The Role of Technology in Promoting Physical Activity: A Case-Study of parkrun †

1
The Advanced Wellbeing Research Centre, Sheffield Hallam University, Sheffield S9 3TU, UK
2
School of Health and Related Research, The University of Sheffield, Sheffield S1 4DA, UK
3
The Centre for Sports Engineering Research, Sheffield Hallam University, Sheffield S9 3TU, UK
*
Author to whom correspondence should be addressed.
†
Presented at the 13th conference of the International Sports Engineering Association, Online, 22–26 June 2020.
Proceedings 2020, 49(1), 80; https://doi.org/10.3390/proceedings2020049080
Published: 15 June 2020
(This article belongs to the Proceedings of The 13th Conference of the International Sports Engineering Association)
Abstract
:Around a third of people worldwide are physically inactive, causing 3.2 million deaths each year. People often use wearables and smartphone trackers to motivate them to be active, but there is evidence to show that use of these trackers declines quickly, often within weeks. One intervention that appears to successfully motivate people to be active is parkrun, a free, weekly timed 5 km run or walk every Saturday morning. The system used by parkrun is surprisingly low-tech: it uses printable barcodes, stopwatches and scanners, and the internet. A survey of 60,694 parkrun participants showed that levels of self-reported physical activity increased following participation in parkrun, especially for those with previously low levels of activity. Nine out of ten reported feeling a sense of personal achievement and improvements to fitness and physical health since starting parkrun. Based on a taxonomy of behaviour change interventions, the technology used by parkrun was shown to incorporate at least seven techniques that inform and encourage parkrunners. It is concluded that physical activity technologies should not be central to an intervention, rather, they should enhance interventions where behaviour change takes precedence.
1. Introduction
In recent decades, people have come to realise the physical and mental benefits of physical activity. One response has been the adoption of wearable technologies such as activity trackers and step counters and yet, globally, 3.2 million deaths each year are still attributed to physical inactivity [1]. Often, state-of-the-art devices have only short-term effects on wearers. In one study, a quarter of participants stopped using an activity tracker after a week, with three quarters stopping after four weeks [2]. One issue is that, while these devices aim to change activity behaviour, they do not often use behaviour change techniques (BCTs) [3].
Abraham and Michie [4] identified a taxonomy of 26 techniques associated with physical activity behaviour change which are often lacking in stand-alone technologies [2]. One organisation that appears to have succeeded where others have failed is parkrun. It organises free, weekly, timed 5 km runs (or walks) in local parks, staffed by volunteers, the majority of whom also participate as runners or walkers.
The parkrun organisation (with a small ‘p’) uses a mix of low-cost technology and internet services as follows: (1) after registering online, a person is given a unique number with a corresponding barcode which can be printed on paper, a wrist band or a plastic card; (2) after running or walking the 5 km event, the participant crosses the finishing line where a volunteer presses a multi-lap stopwatch to record the position and time for the participant; (3) the participant queues to receive a numbered plastic token to identify their finishing position in the same order as their time on the stopwatch; (4) the participant takes the token to a further volunteer along with their personal barcode, and these are scanned together manually using a small handheld laser scanner. This process links the finishing position and time to the participant’s barcode and parkrun number. Following the parkrun, the volunteer Event Director uploads the data to parkrun’s server which produces a list of runtimes and participant names. The participant can use the same barcode to take part in any parkrun event anywhere in the world, and the results are published on the parkrun website, creating a large database of parkrun completion times. Results, with congratulations, and a personal count of the number of runs, are also emailed or sent via SMS to the participant.
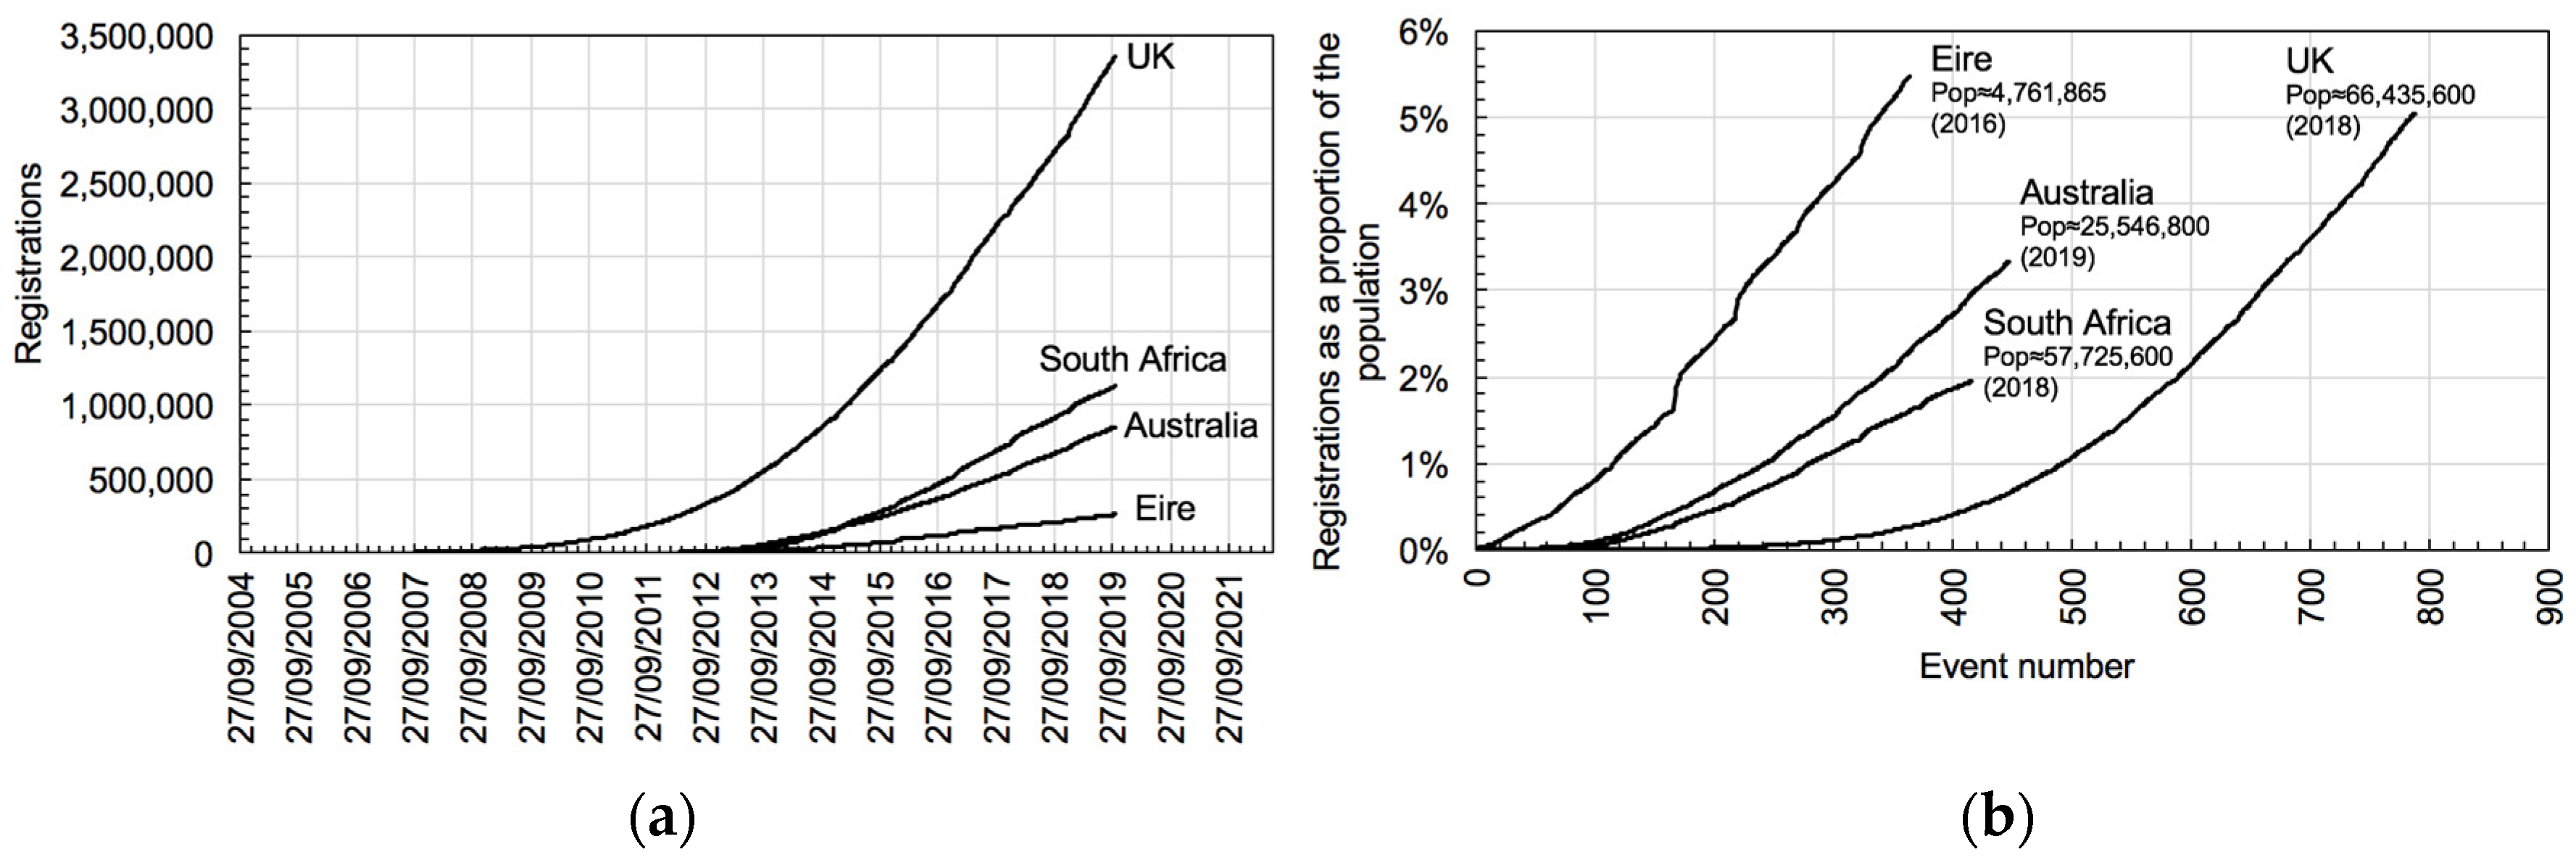
parkrun began in 2004, and the parkrun system might seem archaic and cumbersome, especially in an age where new technology could be used to do the same job much more easily. Yet the parkrun model seems to work, attracting almost 300k runners or walkers each weekend [5] (Figure 1a). There are now almost 2000 parkrun locations across the world, attracting over 5% of the population in some instances (Figure 1b). With parkrun’s apparent success and low-tech approach, the question for others seeking to replicate parkrun’s approach might be:
- Who participates in parkrun?
- Does parkrun change physical activity behaviour, especially the least active?
- Does parkrun impact on their health and wellbeing?
- What are the lessons for the use of technology for other similar interventions?
2. Materials and Methods
2.1. The Demographics of parkrunners
The demographics of parkrunners can be identified through the registration database which contains personal information such as date of birth, postcode, email address, and the name of their ‘home’ parkrun. The following physical activity question is also asked: “Over the last 4 weeks, how often have you done at least 30 min of moderate exercise (enough to raise your breathing rate)?” The possible answers are ≤1, ≈1, ≈2, ≈3 and ≥4 times per week. This latter question can be used to identify whether physical activity levels change following participation.
2.2. The Impact of Participation on Health and Wellbeing
The impact of parkrun participation on health and wellbeing was estimated using a health and wellbeing survey. It contained 47 separate questions and was granted ethical approval by Sheffield Hallam University on 30 July 2018 (ER7034346). The survey was hosted by Qualtrics and distributed by a linked email to all UK registered parkrunners aged 16 and above. The survey responses were linked to the respondents’ parkrun registration data and postcode was used to estimate the participant’s Index of Multiple Deprivation (IMD), a measure that combines 7 socio-economic measures into one number [6].
This paper uses responses to 2 of the 47 questions: (1) the same physical activity question used at registration described above; and (2) a question about the impact of parkrun on the participant’s health, wellbeing and behaviour. The second question consisted of the following: “Thinking about the impact of parkrun on your health and wellbeing, to what extent has running or walking at parkrun changed-?”. Survey respondents were then provided a list of 15 health and wellbeing outcomes and provided 5 response choices: much worse; worse; no impact; better; much better.
3. Results
3.1. The Demographics of parkrunners
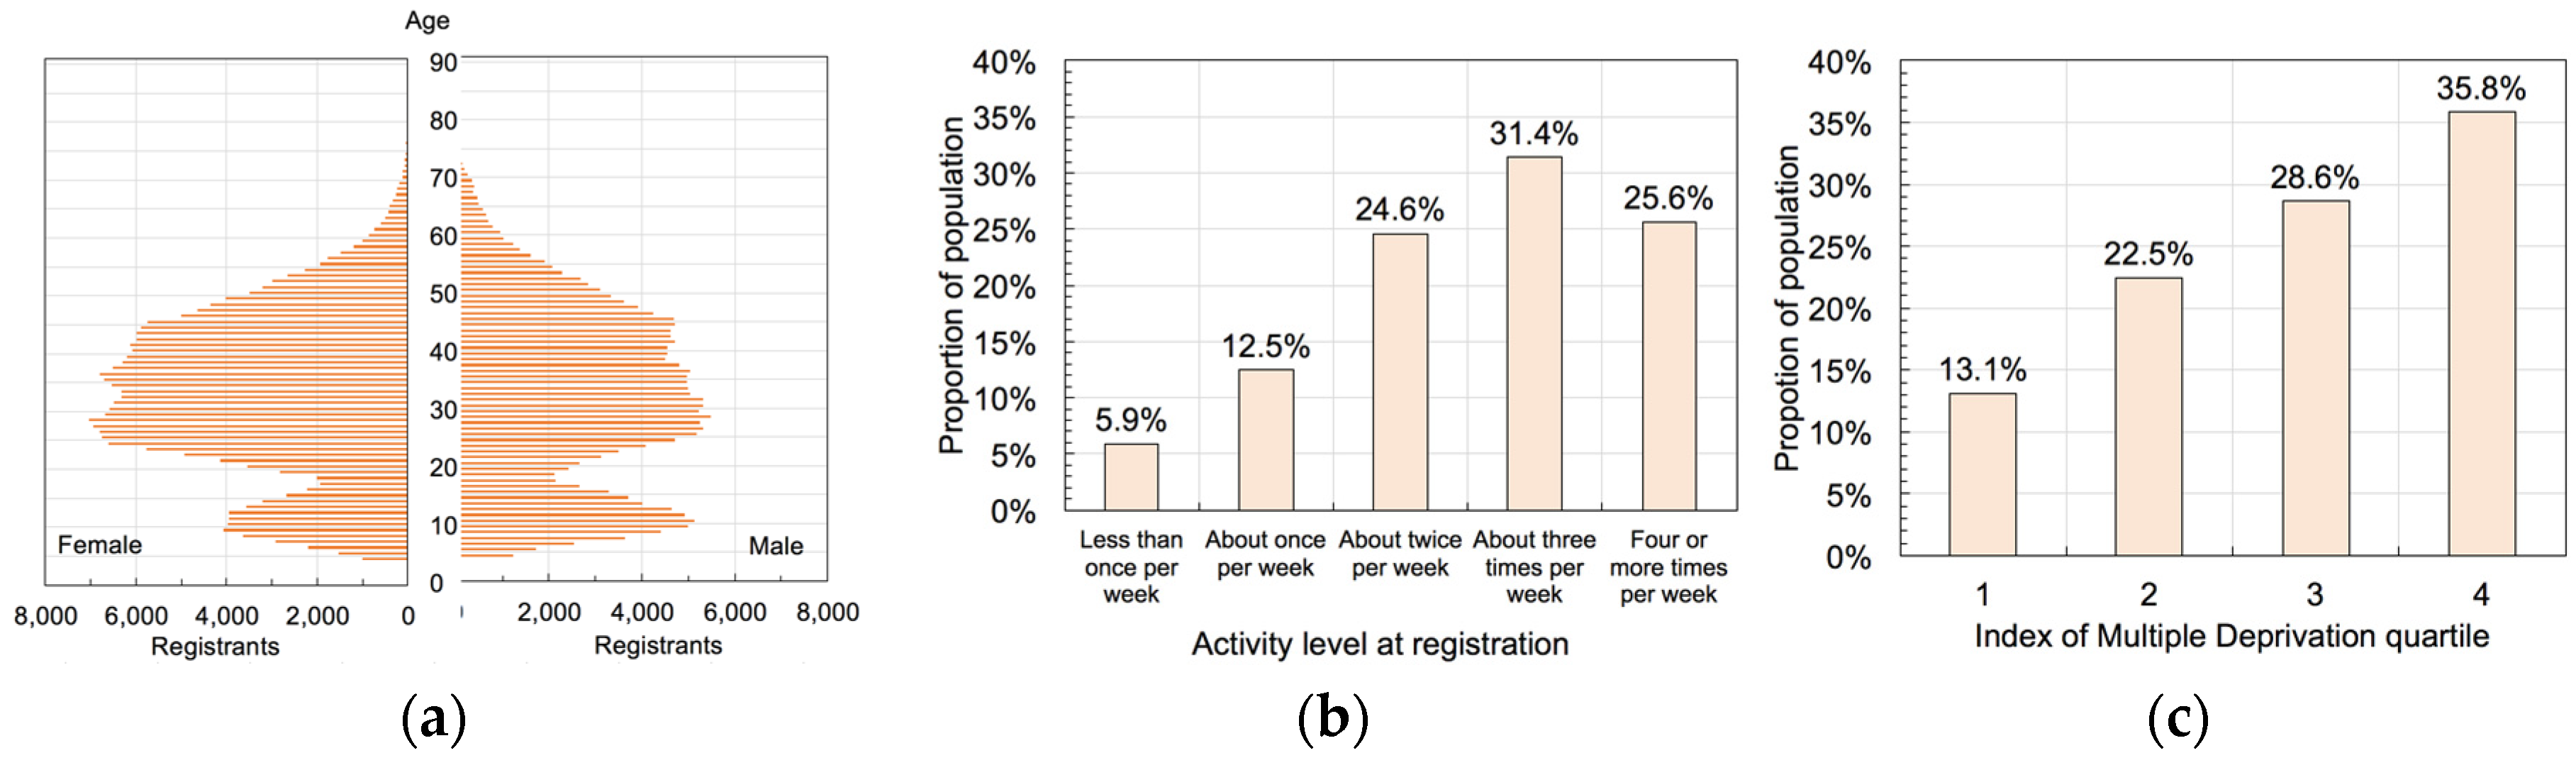
Figure 2 shows summary demographic characteristics of the full UK parkrun registrant population. Figure 2a shows that there are two peaks in the age profile: the first is at around age 12 while the second is a broad peak between the ages of 30 and 45. Those who previously did less than one bout of activity per week, i.e., were previously inactive, represent 5.9% of parkrun registrants, with the most common activity level “about three times per week” at 31.4% of registrants (Figure 2b). Figure 2c shows that 13.1% of registrants were registered with a postcode that was in the most deprived quartile of IMD, with a linear increase in proportion with increasing IMD quartile (i.e., more parkrunners from less deprived communities).
The survey received 60,694 full responses; 44,771 were matched to their physical activity question at registration, while 56,141 answered the question on the impact of parkrun on health and wellbeing.
3.2. Changes in Physical Activity after Participation in parkrun
Table 1 shows the proportion and number of respondents who answered the physical activity question both at registration and at the survey (n = 43,904). The shaded boxes show the proportion of respondents that increased their physical activity levels compared to registration (summarized in succeeding row). A majority of those who reported doing <1, ≈1 and ≈2 bouts of activity per week at registration reported increases in physical activity at the time of the survey (87.9%, 77.3% and 62.7% respectively); 40.1% of the ≈3 registration category increased activity to ≥4 bouts per week at the survey. It was not possible to show increases in activity for the ≥4 registration category as this was already the top category.
The pre-registration mode was three bouts of activity per week (Figure 1b), one measure of the “average” parkrunner. Table 1 shows the proportion of respondents reporting at least this activity level at the time of the survey (i.e., ≥3 bouts per week). It can be seen that 41.3% and 47% of the <1 and ≈1 categories at registration now do the “average” parkrunner amount of activity. It appears that the least active parkrun participants change their behaviour and increase their physical activity levels (at least for the survey respondents).
3.3. The Impact of parkrun on Health and Wellbeing
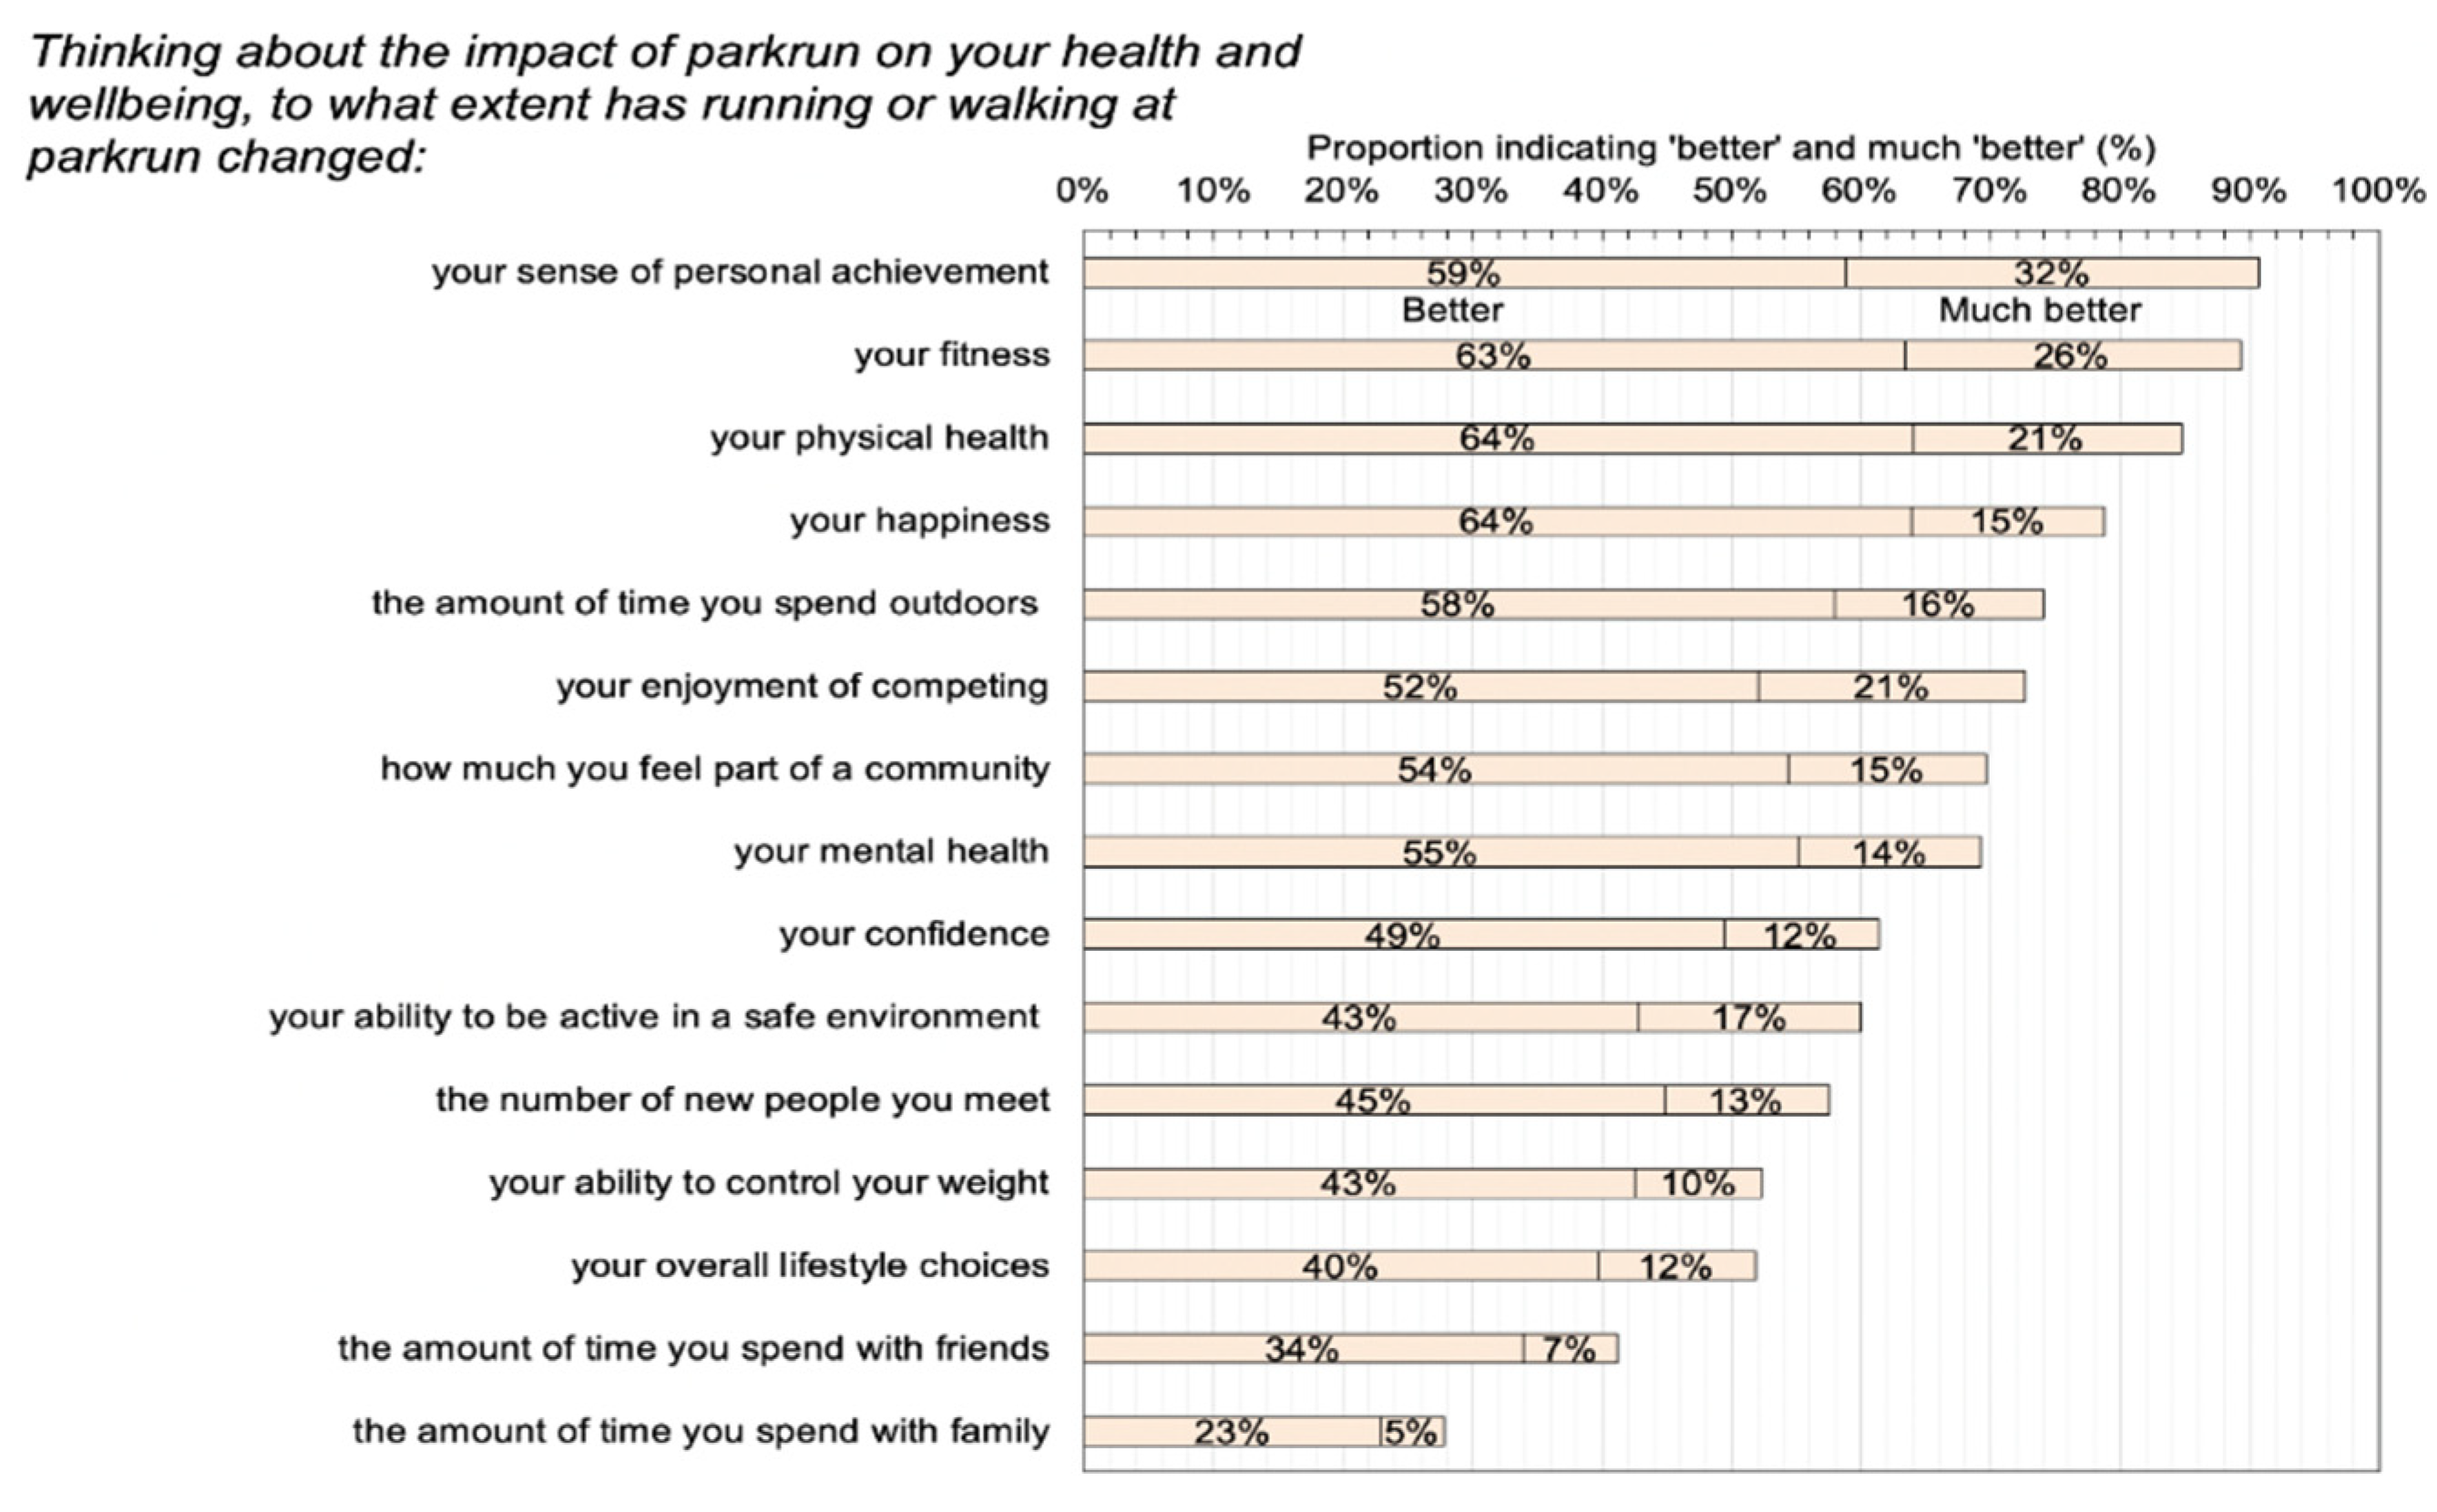
Figure 3 shows the perceived impact of running or walking at parkrun on physical wellbeing, mental wellbeing and behaviour. The figure shows the proportion of respondents selecting “better” or “much better” for each outcome. The largest impact was in a sense of personal achievement in which 91% reported a positive impact. In terms of physical wellbeing, 89% reported improvements to fitness while 85% reported improvements to physical health since taking part in parkrun. In terms of mental wellbeing, 79% reported improvements to their happiness. Feeling part of a community improved for 69% of respondents and behaviour was impacted positively by participation in parkrun: 74% reported improvements to the amount of time spent outdoors while 58% reported improvement in the number of new people they met.
4. The Use of Technology at parkrun and Its Role in Behaviour Change
Evidently, parkrun impacts participants in a positive manner: physical activity levels of the least active increase, people feel a sense of personal achievement and happiness increases. It might seem that the technology used by parkrun plays a relatively trivial role in this. However, the low-level technology used by parkrun is a deliberate choice. Despite the availability of a simple wearable chip and timing mat, as used in other mass participation run/walk events, parkrun embraced the barcode scanning method, even enhancing the process by allowing the use of smartphones as barcode scanners.
Rather than providing an automated system, the process of manual scanning promotes social interactions between runners, walkers and volunteers. It connects people in a way that automated timing would not, and intuitively, parkrun have integrated behaviour change techniques (BCTs) into their way of working. Table 2 shows that parkrun embraces at least seven of the BCTs suggested by Abrahams and Michie [4], similar in number to technology-based interventions [3]. For example, the same template is used for the website of every event across the world to provide pre-event instruction; social media links and the newsletter give a plethora of examples of other parkruns; participants monitor their performances through the online results, which also provide encouragement through badges and notifications of personal bests; and, lastly, participants are able to compare their performance to others of the same gender, age, and circumstance.
Importantly, these BCTs are reinforced on the day of the run, through the queuing required by the low-cost technology while waiting to have your barcode scanned. A more complex automated timing system would allow people to depart immediately and the social networking provided by the queue would vanish.
While parkrun is not necessarily the panacea for the whole population, the key lesson for technologists is that for sustained behaviour change, the application needs to be grounded in behaviour change theory. Technology should not be the central focus of physical activity interventions: rather, they should enable interventions where behaviour change takes precedence.
5. Conclusions
parkrun attracts large numbers of participants worldwide; as much as 5% of the population in some cases. A survey of participants showed that levels of physical activity broadly increased following participation, especially for those with previously low levels of activity. Survey respondents perceived improvements in many measures of health and wellbeing including physical and mental health. Behaviours were also improved, such as meeting new people and feeling part of a community. While parkrun uses simple technology to measure the run times of its participants, it incorporates at least seven behaviour change techniques. It is concluded that technologies seeking to change physical activity behaviour should embrace BCTs if they truly want to increase activity levels; parkrun shows how this could be done. From a technological point of view, sometimes less is more.
Acknowledgments
The parkrun health and wellbeing survey was co-funded by parkrun UK and Sheffield Hallam University.
Conflicts of Interest
The health and wellbeing survey was designed by Sheffield Hallam University in consultation with parkrun. The authors are all member of the parkrun Research Board. Registration data was provided by parkrun while all other data was collected by Sheffield Hallam University who carried out all analysis and interpretation of the data.
References
- World Health Organisation. Global Action Plan for the Prevention and Control of Non-Communicable Diseases 2013–2020; World Health Organisation: Geneva, Switzerland, 2013. [Google Scholar]
- Shih, P.C.; Han, K.; Poole, E.S.; Rosson, M.B.; Carroll, J.M. Use and Adoption Challenges of Wearable Activity Trackers. In Proceedings of the iConference, Newport Beach, CA, USA, 24–27 March 2015. [Google Scholar]
- Direito, A.; Pfaeffli Dale, L.; Shields, E.; Dobson, R.; Whittaker, R.; Maddison, R. Do physical activity and dietary smartphone applications incorporate evidence-based behavior change techniques? BMC Public Health 2014, 14, 646–652. [Google Scholar] [CrossRef] [PubMed]
- Abraham, C.; Michie, S. A taxonomy of behavior change techniques used in interventions. Health Psychol. 2008, 27, 379–387. [Google Scholar] [CrossRef] [PubMed]
- Available online: https//:wiki.parkrun.com (accessed on 23 October 2019).
- Available online: https://www.gov.uk/government/collections/english-indices-of-deprivation (accessed on 23 October 2019).
Figure 1.
Registrations with the weekly 5 km parkrun in the four largest participating countries [6]: (a) absolute registrations by date of event; (b) registrations as a proportion of the approximate population by event number. (Census date, 23 October 2019).
Figure 1.
Registrations with the weekly 5 km parkrun in the four largest participating countries [6]: (a) absolute registrations by date of event; (b) registrations as a proportion of the approximate population by event number. (Census date, 23 October 2019).

Figure 2.
Characteristics of all UK parkrun registrants (n = 3.2 million): (a) age profile; (b) activity level in bouts of at least 30 min of moderate activity per week; (c) Index of Multiple Deprivation (IMD; the lowest number indicates most deprived [7]).
Figure 2.
Characteristics of all UK parkrun registrants (n = 3.2 million): (a) age profile; (b) activity level in bouts of at least 30 min of moderate activity per week; (c) Index of Multiple Deprivation (IMD; the lowest number indicates most deprived [7]).

Figure 3.
Perceived impact of participation in UK parkrun. Possible answers for each outcome were: much worse; worse; no impact; better; much better. Response numbers vary with outcome but n ≥ 56,141.
Figure 3.
Perceived impact of participation in UK parkrun. Possible answers for each outcome were: much worse; worse; no impact; better; much better. Response numbers vary with outcome but n ≥ 56,141.


Table 1.
Proportion (and number of respondents) at each physical activity level at registration and at the time of the survey. Shading indicates groups that show higher physical activity levels than at registration. Percentages relate to columns (n = 43,904).
Table 1.
Proportion (and number of respondents) at each physical activity level at registration and at the time of the survey. Shading indicates groups that show higher physical activity levels than at registration. Percentages relate to columns (n = 43,904).
| Activity Level at Registration | ||||||
|---|---|---|---|---|---|---|
| <1 week−1 (n = 2269) | ≈1 week−1 (n = 5048) | ≈2 week−1 (n = 9976) | ≈3 week−1 (n = 14,796) | ≥4 week−1 (n = 11,815) | ||
| Physical activity level at survey | <1 week−1 | 12.1% (247) | 6.2% (312) | 2.8% (280) | 2.0% (295) | 0.9% (109) |
| ≈1 week−1 | 21.0% (476) | 16.6% (837) | 8.2% (818) | 4.0% (588) | 1.7% (196) | |
| ≈2 week−1 | 25.7% (583) | 30.3% (1528) | 26.3% (2621) | 14.3% (2113) | 4.7% (558) | |
| ≈3 week−1 | 24.8% (562) | 29.8% (1503) | 37.3% (3722) | 39.7% (5870) | 18.3% (2163) | |
| ≥4 week−1 | 16.5% (374) | 17.2% (868) | 25.4% (2,535) | 40.1% (5930) | 74.4% (8789) | |
| Increase c.f. registration | 87.9% (2269) | 77.3% (5048) | 62.7% (9976) | 40.1% (14,796) | n/a | |
| ≥3 week−1 | 41.3% (2269) | 47.0% (5048) | 62.7% (9976) | 79.8% (14,796) | 92.7% (14,796) | |
Table 2.
Behaviour change techniques [5] used by parkrun.
Table 2.
Behaviour change techniques [5] used by parkrun.
| Behaviour Change Technique | parkrun Use of Technology |
|---|---|
| Provide instruction | The parkrun website provides pre-event information for every parkrun in the same format. This is reinforced by volunteers who give a briefing before each event. |
| Model/demonstrate the behavior | Social media/newsletters/emails showing participants completing parkruns. |
| Prompt self-monitoring of behaviour | Participants have their own set of results for all parkruns anywhere in the world. It can also be linked to other self-monitoring technology such as Strava. |
| Provide general encouragement | Behaviour is reinforced by an email after each event which congratulates participants, gives their time and position, and the number of events completed. |
| Provide feedback on performance | An email after each event signposts participants to their results containing number of runs, personal bests and age grading. |
| Provide contingent rewards | Personal best times are highlighted online and milestones noted at 10, 50, 100, 250 and 500 events completed. Free t-shirts are given at each milestone. |
| Provide opportunities for social comparison | All times and names are openly available online; there are links to social media channels. |
Publisher’s Note: MDPI stays neutral with regard to jurisdictional claims in published maps and institutional affiliations. |
© 2020 by the authors. Licensee MDPI, Basel, Switzerland. This article is an open access article distributed under the terms and conditions of the Creative Commons Attribution (CC BY) license (http://creativecommons.org/licenses/by/4.0/).
Share and Cite
MDPI and ACS Style
Haake, S.; Quirk, H.; Bullas, A. The Role of Technology in Promoting Physical Activity: A Case-Study of parkrun. Proceedings 2020, 49, 80. https://doi.org/10.3390/proceedings2020049080
AMA Style
Haake S, Quirk H, Bullas A. The Role of Technology in Promoting Physical Activity: A Case-Study of parkrun. Proceedings. 2020; 49(1):80. https://doi.org/10.3390/proceedings2020049080
Chicago/Turabian StyleHaake, Steve, Helen Quirk, and Alice Bullas. 2020. "The Role of Technology in Promoting Physical Activity: A Case-Study of parkrun" Proceedings 49, no. 1: 80. https://doi.org/10.3390/proceedings2020049080