
The Use of a Genetic Algorithm for Sorting Warehouse Optimisation

 ,
,  , , ,
, , ,  , ,
, ,
Abstract
:1. Introduction
Problem Definition
2. Materials and Methods
2.1. Genetic Algorithms
2.1.1. First Phase: Initial Population
2.1.2. Second Phase: Fitness Function
2.1.3. Third Phase: Selection
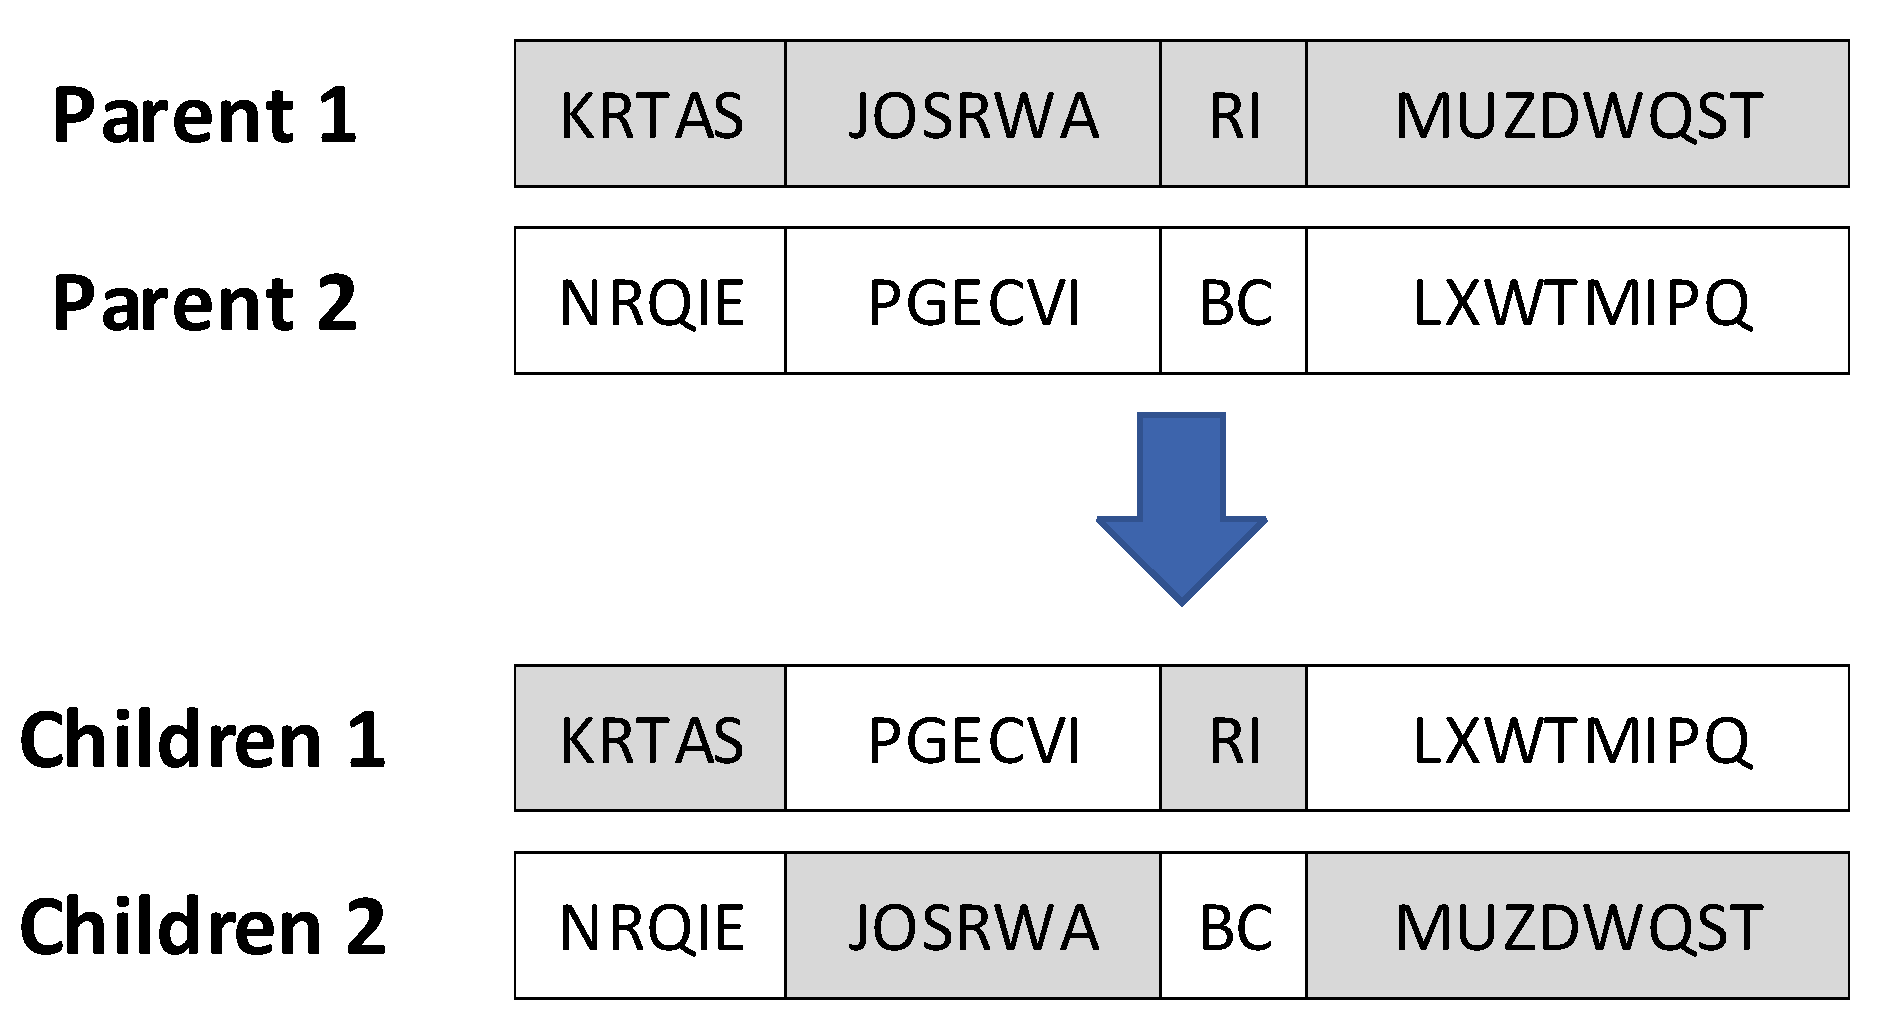
2.1.4. Crossover
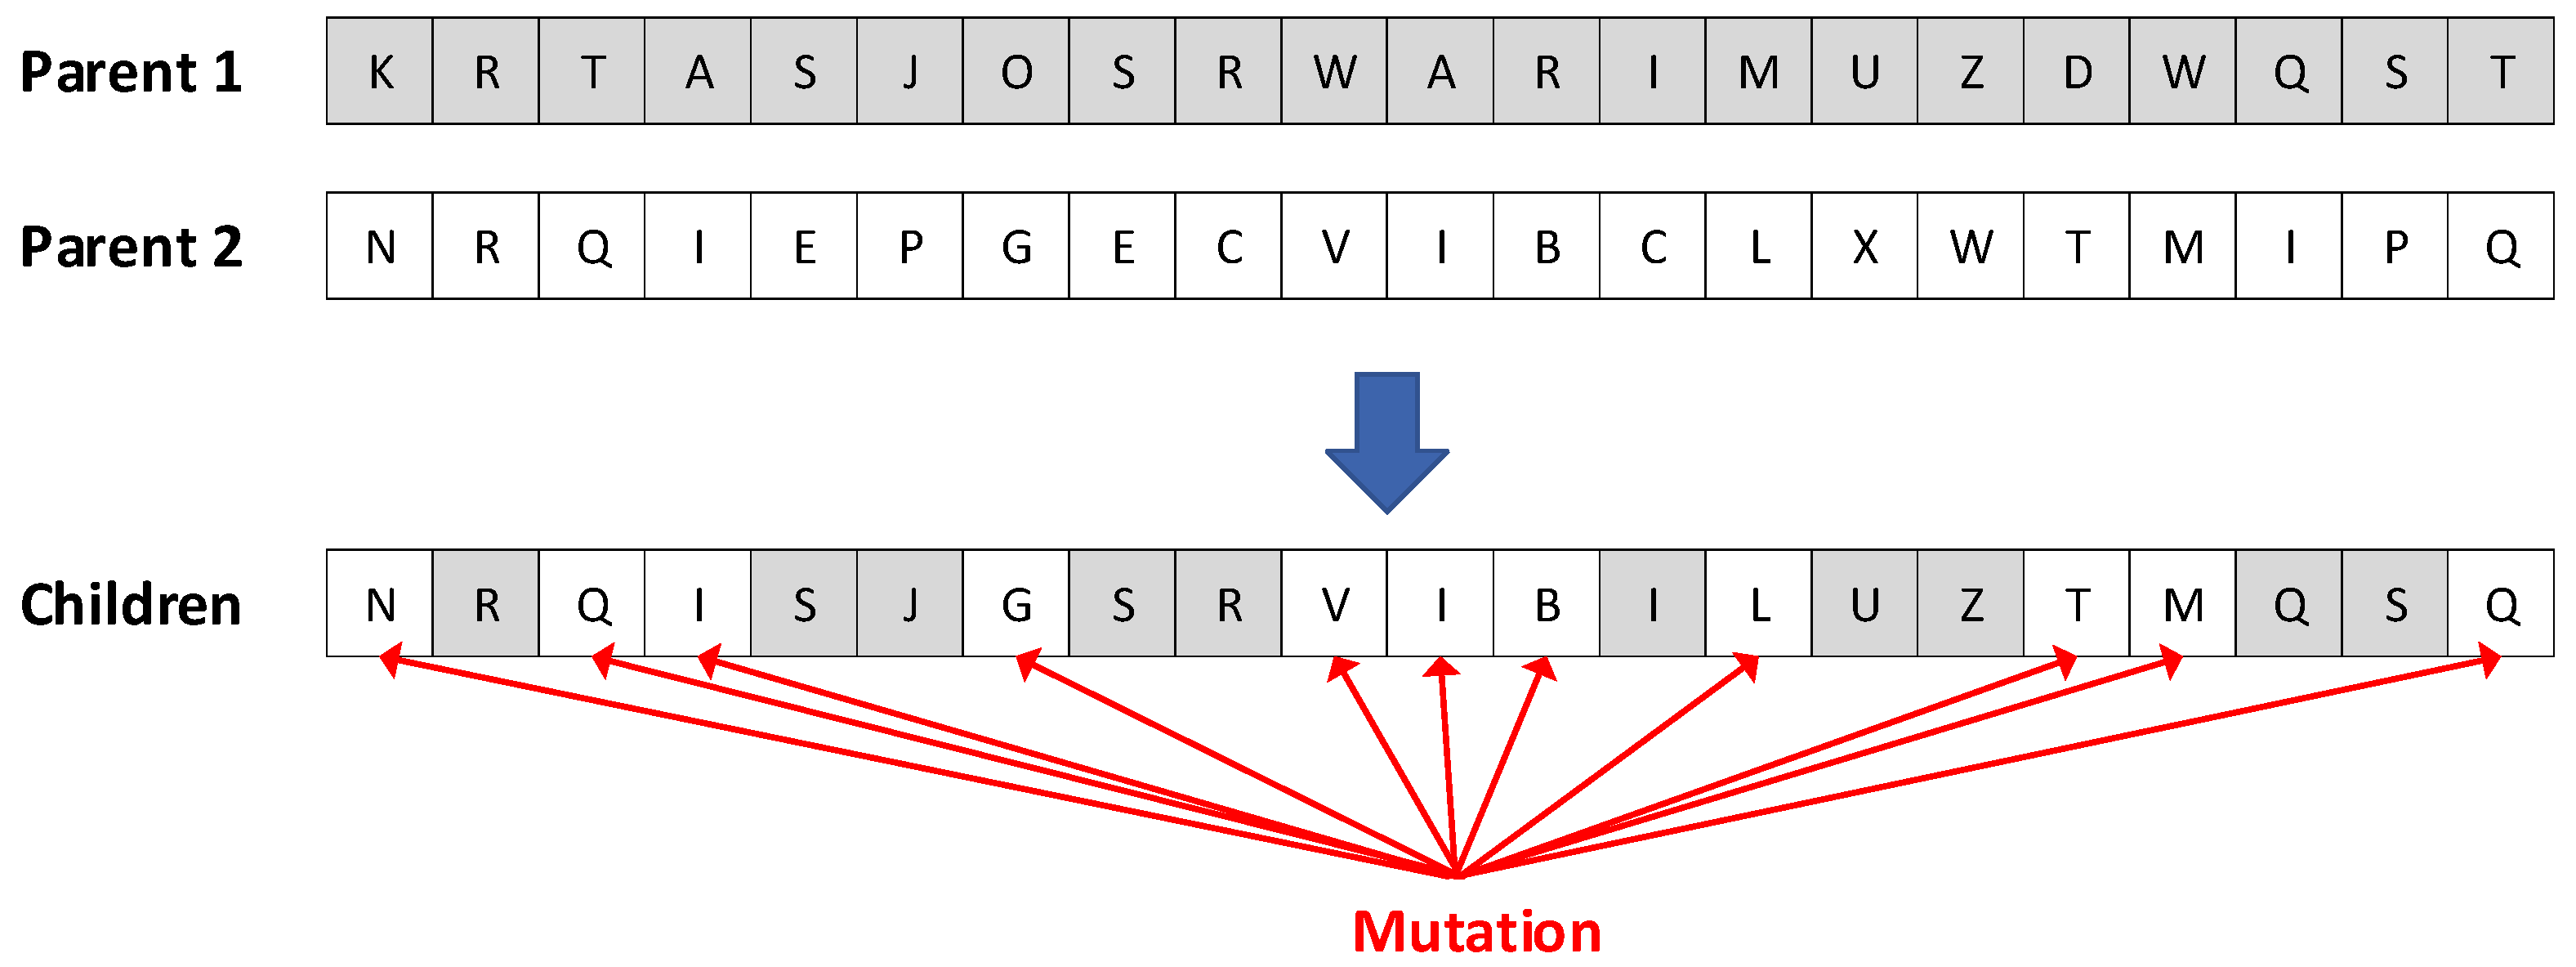
2.1.5. Mutation
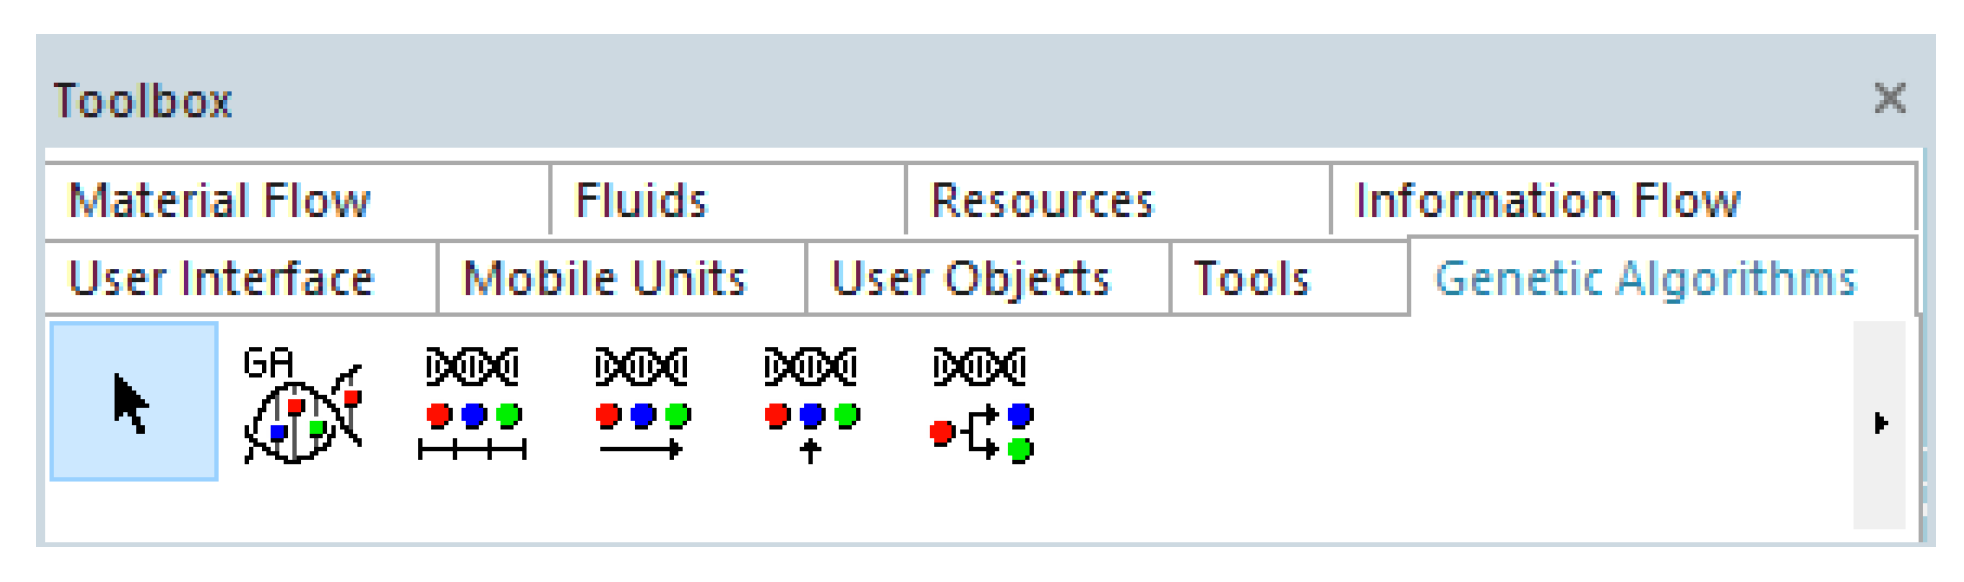
2.1.6. Tecnomatix Plant Simulation and Genetic Algorithms
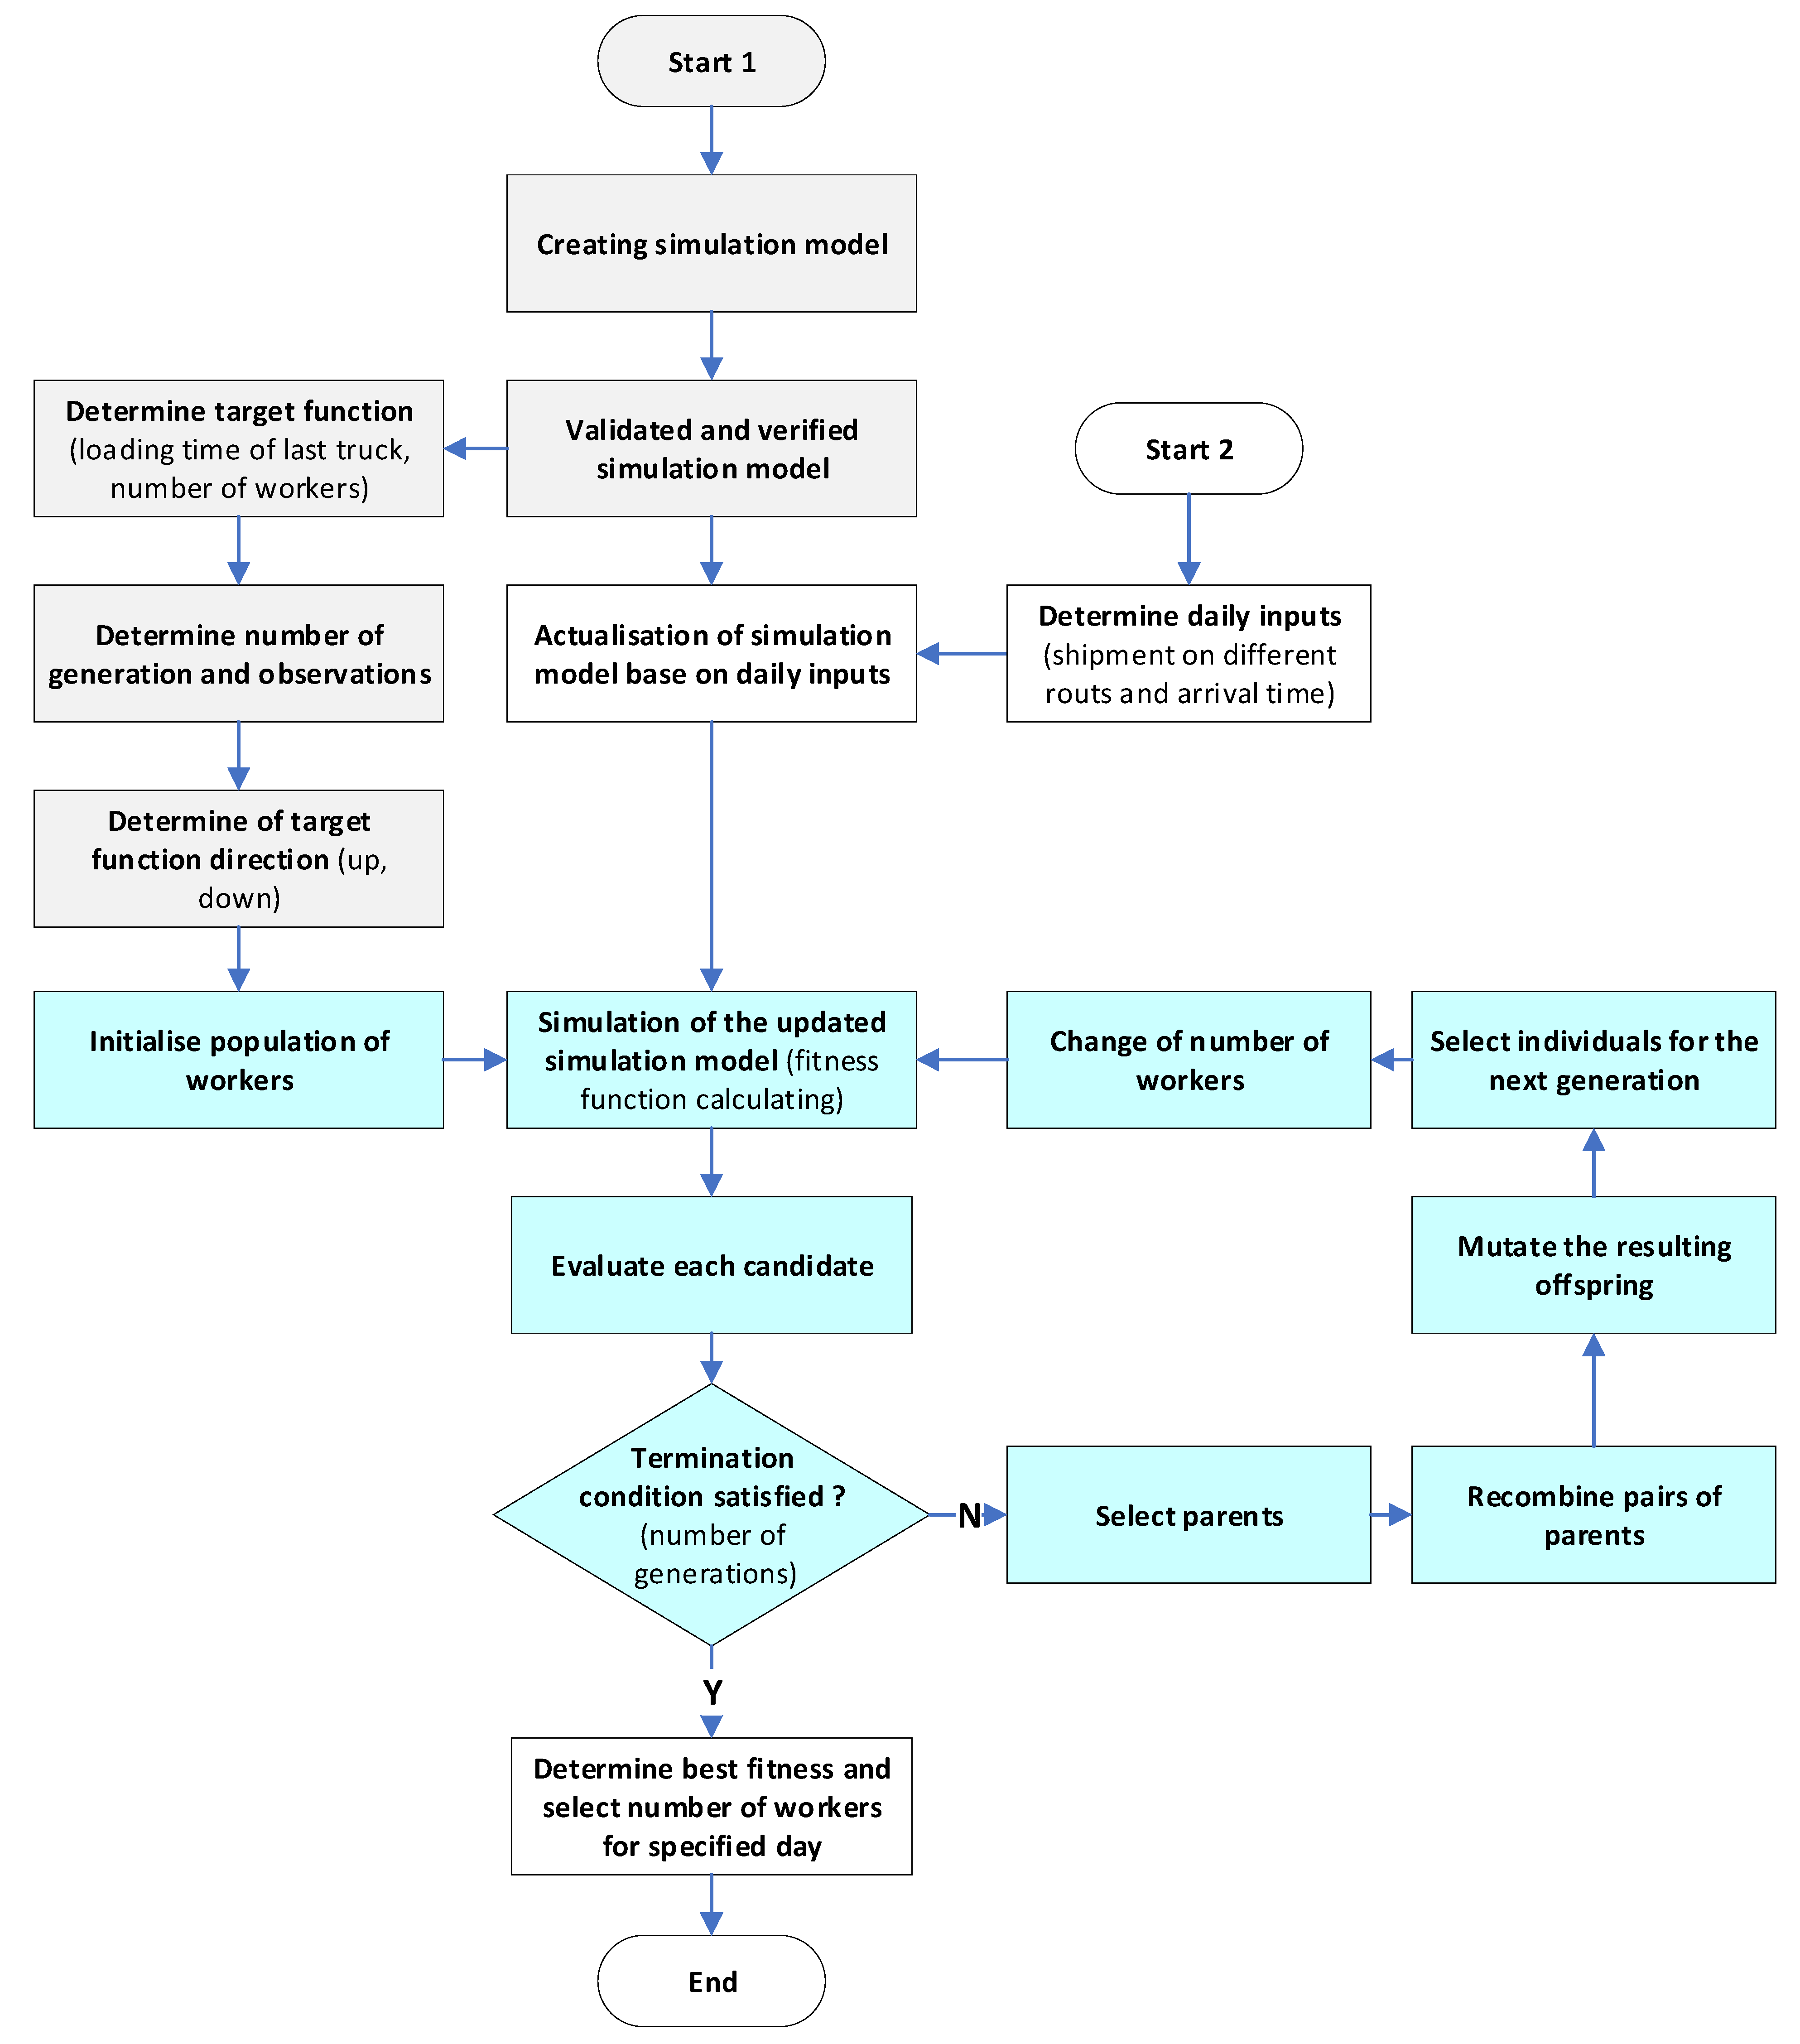
2.2. Design of Algorithm for Determining the Number of Workers in the Sorting Warehouse Using Genetic Algorithms
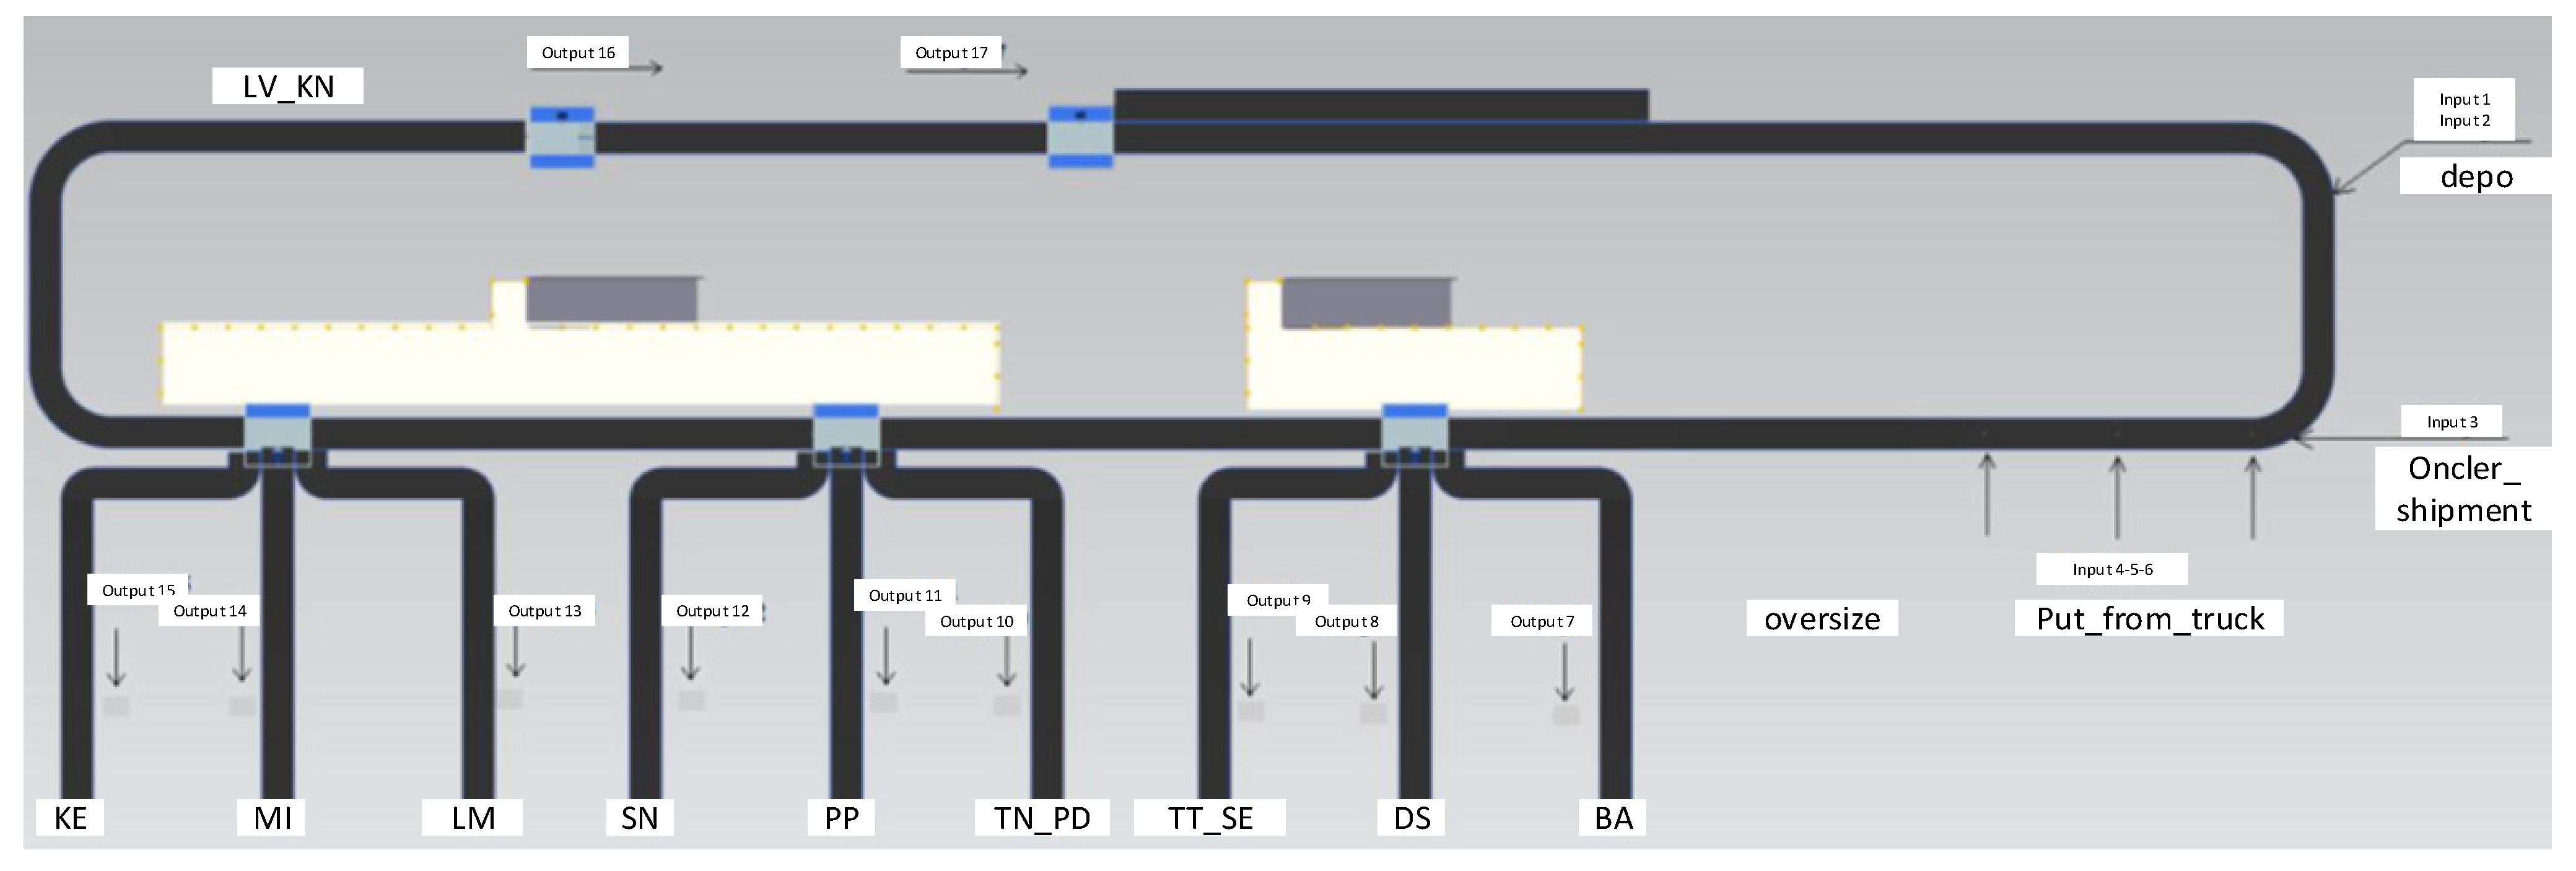
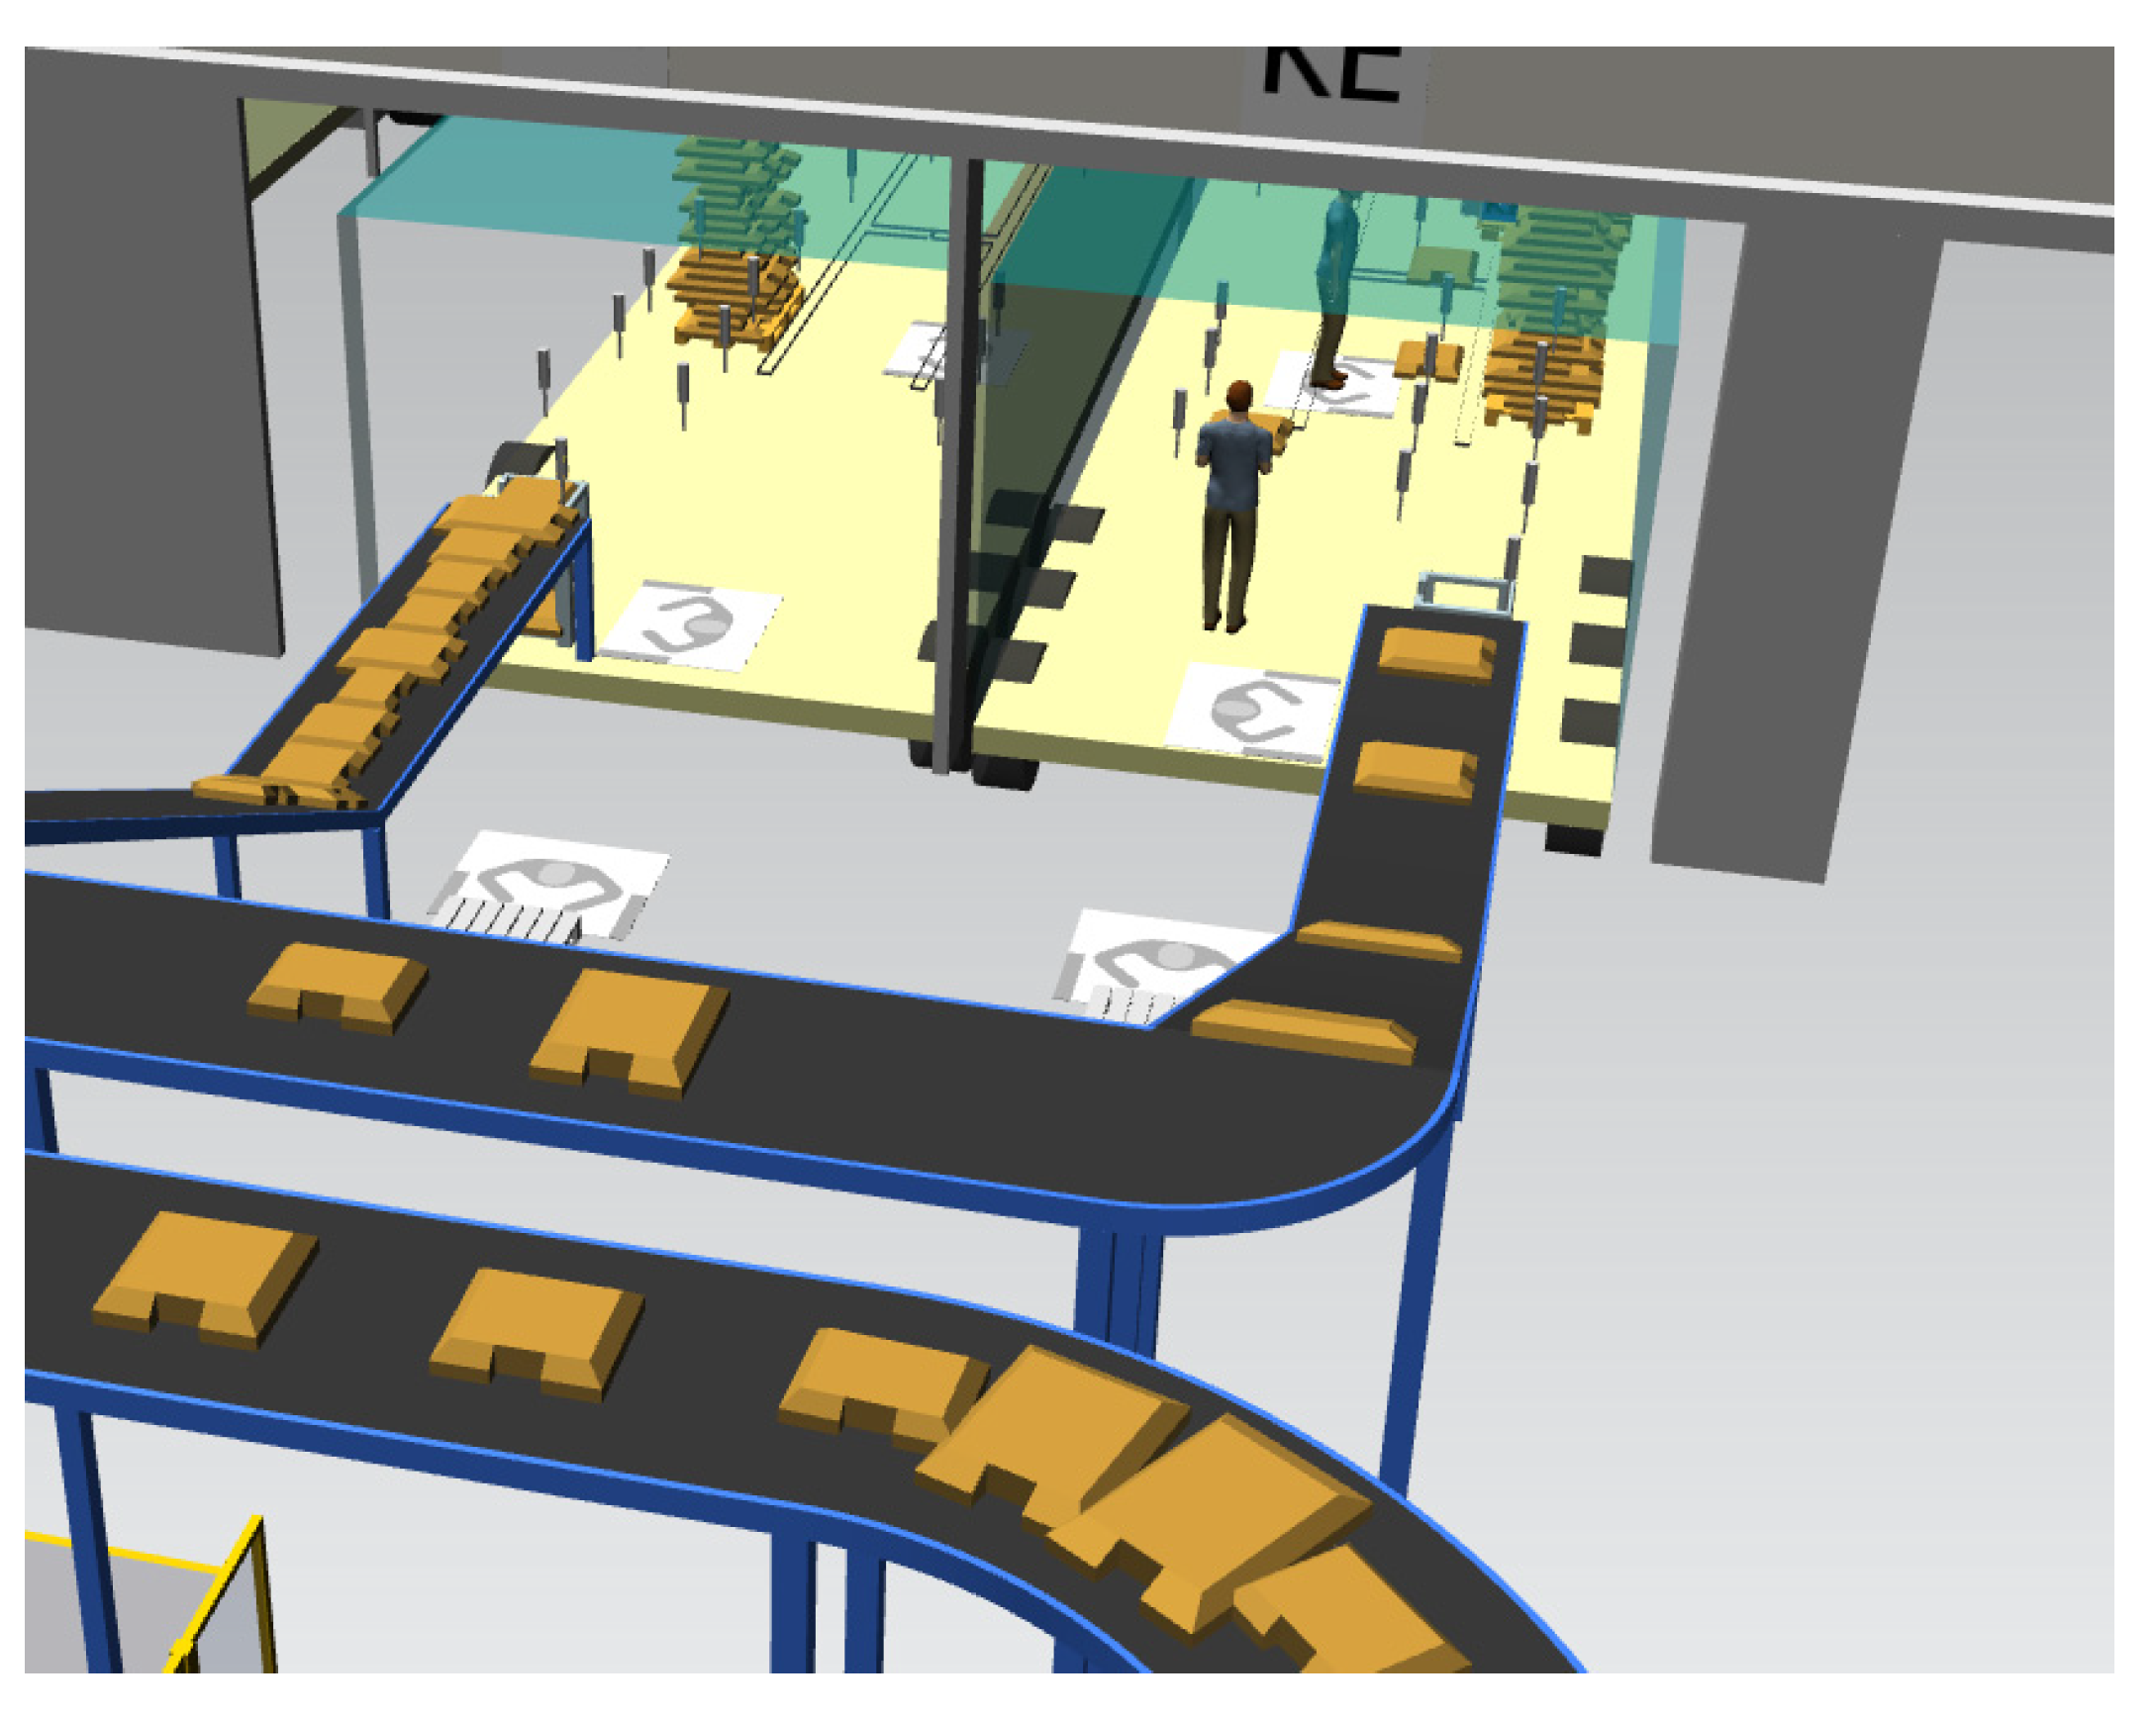
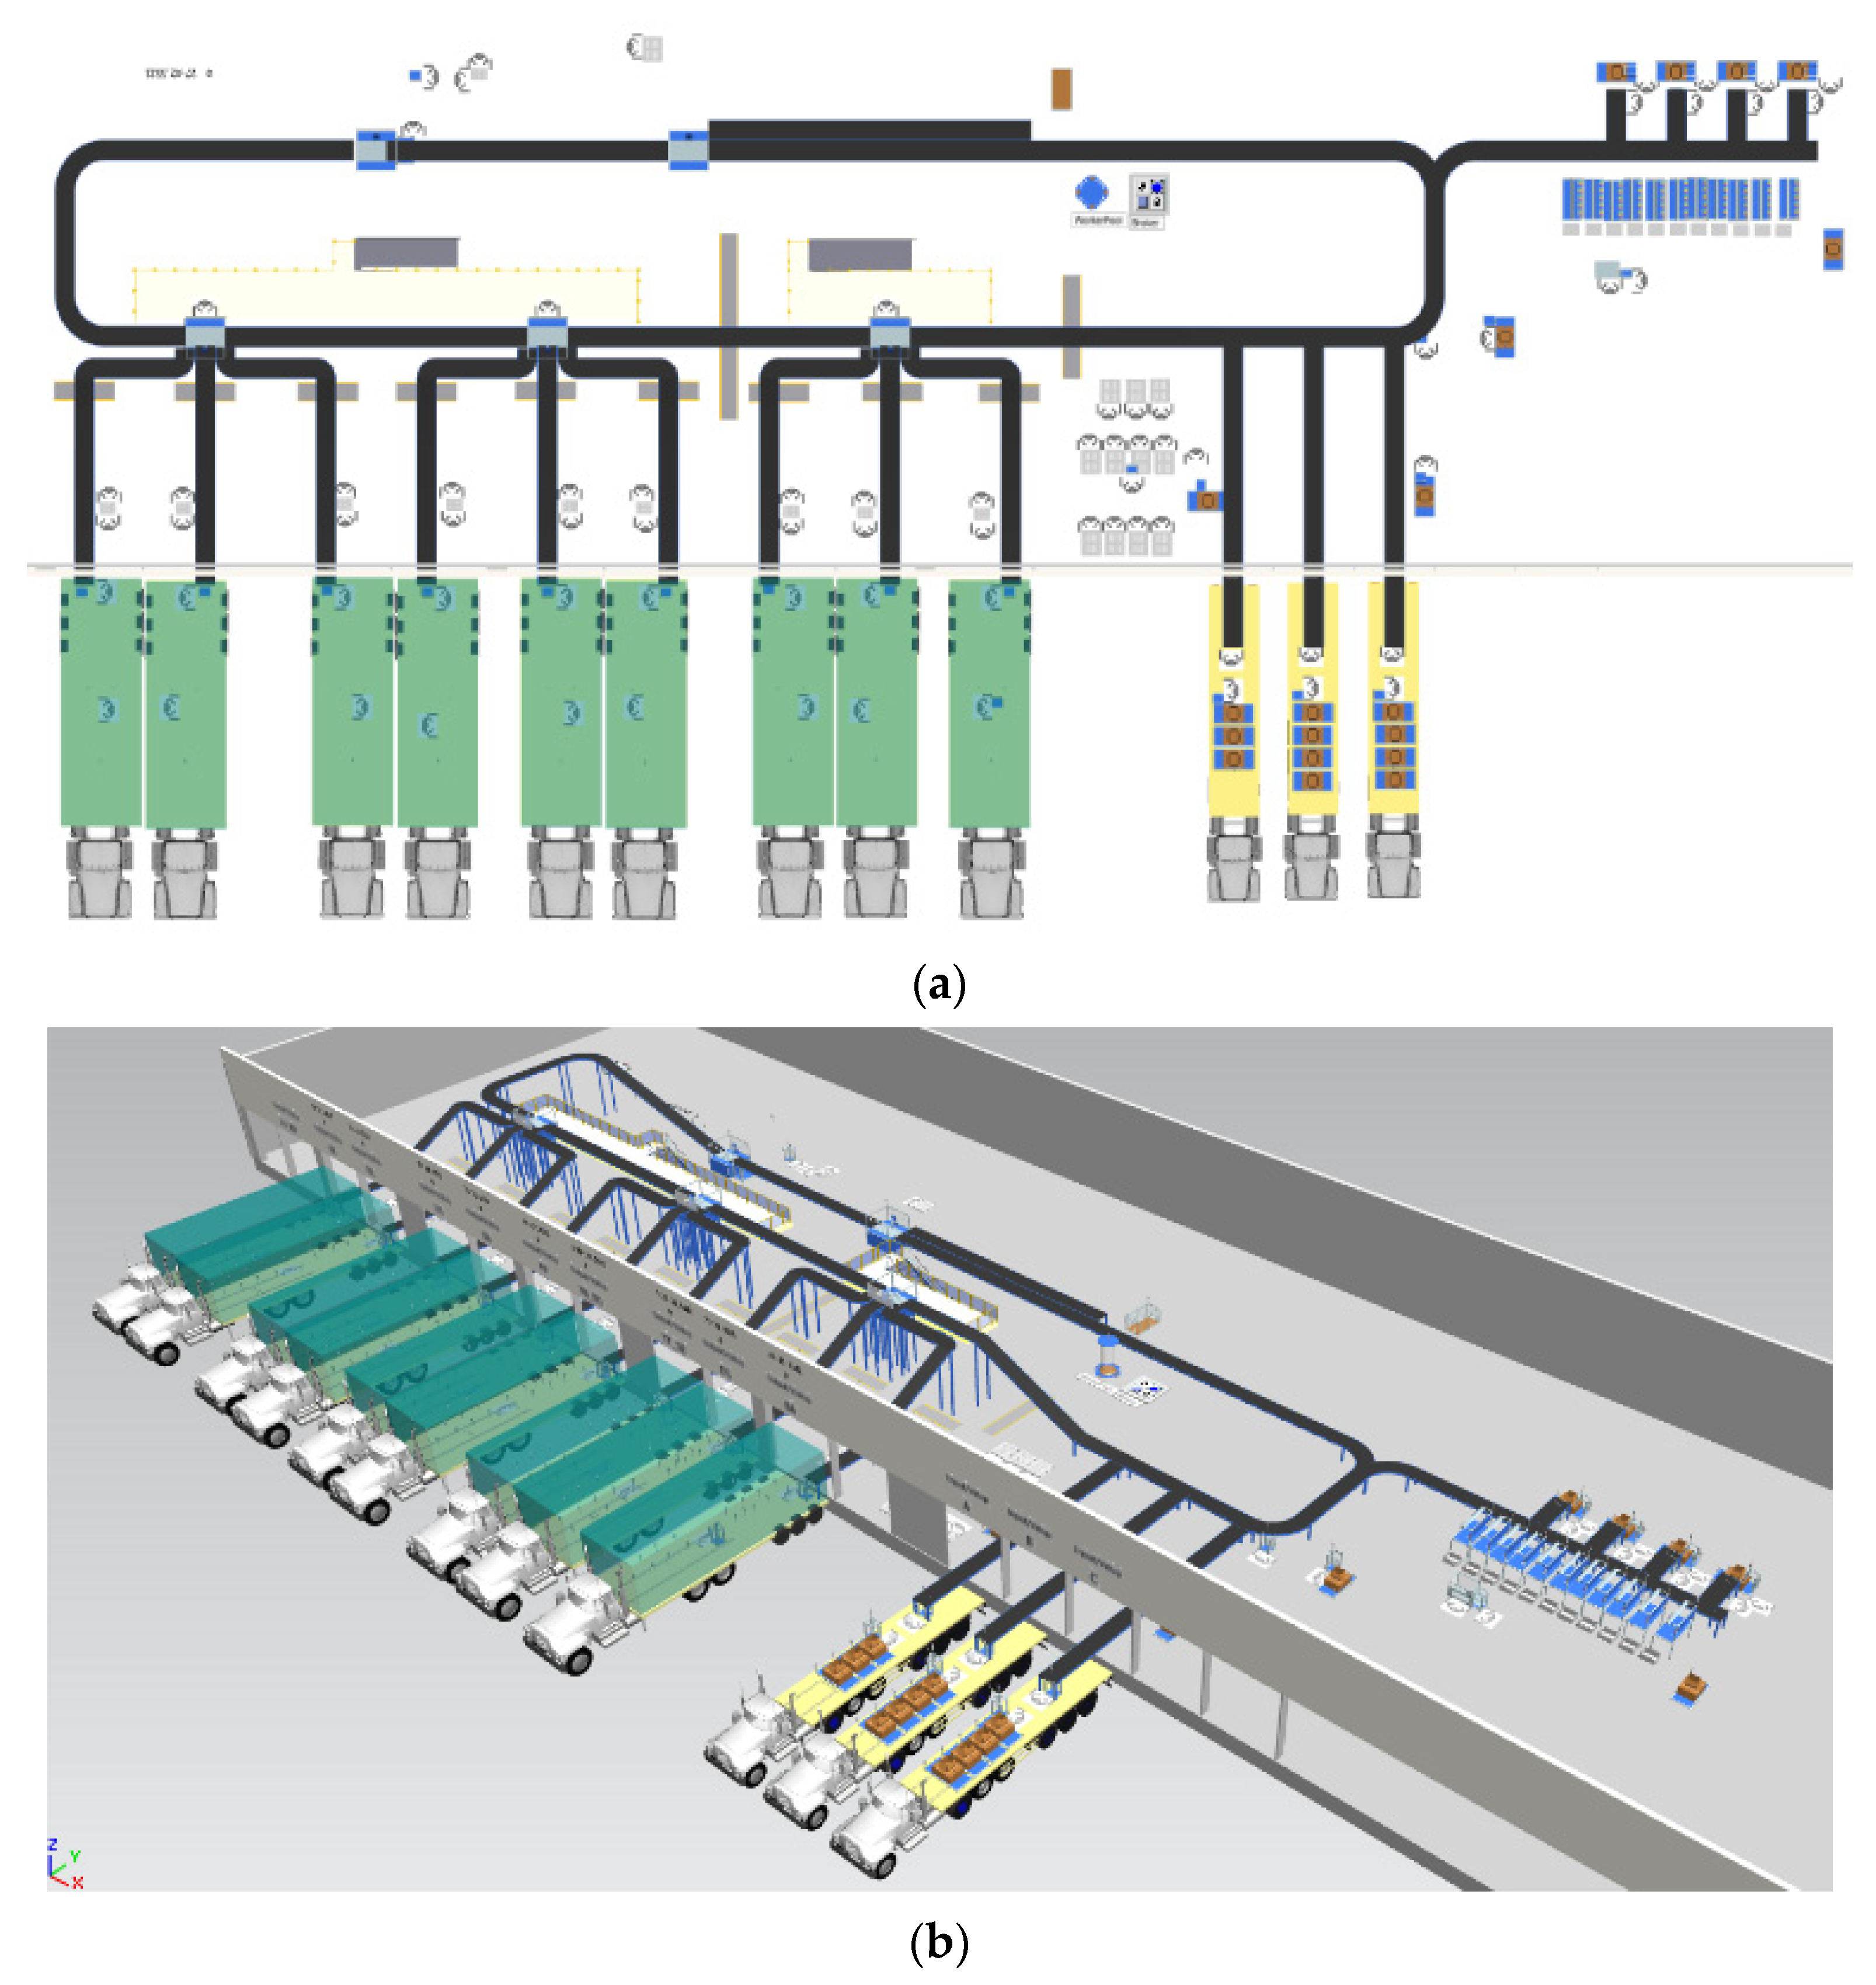
2.3. Design of Simulation Model
3. Results
4. Conclusions
Author Contributions
Funding
Institutional Review Board Statement
Informed Consent Statement
Data Availability Statement
Conflicts of Interest
References
- Milan, G.; Hodon, R.; Binasova, V.; Dulina, L.; Gaso, M. Design of simulation-emulation logistics system. MM Sci. J. 2018, 2018, 2498–2502. [Google Scholar] [CrossRef]
- Plinta, D.; Dulina, L. Ergonomics analysis in the context of a digital factory. In Proceedings of the 38th International Conference on Information Systems Architecture and Technology, ISAT 2017, Szklarska Poreba, Poland, 17–19 September 2017; Volume 657, pp. 304–313. [Google Scholar] [CrossRef]
- Gola, A. Design and Management of Manufacturing Systems. Appl. Sci. 2021, 11, 2216. [Google Scholar] [CrossRef]
- Yadavalli, V.S.; Balcou, C. A supply chain management model to optimise the sorting capability of a ‘third party logistics’ distribution centre. S. Afr. J. Bus. Manag. 2017, 48, 77–84. [Google Scholar] [CrossRef] [Green Version]
- Jankowska, D.; Mikušová, M.; Wacowska-Ślęzak, J. Mobility Issues in Selected Regions of Poland and Slovakia—Outcomes of International Project SOL (Save Our Lives) Survey. Period. Polytech. Transp. Eng. 2014, 43. [Google Scholar] [CrossRef] [Green Version]
- Danilczuk, W.; Gola, A. Computer aided material demand planning using ERP systems and Business Intelligence Technology. Appl. Comput. Sci. 2020, 16, 42–55. [Google Scholar] [CrossRef]
- Mikusova, M.; Abdunazarov, J.; Zukowska, J. Modelling of the Movement of Designed Vehicles on Parking Space for Designing Parking. In Development of Transport by Telematics; Mikulski, J., Ed.; Springer International Publishing Ag: Cham, Switzerland, 2019; Volume 1049, pp. 188–201. [Google Scholar] [CrossRef]
- Kliment, M.; Trebuna, P.; Pekarcikova, M.; Straka, M.; Trojan, J.; Duda, R. Production Efficiency Evaluation and Products’ Quality Improvement Using Simulation. Int. J. Simul. Model. 2020, 19, 470–481. [Google Scholar] [CrossRef]
- Gola, A.; Pastuszak, Z.; Relich, M.; Sobaszek, Ł.; Szwarc, E. Scalability analysis of selected structures of a reconfigurable manufacturing system taking into account a reduction in machine tools reliability. Ekspolatacja Niezawodn. Maint. Reliab. 2021, 23, 242–252. [Google Scholar] [CrossRef]
- Górnicka, D.; Kochańska, J.; Burduk, A. Production Resources Utilization Improvement with the Use of Simulation Modelling. Adv. Intell. Syst. Comput. 2019, 1051, 41–50. [Google Scholar] [CrossRef]
- Ristvej, J.; Ondrejka, R.; Simak, L.; Lovecek, T.; Holla, K.; Lacinak, M.; Surinova, L.; Janosikova, M. Simulation Technologies in Risk Prevention within Crisis Management. In Proceedings of the Modelling and Simulation 2016—European Simulation and Modelling Conference, Las Palmas, Spain, 26–28 October 2016; pp. 327–330. [Google Scholar]
- Zagorecki, A.; Ristvej, J.; Comfort, L.K.; Lovecek, T. Executive dashboard systems for emergency management. Komunikacie 2012, 14, 82–89. [Google Scholar]
- Bubeník, P.; Horák, F. Proactive Approach to Manufacturing Planning. Qual. Innov. Prosper. 2014, 18, 23–32. [Google Scholar] [CrossRef] [Green Version]
- Edl, M.; Votava, V.; Ulrych, Z.; Korecký, M.; Trkovský, V. Analysis and Optimisation of Complex Small-Lot Production in New Manufacturing Facilities Based on Discrete Simulation. In Proceedings of the 20th European Modeling & Simulation Symposium, Amantea, Italy, 17–19 September 2008; pp. 198–203. [Google Scholar]
- Sobrino, D.R.D.; Košťál, P.; Cagáňová, D.; Čambál, M. On the Possibilities of Intelligence Implementation in Manufacturing: The Role of Simulation. Appl. Mech. Mater. 2013, 309, 96–104. [Google Scholar] [CrossRef]
- Saha, S.; Vasegaard, A.; Nielsen, I.; Hapka, A.; Budzisz, H. UAVs Path Planning under a Bi-Objective Optimization Framework for Smart Cities. Electronics 2021, 10, 1193. [Google Scholar] [CrossRef]
- Bučková, M.; Skokan, R.; Fusko, M.; Hodoň, R. Designing of logistics systems with using of computer simulation and emulation. Transp. Res. Procedia 2019, 40, 978–985. [Google Scholar] [CrossRef]
- Pekarcikova, M.; Trebuna, P.; Kliment, M.; Rosocha, L. Material Flow Optimization through E-Kanban System Simulation. Int. J. Simul. Model. 2020, 19, 243–254. [Google Scholar] [CrossRef]
- Močilan, M.; Žmindák, M.; Pecháč, P.; Weis, P. CFD Simulation of Hydraulic Tank. Procedia Eng. 2017, 192, 609–614. [Google Scholar] [CrossRef]
- Sobaszek, Ł.; Gola, A.; Kozłowski, E. Application of survival function in robust scheduling of production jobs. In Proceedings of the 2017 Federated Conference on Computer Science and Information Systems (FEDCSIS), Prague, Czech Republic, 4–7 September 2017; Ganzha, M., Maciaszek, M., Paprzycki, M., Eds.; IEEE: New York, NY, USA, 2017; pp. 575–578. [Google Scholar] [CrossRef]
- Dulina, L.; Bartanusova, M. CAVE Design Using in Digital Factory. Procedia Eng. 2015, 100, 291–298. [Google Scholar] [CrossRef] [Green Version]
- Durica, L.; Micieta, B.; Bubeník, P.; Binasova, V. Manufacturing multi-agent system with bio-inspired techniques: Codesa-prime. MM Sci. J. 2015, 2015, 829–837. [Google Scholar] [CrossRef] [Green Version]
- Tao, J.; Zhang, R.; Zhu, Y. DNA Computing Based Genetic Algorithm: Applications in Industrial Process Modeling and Control; Springer: Singapore, 2020. [Google Scholar] [CrossRef]
- Tabassum, M.; Mathew, K. A genetic algorithm analysis towards optimization solutions. Int. J. Digit. Inf. Wirel. Commun. 2014, 4, 124–142. [Google Scholar] [CrossRef]
- Ayala, H.V.H.; Coelho, L.D.S. Tuning of PID controller based on a multiobjective genetic algorithm applied to a robotic manipulator. Expert Syst. Appl. 2012, 39, 8968–8974. [Google Scholar] [CrossRef]
- Lopez, J. Optimisation with Matlab Using the Genetic Algorithm. Multiobjective Optimisation; Amazon Digital Services LLC—Kdp Print US: Seattle, WA, USA, 2019. [Google Scholar]
- Zou, T.; Wu, S.; Zhang, R. Improved state space model predictive fault-tolerant control for injection molding batch processes with partial actuator faults using GA optimization. ISA Trans. 2018, 73, 147–153. [Google Scholar] [CrossRef]
- Krajčovič, M.; Hančinský, V.; Dulina, L.; Grznár, P.; Gašo, M.; Vaculík, J. Parameter Setting for a Genetic Algorithm Layout Planner as a Toll of Sustainable Manufacturing. Sustainability 2019, 11, 2083. [Google Scholar] [CrossRef] [Green Version]
- Zhang, C.; Yang, J. Genetic Algorithm for Materialized View Selection in Data Warehouse Environments. In Data Warehousing and Knowledge Discovery; Mohania, M., Tjoa, A.M., Eds.; Lecture Notes in Computer Science; Springer: Berlin/Heidelberg, Germany, 1999; pp. 116–125. [Google Scholar] [CrossRef]
- Yao, M.; Chu, W. A genetic algorithm for determining optimal replenishment cycles to minimize maximum warehouse space requirements. Omega 2008, 36, 619–631. [Google Scholar] [CrossRef]
- Yang, W.; Chan, F.T.; Kumar, V. Optimizing replenishment polices using Genetic Algorithm for single-warehouse multi-retailer system. Expert Syst. Appl. 2012, 39, 3081–3086. [Google Scholar] [CrossRef]
- Qin, G.; Li, J.; Jiang, N.; Li, Q.; Wang, L. Warehouse Optimization Model Based on Genetic Algorithm. Math. Probl. Eng. 2013, 2013, 1–6. [Google Scholar] [CrossRef] [Green Version]
- Haijun, Z.; Bingwu, L. A New Genetic Algorithm for Order-Picking of Irregular Warehouse. In Proceedings of the 2009 International Conference on Environmental Science and Information Application Technology, Wuhan, China, 4–5 July 2009; Volume 1, pp. 121–124. [Google Scholar] [CrossRef]
- Liu, Y.; Ji, S.; Su, Z.; Guo, D. Multi-objective AGV scheduling in an automatic sorting system of an unmanned (intelligent) warehouse by using two adaptive genetic algorithms and a multi-adaptive genetic algorithm. PLoS ONE 2019, 14, e0226161. [Google Scholar] [CrossRef] [PubMed]
- Mallawaarachchi, V. Introduction to Genetic Algorithms Code. Available online: https://towardsdatascience.com/introduction-to-genetic-algorithms-including-example-code-e396e98d8bf3 (accessed on 29 May 2021).
- Tecnomatix Plant Simulation Help. Available online: https://docs.plm.automation.siemens.com/content/plant_sim_help/15/plant_sim_all_in_one_html/en_US/tecnomatix_plant_simulation_help/tecnomatix_plant_simulation/tecnomatix_plant_simulation_help.html (accessed on 10 March 2021).


| ZoneA | ZoneB | ZoneC | ZoneD |
|---|---|---|---|
| Carry_SN | Carry_BA | carry_dep_I | Sorting_oversize |
| Carry_TN_PDCarry_PP | Carry_DS | carry_depo_II | Carry_input_from_track_A |
| Carry_LM | Carry_TT_SE | carry_depo_III | Carry_input_from_track_C |
| Carry_MI | Delivery_oversize | carry_depo_IV | Carry_input_from_track_B |
| Carry_KE | Carry_TN_PD | carry_oncler_shipment | |
| Carry_LV_KN | Carry_PP | Carry_input_from_track_A | |
| Carry_BA | |||
| Carry_DS |
| Fitness | End of the Simulation | Number of Employees | Costs (EUR) |
|---|---|---|---|
| 2:43:23.5794 | 5:26:07.1587 | 20 | 451.11 |
| 2:42:49.5336 | 5:24:59.0671 | 20 | 451.00 |
| 2:43:01.1835 | 5:25:22.3670 | 20 | 451.03 |
| ZoneA | ZoneB | ZoneC | ZoneD |
|---|---|---|---|
| 10 | 2 | 1 | 3 |
Publisher’s Note: MDPI stays neutral with regard to jurisdictional claims in published maps and institutional affiliations. |
© 2021 by the authors. Licensee MDPI, Basel, Switzerland. This article is an open access article distributed under the terms and conditions of the Creative Commons Attribution (CC BY) license (https://creativecommons.org/licenses/by/4.0/).
Share and Cite
Grznár, P.; Krajčovič, M.; Gola, A.; Dulina, Ľ.; Furmannová, B.; Mozol, Š.; Plinta, D.; Burganová, N.; Danilczuk, W.; Svitek, R. The Use of a Genetic Algorithm for Sorting Warehouse Optimisation. Processes 2021, 9, 1197. https://doi.org/10.3390/pr9071197
Grznár P, Krajčovič M, Gola A, Dulina Ľ, Furmannová B, Mozol Š, Plinta D, Burganová N, Danilczuk W, Svitek R. The Use of a Genetic Algorithm for Sorting Warehouse Optimisation. Processes. 2021; 9(7):1197. https://doi.org/10.3390/pr9071197
Chicago/Turabian StyleGrznár, Patrik, Martin Krajčovič, Arkadiusz Gola, Ľuboslav Dulina, Beáta Furmannová, Štefan Mozol, Dariusz Plinta, Natália Burganová, Wojciech Danilczuk, and Radovan Svitek. 2021. "The Use of a Genetic Algorithm for Sorting Warehouse Optimisation" Processes 9, no. 7: 1197. https://doi.org/10.3390/pr9071197