Review

Markers for the Comparison of the Performances of Anoxic Biotrickling Filters in Biogas Desulphurisation: A Critical Review

by
Emky Valdebenito-Rolack
1,2,3,*,
Rosario Díaz
1,2,3,
Felipe Marín
1,2,
Daniel Gómez
1,2 and
Felipe Hansen
1,2,3
1
ProCycla SpA and SL, Camino Fundo El Junco SN, Melipilla 9580000, Región Metropolitana, Chile
2
Carretera Pont de Vilomara 140, 2-1, 08241 Manresa, Spain
3
Aroma SpA, Camino Fundo El Junco SN, Melipilla 9580000, Región Metropolitana, Chile
*
Author to whom correspondence should be addressed.
Processes 2021, 9(3), 567; https://doi.org/10.3390/pr9030567
Submission received: 15 February 2021 / Revised: 18 March 2021 / Accepted: 21 March 2021 / Published: 23 March 2021
(This article belongs to the Special Issue Current Trends in Anaerobic Digestion Processes)

Abstract

:
The agriculture and livestock industry generate waste used in anaerobic digestion to produce biogas containing methane (CH4), useful in the generation of electricity and heat. However, although biogas is mainly composed of CH4 (~65%) and CO2 (~34%), among the 1% of other compounds present is hydrogen sulphide (H2S) which deteriorates engines and power generation fuel cells that use biogas, generating a foul smell and contaminating the environment. As a solution to this, anoxic biofiltration, specifically with biotrickling filters (BTFs), stands out in terms of the elimination of H2S as it is cost-effective, efficient, and more environmentally friendly than chemical solutions. Research on the topic is uneven in terms of presenting performance markers, underestimating many microbiological indicators. Research from the last decade was analyzed (2010–2020), demonstrating that only 56% of the reviewed publications did not report microbiological analysis related to sulphur oxidising bacteria (SOB), the most important microbial group in desulphurisation BTFs. This exposes fundamental deficiencies within this type of research and difficulties in comparing performance between research works. In this review, traditional and microbiological performance markers of anoxic biofiltration to remove H2S are described. Additionally, an analysis to assess the efficiency of anoxic BTFs for biogas desulphurisation is proposed in order to have a complete and uniform assessment for research in this field.

1. Introduction

Anaerobic digestion (AD) is a biological process where solid organic matter originated in the agriculture and livestock industry, among others, is used to obtain biogas containing methane (CH4), which in quantities of ~65% is burned to produce bioenergy as heat and electricity in cogeneration engines [1]. The world’s biggest waste sources used in AD come from rice farming, corn farming, and wheat. Among them, the major energy crops for biogas production are maize silage and grass, followed by lignocellulosic residues or other plant biomass in general (rich in lignin content) from sources such as banana plants (leftover banana trees, flowers, leaves), palm oil residues after harvest, sugar and palm oil refinement processes (that produce large quantities of fibrous lignocellulosic biomass), forestry residues, coffee pulp, and field residues such as corn stover [2]. AD is conducted by breaking up the organic matter (anaerobically) generating biogas, mainly composed of methane (CH4) and carbon dioxide (CO2), with a lower concentration of hydrogen sulphide (H2S), ammonium (NH3), and other trace compounds [1].
AD is carried out by several groups of bacteria and methanogenic archaea in four stages: hydrolysis, acidogenesis, acetogenesis, and methanogenesis, CH4 is produced in the last stage [1]. In the intermediate stages of AD, H2S is produced from the degradation of proteins containing sulphur-rich amino acids and from the sulphate reduction (SO42−). This process is carried out by sulphate-reducing bacteria (SRB) [3].
At low concentrations (0.01–0.3 ppmv) H2S produces foul smells and the effects of H2S on human health at different concentrations are summarized in Table 1. Thus, the maximum exposure concentration permitted in the industry is 10 ppmv, with peaks of 50 ppmv accepted for a duration of 10 min [4,5].
During biogas combustion for the production of heat or electricity in cogeneration units, the co-combustion of the H2S content produces sulphur dioxide (SO2) emissions which cause acid rain [6]. Furthermore, at concentrations over 500 ppmv H2S corrodes metals and degrades engine oil in the cogeneration units where biogas is burned to generate electrical power, producing malfunction [7,8,9]. For the use of biogas in combustion for the generation of heat, concentrations of up to 200–500 ppmv are accepted, but preferably this should be zero [10].
Another use of biogas affected by its H2S content is in the application of biogas as a raw material for high-efficiency fuel cells, especially solid-oxide fuel cells (SOFC) where electricity is generated by electrochemical reactions with low contaminant emissions [11]. For instance, in conventional SOFCs with nickel anodes, H2S forms a nickel sulphide precipitate (NiS) creating a metal sulphide layer on the anode surface, reducing the cell electrochemical activity [12]. The effect of H2S on the anodes depends on the SOFC materials and the operating temperature. Thus, it has been reported that in cells with nickel-yttria stabilized zirconia (Ni-YSZ), scandium-stabilized zirconia (Ni-ScSZ), and nickel-gadolinium-doped-ceria (Ni-GDC) a harmful effect on the anode occurs at >5–20 ppmv [12].
The aforementioned corrosion of electricity cogeneration units and the international regulations referring to H2S concentrations prior to biomethane injection into natural gas grids (among others) have motivated the development of many physical-chemical and biological methods for eliminating H2S in biogas [13]. The first methods include technologies based on in-situ chemical precipitation, absorption, and membrane separation [13]. The latter refer to biofilters, which stand out because they are cost-effective, efficient, and more environmentally friendly than physical-chemical methods [14]. Biofilters for gas treatment are devices in which a residual gas current containing pollutants is passed through a packing material containing bacteria immobilized as biofilms capable of metabolizing the pollutants (like H2S in biogas) [15]. There are two groups of biofilters: (1) open biofilters: usually a box with packing material containing the biofilms inside which is open to the atmosphere, in which parameters such as temperature, humidity, and the purity of the microbial cultures are difficult to control as they are weather dependent (due to rain and temperature fluctuation, among others); and (2) closed biofilters: in which the biofilm-containing packing material is inside a closed container (usually made of steel or plastic), making it easier to control parameters such as culture media flow, nutrients, gas flow, temperature, and humidity [16]. Biofiltration is considered more environmentally and economically friendly than physical-chemical methods, as it requires significantly lower chemical use and energy consumption, which translates into a low carbon footprint and lower costs [14]. Thus, H2S biofiltration has been researched since the early 1990s [17], being of greater interest in recent years [18]. Biotrickling filters (BTF) are a type of closed biofilter combined with a bioreactor containing a microorganisms culture or a nutrient solution container. These filters are different to other biological solutions such as bioscrubbers as they contain packing material in the biofiltration section, while for bioscrubbers the biofiltration is undertaken in two stages: firstly, a column containing a liquid culture to absorb the pollutant is used and then a bioreactor is used in order to carry out the pollutant degradation [19]. BTFs are one of the most widely used biological technologies to perform biogas desulfurisation, because of their lower investment, operation, and maintenance costs, as well as for their greater energy efficiency, both in the removal of foul smells and in industrial-scale applications for biogas treatment [20,21]. Furthermore, this type of biotechnology presents a low pressure drop and an equitable distribution of microorganisms through the biofilter bed of the BTF [22]. Due to these factors, we henceforth focus our discussion on BTFs.
Although research on biofiltration to remove H2S is extensive, the results are often unevenly reported, making it difficult to compare the efficiency of BTFs and neglecting the microorganisms used (Table 2). There are almost as many ways to express biofiltration performance markers as there are research works on them. In some cases only H2S inlet and outlet concentrations of the biofilter or BTF were reported, without taking into account the type and concentration of microorganisms that performed the degradation, as described in the Table 2, in the research items 8, 9, 13, 14, and 15. For example, Brito et al. (2018) evaluated the change of nitrate (NO3) to nitrite (NO2) as electron acceptors in BTFs for H2S removal, only reporting the outlet H2S concentration (15 ppmv), describing loading rates (LR) from 7–69 g m−3h−1. However, it would be more insightful to have a performance comparison on critical and maximal elimination capacities (ECs) and their respective removal efficiencies (REs), specifically if the LRs was given [23]. In other cases, different operational conditions of the BTFs were compared through the indicators’ removal efficiencies (REs), empty bed residence times (EBRTs), ECs, and H2S LRs, as described in the Table 2, in the research items 1, 2, 3, 4, 5, 6, 7, 10, 11, 12, 16, 17, and 18. Today these markers are considered traditional parameters of biofiltration efficiency, referring to the process carried out in biofilters or BTFs indistinctly [24]. Some works, such as Valle et al. (2018), have focused on the analysis of the BTF microbiota and the RE, but they did not report on other important biofiltration performance markers, such EC, and other parameters like EBRT can only be calculated or inferred by the reader based on the presented data [25]. In the same way, most of the research cited in this review only reports the critical indicators (like ECcrit) or the maximal markers (like ECmax) and they are not the same (see Section 3). One of the reviewed works, Almenglo et al. (2016), reported on both the critical and maximal performance markers, indicating an ECcrit of 94.7 g m−3 h−1 with a respective RE > 99% and an ECmax of 127.3 g m−3 h−1 with an RE = 92.6% [26]. Although it is true that the study of traditional efficiency parameters is the most practical way to compare different operational scenarios in biofiltration, it is also important to investigate the speed at which the inoculated microorganisms colonize the packing material used and draw a relationship between the biomass of the formed biofilm and the H2S concentration that the biofiltration device is capable of removing. This will be an indicator that the species, strain, or microbial community used is more or less efficient (for which taxonomic identification will be convenient) and will allow the selection of microorganisms and packing materials suitable in preventing clogging by biomass or elemental sulphur accumulation, a collateral effect that reduces the efficiency of the device producing pressure drops in the long term [27,28]. For example, Fernández et al. (2012) compared two BTFs, one packed with open polyurethane foam (BTHE) and the other with polypropylene pall rings (BTHA), both inoculated with a strain (DSM 12475) of the sulphur-oxidizing bacteria Thiobacillus thioparus. This research group observed that the BTHE EC (22 g H2S m−3h−1) was higher than the BTHA EC (12 g H2S m−3h−1), finding that for the BTHA the biomass was 1log less (1.96 × 10⁹ cells (g dry carrier)−1, suggesting that the higher performance of BTHE was caused by its greater immobilized biomass and, despite the higher EC of BTHE, this BTF will be clogged sooner than the one containing BTHA [29]. On the other hand, Tayar et al. (2019) evaluated the immobilized biomass of an impure microbial inoculum (anaerobic sludge) in different polymeric packing materials of BTFs, such polyvinyl chloride (PVC) and open-pore polyurethane foam (OPUF), among others, finding that the PVC BTF produced an EC six times higher than that of the OPUF (84.4 gS H2S m−3h−1 and 14 gS H2S m−3h−1, respectively) in view of the fact that the biomass immobilized in the PVC was ~1.7 times less than that of the OPUF (15 and ~25.4 mass of protein per mass of dry support (mg g−1), respectively) and with the advantage that PVC is cheaper than OPUF [30]. In addition, this is a topic that is closely related to the material chosen to develop the bacterial biofilms in the BTF, demonstrating that the biomass immobilization tests in addition to the EC testing are useful in the selection of suitable packing materials [18]. The problem is that research on anoxic biogas filtration to remove H2S has focused on one of these three topics: (a) the concentrations removed by the BTF, (b) the traditional removal parameters (RE, LR, EBRT, and EC) or, (c) the BTF microbial ecology. However, the behaviour of a BTF is the sum of the three aspects described above and they must be analysed as a whole. Few investigations include the three factors mentioned before. In fact, it has been recently described that the device technical characteristics, gas flow (Q), traditional biofiltration parameters, types of microorganisms used, and type of culture medium must be adequately correlated to establish robust conclusions about the behaviour of a biofiltration system [16]. In view of all this, standardization of the results presentation in biofiltration to remove H2S from biogas or for any type of gas BTF research, is of vital importance. Similarly, it is also important to determine the concentration and identity of the microorganisms used. Because of this, the objectives of this article are: (a) to review the traditional efficiency and microbiological markers in BTFs and the correct presentation of them; (b) to describe the microbiological analyses that are convenient for performance in the biotrickling filter study; (c) to review the status of BTFs for biogas H2S anoxic removal in the recent decade (2010–2020), with emphasis on the research comparison as per the traditional and microbiological markers; and (d) to propose a performance markers framework for the comparison of BTF research that every study in the field should use.

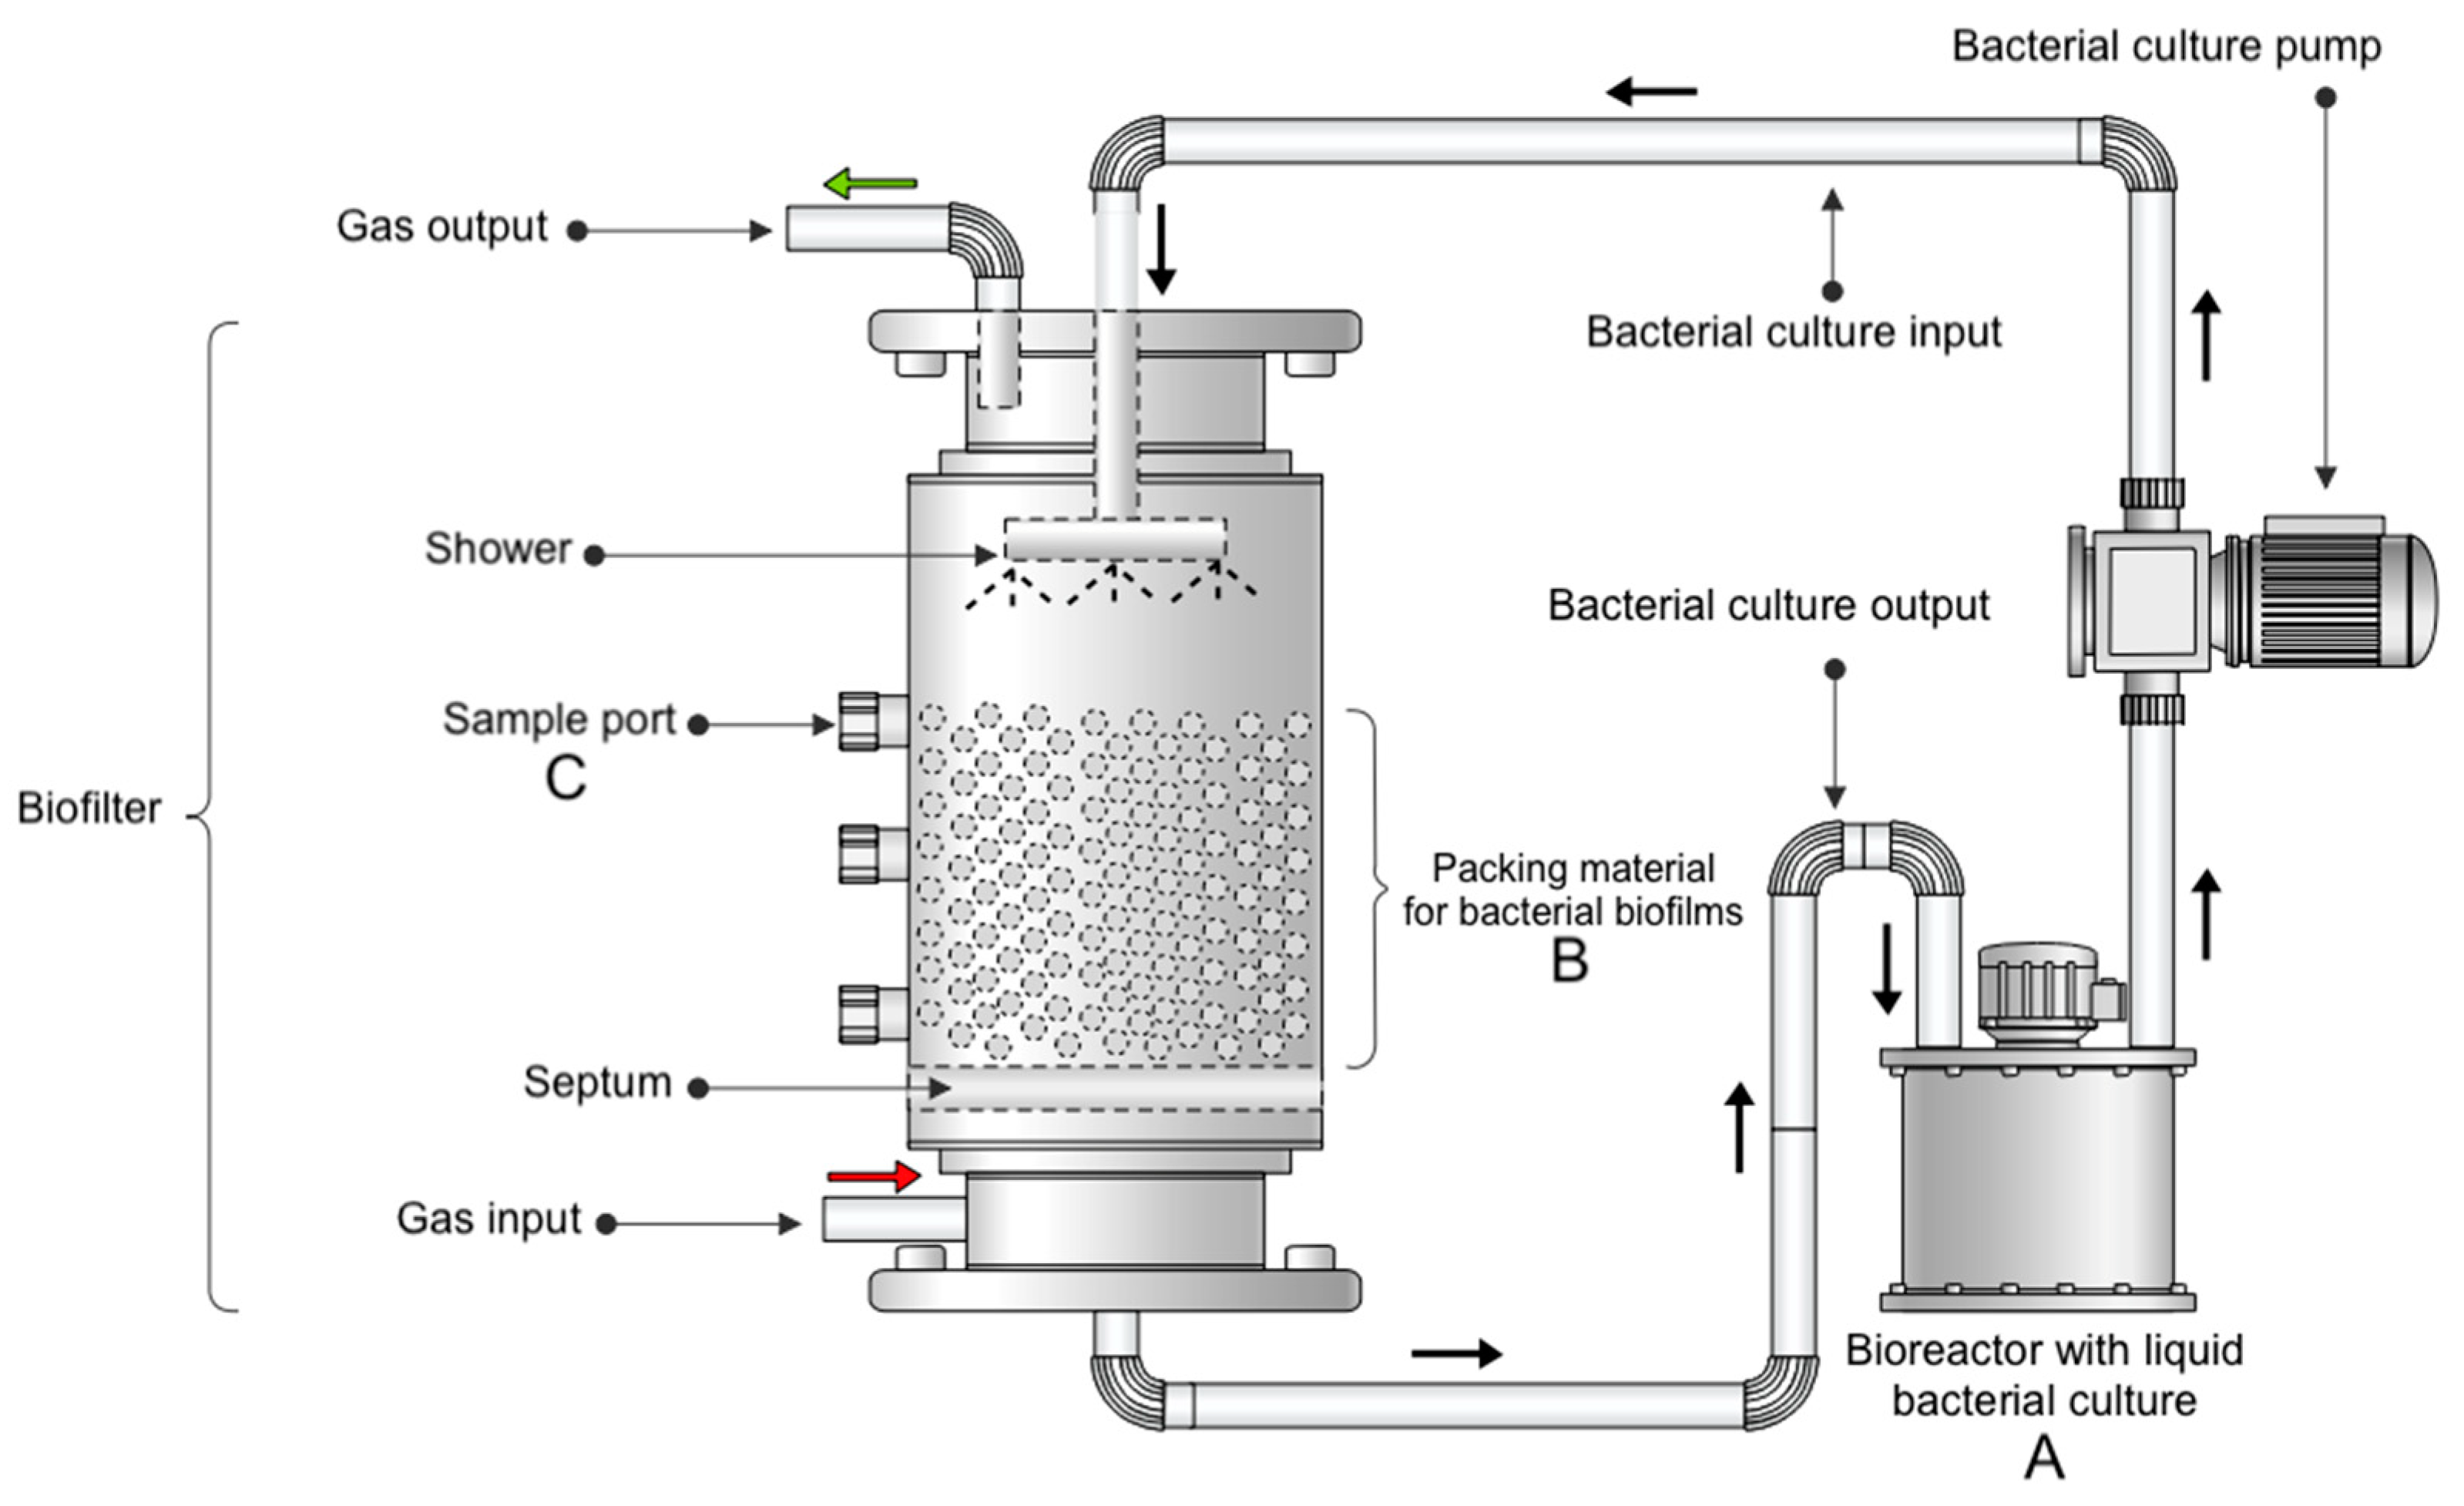
2. Biotrickling Filters

As previously described, BTFs are biological devices that remove chemical contaminants from a gas flow and are considered as a type of biofilter [29,31,44]. However, there are some configuration differences between them. While in a biofilter a microorganisms culture is intermittently applied, in BTFs the culture is continuously recirculated through a packing material, forming microorganism biofilms (BFs) [16]. BFs are organized microorganism communities attached to surfaces, embedded in an exopolysaccharide (EPS) matrix, whose physiology and gene expression is different than a planktonic community. Among these differences are: (a) BF microorganisms are more resistant to environmental factors; (b) they do not limit their growth by substrate, as they can interact with the environment and among themselves since they are not fixed structures; and (c) they produce EPSs [44,45,46].
The basic setup of a BTF is usually a cylinder-shaped container filled with a packing material (Figure 1B) that is basically the biofilter part of the device, consisting of a sprinkler at the top (Figure 1, “shower”), from which the prokaryote microorganisms culture originated from a bioreactor or fermenter (Figure 1A) is applied. This culture drains through the packing material, contributing to the growth of prokaryote microorganism BF (usually bacteria or archaea). In the case of treating contaminated biogas, a counter current is usually applied from the lower part of the BTF (Figure 1, red arrow), ascending through the packing material containing the BF, where the pollutants are metabolized resulting in a reduced or eliminated contaminant concentration biogas through the upper part of the device (Figure 1, green arrow). This type of solution has been tested at an industrial scale from very low concentrations to values close to 15,000 ppmv [32,33].

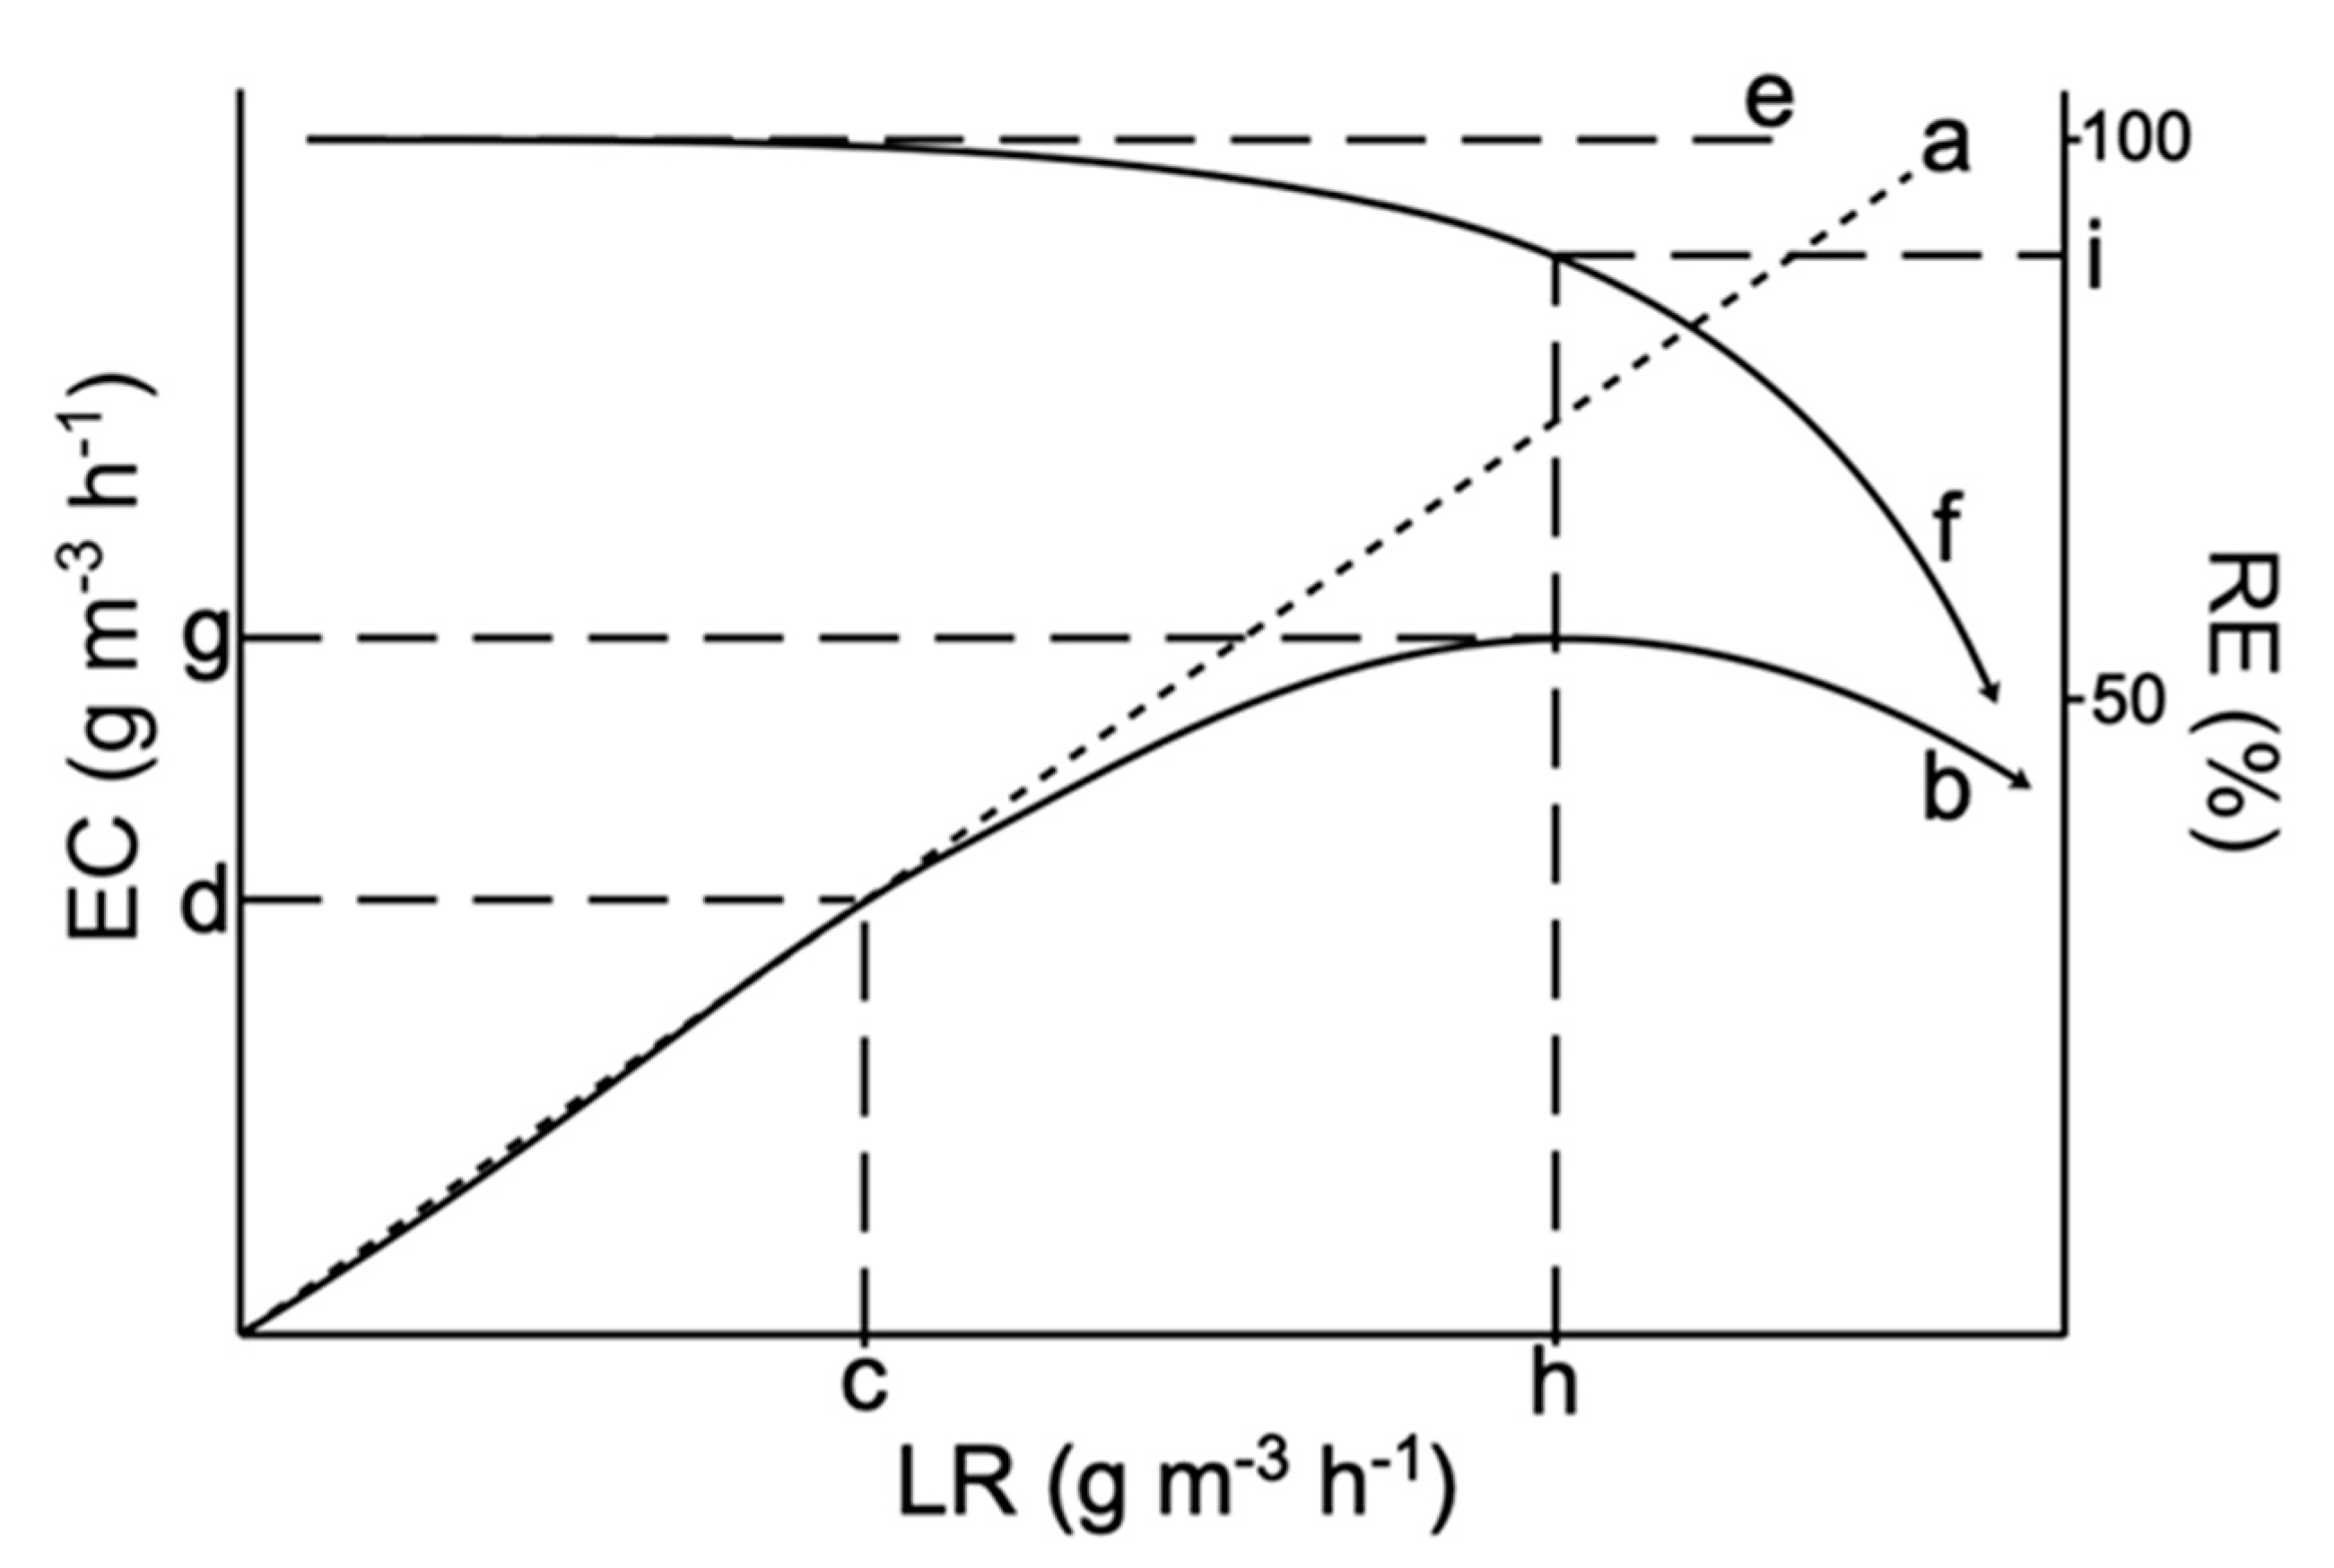
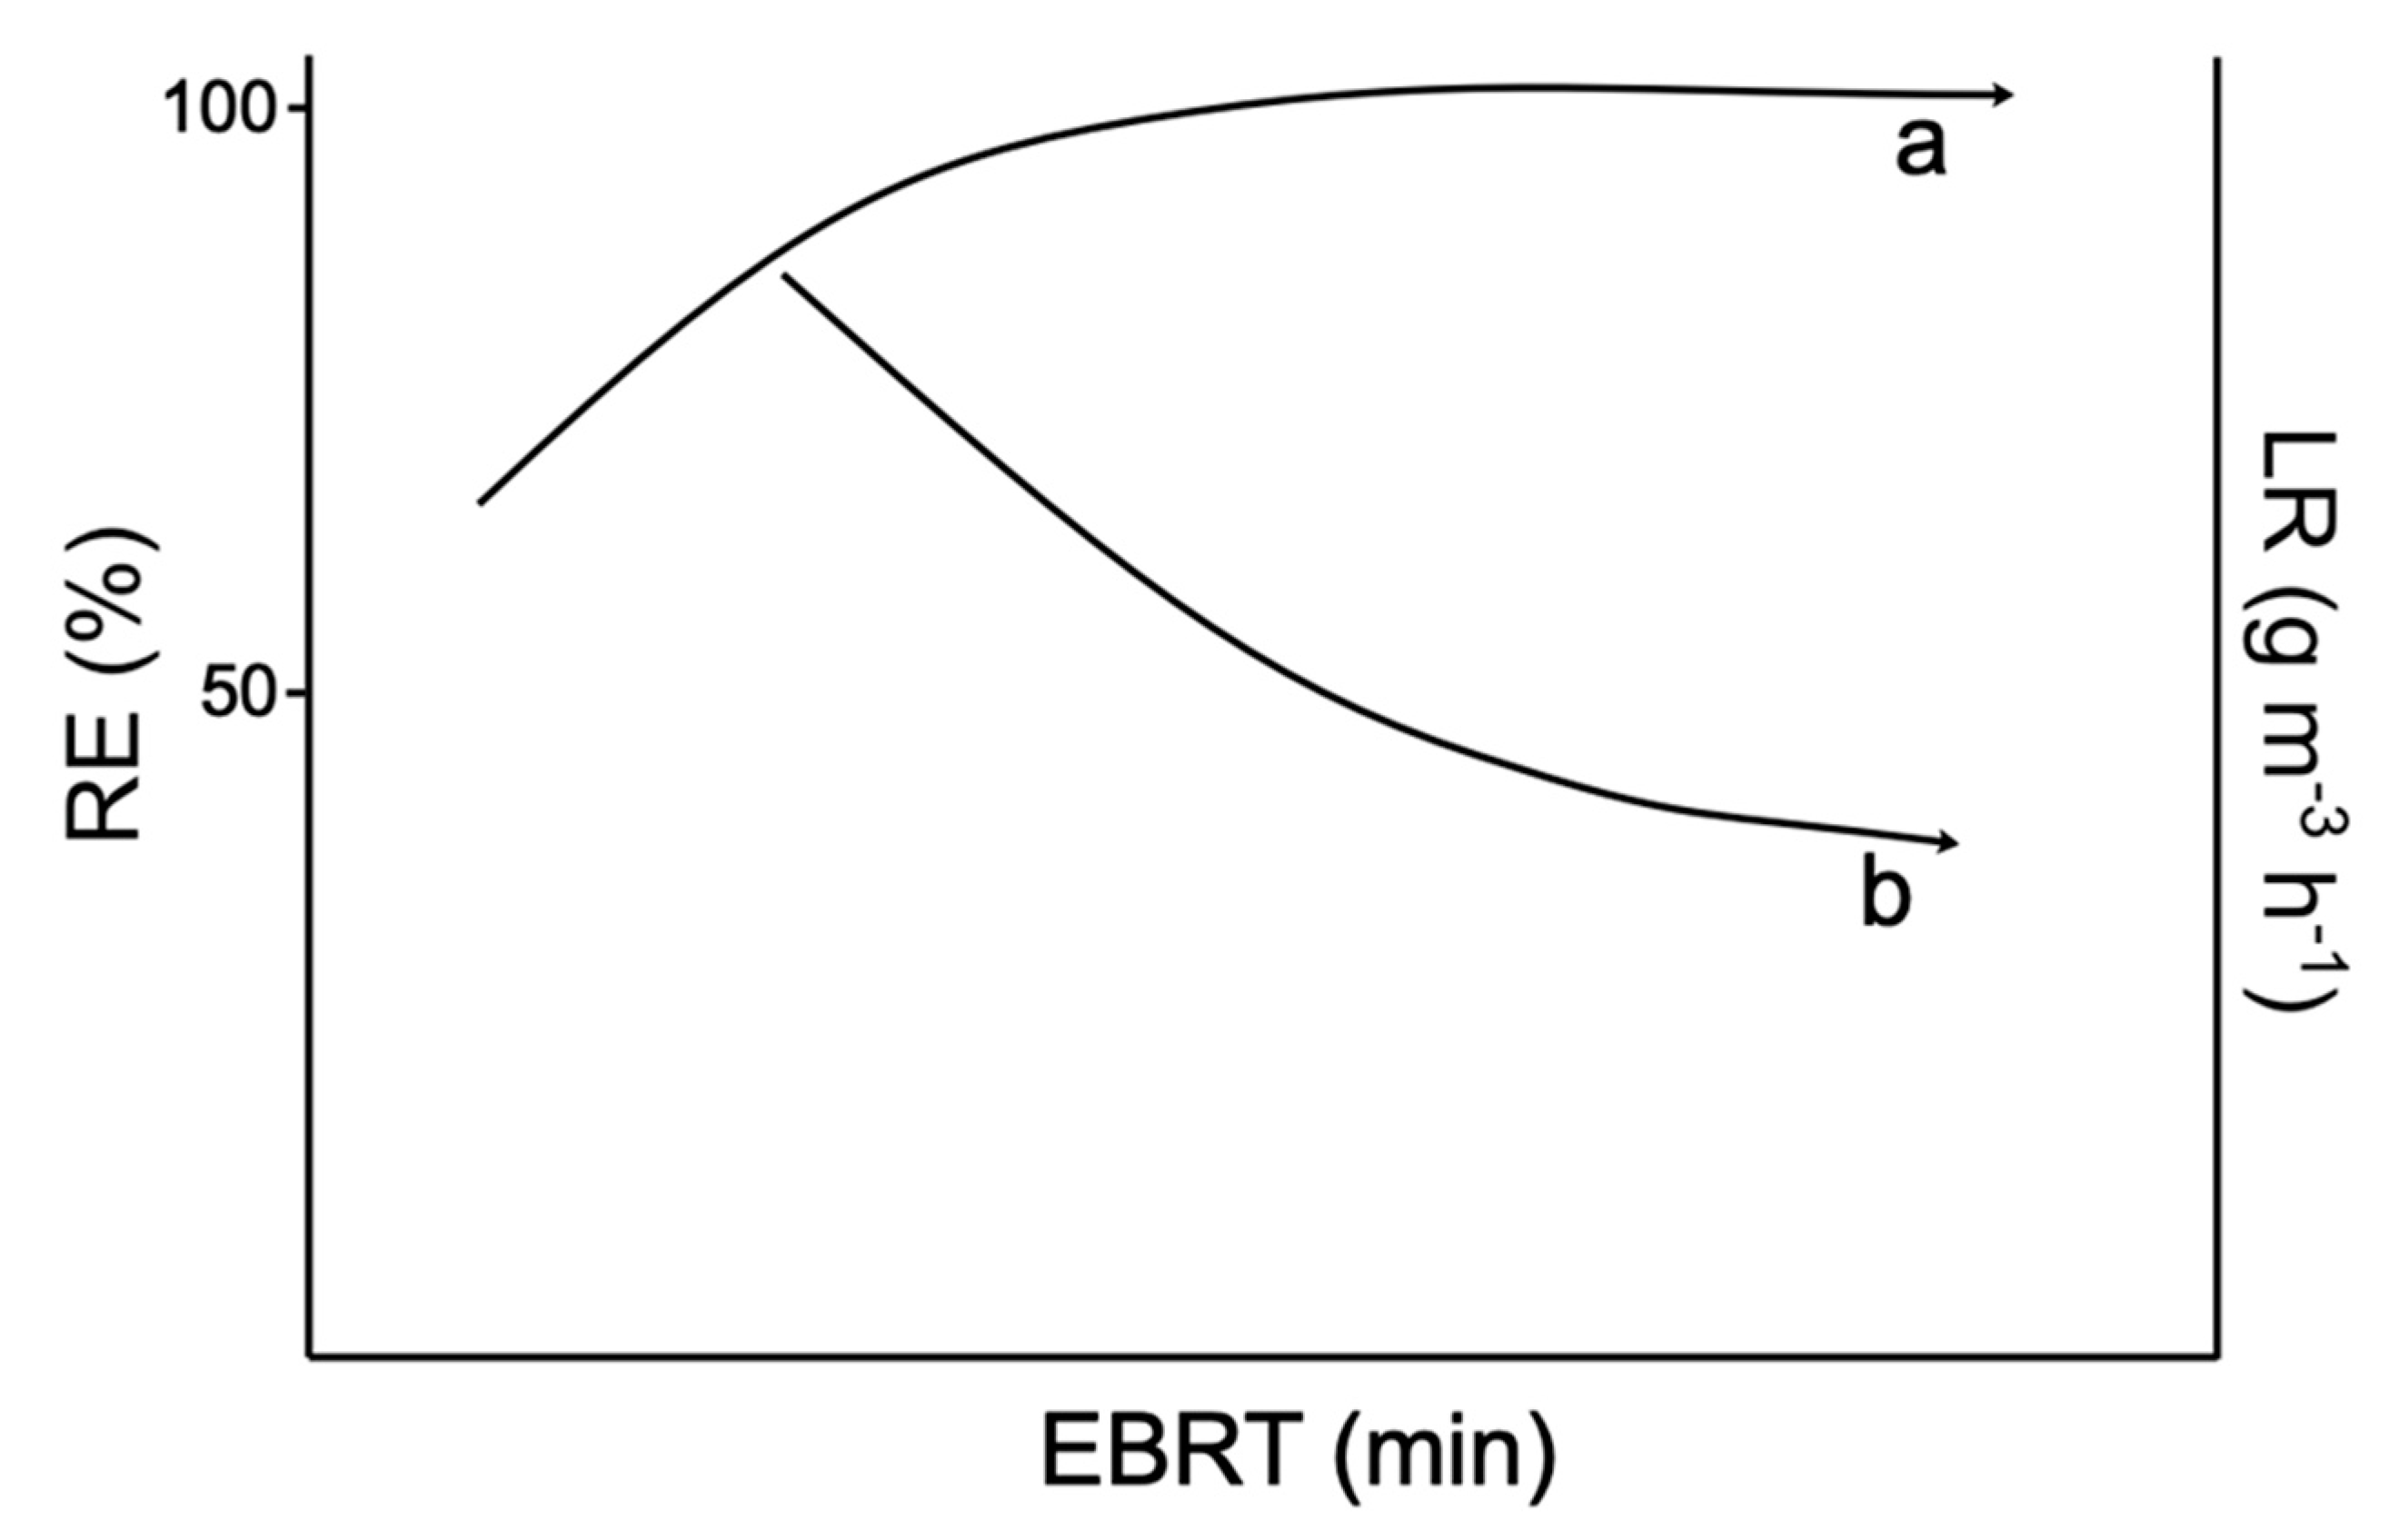
3. Traditional Biofiltration Efficiency Parameters

The main parameters that allow for the comparison of biofiltration performance are listed together with their corresponding equations in Table 3 [3,19,24,39,47].
Variables described in Table 3, EC versus LR and RE versus LR are usually plotted based on biofiltrations experiments as illustrated in the Figure 2 [29,30,39,44]. Theoretically, EC increases proportionally and linearly as LR increases, considering a RE of 100% (Figure 2a). However, in all experiments documented up to date, have found a deviation of the theoretical curve (Figure 2b) from a certain critical LR (LRcrit) (Figure 2c). The EC corresponding to this LRcrit is called critical EC (ECcrit) (Figure 2d). At that point the RE (Figure 2f) is still between 99–100% (RE for ECcrit). The EC corresponding to the point of inflexion before its drop is called maximum EC (ECmax) (Figure 2g), which reflects an RE lower than 99% (Figure 2i) [24]. It is desirable for a BTF to have an experimental curve that is as close to the theoretical curve as possible and that the ECcrit should have the highest possible value [39]. Similarly, the RE has a theoretical curve of 100% removal (Figure 2e), but actually, the curve deviates towards lower removal percentages (Figure 2f), usually close to 90% RE (Figure 2i), when the EC value approaches ECmax (Figure 2g) and the maximum LR (LRmax) (Figure 2h) [47,48,49,50].
On the other hand, H2S contaminated biogas must remain in the BTF bed for a certain amount of time so that it comes into contact with the sulphur oxidizing bacteria (SOB) biofilms in order for the H2S biological oxidation to occur. Such as interval is called the empty bed residence time (EBRT) (Table 3). Thus, a graph of RE versus EBRT is drawn (Figure 3) where RE increases along with EBRT (Figure 3a) while LR decreases (Figure 3b) [39]. The EBRT value can range from a few seconds to hours [41,51]. The higher the value, the higher the RE, although, the LR will be lower and lower. Furthermore, at very high EBRT values, high volume BTFs are needed [3]. Thus, a BTF will be more efficient at an optimal LR, allowing the highest EC, RE, and EBRT at the same time.
The determination of critical and maximum markers is already an accepted methodology to compare BTF performances [24]. However, research reporting only maximum or only critical values are still published (Table 2).

4. BTF Microbiological Study

Sulphur is one of the most abundant elements on our planet, being found in the lithosphere, hydrosphere, and atmosphere in the form of chemical species such as sulphates (SO42−), mineral sulphides (pyrite, FeS2), elemental sulphur (S0), and the totally reduced sulphur compounds (TRS), such as hydrogen sulphide (H2S), dimethylsulphide (DMS), dimethyl disulphide (DMDS), and methyl mercaptane (MM) [51,52]. The transformation from one chemical species to another is carried out by the sulphur cycle in which the most reduced ion is S2−, and the most oxidized is SO42−. The latter is reduced by plants, fungi, archaea, and bacteria to form amino acid-sulphur compounds that become protein parts through the assimilation pathway [3]. However, there are sulphate-reducing bacteria that carry out non-assimilative metabolic pathways, releasing TRS in a gaseous form. In AD, one of the main TRS is H2S, which within the sulphur cycle is oxidized by SOB [3,53]. SOB are a diverse group of bacteria and archaea, which use TRS and other not totally reduced sulphur compounds (such as thiosulphate, S2O32−) as electron donors (energy source); oxygen as the ultimate electron acceptor in the case of aerobic SOB; and the NO3− as the last electron acceptor in the case of anaerobic SOB [18,54]. The latter, known as chemolithotrophic denitrifying SOB, display an advantage due to the fact that BTF or bioreactor aeration cycles are not necessary. In this bacterial group, NO3 denitrification can be completely carried out up to N2 or incompletely up to NO2 [55,56]. Thus, when N/S > 1.6 is given, anoxic SOB oxidize the H2S and reduce the NO3 completely down to SO42− and N2, respectively, while at N/S < 0.4 such bacteria only perform oxidoreduction down to S0 and NO2 [18,55]. Added to the actual behaviour of the EC and the RE with respect to the LR, this strongly suggests that BTFs should be microbiologically studied to maintain a strain or bacterial community that is efficient in terms of the parameters described above. This study should not only be carried out in terms of identifying the microorganisms involved and their proportion (through molecular techniques), but it should also quantify the biomass that adheres to the support material in order to evaluate the efficiency of the bacterial groups involved. This also leads to another very important point: the evaluation of different packing materials.

4.1. SOB Molecular Characterization in an Anoxic Desulphurisation BTF

Due to the above, SOB have become the focus of much research on TRS bioremediation, with chemolithotrophic species (which use CO2 as their sole carbon source) being more attractive as they are economically easier to maintain, as there is no need to add an organic carbon source to the culture medium. Among the research mentioned (Table 2) are those describing biogas anoxic desulphurisation (Table 2), in which parameters of BTF efficiency have been widely described, but their microbiological study is scarce [18]. Anoxic H2S biofiltration studies are very recent and most refer to the analysis of the gene encoding 16S rRNA from samples of packing material taken at different heights of the BTF [32,35,42,44]. However, there are two types of samples to be considered in the study of microbiological changes occurring in a BTF: (1) the support material that is inside the BTF bed, where the bacterial biofilms to be used in the bioremediation are formed, as previously described (Figure 1B); and (2) the bacterial culture contained in the bioreactor of the BTF, the analysis of which we also propose, since it influences changes in the BTF (Figure 1A). Regarding this last point, there are disadvantages in laboratory-scale experimentation as when taking samples from the support material it is necessary to open the sample ports (Figure 1C) interrupting the anaerobiosis affecting the BTF’s performance and requiring a re-acclimatization that must be standardized for each experiment, according to the AD biogas composition. Most of the studies described (Table 2) have analysed changes in the BTF microbial community through the DNA extraction from the bacterial resuspension obtained from the packing material, the subsequent amplification of the gene encoding 16S rRNA, and later analysis by denaturing gradient gel electrophoresis (DGGE) [32,42,44] or by amplifying sequences and making phylogenetic analysis [35].

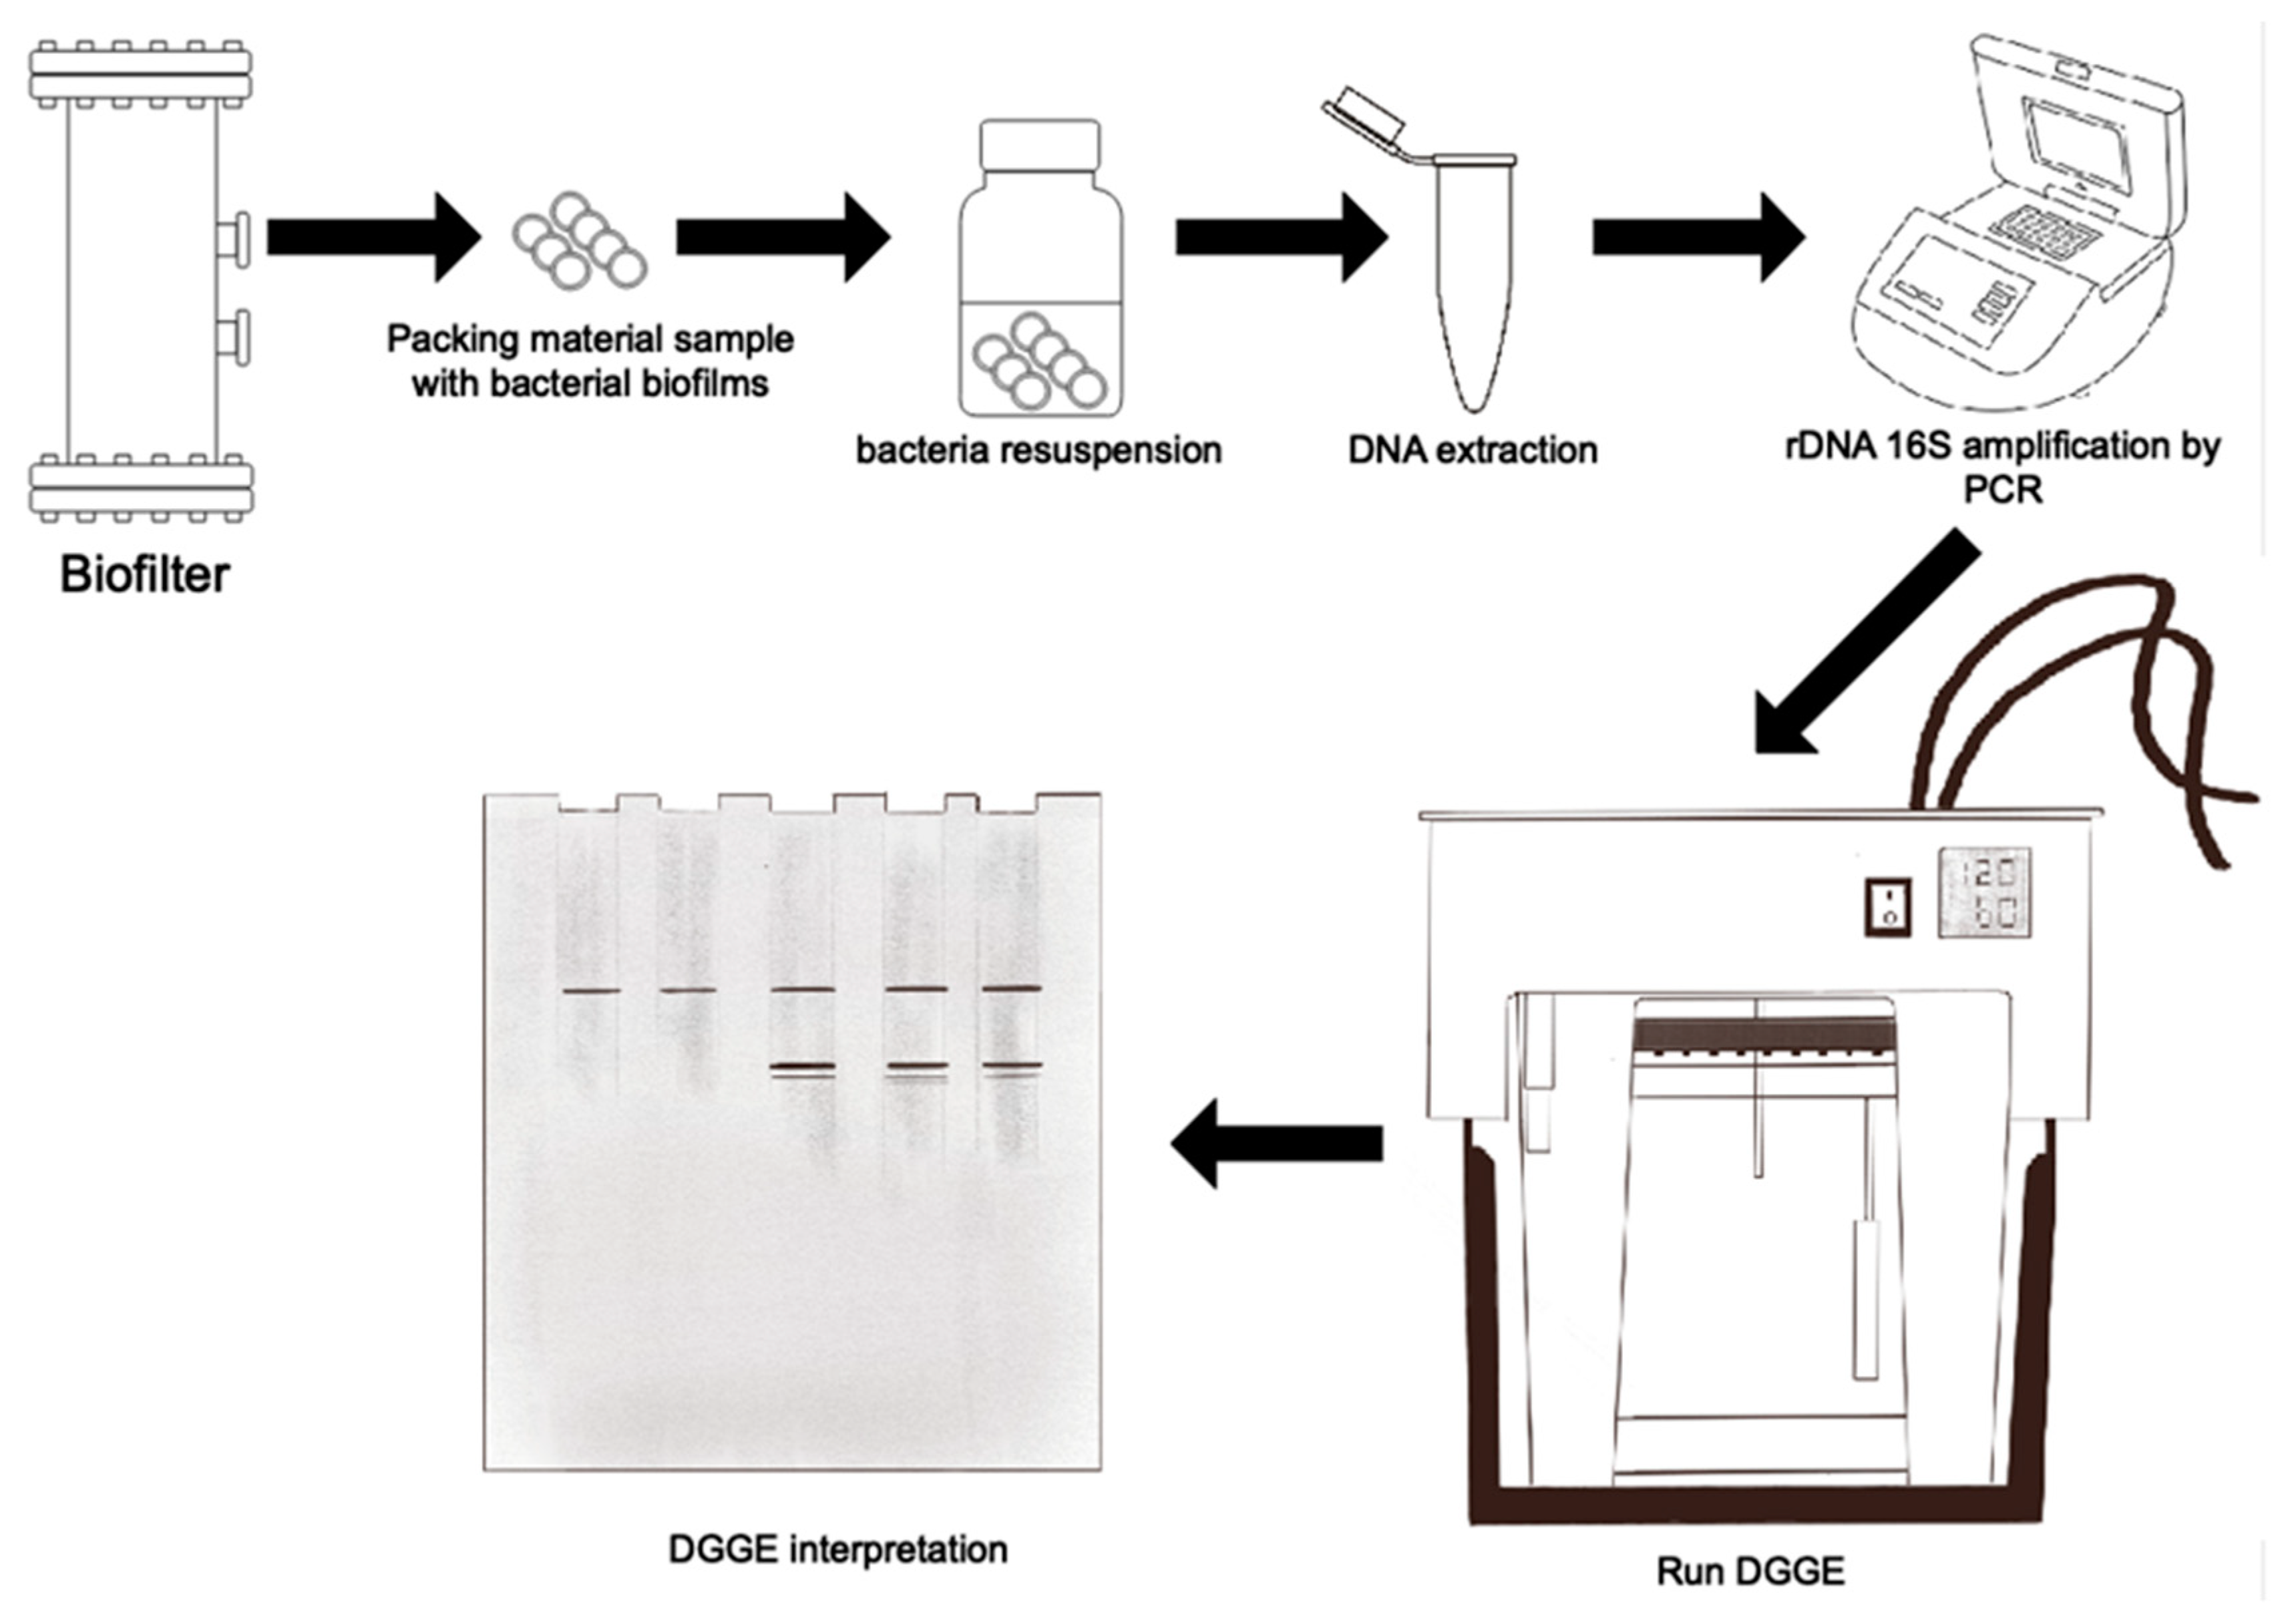
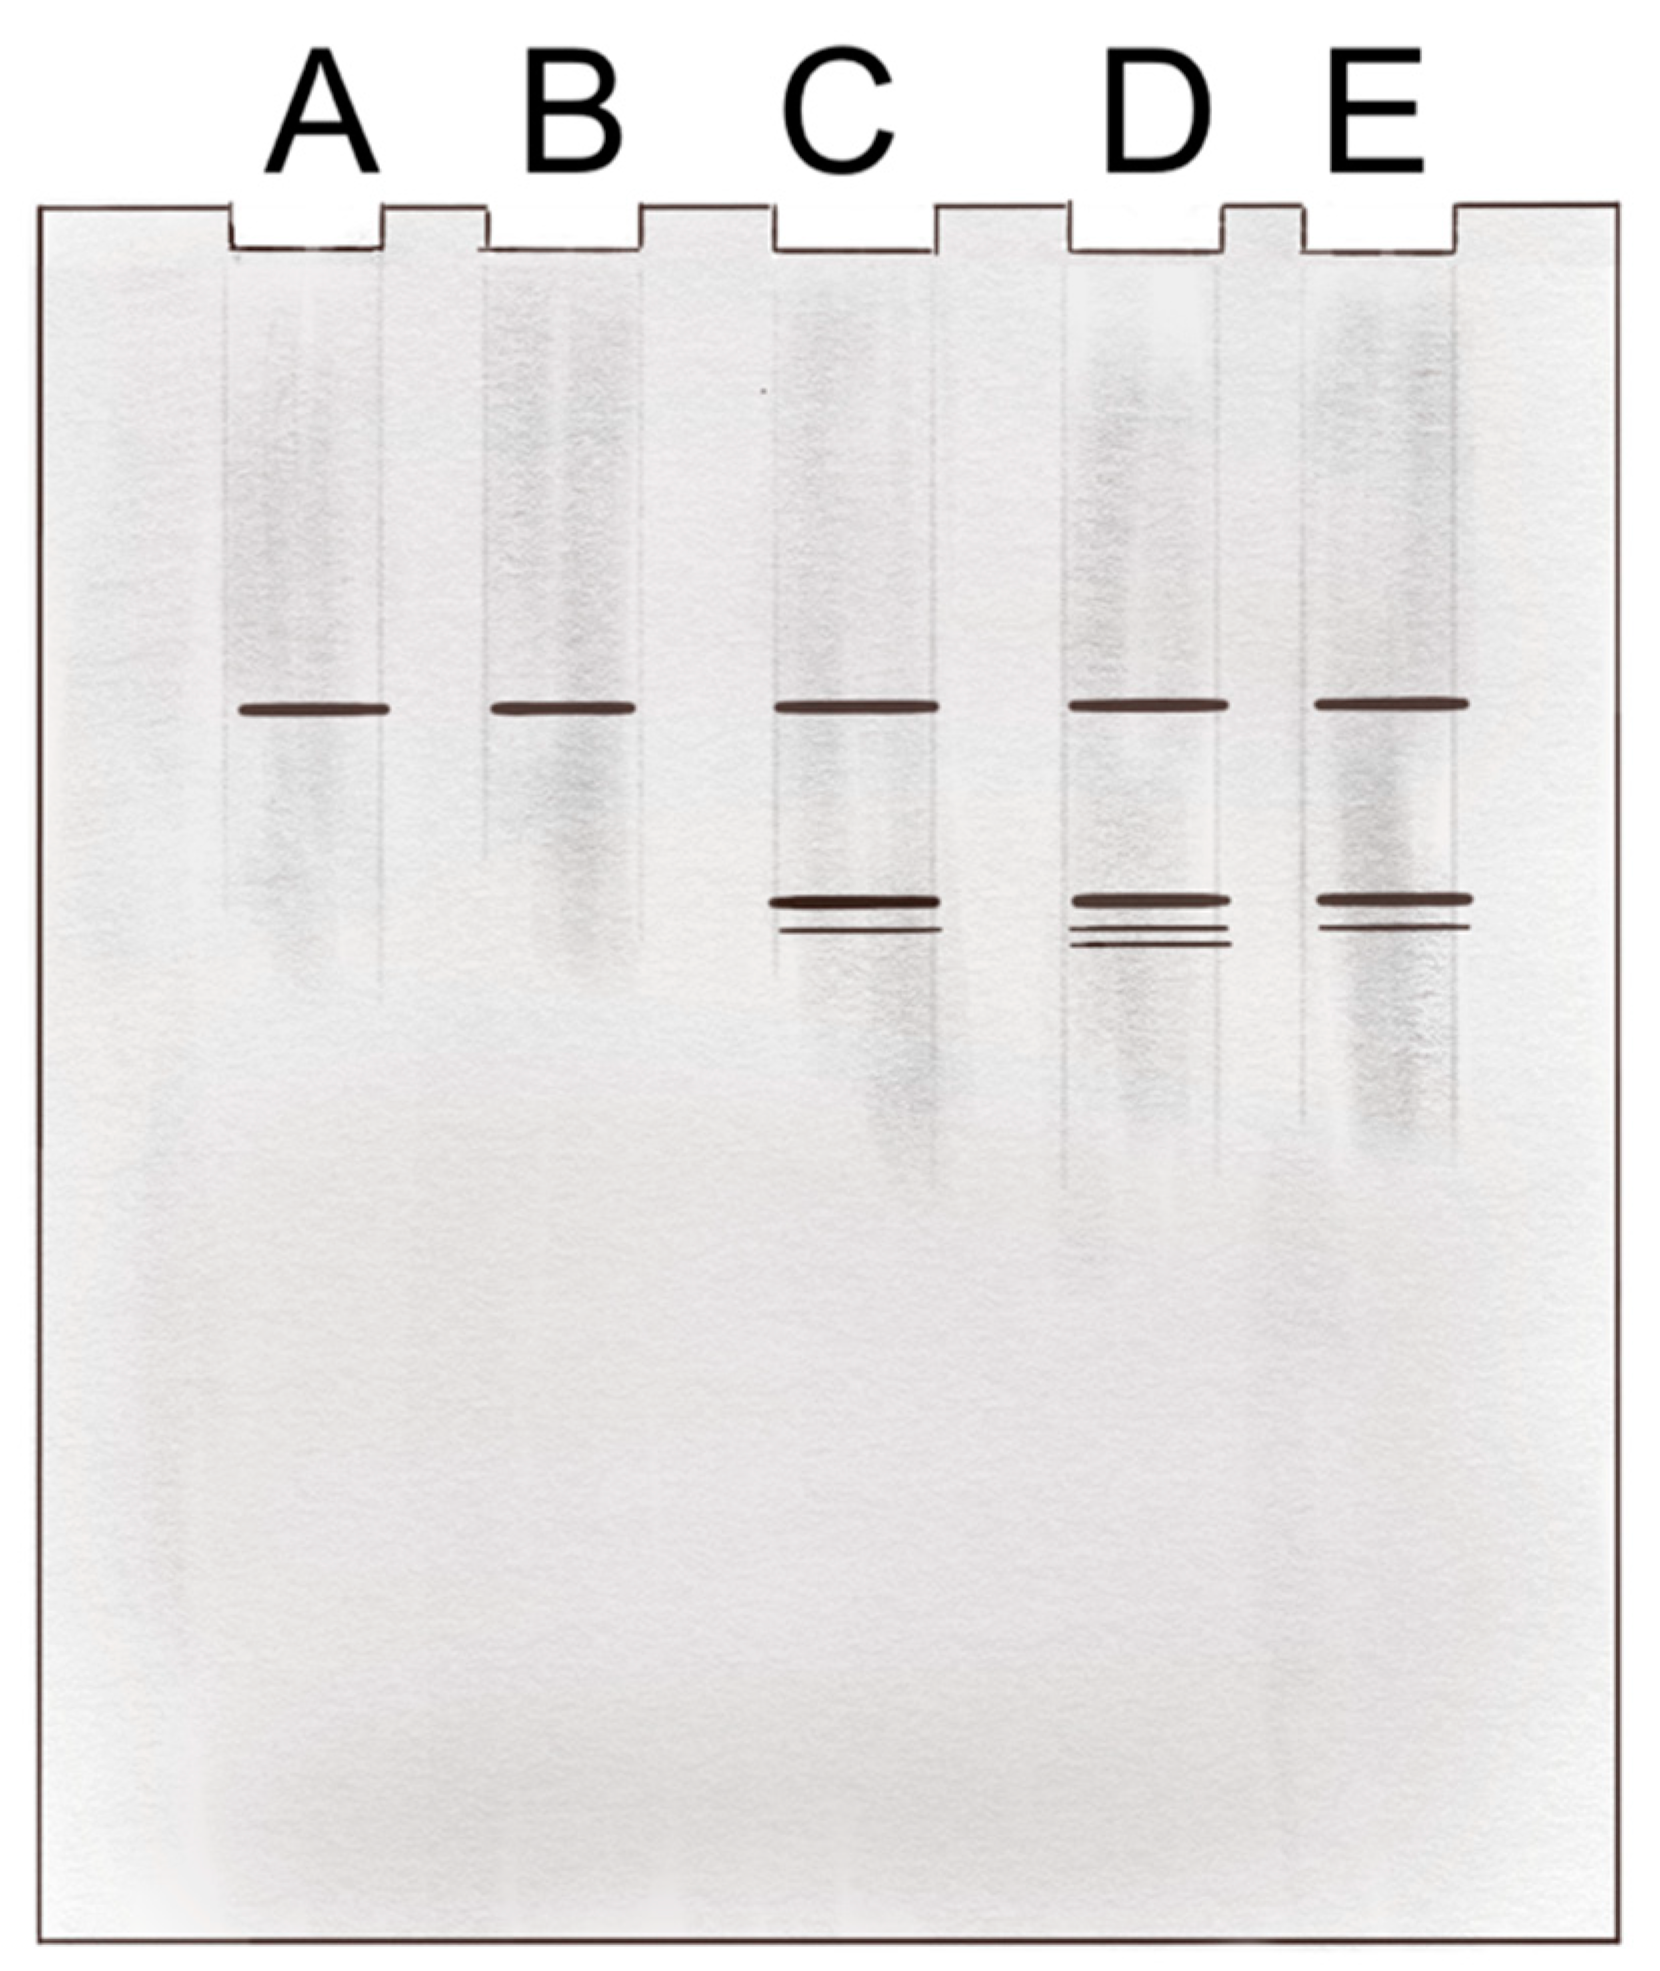
4.1.1. Denaturing Gradient Gel Electrophoresis (DGGE)

Denaturing gradient gel electrophoresis (DGGE) is a genetic analysis based on a polymerase chain reaction (PCR), in which amplified DNA fragments are separated into a polyacrylamide gel with a denaturing gradient of different formamide proportions [57,58]. This technique was developed in the 1970s [59] and was credited with the potential to detect almost the 100% of the differences in a DNA sequence. In the 1990s, DGGE began to be used for the analysis of complex bacterial communities through the separation of amplifiers of the gene encoding 16S rRNA, considered to be an evolutionary chronometer in bacteria [57,60]. Previous stages and the DGGE analysis are illustrated in Figure 4. As a result of the DGGE, the gel capture is presented (Figure 5), which generally includes lanes containing the amplified 16S rDNA of the inoculated strain (Figure 5, lane A), sample from the bioreactor (Figure 5, lane B), and samples of support material with biofilms from different sections of the BTF (Figure 5 lanes C, D, and E). Through the analysis of the band pattern in different cases of anoxic biofiltration for H2S removal as described above, the influence of various operational parameters on changes in the packing material, the EBRT, the Q, and the NO3 concentration, among others, associating them with the RE to explain the BTF behaviours that, frequently, are not supported by the analysis of the traditional efficiency indicators mentioned in point 3 [32,42,44].

4.1.2. DGGE Protocol

The protocol to conduct a BTF bacterial community analysis through DGGE, prior to the PCR of the gel, has been widely described and is illustrated in Figure 4 [43,61].

4.1.3. DGGE Interpretation

DGGE interpretation is done in two non-exclusive manners: (1) comparison of the bacterial biodiversity of the BTF at different stages; (2) DNA sequencing of the fragments obtained in the DGGE.
In the first case, the DGGE is considered as a BTF snapshot at a determined stage. Performing the DGGE under different operational conditions allows the comparison of the band pattern obtained each time. The more bands obtained, the greater the diversity. Based on these DGGE profiles and as a diversity index, the range-weighted richness (Rr) is calculated for each lane, as described below:
Rr = N2 × D
where N is the number of bands contained in the sample (one DGGE lane) and D is the denaturing percentage range in which these bands are found. It is considered low richness (low diversity) when Rr < 10, mean when 10 < Rr < 30, and high when Rr > 30 [62]. This analysis is appropriate when the BTF has been inoculated with a known bacterial community or strain, so that each of the DGGE lanes and their Rr will indicate if the community or strain changes according to operational changes in the BTF. It is conventional to qualitatively report the similarity between the strain or community control band patterns (initial inoculum) and the samples taken at different stages of the BTF (e.g., temperature disturbances, pH disturbances, change of culture medium, nutrient concentration, among others).
In the second case, DGGE is used as a method for isolating amplified DNA, separating fragments with differences of one base pair. The bands are cutted, their DNA is resuspended and amplified again, and then they are sequenced. These sequences are used to perform a taxonomic search as described in chapter 16 of the NCBI Handbook [63] and in web BLAST page options [64]. Then, a detailed phylogenetic analysis is made for each BTF stage and thus, it is investigated if the inoculated taxonomic groups are maintained, if others have appeared, or if some have been eliminated [43]. This analysis is convenient when the BTF has been inoculated with a bacterial community or with residues in which the intention is to select, in the BTF, the most efficient microorganisms and taxonomically identify them. Frequently, a table identifying taxonomically the sequences corresponding to each band is reported [43].

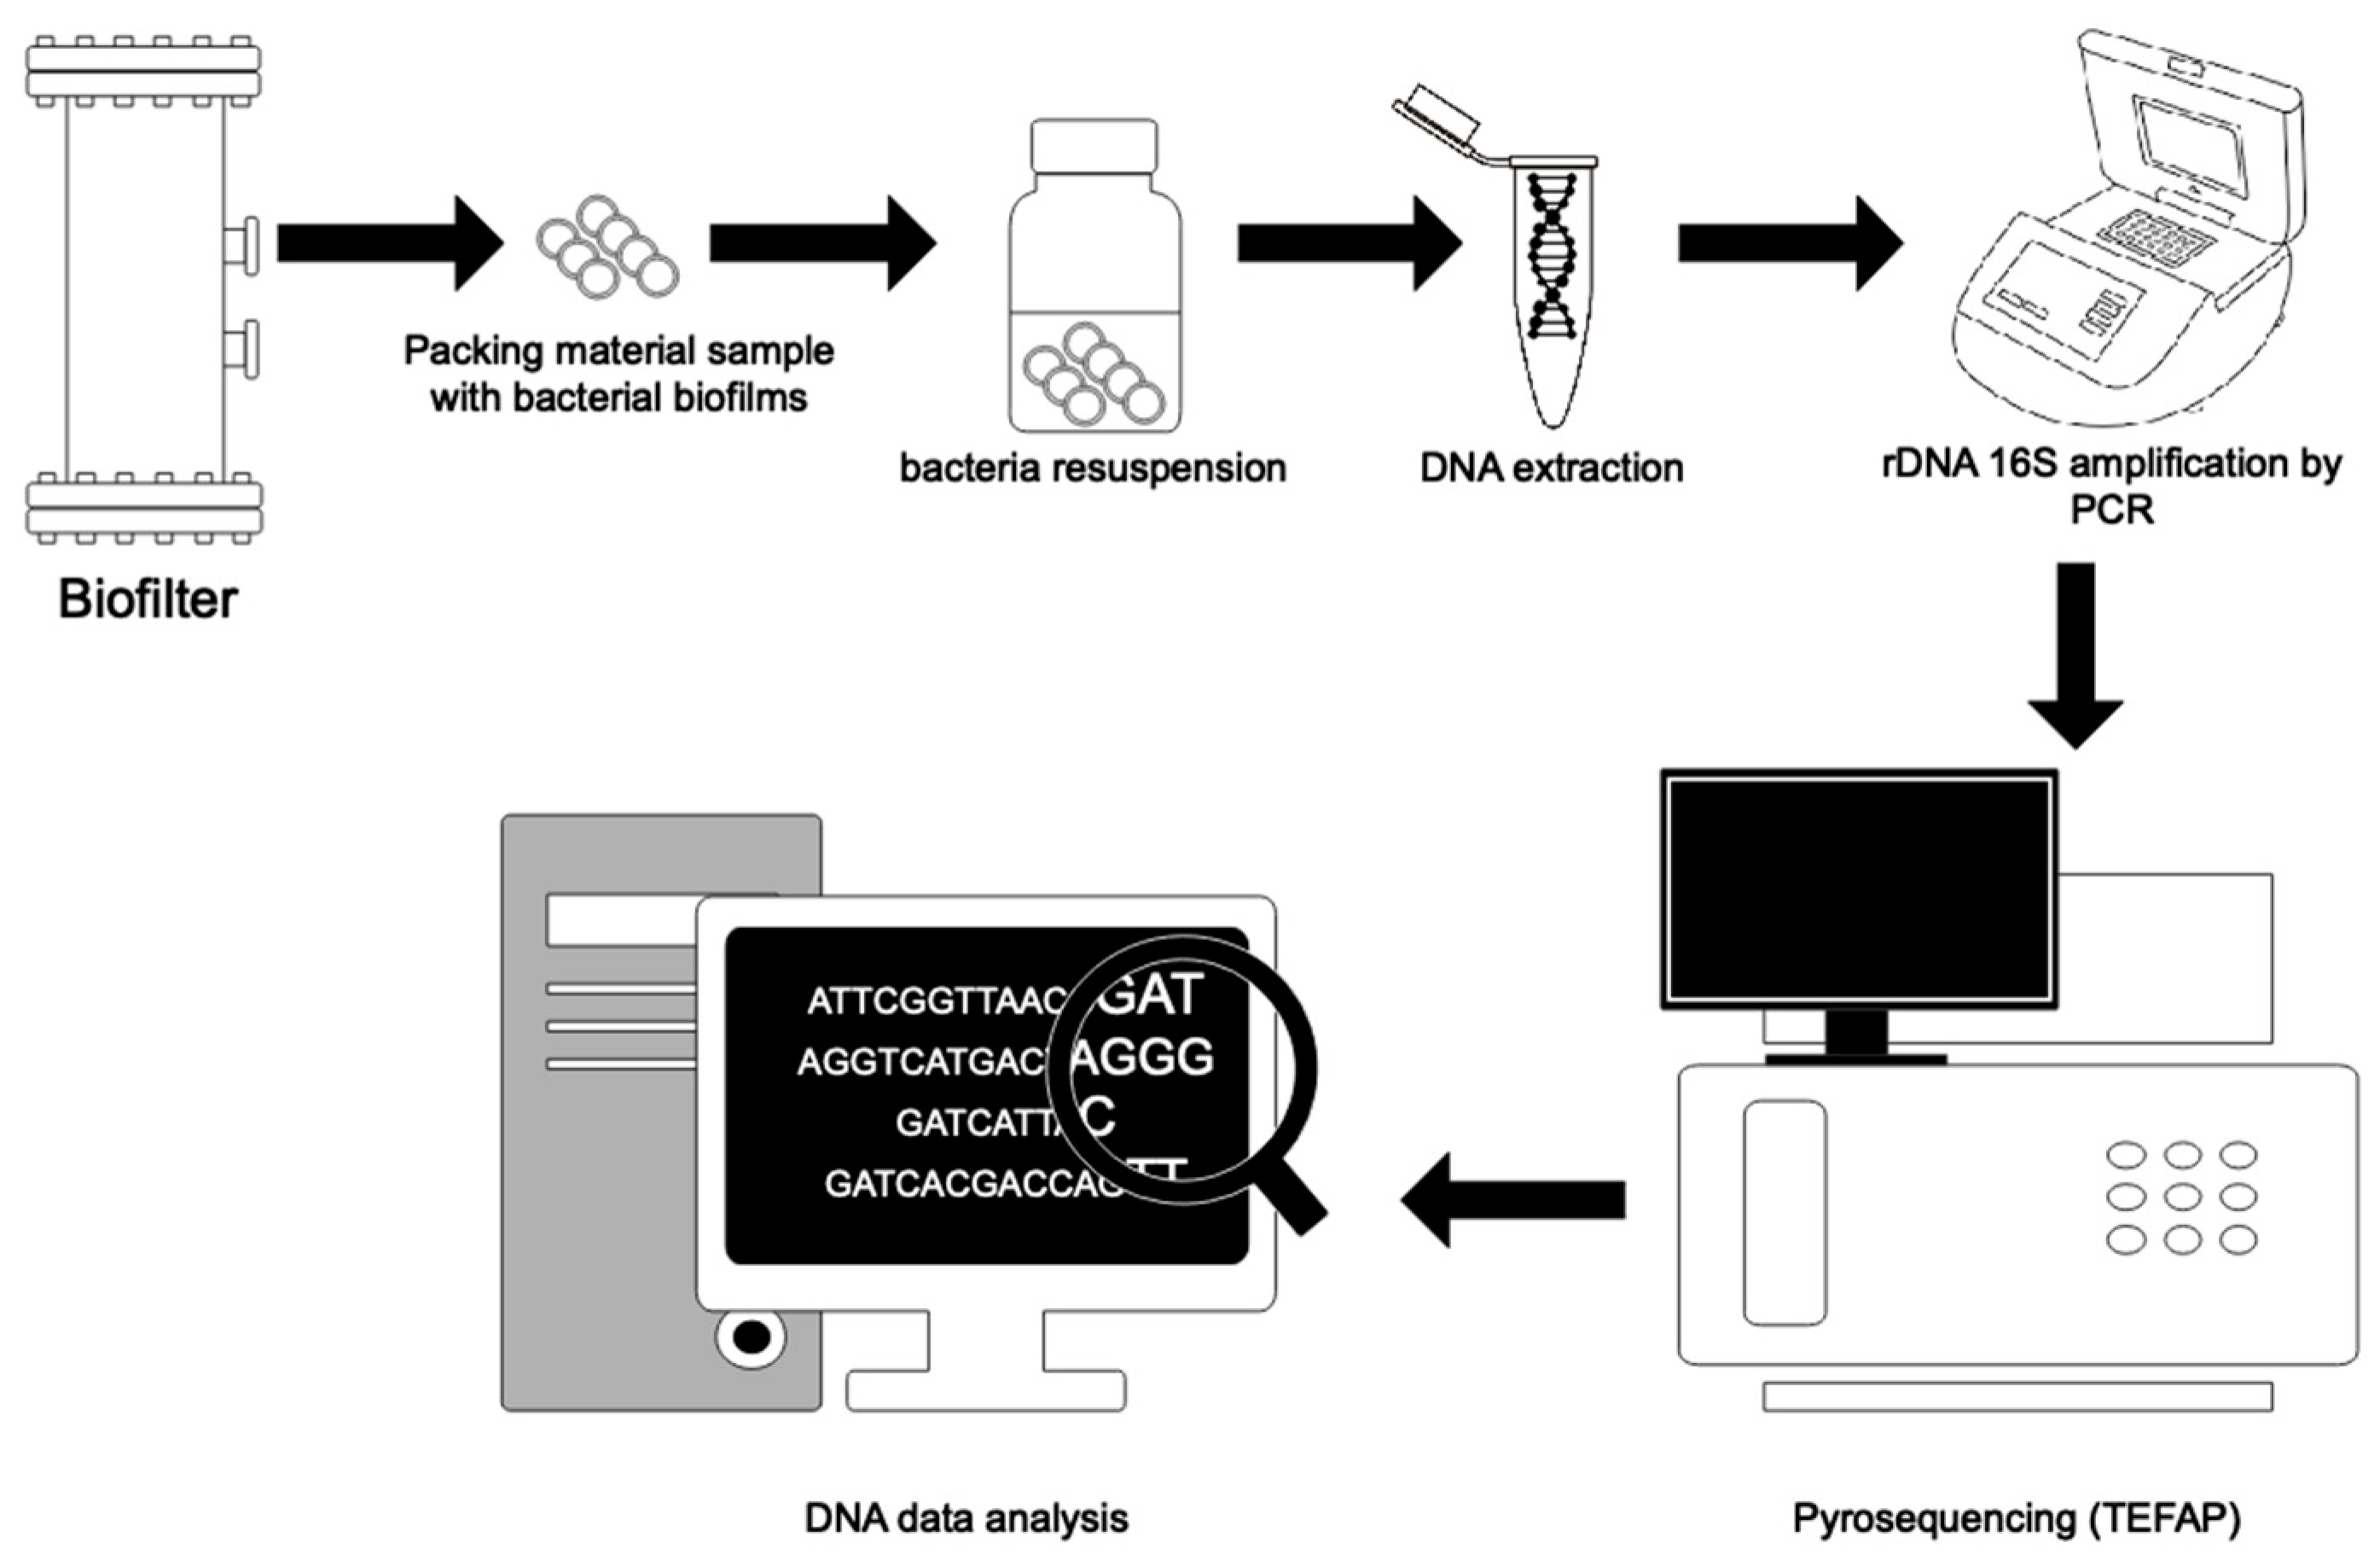
4.1.4. DNA Pyrosequencing

The microbial diversity dynamics are also investigated through DNA sequencing techniques of the entire BTF biomass sample, such as tag-encoded FLX-amplicon pyrosequencing (TEFAP) in a FLX 454 instrument (Roche, USA). This technique was the first of the so-called next-generation sequencing, implemented in 2005 [65]. This technique allows parallel sequencing of many different fragments at the same time and is ideal for obtaining DNA sequences of all the microorganisms in a biomass sample from a BTF, without the need for a previous separation in a gel or the requirement to isolate the strains [35].

4.1.5. TEFAP Protocol

The procedure for analyzing the BTF bacterial community through TEFAP is illustrated in Figure 6, as described in the literature [31].

4.1.6. TEFAP Interpretation

In this case the DNA data analysis consists of the taxonomic search of the sequences obtained in a database, as described for the second case of DGGE in point 4.1.3 and representing all the different 16S rDNA sequences found in the sample. Thus, this analysis is convenient when the BTF has been inoculated with an unknown bacterial community or with residues, which are to be taxonomically selected and identified. As mentioned in point 4.1.3, usually a table identifying taxonomically each sequence is reported. In other cases, a phylogenetic tree, often of the neighbour-joining type whose evolutionary distances are computed using the maximum composite likelihood method, has been used to report this data [58,66,67].

4.2. Determination of the Biomass Attached to the Support Material (Biofilms)

The methods for quantitative and qualitative biomass determination used in anoxic BTFs (found in the cited research, Table 2) for biogas desulphurisation are summarized in Table 4. Usually, a quantitative microscopic, plate culture, or genetic method that delivers a cell value, CFU, or gene copy number (DNA sequence) is selected, which is expressed per dry weight unit or per unit area of the packing material.

Other BTF Biofilm Quantification Methods Proposed

Other BTF biofilm quantification methods provide important data to explain behaviour differences between them, but they have not been used in anoxic BTFs for biogas desulphurisation, are described in Table 5.

5. Anoxic BTF Packing Materials for Biogas Desulphurisation

The selection of the appropriate packing material is vital for a BTF and has been the subject study of numerous research works, since it influences the contaminants degradation kinetics, affecting the EC of a BTF as per the nature of the material and its size [18,72]. There is a large number of packing materials described for obtaining biofilms used in BTF. The most common ones are organic materials such as peat, soil, and compost, followed by wood bark, sugarcane bagasse [73], and peanut shells [74]. However, these materials when compressed are easily clogged with bacterial biomass or an accumulation of elemental sulphur, causing pressure drops and eventually decreasing the performance of the BTF [18,27]. Inorganic materials such as glass spheres and perlite have been demonstrated to provide improved mechanical and hydrodynamic properties, producing constant biogas pressure in the BTF over time [18,75,76]. Although of an elevated cost, metal oxides such as porous ceramics, volcanic rocks [77], and perlite [50] are most commonly used. Combinations of organic and inorganic materials have also been studied, pursuing the addition of the nutritional properties of the organic materials and the mechanical properties of the inorganic compounds [76]. Polymeric materials such as polyethylene [39], polypropylene [23], plastic rings, and polyurethane foam [18] have also been used, offering advantages such as a high specific area and characteristics of hydrophobic afiinity with the attached microorganisms. Other materials, such as volcanic rock, have stood out for their porosity, facilitating the settlement of the SOB to be used [18].
The most important properties of a packing material are large surface area, high porosity, high chemical stability (one that will not be degraded by the treated chemicals or by-products), structural firmness (so as not to produce small pore sizes and thus prevent plugging), low cost, and high affinity with biofilm-forming bacteria [72].
Studies including the evaluation of different packing materials for the attachment of SOB biofilm for anoxic biogas desulphurisation are very scarce and are limited to four works described in Table 2 [25,27,33,40]. Among them, research by Ben Jaber et al. [40] and Tayar et al. [30] stand out. The first work investigated expanded schist and cellular concrete inoculated with activated sludge from a wastewater treatment plant, where it was found that expanded schist was the best support material through the comparison of the EC produced by each of them (30.3 g m−3 h−1 for expanded schist and 25.2 g m−3 h−1 for cellular concrete), though no microbiological studies, such as the measurement of the biomass by surface area of packing material or the evaluation of the microbial population composition, were carried out in this regard. In the second work, different cost-effective polymeric materials were tested: strips of PVC, polyethylene terephthalate (PET), polytetrafluoroethylene (Teflon), and OPUF. The findings of this work suggested that the best cost-effective polymeric material in anoxic BTF for biogas desulphurisation is PVC, based on the comparison of operational parameters such as temperature and H2S LR. As for microbiological study, the determination of microorganism biomass through the quantification of the total protein mass per dry packing material mass was included. The biomass immobilized in the PVC was ~1.7 times less than that in the OPUF (15 and ~25.4 mass of protein per mass of dry support (mg g−1)), but the ECcrit produced in the BTF packed with PVC (84.4 gS H2S m−3h−1) was six times higher than the BTF with OPUF (14 gS H2S m−3h−1). This experiment demonstrated that PVC is a better packing material because the performance produced is higher, the biomass accumulation is less which helps to prevent the BTF clogging, and it is cheaper (USD $0.21 for PVC and USD $0.67 for OPUF in BTFs with 3 L of working volume).
The lack of microbiological studies on the evaluation of BTF packing materials is important, since a material related to a prokaryotic microorganism taxonomic group will not necessarily be related to all the taxa and mixtures found in the BTF inoculum. Thus, as shown in Table 2, the inoculums used in investigations are diverse and, therefore, so are the microorganism taxonomic groups used. However, most of the BTF research groups are inclined to use polymeric materials, among which polyethylene or polypropylene rings (Pall rings and K1 Kaldness rings, among others) stand out. It has been inferred that this is due to the hydrophobic characteristics of such materials. However, thorough studies, including microbiological parameters such as microbial identity, and CFU or viable cells count per unit area in the packing material, are necessary. Thus, specific growth speed (µ) will be a factor to consider in calculating how efficient is a prokaryote with a given packing material (g H2S d−1 cell−1) [52].

6. Discussion

Traditional and microbiological markers are useful to compare the performance of BTFs (and biofilters) in terms of their removal of H2S from biogas, and the need to simultaneously report and relate them are described and discussed in this review [16,24]. In this regard, all publications on this topic from 2010 to 2020 describing traditional and microbiological markers for anoxic biogas desulphurisation BTFs were reviwed and it was found that there was no uniformity in the presentation of parameters: sometimes only traditional critical markers were reported, and in other cases only the maximum ones (EC, LR, RE, and EBRT), neglecting important analyses in several cases. Thus, it was found that 56% of the publications reviewed did not report any microbiological analysis related to SOB (Table 2: 2, 4, 5, 7, 8, 9, 10, 12, 13, and 15). On the other hand, it was found that 78% of the research presented in this review was undertaken at a laboratory scale, 17% at a pilot scale, and only one research at the field scale, demonstrating that the pilot and full scales still present a challenge, an opinion shared by other reviews [78]. This exposes fundamental shortcomings in this type of research and there are several reasons why it is difficult to compare performances between research works in order to guide the reader in terms of progress made in this field: (a) the research described in this review does not always report the critical and maximum values of the traditional markers (Table 2), which has been established as essential in recent specialized literature in the field of biofiltration [24]; (b) there is a lack of microbiological analysis to better understand which bacterial populations are more efficient in BTFs for biogas treatment, we agree with other researchers in this regard [18,79]; and (c) there is still much research to be published on the use of BTFs for desulphurisation on an industrial scale, an opinion shared between scientists in the field [79]. This is mainly due to the difficulties of achieving a robust and reliable operation of the BTFs [21]. For this reason, we propose a framework of minimum parameters to be considered to compare the performance of anoxic BTFs for biogas desulphurisation (Table 6) and thus evaluate research in this field in a complete and uniform way. These parameters can be applied to BTFs for any type of gas treatment.
On other hand, in silico experiments utilizing mathematical modelling have gained attention in recent years, simulating the behaviour of real bioreactors to enable the better understanding of their processes and allowing the selecting of appropriate operational parameters for real solutions [80]. In this regard, a recent work of López et al. (2021) evaluated the effect of different control strategies in an aerobic BTFs for biogas desulfurisation under different H2S LR conditions [21]. This research group found that the control of the trickling liquid velocity is one of the bests strategies for the regulation of the performance of the BTF at a H2S LR below 169 g m−3 h−1 when perturbations in the inlet H2S concentration occur, being applicable to the research described in Table 2, in which the LR used was under 130 g m−3 h−1 in the most of cases. Although this research is focused on aerobic BTFs, similar modelling results were described by Almenglo et al. in 2015 for anoxic BTFs, in which a higher feeding of NO3 in the trickling solution (1380 g over 920 g) allowed the outlet H2S to be kept between 1.46–1.47 g, in sight of H2S LR variations of 149.4 g m−3 h−1 over 94.1 g m−3 h−1 [81]. This type of mathematical model development, including the traditional performance parameters (Table 6), are a powerful tool to evaluate operational strategies, added to the microbiological markers suggested in the Table 6.

7. Conclusions

This review suggests that the performance of BTFs should be assessed through a set of traditional and microbiological parameters described in the Table 6, because BTFs are biological systems and not merely chemical systems subjected to scrutiny. We consider that, at least, studies undertaken at the laboratory scale will be more revealing in terms of knowledge generation and application, if they are carried out this way. Additionally, more pilot and industrial scale studies are necessary and will be very useful for the comparison of biofiltration devices, if the complete spectrum of performance and microbiological markers are tested.

Author Contributions

Conceptualization, E.V.-R. and F.H.; methodology, E.V.-R.; software, E.V.-R.; validation, R.D., F.M., D.G. and F.H.; formal analysis, E.V.-R. and R.D.; investigation, E.V.-R. and F.H.; resources, F.H.; data curation, E.V.-R. and F.H.; writing—original draft preparation, E.V.-R.; writing—review and editing, R.D.; visualization, R.D. and E.V.-R.; supervision, E.V.-R. and F.H.; project administration, E.V.-R.; funding acquisition, F.H. All authors have read and agreed to the published version of the manuscript.

Funding

This review was funded by Procycla SpA/SL and Aroma Global Spa (Chile), a privately held organizations group.

Institutional Review Board Statement

Not applicable.

Informed Consent Statement

Not applicable.

Data Availability Statement

Data sharing is not applicable to this article.

Acknowledgments

The authors would like to thank Fundo El Junco, Melipilla, Chile, for their contribution in this review.

Conflicts of Interest

The authors declare no conflict of interest.

References

  1. Koonaphapdeelert, S.; Aggarangsi, P.; Moran, J. (Eds.) Biomethane. Green Energy and Technology; Springer: Singapore, 2020; pp. 1–179. [Google Scholar] [CrossRef]
  2. Langeveld, J.; Peterson, E. Feedstocks for Biogas Production: Biogas and Electricity Generation Potentials. In Biogas Fundamentals; Process; and Operation; Tabatabaei, M., Ghanavati, H., Eds.; Springer: Cham, Switzerland, 2018; pp. 35–49. [Google Scholar]
  3. Khoshnevisan, B.; Tsapekos, P.; Alfaro, N.; Díaz, I.; Fernández-Polanco, M.; Rafiee, S.; Angelidaki, I. A review on prospects and challenges of biological H2S removal from biogas with focus on biotrickling filtration and microaerobic desulfurization. Biofuel Res. J. 2017, 16, 741–750. [Google Scholar] [CrossRef] [Green Version]
  4. Guidotti, T. Hydrogen sulfide intoxication. Handb. Clin. Neurol. 2015, 131, 111–133. [Google Scholar] [CrossRef]
  5. Fabian-Wheeler, E.; Hile, M.; Murphy, D.; Hill, D.; Meinen, R.; Brandt, R.; Elliott, H.; Hofstetter, D. Operator Exposure to Hydrogen Sulfide from Dairy Manure Storages Containing Gypsum Bedding. J. Agric. Saf. Health 2017, 23, 9–22. [Google Scholar] [CrossRef] [PubMed]
  6. Merico, E.; Grasso, F.; Cesari, D.; Decesari, S.; Belosi, F.; Manarini, F.; De Nuntiis, P.; Rinaldi, M.; Gambaro, A.; Morabito, E.; et al. Characterisation of atmospheric pollution near an industrial site with a biogas production and combustion plant in southern Italy. Sci. Total Environ. 2020, 717, 137220. [Google Scholar] [CrossRef] [PubMed]
  7. Awe, O.; Zhao, Y.; Nzihou, A.; Pham Minh, D.; Lyczko, N. A Review of Biogas Utilisation; Purification and Upgrading Technologies. Waste Biomass Valorization 2017, 8, 267–283. [Google Scholar] [CrossRef] [Green Version]
  8. Gabriel, D.; Colón, J.; Ramírez, M. Life cycle assessment of biofiltration. In From Biofiltration to Promising Options in Gaseous Fluxes Biotreatment. Recent Developments; New Trends; Advances; and Opportunities; Soreanu, G., Dumont, E., Eds.; Elsevier: Cambridge, MA, USA, 2020; pp. 89–108. [Google Scholar] [CrossRef]
  9. Torres, R.; Maríun, D.; Rodero, M.; Pascual, C.; González-Sánchez, A.; de Godos Crespo, I.; Lebrero, R.; Muñoz Torre, R. Biogas treatment for H2S, CO2, and other contaminants removal. Life cycle assessment of biofiltration. In From Biofiltration to Promising Options in Gaseous Fluxes Biotreatment. Recent Developments; New Trends; Advances; and Opportunities; Soreanu, G., Dumont, E., Eds.; Elsevier: Cambridge, MA, USA, 2020; pp. 89–108. [Google Scholar] [CrossRef]
  10. Rodríguez, G.; Dorado, A.; Fortuny, M.; Gabriel, D.; Gamisans, X. Biotrickling filters for biogas sweetening: Oxygen transfer improvement for a reliable operation. Process. Saf. Environ. Prot. 2014, 92, 261–268. [Google Scholar] [CrossRef] [Green Version]
  11. Papurello, D.; Lanzini, A. SOFC single cells fed by biogas: Experimental tests with trace contaminants. Waste Manag. 2018, 72, 306–312. [Google Scholar] [CrossRef]
  12. Saadabadi, S.; Thattai, A.; Fan, L.; Lindeboom, R.; Spanjers, H.; Aravind, P. Solid Oxide Fuel Cells fuelled with biogas: Potential and constraints. Renew. Energy 2019, 134, 194–214. [Google Scholar] [CrossRef]
  13. Muñoz, R.; Meier, L.; Diaz, I.; Jeison, D. A review on the state of the art of physical/chemical and biological technologies for biogas upgrading. Rev. Environ. Sci. Biotechnol. 2015, 14, 727–759. [Google Scholar] [CrossRef] [Green Version]
  14. Toledo-Cervantes, A.; Estrada, J.; Lebrero, R.; Muñoz, R. A comparative analysis of biogas upgrading technologies: Photosynthetic vs physical/chemical processes. Algal Res. 2017, 25, 237–243. [Google Scholar] [CrossRef]
  15. Shareefdeen, Z. High-performance biofilters for air treatment applications. In From Biofiltration to Promising Options in Gaseous Fluxes Biotreatment. Recent Developments; New Trends; Advances; and Opportunities; Soreanu, G., Dumont, E., Eds.; Elsevier: Cambridge, MA, USA, 2020; pp. 111–127. [Google Scholar] [CrossRef]
  16. Barbusiński, K.; Urbaniec, K.; Kasperczyk, D.; Thomas, M. Biofilters versus bioscrubbers and biotrickling filters: State-of-the-art biological air treatment. In From Biofiltration to Promising Options in Gaseous Fluxes Biotreatment. Recent Developments; New Trends; Advances; and Opportunities; Soreanu, G., Dumont, E., Eds.; Elsevier: Cambridge, MA, USA, 2020; pp. 29–51. [Google Scholar]
  17. Leson, G.; Winer, A. Biofiltration: An innovative air pollution control technology for VOC emissions. J. Air Waste Manag. Assoc. 1991, 41, 1045–1054. [Google Scholar] [CrossRef] [PubMed]
  18. Le Borgne, S.; Baquerizo, G. Microbial Ecology of Biofiltration Units Used for the Desulfurization of Biogas. Chem. Eng. 2019, 3, 72. [Google Scholar] [CrossRef] [Green Version]
  19. Gabaldón, C.; San-Valero, P.; Quijano, G. Current challenges and perspectives in gas fluxes biotreatment. In From Biofiltration to Promising Options in Gaseous Fluxes Biotreatment. Recent Developments; New Trends; Advances; and Opportunities; Soreanu, G., Dumont, E., Eds.; Elsevier: Cambridge, MA, USA, 2020; pp. 53–69. [Google Scholar]
  20. Raboni, M.; Torretta, V. A modified biotrickling filter for nitrification-denitrification in the treatment of an ammonia-contaminated air stream. Environ. Sci. Pollut. Res. Int. 2016, 23, 24256–24264. [Google Scholar] [CrossRef] [PubMed]
  21. López, L.; Mora, M.; Van der Heyden, C.; Baeza, J.A.; Volcke, E.; Gabriel, D. Model-Based Analysis of Feedback Control Strategies in Aerobic Biotrickling Filters for Biogas Desulfurization. Processes 2021, 9, 208. [Google Scholar] [CrossRef]
  22. Wu, Y.; Ren, H.; Ding, L. Performance of an innovative polyethylene carrier biotrickling filter treating hydrogen sulphide gas. Huan Jing Ke Xue 2010, 31, 1451–1456. [Google Scholar] [PubMed]
  23. Brito, J.; Valle, A.; Almenglo, F.; Ramírez, M.; Cantero, D. Progressive change from nitrate to nitrite as the electron acceptor for the oxidation of H2S under feedback control in an anoxic biotrickling filter. Biochem. Eng. J. 2018, 139, 154–161. [Google Scholar] [CrossRef]
  24. Dumont, E. Determination of biofilter performances. In From Biofiltration to Promising Options in Gaseous Fluxes Biotreatment. Recent Developments; New Trends; Advances; and Opportunities; Soreanu, G., Dumont, E., Eds.; Elsevier: Cambridge, MA, USA, 2020; pp. 53–69. [Google Scholar]
  25. Valle, A.; Fernández, M.; Ramírez, M.; Rovira, R.; Gabriel, D.; Cantero, D. A comparative study of eubacterial communities by PCR-DGGE fingerprints in anoxic and aerobic biotrickling filters used for biogas desulfurization. Bioprocess. Biosyst. Eng. 2018, 41, 1165–1175. [Google Scholar] [CrossRef]
  26. Almenglo, F.; Ramírez, M.; Gómez, J.; Cantero, D. Operational conditions for start-up and nitrate-feeding in an anoxic biotrickling filtration process at pilot scale. Chem. Eng. J. 2016, 285, 83–91. [Google Scholar] [CrossRef]
  27. Ben Jaber, M.; Couvert, A.; Amrane, A.; Rouxel, F.; Le Cloirec, P.; Dumont, E. Biofiltration of high concentration of H2S in waste air under extreme acidic conditions. New Biotechnol. 2017, 33, 136–143. [Google Scholar] [CrossRef] [PubMed]
  28. Cruz-García, B.; Geronimo-Meza, A.; Martínez-Lievana, C.; Arriaga, S.; Huante-González, Y.; Aizpuru, A. Biofiltration of high concentrations of methanol vapors: Removal performance; carbon balance and microbial and fly populations. J. Chem. Technol. Biotechnol. 2019, 94, 1925–1936. [Google Scholar] [CrossRef]
  29. Fernández, M.; Ramírez, M.; Pérez, R.; Gómez, J.; Cantero, D. Biofiltration of H2S in biogas with Thiobacillus denitrificans under anoxic conditions. EcoSTP. EcoTechnologies for Wastewater Treatment. In Proceedings of the IWA International Conference, Santiago de Compostela, Spain, 27–28 June 2012; p. 53. [Google Scholar]
  30. Tayar, S.; Guerrero, R.; Hidalgo, L.; Bevilaqua, D. Evaluation of Biogas Biodesulfurization Using Different Packing Materials. ChemEngineering 2019, 3, 27. [Google Scholar] [CrossRef] [Green Version]
  31. Montebello, A.; Fernández, M.; Almenglo, F.; Ramírez, M.; Cantero, D.; Baeza, M.; Gabriel, D. Simultaneous methylmercaptan and hydrogen sulfide removal in the desulfurization of biogas in aerobic and anoxic biotrickling filters. Chem. Eng. J. 2012, 200, 237–246. [Google Scholar] [CrossRef]
  32. Fernández, M.; Ramírez, M.; Pérez, R.; Gómez, J.; Cantero, D. Hydrogen sulphide removal from biogas by an anoxic biotrickling filter packed with Pall rings. Chem. Eng. J. 2013, 225, 456–463. [Google Scholar] [CrossRef]
  33. Romero, A.; Rodríguez, M.; Andrès, Y.; Dumont, E. Steady- and transient-state H2S biofiltration using expanded schist as packing material. New Biotechnol. 2013, 30, 210–218. [Google Scholar] [CrossRef] [PubMed]
  34. Fernández, M.; Ramírez, M.; Gómez, J.; Cantero, D. Biogas biodesulfurization in an anoxic biotrickling filter packed with open-pore polyurethane foam. J. Hazard. Mater. 2014, 264, 529–535. [Google Scholar] [CrossRef]
  35. Almenglo, F.; Bezerra, T.; Lafuente, J.; Gabriel, D.; Ramirez, M.; Cantero, D. Effect of gas-liquid flow pattern and microbial diversity analysis of a pilot-scale biotrickling filter for anoxic biogas desulfurization. Chemosphere 2016, 157, 215–223. [Google Scholar] [CrossRef] [PubMed]
  36. Lebrero, R.; Toledo-Cervantes, A.; Muñoz, R.; del Nery, V.; Foresti, E. Biogas upgrading from vinasse digesters: A comparison between an anoxic biotrickling filter and an algal-bacterial photobioreactor. J. Chem. Technol. Biotechnol. 2016, 91, 2488–2495. [Google Scholar] [CrossRef] [Green Version]
  37. Li, X.; Jiang, X.; Zhou, Q. Effect of S/N Ratio on the Removal of Hydrogen Sulfide from Biogas in Anoxic Bioreactors. Appl. Biochem. Biotechnol. 2016, 180, 930–944. [Google Scholar] [CrossRef]
  38. Pirolli, M.; da Silva, M.; Mezzari, M.; Michelon, W.; Prandini, J.; Moreira-Soares, H. Methane production from a field-scale biofilter designed for desulfurization of biogas stream. J. Environ. Manag. 2016, 177, 161–168. [Google Scholar] [CrossRef] [PubMed]
  39. Ziemiński, K.; Kopycki, W. Impact of Different Packing Materials on Hydrogen Sulfide Biooxidation in Biofilters Installed in the Industrial Environment. Energy Fuel 2016, 30, 9386–9395. [Google Scholar] [CrossRef]
  40. Ben Jaber, M.; Couvert, A.; Amrane, A.; Le Cloirec, P.; Dumont, E. Hydrogen sulfide removal from a biogas mimic by biofiltration under anoxic conditions. J. Environ. Chem. Eng. 2017, 5, 5617–5623. [Google Scholar] [CrossRef]
  41. Brito, J.; Almenglo, F.; Ramírez, M.; Gómez, J.; Cantero, D. PID control system for biogas desulfurization under anoxic conditions. J. Chem. Technol. Biotechnol. 2017, 92, 2369–2375. [Google Scholar] [CrossRef]
  42. López, L.; Brito, J.; Mora, M.; Almenglo, F.; Baeza, J.; Ramírez, M.; Lafuente, J.; Cantero, D.; Gabriel, D. Feedforward control application in aerobic and anoxic biotrickling filters for H2S removal from biogas. J. Chem. Technol. Biotechnol. 2018, 93, 2307–2315. [Google Scholar] [CrossRef]
  43. Khanongnuch, R.; Di Capua, F.; Lakaniemi, A.; Rene, E.; Lens, P. H2S removal and microbial community composition in an anoxic biotrickling filter under autotrophic and mixotrophic conditions. J. Hazard. Mater. 2019, 367, 397–406. [Google Scholar] [CrossRef]
  44. Flemming, H.; Wingender, J.; Szewzyk, U.; Steinberg, P.; Rice, S.; Kjelleberg, S. Biofilms: An emergent form of bacterial life. Nat. Rev. Microbiol. 2016, 14, 563–575. [Google Scholar] [CrossRef] [PubMed]
  45. Yin, W.; Wang, Y.; Liu, L.; He, J. Biofilms: The Microbial “Protective Clothing” in Extreme Environments. Int. J. Mol. Sci. 2019, 20, 3423. [Google Scholar] [CrossRef] [Green Version]
  46. Karygianni, L.; Ren, Z.; Koo, H.; Thurnheer, T. Biofilm Matrixome: Extracellular Components in Structured Microbial Communities. Trends Microbiol. 2020, 28, 668–681. [Google Scholar] [CrossRef] [PubMed]
  47. Omri, I.; Bouallagui, H.; Aouidi, F.; Godon, J.; Hamdi, M. H2S gas biological removal efficiency and bacterial community diversity in biofilter treating wastewater odor. Bioresour. Technol. 2011, 102, 10202–10209. [Google Scholar] [CrossRef]
  48. Ramírez, M.; Fernández, M.; Granada, C.; Le Borgne, S.; Gómez, J.; Cantero, D. Biofiltration of reduced sulphur compounds and community analysis of sulphur-oxidizing bacteria. Bioresour. Technol. 2011, 102, 4047–4053. [Google Scholar] [CrossRef] [PubMed] [Green Version]
  49. López, L.; Bezerra, T.; Mora, M.; Lafuente, J.; Gabriel, D. Influence of trickling liquid velocity and flow pattern in the improvement of oxygen transport in aerobic biotrickling filters for biogas desulfurization. J. Chem. Technol. Biotechnol. 2016, 91, 1031–1039. [Google Scholar] [CrossRef]
  50. Pu, S.; Liu, Z.; Yang, F.; Long, D.; Liu, W.; Wang, H.; Huang, K.; Huang, X. Comparative study on the removal efficiency of hydrogen sulfide (H2S) using three different packings. J. Air Waste Manag. Assoc. 2018, 68, 900–908. [Google Scholar] [CrossRef] [PubMed] [Green Version]
  51. Maier, R. Biogeochemical cycling. In Environmental Microbiology, 3rd ed.; Pepper, I., Gerba, C., Gentry, T., Eds.; Elsevier: San Diego, CA, USA, 2015; pp. 339–373. [Google Scholar]
  52. Valdebenito-Rolack, E.; Ruiz-Tagle, N.; Abarzúa, L.; Aroca, G.; Urrutia, H. Characterization of a hyperthermophilic sulphur-oxidizing biofilm produced by archaea isolated from a hot spring. Electron. J. Biotechnol. 2017, 25, 58–63. [Google Scholar] [CrossRef]
  53. Valdebenito-Rolack, E.; Araya, T.; Abarzua, L.; Ruiz-Tagle, N.; Sossa, K.; Aroca, G.; Urrutia, H. Thiosulphate oxidation by Thiobacillus thioparus and Halothiobacillus neapolitanus strains isolated from the petrochemical industry. Electron. J. Biotechnol. 2011, 14, 1–9. [Google Scholar] [CrossRef] [Green Version]
  54. Almenglo, F.; Ramírez, M.; Cantero, D. Application of Response Surface Methodology for H2S Removal from Biogas by a Pilot Anoxic Biotrickling Filter. ChemEngineering 2019, 3, 66. [Google Scholar] [CrossRef] [Green Version]
  55. Rodero, M.; Ángeles, R.; Marín, D.; Díaz, I.; Colzi, A.; Posadas, E.; Lebrero, R.; Muñoz, R. Biogas Purification and Upgrading Technologies. In Biogas Fundamentals; Process; and Operation; Tabatabaei, M., Ghanavati, H., Eds.; Springer: Cham, Switzerland, 2018; pp. 239–276. [Google Scholar]
  56. Vikrant, K.; Kailasa, S.; Tsang, D.; Lee, S.; Kumar, P.; Giri, B.; Singh, R.; Kim, K. Biofiltration of hydrogen sulfide: Trends and challenges. J. Clean. Prod. 2018, 187, 131–147. [Google Scholar] [CrossRef]
  57. Muyzer, G.; de Waal, E.; Uittierlinden, A. Profiling of complex microbial populations by denaturing gradient gel electrophoresis analysis of polymerase chain reaction-amplified genes coding for 16S rRNA. Appl. Environ. Microbiol. 1993, 59, 695–700. [Google Scholar] [CrossRef] [Green Version]
  58. Ralebitso-Senior, T.; Senior, E.; Di Felice, R.; Jarvis, K. Waste gas biofiltration: Advances and limitations of current approaches in microbiology. Environ. Sci. Technol. 2012, 46, 8542–8573. [Google Scholar] [CrossRef]
  59. Spohr, G.; Mirault, M.; Imaizumi, T.; Scherrer, K. Molecular-weight determination of animal-cell RNA by electrophoresis in formamide under fully denaturing conditions on exponential polyacrylamide gels. Eur. J. Biochem. 1976, 62, 313–322. [Google Scholar] [CrossRef] [PubMed]
  60. Muyzer, G.; Teske, A.; Wirsen, C.; Jannasch, H. Phylogenetic relationships of Thiomicrospira species and their identification in deep-sea hydrothermal vent samples by denaturing gradient gel electrophoresis of 16S rDNA fragments. Arch. Microbiol. 1995, 164, 164–172. [Google Scholar] [CrossRef]
  61. Khanongnuch, R.; Di Capua, F.; Lakaniemi, A.; Rene, E.; Lens, P. Effect of N/S ratio on anoxic thiosulfate oxidation in a fluidized bed reactor: Experimental and artificial neural network model analysis. Process. Biochem. 2018, 68, 171–181. [Google Scholar] [CrossRef]
  62. Zhang, J.; Ma, G.; Deng, Y.; Dong, J.; Van Stappen, G.; Sui, L. Bacterial Diversity in Bohai Bay Solar Saltworks; China. Curr. Microbiol. 2016, 72, 55–63. [Google Scholar] [CrossRef]
  63. Beck, J.; Benson, D.; Coleman, J.; Hoeppner, M.; Johnson, M.; Maglott, D.; Mizrachi, I.; Morris, R.; Ostell, J.; Pruitt, K.; et al. (Eds.) The NCBI Handbook, 2nd ed.; National Center for Biotechnology Information: Bethesda, MD, USA, 2019; pp. 1–434. Available online: https://www.ncbi.nlm.nih.gov/books/NBK143764/ (accessed on 16 March 2021).
  64. Altschul, S.; Madden, T.; Schaffer, A.; Zhang, J.; Zhang, Z.; Miller, W. Gapped Blast and PSI BLAST: A new generation of protein database search programs. Nucleic Acids Res. 1997, 25, 3389–3402. [Google Scholar] [CrossRef] [PubMed] [Green Version]
  65. Margulies, M.; Egholm, M.; Altman, W.; Attiya, S.; Bader, J.; Bemben, L.; Berka, J.; Braverman, M.; Chen, Y.; Chen, Z.; et al. Genome sequencing in microfabricated high-density picolitre reactors. Nature 2005, 437, 376–380. [Google Scholar] [CrossRef] [PubMed]
  66. Saitou, N.; Nei, M. The neighbor-joining method: A new method for reconstructing phylogenetic trees. Mol. Biol. Evol. 1987, 4, 406–425. [Google Scholar] [CrossRef] [PubMed]
  67. Tamura, K.; Nei, M.; Kumar, S. Prospects for inferring very large phylogenies by using the neighbor-joining method. Proc. Natl. Acad. Sci. USA 2004, 101, 11030–11035. [Google Scholar] [CrossRef] [Green Version]
  68. Elías, A.; Barona, A.; Gallastegi, G.; Rojo, N.; Gurtubay, L.; Ibarra-Berastegi, G. Preliminary acclimation strategies for successful startup in conventional biofilters. J. Air Waste Manag. Assoc. 2010, 60, 959–967. [Google Scholar] [CrossRef] [PubMed] [Green Version]
  69. Tu, X.; Guo, J.; Yang, Y.; Feng, R.; Sun, G.; Li, J. Biofilms formed within the acidic and the neutral biotrickling filters for treating H2S-containing waste gases. RSC Adv. 2017, 7, 25475–25482. [Google Scholar] [CrossRef] [Green Version]
  70. Herigstad, B.; Hamilton, M.; Heersink, J. How to optimize the drop plate method for enumerating bacteria. J. Microbiol. Methods 2001, 44, 121–129. [Google Scholar] [CrossRef]
  71. Baron, F.; Cochet, M.; Ablain, W.; Grosset, N.; Madec, M.; Gonnet, F.; Jan, S.; Gautier, M. Rapid and cost-effective method for micro-organism enumeration based on miniaturization of the conventional plate-counting technique. Le Lait 2006, 86, 251–257. [Google Scholar] [CrossRef] [Green Version]
  72. Vergara-Fernández, A.; Scott, F.; Moreno-Casas, P. Biofiltration of volatile organic compounds and polycyclic aromatic hydrocarbons. In From Biofiltration to Promising Options in Gaseous Fluxes Biotreatment. Recent Developments; New Trends; Advances; and Opportunities; Soreanu, G., Dumont, E., Eds.; Elsevier: Cambridge, MA, USA, 2020; pp. 53–69. [Google Scholar]
  73. Rahul; Mathur, A.K.; Bala, S.; Majumder, C. Modelling and computational fluid dynamic behaviour of a biofilter treating benzene. Bioresour. Technol. 2012, 125, 200–207. [Google Scholar] [CrossRef]
  74. Ramirez-Lopez, E.; Corona-Hernandez, J.; Avelar-Gonzalez, F.; Omil, F.; Thalasso, F. Biofiltration of methanol in an organic biofilter using peanut shells as medium. Bioresour. Technol. 2010, 101, 87–91. [Google Scholar] [CrossRef]
  75. Nikiema, J.; Heitz, M. The Use of Inorganic Packing Materials during Methane Biofiltration. Int. J. Chem. Eng. 2010, 2010. [Google Scholar] [CrossRef] [Green Version]
  76. Zhu, R.; Li, S.; Bao, X.; Dumont, É. Comparison of biological H2S removal characteristics between a composite packing material with and without functional microorganisms. Sci. Rep. 2017, 7, 42241. [Google Scholar] [CrossRef] [PubMed] [Green Version]
  77. Rattanapan, C.; Ounsaneha, W. Removal of Hydrogen Sulfide Gas using Biofiltration—A Review. Walailak J. Sci. Tech. 2012, 9, 9–18. [Google Scholar]
  78. Okoro, O.; Sun, Z. Desulphurisation of Biogas: A Systematic Qualitative and Economic-Based Quantitative Review of Alternative Strategies. ChemEngineering 2019, 3, 76. [Google Scholar] [CrossRef] [Green Version]
  79. Ramírez, M. Special Issue “Advances in Biogas Desulfurization”. ChemEngineering 2020, 4, 17. [Google Scholar] [CrossRef] [Green Version]
  80. López, L.; Dorado, A.; Mora, M.; Gamisans, X.; Lafuente, J.; Gabriel, D. Modeling an aerobic biotrickling filter for biogas desulfurization through a multi-step oxidation mechanism. ChemEngineering 2016, 294, 447–457. [Google Scholar] [CrossRef] [Green Version]
  81. Almenglo, F.; Ramírez, M.; Gómez, J.; Cantero, D.; Gamisans, X.; Dorado, A. Modeling and control strategies for anoxic biotrickling filtration in biogas purification. J. Chem. Technol. Biotechnol. 2016, 91, 1782–1793. [Google Scholar] [CrossRef]
Figure 1. Basic set up of a biotrickling filter (BTF), accompanied by the bioreactor supplying bacterial culture or nutrient solution. Red arrow: H2S contaminated biogas inlet; green arrow: BTF desulfurized biogas outlet. (A) Bioreactor or nutrient liquid container, (B) working volume, filled with packing material containing microbial biofilms and (C) port to take samples of packing material for microbiological analysis.
Processes 09 00567 g001
Figure 2. Typical elimination capacity (EC) versus loading rate (LR) and removal efficiency (RE) versus LR graphs. (a) Theoretical EC curve, (b) experimental EC curve, (c) critical LR, (d) critical EC, (e) theoretical RE curve, and (f) experimental RE curve, (g) maximum EC, (h) maximum LR and (i) RE for the maximum EC.
Processes 09 00567 g002
Figure 3. Typical RE versus EBRT and LR versus EBRT graphs. (a) RE and (b) experimental LR.
Processes 09 00567 g003
Figure 4. Steps to be followed in the DGGE protocol.
Processes 09 00567 g004
Figure 5. Typical denaturing gradient gel in microbiota analysis in a BTF. Lanes: (A) pure inoculated strain, (B) bioreactor sample, (C) basal section of the BTF sample, (D) middle section of the BTF sample, and (E) upper section of the BTF sample.
Processes 09 00567 g005
Figure 6. Tag-encoded FLX-amplicon pyrosequencing (TEFAP) procedure.
Processes 09 00567 g006
Table 1. H2S concentrations and subsequent effects on human health [4].
H2S Concentration (ppmv)Effect on Human Health
0.01–0.3Olfactory threshold. Rotten egg smell.
20Strong odour. Eye irritation may occur.
20–50Eye and lung irritation.
100Eye and lung irritation, olfactory paralysis, apparent disappearance of odour.
>150Severe eye and lung irritation. Sensation of olfactory loss.
>250Pulmonary edema and risk of death.
>500Highly dangerous, risk of death. Evacuation is mandatory.
>1000Loss of consciousness, apnoea, immediate collapse. Death.
Table 2. Research on anoxic biofiltration for biogas desulphurisation from 2010 to 2020.
BTF Scale(H2S) (ppmv)LRcrit (g m−3 h−1)ECcrit (g m−3 h−1)REcrit (%)EBRT for ECcrit (min)ECmax (g m−3 h−1)REmax (%)EBRT for ECmax (min)pHT (°C)[NO3] (g L−1)TLF/TLV at ECcrit (L min−1/ m h−1)Inoculum/Packing MaterialMicrobial AnalysisRef.
(1) Lab scale60–4000222299NDNDNDND7.3–7.5NDNDNDThiobacillus denitrificans DSM 12475/OPUFDGGE[29]
(2) Lab scale426–214460601002~1308027.4–7.5ND~0.1–0.20.004/7Sludge from a WWTP/OPUF cubesND[31]
(3) Lab scale1400–14,600120120993170~95177–428–305–102.2/15Community of microorganisms from WWTP sludge, selected in the BTF/PPRDGGE[32]
(4) Lab scale133–301~35~3510035428835ND14–22NDNDActivated sludge from a WWTP/shist and UP20ND[33]
(5) Lab scale850–8500130130992.4170852.47.3–7.5305ND/>4.6Consortium from a stirred tank reactor of an WWTP/OPUF cubesND[34]
(6) Pilot scale4100–7100565698214084106.8–7.5ND1.6–432.7/10Community of microorganisms from wastewater from the degritter–degreasing, selected in the BTF/OPUF16S rDNA Pyrosequencing (TEFAP)[35]
(7) Pilot scale4100–790094.794.7>994.6127.392.6106.8–7.4ND2.325/7.63Community of microorganisms from wastewater from the degritter–degreasing, selected in the BTF/OPUFND[26]
(8) Lab scale4400–800026.226.299.130NDNDND7253NDMicrobial consortia from sludge of an upflow anaerobic sludge blanket reactor from poultry slaughterhouse/PU foamND[36]
(9) Lab scale1500–160016.354.5992–5NDNDND6–7.5250.2–0.70.005–0.010/NDMicrobial enrichment from anaerobic sludge from a WWTP/PP ringsND[37]
(10) Field scaleND438438NDND150999.854–1073–6.9210.71.17/NDCommunity of microorganisms from swine wastewater selected in the BTF/PP bioballsRT-PCR for relevant methanogens detection not for SOB[38]
(11) Pilot scale265–12451.791.7999.312.38.4596.412.36.2–6.923–270.42–1.26ND/1.02Microbial consortium isolated from a mix of sludge from anaerobic fermentation chambers and from chemical desulfurization units/PE K1 ringsCFU count in nutrient agar plates[39]
(12) Lab scale900–110025.225.2100230.3~954, 59, 7NDNDNDMicroorganisms of activated sludge from a domestic WWTP, selected in the BTF/expanded schist and cellular concreteND[40]
(13) Lab scale190079.879.8ND117141.1ND1177.433–800.13–0.30.67/10ND/PPRND[41]
(14) Lab scale710–3564NDND94.7214194.727.4–7.5301.981/15Community of microorganisms from a sample of WWTP, selected in the BTF/PP ringsDGGE[23]
(15) Lab scale2848808096.51.96141.192.91.967.4–7.5ND0.38–0.418ND/10ND/PP ringsND[42]
(16) Lab scale200051.48ND982.2NDNDND7.3–7.5ND58.4–60/2.28–20.6Community of microorganisms from a stirred tank reactor of a WWTP, selected in the BTF/OPUF and PP ringsDGGE[25]
(17) Lab scale100–500~16.4~16.491.9ND19.2993.57240.012–0.0620.04/0.22Thiobacillus dominated culture from a moving bed biofilm reactor/PU foamDGGE[43]
(18) Lab scale1537–212784.484.495.71.6NDNDND7350.25–80.5/11Community of microorganisms from a sample of anaerobic sludge of a STP, selected in the BTF/strips of PVC, PET, PTFE (Teflon), OPUBiomass was determined as weight of protein by weight of dry support material[30]
Abbreviations: LR: loading rate, EC: elimination capacity, RE: removing efficiency, EBRT: empty bed retention time, T: temperature, TLF: trickling liquid flow, TLV: trickling liquid velocity, OPUF: open pore urethane foam, WWTP: wastewater treatment plant, PPR: polypropylene pall rings, PU: polyurethane, PP: polypropylene, PE: polyethylene, STP: sewage treatment plant, PVC: polyvinyl chloride, PET: polyethylene terephthalate, PTFE: polytetrafluoroethylene, ND: not displayed or not made.
Table 3. H2S BTF efficiency parameters.
ParameterEquationVariables
Elimination capacity of H2S
(EC)
E C H 2 S = ( C i n C o u t ) · Q V Cin = H2S input concentration
Removal efficiency of H2S
(RE)
R E H 2 S = ( C i n C o u t ) C i n Cout = H2S output concentration
Empty bed retention time
(EBRT)
E B R T = V Q V = Empty bed volume of the BTF bed
Loading rate
(LR)
L R = C i n V · Q Q = Biogas flow
Table 4. Common biofilm quantification methods in BTFs research.
MethodTechniqueAdvantageDisadvantageRef.
Microorganisms cell count by weight or area of dry packing material (quantitative).Direct count of cells in a Neubauer chamber through optical microscopy.Fast, easy, and inexpensive.No information about the viable cells. It cannot made if the cells are too little.[26,34]
Colony forming units (CFU) count by weight or area of dry packing material (quantitative).Biofilm resuspension spreading in agar plate dishes and anoxic incubation for 14 d.Easy and relatively inexpensive. Reports the viable biomass.Long period of time to obtain results (~14 d).[39]
DNA sequences copies (quantitative).rDNA 16S pyrosequencing (TEFAP).Reports the microorganisms identity and their relative abundance.No information about the viable cells.[35]
Relative intensity of a DNA amplification product (quantitative).rDNA 16S PCR, DGGE, and calculation of the relative abundance by band intensity.Relative abundance by taxa previously selected as control microorganisms. An easy way to measure microbial community changes.It is restricted to the previous selection of control cultures (e.g., ATCC, DSM) and specific primers.[25,42]
Gene copies by cDNA sample (mRNA copies) (quantitative).RT-qPCR.Relatively fast and easy. It reports the number of mRNA in the sample, proportional to the number of viable bacteria in the specific taxonomic group previously selected.It is restricted to the previous selection of specific primers and it needs cloning to make the calibration curve.[38]
Protein weight by weight or area of dry packing material (quantitative).Quantification of total proteins by Lowry techniqueRelatively inexpensive, fast, and easy. Total proteins are proportional to viable biomass.Restricted to the detection limits of the protein determination kit or the preparation of reactants.[30]
Observation of the microorganisms on the surface of packing material (qualitative).Scanning electron microscopy (SEM).Reports the cells morphology, size, and the formation of EPS filaments and fimbriae. It shows the topology of the biofilm. Coupled to material analysis, it reports the chemical elements that surrounds the biofilm cells.No information about the viable cells. A relative quantification is only possible when the biofilm has a single layer of cells.[32,37]
Table 5. Methods of viable microorganism quantification in BTFs.
MethodTechnicAdvantageDisadvantageRef.
Microorganisms cells count by weight or area of dry packing material (quantitative and qualitative).Direct count of cells by optical epifluorescence microscopy with live–death stain (Baclight, Thermofischer, Waltham, MA, USA).Relatively fast and easy. Reports the viable and not viable cells. If observed in a confocal laser scanning microscope (CSLM), biofilm topology and thickness is reported.Relatively expensive and low capacity of sample processing quantity.[68,69]
Colony forming units (CFU) count by weight or area of dry packing material (quantitative).Drops of serial dilutions of biofilm resuspension spreading in agar plate dishes or 24-well agar microplates and anoxic incubation for 14 d.Cost-effective and allows many replicates producing better statistical data. Reports the viable CFU.Long period of time to obtain results (~14 d).[47,70,71]
Table 6. Suggested set of traditional and microbiological parameters that every research on BTFs should include.
ParameterDescription
Traditional Markers of Efficiency in BTFs for Biogas Desulphurisation
ECcrit (g m−3 h−1)Elimination capacity at 90–100% of RE.
LRcrit (g m−3 h−1)Loading rate of pollutant at 90–100% of RE, theoretically its value is equal to ECcrit.
EBRT for ECcrit (min)Empty bed retention time at the ECcrit, sometimes is equivalent to EBRT for ECmax.
ECmaxMaximum elimination capacity (EC). Corresponds to the inflexion point or the first value of the asymptotic part of the EC versus LR curve.
LRmax (g m−3 h−1)Loading rate (LR) at the ECmax.
RE for ECmaxRemoving efficiency at ECmax.
EBRT for ECmaxEmpty bed retention time at the ECmax, sometimes equivalent to the EBRT for ECcrit.
Microbiological markers
Inoculum descriptionDetail of the sample, culture, or strain for the inoculum.
Quantification of biomassBacterial cell count by packing material surface, through microscopic cell counting in Neubauer chamber or Baclight stain. CFU by packing material surface, through the drop plate method.
Initial microbial ecology (after start-up)DGGE or TEFAP for the biofilm in the packing material of the BTF and the liquid culture in the bioreactor.
Final microbial ecology (at ECcrit and ECmax times)DGGE or TEFAP for the biofilm in the packing material of the BTF and the liquid culture in the bioreactor.
Microbial ecology under perturbationDGGE or TEFAP for the biofilm in the packing material of the BTF and the liquid culture in the bioreactor.
Publisher’s Note: MDPI stays neutral with regard to jurisdictional claims in published maps and institutional affiliations.

