The Effect of Root Clearance on Mechanical Energy Dissipation for Axial Flow Pump Device Based on Entropy Production


1
Research Center of Fluid Machinery Engineering and Technology, Jiangsu University, Zhenjiang 212013, China
2
Mechanical Engineering Department, Wa Technical University, Wa, XW-0547-6186 Upper West, Ghana
*
Author to whom correspondence should be addressed.
Processes 2020, 8(11), 1506; https://doi.org/10.3390/pr8111506
Submission received: 8 October 2020
/
Revised: 13 November 2020
/
Accepted: 17 November 2020
/
Published: 20 November 2020
(This article belongs to the Special Issue CFD Based Researches and Applications for Fluid Machinery and Fluid Device)
Abstract
:The axial flow pump is a low head, high discharge pump usually applicable in drainage and irrigation facilities. A certain gap should be reserved between the impeller blade root and the impeller hub to ensure the blade adjustability to broaden the high-efficiency area. The pressure difference between its blade surface induces leakage flow in the root clearance region, which decreases hydraulic performance and operational stability. Therefore, this study was carried out to investigate the effect of root clearance on mechanical energy dissipation using numerical simulation and entropy production methods. The numerical model was validated with an external characteristics test, and unsteady flow simulations were conducted on the axial flow pump under four different root clearance radii. The maximum reductions of 15.5% and 6.8% for head and hydraulic efficiency are obtained for the largest root clearance of 8 mm, respectively. The dissipation based on entropy theory consists of indirect dissipation and neglectable direct dissipation. The leakage flow in the root clearance led to the distortion of the impeller’s flow pattern, and the indirect dissipation rate and overall dissipation of the impeller increased with increasing root clearance radius. The inflow pattern in the diffuser was also distorted by leakage flow. The diffuser’s overall dissipation, indirect dissipation rate on the blade surface, and indirect dissipation rate near inlet increased with increasing root clearance radius. The research could serve as a theoretical reference for the axial flow pump’s root clearance design for performance improvement and operational stability.
1. Introduction
The axial flow pump is a high flow rate pump with a low head, usually applied in drainage and irrigation engineering [1,2]. In this pump, the fluid approaches the impeller axially and leaves but with a swirling motion resulting from the impeller rotation. To effectively improve on its performance characteristics, an adjustable blade angle has been proven to widen the operating range of the axial flow pump, with an impeller tip clearance (radial clearance between impeller rim and impeller housing) [3,4,5] and root clearance (radial clearance between impeller hub and impeller root) [6]. However, the pressure difference between the suction side and the blade’s pressure side induces leakage flow in the tip clearance [7,8] and root clearance regions. This can generate flow blockage within the impeller passage [9,10], resulting in decreased hydraulic performance and operational stability [11,12,13]. In comparison, the tip clearance region is more susceptible to cavitation and clearance leakage vortices due to the large internal velocity circulation compared to the root clearance. Laborde et al. [14] studied the effect of clearance geometry, clearance height, and the operating condition on tip vortex cavitation in an axial flow pump by visual experiment. Farrell et al. [15] built a correlation of variables to predict the vortex minimum pressure. This was validated by experimental tests and other existing data from the literature. Zhang et al. [16] analyzed tip leakage flow structure and the evolution of tip vortex based on a modified filter-based turbulence model. Wu et al. [17,18] performed the particle image velocimetry test to study the tip leakage flow structure and the formation process of tip leakage vortex in the water-jet pump. Although circumferential velocity was low, and the flow was relatively stable in the axial flow pump’s root clearance, excessive root clearance would also significantly impact the hydraulic performance. If the blade root clearance were rather too small, the blade’s adjustability would be affected, resulting in a reduction of the high-efficiency operation range. Considering the state of the art, the root clearance of the axial flow pump has not been extensively researched, and therefore there is the need to investigate further the flow losses and loss mechanisms in the blade root clearance of the axial flow pump.
In identifying and evaluating hydraulic loss distributions in pumps, entropy production analysis has become very popular since it can help the pump designer improve hydraulic performance. In the past, local entropy production based on empirical correlations was applicable to laminar flow problems only [19,20]. However, in 2003, Kock et al. [21,22] proposed a calculation model of local entropy production suitable for turbulent shear flows by Reynolds-averaging the entropy generation equation. The local entropy could be estimated from calculation results from Computational Fluid Dynamics (CFD) using a proposed calculation model without solving the transport equation. This method has been widely used to obtain the spatial distribution of hydraulic losses in pumps [23,24,25].
In this paper, the root clearance radius on energy dissipation in the axial flow pump was studied. The axial flow pump’s external characteristic test was first performed at two root clearance radii (0 mm and 2.7 mm) to validate the numerical model. The theory of entropy production was then applied to the unsteady calculation results with 4 root clearance radii (0 mm, 2.7 mm, 5 mm, and 8 mm) to identify the effect of the flow rate and root clearance radius on energy losses for each hydraulic component. Finally, the loss distribution and mechanism resulting from indirect dissipation within the impeller and diffuser were analyzed, and a reference was established for root clearance design in the axial flow pump.
2. Numerical Simulation
2.1. Computational Domain
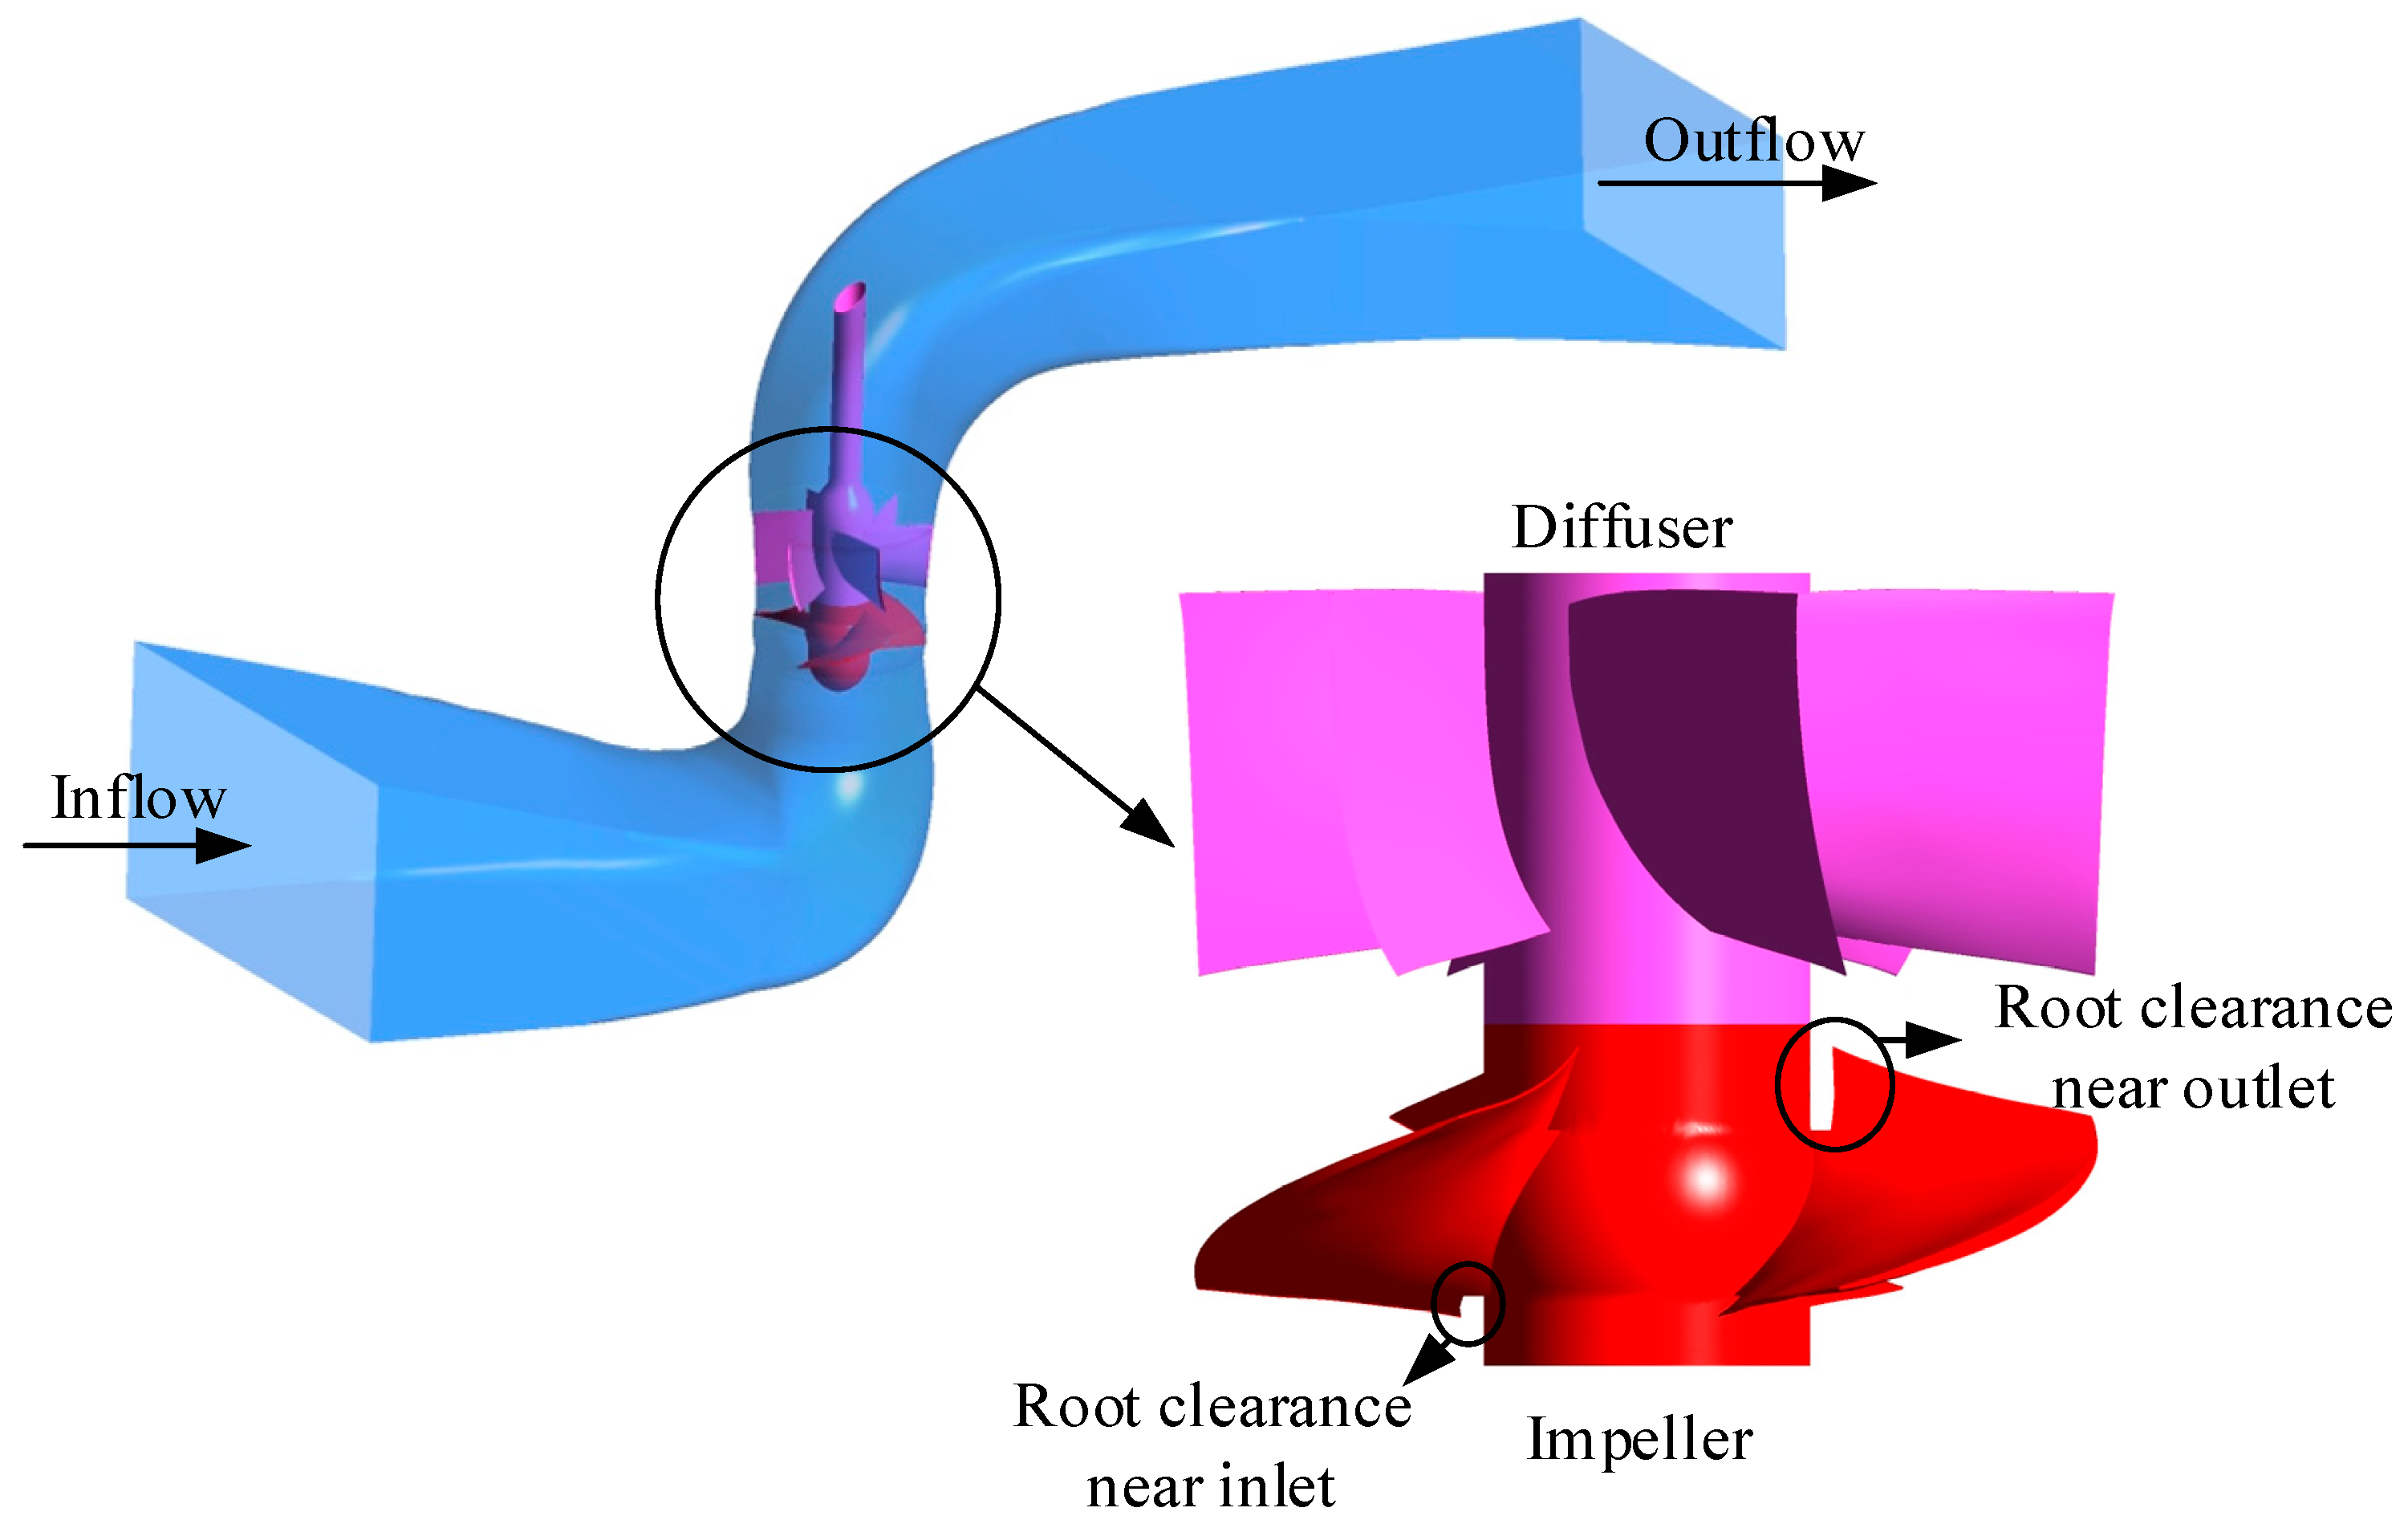
Figure 1 shows that the axial flow pump model consists of an elbow inflow runner, an axial flow impeller, a diffuser, and an outflow runner. In this paper, the pump performance, and four kinds of root clearance radius (0 mm, 2.7 mm, 5 mm, 8 mm) of impeller were designed. The main design and geometry parameters of the pump model are shown in Table 1, and the specific speed was calculated based on Equation (1) [26]:
where and n stand for the specific speed and shaft rotational speed, respectively, Qdes presents the design volume flow rate, and Hdes is the design pump head.
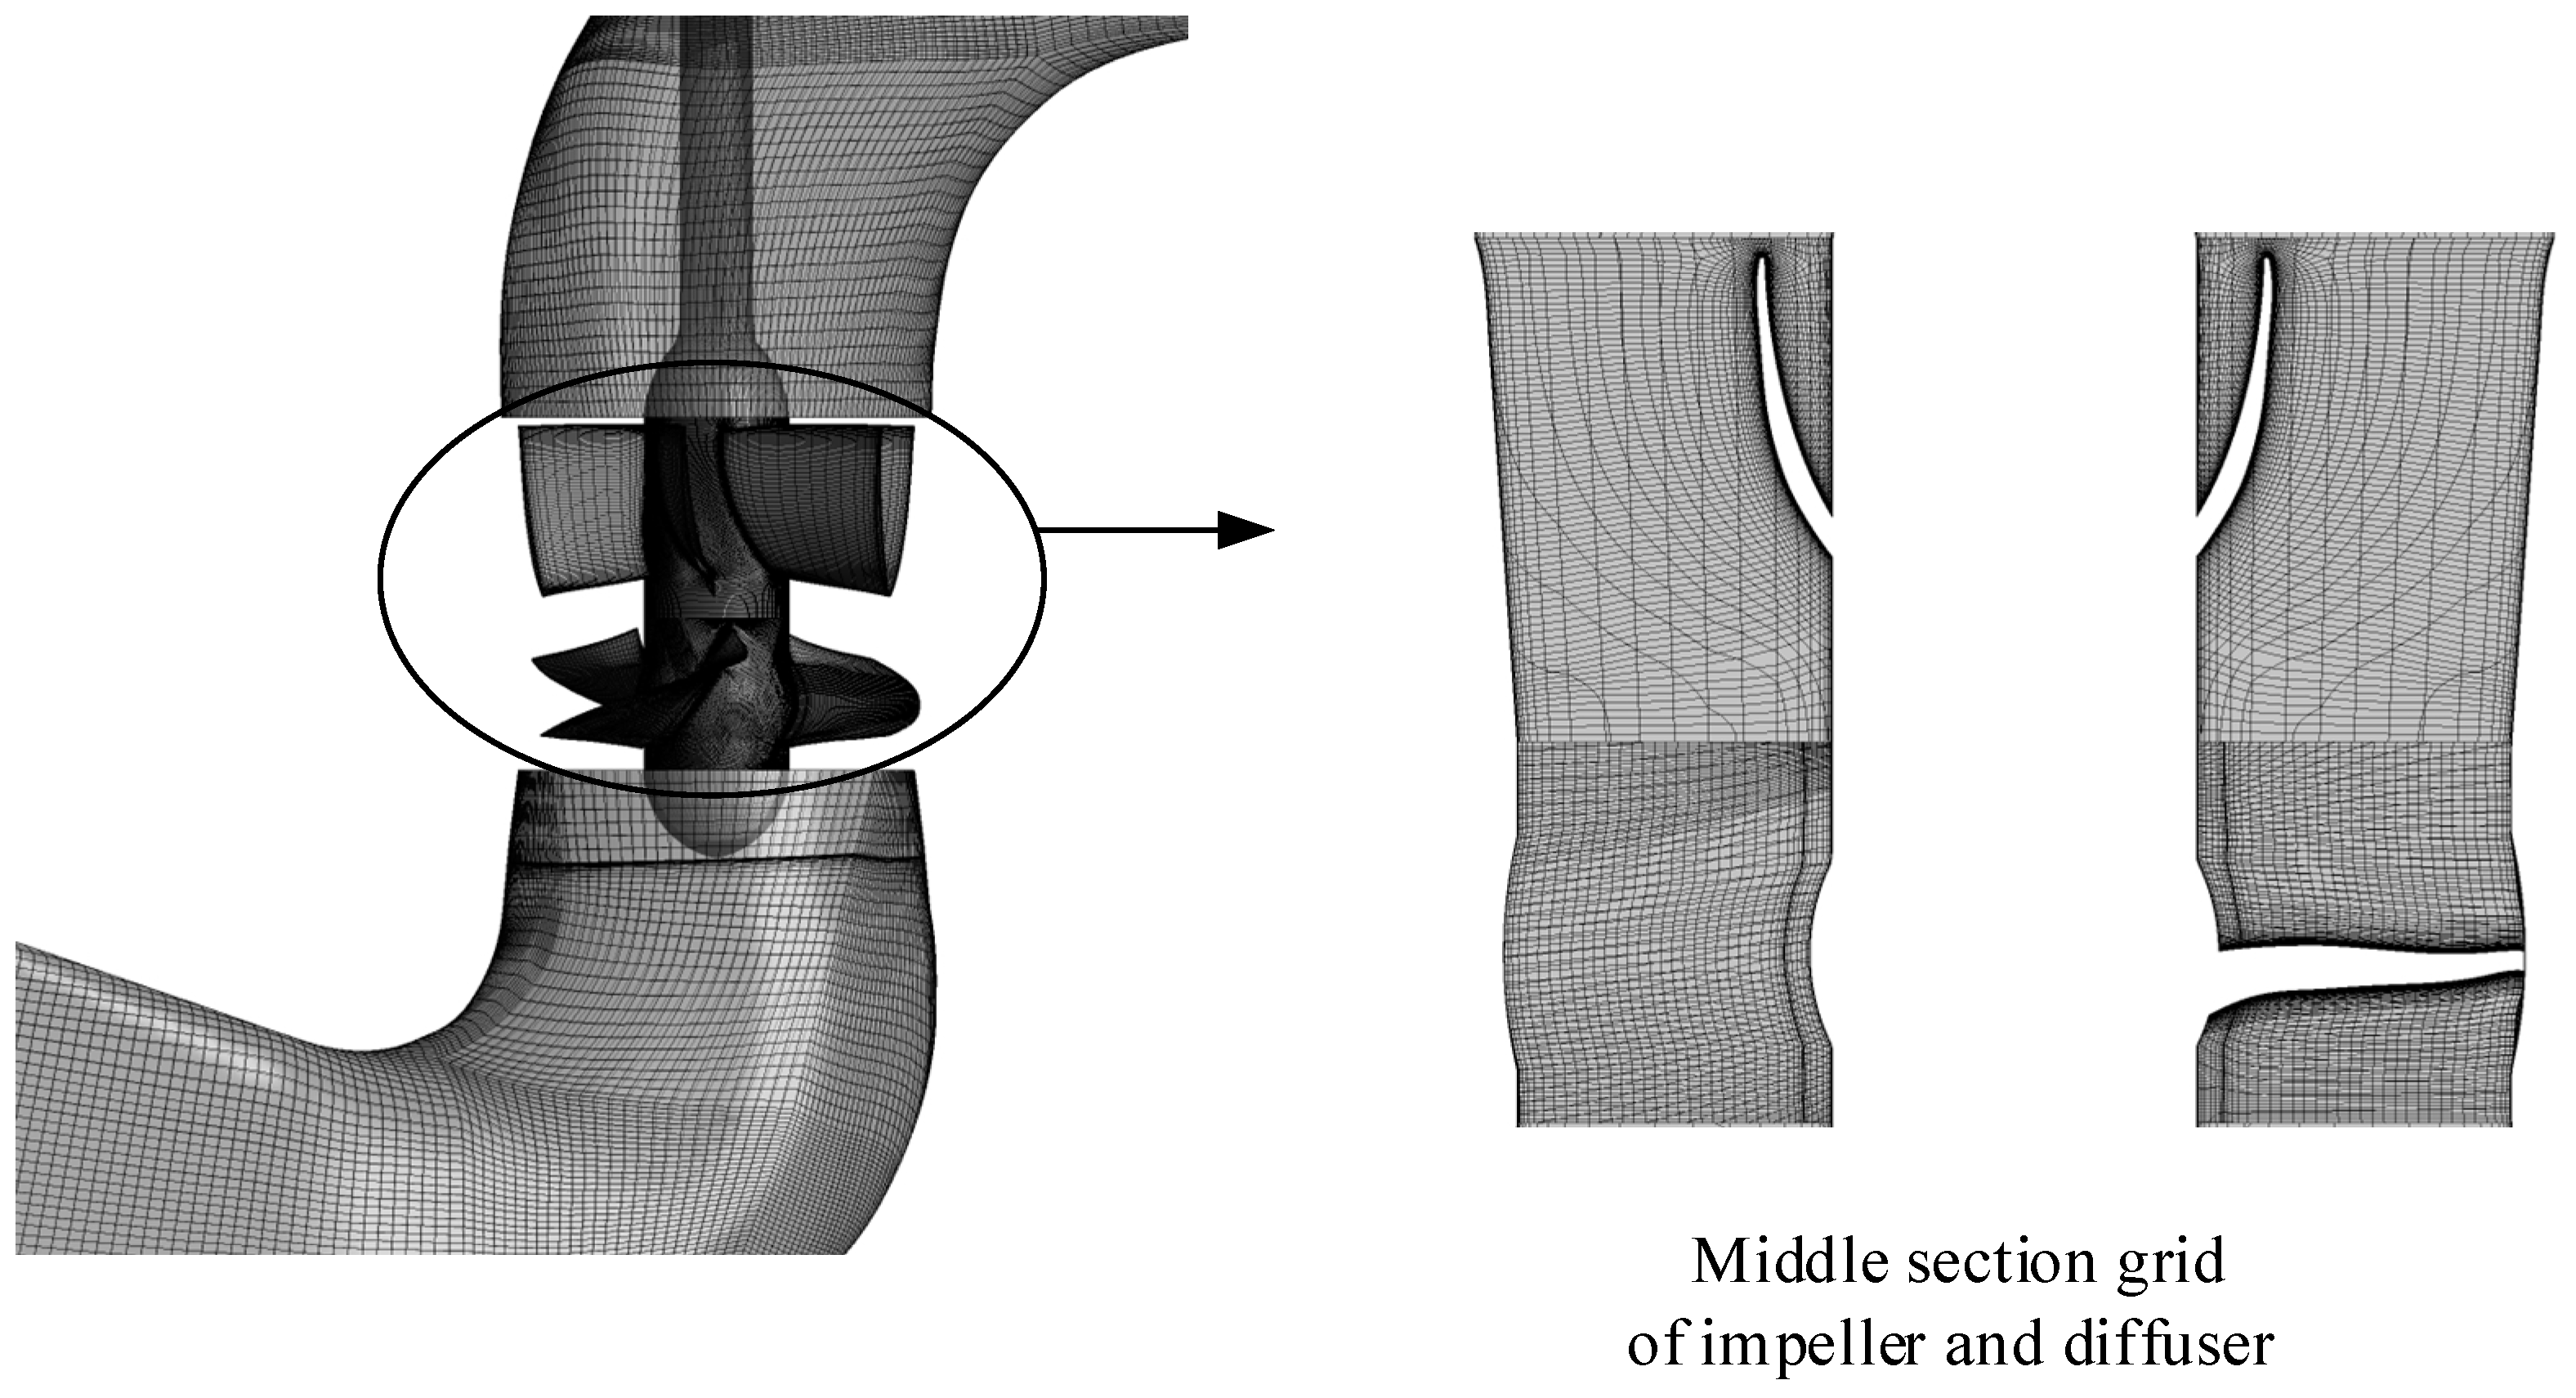
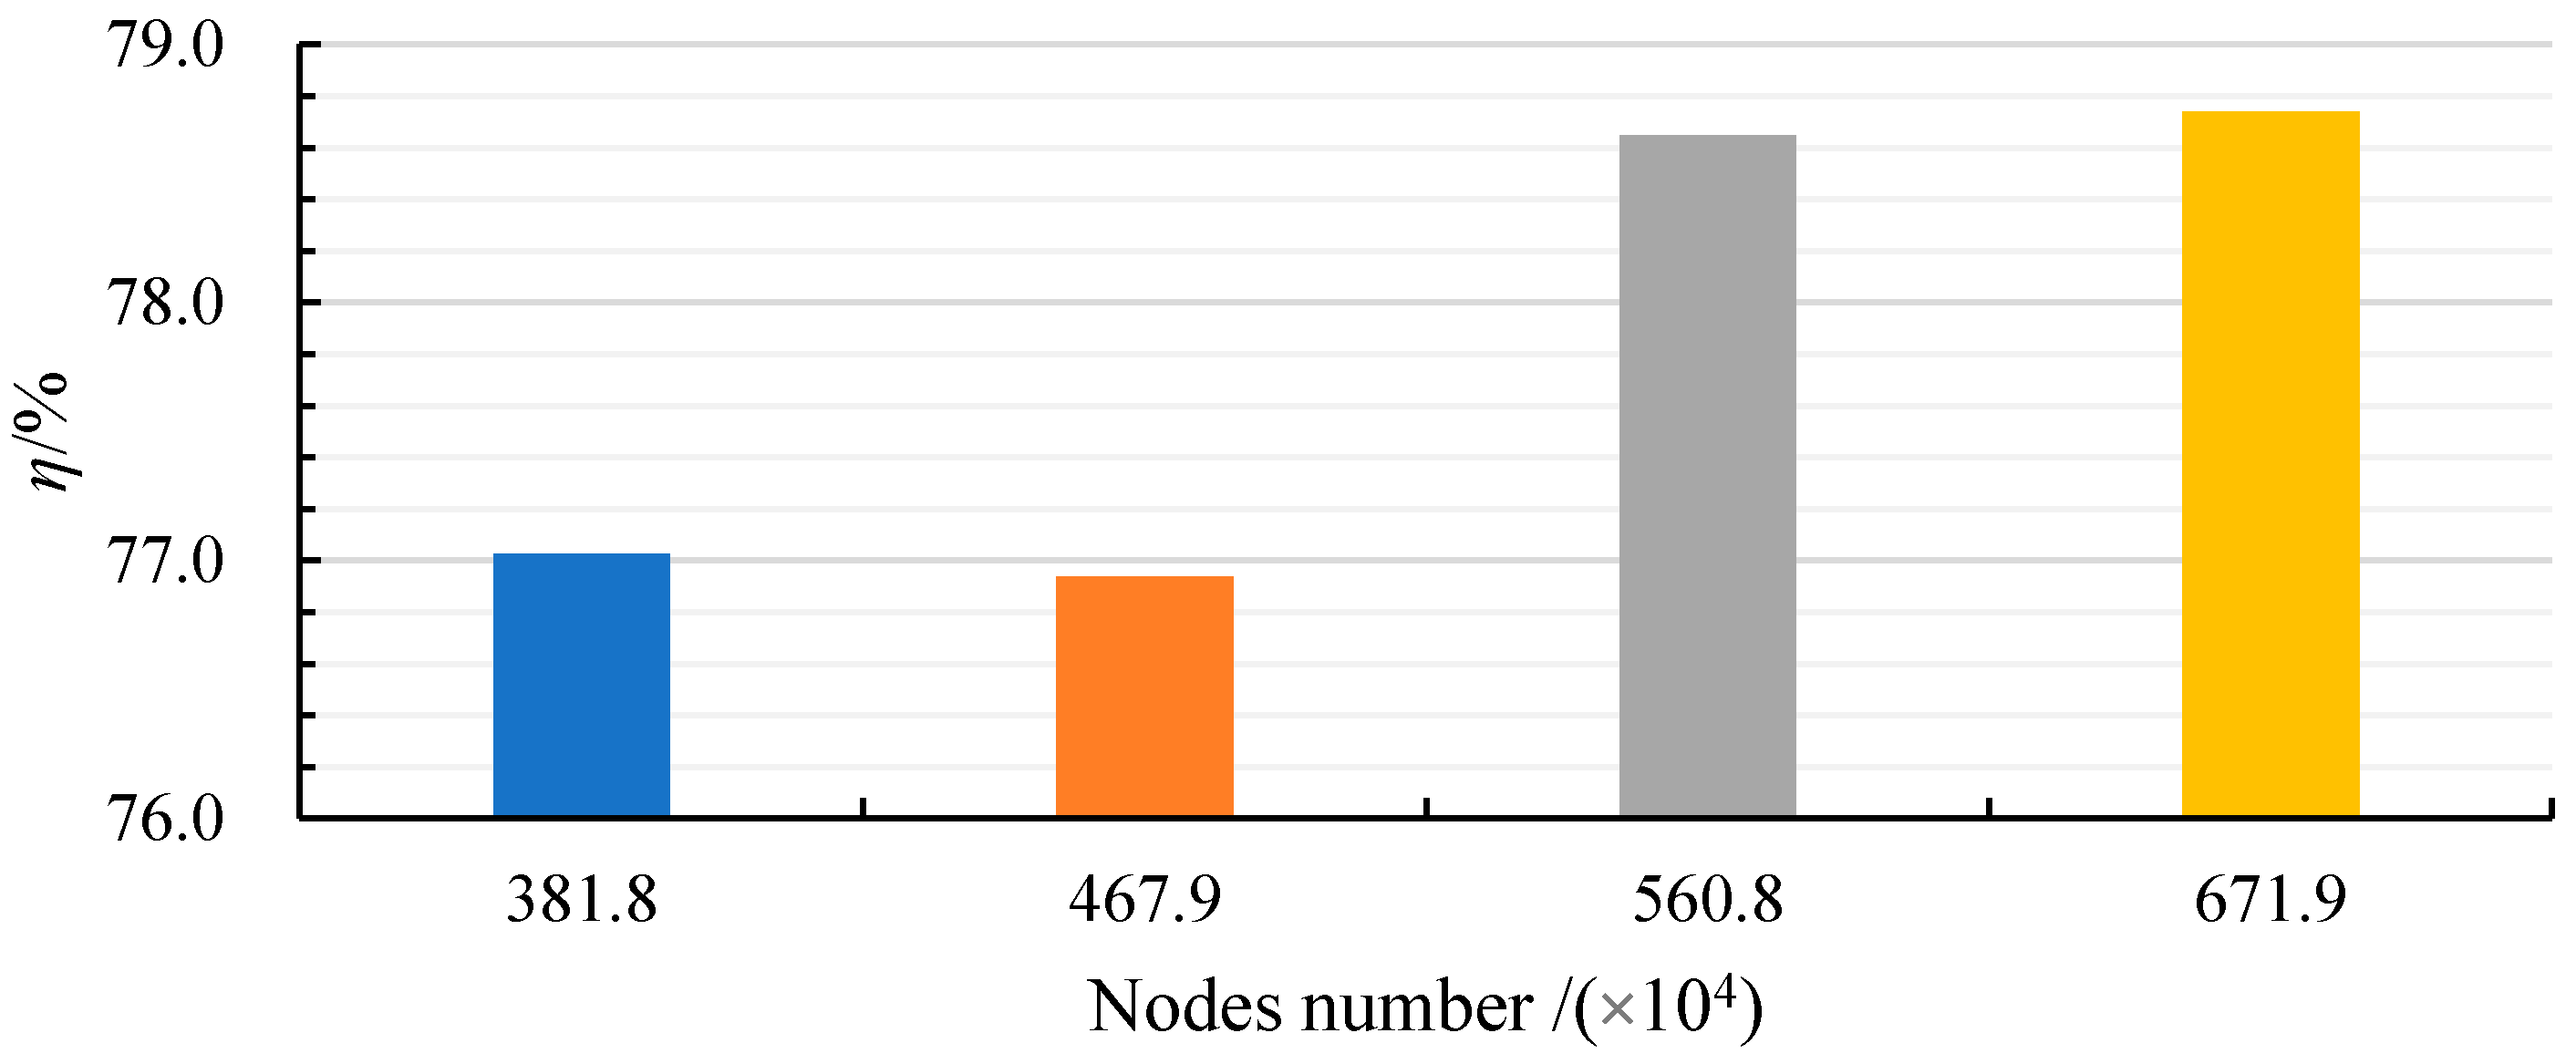
In order to precisely analyze the detailed flow loss distributions within the gap position, ANSYS ICEM was used to generate high-quality structural hexahedral grids for the inflow runner, impeller, and outflow runner. Turbogrid was used to generate grids of the diffuser automatically. Figure 2 presents the mesh of the calculation domain. The average Y+ of impeller and diffuser were 10.1 and 10.9, respectively. For the inflow runner and outflow runner, the average Y+ values were 5.0 and 15.4, respectively. In ensuring the simulation’s speed and accuracy, a grid independence analysis of the pump was conducted in Figure 3. When the total number of grid nodes of pump exceeded 5.6 million, the calculation results were seen to be stable, and the relative error of the efficiency was within 0.15%. Therefore, to ensure the calculation accuracy and save calculation resources, the number of grid nodes of inflow runner, impeller, guide vane, and outflow runner was finally controlled at 1.8 million, 1.2 million, 1.5 million, and 1.5 million, respectively.
2.2. Boundary Condition
In this study, 25 °C was chosen as the temperature of the working fluid. The governing equation was Reynolds Averaged Navier–Stokes (RANS) equation, which is defined as follows:
where i and j stand for cartesian direction; and present the time-average speed and time-average pressure, respectively; and stand for the fluid density and the dynamic viscosity. is the Reynolds stress and is the source item.
The SST k-ω turbulence model [27,28] was used to enclose the Equation. It was a Baseline (BSL) k-ω model with a limiter to the formulation of eddy-viscosity. The Baseline (BSL) k-ω model can be described as follows:
The coefficient is a linear combination of and ; is a linear combination of and ; is a linear combination of and ; is a linear combination of and . and are buoyancy production terms; is turbulence viscosity.
The calculation method of linear combination is as follows:
where = 1.176, = 2, = 0.075, = 5/9, = 0.09, = 1, = 1/0.856, = 0.44, = 0.0828. The F1 is a blending function of the wall distance, the value of which is 1 near the wall and decreases to 0 outside the boundary layer.
In order to improve the prediction accuracy of k-ω model for 3D flows, the shear stress transfer model (SST) should be applied to limit the formulation of eddy-viscosity.
where F2 is a blending function similar to F1.
Inlet and outlet boundary conditions were set as “Mass flow rate” and “Opening”, respectively. The reference pressure was 1 atm, and the outlet relative pressure was 0 atm. The no-slip wall and automatic wall function [29] was adopted as the wall condition for each hydraulic component. In addition, the roughness of the impeller and diffuser was set as 0.0125 mm, and that of the inflow runner and outflow runner was set as 0.05 mm.
Five flow conditions, 0.8 Qdes 0.9 Qdes 1.0 Qdes 1.1 Qdes and 1.2 Qdes were analyzed based on unsteady calculation. The time step and total time were set as 0.000373134s and 0.447761s, respectively. The interface condition between rotor and stator was set as “Transient rotor stator” [30], and the interface condition between stators was set as “None”. In each time step, when the residual value of convergence was less than 5 × 10⁻⁵ or the number of iteration steps reached 10, the calculation would stop. In addition, the advection scheme and transient scheme were set as “Upwind” and “second order Backward Euler.”
2.3. Entropy Production Theory
The entropy production model’s derivation was based on the entropy transport equation (Equation (9)), which was applied to the single-phase incompressible fluid [27].
where s is the specific entropy; , , are the velocity components in Cartesian direction: x, y, z; T is the temperature. stands for reversible heat transfer term. and present the entropy production by heat transfer and the entropy production by dissipation.
An isothermal heat transfer rate was set to render the system into a thermal equilibrium state. Hence, and were neglected.
Because all calculated results were based on RANS equation, should be time-averaged. can be divided into the entropy production by direct dissipation and entropy production by indirect dissipation . and are defined as follows.
where , , are time-average velocity; , , are instantaneous velocity fluctuation.
Because the , , cannot be obtained when solving the RANS equation, Kock et al. [22] proposes another method and the can be calculated as follows:
The overall dissipation of each hydraulic component can be obtained by integrating the dissipation rate over the whole fluid-producing domain as follows:
where PD represents direct power loss, and PI represents indirect power loss.
3. Test Measurement
3.1. Test Equipment
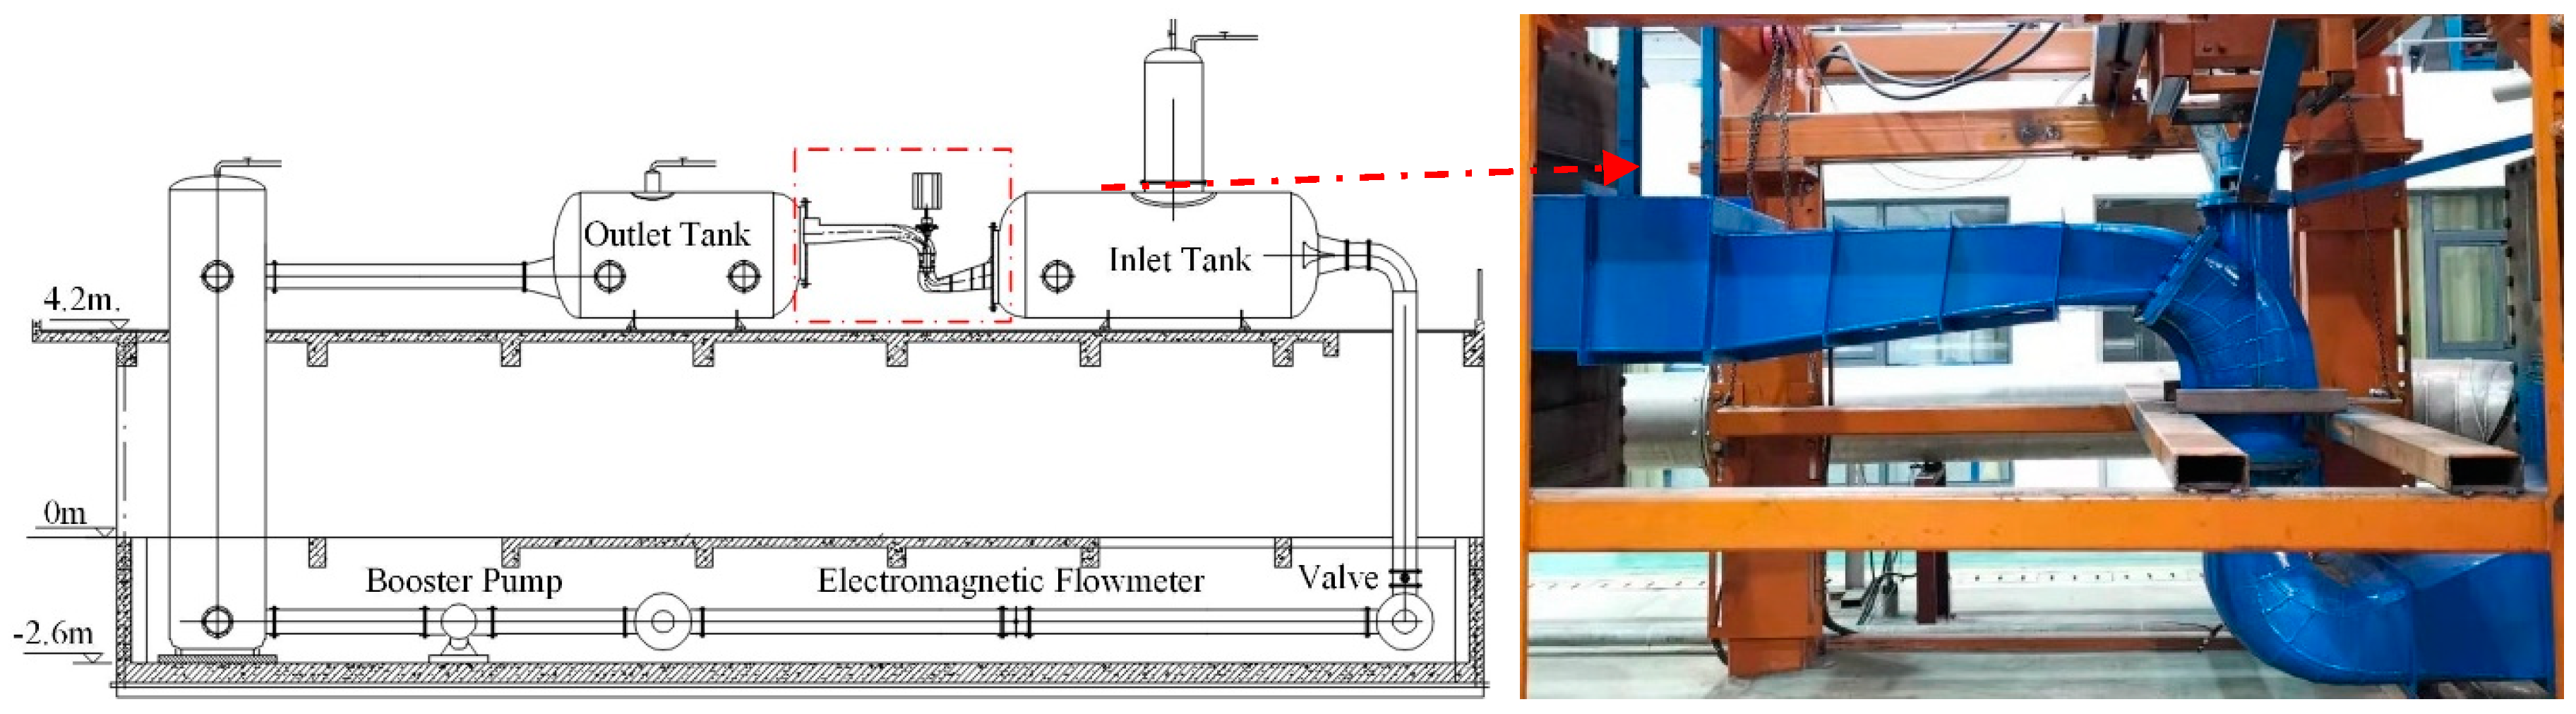
The closed test bench adopted a double-floor vertical structure, as shown in Figure 4. The flow meter was located on the −2.6 m floor, and the pressure transducers and torque meter were located on the 4.2 m floor. The basic parameters of test equipment are shown in Table 2. In addition, the flowmeter was arranged horizontally, and the length of straight pipes was greater than five times the pipe diameter. The test measuring point of the head was located on the inlet and outlet water tank.
3.2. Test Validation
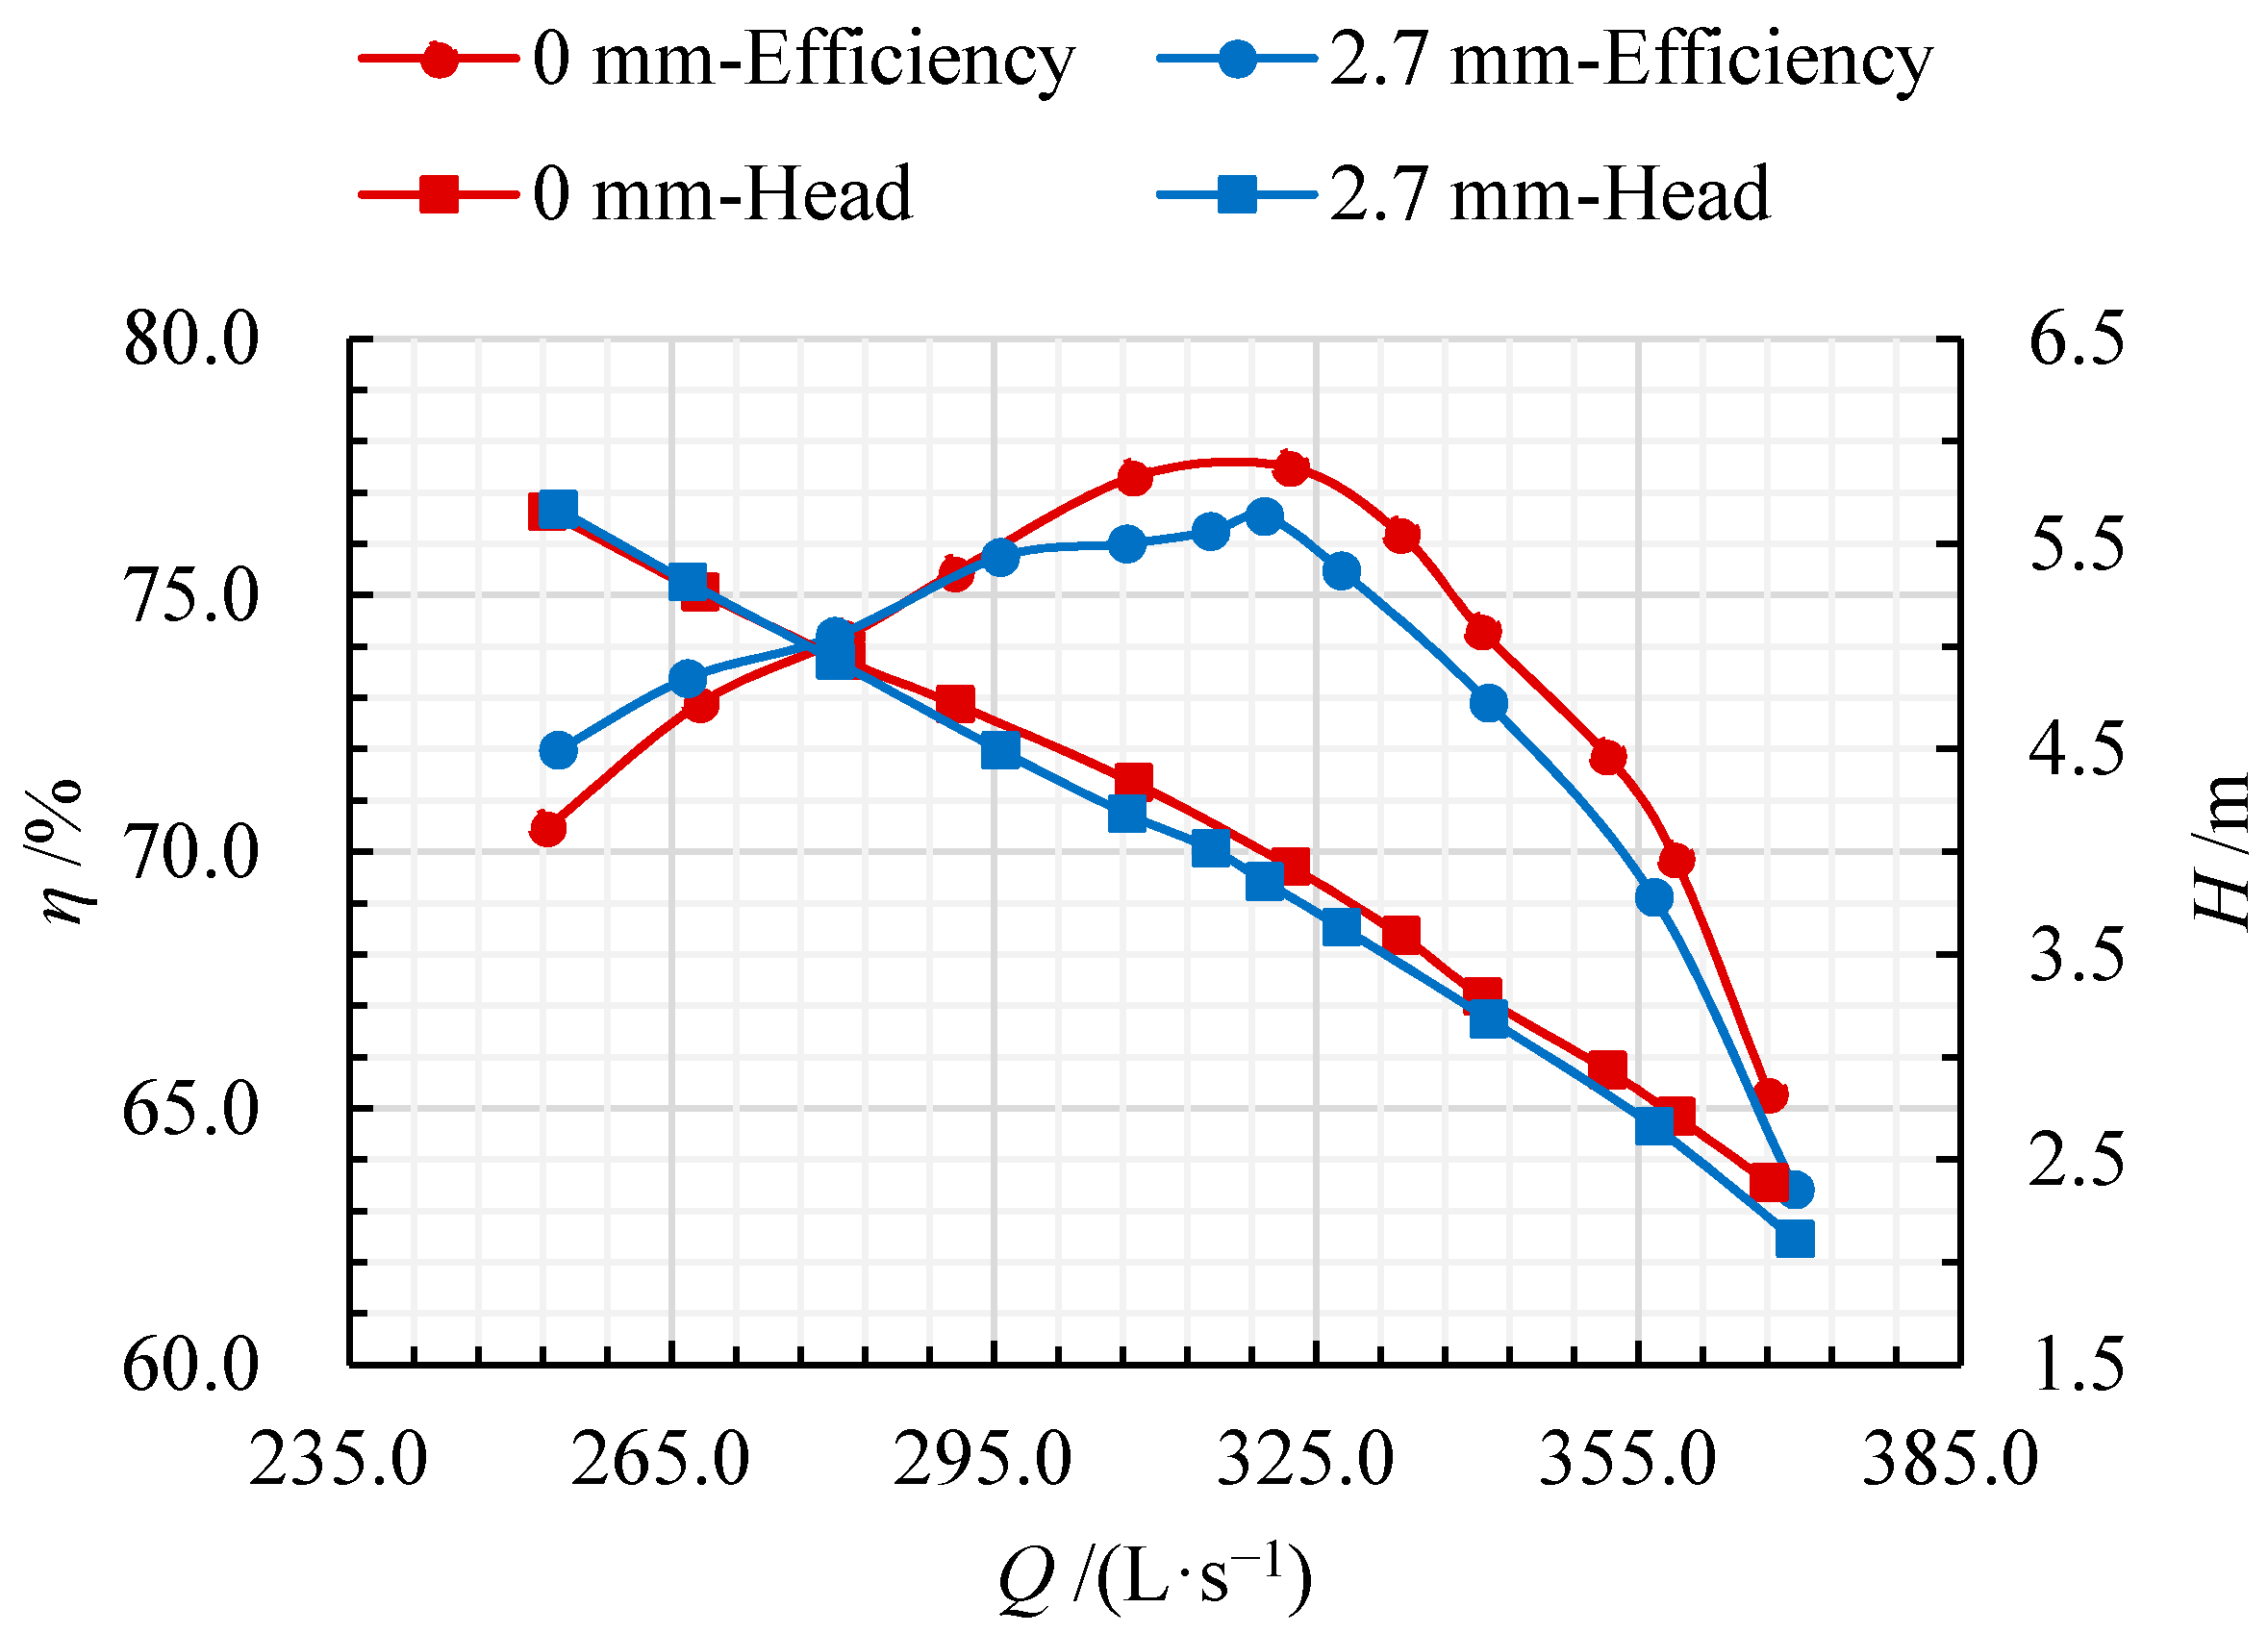
Figure 5 shows the external characteristic test results of an axial flow pump with two different root clearance radii (0 mm and 2.7 mm). The hydraulic efficiency and head were defined as follows:
where and present the total pressure at the outlet of outflow runner and inlet of inflow runner, respectively. stand for the motor input power, and are the fluid density and gravitational acceleration.
For the pump with a root clearance of 2.7 mm, the pump head was lower than that without root clearance under all flow rates, and the drop of performance parameters caused by root clearance increased with increasing flow rate. Under the part-load condition, the pump efficiency with 2.7 mm root clearance was slightly higher than that without root clearance, but the pump efficiency with 2.7 mm root clearance was significantly lower than that without root clearance under design condition and over-load condition. The experimental (EXP) results proved that the root clearance radius has a significant influence on hydraulic pump performance.
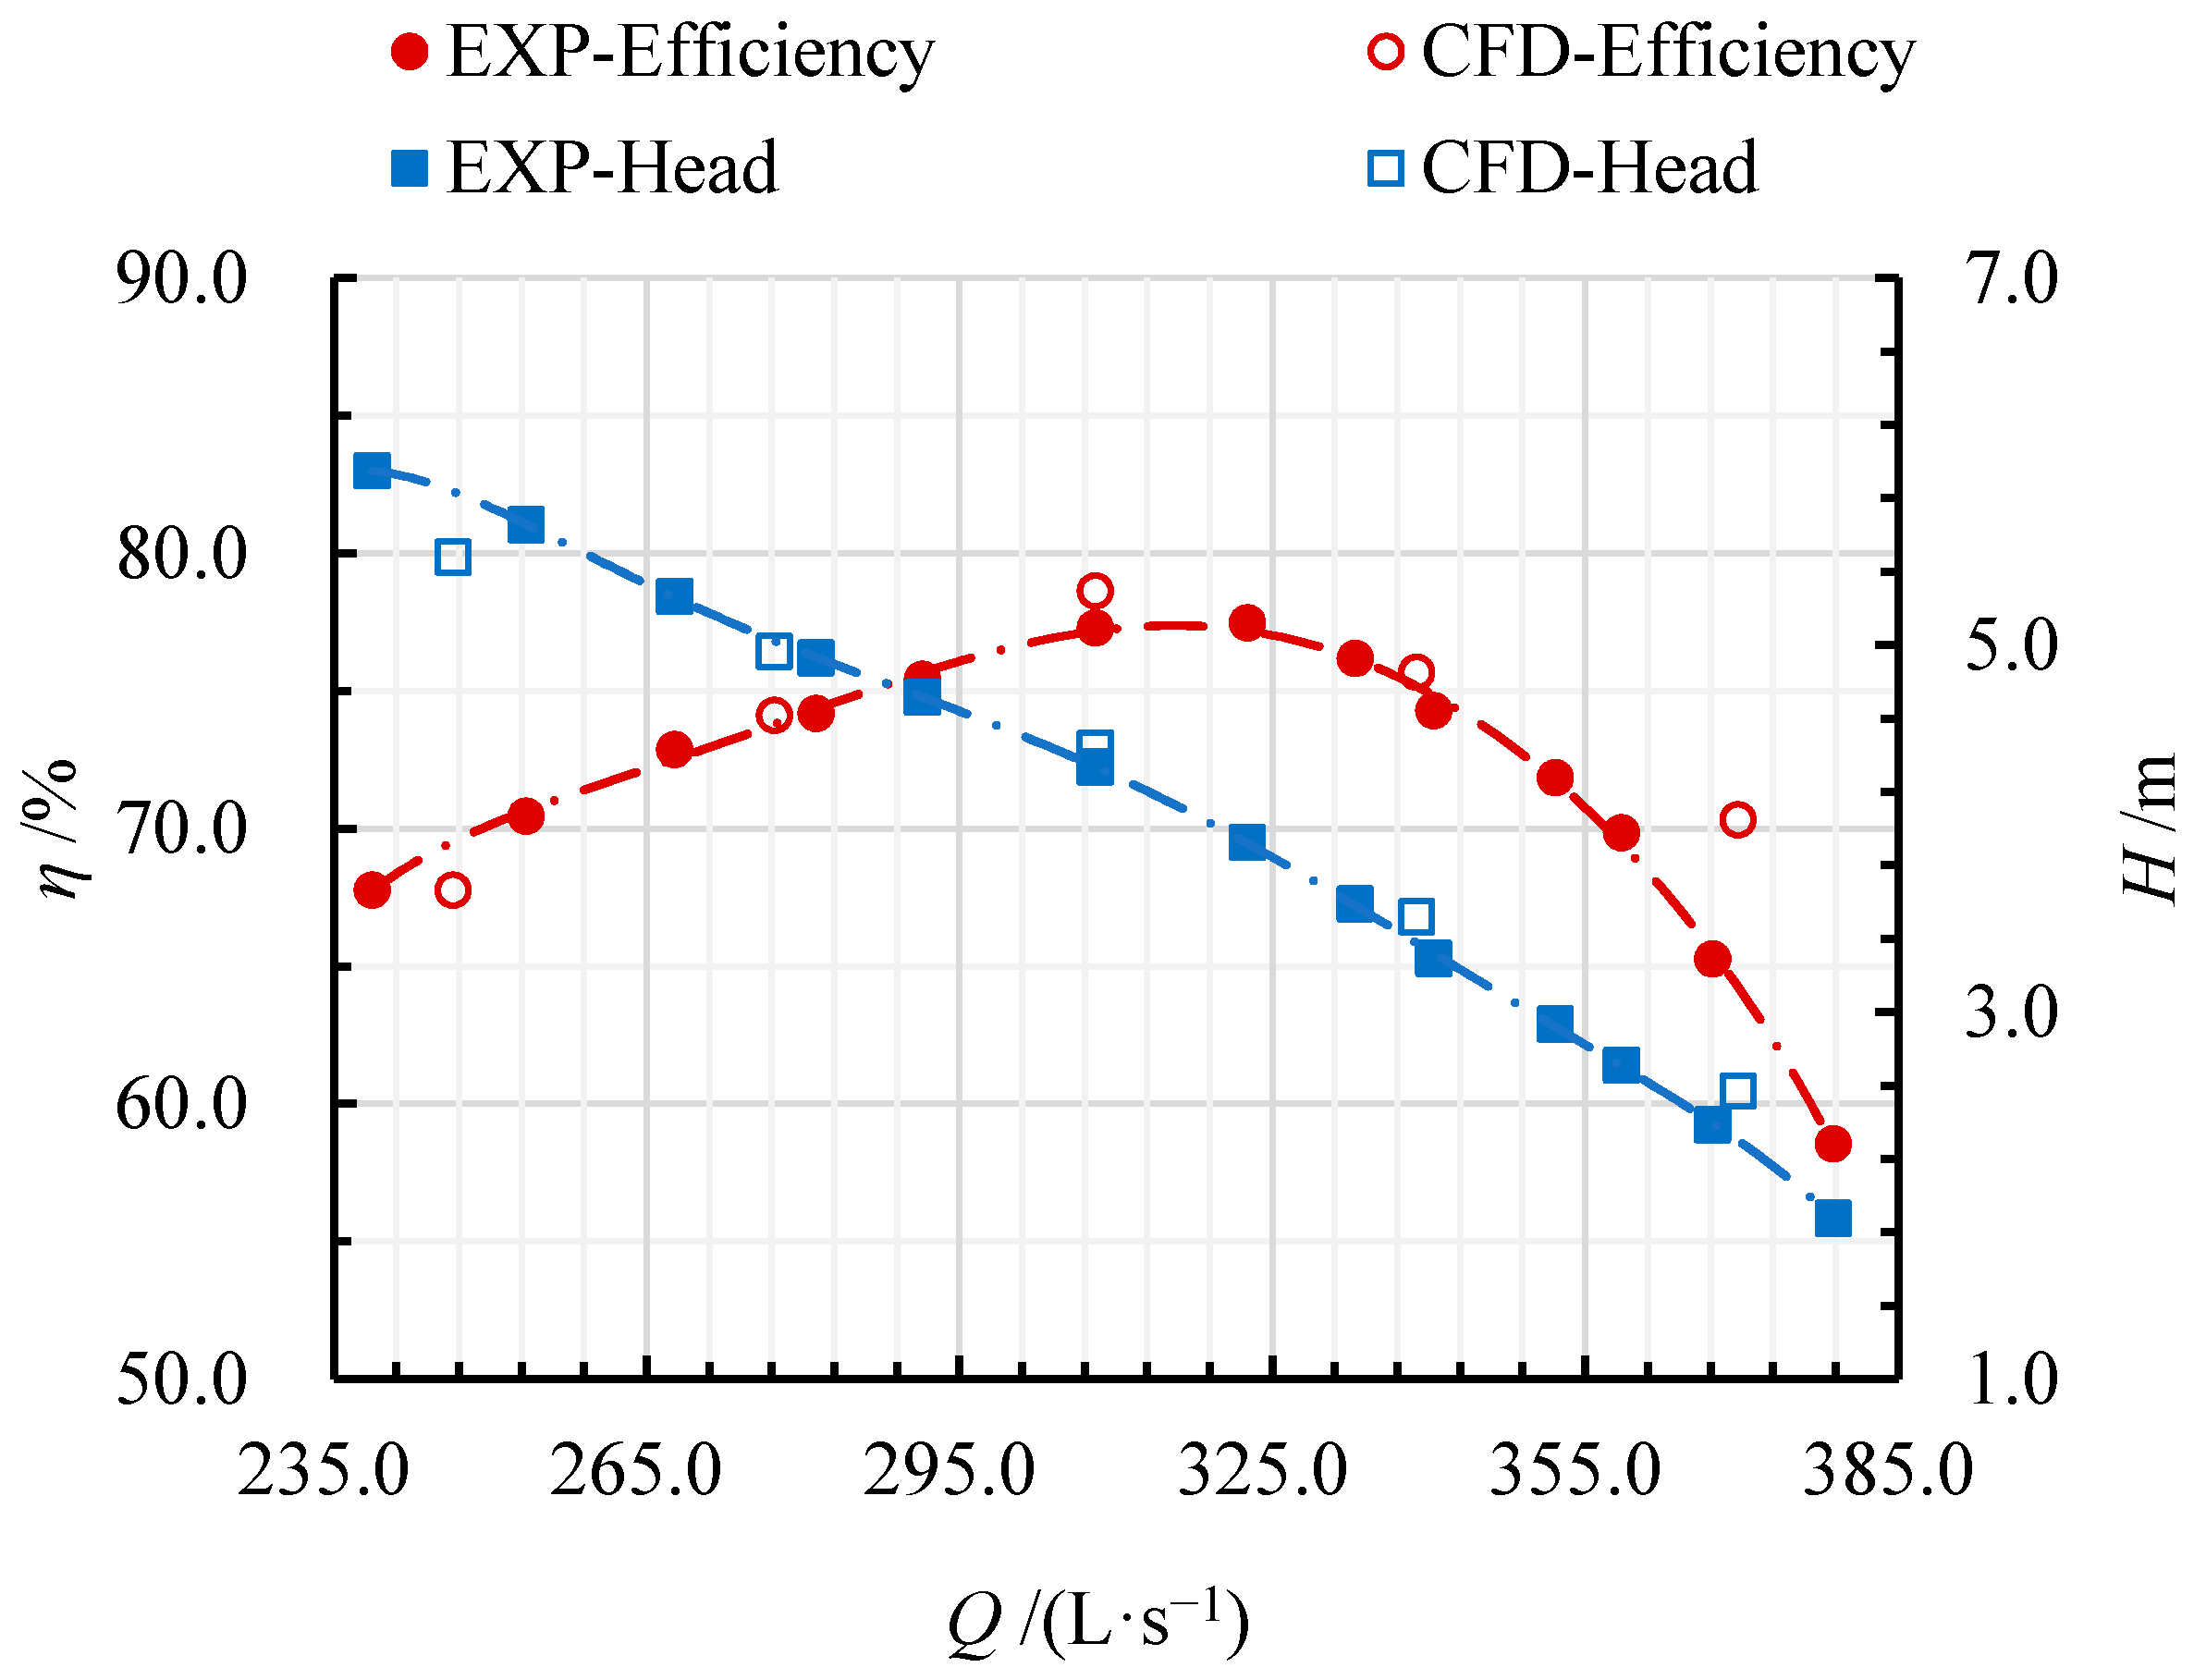
In order to verify the accuracy of numerical simulation, the experiment data with a root clearance of 0 mm was compared with calculated results in Figure 6. Under part-load flow rates, the simulated head and efficiency were lower than test data, but the simulated head and efficiency were higher than experiment data under design and over-load flow conditions. In addition, the maximum relative deviation between the measured results and the calculated data was less than 3% under the design flow rate. This shows that the numerical simulation results could accurately predict the pump’s internal flow characteristics, and the numerical simulation results are reliable.
4. Analysis of Calculation Results
4.1. Comparison of Pump Performance
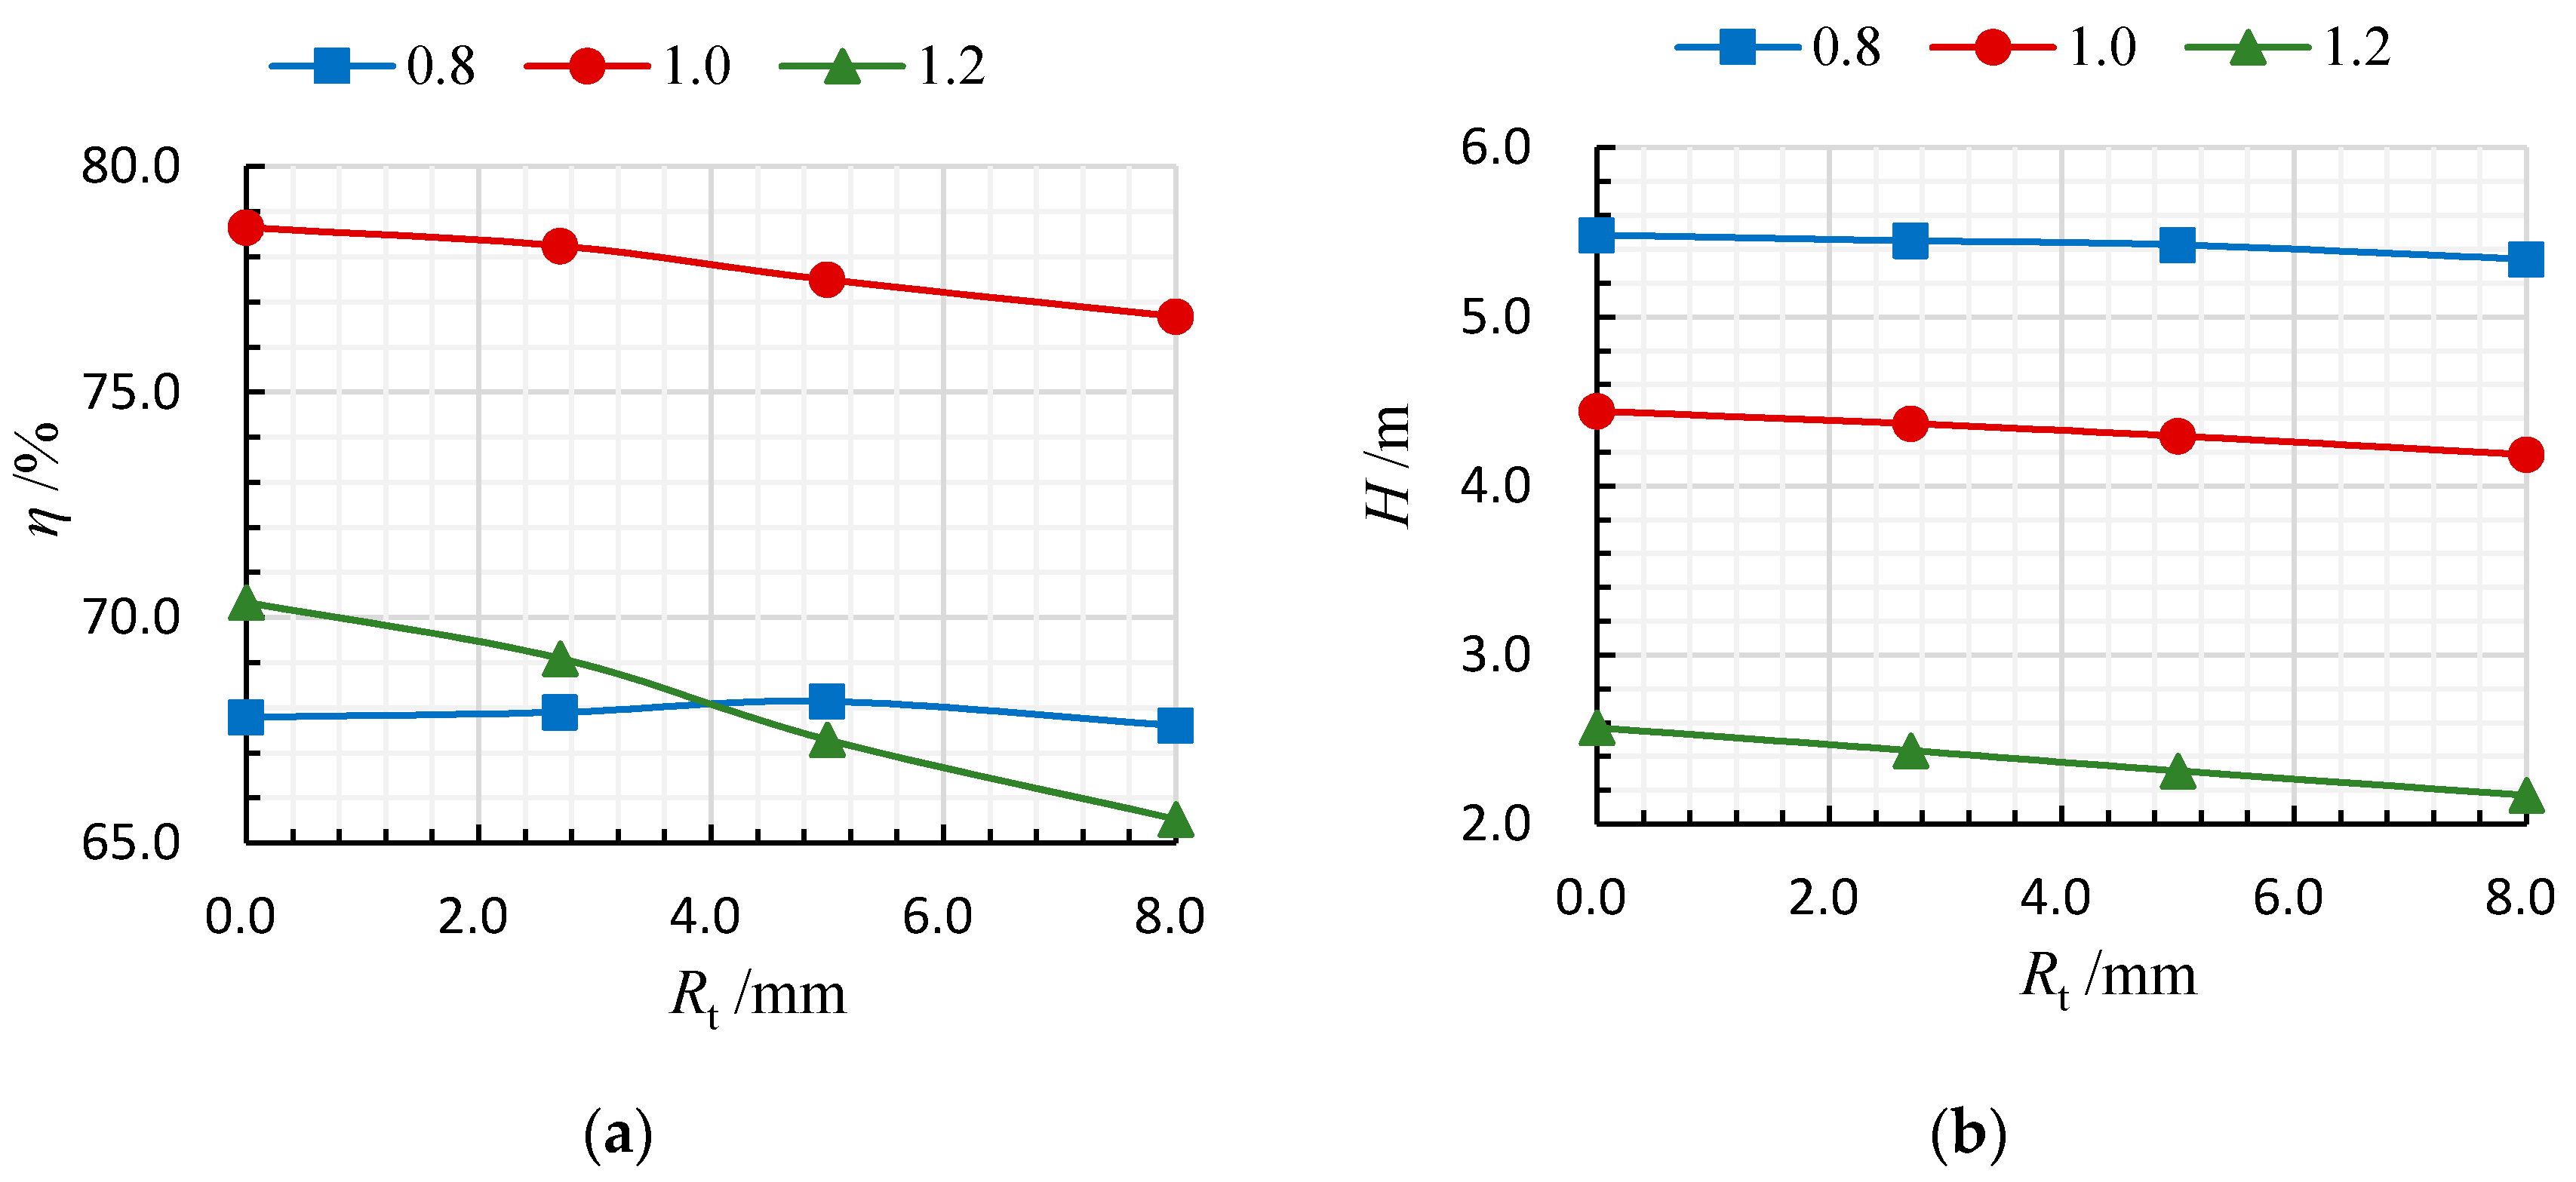
Figure 7 shows the hydraulic performance of the pump under different root clearance radii. As shown in Figure 7a, the hydraulic efficiency under 0.8 Qdes did not fluctuate obviously with the increase of root clearance radius. However, the hydraulic efficiency under 1.0 Qdes and 1.2 Qdes decreased with increasing root clearance radius, and the maximum drop in efficiency was 2.5% and 6.8% at 1.0 Qdes and 1.2 Qdes, respectively. In Figure 7b, the pump head decreased with increasing root clearance radius under all flow conditions, while a head drop of 2.6%, 5.6%, and 15.5% occurred at 0.8 Qdes, 1.0 Qdes, and 1.2 Qdes, respectively. In conclusion, under 0.8 Qdes, the root clearance radius had no significant effect on the hydraulic performance of the axial flow pump device, but under 1.0 Qdes and 1.2 Qdes, the hydraulic performance decreased significantly as the root clearance radius increased. This was consistent with the test results above.
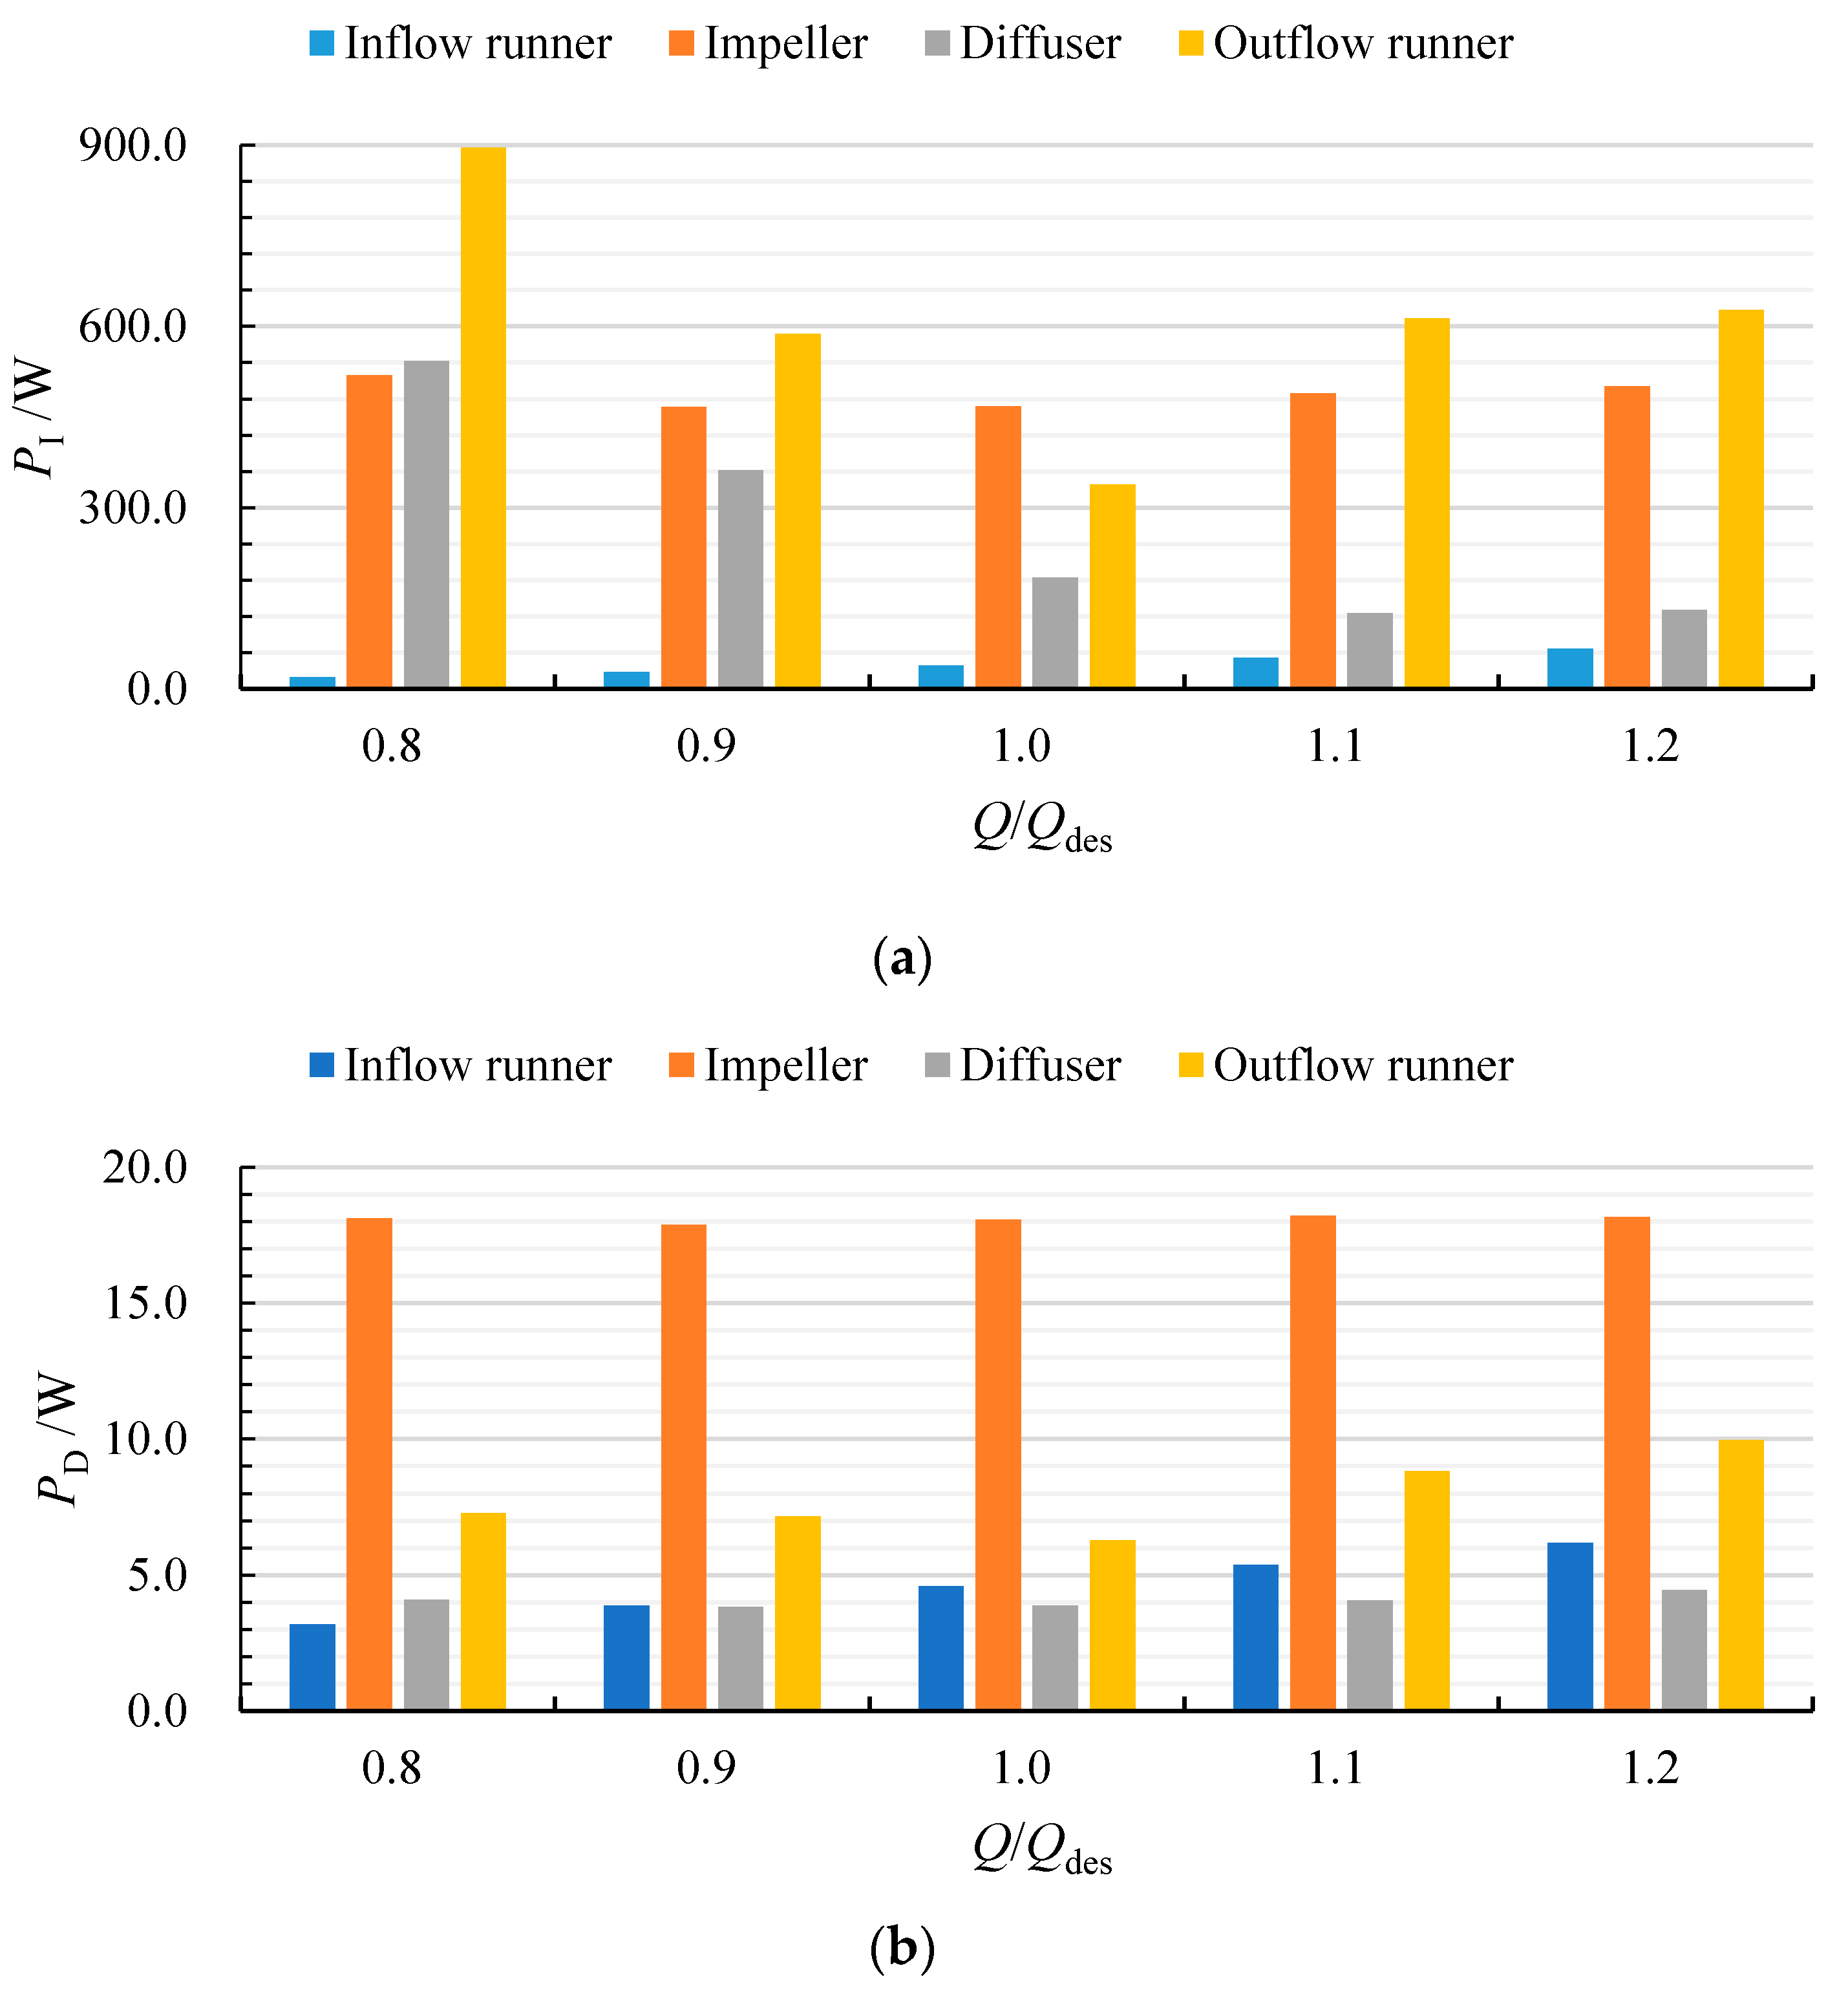
To illustrate why the hydraulic performance decreased with increasing root clearance radius, the entropy production theory was applied to the unsteady calculated results to analyze the additional energy losses caused by leakage flow in root clearance. Firstly, each hydraulic component’s overall dissipation without root clearance under different flow rates was shown in Figure 8. Figure 8a shows the distribution of overall indirect dissipation PI. Due to the small rotational kinetic energy inside the inflow runner, the PI of this component was much lower than that of other hydraulic components. In addition, the PI of impeller and outflow runner was minimal near the design condition, and that of diffuser decreased with flow rate was increasing. Figure 8b shows the distribution of overall direct dissipation PD. As shown in the figure, the PD of the impeller was significantly higher than that of other hydraulic components, the effect of the flow rate had little influence on the PD. Compared with PI, the PD was so small that could be ignored, so the following section only analyzed the distribution of PI in axial flow pump.
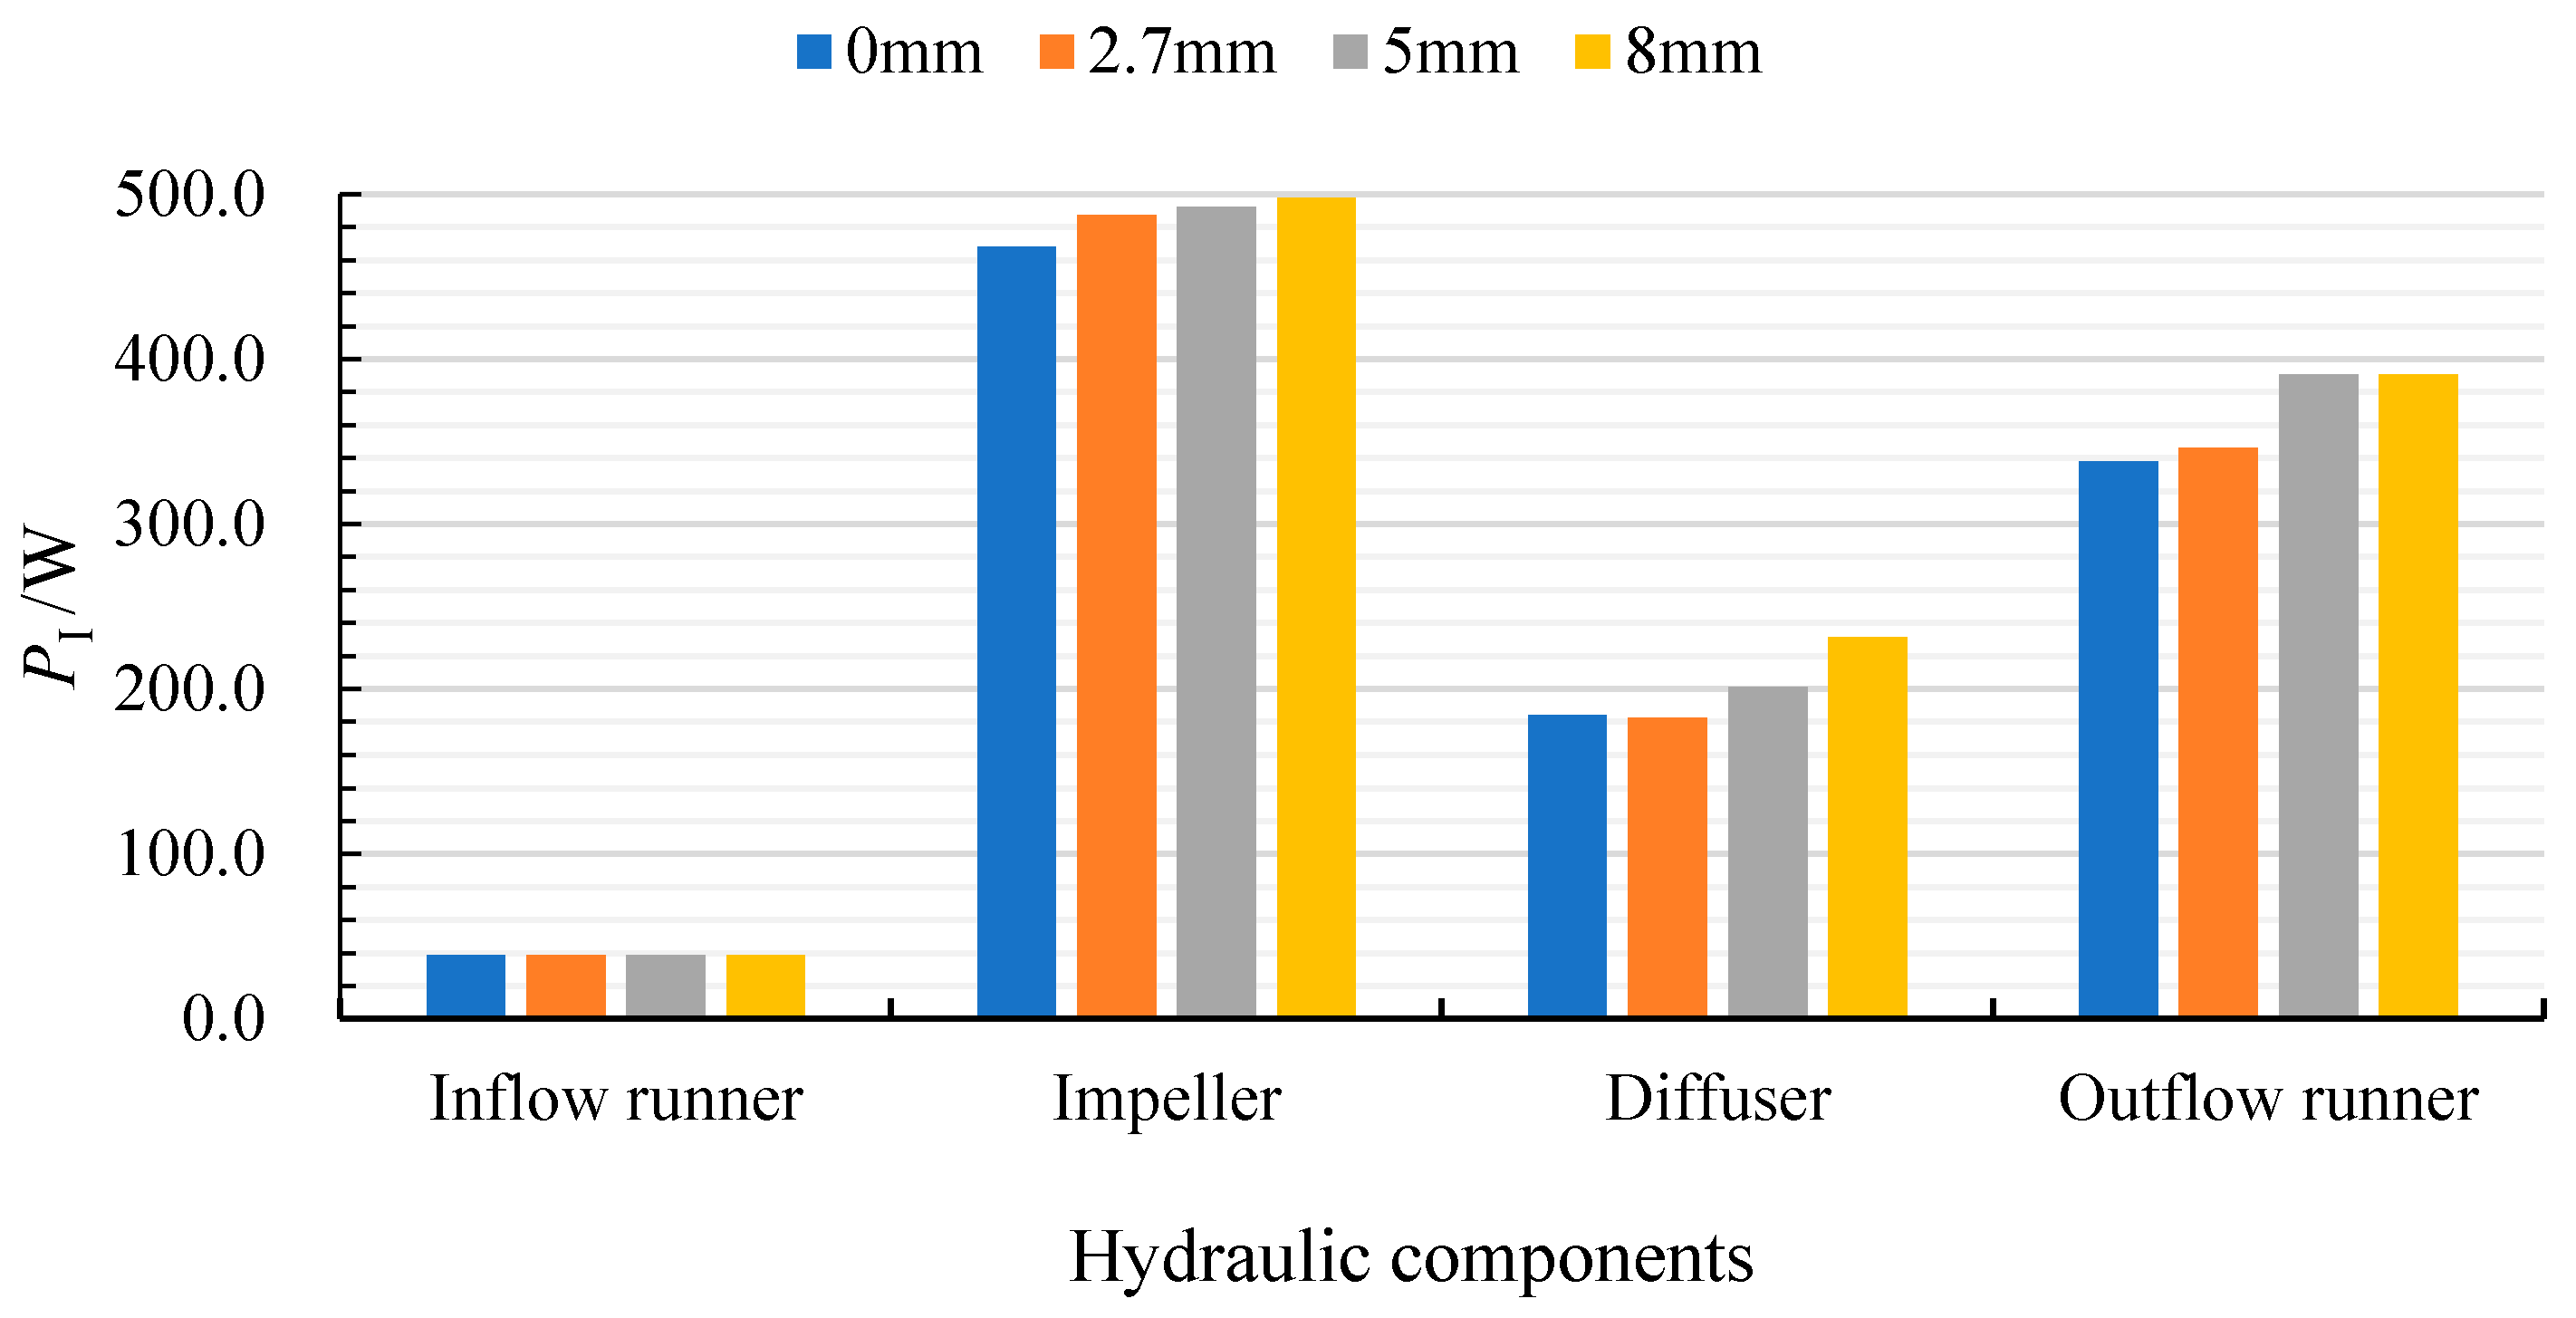
Figure 9 shows the PI of four hydraulic components with four root clearance radii at 1.0 Qdes. As shown in the figure, the PI of each hydraulic component from high to low is as follows: impeller, outflow runner, diffuser, and inflow runner. The effect of root clearance radius on PI in inflow runner was not obvious, and that of other hydraulic components increased with root clearance radius increasing, which explained why the hydraulic performance decreased with increasing root clearance radius. In addition, the maximum increases in PI in the impeller, diffuser, and outflow runner caused by the increase of root clearance radius were 3%, 5%, and 8%, respectively.
4.2. Analysis of Inner Flow Dissipation
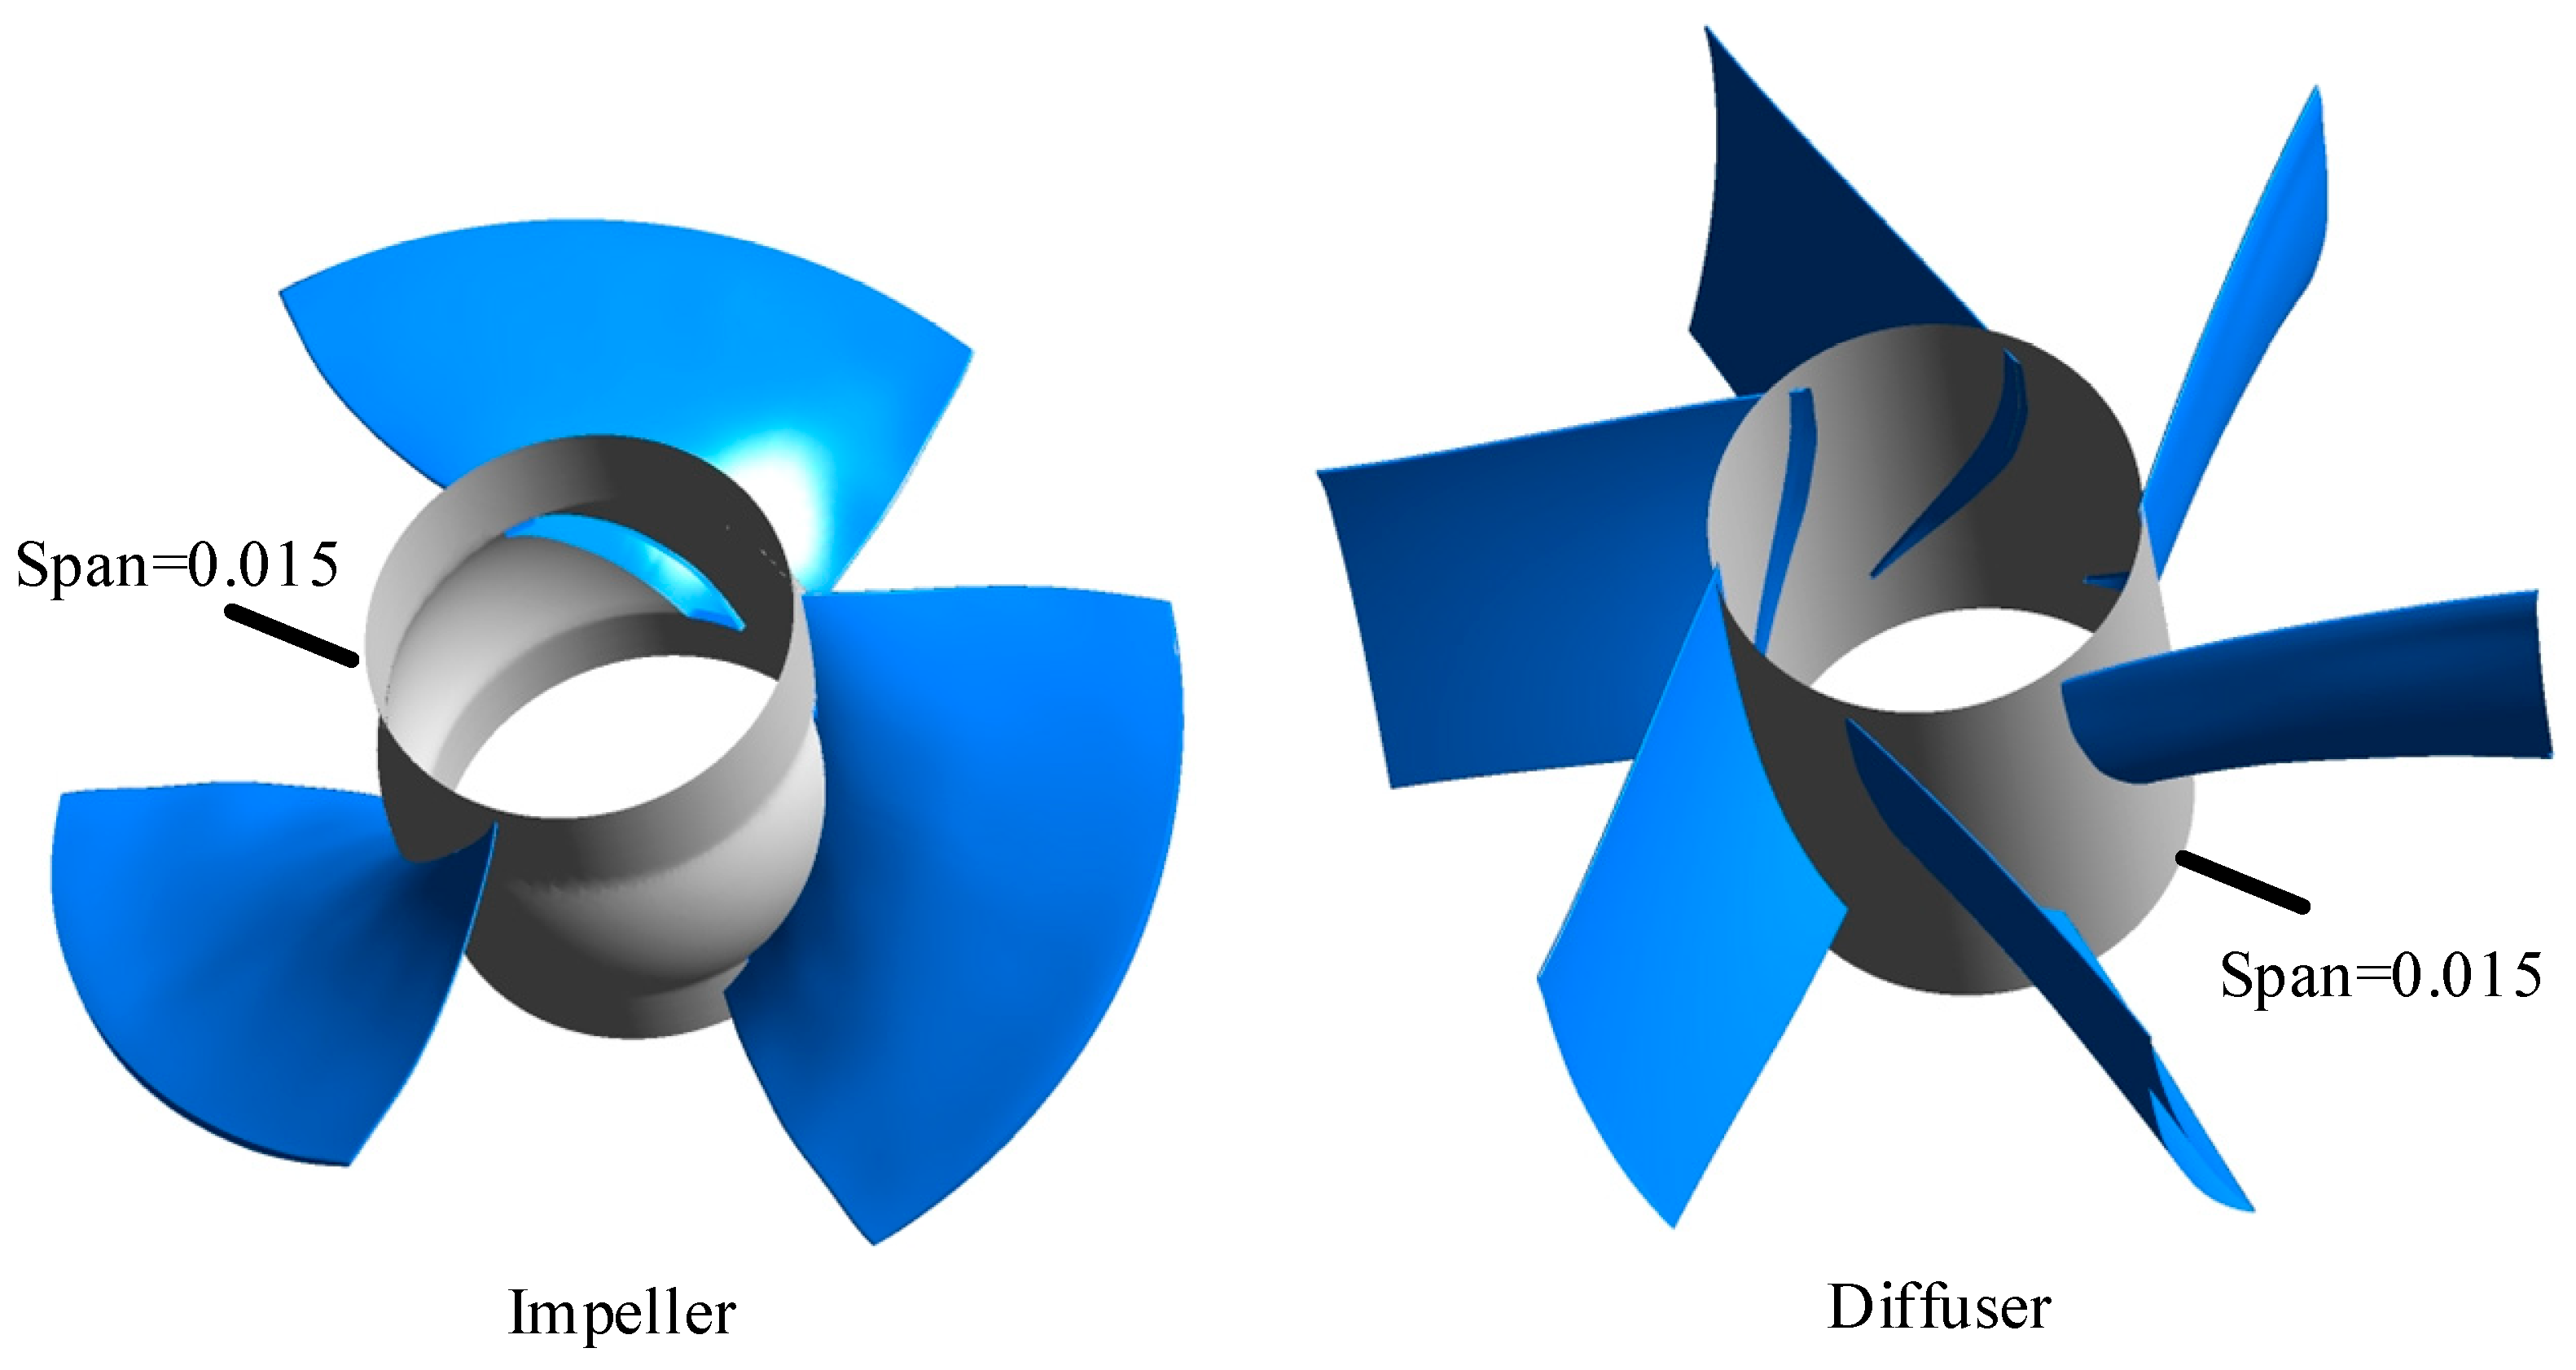
To understand the reason for the rise in overall dissipation with increasing root clearance radius, the internal velocity distribution and indirect dissipation rate within the impeller passage and diffuser passage were analyzed under different root clearance radii. Figure 10 shows the cylindrical cross-section for the impeller and diffuser at a specific blade height position Span, which is defined as follow:
where, r is the calculated ring radius, and are the the hub radius and radius of the impeller rim.
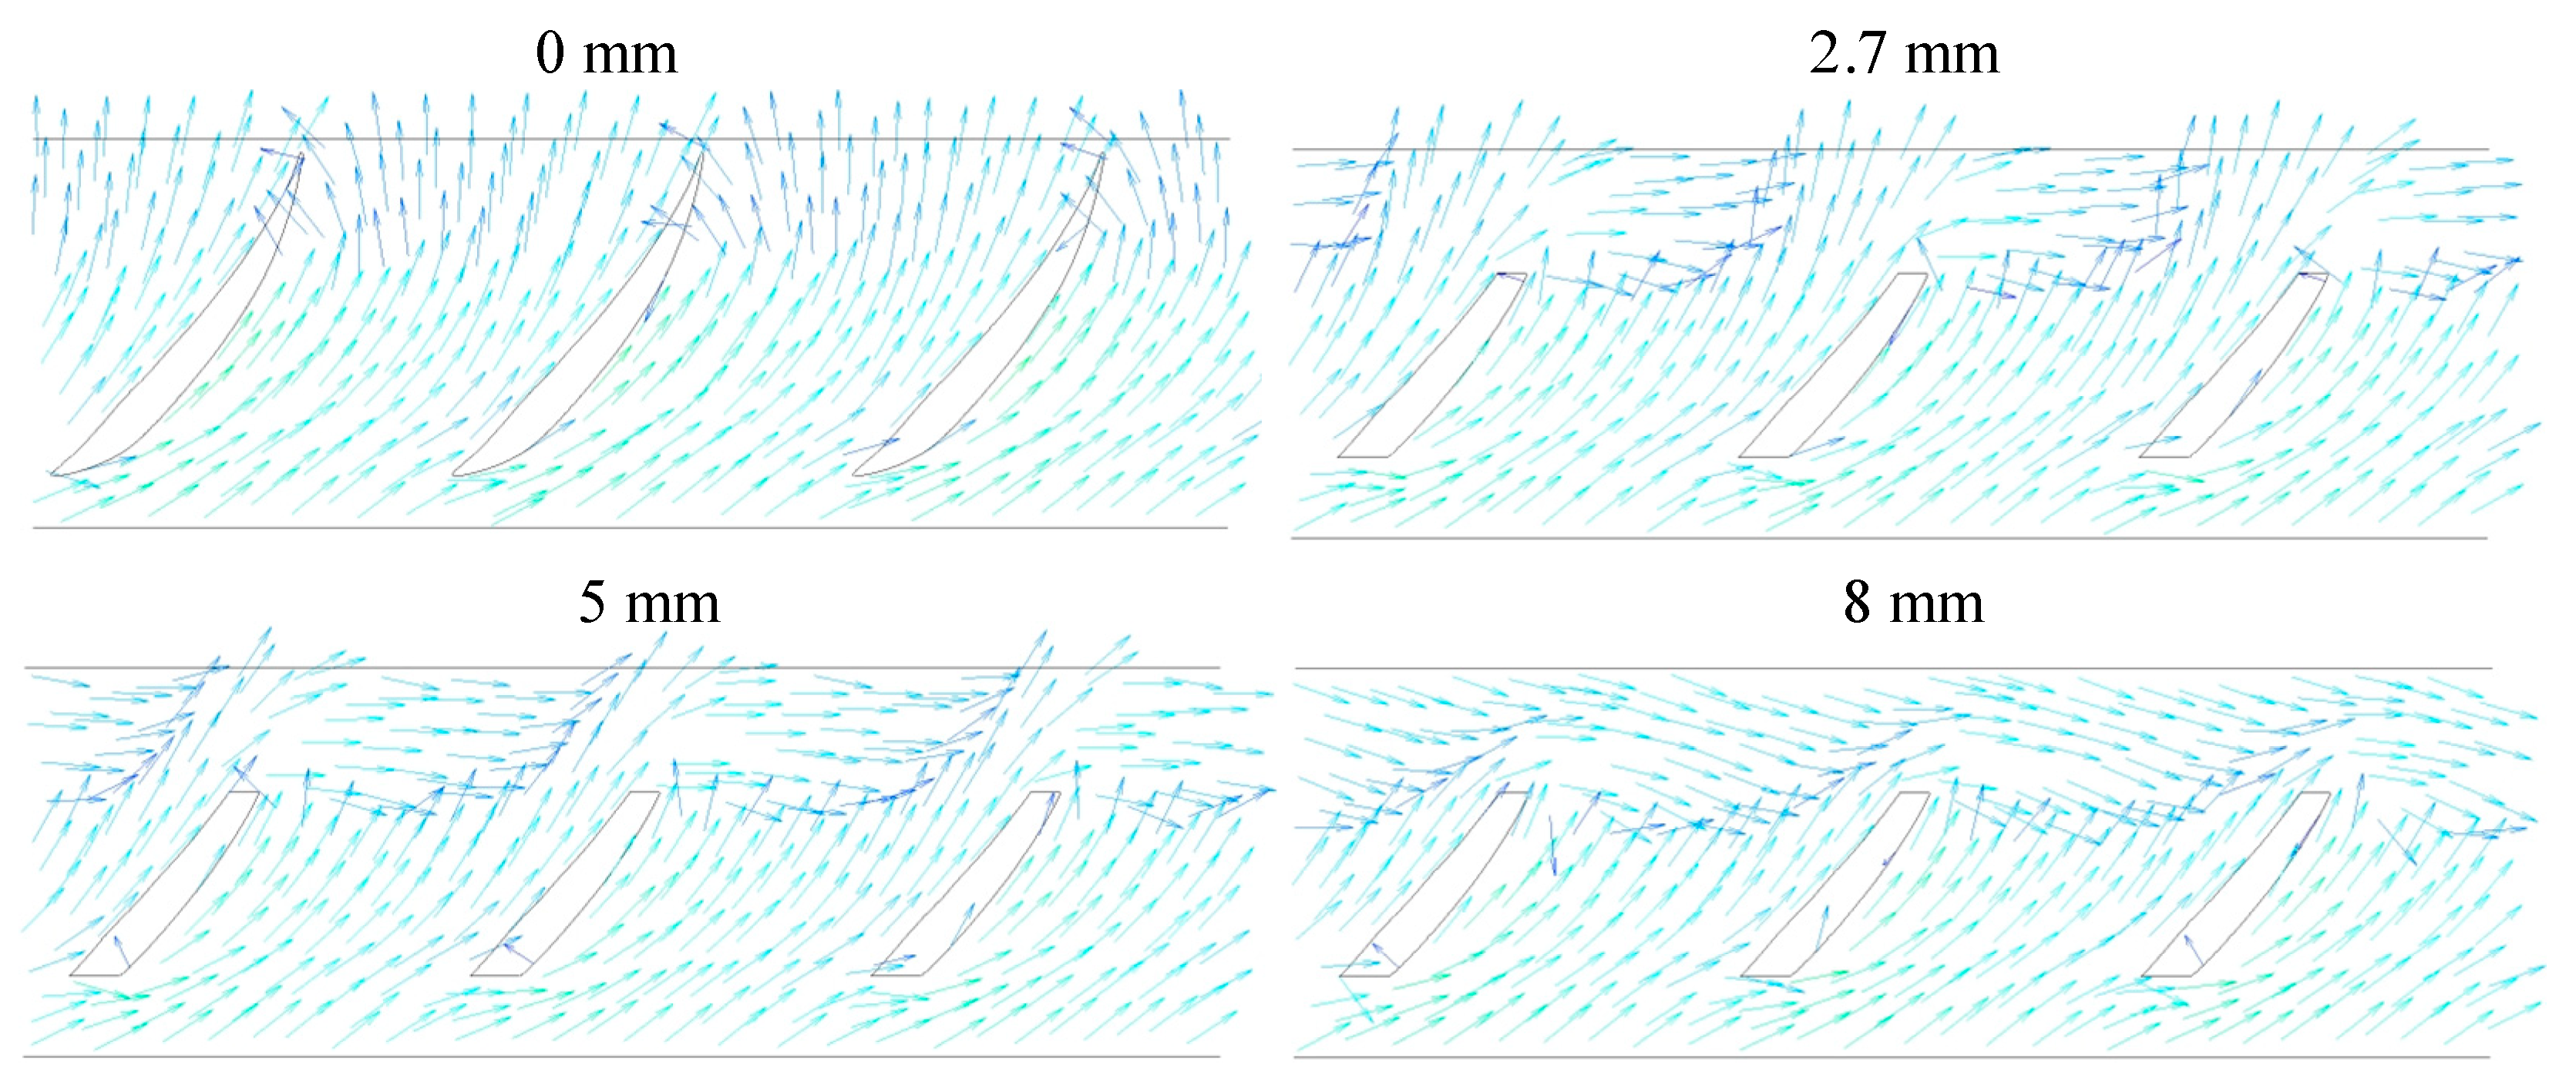
Figure 11 shows the distribution of the relative velocity vector within the cross-section of the impeller passage with Span = 0.015 at 1.0 Qdes. In the impeller passage without root clearance, the inlet angle matched the inlet edge of the blade better, and the fluid moved closer to the blade profile. There was only a small range of backflow at the trailing edge of the blade. The pressure difference between the pressure side and the blade’s suction side causes the leakage flow to appear in the blade root clearance. In addition, the collision between the root leakage flow and the main flow leads to the deviation of the flow direction near the impeller inlet and outlet to the circumferential direction. The degree of deviation for the flow direction increased with the increasing root clearance radius.
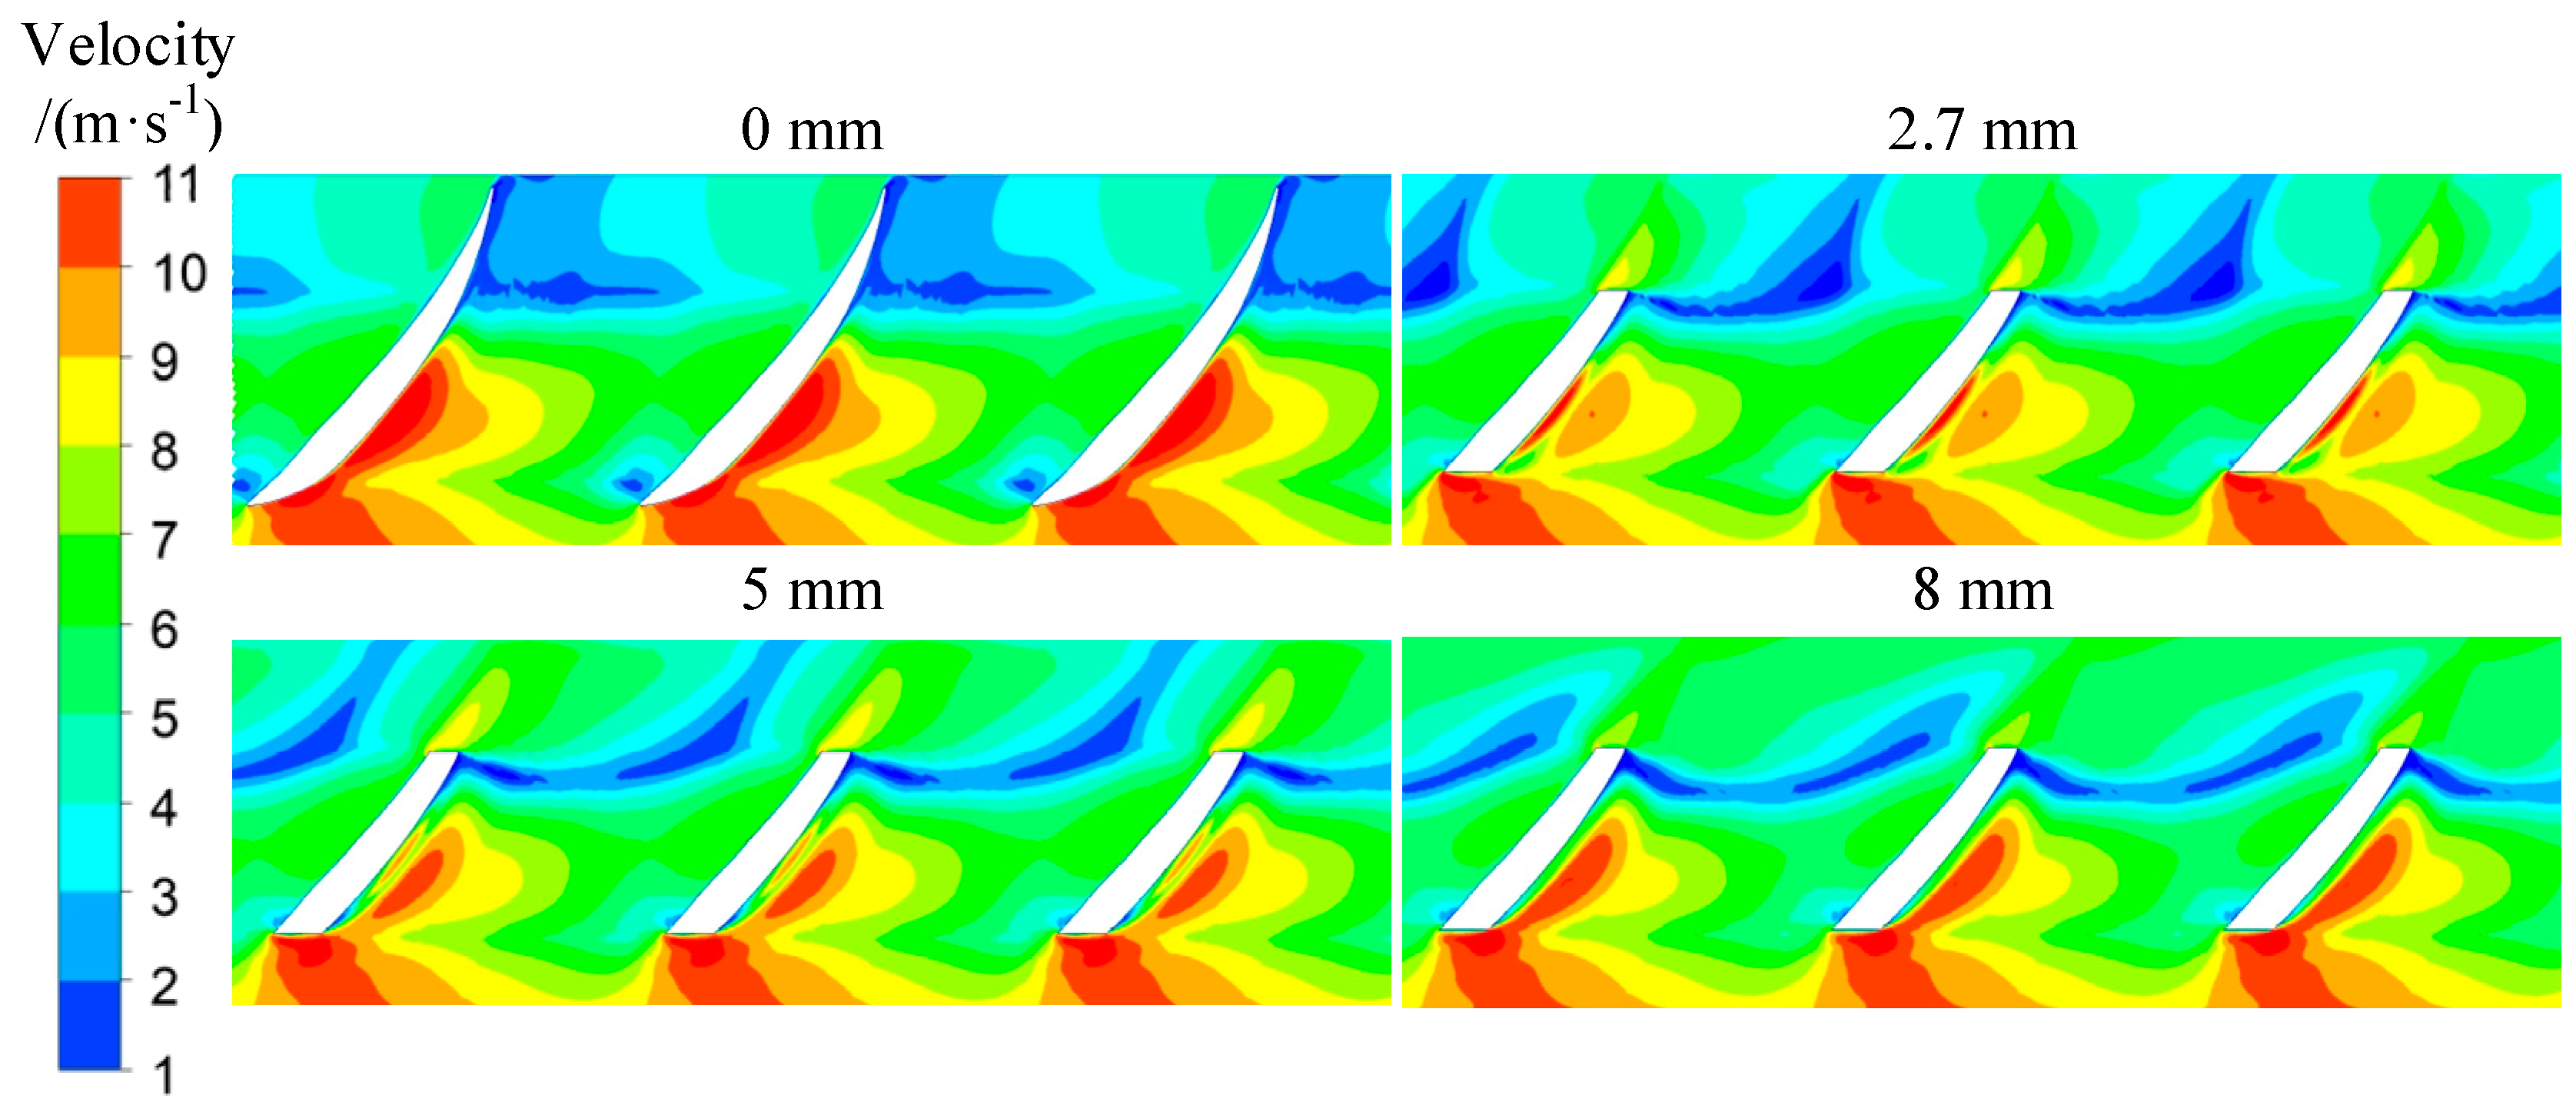
Figure 12 shows the relative velocity distribution in the cross-section of the impeller passage at Span = 0.015 under 1.0 Qdes. In the impeller passage without root clearance, the low velocity caused by the wake vortex can be found near the trailing edge of the suction side, and the high velocity was obtained near the leading edge of the blade suction side. In the passage with root clearance, the low velocity near the trailing edge of the suction side was offset horizontally, causing leakage flow, thereby reducing the high-velocity area near the trailing edge of the suction side.
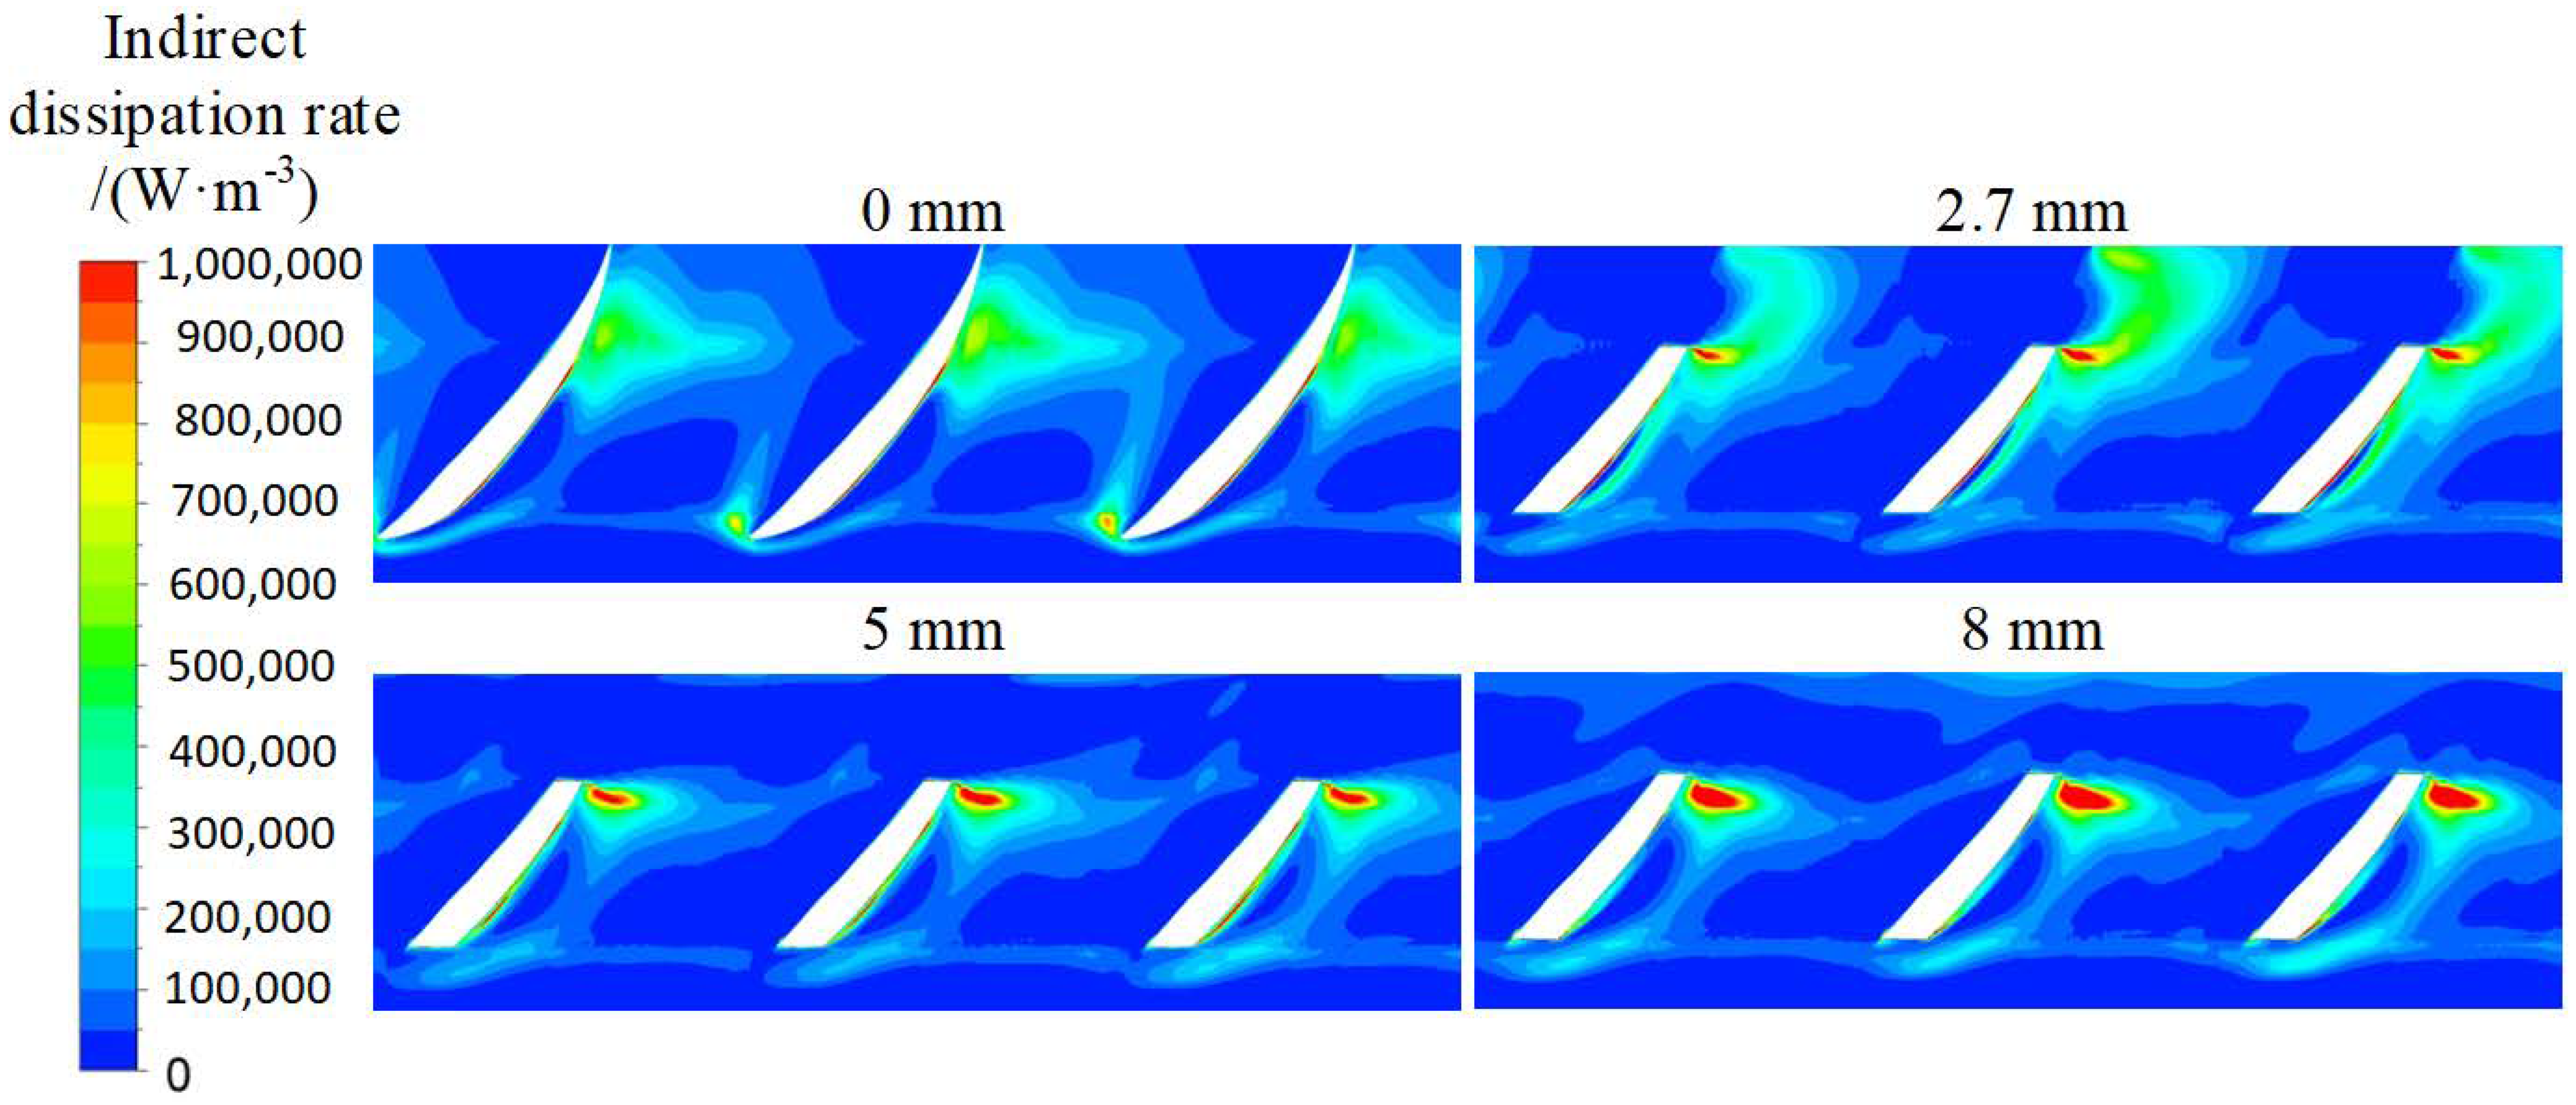
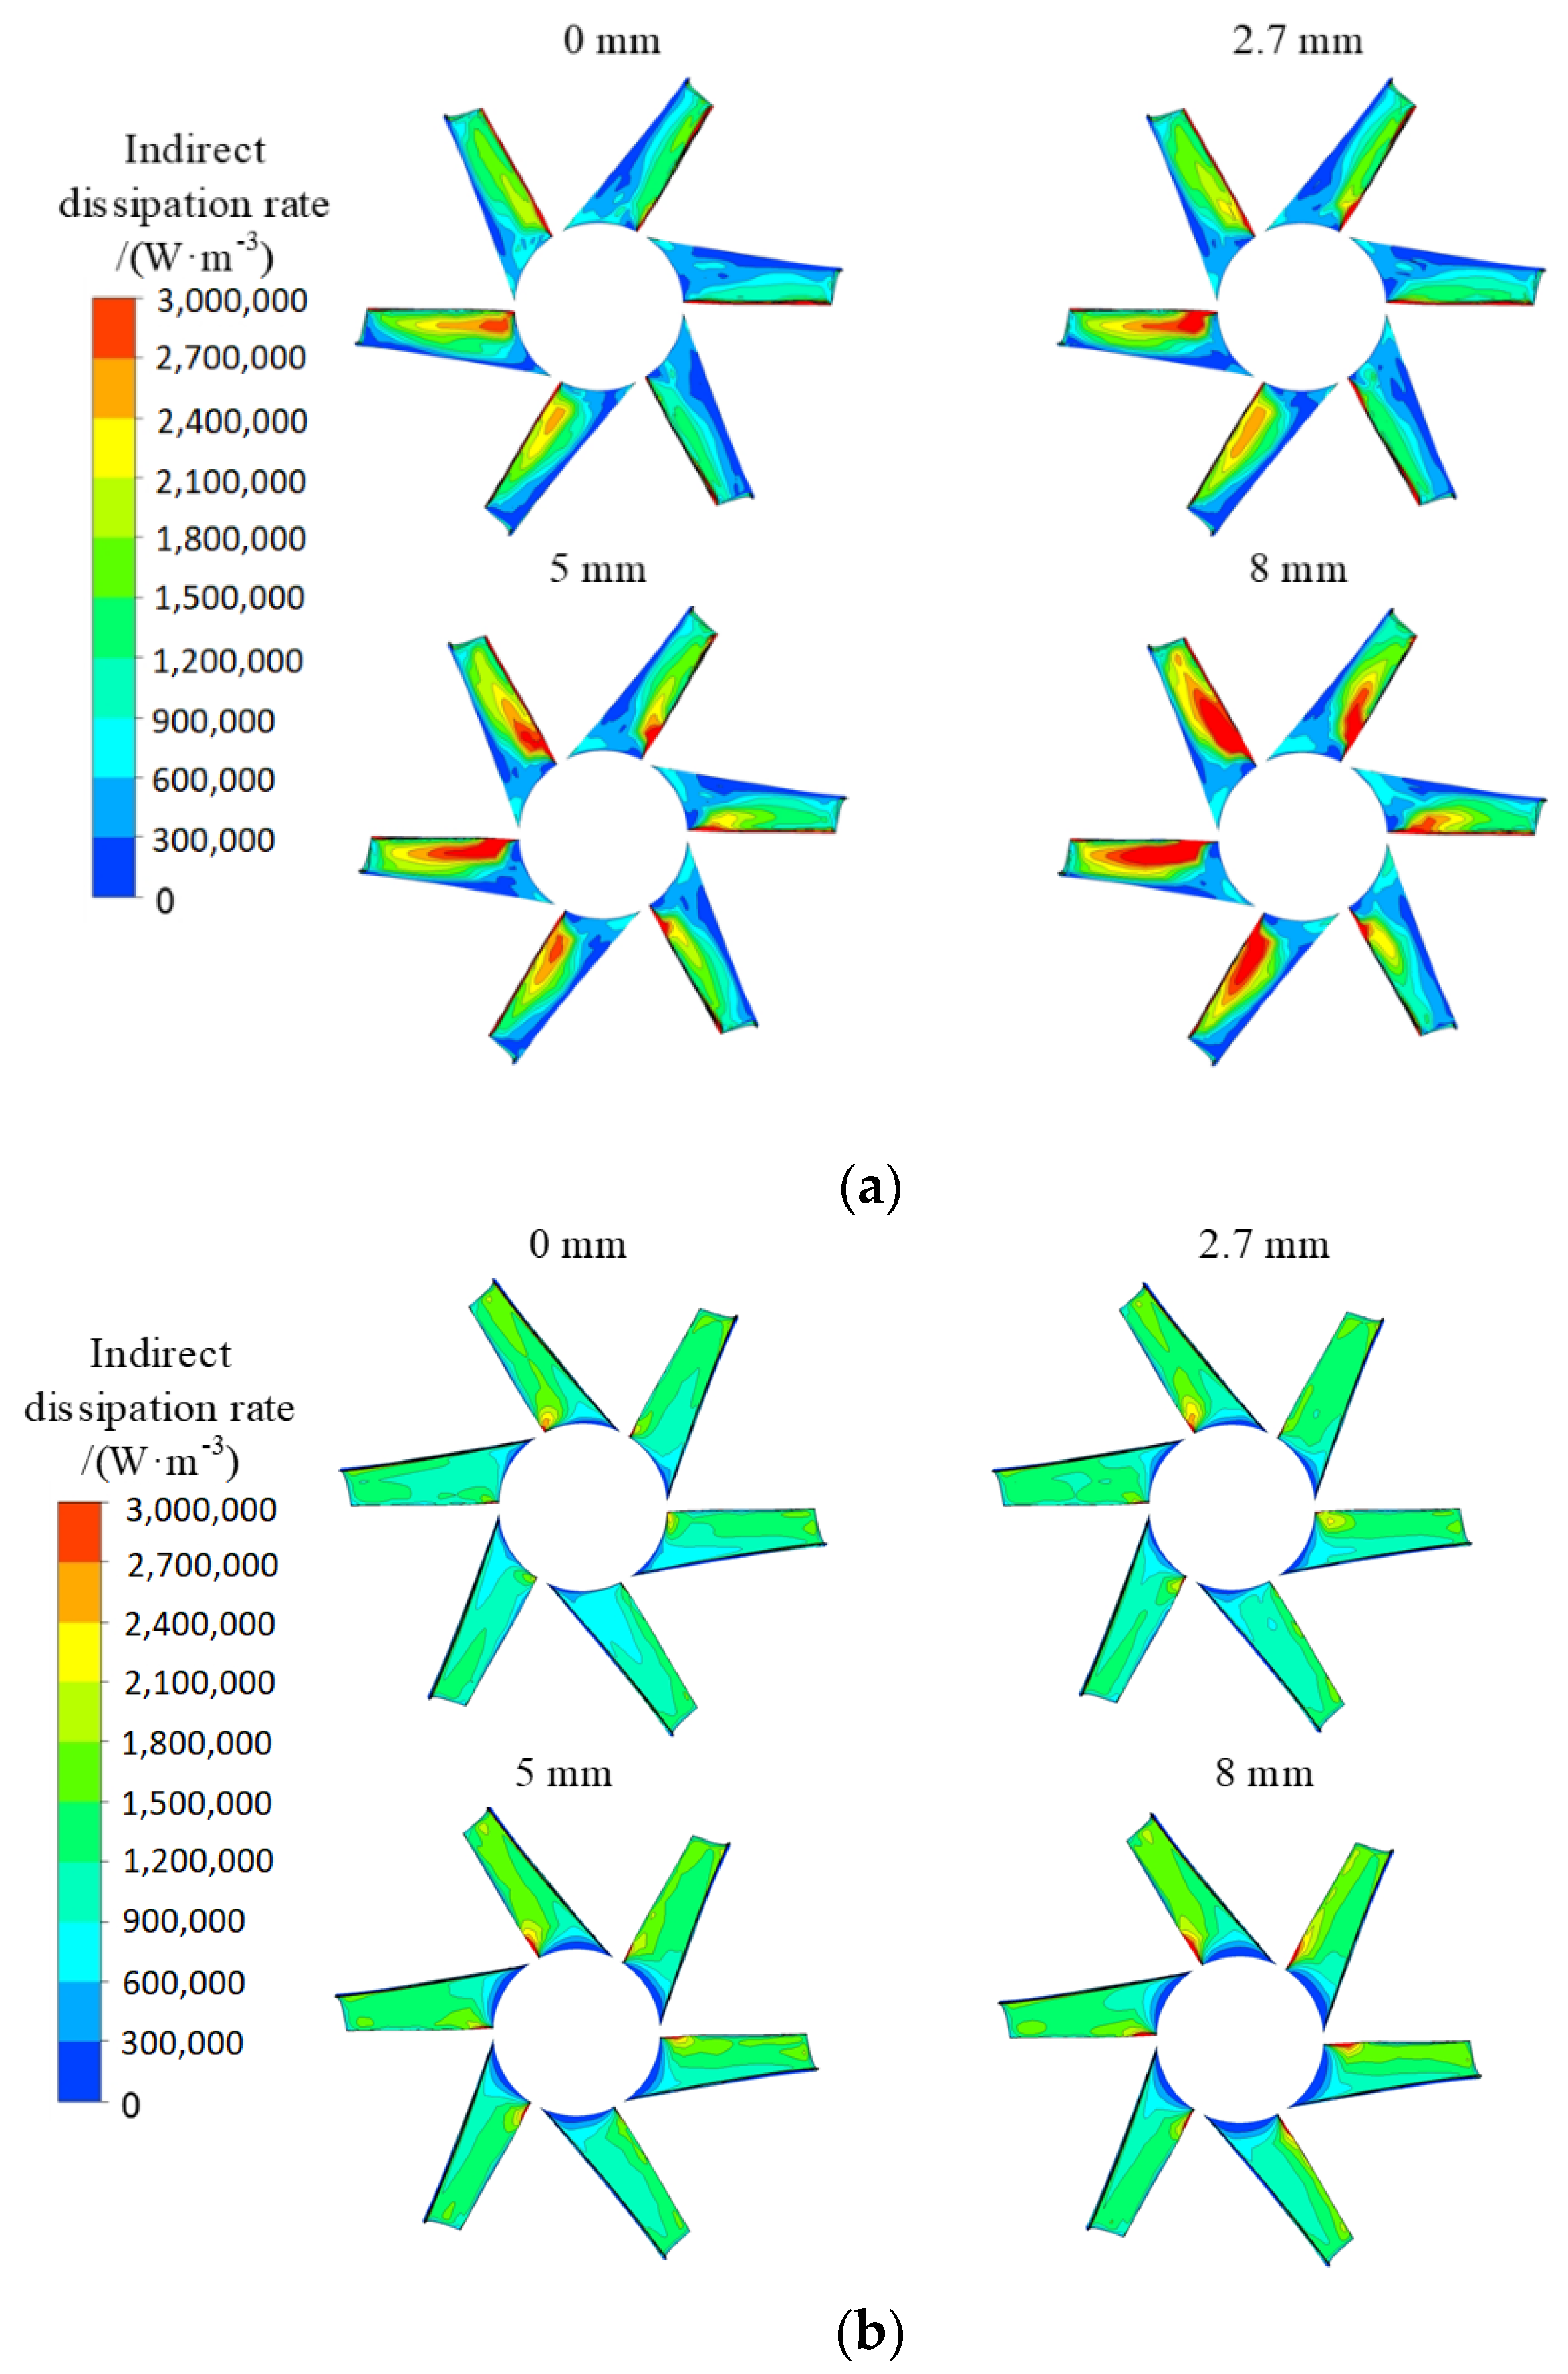
Figure 13 shows the distribution of indirect dissipation rate in the cross-section of impeller passage at Span = 0.015 under 1.0 Qdes. In impeller passage without root clearance, the dissipation rate near the blade’s trailing edge was higher due to the wake vortex, but there was no obvious high dissipation region. When the blade root clearance appeared in the impeller passage, a high dissipation region appeared near the trailing edge of the blade due to the impact of the leakage flow and the mainstream flow. The larger the clearance radius is, the greater the leakage velocity, resulting in a more obvious flow instability. Therefore, the area of the high dissipation region near the trailing edge of the blade increases with increasing root clearance radius.
The standard deviation of relative velocity represents the fluctuation and stability of velocity in the last period. It was defined as:
where Vi is the velocity at every time step; . is the average velocity in a single rotation cycle; Vsd is the standard deviation velocity in a single rotation cycle; N represents the sampling times of velocity data in a single rotation cycle.
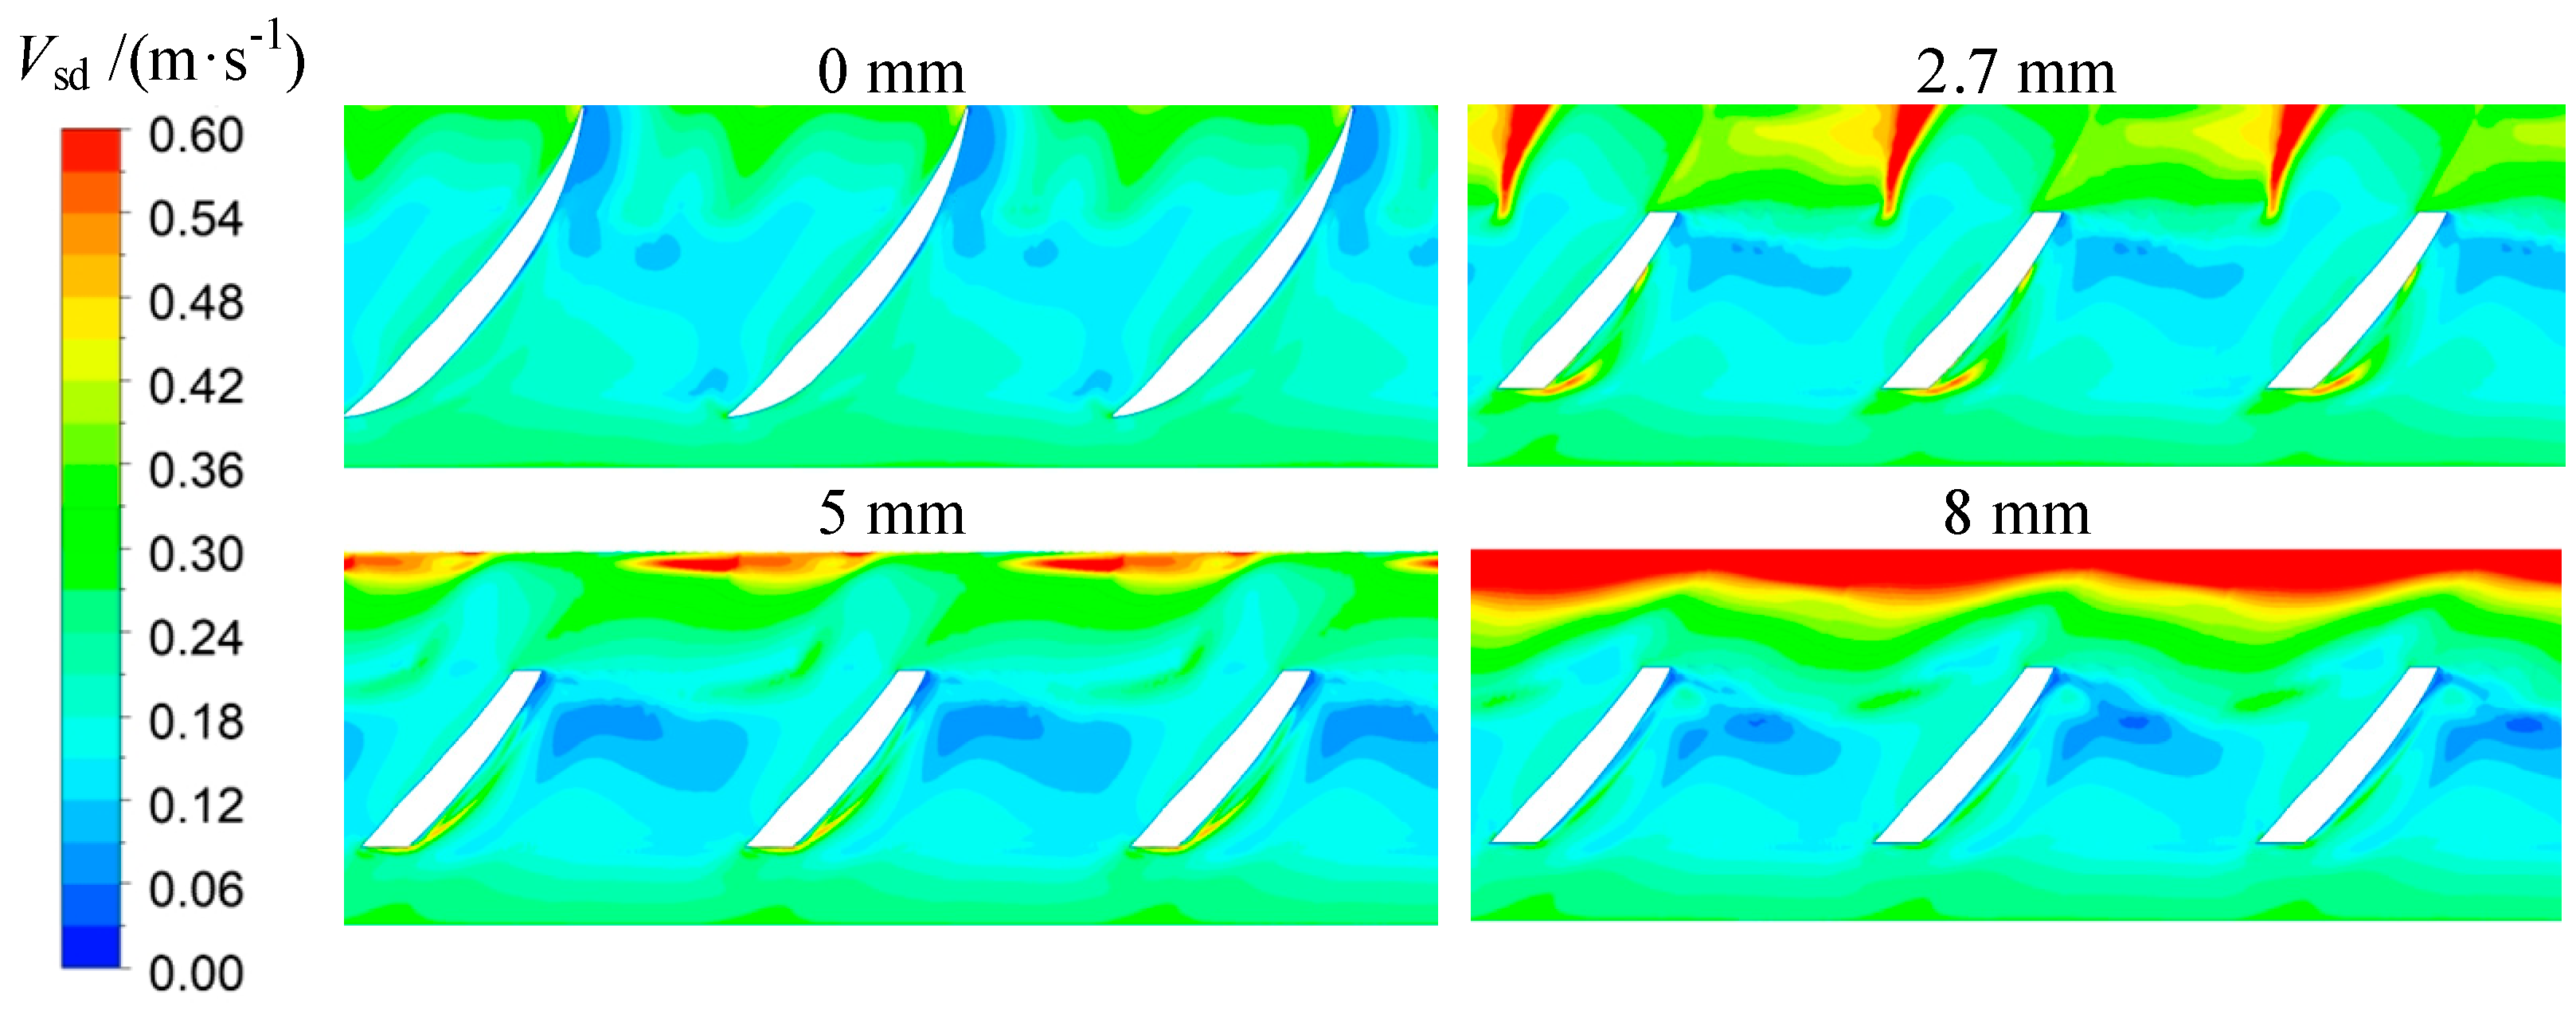
Figure 14 shows the standard deviation of the velocity distribution within the impeller passage with four root clearance radii at Span = 0.015. In the impeller passage without root clearance, the internal flow field was relatively stable, and there was no high fluctuation intensity of velocity. In the impeller passage with 2.7 mm root clearance, the velocity fluctuation near the impeller outlet became stronger due to the influence of leakage flow in root clearance. When the root clearance continued to increase, the velocity fluctuation intensity in the blade passage decreased gradually, while the velocity fluctuation intensity at the impeller outlet increased. This result shows that the leakage flow in root clearance leads to the enhancement of rotor-stator interaction between the impeller and diffuser and worsens the diffuser’s inflow condition.
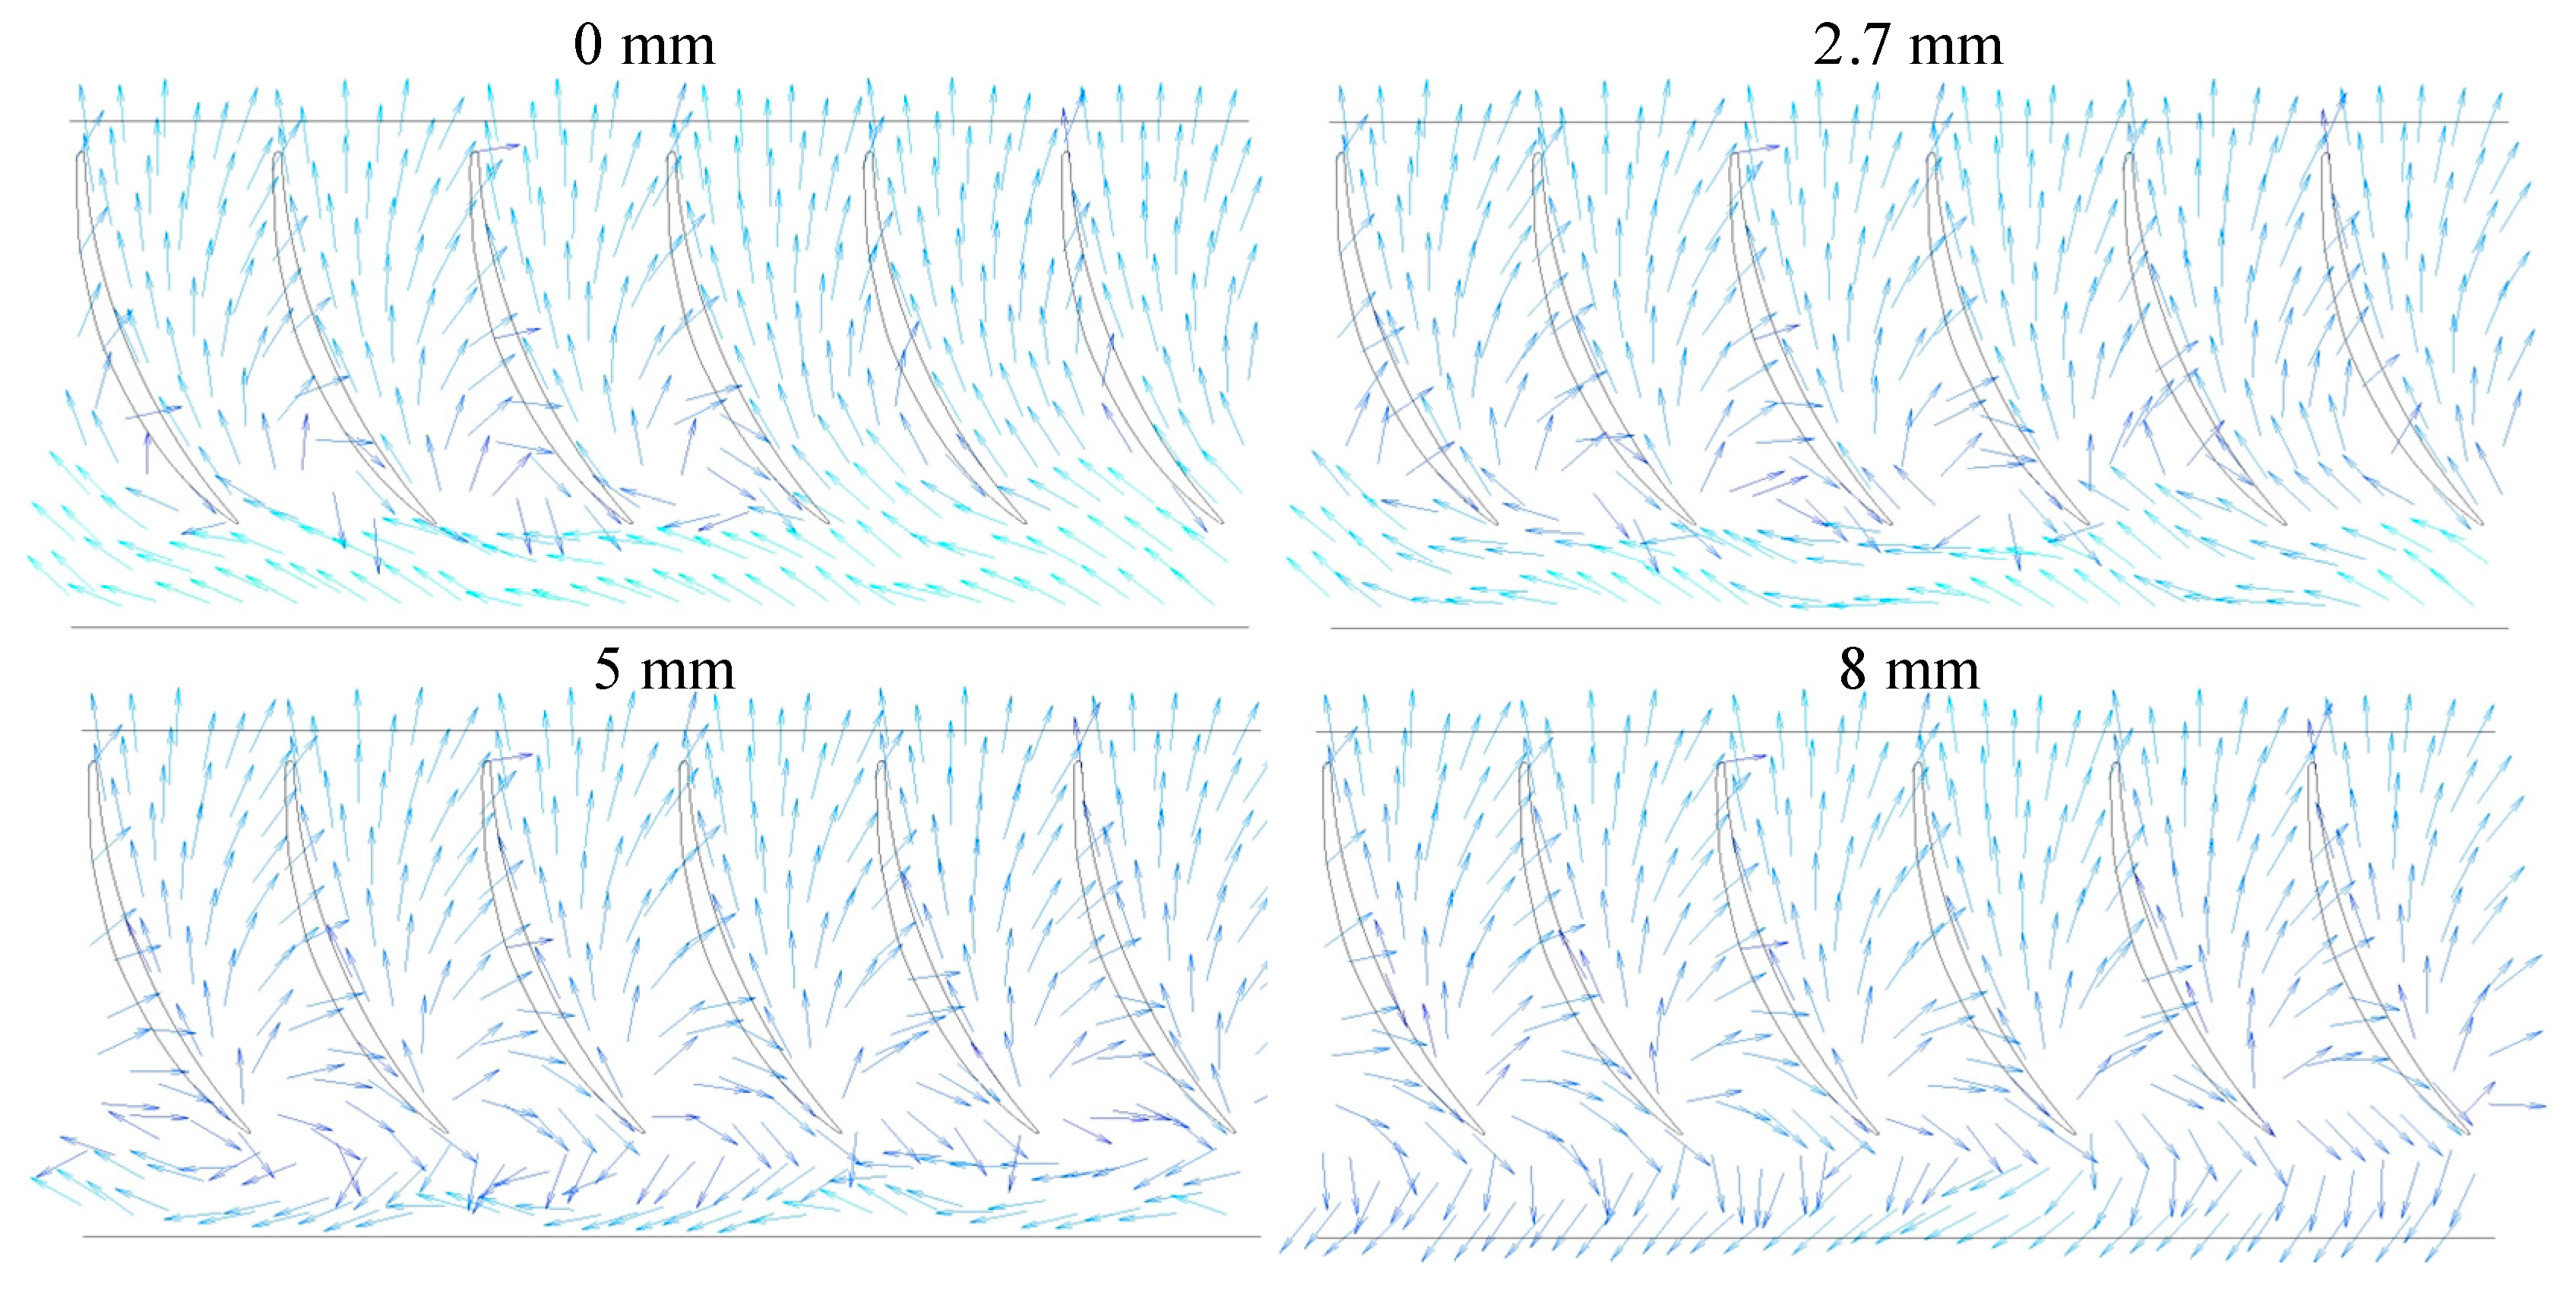
Figure 15 shows the distribution of the velocity vectors in the guide vane passage with four root clearance radii. After passing through the impeller, the fluid generated a large amount of rotational kinetic energy, which caused some flow separation near the leading edge of the guide vane since the inlet angle of the guide vane was large. Furthermore, the inflow direction was obviously affected by the clearance radius of the blade root. The guide vane’s inlet angle gradually deviated to the horizontal direction with increasing blade root clearance radius, which could affect the flow of the fluid between the guide vanes. The flow pattern inside the guide vane was expected to deteriorate with the increase of the root clearance radius, particularly at 5 and 8 mm, where an obvious backflow phenomenon at the inlet of the guide vane occurs.
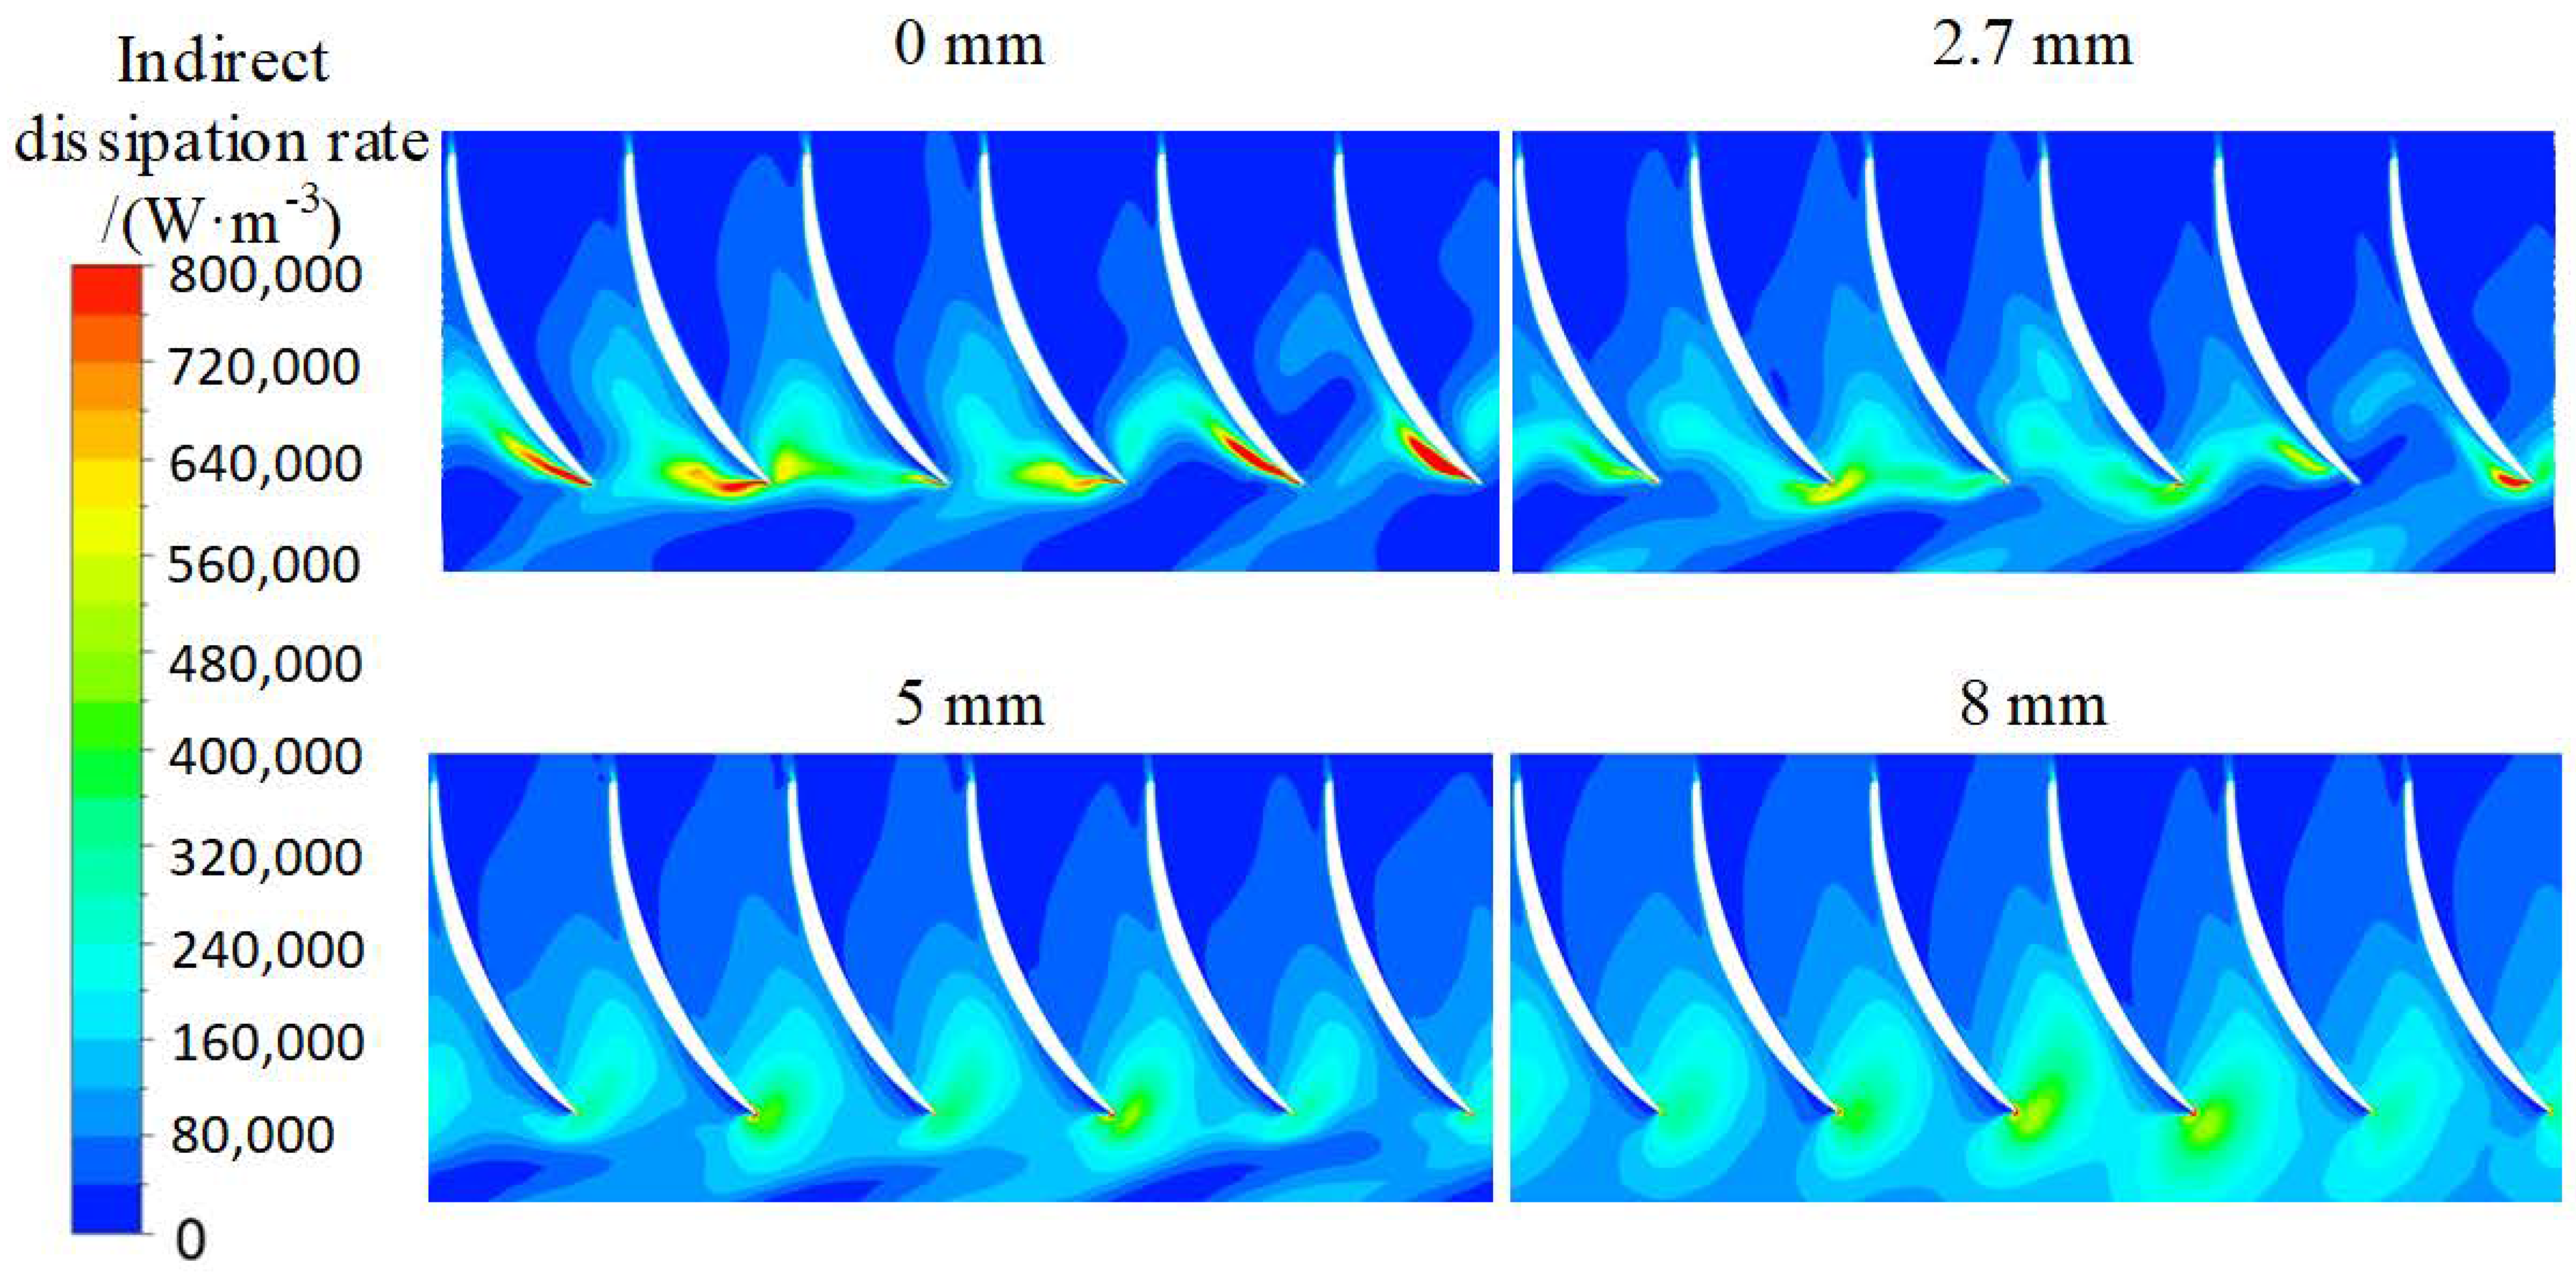
Figure 16 shows the distribution of indirect dissipation rate at Span = 0.015 in the diffuser passage at 1.0 Qdes. When there is no root clearance in the diffuser passage, a high indirect dissipation rate occurred at the leading edge of the suction side as a result of flow separation. The backflow near the diffuser inlet could hinder the inlet flow of the guide vane into the blade passage, and the recirculation area near the diffuser inlet gradually increases with increasing root clearance. So, the indirect dissipation rate near the leading edge of the suction side and diffuser inlet decreased and increased with root clearance increasing, respectively.
Figure 17 shows the distribution of indirect dissipation rate on the surface of the diffuser blades at 1.0 Qdes. At the diffuser inlet, the blade surface’s indirect dissipation rate gradually decreased from the leading edge of the blade towards the trailing edge, as shown in Figure 17a. Particularly near the hub, the indirect dissipation rate of the blade surface was very high. Since the leakage flow in the blade root clearance would worsen the inflow condition of the guide vane, thereby affecting the stability of the flow field in the guide vane channel, the area of the high dissipation zone near the hub is increased with increasing blade root clearance radius. For the diffuser outlet, the blade surface’s overall indirect dissipation rate was low, and the indirect dissipation rate gradually decreased from the leading edge to the trailing edge, as shown in Figure 17b. In addition, the indirect dissipation rate near the guide vane hub was also low, and only a small area of high dissipation rate existed near the leading edge.
5. Conclusions
In this paper, the unsteady internal flow state of the axial flow pump under four root clearance radii (0 mm, 2.7 mm, 5 mm, 8 mm) was calculated to establish the influence of root clearance radius on hydraulic performance. The external characteristics test of an axial flow pump with root clearance radii 0 mm and 2.7 mm was completed to verify the numerical simulation method’s reliability. In addition, the entropy production theory was adopted to determine the turbulence dissipation distribution within the flow domain in the axial flow pump. These conclusions were drawn to provide a reference for mixed flow pumps with similar specific speed:
In the axial flow pump, both the hydraulic efficiency and head decreased with root clearance radius increasing, and the decline magnitude rose with increasing flow rate. At 0.8 Qdes, the effect of root clearance on hydraulic efficiency and the head was not obvious. With an increase in flow rate, the effect of root clearance became obvious. The maximum reductions in the head and hydraulic efficiency were 15.5% and 6.8%, with the root clearance of 8 mm at 1.2 Qdes, respectively.
- (1)
- The overall direct dissipation PD of each hydraulic component was negligible, compared with overall indirect dissipation PI. In addition, the PI of the inflow runner was much lower than that of the impeller, outflow runner, and diffuser. The PI of outflow runner decreased with decreasing flow rate, whereas that of impeller and diffuser reach a minimum value at 0.9 Qdes and 1.1 Qdes, respectively.
- (2)
- Driven by the pressure difference on the blade surface, the leakage flow in the root clearance led to the distortion of the flow pattern in the impeller, and the impeller-diffuser interaction became stronger. The indirect dissipation rate near the trailing edge of the blade and the PI of the impeller increased with increasing root clearance.
- (3)
- The flow pattern inside the diffuser was unsteady due to deterioration of inflow conditions caused by leakage flow from the root clearance. Therefore, both the indirect dissipation rate at the leading edge of the blade and near inlet and PI of the diffuser increased with increasing root clearance radius.
- (4)
- The hydraulic losses increased with increasing root clearance. However, if the root clearance is too small, the range of blade adjustment will be reduced, thereby narrowing the high-efficiency region range. The research results can reference the axial flow pump’s root clearance design and help designers find a balance point between the range of blade adjustment and hydraulic performance.
Author Contributions
Conceptualization, Y.L., and F.M.; data curation, Y.L., and Y.Z.; methodology, Y.L., and Y.Z.; project administration, Y.L., and F.M.; supervision, Y.L.; validation, F.M.; Writing—original draft, Y.L.; Writing—review & editing, Y.Z., and M.K.O. All authors have read and agreed to the published version of the manuscript.
Funding
This research was supported by the Science and Technology Plan of Wuhan (Grant No.2018060403011350).
Acknowledgments
The authors sincerely thank the Science and Technology Plan of Wuhan.
Conflicts of Interest
The authors declare no conflict of interest.
Nomenclature
| (m3/s) | Flow rate |
| (m3/s) | Design flow rate |
| (m) | Head of axial flow pump device |
| (m3/s) | Design head of axial flow pump device |
| (%) | Efficiency of axial flow pump device |
| (%) | Design efficiency of axial flow pump device |
| (r/min) | Rotating speed |
| (°) | Specific speed of axial flow pump device |
| (m/s) | Standard deviation of relative velocity |
| T (K) | Temperature |
| Pm (W) | Motor input power |
| (kg/m3) | Water density |
| Dissipation rate of turbulence energy | |
| (m/s) | Average velocity component in x direction |
| (m/s) | Average velocity component in y direction |
| (m/s) | Average velocity component in z direction |
| (m/s) | Velocity fluctuation component in x direction |
| (m/s) | Velocity fluctuation component in y direction |
| (m/s) | Velocity fluctuation component in z direction |
| S [J/(K·kg)] | Specific entropy |
| PD (W) | Direct power loss |
| PI (W) | Indirect power loss |
| Rt (mm) | Root clearance radius |
| (m/s) | Average velocity of the node in a single rotation cycle |
| rh (mm) | Hub radius |
| rt (mm) | Impeller rim radius |
| 3D | Three-Dimensional |
| RANS | Reynolds Averaged Navier–Stokes |
| CFD | Computational Fluid Dynamics |
| EXP | Experiment |
References
- Yang, F.; Chen, S.; Liu, C.; Wang, M.; Zhou, J. Influence of division pier on pressure fluctuation and internal flow pattern in outlet conduit of axial-flow pumping system. Trans. Chin. Soc. Agric. Mach. 2018, 49, 212–217. (In Chinese) [Google Scholar]
- Song, X.; Liu, C.; Luo, C. Influence of inlet vortex on pressure pulsation in axial flow pump unit. Trans. Chin. Soc. Agric. Mach. 2018, 49, 212–217. (In Chinese) [Google Scholar]
- Li, C.; Ke, T.; Zhang, J.; Zhang, H.; Huang, W. Experimental and Numerical Investigation of the Unsteady Tip Leakage Flow in Axial Compressor Cascade. J. Therm. Sci. 2013, 22, 103–110. [Google Scholar] [CrossRef]
- Storer, J.A.; Cumpsty, N.A. Tip leakage flow in axial compressors. J. Turbomach. 1991, 113, 252–259. [Google Scholar] [CrossRef]
- Xu, B.; Shen, X.; Zhang, D.; Zhang, W. Experimental and Numerical Investigation on the Tip Leakage Vortex Cavitation in an Axial Flow Pump with Different Tip Clearances. J. Fluids Eng. 2019, 7, 935. [Google Scholar] [CrossRef] [Green Version]
- Meng, F.; Li, Y.; Yuan, S. Effect of Hub Clearance on Hydraulic Performance in Bidirectional Axial-flow Pump. Trans. Chin. Soc. Agric. Mach. 2020, 51, 131–138. (In Chinese) [Google Scholar]
- Liu, Y.; Han, Y.; Tan, L.; Wang, Y. Blade rotation angle on energy performance and tip leakage vortex in a mixed flow pump as turbine at pump mode. Energy 2020, 206, 118084. [Google Scholar] [CrossRef]
- Liu, Y.; Tan, L. Theoretical Prediction Model of Tip Leakage Vortex in a Mixed Flow Pump with Tip Clearance. J. Fluids Eng. 2020, 142, 021203. [Google Scholar] [CrossRef]
- Zhang, D.; Shi, W.; Van Esch, B.B.; Shi, L.; Dubuisson, M. Numerical and experimental investigation of tip leakage vortex trajectory and dynamics in an axial flow pump. Comput. Fluids 2013, 112, 61–71. [Google Scholar] [CrossRef]
- Murayama, M.; Yoshida, Y.; Tsujimoto, Y. Unsteady Tip Leakage Vortex Cavitation Originating From the Tip Clearance of an Oscillating Hydrofoil. J. Fluids Eng. 2006, 128, 421–429. [Google Scholar] [CrossRef]
- Mailach, R.; Lehmann, I.; Vogeler, K. Rotating Instabilities in an Axial Compressor Originating From the Fluctuating Blade Tip Vortex. J. Turbomach. 2001, 123, 453–460. [Google Scholar] [CrossRef]
- Khalid, S.A.; Khalsa, A.S.; Waitz, I.A.; Tan, C.S.; Greitzer, E.M.; Cumpsty, N.A.; Adamczyk, J.J.; Marble, F.E. Endwall Blockage in Axial Compressors. J. Turbomach. 1999, 121, 499. [Google Scholar] [CrossRef]
- Hsiao, C.T.; Chahine, G.L. Scaling of Tip Vortex Cavitation Inception Noise With a Bubble Dynamics Model Accounting for Nuclei Size Distribution. J. Fluids Eng. 2005, 127, 55–65. [Google Scholar] [CrossRef]
- Laborde, R.; Chantrel, P.; Mory, M. Tip Clearance and Tip Vortex Cavitation in an Axial Flow Pump. J. Fluids Eng. 1997, 119, 680–685. [Google Scholar] [CrossRef]
- Farrell, K.J.; Billet, M.L. A Correlation of Leakage Vortex Cavitation in Axial-Flow Pumps. J. Fluids Eng. 1994, 116, 551–557. [Google Scholar] [CrossRef]
- Zhang, D.; Shi, L.; Zhao, R.; Shi, W.; Pan, Q.; van Esch, B.B. Study on unsteady tip leakage vortex cavitation in an axial-flow pump using an improved filter-based model. J. Mech. Technol. 2017, 31, 659–667. [Google Scholar] [CrossRef]
- Wu, H.; Miorini, R.L.; Katz, J. Measurements of the tip leakage vortex structures and turbulence in the meridional plane of an axial water-jet pump. Exp. Fluids 2011, 50, 989–1003. [Google Scholar] [CrossRef]
- Wu, H.; Tan, D.; Miorini, R.L.; Katz, J. Three-dimensional flow structures and associated turbulence in the tip region of a waterjet pump rotor blade. Exp. Fluids 2011, 51, 1721–1737. [Google Scholar] [CrossRef]
- Shuja, S.Z.; Yilbas, B.S.; Budair, M.O. Entropy analysis of a flow past a heat-generated bluff body. Int. J. Energy Res. 2015, 23, 1133–1142. [Google Scholar] [CrossRef]
- Abu-Hijleh BA, K.; Heilen, W.N. Entropy generation due to laminar natural convection over a heated rotating cylinder. Int. J. Heat Mass Transf. 1999, 42, 4225–4233. [Google Scholar] [CrossRef]
- Kock, F.; Herwig, H. Local entropy production in turbulent shear flows: A high-Reynolds number model with wall functions. Int. J. Heat Mass Transf. 2004, 47, 2205–2215. [Google Scholar] [CrossRef]
- Kock, F.; Herwig, H. Entropy production calculation for turbulent shear flows and their implementation in cfd codes. Int. J. Heat Fluid Flow 2005, 26, 672–680. [Google Scholar] [CrossRef]
- Li, D.; Wang, H.; Qin, Y.; Han, L.; Wei, X.; Qin, D. Entropy production analysis of hysteresis characteristic of a pump-turbine model. Energy Convers. Manag. 2017, 149, 175–191. [Google Scholar] [CrossRef]
- Shen, S.; Qian, Z.; Ji, B. Numerical Analysis of Mechanical Energy Dissipation for an Axial-Flow Pump Based on Entropy Generation Theory. Energies 2019, 12, 4162. [Google Scholar] [CrossRef] [Green Version]
- Behzadmehr, A.; Mercadier, Y. Numerical study of flow parameters and entropy generation on a centrifugal fan. Int. J. Exergy 2009, 6, 80–92. [Google Scholar] [CrossRef]
- Wang, M.; Li, Y.; Yuan, J.; Meng, F.; Appiah, D.; Chen, J. Comprehensive Improvement of Mixed-Flow Pump Impeller Based on Multi-Objective Optimization. Processes 2020, 8, 905. [Google Scholar] [CrossRef]
- Zhang, F.; Appiah, D.; Hong, F.; Zhang, J.; Yuan, S.; Adu-Poku, K.A.; Wei, X. Energy loss evaluation in a side channel pump under different wrapping angles using entropy production method. Int. Commun. Heat Mass Transf. 2020, 113, 104526. [Google Scholar] [CrossRef]
- Menter, F.R. Two-equation eddy-viscosity turbulence models for engineering applications. Aiaa J. 1994, 32, 1598–1605. [Google Scholar] [CrossRef] [Green Version]
- Mentor, F.; Ferreira, J.C.; Esch, T.; Konno, B. The SST turbulence model with improved wall treatment for heat transfer predictions in gas turbines. In Proceedings of the International Gas Turbine Congress, Tokyo, Japan, 2–7 November 2003. [Google Scholar]
- Pei, J.; Yuan, S.; Benra, F.K.; Dohmen, H.J. Numerical prediction of unsteady pressure field within the whole flow passage of a radial single-blade pump. J. Fluids Eng. 2012, 134, 101103. [Google Scholar] [CrossRef]
Figure 1.
3D model of the axial flow pump device.

Figure 2.
Mesh of axial flow pump device.

Figure 3.
Grid independence of pump device without root clearance.

Figure 4.
Photo of the axial flow pump device.

Figure 5.
Comparison of simulated pump performance under different root clearance radii.

Figure 6.
Comparison of pump performance between simulated data and test results (Rt = 0 mm).

Figure 7.
Comparison of simulated (a) hydraulic efficiency and (b) head under different root clearance radii.
Figure 7.
Comparison of simulated (a) hydraulic efficiency and (b) head under different root clearance radii.

Figure 8.
Distribution of (a) power loss due to indirect dissipation and (b) power loss due to direct dissipation of different hydraulic components without root clearance under five flow rates.
Figure 8.
Distribution of (a) power loss due to indirect dissipation and (b) power loss due to direct dissipation of different hydraulic components without root clearance under five flow rates.

Figure 9.
Distribution of power loss due to indirect dissipation at 1.0 Qdes for varying root clearances (Rt = 0 mm, 2.7 mm, 5 mm, 8 mm).
Figure 9.
Distribution of power loss due to indirect dissipation at 1.0 Qdes for varying root clearances (Rt = 0 mm, 2.7 mm, 5 mm, 8 mm).

Figure 10.
The cylindrical cross-section for impeller and diffuser.

Figure 11.
Distribution of velocity vector at Span = 0.015 in impeller passage with varying root clearances (Rt = 0 mm, 2.7 mm, 5 mm 8 mm; Q = 1.0 Qdes).
Figure 11.
Distribution of velocity vector at Span = 0.015 in impeller passage with varying root clearances (Rt = 0 mm, 2.7 mm, 5 mm 8 mm; Q = 1.0 Qdes).

Figure 12.
Velocity contour at Span = 0.015 in impeller passage with varying root clearances (Rt = 0 mm, 2.7 mm, 5 mm 8 mm; Q = 1.0 Qdes).
Figure 12.
Velocity contour at Span = 0.015 in impeller passage with varying root clearances (Rt = 0 mm, 2.7 mm, 5 mm 8 mm; Q = 1.0 Qdes).

Figure 13.
Distribution of the indirect dissipation rate at Span = 0.015 in the impeller passage with varying root clearances (Rt = 0 mm, 2.7 mm, 5 mm 8 mm; Q = 1.0 Qdes).
Figure 13.
Distribution of the indirect dissipation rate at Span = 0.015 in the impeller passage with varying root clearances (Rt = 0 mm, 2.7 mm, 5 mm 8 mm; Q = 1.0 Qdes).

Figure 14.
Standard deviation of the velocity distribution at Span = 0.015 in the impeller passage with varying root clearances (Rt = 0 mm, 2.7 mm, 5 mm 8 mm; Q = 1.0 Qdes).
Figure 14.
Standard deviation of the velocity distribution at Span = 0.015 in the impeller passage with varying root clearances (Rt = 0 mm, 2.7 mm, 5 mm 8 mm; Q = 1.0 Qdes).

Figure 15.
Velocity vectors at Span = 0.015 in guide vane passage with varying root clearances (Rt = 0 mm, 2.7 mm, 5 mm 8 mm; Q = 1.0 Qdes).
Figure 15.
Velocity vectors at Span = 0.015 in guide vane passage with varying root clearances (Rt = 0 mm, 2.7 mm, 5 mm 8 mm; Q = 1.0 Qdes).

Figure 16.
Indirect dissipation rate at Span = 0.015 in guide vane passage with varying root clearances (Rt = 0 mm, 2.7 mm, 5 mm 8 mm; Q = 1.0 Qdes).
Figure 16.
Indirect dissipation rate at Span = 0.015 in guide vane passage with varying root clearances (Rt = 0 mm, 2.7 mm, 5 mm 8 mm; Q = 1.0 Qdes).

Figure 17.
Distribution of indirect dissipation rate (a) from diffuser inlet and (b) from diffuser outlet on the surface of diffuser blades with varying root clearances (Rt = 0 mm, 2.7 mm, 5 mm, 8 mm; Q = 1.0 Qdes).
Figure 17.
Distribution of indirect dissipation rate (a) from diffuser inlet and (b) from diffuser outlet on the surface of diffuser blades with varying root clearances (Rt = 0 mm, 2.7 mm, 5 mm, 8 mm; Q = 1.0 Qdes).


Table 1.
Main parameters of the axial flow pump device.
| Design Parameters (CFD Results Under Rt of 0 mm) | |||
| design flow rate (m3/s) | 0.308 | Rotational speed (r/min) | 1340 |
| Design head (m) | 4.44 | Specific speed | 887.4 |
| Geometry Parameters | |||
| Impeller blade number | 3 | Diffuser blade number | 6 |
| Impeller diameter (mm) | 300 | Outlet diameter of diffuser (mm) | 312.8 |
| Tip clearance (mm) | 0.3 | Root clearance radius (mm) | 0/2.7/5/8 |
Table 2.
Basic parameters of test equipment.
| Equipment name | Instrument Model | Measuring Range | Measurement Uncertainty |
|---|---|---|---|
| Intelligent electromagnetic flowmeter | OPTIFLUX2000F | 0 ~ 1800 m3/h | ≤±0.2% |
| Smart differential pressure transmitter | EJA | 0 ~ 10 m | ≤±0.1% |
| Intelligent torque speed sensor | JCL1 | 0 ~ 200 N·m | ≤±0.1% |
Publisher’s Note: MDPI stays neutral with regard to jurisdictional claims in published maps and institutional affiliations. |
© 2020 by the authors. Licensee MDPI, Basel, Switzerland. This article is an open access article distributed under the terms and conditions of the Creative Commons Attribution (CC BY) license (http://creativecommons.org/licenses/by/4.0/).
Share and Cite
MDPI and ACS Style
Li, Y.; Zheng, Y.; Meng, F.; Osman, M.K. The Effect of Root Clearance on Mechanical Energy Dissipation for Axial Flow Pump Device Based on Entropy Production. Processes 2020, 8, 1506. https://doi.org/10.3390/pr8111506
AMA Style
Li Y, Zheng Y, Meng F, Osman MK. The Effect of Root Clearance on Mechanical Energy Dissipation for Axial Flow Pump Device Based on Entropy Production. Processes. 2020; 8(11):1506. https://doi.org/10.3390/pr8111506
Chicago/Turabian StyleLi, Yanjun, Yunhao Zheng, Fan Meng, and Majeed Koranteng Osman. 2020. "The Effect of Root Clearance on Mechanical Energy Dissipation for Axial Flow Pump Device Based on Entropy Production" Processes 8, no. 11: 1506. https://doi.org/10.3390/pr8111506
Note that from the first issue of 2016, this journal uses article numbers instead of page numbers. See further details here.