Improving the Energy Efficiency of Industrial Refrigeration Systems by Means of Data-Driven Load Management


Department of Electronic Engineering, Technical University of Catalonia, 08034 Barcelona, Spain
*
Author to whom correspondence should be addressed.
Processes 2020, 8(9), 1106; https://doi.org/10.3390/pr8091106
Submission received: 4 August 2020
/
Revised: 28 August 2020
/
Accepted: 2 September 2020
/
Published: 5 September 2020
(This article belongs to the Special Issue Synergies in Combined Development of Processes and Models)
Abstract
:A common denominator in the vast majority of processes in the food industry is refrigeration. Such systems guarantee the quality and the requisites of the final product at the expense of high amounts of energy. In this regard, the new Industry 4.0 framework provides the required data to develop new data-based methodologies to reduce such energy expenditure concern. Focusing in this issue, this paper proposes a data-driven methodology which improves the efficiency of the refrigeration systems acting on the load side. The solution approaches the problem with a novel load management methodology that considers the estimation of the individual load consumption and the necessary robustness to be applicable in highly variable industrial environments. Thus, the refrigeration system efficiency can be enhanced while maintaining the product in the desired conditions. The experimental results of the methodology demonstrate the ability to reduce the electrical consumption of the compressors by 17% as well as a 77% reduction in the operation time of two compressors working in parallel, a fact that enlarges the machines life. Furthermore, these promising savings are obtained without compromising the temperature requirements of each load.
1. Introduction
Nowadays, energy efficiency in industrial processes is considered one of the bases for economic competitiveness and growth [1,2]. In this regard, most of the food processes require highly consuming refrigeration systems in order to preserve the quality and properties of products. Therefore, it is crucial to maximize the efficiency of such refrigeration systems to save energy in the food industry.
Aligned with the energy saving strategies, the current Industry 4.0 paradigm opens new paths towards more efficient energy management strategies for industrial processes. The data collected in the industrial refrigeration systems can become a key asset in order to develop novel methodologies to achieve an efficient energy management.
The improvement in terms of efficiency of refrigeration systems has multiple approaches, from the retrofitting of the current refrigerant [3,4], to the replacement of the classical systems with hybrid systems [5,6,7]. However, in scenarios where the refrigeration machinery cannot be modified due to economical or process restrictions, the refrigeration systems are commonly improved by manipulating the generation part, composed by the compressors and the condensers, or modifying the temperatures of operation, the evaporation and condensation [8,9,10,11,12]. Nevertheless, by manipulating the load side, composed by the evaporators of the refrigeration system, it is also possible to improve the efficiency of the refrigeration system in an indirect way [13,14,15].
In the load side approach, the thermal inertia is used to apply different load response strategies such as load shifting and shedding in order to modify the power consumption shape [16]. However, to be able to manage the loads of a refrigeration system arises the necessity to identify the cooling loads of each refrigerated space. Therefore, the required methodology to tackle the load management problem should consider the estimation of the cooling loads.
In this regard, the current manuscripts about the estimation of the loads, also called non-intrusive load monitoring (NILM) or energy disaggregation in literature, put their efforts to estimate the electrical consumption of the refrigeration machinery [17,18] and not into the cooling load.
Other articles divide the whole cooling load of a system into various estimated sub-items such as the conduction, solar, air, or internal loads of a whole building [19,20], but omit the discrete consumption of each refrigerated space or even each cooling machine.
From a load management perspective, in a common refrigeration system, the spaces to refrigerate should maintain a certain temperature, and are typically controlled by a deadband, which means that the evaporators turn on when the temperature reaches the upper limit and turn off when they reach the lower limit. Hence, the cooling capacity is used randomly as well as the energy consumption in order to supply the demand necessities [21].
To improve such operation, and avoid non-desired compressor switches, several studies are presented; from thermal energy storages (TESs) such as phase change materials (PCMs) to accumulate the energy [22], to model predictive control (MPC) strategies, which use forecasting information to anticipate the demand behavior. In these approaches, most of the cooling loads are mathematically described by the equivalent thermal parameter models [23], using software such as TRNSYS and EnergyPlus or using data-driven techniques to model the load behavior or even to identify the equivalent thermal parameter (ETP) equations parameters [24].
Moreover, most of the state of the art load management techniques are based on forecasting models [13,14,15]. Such applications take advantage of the periodicity in the load to model the behavior and manage the loads in consequence. However, characteristics that affect industrial refrigeration systems, such as various spaces to refrigerate in parallel or huge cooling loads that appear randomly due to its nature, can hinder the forecasting reliability and the subsequent load management. These situations, hinder the application of methodologies that incorporate forecasting in delicate refrigeration processes, since the errors associated with the forecasted signals can affect negatively the management and compromise the product quality.
In the present article, the proposed methodology to manage the cooling loads of a refrigeration system considers the estimation of the cooling loads, with a novel NILM strategy presented in our previous work [25], and takes advantage of such estimation to reduce the compressors electrical expenditure under non-scheduled processes. Such increase of the compressors operation efficiency is achieved modulating the load by means of the switching of the evaporators allocated in the different spaces to refrigerate. The methodology guarantees the product quality constraints while reducing the energy consumption.
This paper is organized as follows: First, the description of the refrigeration system and the management issue addressed is given in Section 2. Section 3 describes the basis of the proposed methodology for AI (Artificial Intelligence) based load management. Finally, Section 4 presents the experimental results about the application of the methodology to the industrial refrigeration system and the corresponding discussion is given in Section 5.
2. System Description and Problems Addressed
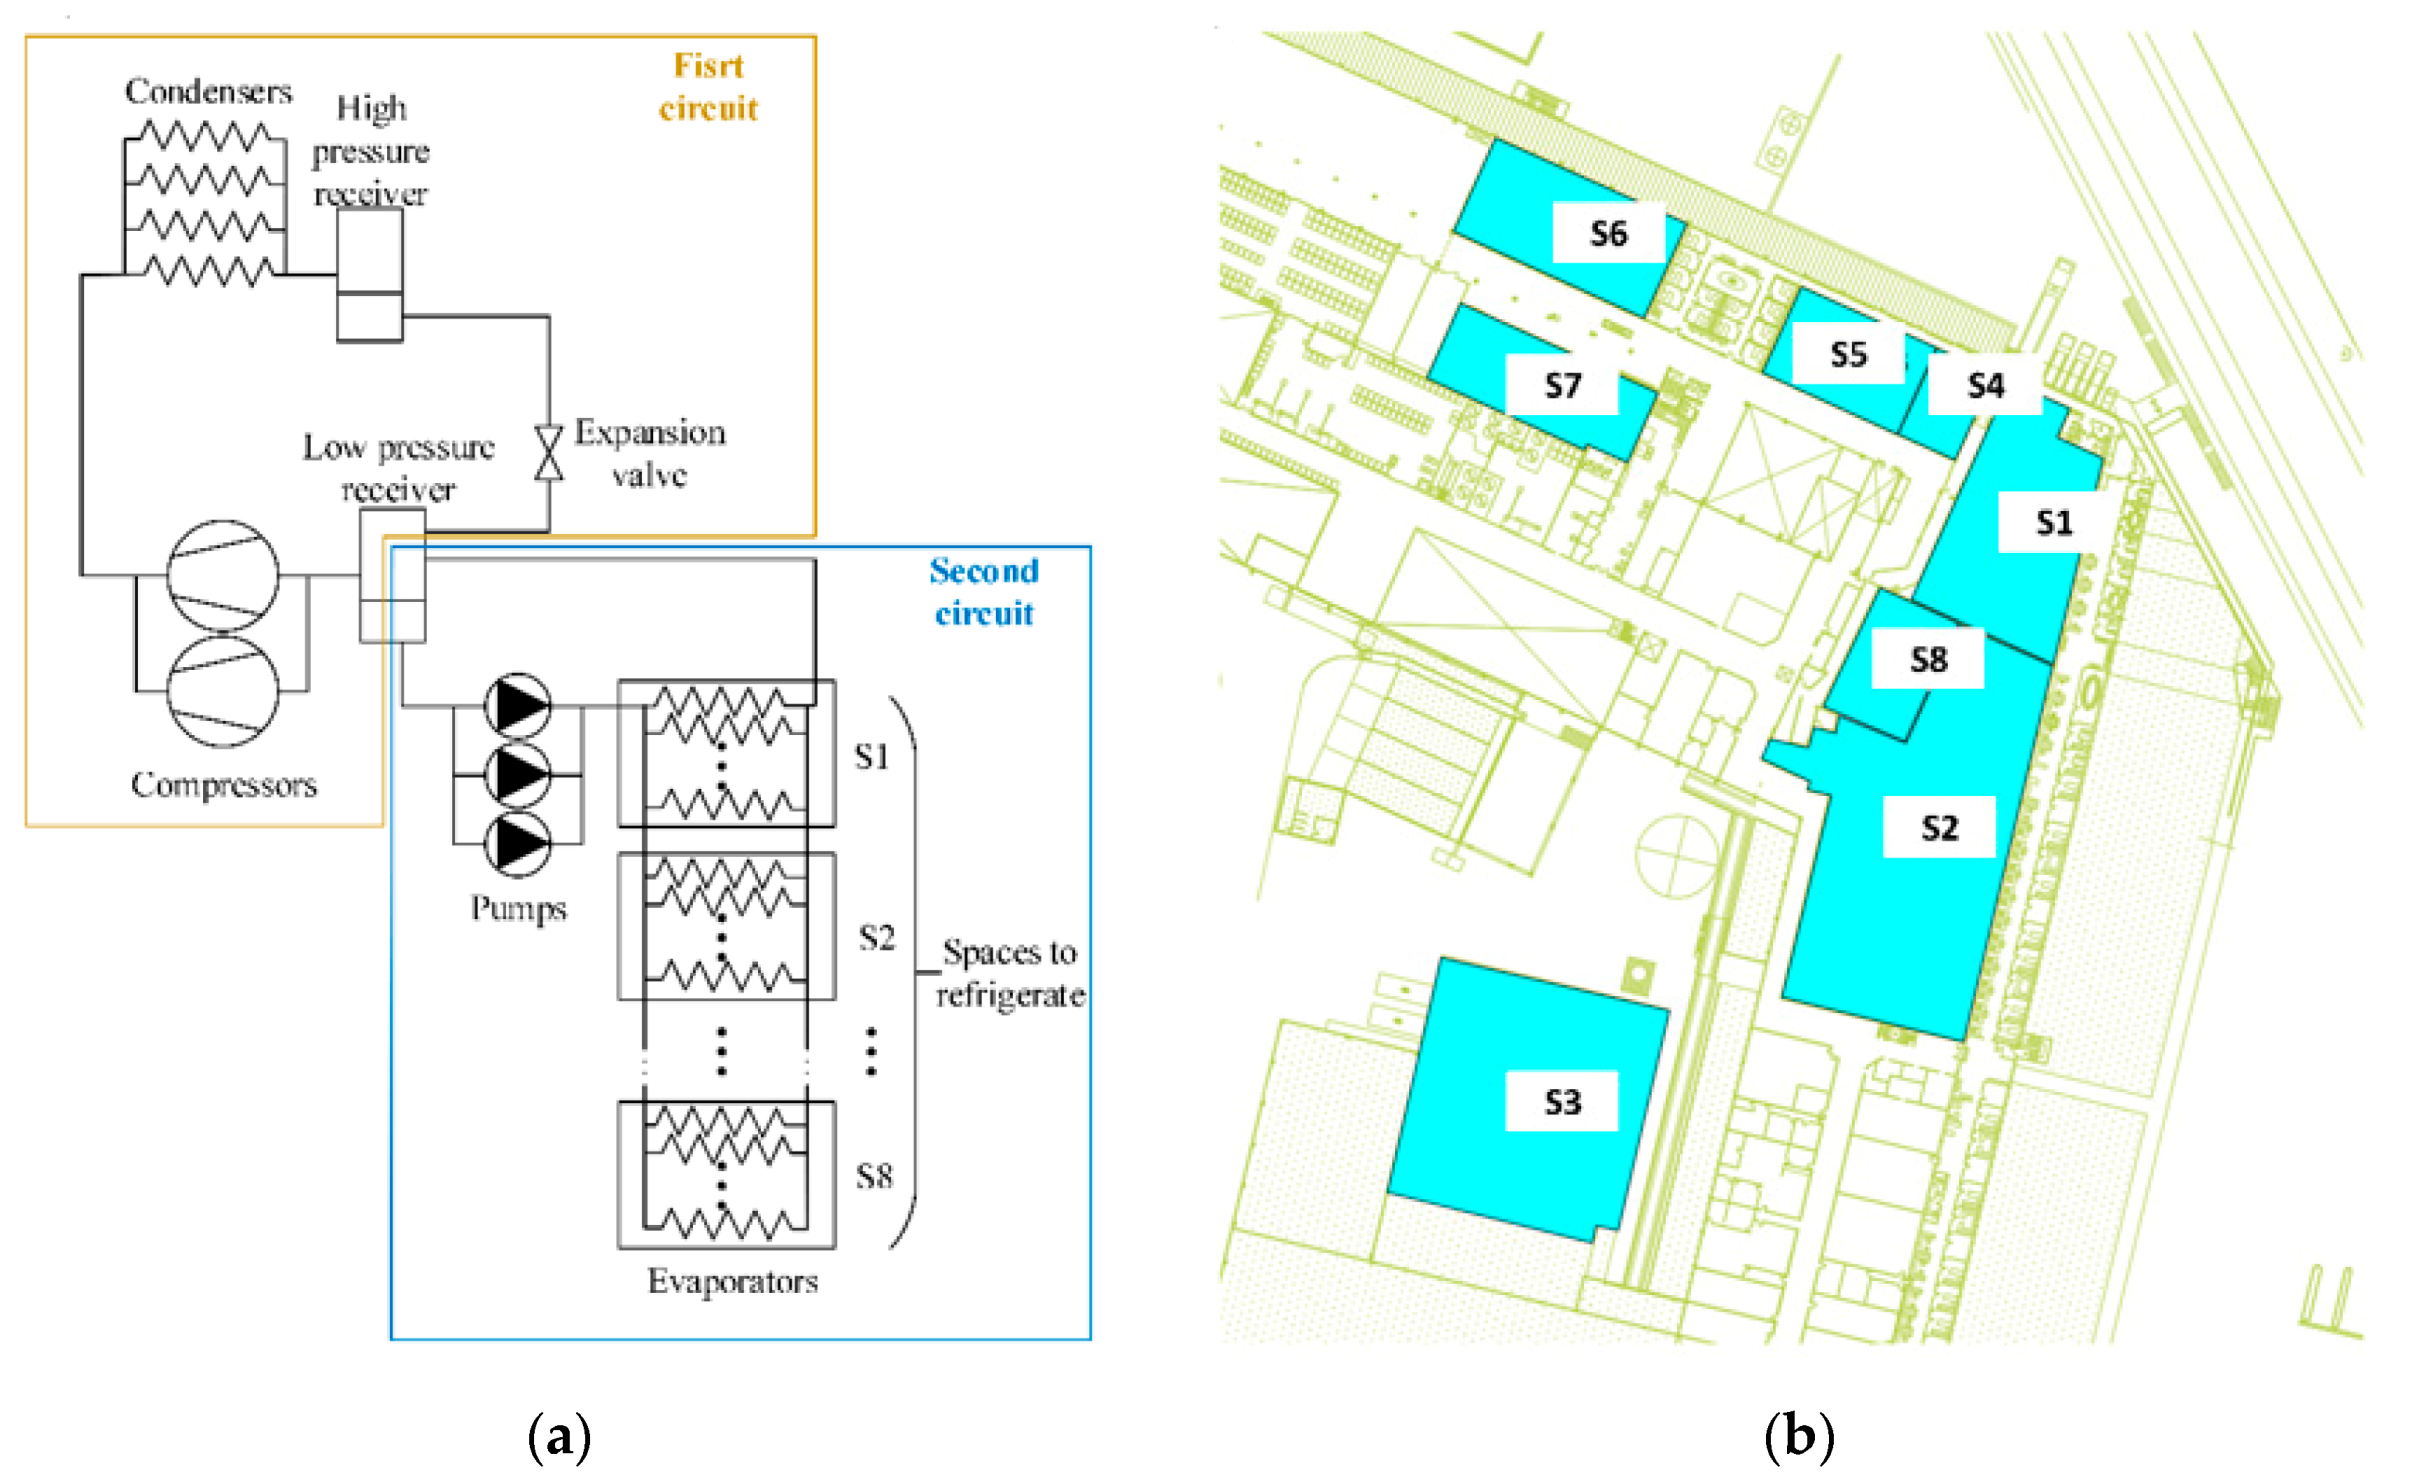
The test system is an overfeed vapor compression refrigeration cycle. The goal of these systems is to remove heat of a space. In order to accomplish such task, the refrigerant circulates through the system depicted in Figure 1. This system consists of two main circuits, the first one is composed by four condensers, two compressors, an expansion device, a low pressure separator receiver, and a high pressure receiver. Then, the second one is composed by a low pressure separator receiver, a common element in both circuits, three pumps to force the liquid recirculation, and various evaporators distributed in the eight spaces to refrigerate (S1–S8) of the facility.
The refrigerant employed in the overfeed refrigeration system is the ammonia (R717), due to its efficiency in low temperatures, its environmentally friendly properties, its heat transfer, and its low price. In the first circuit, the refrigerant in vapor state is suctioned by the compressors from the low pressure separator receiver to increase the refrigerant pressure. In order to perform that job and to provide enough cooling capacity () to satisfy plant demand, two screw compressors are located in parallel. These compressors are the part of the system that consume the majority of the energy [26] and also its performance is highly reduced when their slide valve, the mechanism used to change the capacity, is below the nominal conditions [27]. The screw compressors are the most used in industrial refrigeration systems with huge cooling capacities to supply [28]. Other types of compressors that are used in some industrial applications, such as the reciprocating ones, have different performance behavior, which are not further detailed in this article.
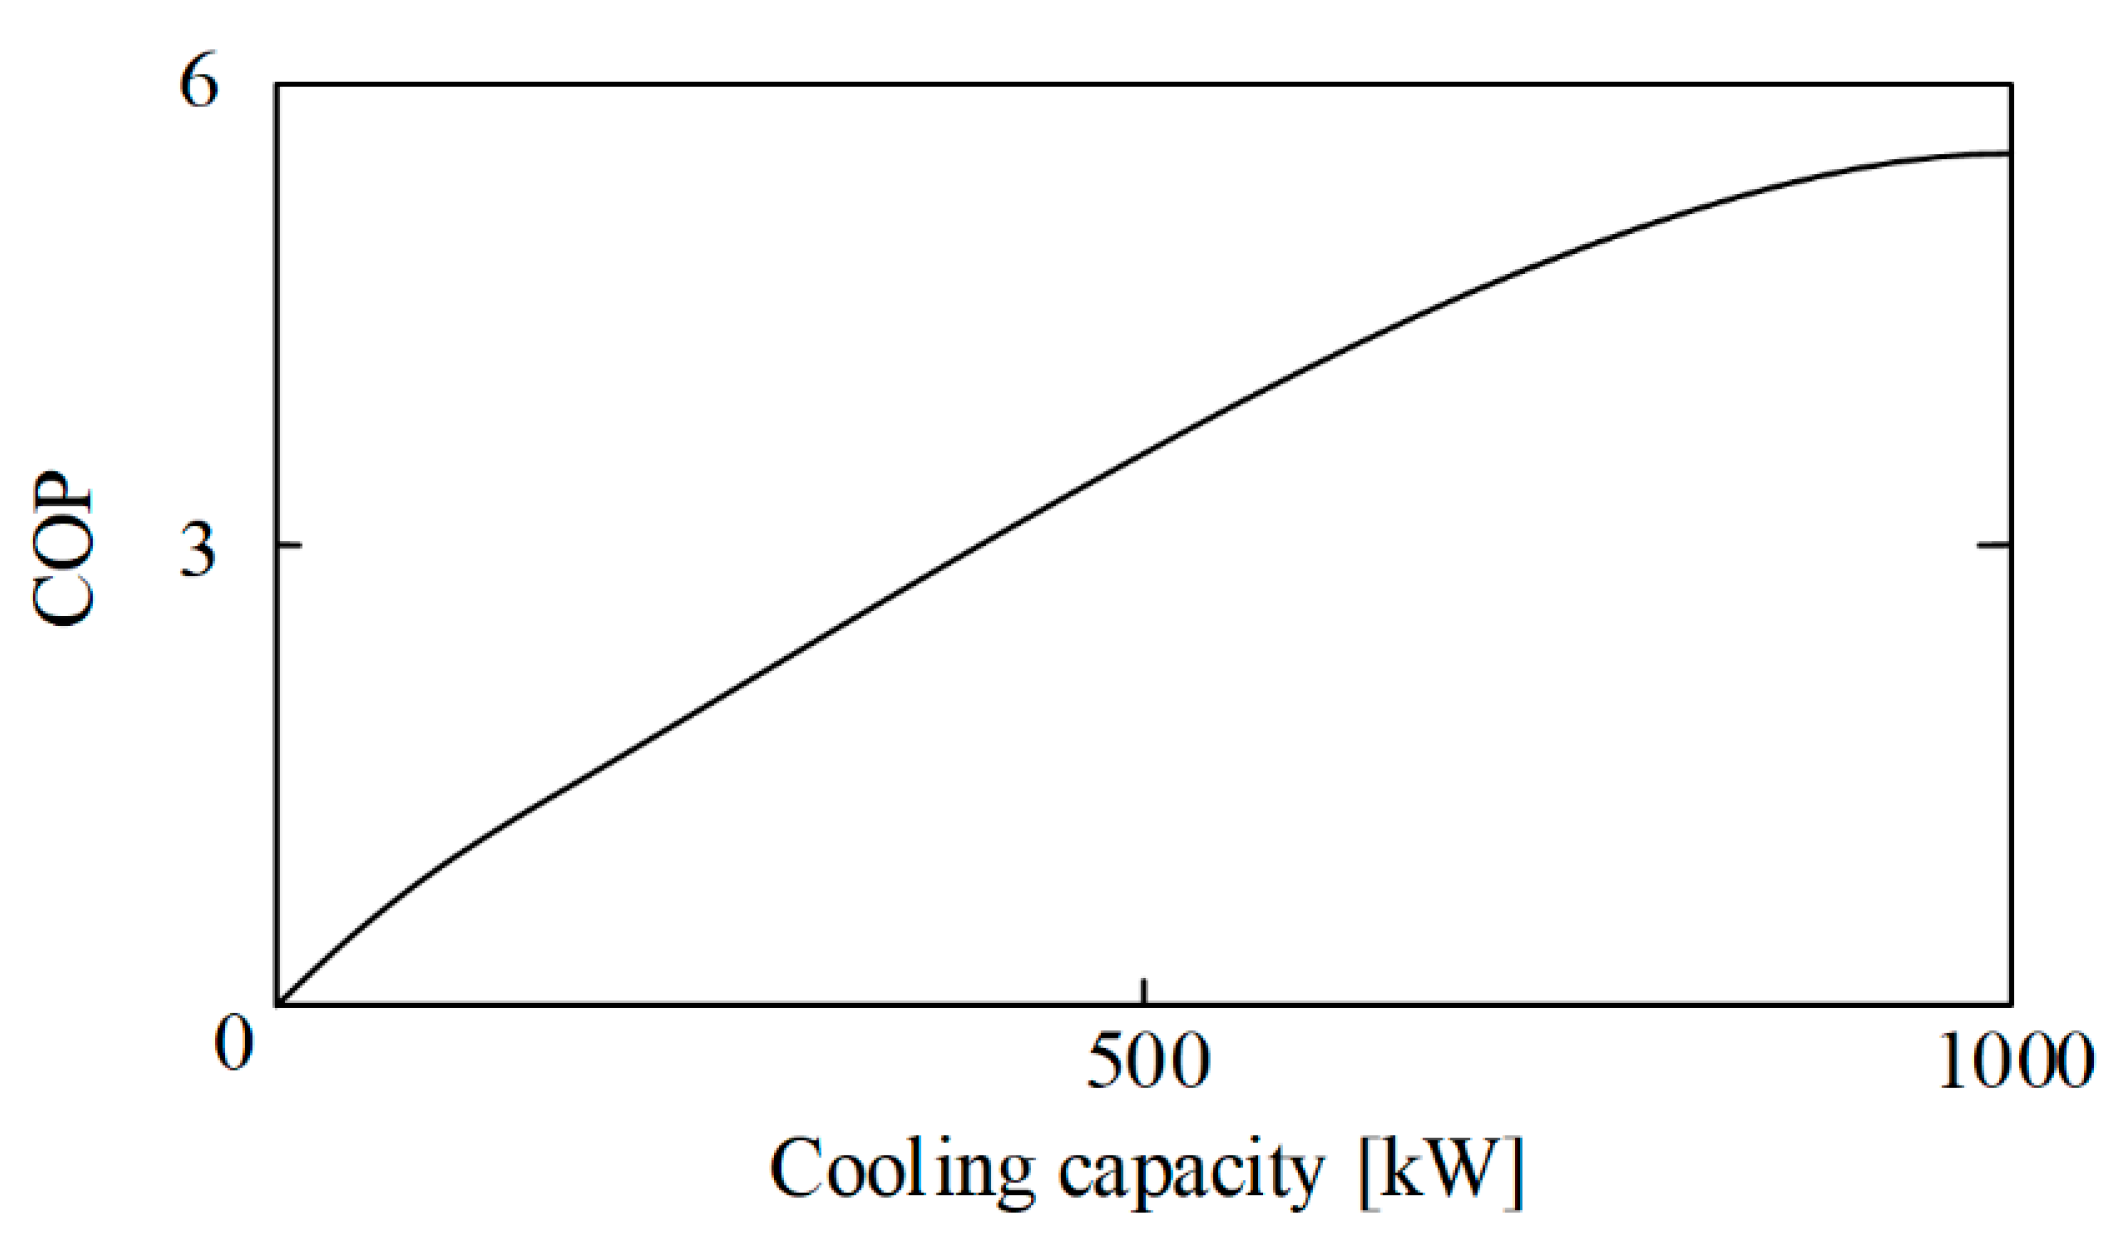
Currently, in the studied system, the screw compressors capacity is controlled with a classic proportional-integral-derivative controller (PID) in order to supply the desired cooling power, switching the second one when the desired cooling power is not reached during a specific amount of time. To provide more detail about a typical screw compressor, a performance curve is depicted in Figure 2 [29], where it can be appreciated that the coefficient of performance (COP), which is the ratio between the cooling capacity and the electrical consumption, is lower in small cooling capacities. Such COP curve of the compressor is highly influenced by the operation conditions, specifically the suction pressure and the discharge pressure, which are the pressures at the inlet and outlet of the compressor respectively. In the test system, these values can vary depending on the type of the load processed and the outdoor temperature and humidity. Specifically, the suction pressure varies between 1.6 and 2 bar, and the discharge pressure fluctuates between 8 and 12 or 13 bar in the hottest days of the summer.
Subsequently, in the condensers, the refrigerant is cooled to change the phase from vapor to liquid and reject the heat The aforesaid condensers block is formed by four evaporative condensers in parallel with five fans and a water pump, each one to be able to reject the heat from the refrigerant to outdoor, property which is highly influenced by outdoor conditions. Finally, the low-pressure receiver, which is the common part of both circuits, contains R717 in a mixture of a vapor–liquid state. The pressure inside the receiver is maintained by the compressors and its set point is established considering the desired evaporation temperature.
In the second circuit, the refrigerant is suctioned by the pumps and led to the evaporators. The pumps, are used to guarantee the refrigerant overfeed mass flow through the evaporators distributed alongside the spaces to refrigerate of the facility. Afterwards, in the evaporators located at the different S, the refrigerant is partially evaporated and then returned to the low pressure separator receiver [30]. Such evaporators are turned on or off according to the specific temperature ranges of each individual S, without considering the operation of the other S operating in parallel. When a space to refrigerate is above the desired range, more evaporators are turned on, while when the temperature is below the range, the evaporators are turned off. A brief description of the characteristics of each S is depicted in Table 1.
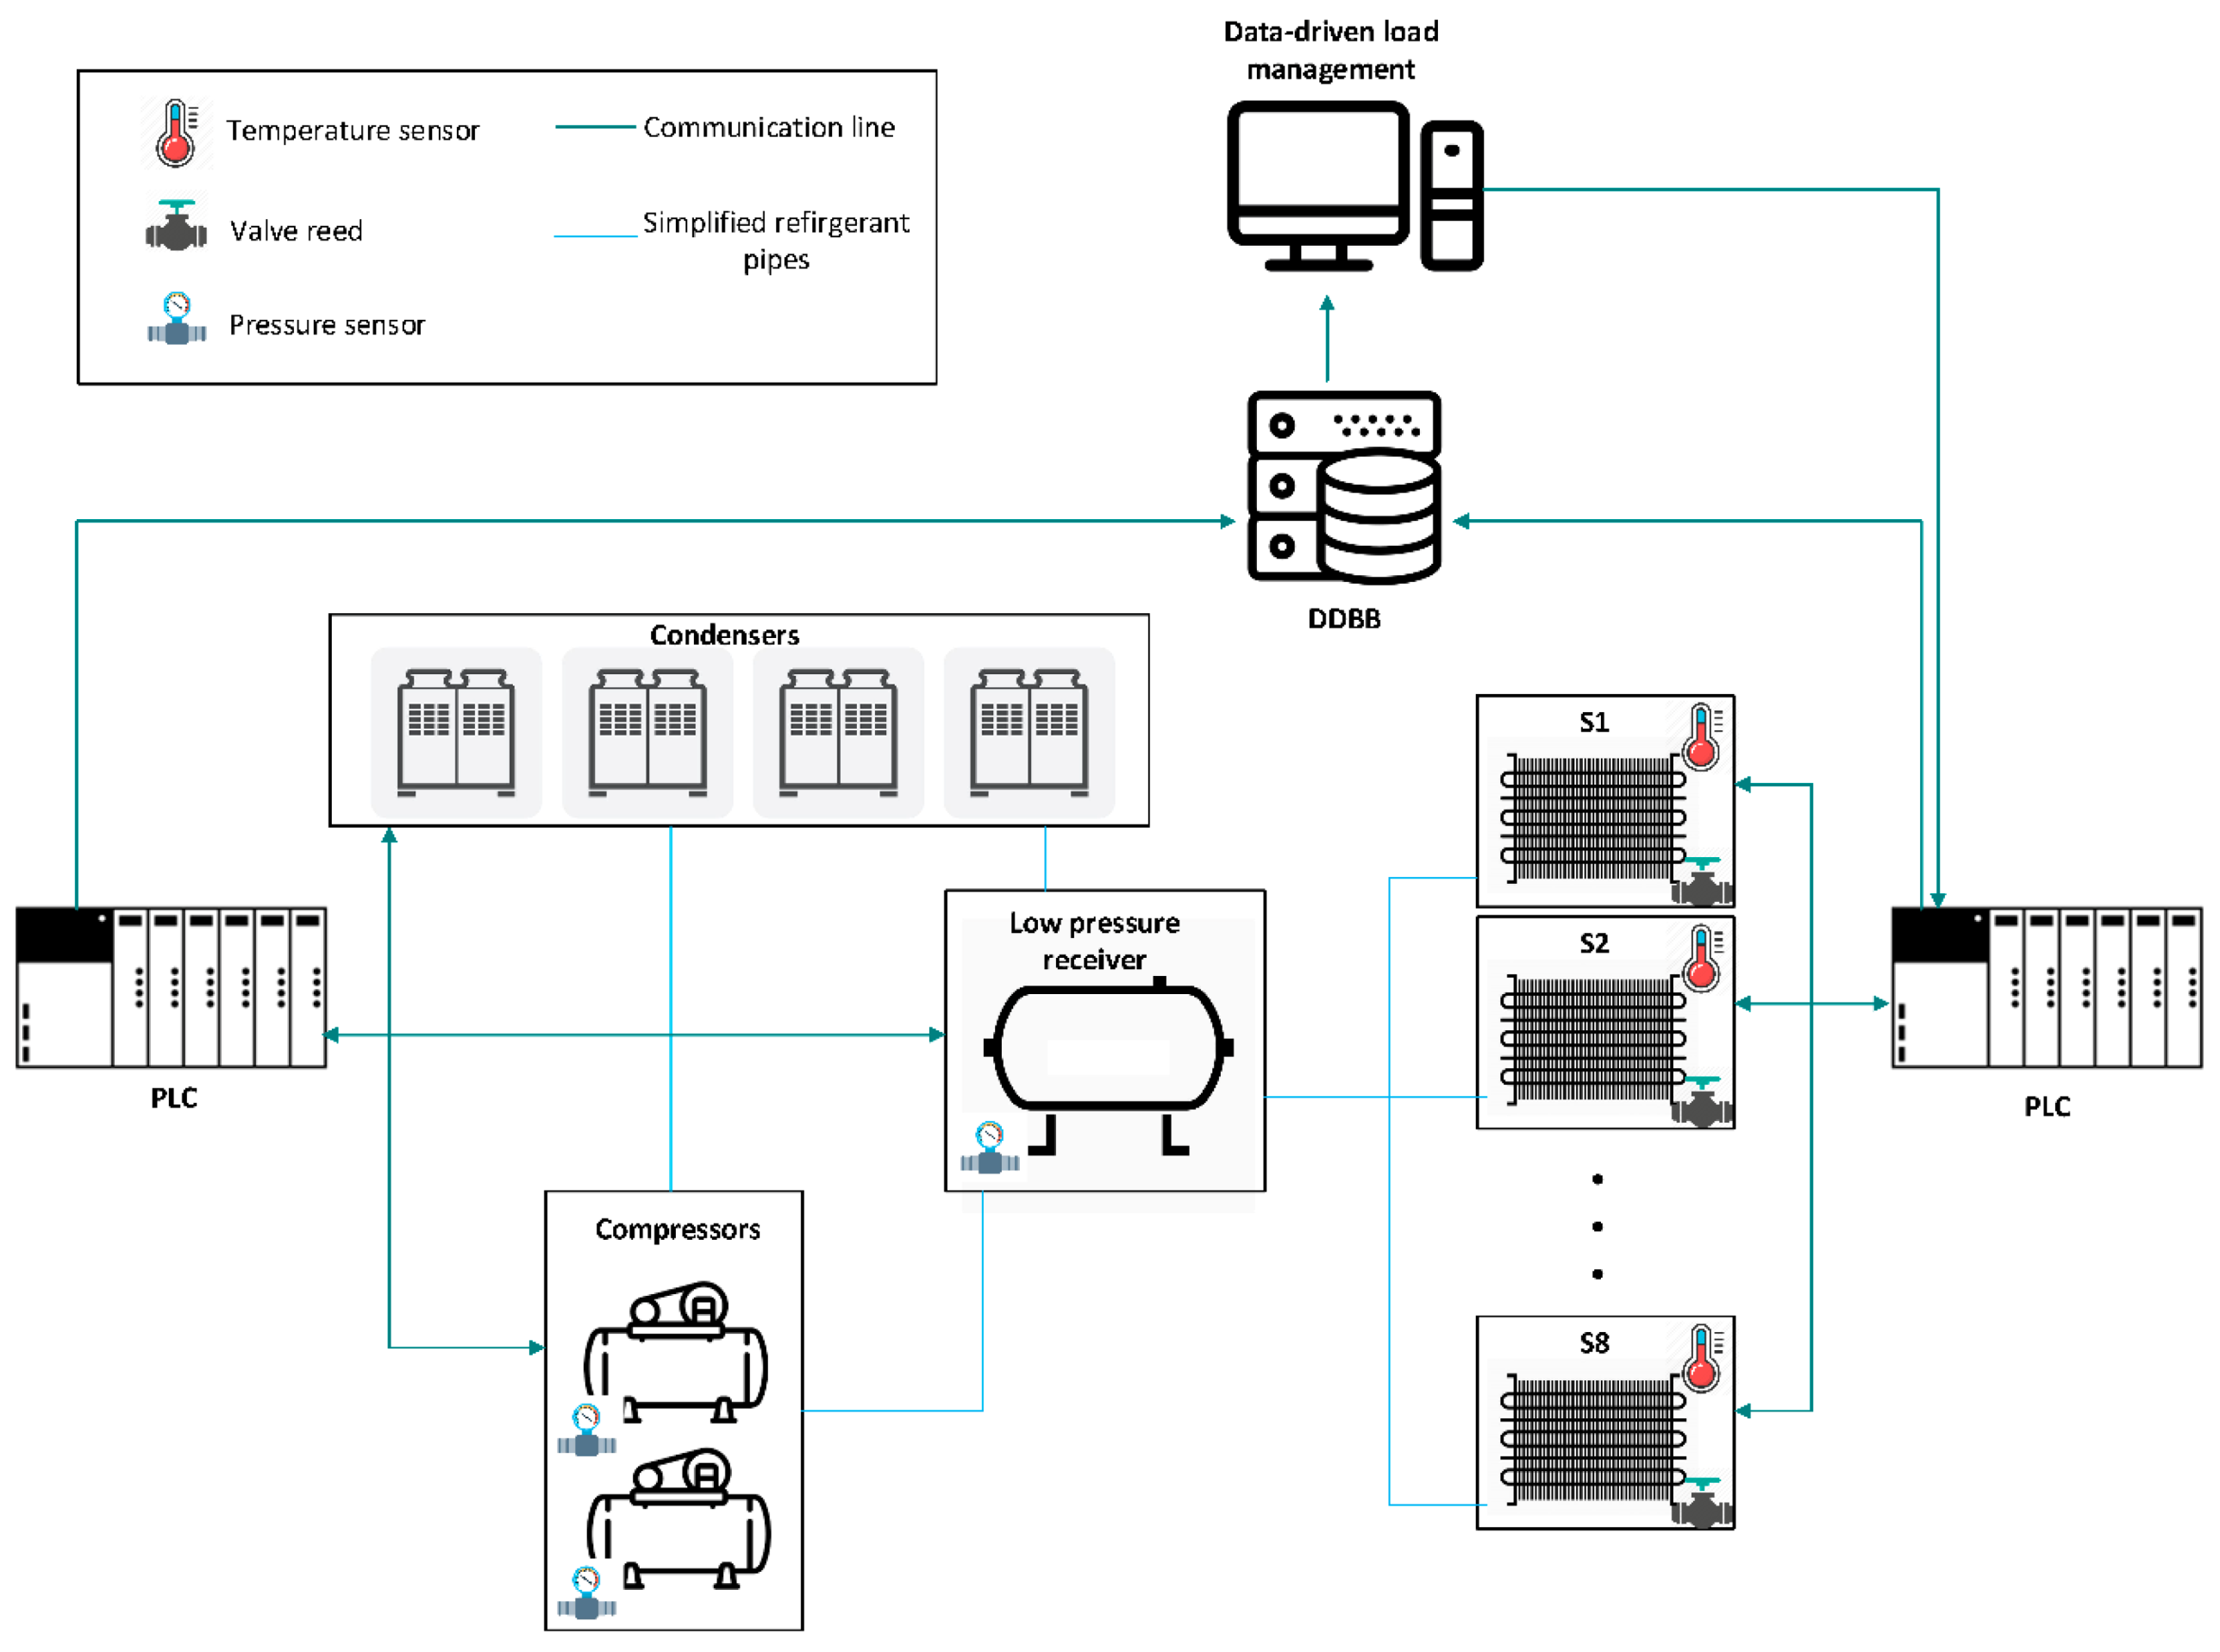
The described operation of the refrigeration system is constantly being monitored and controlled by means of the different signals acquired, Figure 3. All the information collected in the system is acquired employing different sensors such as pressure sensors (WIKA S20), temperature sensors (WIKA T15.H), or valve positioning reeds (included in the valve itself 027H9065) and read with different PLCs (Siemens 319-3 and various S7-200), which also control the system operation. These PLCs are communicating minutely with a relational DDBB (MySQL) in order to store the data, basis for this data-driven research work. The employed dataset for the study is available at the IEEE DataPort in [31].
Challenges Improving Compressors Performance by Means of Load Management
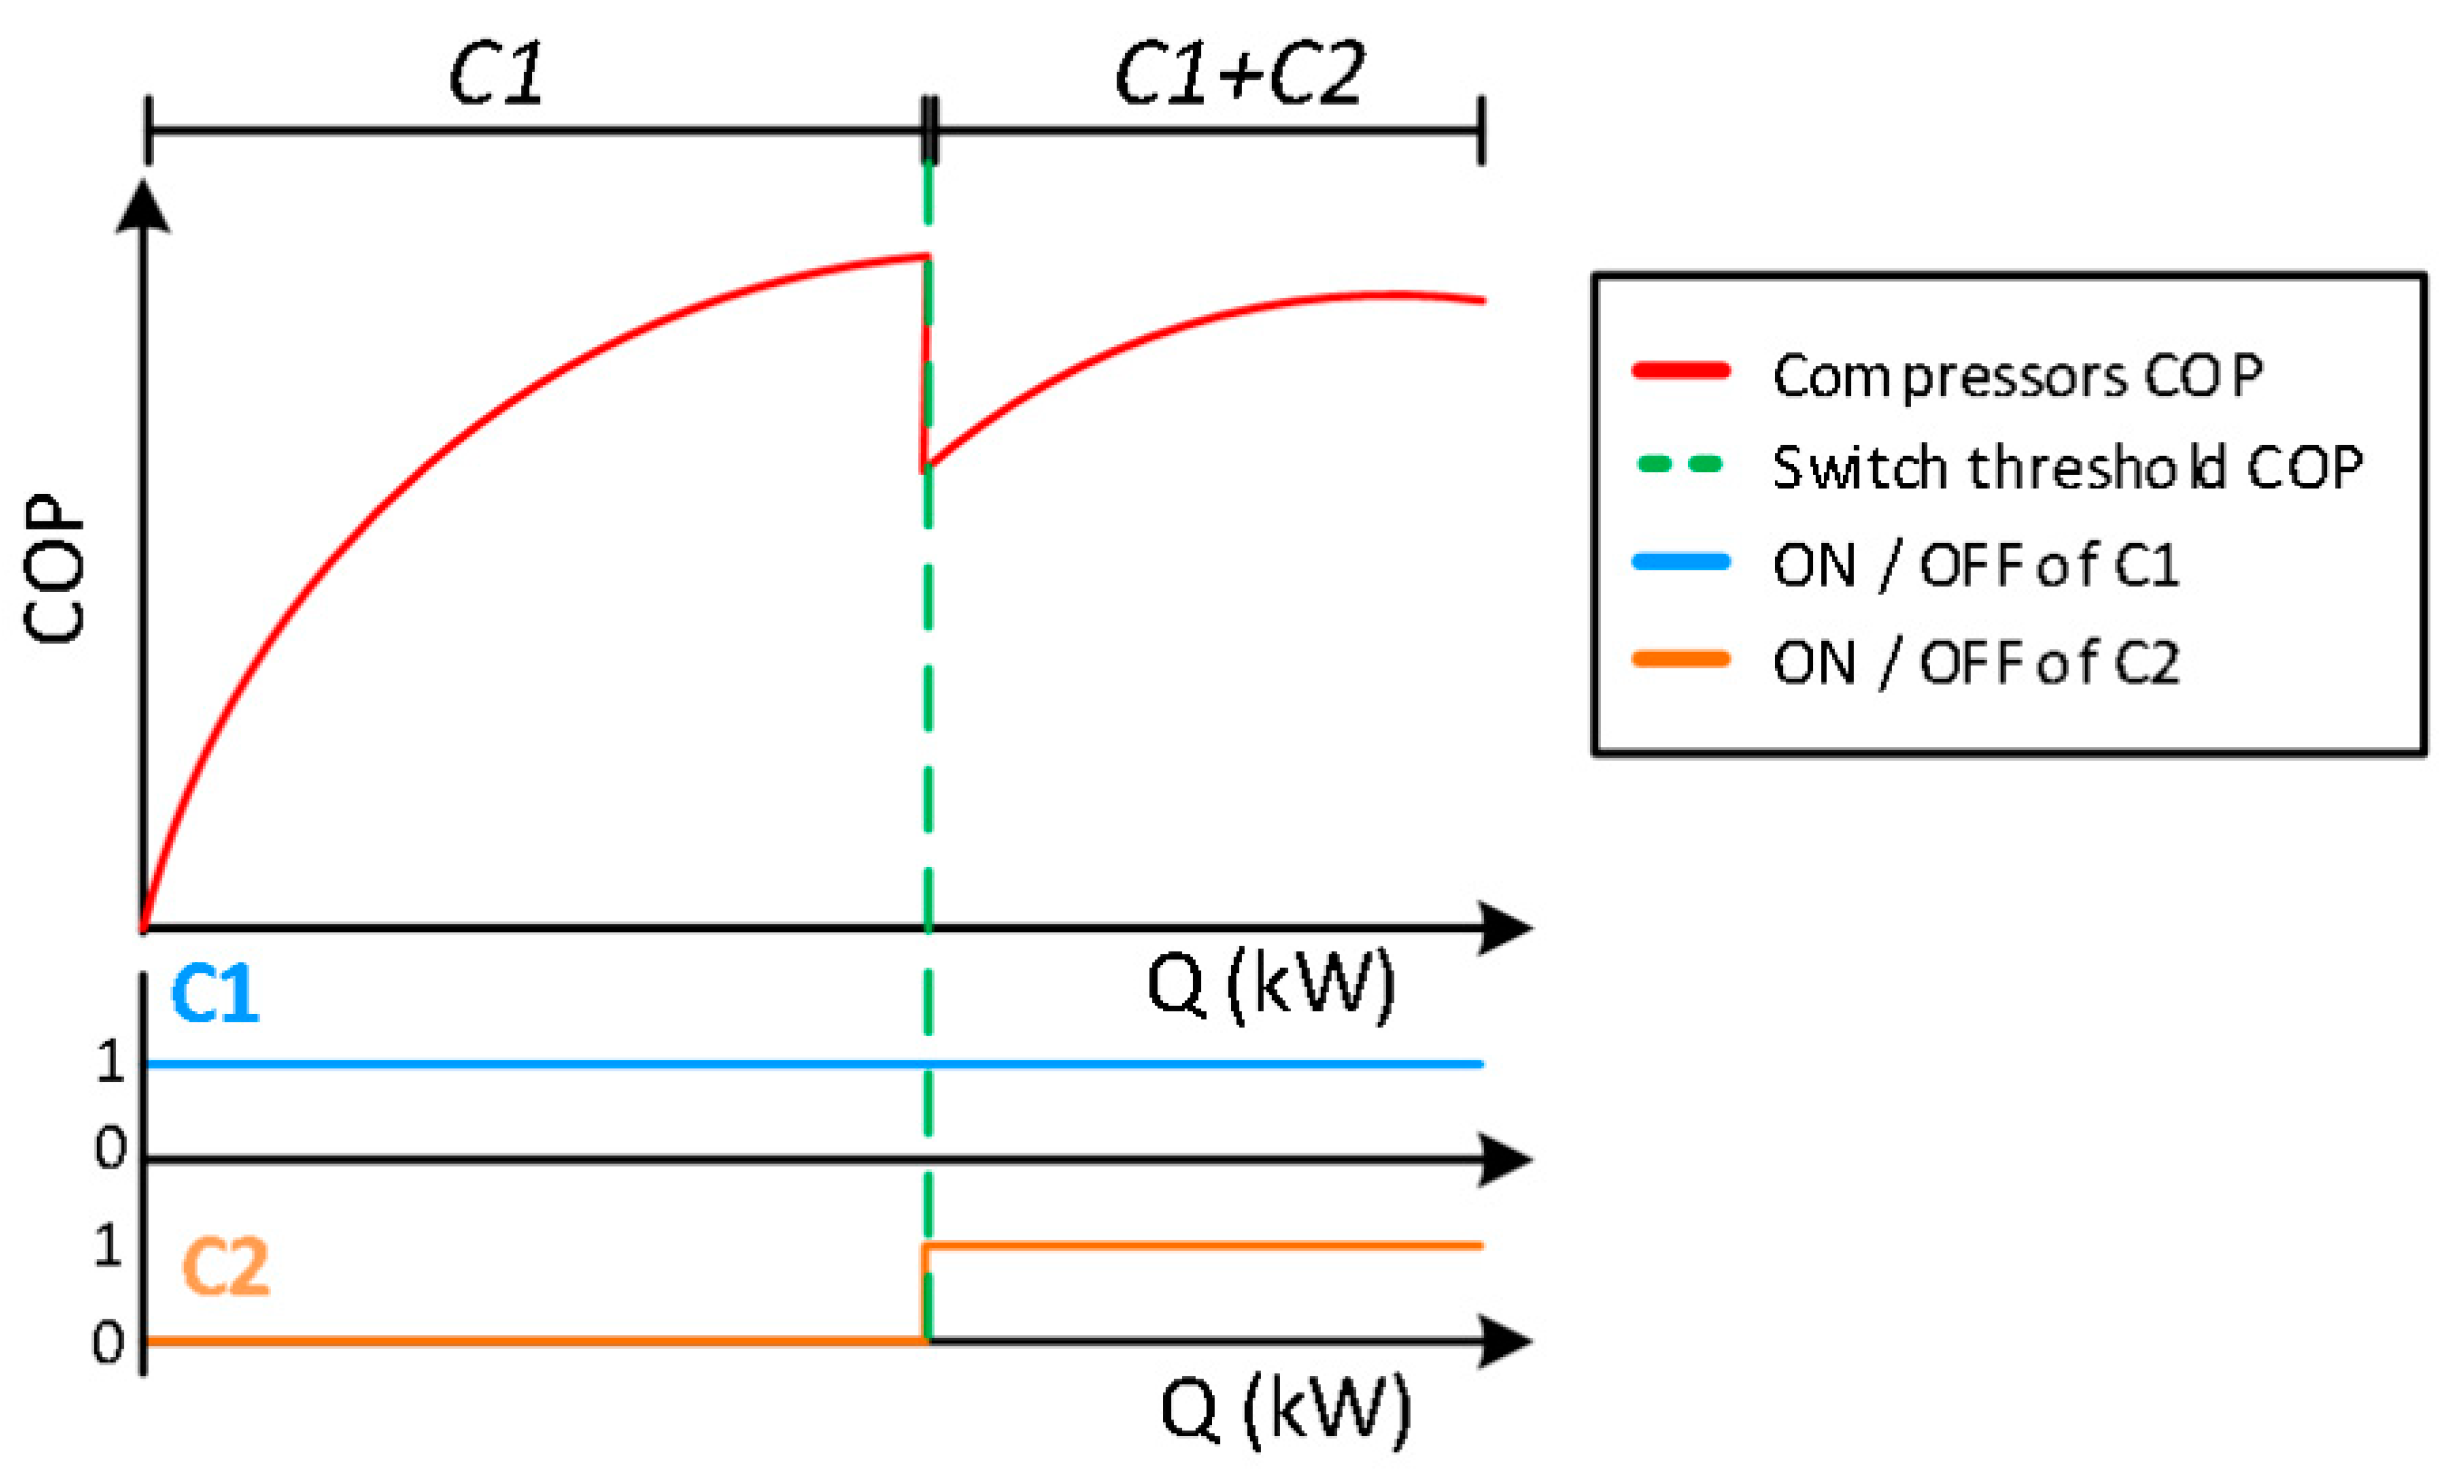
Although the proposed management strategy is focused on the load side, in order to enhance the comprehension of a refrigeration system particularities and highlight the challenges addressed in this paper, a theoretical performance curve of a two screw compressors, C1 and C2, working in parallel is explained. In this regard, Figure 4 shows the relation of the resulting coefficient of performance (COP) versus the of C1 and C2 for specific operation conditions of the system.
As it can be seen, the performance decreases substantially when the compressors are operating under their nominal cooling capacity, the thing that happens regularly when the system works with two compressors in parallel. Furthermore, the maximum COP of the system cannot be reached at the maximum cooling capacity as the characteristics of the two compressors working in parallel are different, a fact that limits the COP in such situations. Even though both compressors had the same technical specifications, the wear associated to its operation in a real scenario would influence the maximum reachable COP, which implies that the performance would be lower at full cooling capacity than when the least degraded machine works alone at full load. The period of time both compressors are working in parallel is defined as simultaneity, and since such situation implies a significant decrease of system performance, simultaneity time should be minimized by the proposed methodology. In this regard, the objective of this paper is to define a load management method that increases the refrigeration system efficiency by reducing the time that the system is operating with two compressors in parallel.
The simultaneity happens when the cooling demand increases and the second compressor is switched. In such situation, the electrical consumption of the refrigeration system increases substantially and, in most cases, only to provide a higher during a short period of time. These situations can be reduced or eliminated if the cooling consumption of each load is properly managed. In fact, such reduction can be performed by managing the loads, that is to increase or decrease the amount of cooling power they are receiving from the compressors to modify the shape of the curve.
Accordingly, in refrigeration systems, the cooling load seen by the compressors can be adjusted mainly in two different approaches, the first one consists on changing the configuration of the multiple evaporators allocated in each S in order to modify the cold flow each S is receiving. The second approach consists on modifying the final product quantity each S is trying to refrigerate. Scheduling strategies to change the spaces occupancy are proper approaches in such issues, however, in the explained problem, the quantity of products processed can be irregular and the stochastic nature of such processes cannot be modified. Thus, scheduling is not viable and techniques that employ forecasting assumptions that can induce error can be harmful for the product quality.
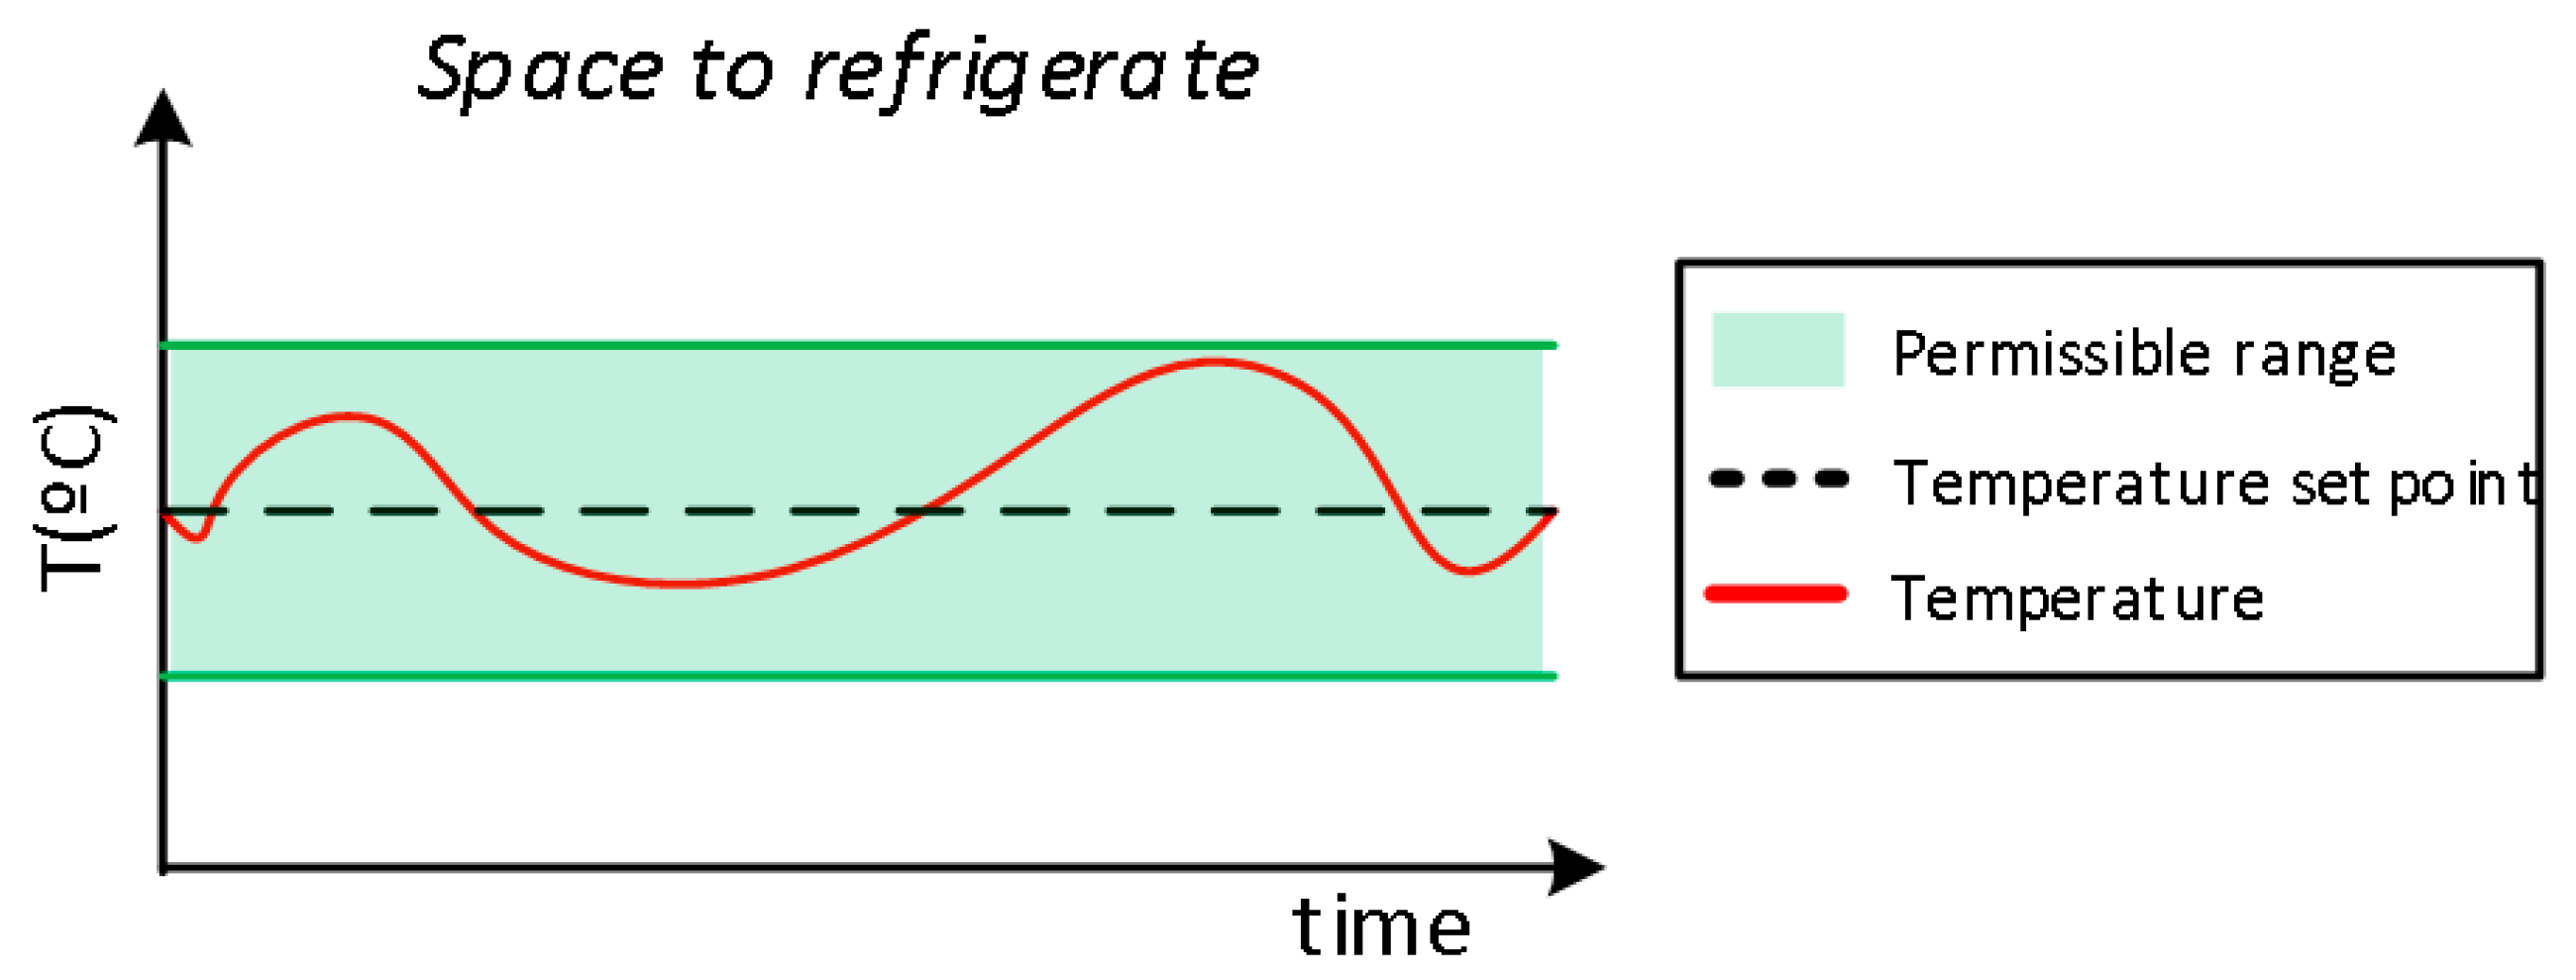
Hence, with all the aforementioned restrictions and particularities, the methodology should take advantage of the intrinsic thermal storage properties of each S to reduce simultaneity among the different S. In this regard, Figure 5 exemplifies a permissible temperature range of a specific space to refrigerate. Such range can be used by the proposed methodology to manage the loads without damaging the product quality.
The proposed methodology in this paper is focused on reducing the simultaneity of operation of the different spaces to refrigerate, it does so by stopping the evaporators of the spaces to refrigerate that are inside the permissible range when other spaces require a higher amount of cooling power demand. Such management should manage the load contributing to avoid the unwanted switching of the second compressor while preserving he product temperature constraints. The creation of an automatic methodology to perform such cooling load management is presented in this paper.
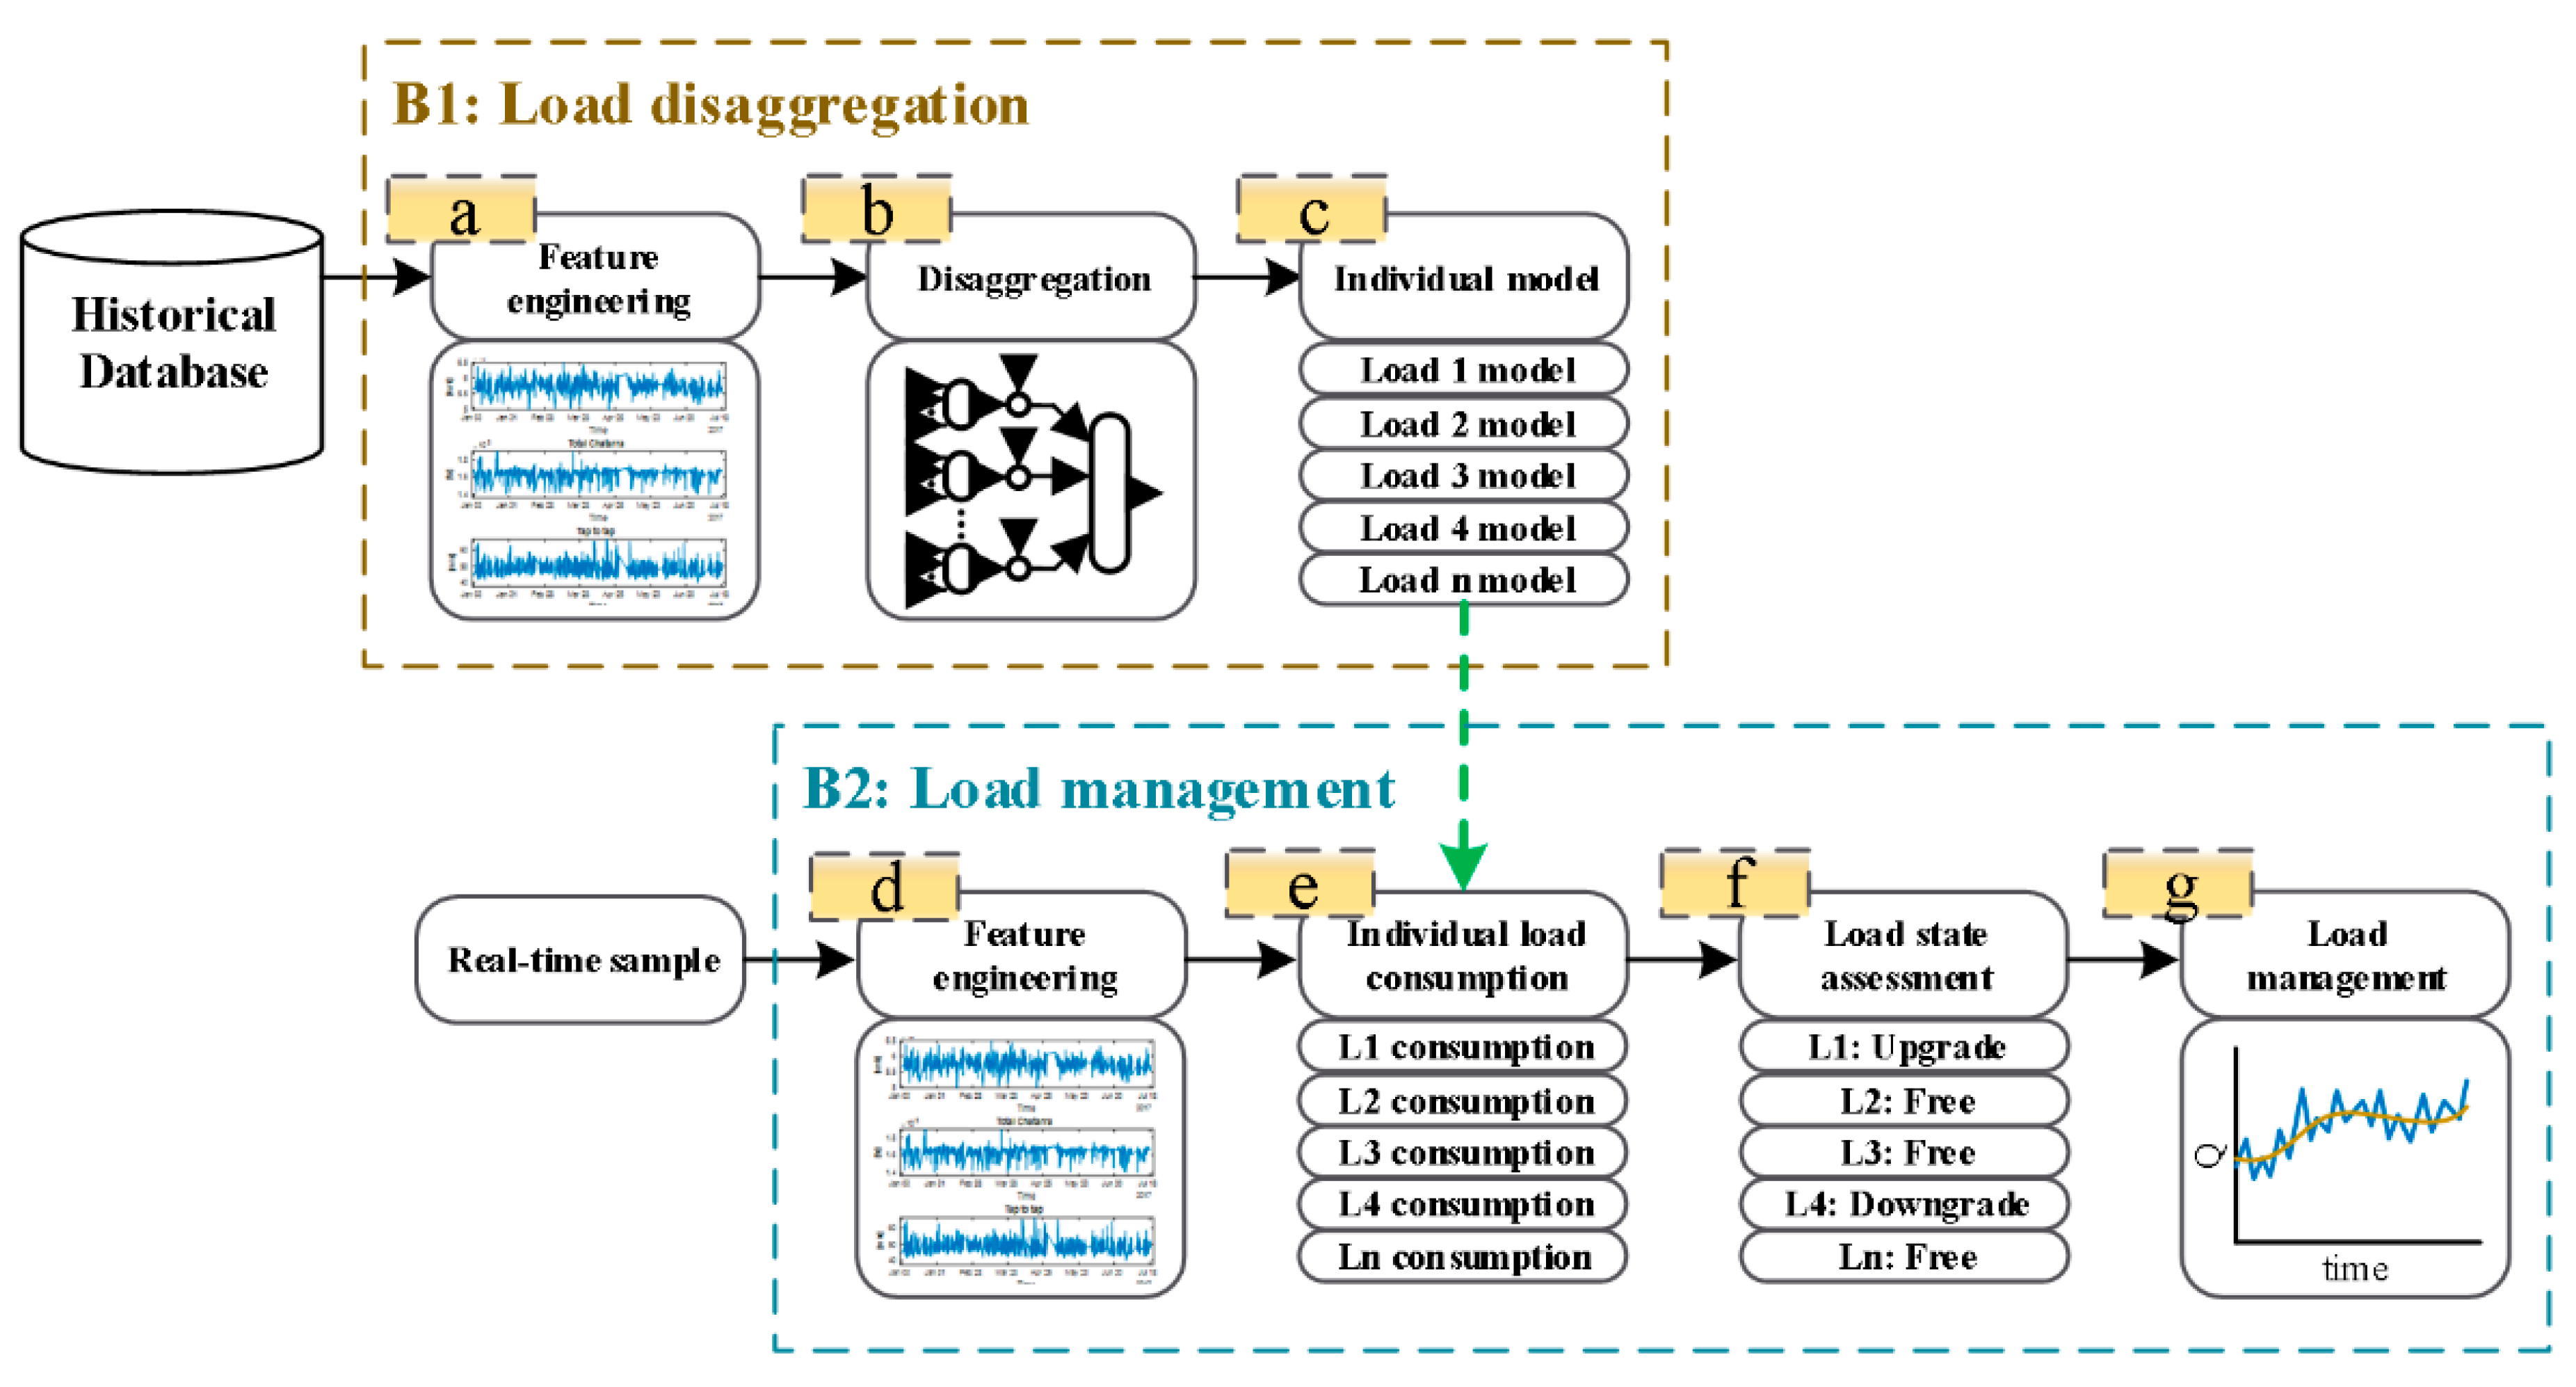
3. Overall Load Management Methodology
The proposed load management methodology is depicted in Figure 6, which is defined in two main blocks, the first focuses on solving the individual energy monitoring issue by means of a disaggregation strategy and the second block manages the cooling loads in order to reduce the compressors simultaneity. Such strategy is applied in order to increase overall energy efficiency in terms of electricity consumption by reducing the time that a second compressor is used without being necessary.
The methodology begins with the generation of a model that defines the individual consumption of each space to refrigerate (Load disaggregation). The model of each individual cooling load is fitted using only the historical operation data and the aggregated consumption as target. Considering that most of these systems do not have access to labelled data to train the models due to the elevated cost of the instrumentation, and taking advantage of the benefits of having historical operation data, a semisupervised technique is proposed to solve this NILM problem. To provide a clear following of the description of the proposed solution, each step of the methodology is labelled with a letter (from a to g).
First of all, in (a), a feature engineering step is employed to develop new appliance characteristics based on its operation information, such as the elapsed time since the machine was turned on/off or the number of machines operating. These new features are used as inputs to the subsequent step to improve the system characterization and disaggregation capabilities. Afterwards, the algorithm designed for the disaggregation task is trained using the aggregated consumption data as target and the previously computed features, together with the system signals, as inputs (b). Finally, and to finish this first disaggregation block, the model of each load is obtained separately by the proposed algorithm structure (c).
With the disaggregation task completed, the methodology manages the demand response in order to improve the efficiency in the generation side of the system. The real-time data acquired from the system PLCs are used to perform the same feature engineering (d) as in the disaggregation step (b). Thus, the same features can be used to identify the individual consumption of each load. To accomplish such task, and besides the mentioned features, the models created in the previous step (c) are also utilized in this step (e).
The demand necessities of each space to refrigerate, named S, which can be e.g., a cooling tunnel, a cooling chamber, etc., are now evaluated in regard to the temperature set point together with the current temperature and its variation. To do such task, each S is assessed in step (f) to increase or diminish its power consumption and also, to be able to recognize the spaces to refrigerate that can be used to modulate the whole consumption. The aforesaid assessment is performed using the tags: increase, when more power its necessary to refrigerate the space, decrease when the space is colder than its necessary, or free to designate the spaces which are within its correct temperature range and can be used to mitigate changes in the current load demands.
Thus, the product temperature conditions are guaranteed and never altered by the management strategy as the modifications are done only with the spaces with the “free” tag. The selection of the rules for such assessment parameters is critical for product quality, hence, they should be chosen by process experts taking into account the kind of load that each S work with.
Finally, the last module (g) manages the loads to combine them in order to manage the demand response, which is the final objective of this methodology. In this regard, this module is in charge of modifying the evaporators management of the loads that are within its desired temperature bounds, assessed as “free” in step (f), according to a defined optimization cost function. In this regard, the cost function of the algorithm is defined to smooth as much as possible the aggregated consumption curve . By smoothing , we are indirectly trying to preserve a single compressor operation and avoiding switching actions, since the changes of the load that might cause the switching of a new compressor are mitigated with the switching of the evaporators of each S that is within the temperature deadband. Therefore, this step is able to operate the compressors in a more efficient partial load ratio (PLR) while avoiding unnecessary and harmful switches.
3.1. Load Disaggregation
The NILM approach for cooling loads is detailed and validated, with a mathematical simulation performed in Matlab and in a real refrigeration system, in our previous work [25]. However, as part of the methodology presented in this article, a brief summary of the disaggregation structure is presented.
In general terms, the NILM is performed with a neural network structure. The structure uses the inputs selected and created in the feature engineering part to model the aggregated consumption signal. Even though the structure is trained with the aggregated consumption, it is able to estimate the individual load of each S.
The structure is made up by three main layers: the first one composed by various multi-layer perceptron neural networks (MLP) in charge to model the behavior of each S, the second one composed by a neuron in charge to activate or deactivate the output and the weight update of its previous MLP, and the third one in charge to aggregate the output of the previous layers in order to train the model with the aggregated consumption.
The first layer contains as many MLPs as spaces to refrigerate. Each MLP can be seen as an individual network, but they are trained together with the same aggregated consumption signal as target due to the summation layer that connects all the previous outputs.
The second layer has the functionality to enable or disable the output of each MLP according to the refrigeration space status (ON/OFF). This refrigeration space status is the signal of the evaporators allocated in each S. In case that the evaporators of a specific S are OFF, its MLP should not contribute to the total consumption. This layer helps the proposed structure to learn the load of each S.
Finally, the last layer is used to sum all the previous sub-nets output and generate the aggregated output. Thus, the whole structure is able to be trained simultaneously with the whole consumption signal, .
The mathematical expression of the proposed three-layered network structure is presented in Equation (1):
where is the estimated aggregated signal, the number of available spaces to refrigerate, the n-th MLP weights, the n-th MLP inputs, and the n-th space to refrigerate status (ON/OFF).
3.2. Load Management
Knowing the consumption of each evaporator of the refrigeration system thanks to the disaggregation, and being aware of the operation restrictions in order to maintain the product quality, a mathematical optimization problem arises to manage the load for reducing the compressors simultaneity and preserving the compressors in efficient cooling capacities. The optimization algorithm can be approached as an integer non-linear problem with the objective to find the best number of evaporators turned ON in each S in order to minimize the consumption variability, as shown in Equation (2).
The main concern of any optimization algorithm is the selection of its associated cost function. Such cost function is intended to modify the demand curve progressively, and reduce the compressors simultaneity time and the global amount of compressor switching. Therefore, the designed cost function variates the number of operating evaporators to modify the demand shape:
where:
Being the cooling load consumed by an evaporator obtained with the disaggregation consumption model, N the number of spaces to refrigerate, where (N = total number of S), and the number of active evaporators. The number of active evaporators in a space to refrigerate is modified according to an assessment strategy. This fact can be done due to the previously explained permissible temperature range of each space to refrigerate.
Each space evaluates the necessity of to preserve the set point conditions, thus, some of the spaces to refrigerate are forced to “upgrade” or “downgrade” by means of starting or stopping evaporators. Otherwise, if the space to refrigerate is within its deadband, assessed as “free”, the optimization solver can choose the number of evaporators that minimizes the function. With such free spaces, the load can be managed to achieve the desired objective. Mathematically speaking, such assessments are described as bounds in in the selection:
In the displayed boundary functions Equations (4) and (5), and refer to the upper and lower boundaries respectively and is the max amount of available evaporators. The multiple h are the fixed thresholds selected using each space to refrigerate deadband and cooling necessities. Such cooling necessities can vary depending on the type of the product to refrigerate, the characteristics of the space to refrigerate, or the machinery installed in each space.
Finally, is the temperature ( error regarding the set point () displayed in Equation (6) and is the temperature difference among two consecutive timesteps, Equation (7):
As the formulated optimization problem is non-linear, a little trick is performed in order to transform it to linear and reduce its complexity, and hence, its computation time [32]. The trick consists in dividing the problem into two linear optimization problems shown in Equations (8) and (9):
Finally, the lowest of the two solutions is selected in order to recommend the number of evaporators in each space.
The results of the load management methodology aim to reduce the time with two compressors operating and increase the efficiency of the compressors by maintaining its cooling capacities in the optimal zone.
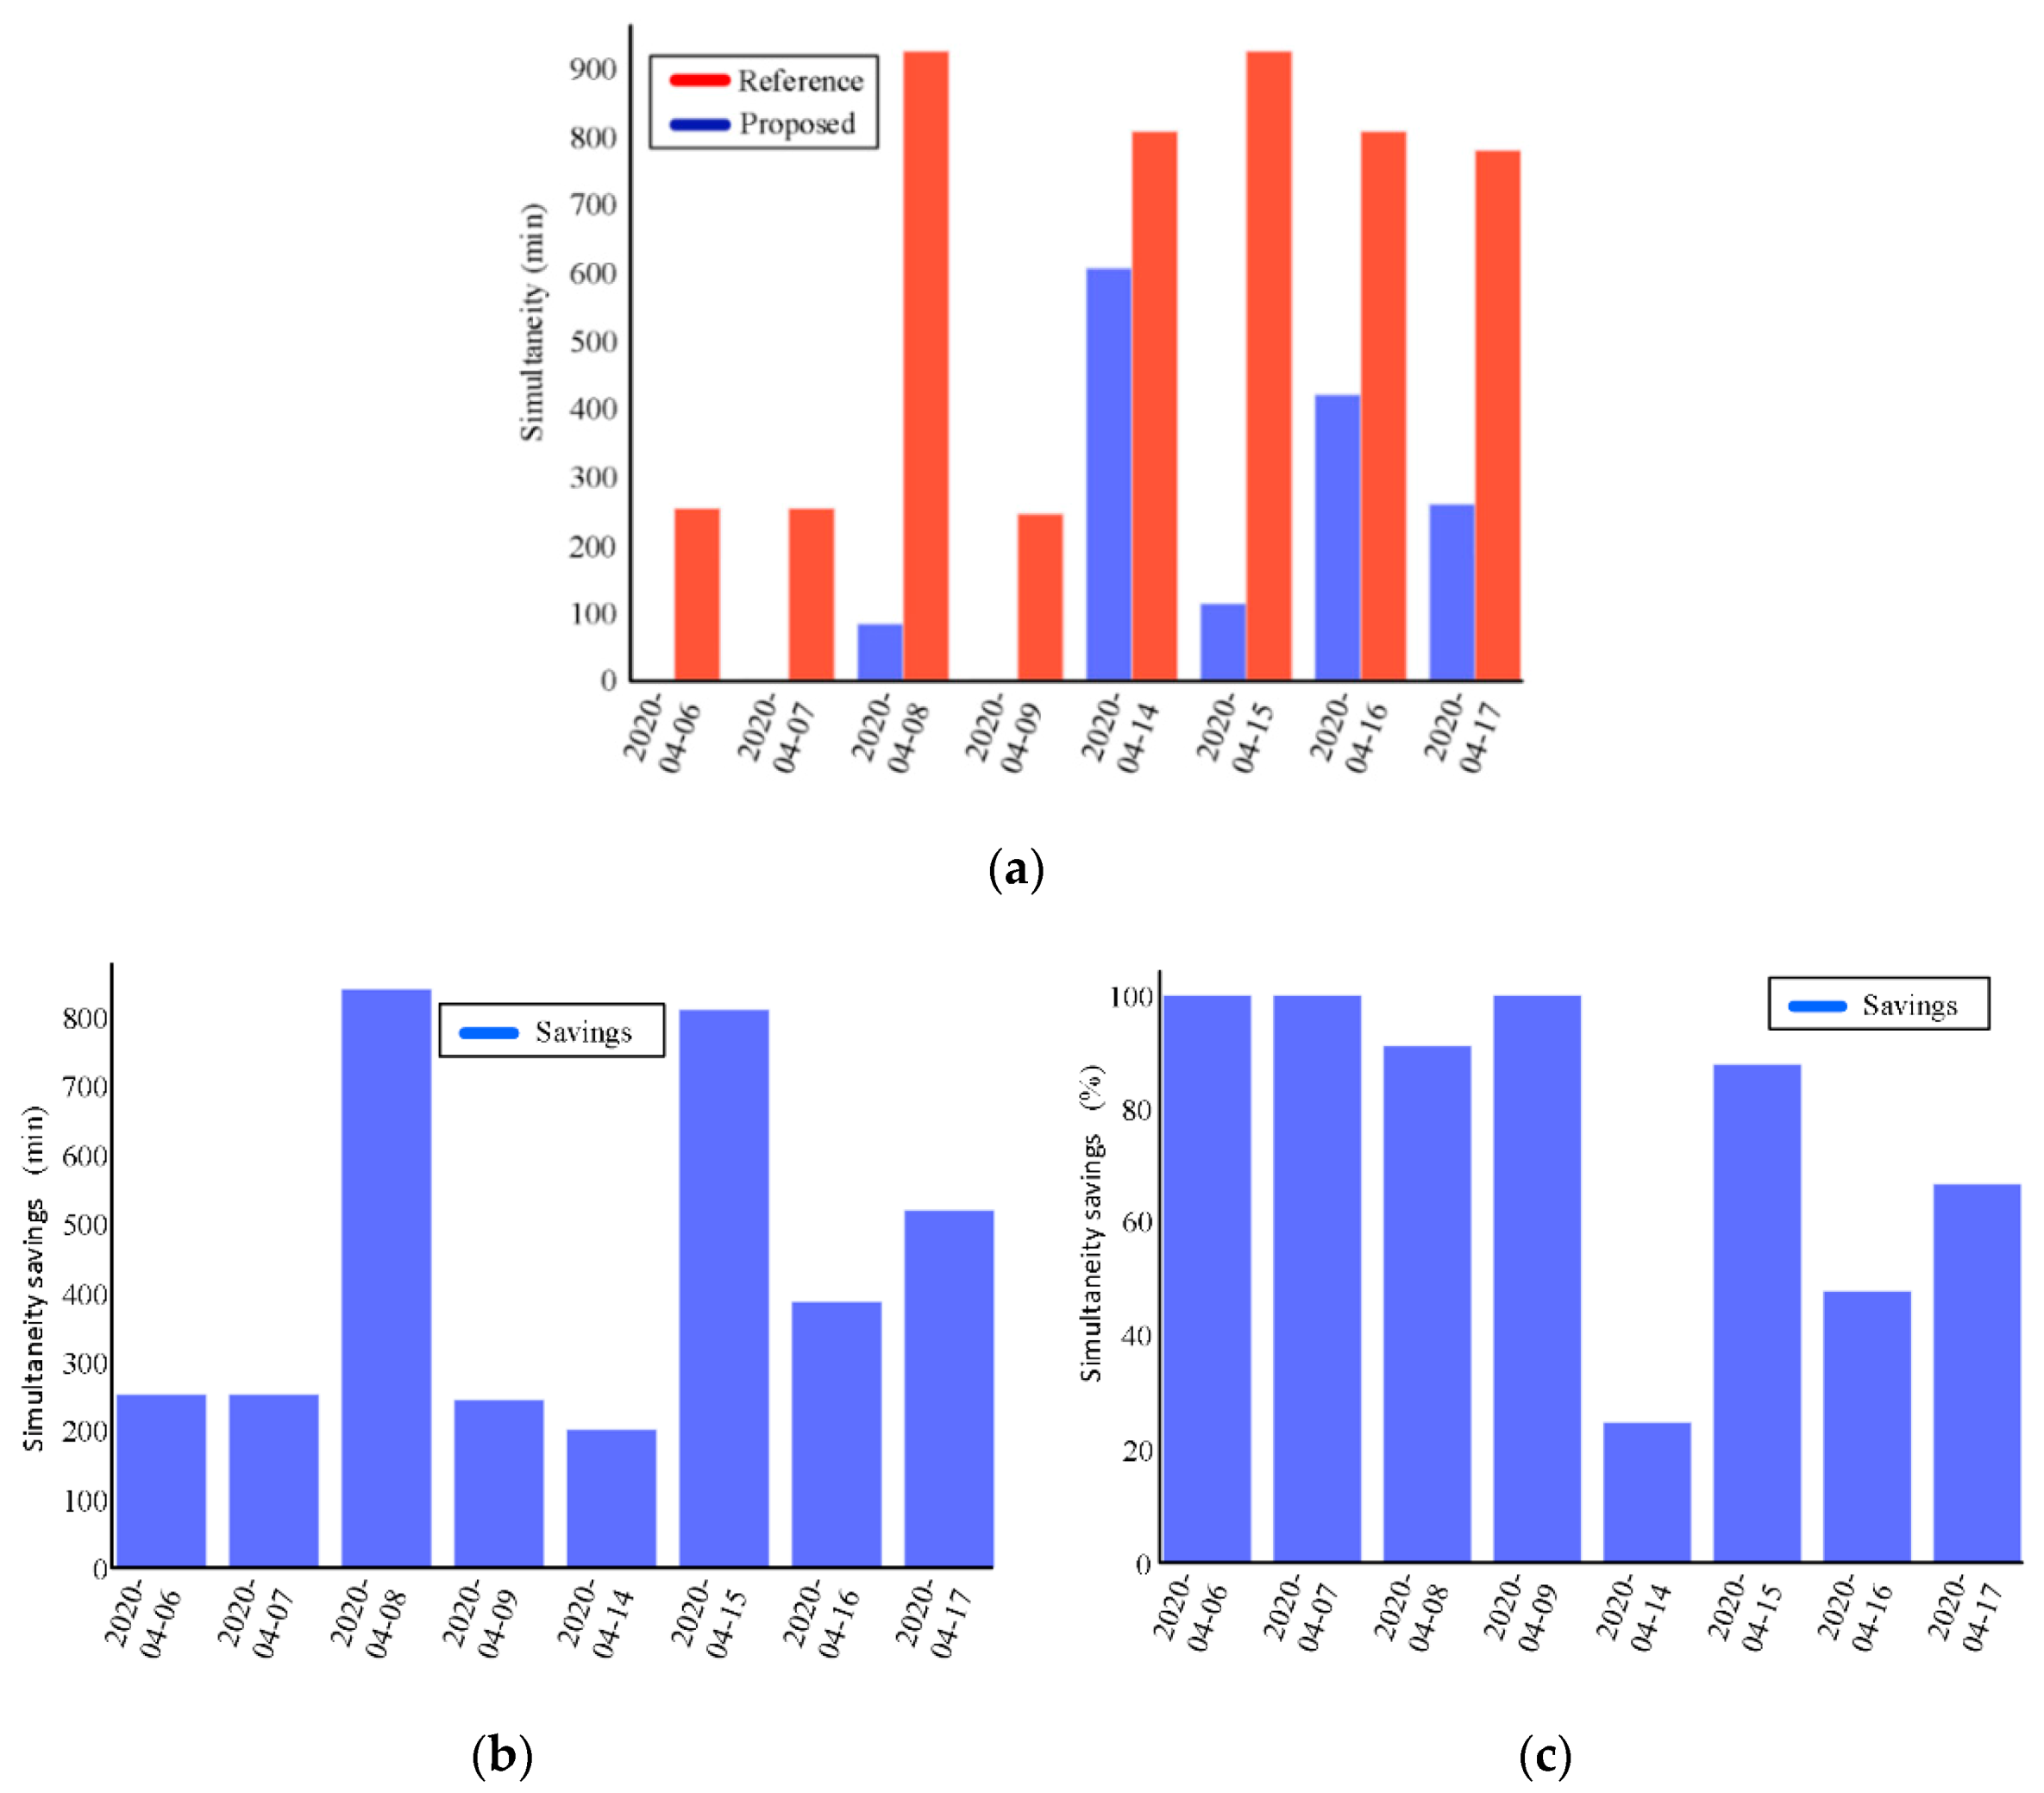
Note that the validation of the impact of such load management strategies applied in a real scenario is not common in the literature. For this reason, two different scores have been used in order to quantify the impact of the proposed methodology. These scores are the simultaneity coefficient, and the time that the compressors are operating in high efficiency cooling capacities.
Firstly, this simultaneity coefficient measures, in minutes, how much time two compressors have been working in parallel, as shown in Equation (10). This is a key parameter that should be minimized, since worst performances are achieved when the refrigeration system is operating with two compressors in parallel in situations where they are not required:
Being and the compressor status (ON/OFF) in the timestep i and I is the number of minutes of a day, 1440. This metric is used as follows: in most scenarios this simultaneity happens when a peak occurs and a second compressor is needed to supply the demand necessities, e.g., situations where a new refrigerated space is turned on or some load is input to a refrigerated space and forces the operation of multiple evaporators in parallel. After these situations, and due to compressors constraints, even the peak has already passed and the second compressor is no further needed, it remains operative to minimize the starts and stops, leading to a poor performance operation. The load management should reduce the simultaneity time where the system operates with two compressors.
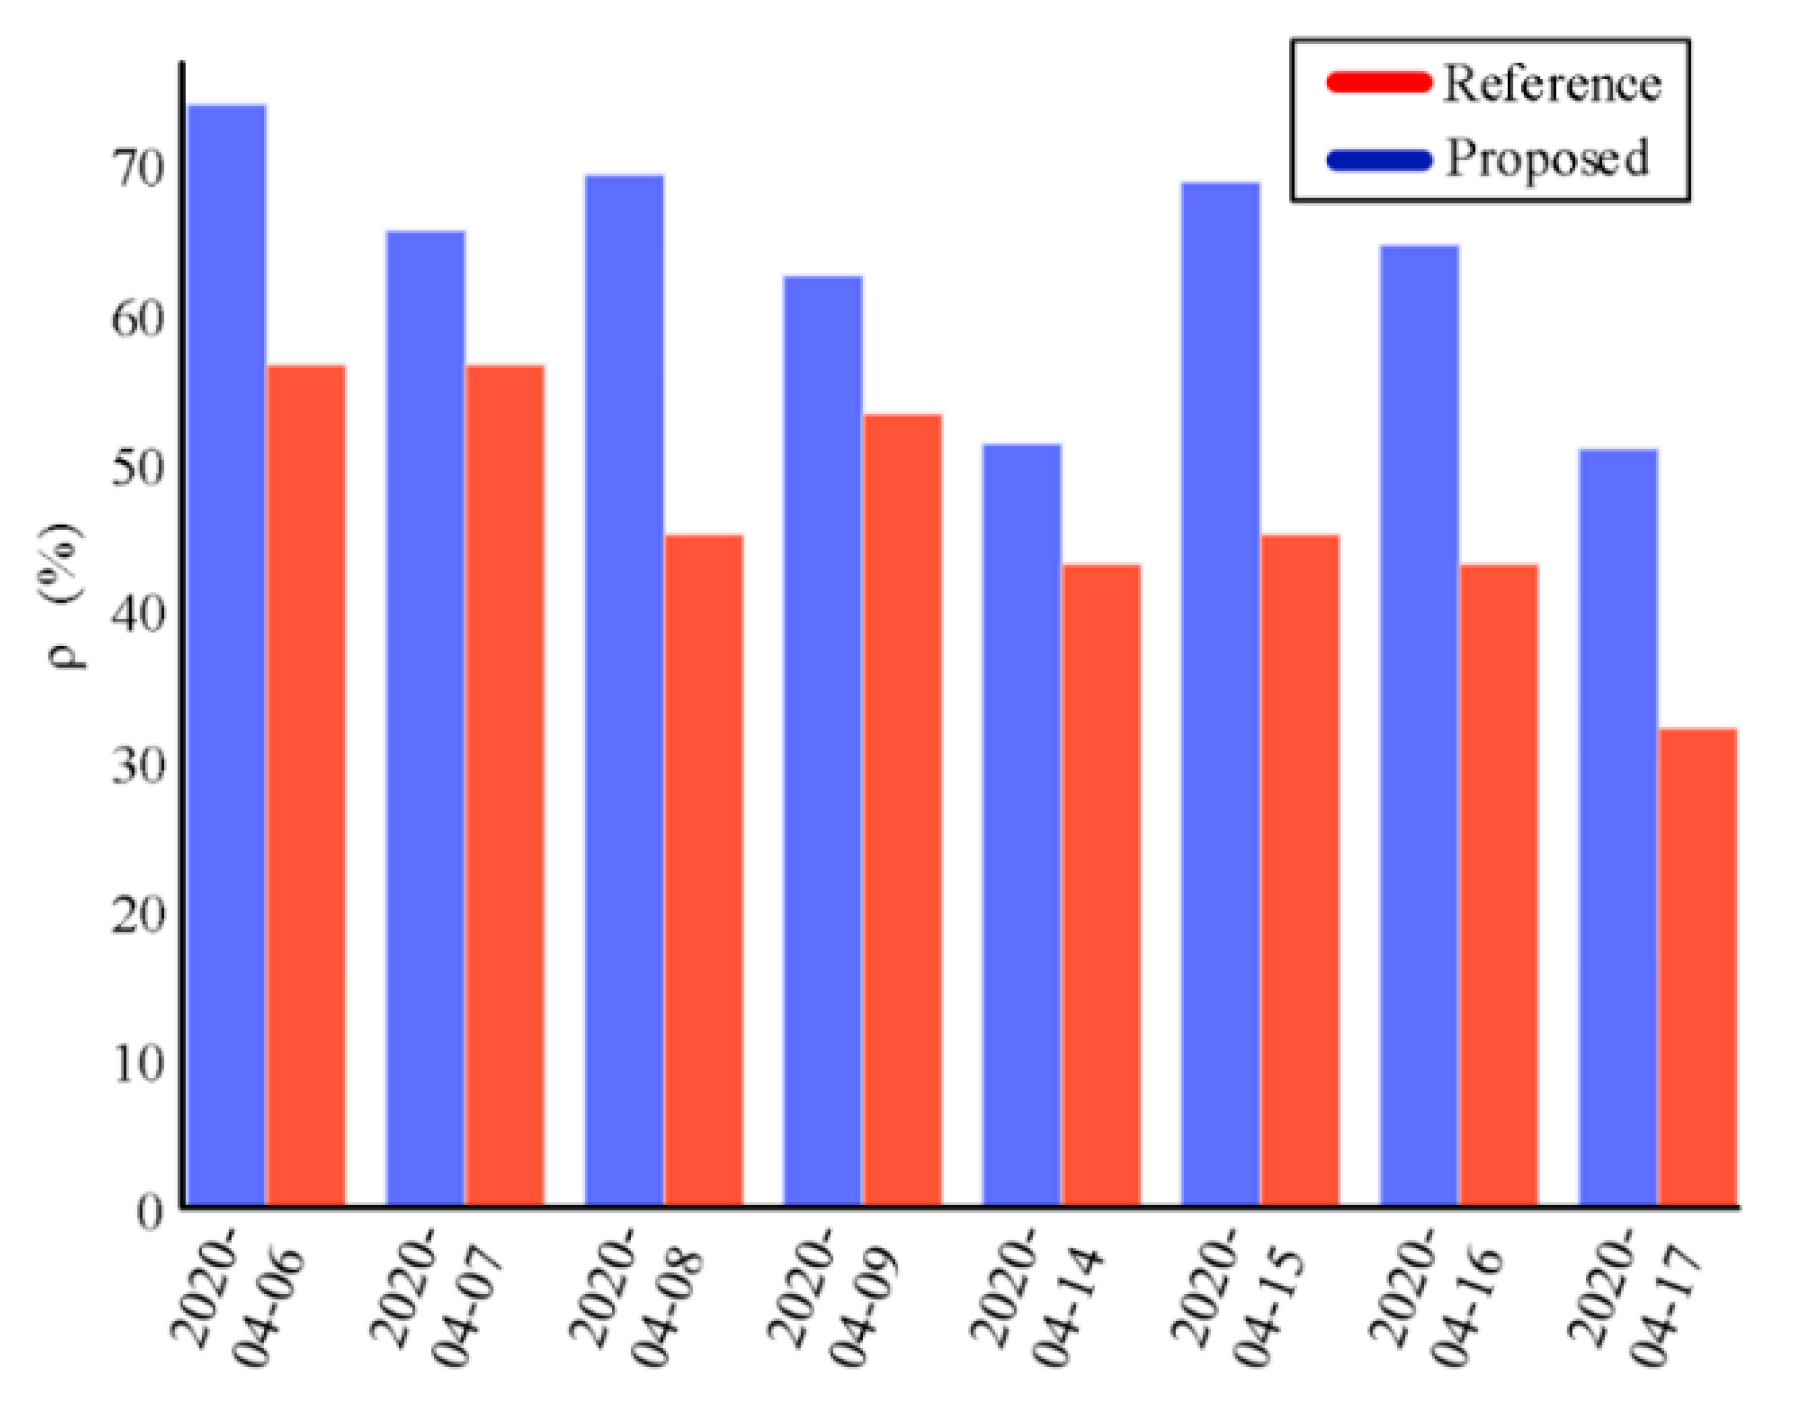
Secondly, to measure the compressors performance, the partial load ratio (PLR) is directly employed. The compressors efficiency is highly related with its PLR, which is the percentage of cooling capacity provided. Typically, compressors are designed to operate efficiently in its nominal PLR conditions, which are about 90–100% of its total cooling capacity. Therefore, higher partial loads mean higher efficiencies, hence, the PLR is used to measure the compressors efficiency. The metric is formulated as in Equation (11), which measures the percentage of time per day that the compressors were operating above 90% of its PLR (:
Being and the operating time per day of compressors one and two respectively in minutes and and the operating time above the 90% of PLR per day of compressors one and two respectively in minutes.
4. Experimental Results
The methodology is validated applying the proposed methodology in an industrial refrigeration plant composed of two compressors in parallel and 8 spaces to refrigerate (S). However, one of the spaces cannot be managed due to instrumentation and process constraints. Hence, the disaggregation step is performed in S1–S8 but the management is only performed in S1–S6 and S8 excluding S7 that cannot be controlled.
First of all, a fundamental step in the proposed load management methodology is the cooling load disaggregation. The proposed neural network structure is developed employing a whole year of data with a sampling rate of a minute, using 3 weeks of each month for training and the remaining one for testing. Thus, using the minutely recorded data from each timestep and the multiple variables from the evaporators, some features are created to train the neural network structure, listed in Table 2.
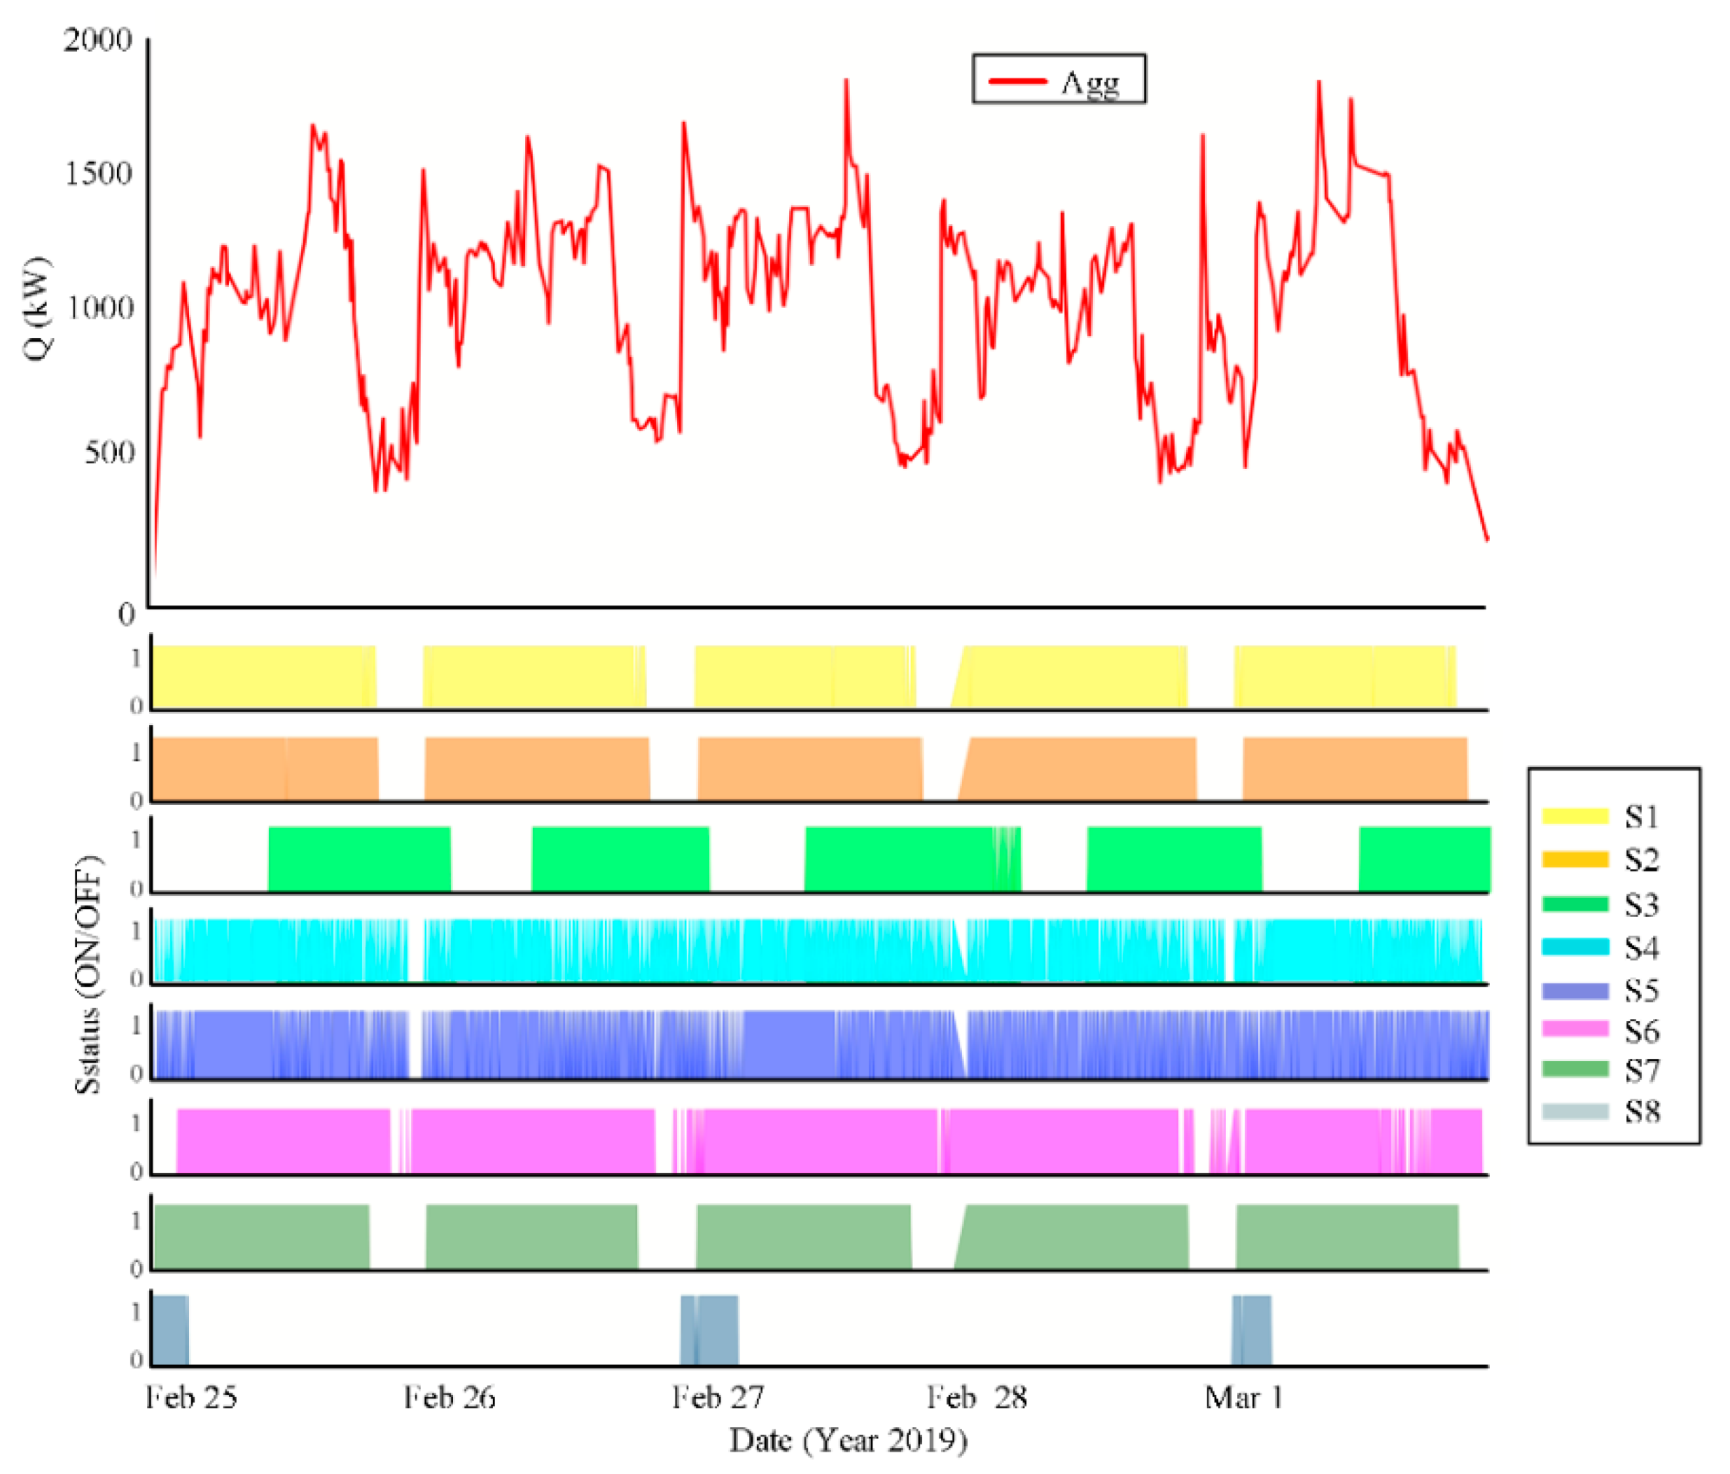
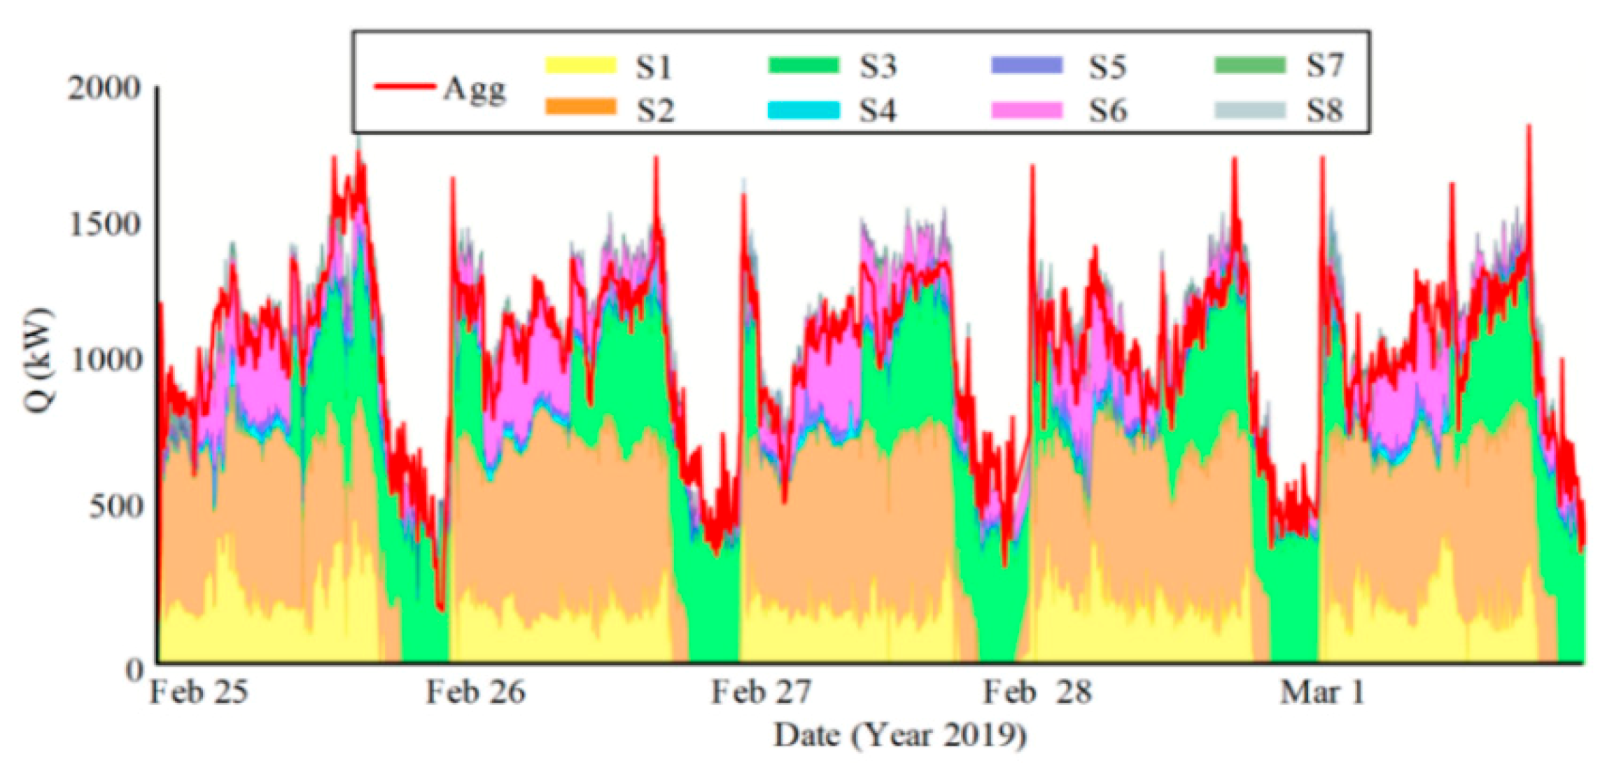
From the refrigeration system signals, we obtain the aggregated cooling consumption and the state of each space to refrigerate, depicted in Figure 7. In the situations where the state of a specific S is OFF, such S does not contribute to the aggregated consumption. With such information, and employing the disaggregation technique, the consumption estimation of each S is obtained as depicted in Figure 8. The shape of the estimated individual consumptions is highly influenced by various factors such as the dimensions of the S, the quantity of load, the type of process performed in such S, the number and power of evaporators installed or the location and isolation of the space. Therefore, the individual duration and contribution is different for each S depending on the aforementioned factors. For example, S2 has the highest contribution due to the dimensions of the space to refrigerate and the quantity of load processed in it, while the S5 is almost always ON as the space it is used as a storage where there is load almost all the time.
Using the individual consumptions estimated, and during the evaluation of real data, each space to refrigerate is assessed with a certain tag depending on its temperature requirements, Figure 9. These assessments to tag the necessity are expressed in the boundary equations of the optimization problem, formulated in the methodology description, Equations (4) and (5). The multiple h parameters of such equations, as mentioned before, since can influence the operation of each S, are selected according to the system experts’ opinion. Such parameters are shown in Table 3.
Basically, the tags assigned in each space are used to force an upgrade, which means an increase of cooling turning on more evaporators, or a downgrade, which demands a decrease of the cooling capacity turning off some evaporators. In the case that the space is in the desired temperature range, which can be assessed as free, the optimization algorithm can choose the number of evaporators in order to avoid the consumption peaks.
In practice, some safety management rules have been integrated: the upgrade assessment is forced to be at maximum of one evaporator if they are not all already on, and the downgrade is forced to be at maximum of one evaporator also, if they are not all already off. These constraints are employed to diminish the abrupt changes in cooling capacity and temperatures. In addition, the refrigerated spaces which are not constrained with the upgrade or downgrade assessment are also limited regarding the number of evaporators. The maximum modification in regard the current number of evaporators is limited to two evaporators for the same reason as in the other assessments. These measures are performed according to the methodology goals and with the advice of the refrigeration system experts.
At this point of the methodology, the optimization problem presented in Equation (2) is solved by means of the default CBC solver of the PuLP library provided by [33]. Due to the online nature of the load management approach, and without the necessity to train the methodology as the disaggregation should be already trained, the proposed method is validated directly to the refrigeration system. For this reason, the load management methodology is validated in real-time in the refrigeration system within 8 consecutive days of operation. The gap between the two working weeks is due to the eastern holidays.
To be able to compare it and validate its improvement capabilities in regard to the compressor performance, each validation day of operation is compared with a reference day. The reference day is the most similar day found in one year of historical operation taking into account some key parameters or variables: the suction pressure, discharge pressure, and cooling capacity of the available historical dataset, which are the main variables that affect the compressor performance, and can be used as a reference to compare similar days in operational and load demands. Further information of the importance of those variables is explained in our previous work [34].
In this regard, Table 4 shows the values of the variables from the tested day with the proposed method against the values of the day used as a reference. As it can be seen in the table, no huge differences in the variable values can be found between both days, the tested and the reference, and hence, a realistic evaluation can be made.
Figure 10 illustrates the effects of the proposed load management methodology measured with the simultaneity metric, explained in the Section 3.2. As it can be appreciated in the figure, the proposed methodology spends less time with two compressors than the reference days, which means less simultaneity. During the tested days, a substantial reduction of about 438 min of the second compressor operation per day is achieved, which means a reduction of about the 77% of simultaneity in regard to the reference. These results confirm the capability of the proposed load management methodology to modulate the consumption signal in order to reduce the usage of the second compressor.
From Figure 11, it is observable that during the working days tested with the proposed methodology, the compressors operate more percentage of the time with high PLRs according to the proposed metric detailed in Section 3.2. The mean of the proposed solution is about 63% while the reference is about 46%, that means an increment of about 17% of time working in a more efficient PLR conditions. The proposed load management methodology forces the compressors to operate in higher partial load ratios, reducing inefficient PLRs caused by the operation of two compressors in parallel in low cooling capacity scenarios.
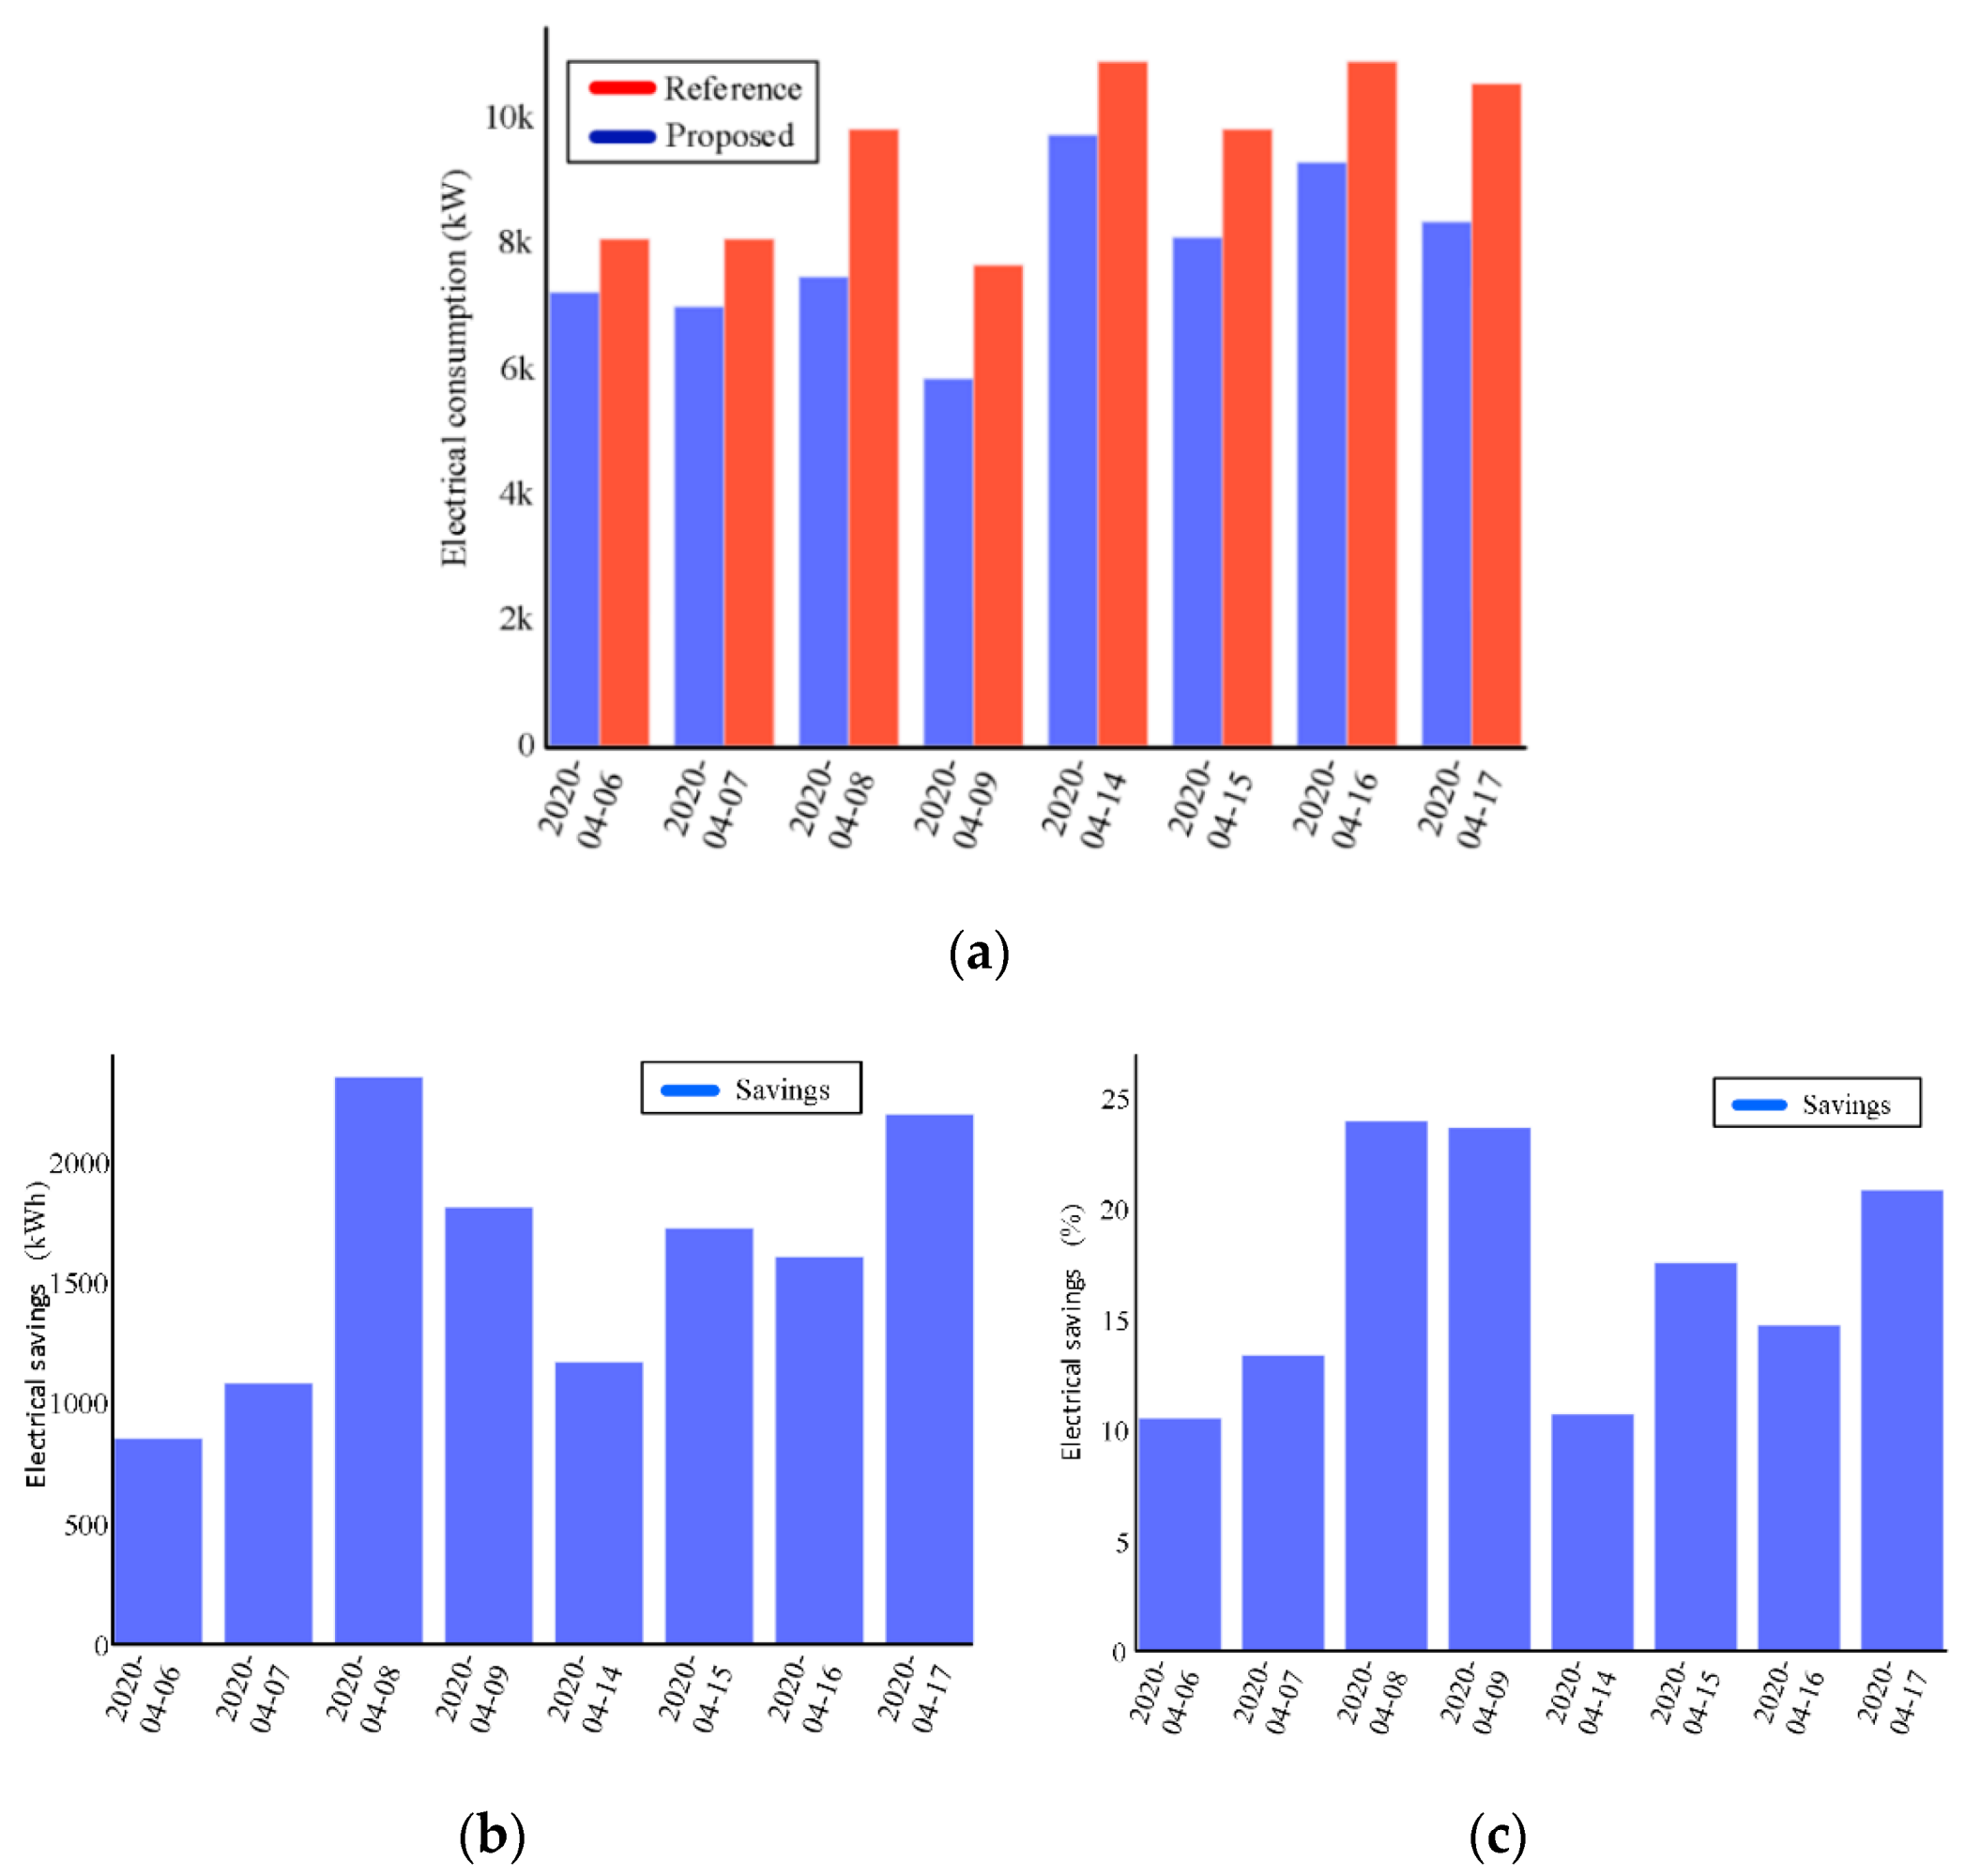
With these two measurements, it is noticeable that the proposed methodology reduces the time with two compressors operating in parallel and increases the efficiency of each compressor while they are operating. Once these two aspects are validated, Figure 12 illustrates how this methodology affects the consumption in terms of electricity expenditure, which is the main goal in order to be more efficient and save energy. The proposed management methodology allows to produce the same cooling capacity during the tested days, reducing the electrical energy consumption and without influencing the schedule of the process performed in each S.
Observing such results, it can be concluded that the methodology demonstrates its effectivity reducing the energy expenditure of the compressors by reducing the simultaneity and increasing the PLR. By managing the evaporators of the system, hence the load, the compressors reduced its consumption per day about 1600 kWh, which means a reduction of about a 17% compared with the reference days.
It is confirmed that the load management affects the compressors operation, since that they are able to supply the same with the expenditure of less electrical power, however, to fully ensure the effectiveness of the methodology, it is necessary to ensure that the temperature set points of each space to refrigerate are correctly maintained. There is no use in reducing the energy expenditure if the desired objective, which is the proper refrigeration of the products, is not achieved.
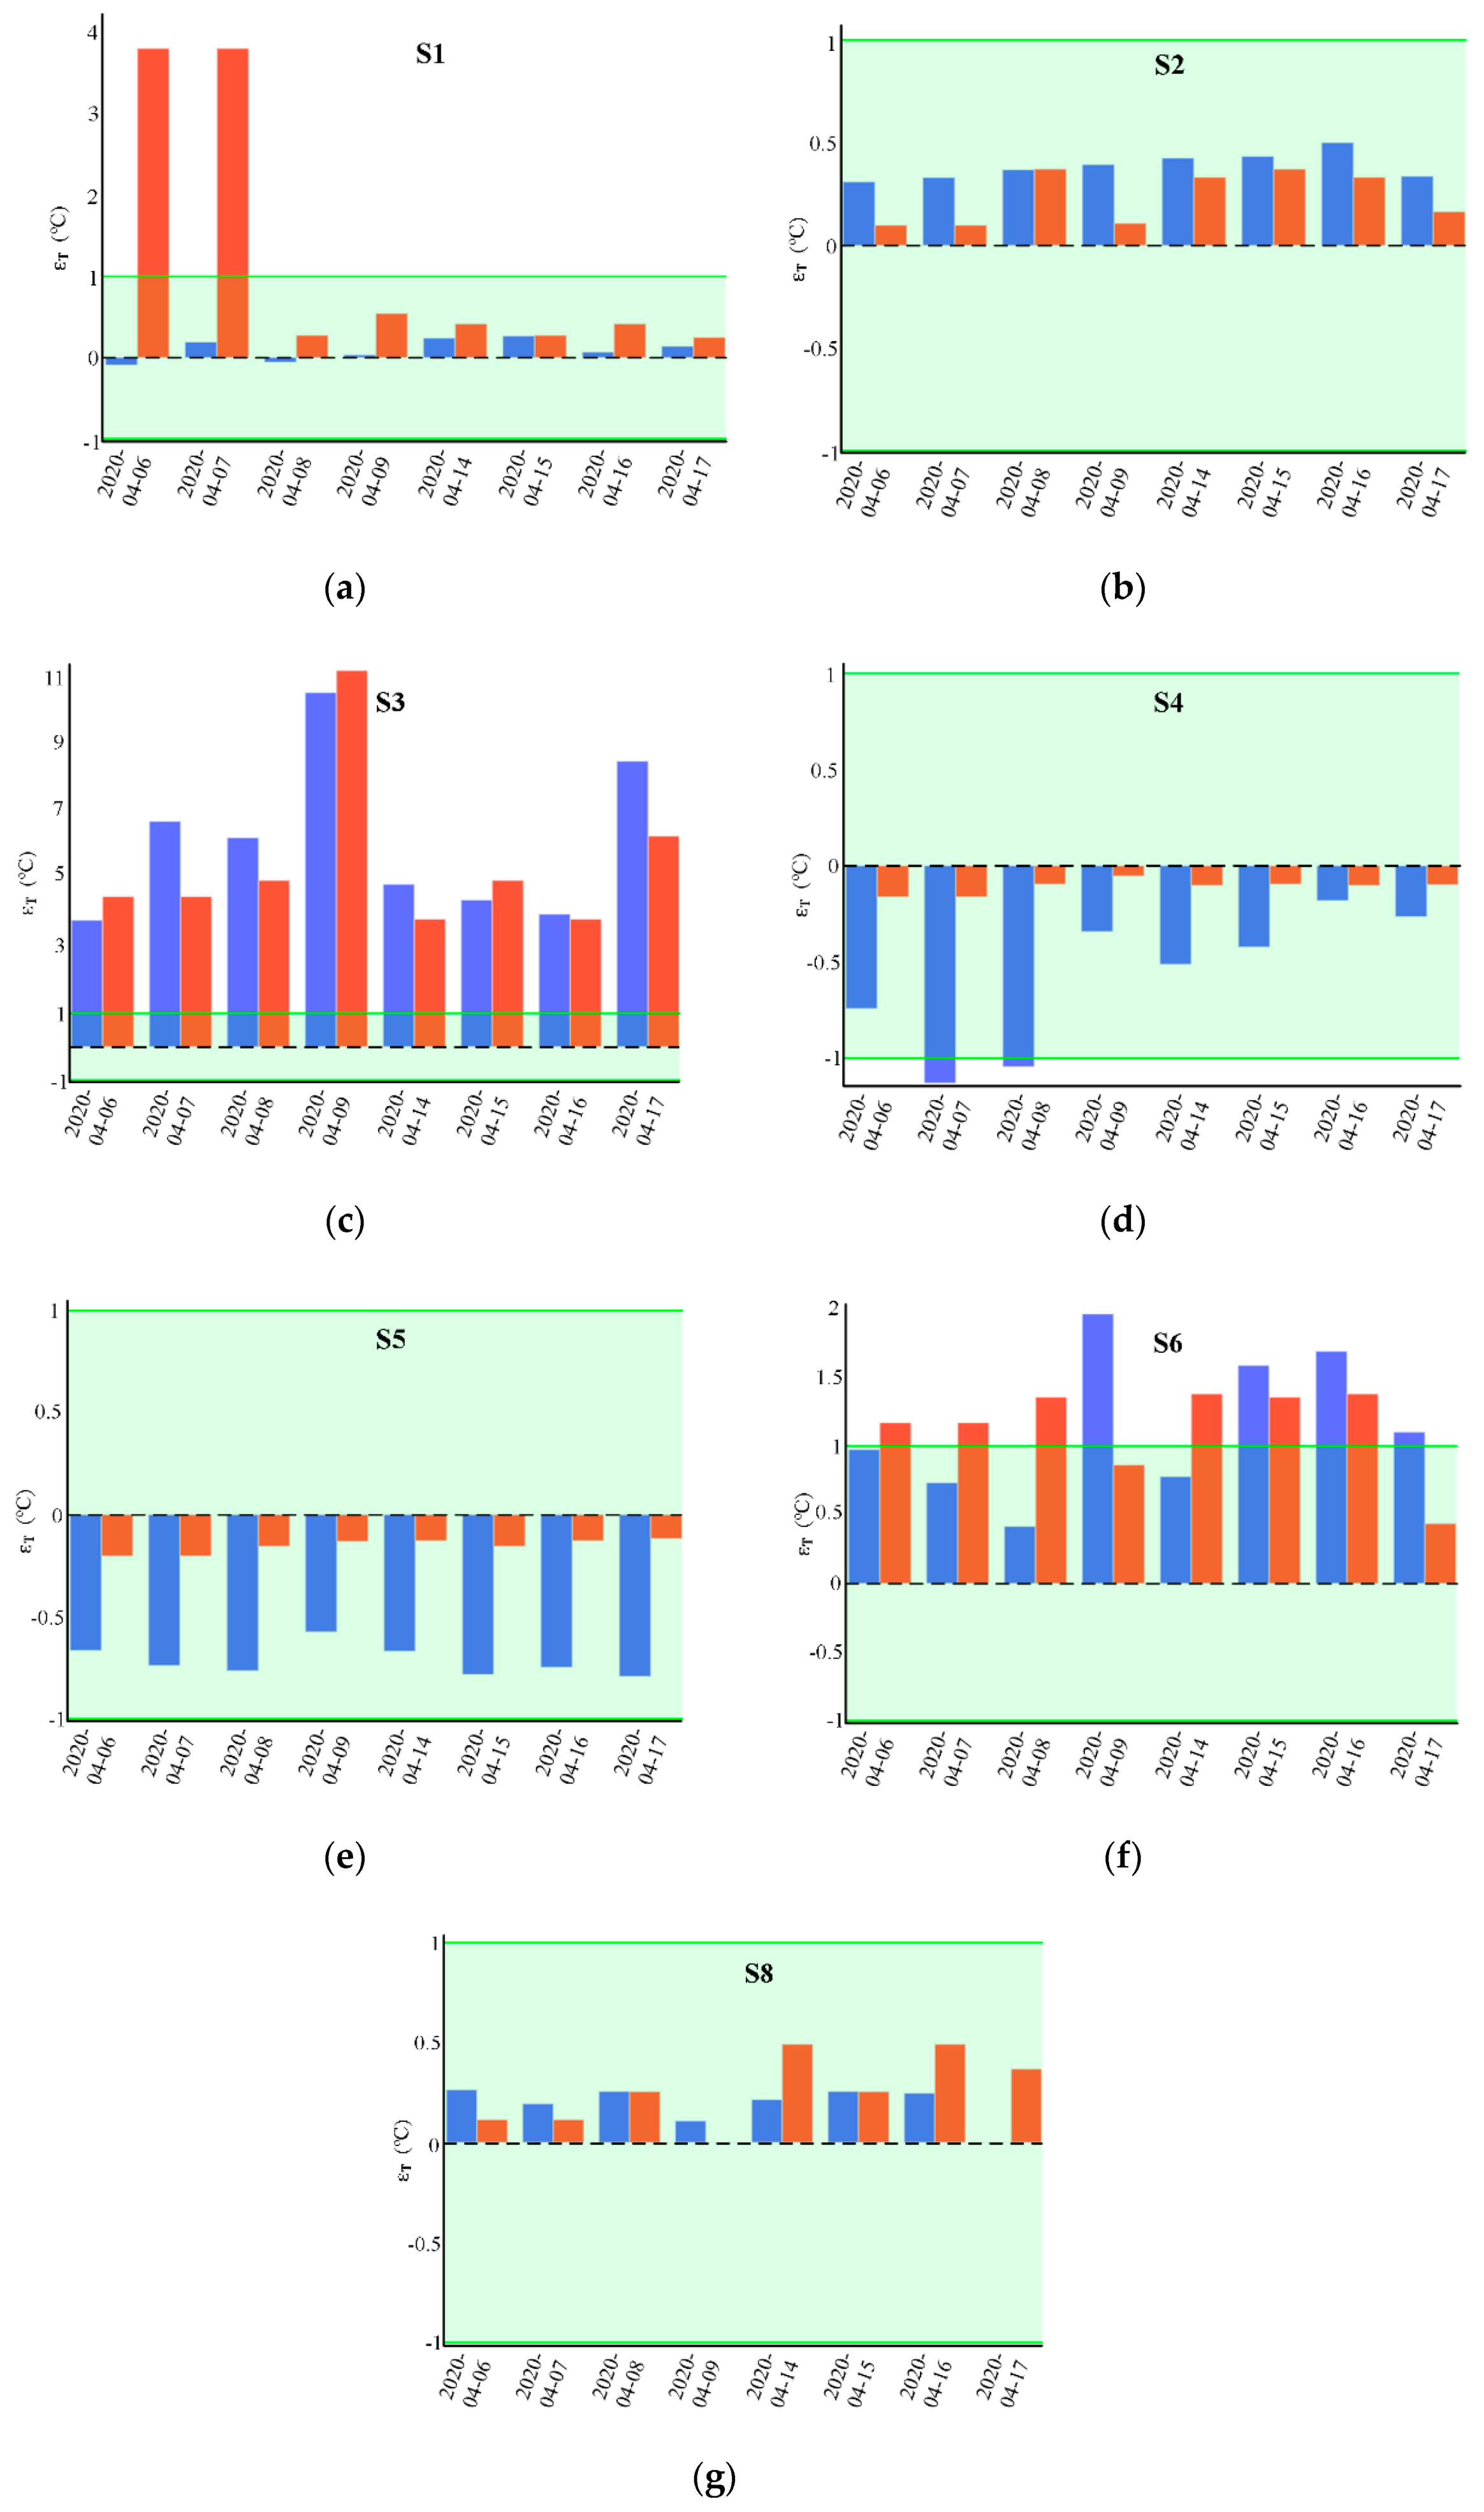
Figure 13 depicts the mean temperature error of each day in each space to refrigerate. This error is only measured when the S are operating, since when there is no load in them, the refrigeration is stopped. According to experts, and following the historical control rules, each set point has 2 degrees of deadband, one above and one below the set point, where the temperature error is admissible. Nevertheless, the desired set point is depicted with a dashed line.
Figure 13 demonstrates that the temperature errors of the proposed load management methodology are similar to those of the historical control. Most of the spaces to refrigerate are within its deadband, except the S3 which is mostly outside, both with the proposed method and with the historical one. This situation happens due to the power limitations of the evaporators in such space.
In addition, note that S4 and S5, although being in the green zone, they tend to be overcooled. The management methodology uses them as a cooling battery to smooth the demand, since they are usually assessed with the free tag. This can be done as the evaporators of these spaces are oversized.
These presented experimental results allow to validate the capability of the methodology to increase the compressors operation efficiency while maintaining the temperature as well as with the historical control.
5. Conclusions and Discussion
This article has demonstrated that load management is an effective indirect approach to increase the efficiency of the refrigeration system compressors. In the proposed methodology, the estimated individual consumption of each cooling load is employed to perform a load management strategy suitable for stochastic loads behavior. In the results, it is shown that a reduction about 17% of the electrical consumption of the compressors is achieved and a reduction about 77% of the operation time with two compressors working in parallel as well. In addition, all the savings are obtained without compromising the temperature requirements of the food stored in each space. Such results indicate the suitability of applying data-driven approaches for improving energy efficiency in industrial refrigeration systems.
Further discussion of the main aspects of the paper is given below, in this regard, the contributions presented in this article can be used in any industrial refrigeration system to reduce the electrical energy expenditure as well. The findings exposed in the experimental results are validated with a system composed by two compressors, nevertheless, it can be also applied with more compressors operating in parallel. The type of compressor does not affect the obtained simultaneity results, however, the efficiency in PLR terms, can be different, depending on the compressor technology. Further studies should be performed in order to quantify the benefits of the proposed load management with other compressor technologies in regard with its PLR.
Moreover, the methodology can be used as well in refrigeration systems that contain different number of spaces to refrigerate. On the one hand, more spaces to refrigerate would influence negatively the disaggregation error, leading to an effective but less optimal solution, while less spaces would increase the precision of the individual estimations, leading to a more optimal solution. On the other hand, with more spaces to refrigerate, appear more possibilities to manage the load, while with few spaces, the possible solutions are more limited. In addition, the type of space influences the improvement capabilities, as shown in the experimental results, some spaces do not have the possibility to modulate its load as they never reach the desired temperature deadband. Such characteristic along with the number of spaces, can limit the optimization capabilities.
The experimental results presented, illustrate the effectiveness and the robustness of the presented methodology. The load management has the capability to increase the system performance and it is demonstrated via the experimental tests applied in the industrial refrigeration system. Such promising results demonstrate the increase in system efficiency, reducing the simultaneity time with various compressors in parallel and reducing the electrical consumption. The simultaneity savings can also be beneficial in maintenance, since the compressors operate less hours and hence, the scheduled preventive tasks are less frequent. Moreover, since the compressors operation is reduced, less failures may occur, which minimize the probability of unexpected downtimes. Such results represent a significant improvement that points out the necessity of performing a proper management of loads in an industrial refrigeration system.
Lastly, a possible continuation of this research work is to investigate a way to parameterize the algorithms without the help of a system’s expert. Therefore, further research is needed to deduce from the system data the multiple optimization thresholds as well as the disaggregation parametrization. Moreover, it should be mentioned that the potential savings of the presented load management can be incremented combining this methodology with the compressors PLR set point recommendation of our previous work [35]. Thus, the load management guarantees the minimum time with various compressors operating in parallel, and the set point recommendation guarantees a near-optimal generation of the required cooling capacity.
Author Contributions
Conceptualization, J.C., D.Z. and J.A.C.; methodology, J.C., D.Z. and J.A.C.; software, J.C.; validation, J.C. and D.Z.; formal analysis, J.C.; investigation, J.C.; resources, J.C.; data curation, J.C.; writing—original draft preparation, J.C.; writing—review and editing, J.C., D.Z., J.A.C. and J.A.O.; visualization, J.C.; supervision, J.A.O.; project administration, J.A.O.; funding acquisition, J.C. All authors have read and agreed to the published version of the manuscript.
Funding
This research was partially funded by the Secretary of Universities and Research of the Department of Enterprise and Knowledge of the Generalitat de Catalunya under 2017DI007. The APC was funded by the University and Research Aid Management Agency of the Generalitat de Catalunya under 2017 SGR 967.
Acknowledgments
The authors would like to thank the support of Corporación Alimentaria Guissona S.A. for providing access to their refrigeration system dataset and their expert advices.
Conflicts of Interest
The authors declare no conflict of interest. The funders had no role in the design of the study; in the collection, analyses, or interpretation of data; in the writing of the manuscript, or in the decision to publish the results.
Abbreviations
| Symbol | Description |
| Agg | Aggregated signal |
| B | Number of available evaporators |
| C | Compressor |
| CBC | COIN-OR branch and cut |
| COP | Coefficient of performance |
| ETP | Equivalent thermal parameter |
| G | Number of switched ON evaporators |
| Threshold for the optimization algorithm | |
| I | Number of minutes of a day |
| L | Lower boundary of optimization algorithm |
| MLP | Multi-layer perceptron |
| MPC | Model predictive control |
| N | Number of spaces to refrigerate |
| NILM | Non-intrusive load monitoring |
| p | Pressure |
| PID | Proportional-integral-derivative controller |
| PLC | Programmable logic controller |
| PLR | Partial load ratio |
| PCM | Phase change material |
| Cooling capacity | |
| Estimated aggregated cooling capacity | |
| Estimated cooling capacity consumed by an evaporator | |
| U | Upper boundary of optimization algorithm |
| R717 | Ammonia |
| S | Space to refrigerate |
| Suction pressure | |
| T | Temperature |
| Number of minutes with the compressor switched ON per day | |
| Number of minutes with the compressor above 90% of PLR per day | |
| TES | Thermal energy storage |
| Temperature set point | |
| Temperature difference | |
| Temperature error | |
| Percentage of time that a compressor is above 90% of PLR | |
| Number of timesteps elapsed since the evaporator was switched ON | |
| Number of timesteps elapsed since the evaporator was switched OFF | |
| Neural network weighs | |
| Space to refrigerate status | |
| Neural network inputs |
References
- Abdelaziz, E.; Saidur, R.; Mekhilef, S. A review on energy saving strategies in industrial sector. Renew. Sustain. Energy Rev. 2011, 15, 150–168. [Google Scholar] [CrossRef]
- Antonakakis, N.; Chatziantoniou, I.; Filis, G. Energy consumption, CO 2 emissions, and economic growth: An ethical dilemma. Renew. Sustain. Energy Rev. 2017, 68, 808–824. [Google Scholar] [CrossRef] [Green Version]
- Banjo, S.; Bolaji, B.; Osagie, I.; Fayomi, O.; Fakehinde, O.; Olayiwola, P.; Oyedepo, S.; Udoye, N.E. Experimental analysis of the performance characteristic of an eco-friendly HC600a as a retrofitting refrigerant in a thermal system. J. Physics: Conf. Ser. 2019, 1378, 042033. [Google Scholar] [CrossRef]
- Oruç, V.; Devecioğlu, A.G. Retrofitting an air-conditioning device to utilize R1234yf and R1234ze(E) refrigerants as alternatives to R22. J. Braz. Soc. Mech. Sci. Eng. 2018, 40, 226. [Google Scholar] [CrossRef]
- Kojok, F.; Fardoun, F.; Younes, R.; Outbib, R. Hybrid cooling systems: A review and an optimized selection scheme. Renew. Sustain. Energy Rev. 2016, 65, 57–80. [Google Scholar] [CrossRef]
- Qian, X.; Yang, Y.; Lee, S.W.; Caballes, M.J.L.; Alamu, O.S. Cooling Performance Analysis of the Lab-Scale Hybrid Oyster Refrigeration System. Process. 2020, 8, 899. [Google Scholar] [CrossRef]
- Li, J.-B.; Xu, S.; Liu, F.-S. Influence of driving speed on absorption/compression hybrid refrigerant cycle. Jilin Daxue Xuebao (Gongxueban)/J. Jilin Univ. (Eng. Technol. Ed.) 2013, 43, 291–297. [Google Scholar]
- Chen, S.; Liu, X.; Fu, H. Design of Energy-saving Optimized Remote Control System of Chiller Based on Improved Particle Swarm Optimization. In Proceedings of the 2018 5th IEEE International Conference on Cloud Computing and Intelligence Systems (CCIS), Nanjing, China, 23–25 November 2018; pp. 299–304. [Google Scholar]
- Jabari, F.; Mohammadpourfard, M.; Mohammadi-Ivatloo, B. Energy efficient hourly scheduling of multi-chiller systems using imperialistic competitive algorithm. Comput. Electr. Eng. 2020, 82, 106550. [Google Scholar] [CrossRef]
- Vu, H.D.; Chai, K.S.; Keating, B.; Tursynbek, N.; Xu, B.; Yang, K.; Yang, X.; Zhang, Z. Data Driven Chiller Plant Energy Optimization with Domain Knowledge. In Proceedings of the 2017 ACM on International Symposium on Symbolic and Algebraic Computation, Kaiserslautern, Germany, 25–28 July 2017; pp. 1309–1317. [Google Scholar] [CrossRef] [Green Version]
- Sohrabi, F.; Nazari-Heris, M.; Mohammadi-Ivatloo, B.; Asadi, S. Optimal chiller loading for saving energy by exchange market algorithm. Energy Build. 2018, 169, 245–253. [Google Scholar] [CrossRef]
- Lu, A.; Ding, Q.; Jiang, A. Research on Optimization of Chiller Based on Adaptive Weight Particle Swarm Algorithm. In Proceedings of the 2018 International Conference on Control, Automation and Information Sciences (ICCAIS), Hangzhou, China, 24–27 October 2018; pp. 428–433. [Google Scholar] [CrossRef]
- Afram, A.; Janabi-Sharifi, F. Theory and applications of HVAC control systems – A review of model predictive control (MPC). Build. Environ. 2014, 72, 343–355. [Google Scholar] [CrossRef]
- Chen, C.; Wang, J.; Heo, Y.; Kishore, S. MPC-Based Appliance Scheduling for Residential Building Energy Management Controller. IEEE Trans. Smart Grid 2013, 4, 1401–1410. [Google Scholar] [CrossRef]
- Avci, M.; Erkoc, M.; Rahmani, A.; Asfour, S. Model predictive HVAC load control in buildings using real-time electricity pricing. Energy Build. 2013, 60, 199–209. [Google Scholar] [CrossRef]
- Shoreh, M.H.; Siano, P.; Shafie-Khah, M.; Loia, V.; Catalão, J.P. A survey of industrial applications of Demand Response. Electr. Power Syst. Res. 2016, 141, 31–49. [Google Scholar] [CrossRef]
- Liang, M.; Meng, Y.; Lu, N.; Lubkeman, D.; Kling, A. HVAC load Disaggregation using Low-resolution Smart Meter Data. In Proceedings of the 2019 IEEE Power & Energy Society Innovative Smart Grid Technologies Conference (ISGT), Washington, DC, USA, 18–21 February 2019. [Google Scholar]
- Sala, E.; Kampouropoulos, K.; Delgado-Prieto, M.; Romeral, L. Disaggregation of HVAC load profiles for the monitoring of individual equipment. In Proceedings of the 2016 IEEE 21st International Conference on Emerging Technologies and Factory Automation (ETFA), Berlin, Germany, 6–9 September 2016; pp. 1–6. [Google Scholar] [CrossRef]
- Lin, X.; Tian, Z.; Lu, Y.; Zhang, H.; Niu, J. Short-term forecast model of cooling load using load component disaggregation. Appl. Therm. Eng. 2019, 157, 113630. [Google Scholar] [CrossRef]
- Xiao, Z.; Yuan, J.; Gang, W.; Zhang, C.; Xu, X. A NILM method for cooling load disaggregation based on artificial neural network. E3S Web Conf. 2019, 111. [Google Scholar] [CrossRef] [Green Version]
- Hovgaard, T.G.; Larsen, L.F.; Edlund, K.; Jørgensen, J.B. Model predictive control technologies for efficient and flexible power consumption in refrigeration systems. Energy 2012, 44, 105–116. [Google Scholar] [CrossRef]
- Song, M.; Niu, F.; Mao, N.; Hu, Y.; Deng, S.S. Review on building energy performance improvement using phase change materials. Energy Build. 2018, 158, 776–793. [Google Scholar] [CrossRef]
- Radaideh, A.; Vaidya, U.; Ajjarapu, V. Sequential Set-Point Control for Heterogeneous Thermostatically Controlled Loads Through an Extended Markov Chain Abstraction. IEEE Trans. Smart Grid 2017, 10, 116–127. [Google Scholar] [CrossRef]
- Mirakhorli, A.; Dong, B. Occupancy behavior based model predictive control for building indoor climate—A critical review. Energy Build. 2016, 129, 499–513. [Google Scholar] [CrossRef]
- Cirera, J.; Carino, J.A.; Zurita, D.; Ortega, J.A. Semisupervised refrigeration plant cooling disaggregation by means of deep neural network ensemble. In Proceedings of the 2019 IEEE 28th International Symposium on Industrial Electronics (ISIE), Vancouver, BC, Canada, 12–14 June 2019; pp. 1761–1766. [Google Scholar] [CrossRef]
- Azmi, W.H.; Sharif, M.Z.; Yusof, T.M.; Mamat, R.; Redhwan, A.A.M. Potential of nanorefrigerant and nanolubricant on energy saving in refrigeration system—A review. Renew. Sustain. Energy Rev. 2017, 69, 415–428. [Google Scholar]
- Widell, K.; Eikevik, T. Reducing power consumption in multi-compressor refrigeration systems. Int. J. Refrig. 2010, 33, 88–94. [Google Scholar] [CrossRef] [Green Version]
- Stoecker, W.F. Industrial Refrigeration Handbook; McGraw-Hill Education: New York, NY, USA, 1998. [Google Scholar]
- Huang, P.; Huang, G.; Augenbroe, G.; Li, S. Optimal configuration of multiple-chiller plants under cooling load uncertainty for different climate effects and building types. Energy Build. 2018, 158, 684–697. [Google Scholar] [CrossRef]
- Sadurni, A.; Oliet, C.; Rigola, J.; Oliva, A. Detailed Unsteady Simulation of Liquid Overfeed Refrigerating Systems. In Proceedings of the 2008 International Refrigeration and Air Conditioning Conference, West Lafayette, IN, USA, 14–17 July 2008; pp. 1–8. [Google Scholar]
- Josep Cirera i Balcells, Miquel Pujal i Curià, Jordi Brull i Noval, Albert Vendrell i Ribera. Industrial overfeed refrigeration system. IEEE Dataport 2020. [Google Scholar] [CrossRef]
- Blázquez, J.L.F.; Maestre, I.R.; Gallero, F.J.G.; Baladés, J.D.M. Reduction of computation time in building energy performance simulation programs by applying tearing techniques. Energy Build. 2016, 130, 667–675. [Google Scholar] [CrossRef]
- Mitchell, S.; O’Sullivan, M.; Dunning, I. PuLP: A Linear Programming Toolkit for Python; The University of Auckland: Auckland, New Zealand, 2011. [Google Scholar]
- Cirera, J.; Carino, J.A.; Zurita, D.; Ortega, J.A. Data Analytics for Performance Evaluation Under Uncertainties Applied to an Industrial Refrigeration Plant. IEEE Access 2019, 7, 64127–64135. [Google Scholar] [CrossRef]
- Cirera, J.; Carino, J.A.; Zurita, D.; Ortega, J.A. A Data-Driven-Based Industrial Refrigeration Optimization Method Considering Demand Forecasting. Processes 2020, 8, 617. [Google Scholar] [CrossRef]
Figure 1.
(a) Refrigeration system scheme. (b) Distribution and area of the spaces to refrigerated in the facilities.
Figure 1.
(a) Refrigeration system scheme. (b) Distribution and area of the spaces to refrigerated in the facilities.

Figure 2.
Theoretical cooling capacity—slide valve curve of a screw compressor.

Figure 3.
Simplified communication diagram of the refrigeration system. The data-driven load management block represents the proposed solution to manage the cooling loads.
Figure 3.
Simplified communication diagram of the refrigeration system. The data-driven load management block represents the proposed solution to manage the cooling loads.

Figure 4.
Example of the performance of two screw compressors C1 and C2 working in parallel to supply the cooling demand.
Figure 4.
Example of the performance of two screw compressors C1 and C2 working in parallel to supply the cooling demand.

Figure 5.
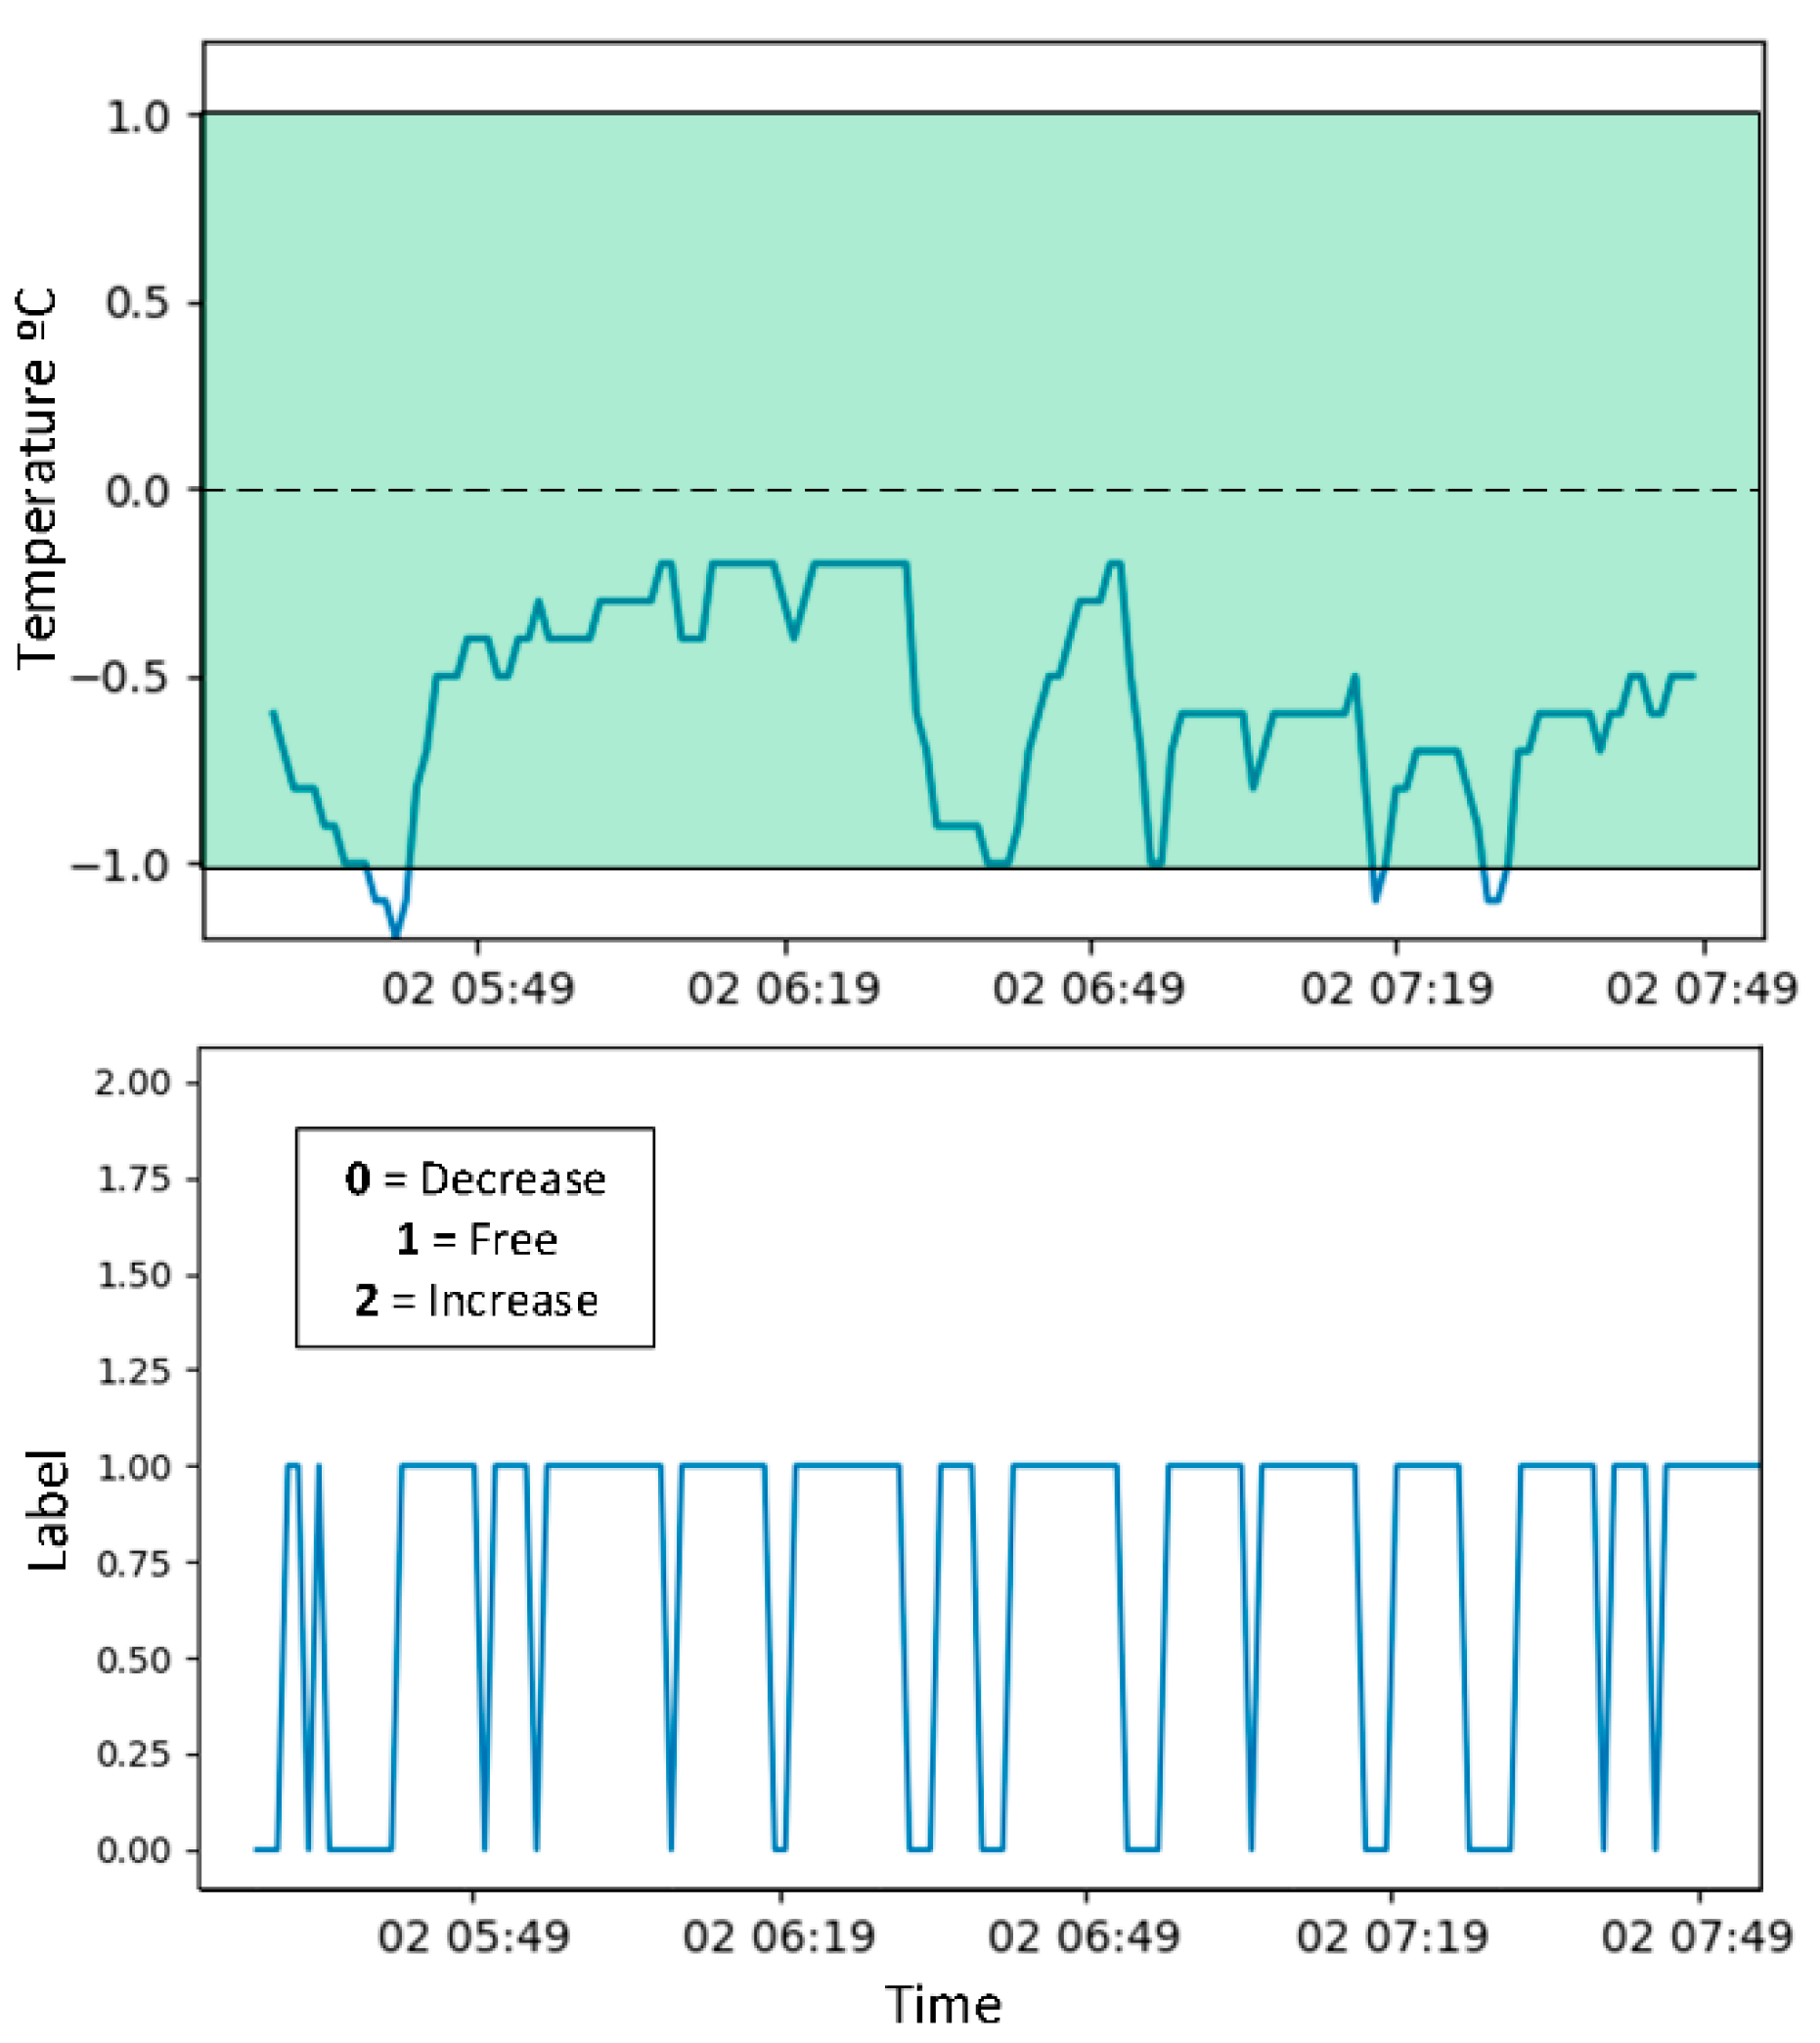
Example of the permissible temperature range of a specific space to refrigerate.

Figure 6.
Proposed load management methodology diagram with the two main blocks highlighted.

Figure 7.
Aggregated cooling consumption and state of each S.

Figure 8.
Estimation of the individual load contribution to the total aggregated signal.

Figure 9.
Detail of a specific S temperature with its corresponding assessment in each situation. The green area of the temperature plot represents the permissible temperature range.
Figure 9.
Detail of a specific S temperature with its corresponding assessment in each situation. The green area of the temperature plot represents the permissible temperature range.

Figure 10.
Simultaneity results. (a) Simultaneity of the proposed method compared with the reference. (b) Minutes saved with the proposed method vs. reference. (c) Percentage of simultaneity that it supposes.
Figure 10.
Simultaneity results. (a) Simultaneity of the proposed method compared with the reference. (b) Minutes saved with the proposed method vs. reference. (c) Percentage of simultaneity that it supposes.

Figure 11.
Compressor efficiency results. Comparison of percentage of time in high efficiency partial load ratio (PLR).
Figure 11.
Compressor efficiency results. Comparison of percentage of time in high efficiency partial load ratio (PLR).

Figure 12.
Electrical consumption results. (a) Electrical energy consumption of the proposed method compared with the reference. (b) Energy saved with the proposed method vs. reference. (c) Percentage of energy that it supposes.
Figure 12.
Electrical consumption results. (a) Electrical energy consumption of the proposed method compared with the reference. (b) Energy saved with the proposed method vs. reference. (c) Percentage of energy that it supposes.

Figure 13.
Temperature error in regard to its set point of the different spaces to refrigerate. (a–g) Error in each space.
Figure 13.
Temperature error in regard to its set point of the different spaces to refrigerate. (a–g) Error in each space.


Table 1.
Characteristics of each space to refrigerate.
| Id | Type of Organic Load | N° Evaporators | T Set Point (°C) | Average Working Time Per Day (h) | Area (m2) |
|---|---|---|---|---|---|
| S1 | Chicken tunnel | 3 | −0.5 | 19 | 1164 |
| S2 | Chicken tunnel | 3 | −0.5 | 19 | 1407 |
| S3 | Pig tunnel/chamber | 5 | −2/−10 | 14 | 1246 |
| S4 | Meat chamber | 4 | 0 | 24 | 270 |
| S5 | Meat chamber | 4 | 0 | 24 | 575 |
| S6 | Turkey tunnel/chamber | 4 | −2/1 | 19 | 754 |
| S7 | Chicken tunnel | 6 | −0.8 | 19 | 684 |
| S8 | Quail tunnel | 1 | −0.3 | 3 | 418 |
Table 2.
Features employed for the disaggregation methodology.
| Feature | Unit | Description |
|---|---|---|
| °C | Temperature of the spaces at the current timestep t. | |
| °C | Temperature of the space s at time t-1. | |
| °C | Temperature of the space s at time t-2. | |
| °C | Temperature of the space s at time t-3. | |
| Timesteps | Number of timesteps elapsed since the evaporator g of the space s was switched ON at the current timestep t. | |
| Timesteps | Number of timesteps elapsed since the evaporator g of the space s was switched OFF at the current timestep t. | |
| Units | Number of evaporators switched ON at the space s at the current timestep t. | |
| Bar | Suction pressure | |
| ON/OFF | Evaporator status of each S. If multiple evaporators a logical OR is applied |
Table 3.
h parameters values.
| S1 | −1.5 | −0.5 | 0 | 0.4 | −0.2 | 0 |
| S2 | −1.5 | −0.5 | 0 | 0.4 | −0.2 | 0 |
| S3 | −1.5 | −0.5 | 0 | 0.4 | −0.2 | 0 |
| S4 | −2 | −0.5 | 0 | 0.4 | −1.2 | 0 |
| S5 | −2 | −0.5 | 0 | 0.4 | −1.2 | 0 |
| S6 | −1.5 | −0.2 | 0 | 0.4 | −0.2 | 0 |
| S8 | −1.5 | −0.5 | 0 | 0.4 | −0.2 | 0 |
Table 4.
Comparison between the variables of validation days and reference days.
| Proposed | Reference | ||||||
|---|---|---|---|---|---|---|---|
| Date | (kWh) | Suction p (bar) | Discharge p (bar) | Date | (kWh) | Suction p (bar) | Discharge p (bar) |
| 2020-04-06 | 29,518 | 1.70 | 8.01 | 2020-01-21 | 28,673 | 1.70 | 8.03 |
| 2020-04-07 | 28,101 | 1.69 | 8.02 | 2020-01-21 | 28,673 | 1.70 | 8.03 |
| 2020-04-08 | 30,066 | 1.69 | 8.03 | 2019-10-17 | 30,270 | 1.72 | 8.09 |
| 2020-04-09 | 23,099 | 1.78 | 8.00 | 2019-12-27 | 23,263 | 1.71 | 8.00 |
| 2020-04-14 | 35,380 | 1.70 | 8.32 | 2019-06-19 | 31,580 | 1.67 | 8.76 |
| 2020-04-15 | 31,948 | 1.71 | 8.35 | 2019-10-17 | 30,270 | 1.72 | 8.09 |
| 2020-04-16 | 33,575 | 1.70 | 8.63 | 2019-06-19 | 31,580 | 1.67 | 8.76 |
| 2020-04-17 | 30,264 | 1.70 | 8.59 | 2019-08-13 | 30,175 | 1.70 | 8.70 |
© 2020 by the authors. Licensee MDPI, Basel, Switzerland. This article is an open access article distributed under the terms and conditions of the Creative Commons Attribution (CC BY) license (http://creativecommons.org/licenses/by/4.0/).
Share and Cite
MDPI and ACS Style
Cirera, J.; Carino, J.A.; Zurita, D.; Ortega, J.A. Improving the Energy Efficiency of Industrial Refrigeration Systems by Means of Data-Driven Load Management. Processes 2020, 8, 1106. https://doi.org/10.3390/pr8091106
AMA Style
Cirera J, Carino JA, Zurita D, Ortega JA. Improving the Energy Efficiency of Industrial Refrigeration Systems by Means of Data-Driven Load Management. Processes. 2020; 8(9):1106. https://doi.org/10.3390/pr8091106
Chicago/Turabian StyleCirera, Josep, Jesus A. Carino, Daniel Zurita, and Juan A. Ortega. 2020. "Improving the Energy Efficiency of Industrial Refrigeration Systems by Means of Data-Driven Load Management" Processes 8, no. 9: 1106. https://doi.org/10.3390/pr8091106
Note that from the first issue of 2016, this journal uses article numbers instead of page numbers. See further details here.