The Fabrication of Geopolymer Foam Composites Incorporating Coke Dust Waste
by
 , , ,
, , ,
Buczkowska Katarzyna
1,2 ,
,
Chi Hiep Le
1,*, 
Petr Louda
1 ,
,
Szczypiński Michał
1,
Totka Bakalova
1,
Pacyniak Tadeusz
2 and
Karol Prałat
3 1
Department of Material Science, Faculty of Mechanical Engineering, Technical University of Liberec, Studenstká 2, 461 17 Liberec, Czech Republic
2
Department of Materials Technology and Production Systems, Faculty of Mechanical Engineering, Lodz University of Technology, Stefanowskiego 1/15, 90-001 Lodz, Poland
3
Department of Civil Engineering, Faculty of Civil Engineering, Mechanics and Petrochemistry, University of Technology in Płock ul. Z. Łukasiewicza 17, 04-900 Płock, Poland
*
Author to whom correspondence should be addressed.
Processes 2020, 8(9), 1052; https://doi.org/10.3390/pr8091052
Submission received: 6 August 2020
/
Revised: 24 August 2020
/
Accepted: 26 August 2020
/
Published: 28 August 2020
(This article belongs to the Special Issue Foam Matrix Composites: Preparation and Application)
Abstract
:This paper reports the results of an experimental investigation on the mechanical properties of geopolymer foams incorporating filler from the coke dust waste (CDW). In this work, CDW was used to replace a part of geopolymer paste at 5%, 10%, 20%, and 30% by geopolymer binder mass. The physico-mechanical properties and thermal resistance against high temperatures of CDW/geopolymer foams are presented. The primary results obtained show that the use of CDW in the production of geopolymer foam composites made it possible for them to achieve relatively good mechanical properties. However, the incorporation of the CDW into the geopolymer had a slightly negative effect on thermal conductivity, but significantly improved the mechanical strength of the final product. Moreover, this waste also helped the composite foam to achieve a structure with more uniform open pores distribution, compared to the pure foam. After exposure to elevated temperatures, the residual strength of the composite foams maintained well compared to the pure foams.
1. Introduction
Geopolymers, first named by Davidovits in the 1970s, are inorganic polymer materials with an amorphous three-dimensional network structure [1]. Generally, they are made by a mixture of silica- and alumina-rich source materials such as metakaolin, fly ash, rice husk ash, etc., with strongly alkali-activated solutions [2,3,4,5,6]. Geopolymers display a wide range of characteristics and properties, such as high compressive strength, low shrinkage, excellent freeze–thaw resistance, high-temperature resistance, and acid resistance [7,8,9,10,11]. The development of geopolymers has become an attractive research subject in recent years because geopolymer binders provide great potential for an alternative to Portland-cement-based binders. As reported in previous research [12], the manufacturing process of Portland cement demands large amounts of energy, and releases a significant amount of CO2 emissions. It is estimated that the cement industry alone is responsible for around 7% of the CO2 generated globally. Hence, this binder is one of the key causes of global warming. The introduction of geopolymers not only meets the requirements for mechanical performance, but is also interesting as a new green construction material over Portland cement.
It has been reported that geopolymer foams possess admirable properties of low shrinkage, high sound absorption, and high thermal insulation due to their low density and highly porous structure [10,13,14,15,16,17]. Geopolymer foams have more advantages than organic foams and traditional foam materials. While organic foam materials have shown poor fire-resistance performance and even produced toxic gases during combustion, the use of Portland-cement-based foams is associated with high energy consumption and environmental pollution [10,18]. Geopolymer foams are sustainable lightweight materials combining insulation performance with fascinating mechanical and fire-resistance properties [19].
It is well-known that geopolymer foams are produced from solid geopolymers the addition of foaming agents (metallic aluminum powder, metallic silicon, hydrogen peroxide, etc.) which release gas when mixed into the geopolymer, leading to the formation of a macroporous network in the hardened product [20,21,22]. A geopolymer structure with highly visible porosity can be achieved by adding a high concentration of blowing agents [13,22]. This results in low density and high insulation capacity but low mechanical strength. Moreover, using a high concentration of foaming agent without adding a stabilizing agent also causes difficulty in controlling the morphology of the pores and providing a uniform pore distribution throughout the entire volume of the sample. These characteristics may make it difficult to consider pure geopolymer foams as engineering materials. Therefore, filling materials need to be incorporated into geopolymer foams in order to improve their physical-mechanical properties.
Coal carbonization is a process that produces metallurgical coke for use in iron-making blast furnaces and other metal-smelting processes [23]. Carbonization is done by heating the coal to temperatures as high as 1300 °C in the absence of air to distill out tars and light oils [23]. The resulting coke product is also associated with a number of various by-products formed from the incomplete combustion of the coal. Coke dust is one of the by-products of the coking process. Jastrzębska Spółka Węglowa SA is a major coal mining company in Poland that produces around 12 million tons of coal annually [24]. Coke dust waste disposal and management issues are threatening concerns, and the topic of environmental protection and waste recycling has become very popular. Waste management methods are currently being sought. Incorporating this waste in geopolymers as a filling material could be one efficient way to reduce hazards to the environment.
In this work, the original intention of adding the coke dust waste to geopolymer binder was to reduce the cost of the final product due to partial replacement of geopolymer with waste material, while also contributing positively to the mechanical properties of the final material. Therefore, the influence of coke dust waste (CDW) addition on the mechanical properties and thermal resistance of the composite foams was studied, and is discussed herein.
2. Materials and Methods
2.1. Materials
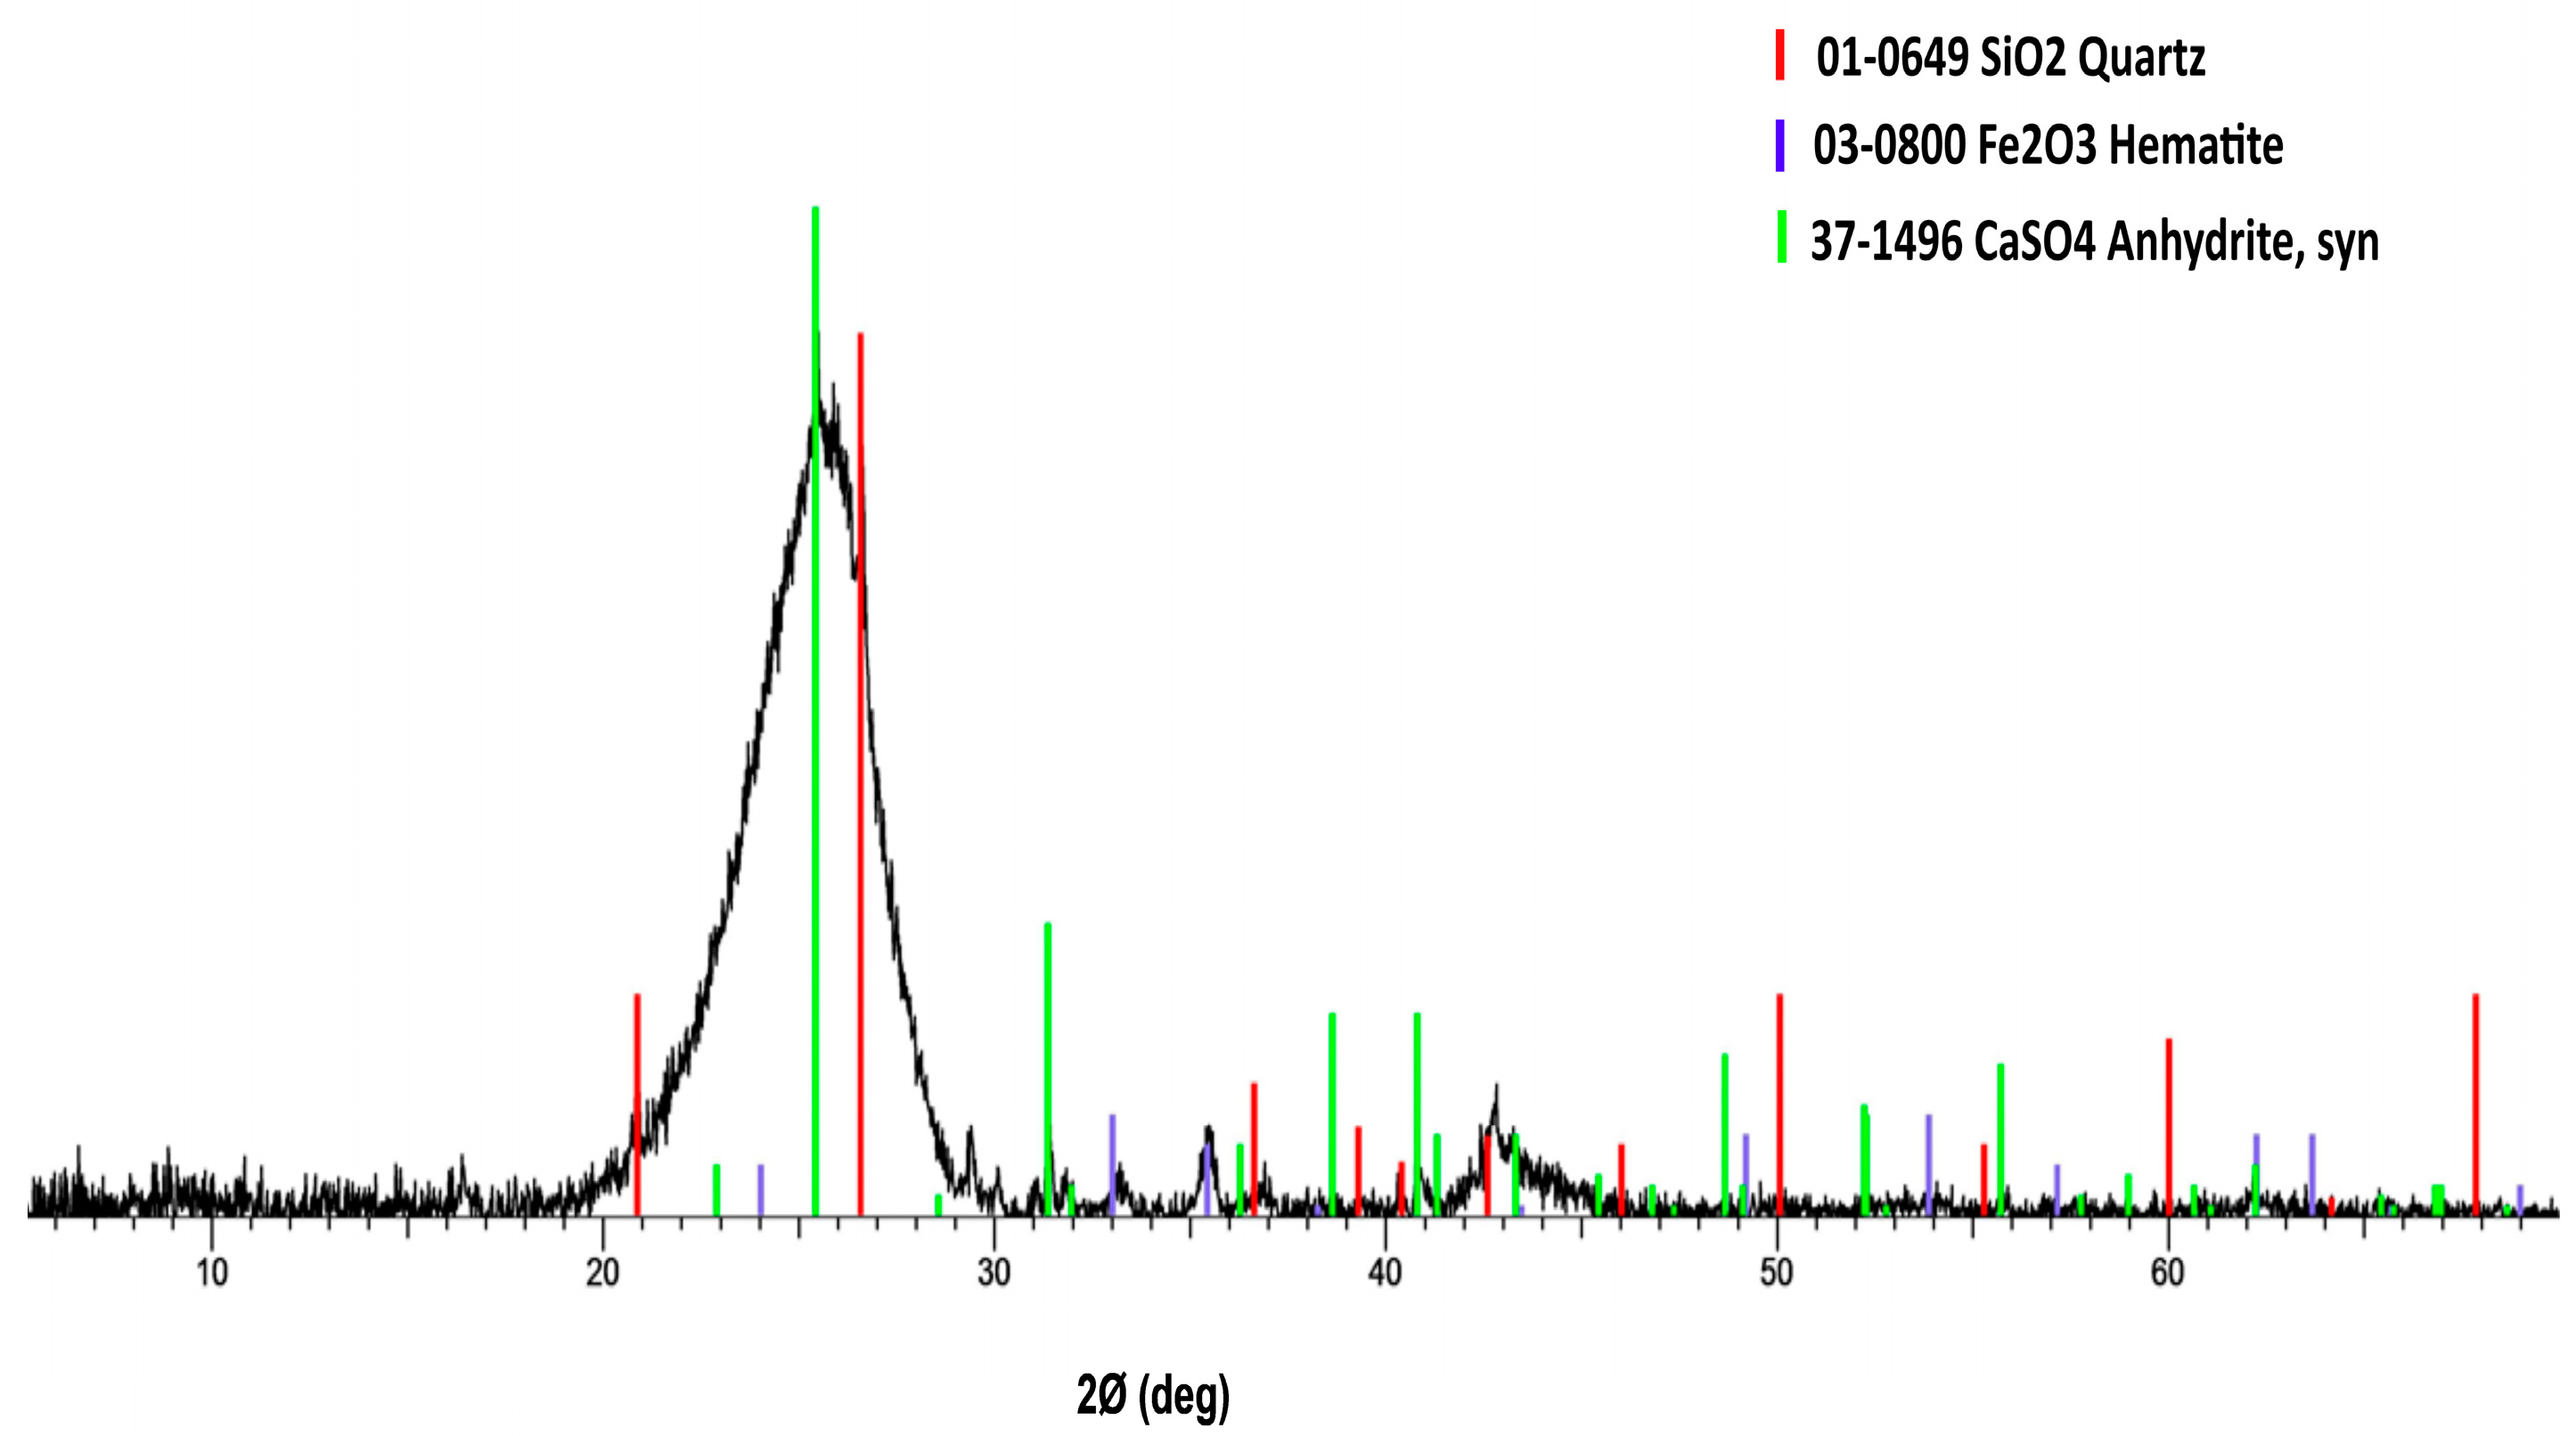
A geopolymer product with commercial branch Lk, purchased from České Lupkové Závody, a.s. Czech Republic, was used as a binder for the manufacture of geopolymer composites. The geopolymer binder consisted of two components, including a metakaolin-based geopolymer cement and a potassium-based activator solution. For the production of geopolymer foams, an aluminum powder with an average particle size of 52 µm, provided by Pkchemie Inc, Czech Republic, was used as a foaming agent. Coke dust waste with strong black color supplied by the coal mining company Jastrzębska Spółka Węglowa S.A. in Poland was used as a filler for producing the composite foams (shown in Figure 1). The chemical composition of the coke dust waste was determined by using X-ray fluorescence (XRF) (Bruker S8 Tiger equipped with an Rh RTG lamp (Bruker, Billerica, MA, USA)). The phase composition of the coke dust was determined by X-ray powder diffraction (XRD) using a Bruker D8 Advance ECO, working with the Cu anode. The XRD results of this filler was shown in Figure 2. It can be seen from the figure that the main phases of the coke dust waste were SiO2 and CaSO4, with a small amount of Fe2O3. The results in Table 1 indicate that it had nearly 69.68% loss on ignition (LOI), which can mostly be attributed to the unburned carbon, whereas the composition of the remaining oxides comprised minor fractions (silica, alumina, iron oxide, calcium oxide, etc.).
2.2. Sample Preparation
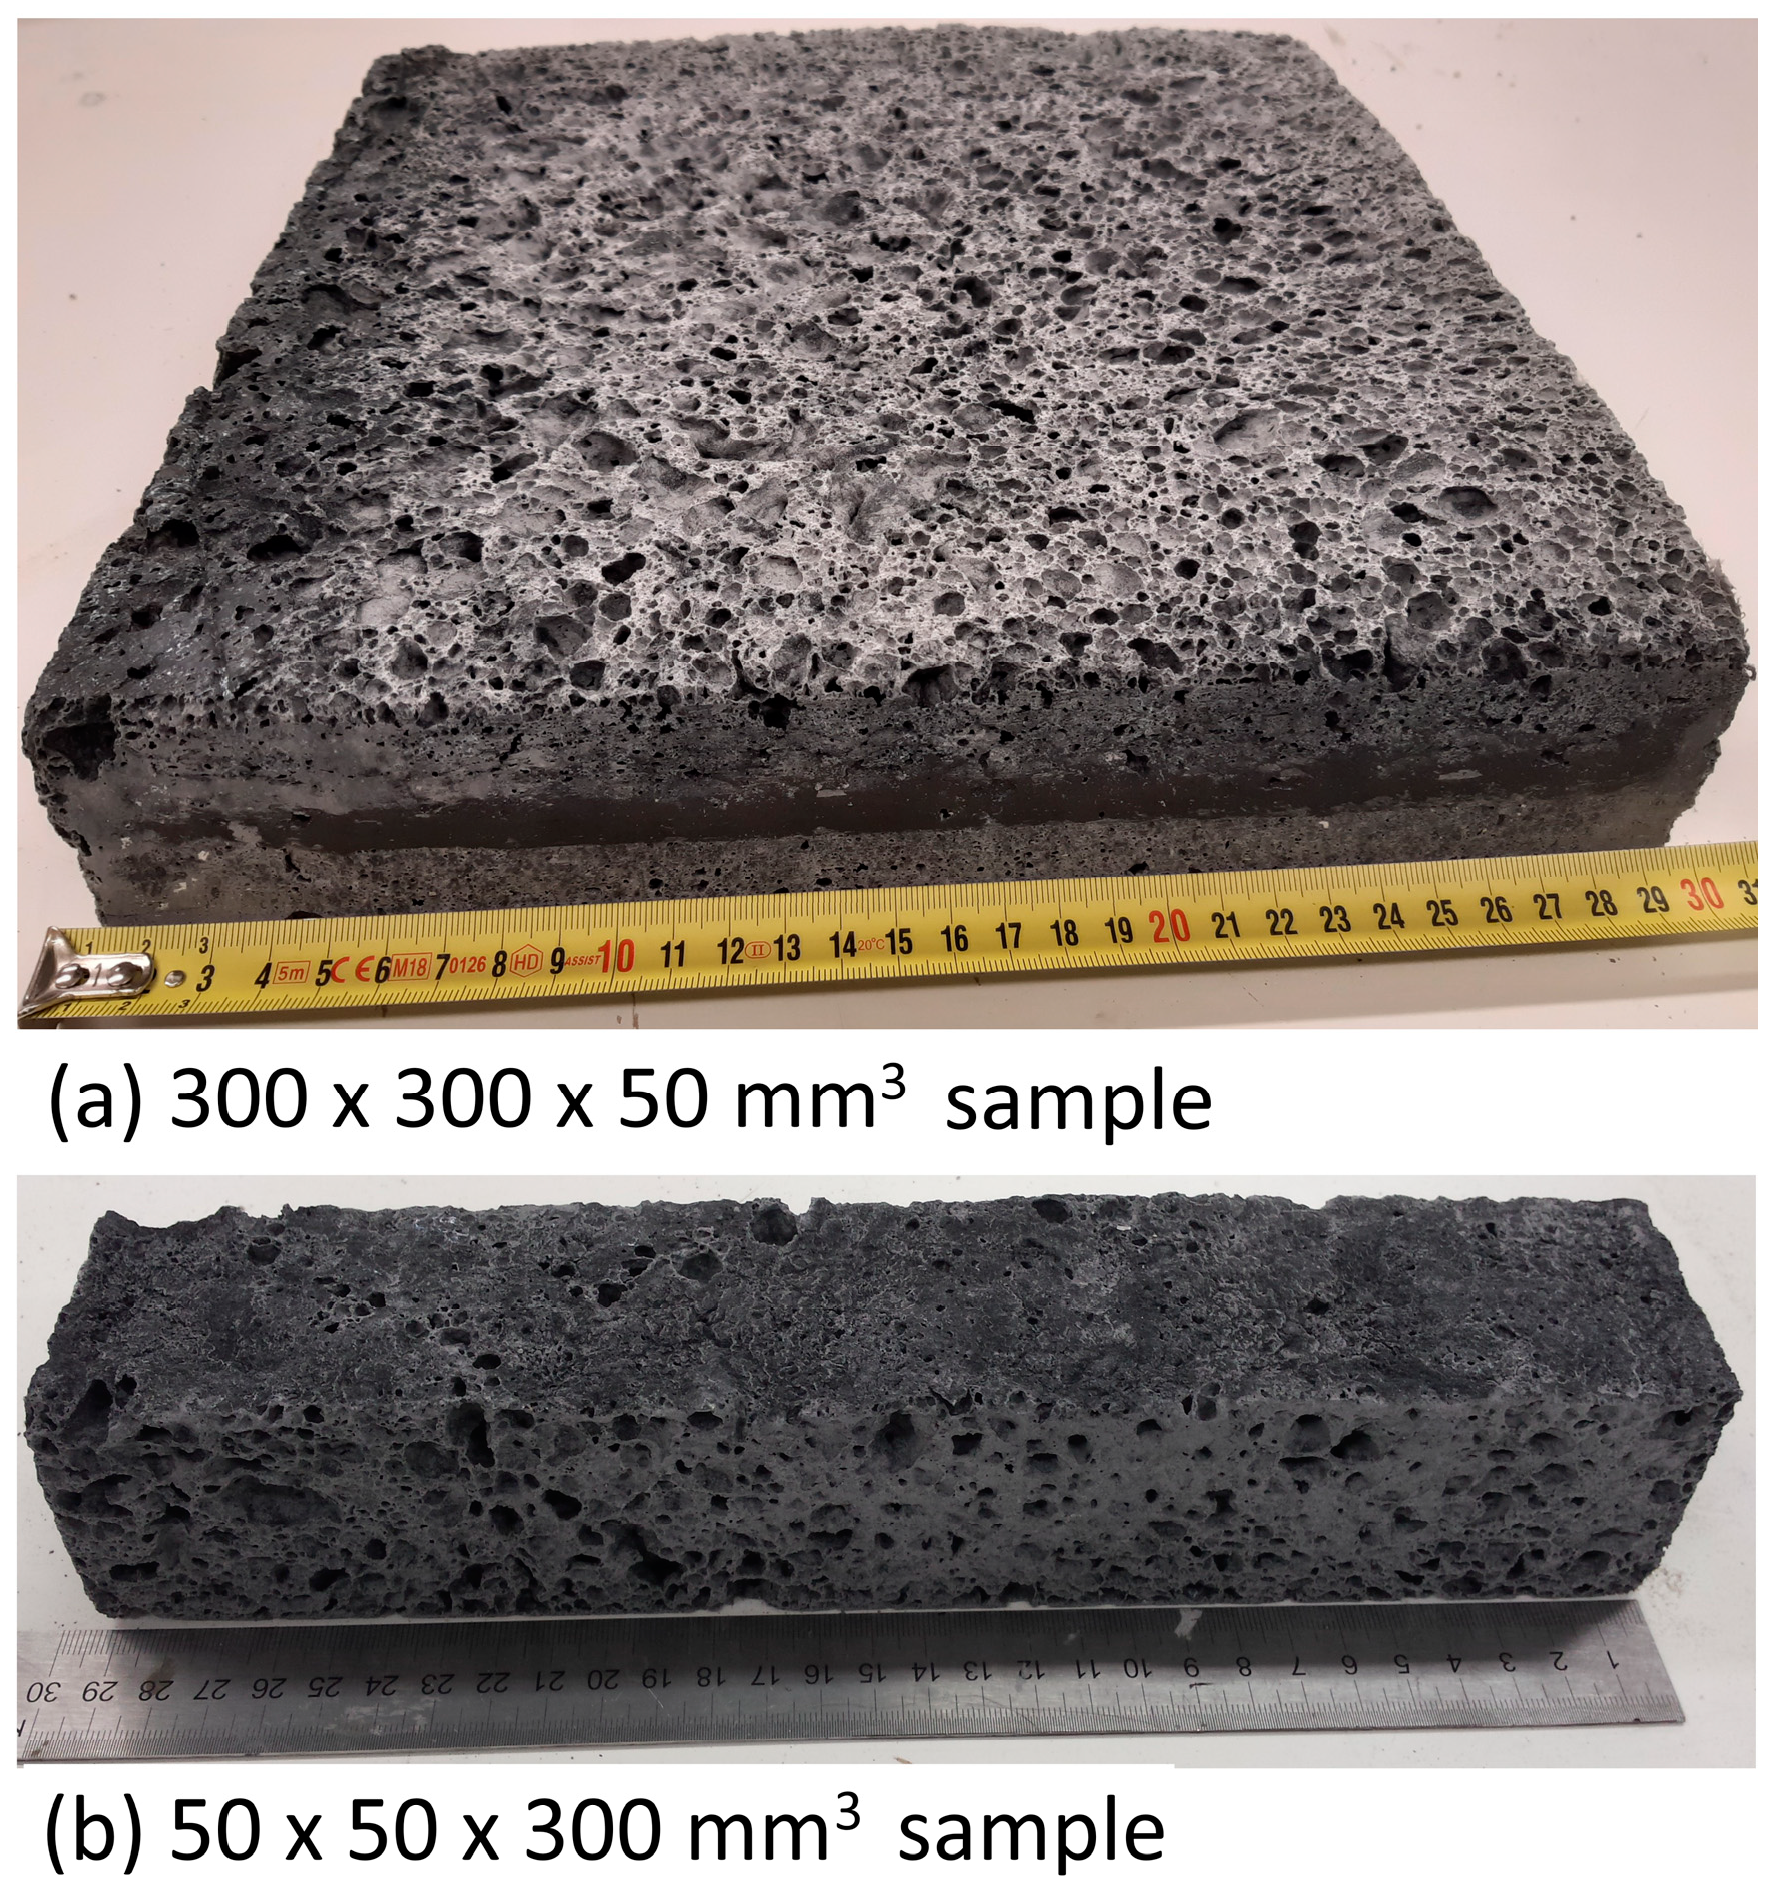
Table 2 shows the mix proportions of the geopolymer foams. Geopolymer paste was replaced by 5%, 10%, 20%, and 30% coke dust, and 0.5% Al powder as a fraction of geopolymer paste weight was used. First, 5 parts of geopolymer cement and 4.5 parts of activator solution were mechanically stirred to obtain a homogenous geopolymer paste for about 5 min. To prepare the geopolymer foam composites, the coke dust waste was added into the prepared geopolymer paste. This mixture was further mixed for about 2 min, followed by addition of the Al powder. Finally, the mixture was stirred for about 1 min to generate pores inside the geopolymer. Immediately after mixing was completed, the mixture was poured into wood molds with dimensions 300 × 300 mm2. These molds were then wrapped with polypropylene film and cured at laboratory temperature, ~20 °C, with a relative humidity of 45%. On the next day, the samples were removed from the molds and wrapped again and left in the laboratory until the test (28 days). Figure 3 shows the sizes of the geopolymer foam samples prepared for the testing.
2.3. Test Methods
A water absorption test was performed in order to measure the total water absorption capacity of the samples. Samples with dimensions of 50 × 50 × 100 mm3 were used for this test. After being dried to constant mass, these samples were immersed in a tap water bath for about 48 h. The samples were then removed from the bath, dried with a rag, and quickly weighed. Three samples for each recipe were tested, and an average value of measurements was recorded. The total water absorption was calculated as per the Equation (1):
where A is total water absorption (%), md is the mass of the oven-dried sample in air in grams, and mw is mass of the sample saturated with water in grams.
A = ((mw − md)/md) × 100 (%)
The bulk density of the samples was determined by dividing the dry mass by the volume. The average value of three different measurements was calculated.
The thermal conductivity test was conducted using a HFM 436 Lambda heat flow meter system (NETZSCH manufacturer, Germany). This system works according to Standard test method ASTM C 518 The tested sample (50 × 300 × 300 mm3) is inserted between a hot and cold plate, and the heat flow produced by well-defined temperature difference is calculated with a heat flux sensor. After a few minutes for the system to reach equilibrium, the external computer determined the thermal conductivity and thermal resistance of the samples. The value of thermal conductivity was calculated per Equation (2):
where λ is the thermal conductivity of the sample (W m−1 K−1), q is heat flux (W/m2), ΔT is the temperature difference across the sample, and Δx is the thickness of the sample (m).
q = λ(ΔT/Δx)
The mechanical properties of the geopolymer foam composites were estimated based on the results of the flexural strength and compressive strength tests. Samples with dimensions of approximately 50 × 50 × 300 mm3, which were cut from the original 50 × 300 × 300 samples, were used to test the flexural strength with a loading span of 240 mm, based on standard ČSN EN 789. Three samples for each recipe were used for the flexural test, and the compressive strength was then determined on both residual pieces obtained from the flexural test. A Labor-Tech universal testing machine (Technical University of Liberec, Czech Republic) with a load cell capacity of 100 kN was used. The samples were tested under displacement control at a loading rate of 4 mm/min.
The thermal resistance of the geopolymer foams was evaluated by measuring the compressive strength and weight loss after being subjected to firing at elevated temperatures ranging from 250 °C to 800 °C. The selected samples were heated in an electric oven with a heating rate of 10 °C/min and soaked for 2 h, then naturally cooled down to room temperature in the oven.
The characteristics of the coke dust waste and the foam samples were analyzed using a Ultra Plus scanning electron microscope (SEM) (ZEISS Company, Oberkochen, Germany). For the coke dust waste, the sample was taken from the supplied bag and fixed on double-sided adhesive carbon tape. Before the analyses, the sample was not modified or plated in any way. For the foam samples, they were dried at 105 °C in an oven for 24 h in order to eliminate residual water inside the structure. Then, they were directly examined under the SEM without metallic coating. The elemental compositions were then determined by energy dispersive spectroscopy X-Max EDS system (Oxford Instruments, Oxford, UK).
3. Results and Discussion
3.1. SEM Characterization of the Coke Dust Waste
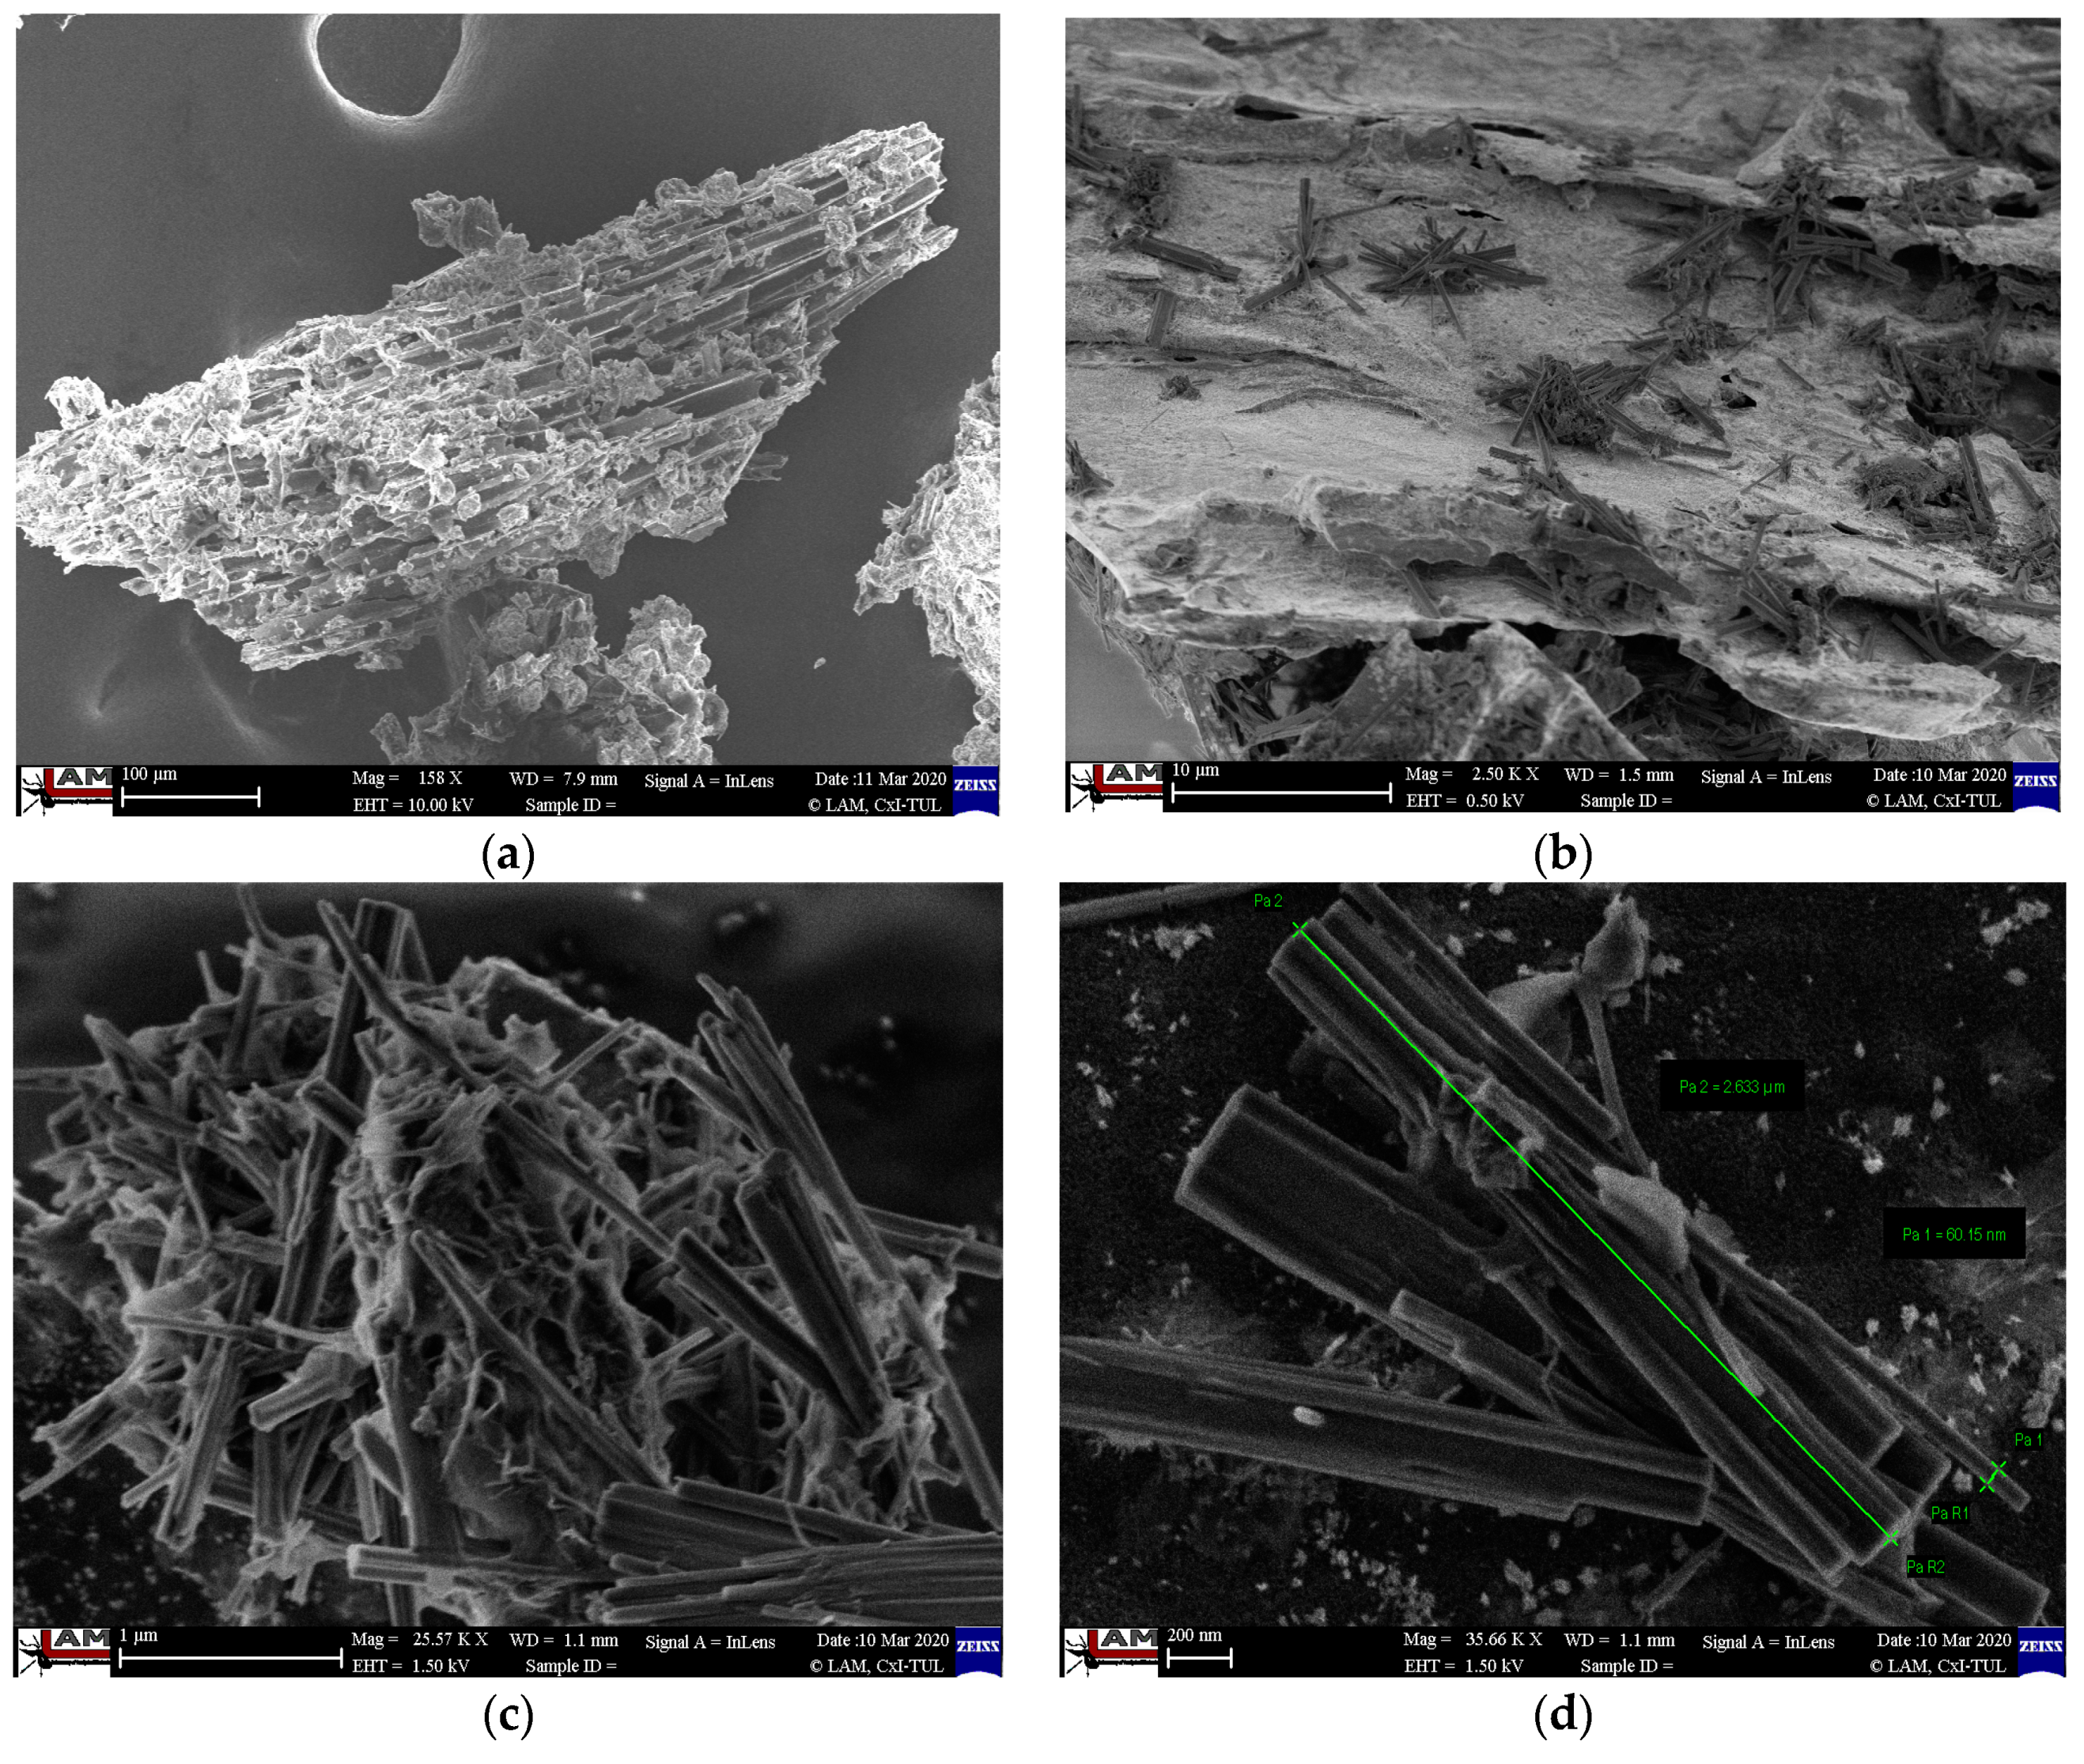
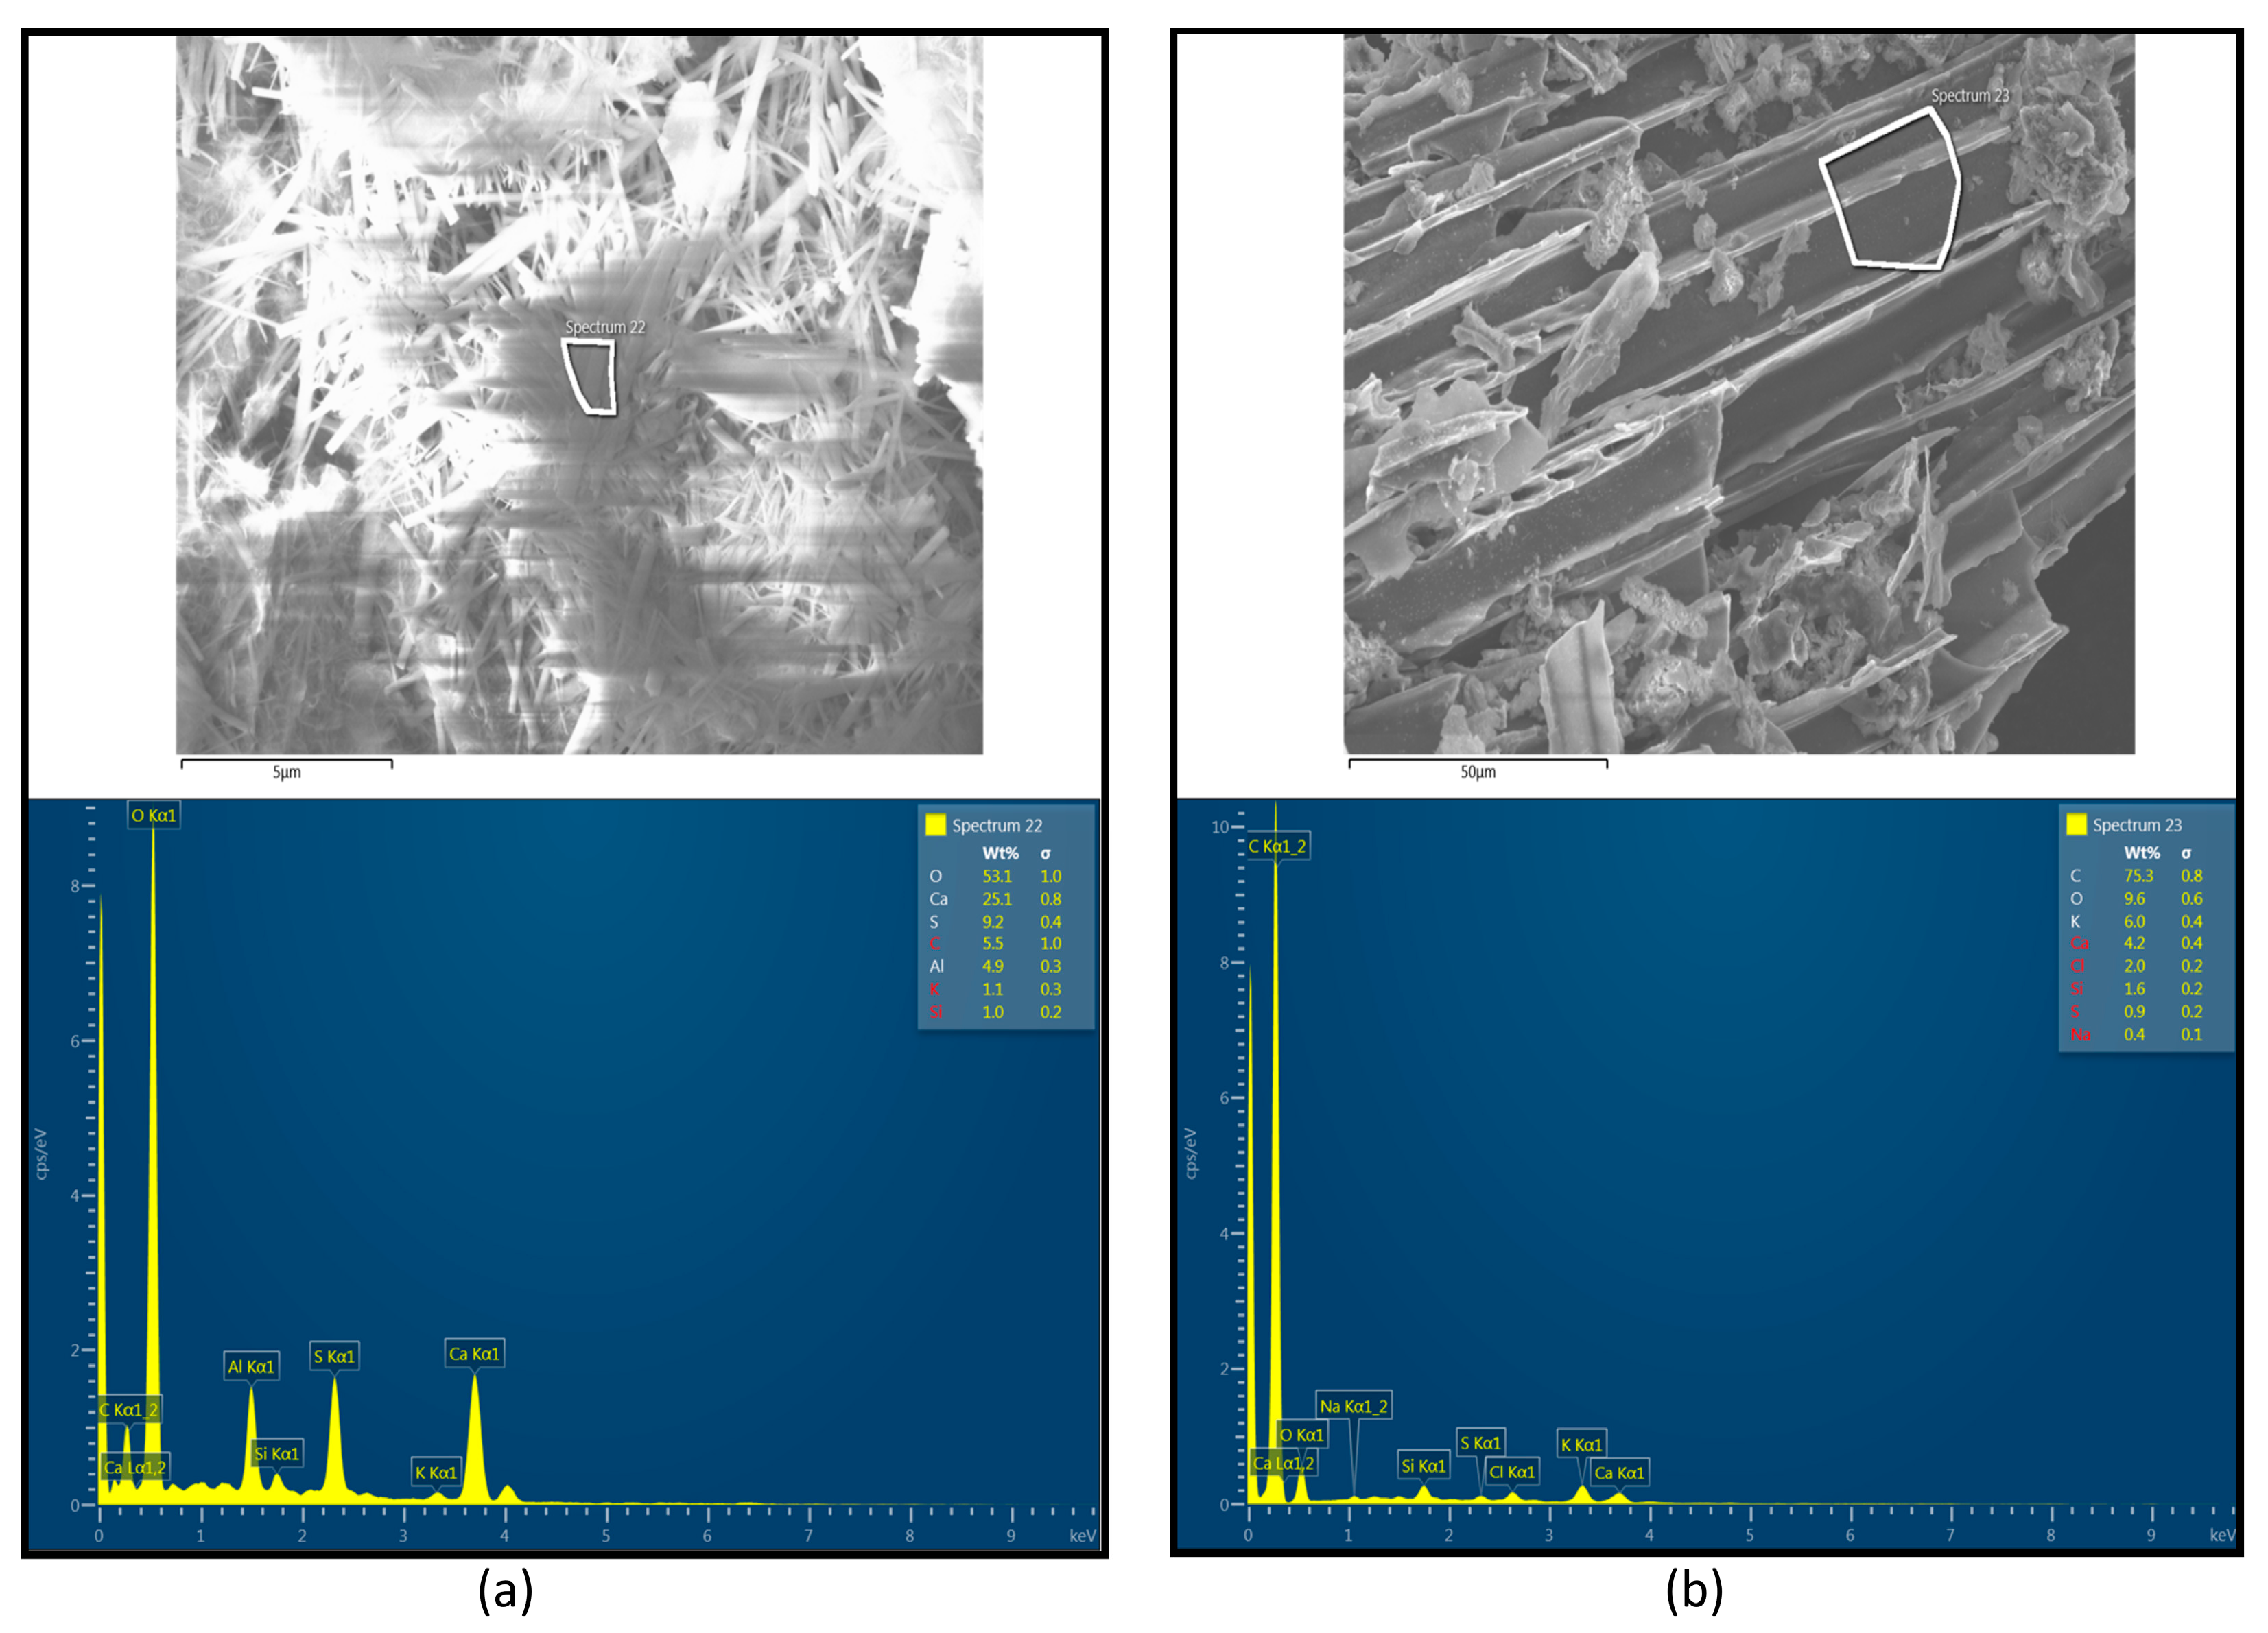
Figure 4 shows the specific shape and surface morphology of the coke dust particles. It can be seen that the particles had an unknown shape resembling very-well-defined plant cell residues (Figure 4a). There were whisker clusters on the surface of these particles (Figure 4b,c). Whiskers had an average length of 2.5 µm, while their diameter was <100 nm (Figure 4d). Based on data from EDS analyses for these whiskers, it can be concluded that the acicular whiskers could be ettringite (Ca6Al2(SO4)3(OH)12·26(H2O) × (CaO)6(Al2O3)(SO3)3·32H2O or (CaO)3(Al2O3) (CaSO4)3·32H2O) (Figure 5a). Ettringite is typically formed by the reaction of tricalcium aluminate with water in the presence of gypsum. The EDS analysis of the coke dust particles showed that the cells were visible with a high proportion of residual carbon (Figure 5b). It can be concluded that the supplied coke dust waste contained several organic residues (visible residues of imperfectly burned plant cells with a high carbon content) and an inorganic phase. On the surface, there were acicular crystals (likely ettringite), whose morphology resembled asbestos (acicular crystals with a length scale of micrometers and a diameter of tens of nanometers).
3.2. Characteristics of the Hardened CDW/Geopolymer Foams at Room Temperature
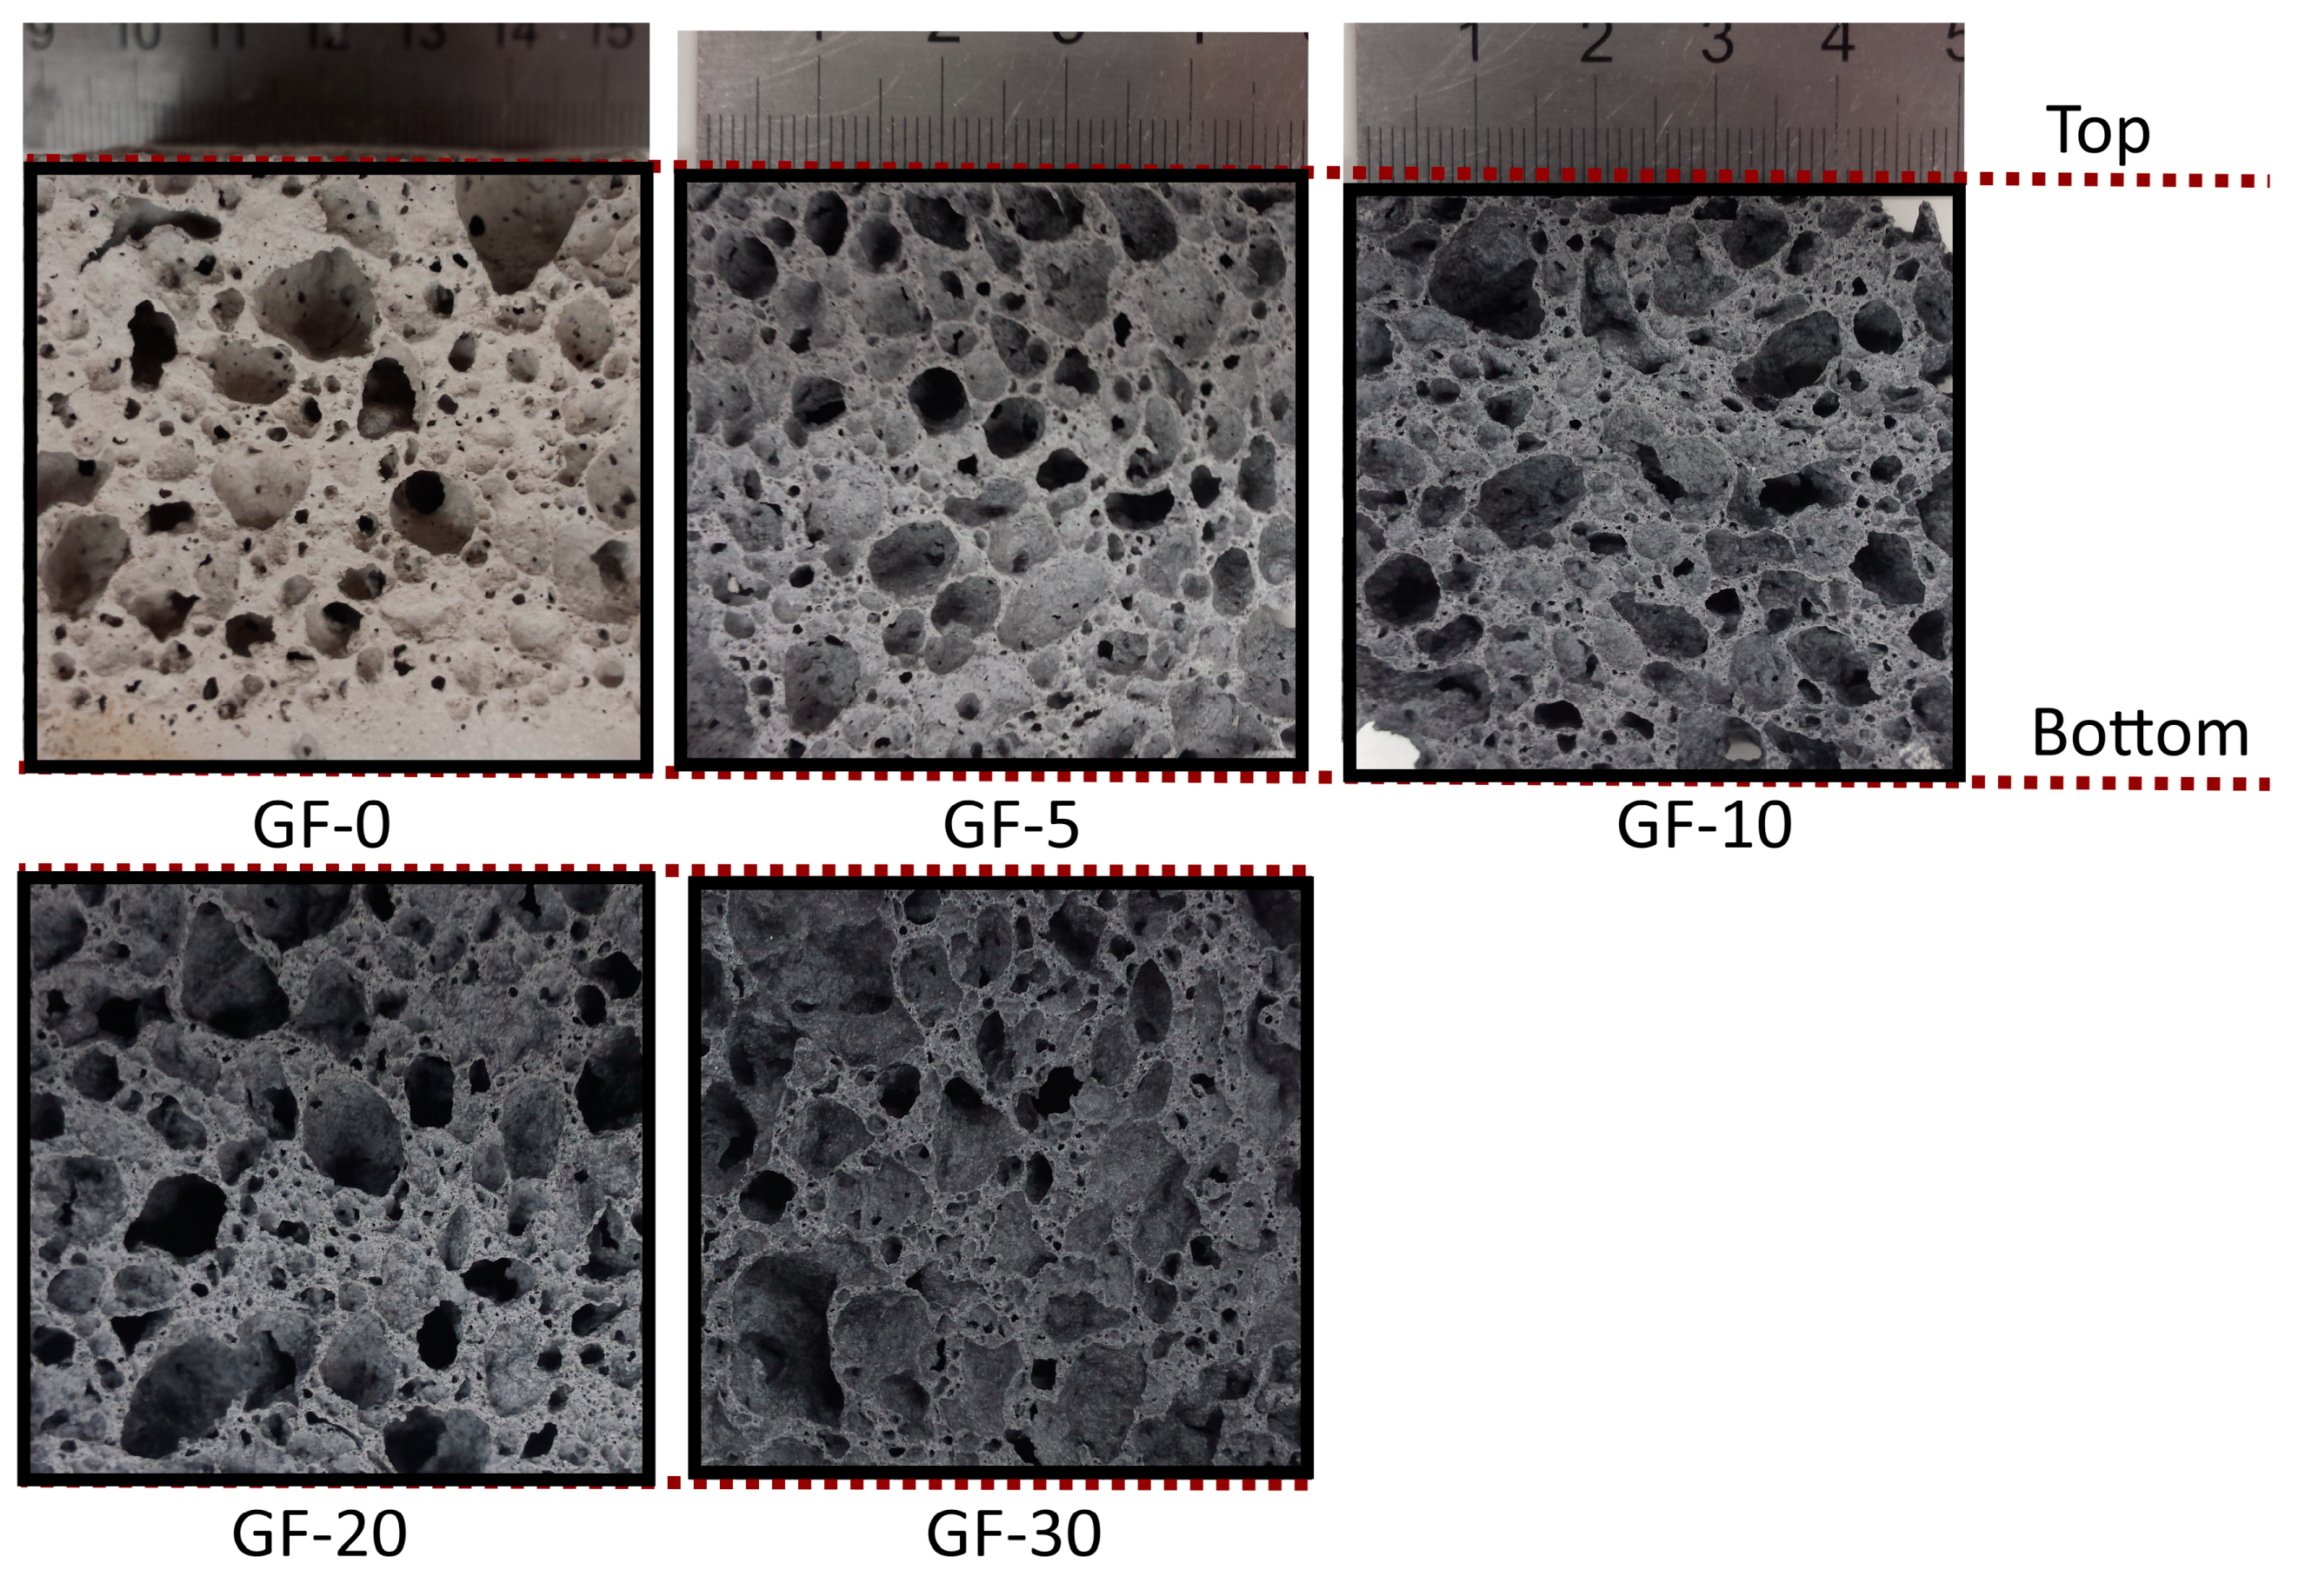
Figure 6 shows photographs of foam samples containing different contents of the coke dust waste. The pure foam samples without fillers were almost grey-white in color. After incorporating the filler, with increasing coke dust content, the foam samples gradually changed to a darker color, which is attributed to the color of the fillers. All the samples displayed macroscopic pores with various sizes and shapes. This is because of the lack of a foam-stabilizing agent and the high content of foaming agent [25]. Additionally, from Figure 6 it can be observed that the formation of visible pores at the bottom of sample GF-0 did not occur. This can be explained by the fact that the flowability of this kind of geopolymer is too high. Hence, in the initial stage (before gel hardening), the pores were formed but immediately collapsed in part due to the weak linkage between the gel molecules, leading to the formation of a denser geopolymer layer on the bottom [19]. The addition of the coke dust waste reduced the high flowability and increased the viscosity of geopolymer paste; on the other hand, this material acted as a filler, making the frame of the geopolymer structure more rigid and leading to the formation of open pores with a significant reduction of pore collapse, as a result of the more uniform open pores distribution compared to the GF-0 pure foam.
The bulk density, water absorption, and thermal conductivity of the foam samples are shown in Table 3. As the table depicts, the geopolymer mixture with the addition of 0.5 wt % aluminum powder produced foam samples with approximately equal densities. The bulk density of GF-0 was 477.87 kg/m3. The addition of 5 wt % coke dust content into the geopolymer paste produced a foam sample with a lower density (444.73 kg/m3). This is attributed to the expansion rate during foam formation. While all the samples containing coke dust showed an almost equal expansion, the GF-0 sample had slightly less expansion. As explained above, the addition of coke dust to geopolymer helped to prevent collapse in the course of the macropore formation process resulting in the fact that the volume of expansion of the foam sample with fillers was larger than that of the pure foam samples. It can be said that the addition of coke dust content beyond 5 wt % did not cause a significant change in the bulk density of the composite foams. Table 3 also shows the results of the water absorption capacity of the foam samples. The water absorption rate reveals the number of open pores inside the structure of the materials. If less water penetrates into the structure, this indicates that the material has fewer pores, resulting in less water absorption. The highest water absorption was seen in sample GF-5 (66.89%). GF-5 showed a water absorption value that was approximately 11.2% higher than that of GF-0. The lesser water absorption capacity of GF-0 is attributed to the reduced pore layer on the sample’s bottom, where there was less water penetration. This is consistent with the results of the bulk density of the foam samples. When the geopolymer paste was replaced by 10, 20, and 30 wt % coke dust content, the water absorption of the corresponding foam samples tended to decrease compared with the GF-5 sample. This is due to the occupation of the pores by the fillers. Coke dust particles with a fine particle size can penetrate inside the pores and fill them up, resulting in reduced water retention. Regarding the thermal conductivity, the pure foam and composite foams showed similar results, and the lowest value was found in the GF-5 sample. Although 30 wt % coke dust waste was used to replace geopolymer binder, the weakness in thermal conductivity of these samples was not negligible compared to other samples. As can be seen in Table 3, the thermal conductivity of sample GF-0 was 0.14 W m−1 K−1, which decreased by 13.57% for the GF-5 sample (0.121 W m−1 K−1). However when the geopolymer foam was reinforced with 10%, 20%, and 30% CDW, the thermal conductivity of the corresponding samples increased by 2.85%, 5.71%, and 10.71% compared to the GF-0 sample. There was a close relationship between bulk density and thermal conductivity. With increasing coke dust concentration, the thermal conductivity increased slightly due to the density increase. Hence, it could be concluded that the coke dust itself had no negative effects on the thermal conductivity of the geopolymer foam.
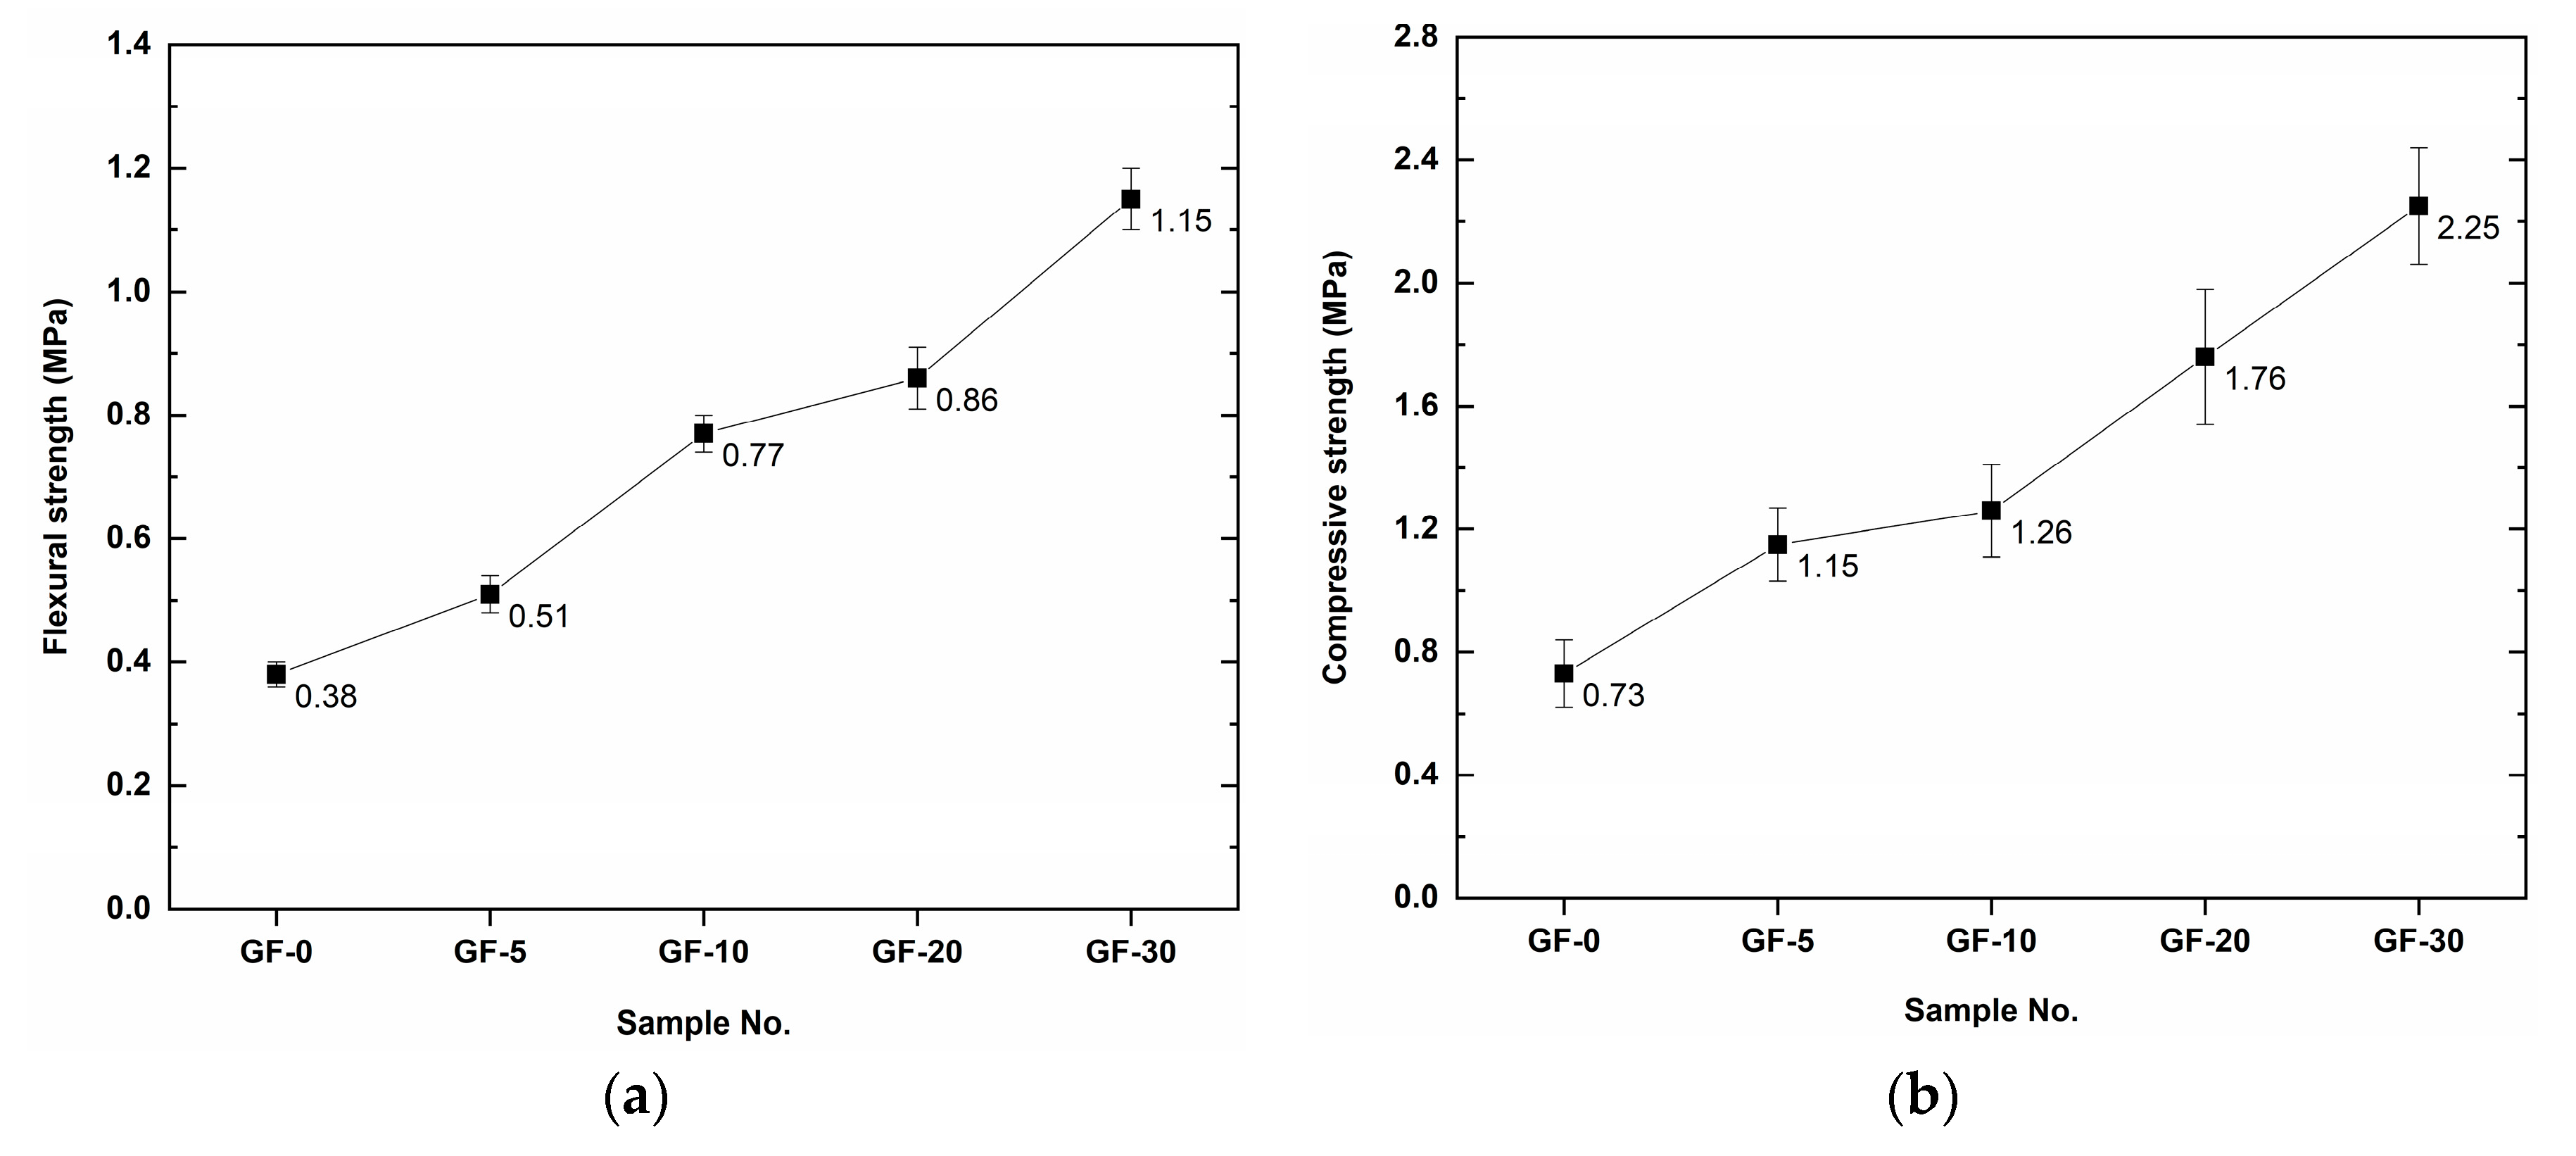
Figure 7 compares the average mechanical strength of the pure foam and composite foams containing different contents of the coke dust at the age of 28 days. As expected, the geopolymer foam reinforced with the coke dust waste had significantly improved mechanical strength. From this result, it can be confirmed that the cohesion strength between geopolymer matrix and coke dust was very good. The mechanical strength of the composite foams always tended to increase as the amount of added filler increased. In this work, the reasonable content of 30 wt % coke dust added to geopolymer paste (GF-30) was used. Mixtures with up to 40% CDW could still be worked in the geopolymer paste, but the fresh mix’s flowability is lost at this addition level, making it impossible to add the Al foaming powder at the later stage. The pure foam (GF-0) showed relatively low mechanical strength (0.36 MPa in flexure and 0.73 MPa in compression). The geopolymer foam (GF-30) reinforced with 30 wt % coke dust increased in flexure by 202.63% MPa and in compression by 208.22% MPa. From an economical point of view, the coke dust appears to be a very effective filler for geopolymer materials.
3.3. High-Temperature Properties of the CDW/Geopolymer Foams
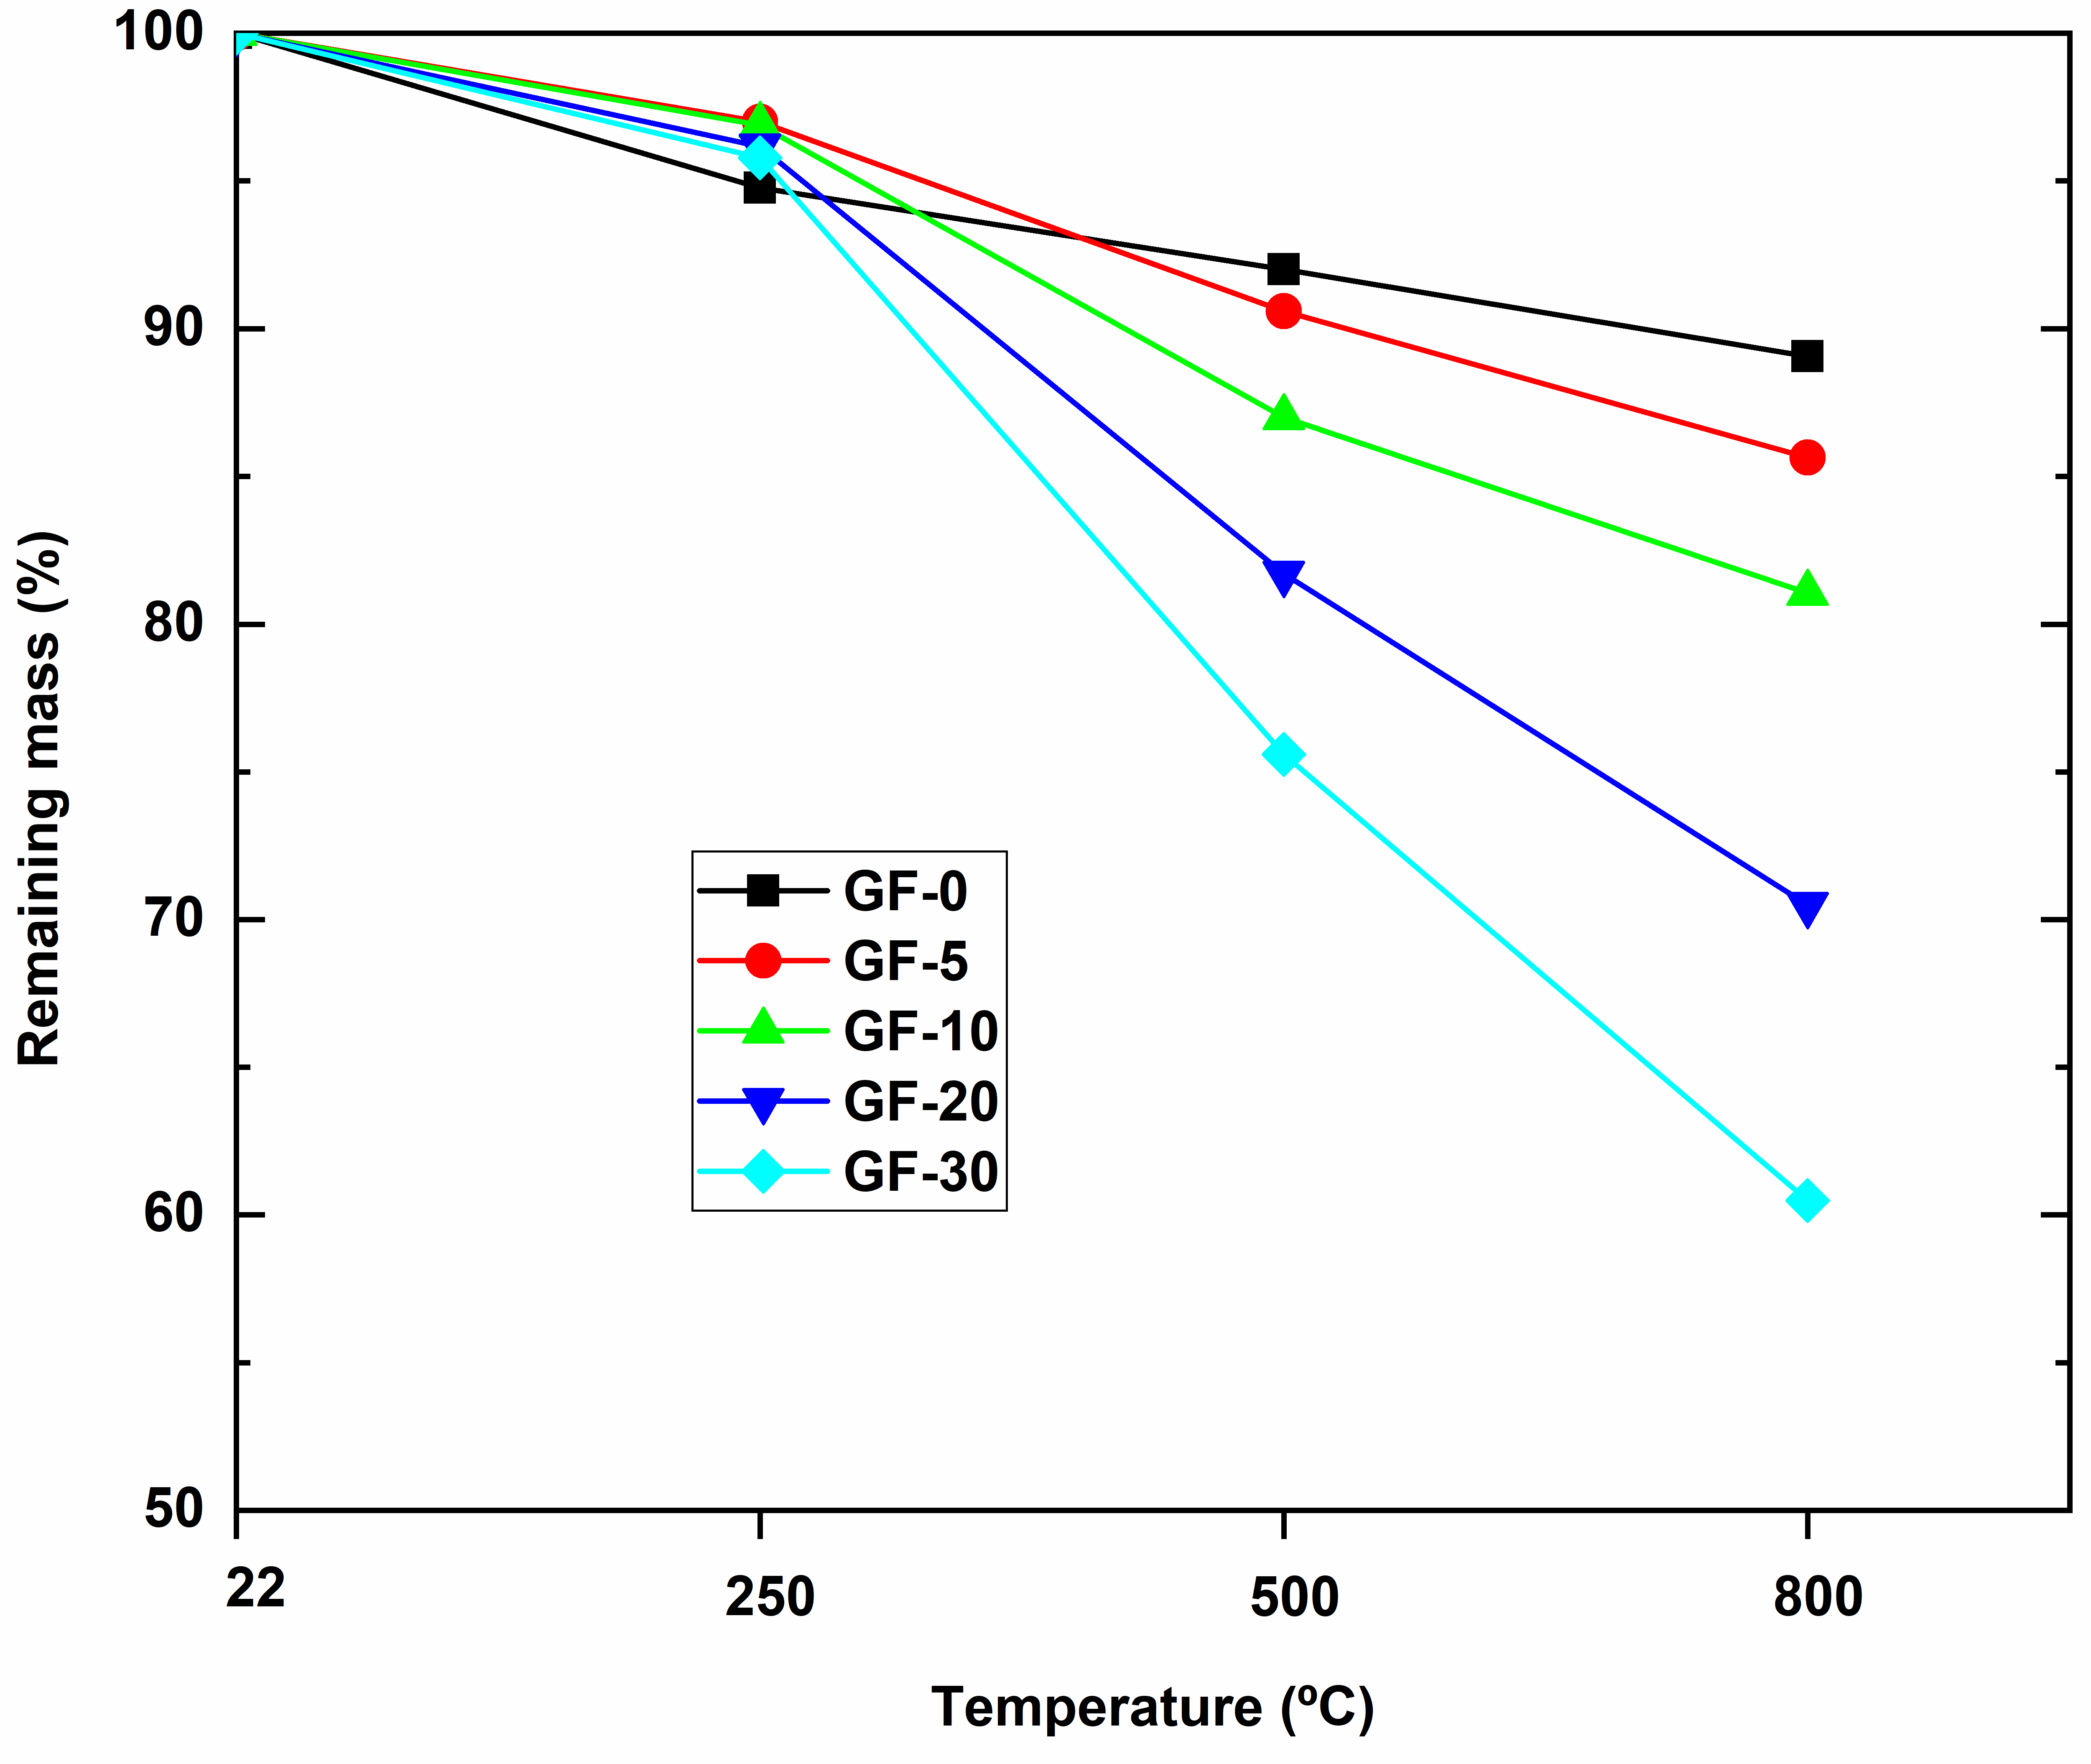
Due to the high carbon content in coke dust, the mechanical strength of the geopolymer foams at elevated temperatures was evaluated. Figure 8 demonstrates the weight loss of the geopolymer foam samples after being exposed to elevated temperatures (250 °C, 500 °C, and 800 °C). At 250 °C, the mass loss gradually decreased when the foam samples were reinforced with increasing content of the coke dust, and the highest mass loss was seen in sample GF-0. The reason is that at this temperature the free water was excluded from the geopolymer structure, resulting in a mass reduction of the samples, while the thermal resistance of carbon was still good. With further increase of the temperature from 500 °C to 800 °C, while the pure foam showed a continuous mass loss with a low rate, the composite foams displayed a high mass loss. This behavior is attributed to the oxidation of carbon at high temperatures [26]. The remaining mass of the pure foam was 89.07% of the original mass, whereas the GF-30 composite foam had only 60.49% of its original mass remaining at 800 °C.
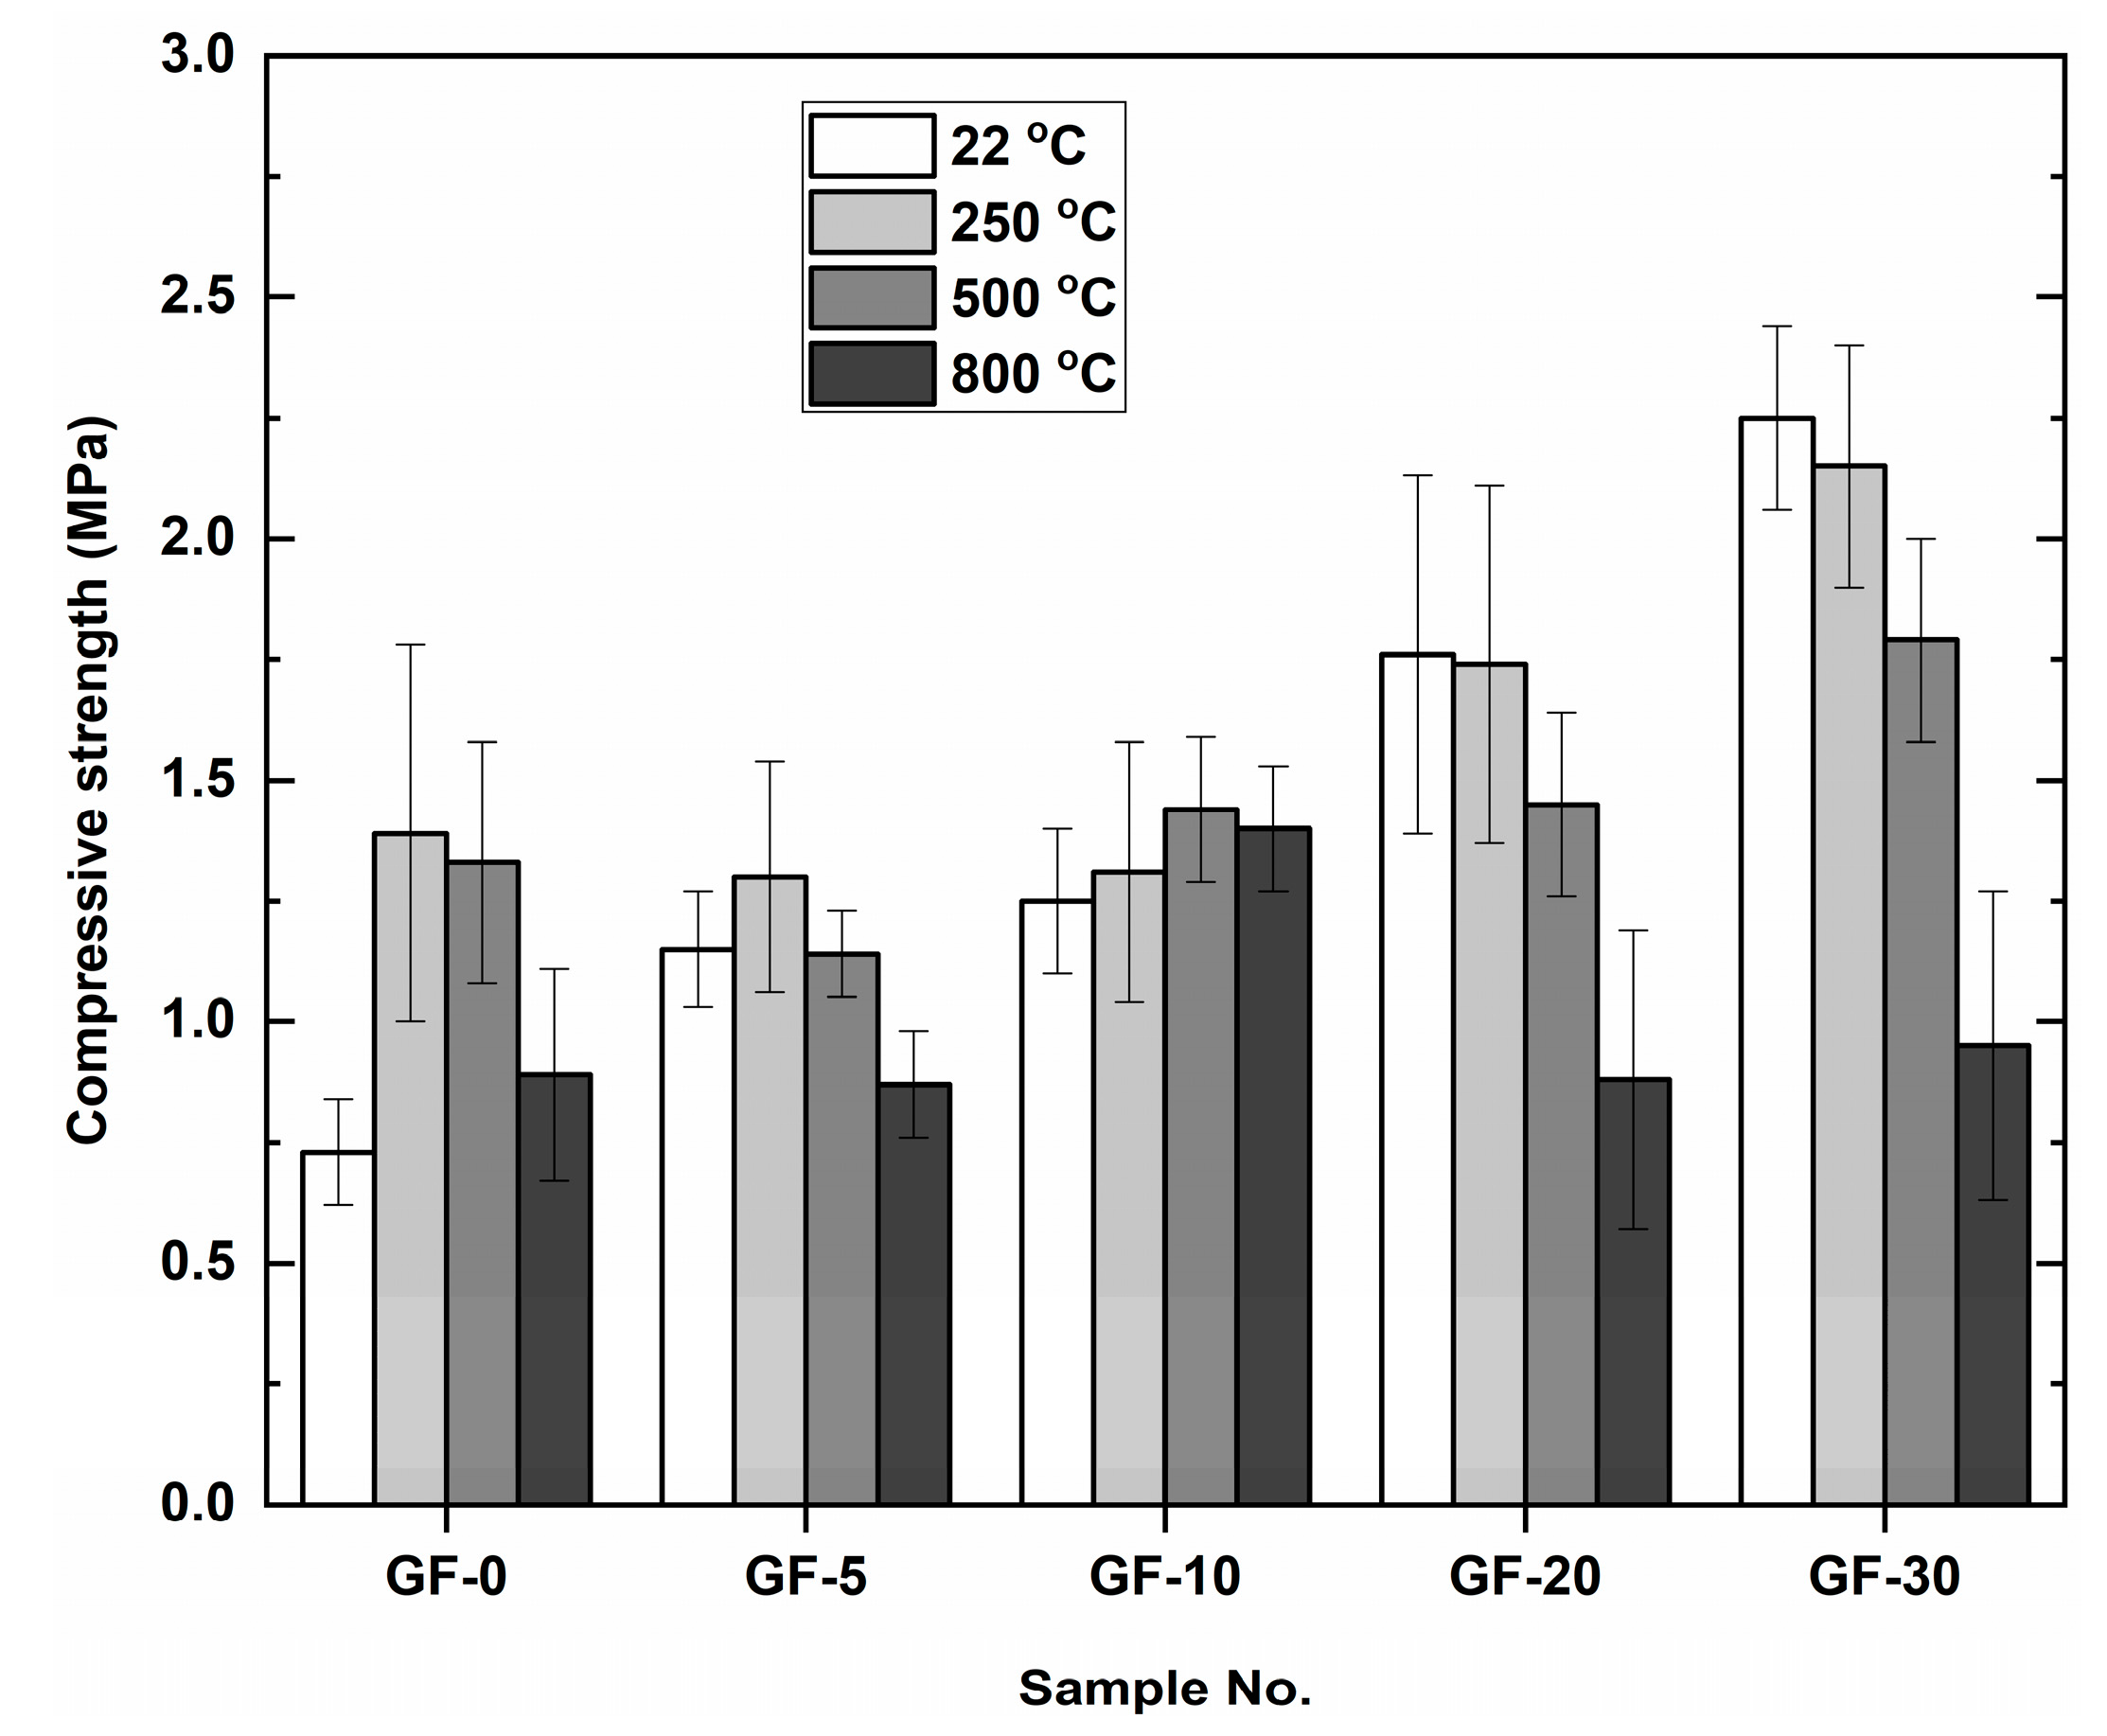
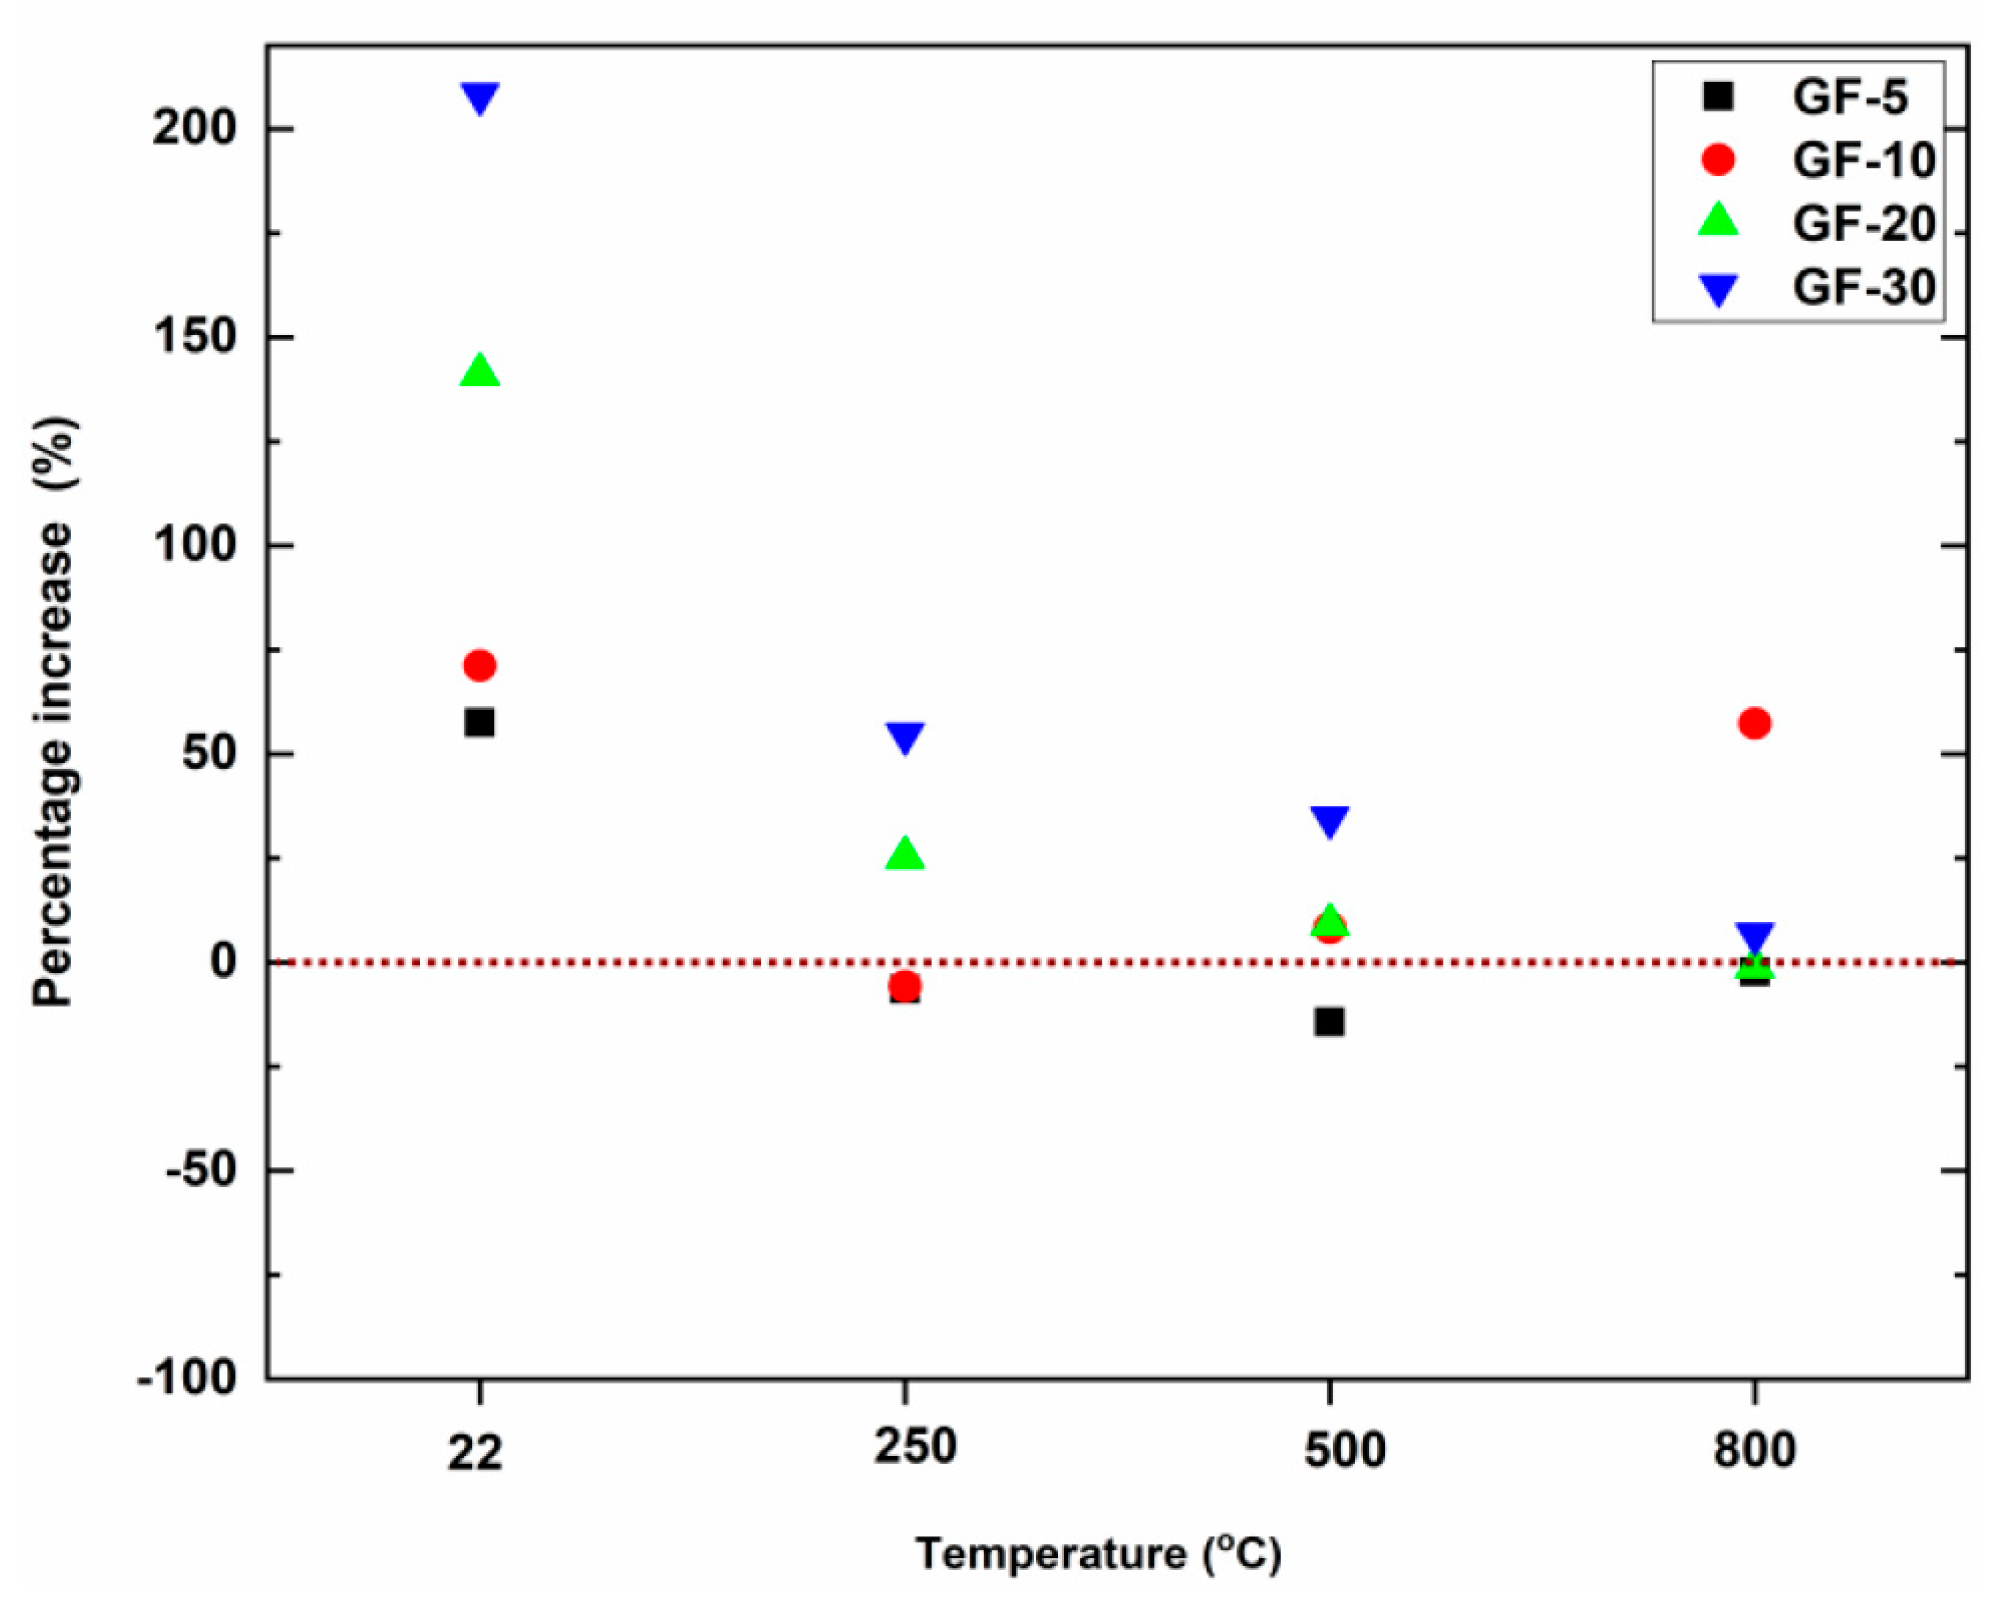
The average compressive strength of the pure foams and composite foams incorporating coke dust waste before and after elevated temperature exposure is depicted in Figure 9. In the case of the GF-0 pure foams, the samples exposed to 250 °C and 500 °C exhibited much higher strength than those at room temperature. Exposure to this temperature level increased the strength of the geopolymers by approximately by 90.41%. As reported in [9,27], this is mainly attributed to the increase in surface forces between the gel particles due to the release of adsorbed moisture and the formation of additional geopolymer binder gel and the simultaneous refinement of the pore structure occurring during geo-polymerization in the exposed samples. The samples then showed a significant decrease in strength at 800 °C. The strength deterioration at this temperature is attributed to an increase in the capillary tension formed in the sample due to its continuous shrinkage behavior [27]. However, the sample strength was still higher than the reference value (without exposure to high temperature). In the case of the composite foams, the replacement of the geopolymer binder by 10 wt % coke dust caused the GF-10 sample to show good resistance to high temperatures. The sample strength did not show any noticeable decrease, even at 800 °C. This confirms that the coke dust waste also clearly contributed to the high-temperature resistance of the geopolymer materials. However, the use of 20 wt % coke dust and above caused the samples to drop significantly in strength beginning at exposure temperatures of 500 °C. Compared to the reference value, the GF-20 sample decreased in compressive strength by 17.61% at 500 °C and by 50% at 800 °C, while the corresponding values for GF-30 were 20.44% and 57.77%, respectively. An overview of the compressive strength comparison of the composite foams with the pure foam is demonstrated in Figure 10. It can be seen that despite the apparent strength degradation of composite foams having high coke dust content at high temperatures, the residual strengths of these composite foams always reached a value approximately equal to or higher than that of pure foam at each given temperature level.
Table 4 shows the identified elements in the geopolymer foams. All the samples displayed high concentrations of silicon, aluminum, and oxygen as evidence for the formation of alumino-silicate gels. Additionally, a high concentration of carbon with increasing coke dust content was found in the composite foams. After exposure to high temperatures, the concentration of carbon tended to decrease with increasing temperature. This indicated that an essential strength reduction of composite foams containing high coke dust content was due to the absence of carbon concentration. In contrast, based on the identified elements by EDS analysis there is no clear explanation as to why the GF-10 sample maintained good strength at high temperatures. It can be said that the geopolymer binder combined with the optimal concentration of the coke dust could promote the optimum reaction to the geopolymerization process, helping to lend the resulting product good resistance to high temperatures.
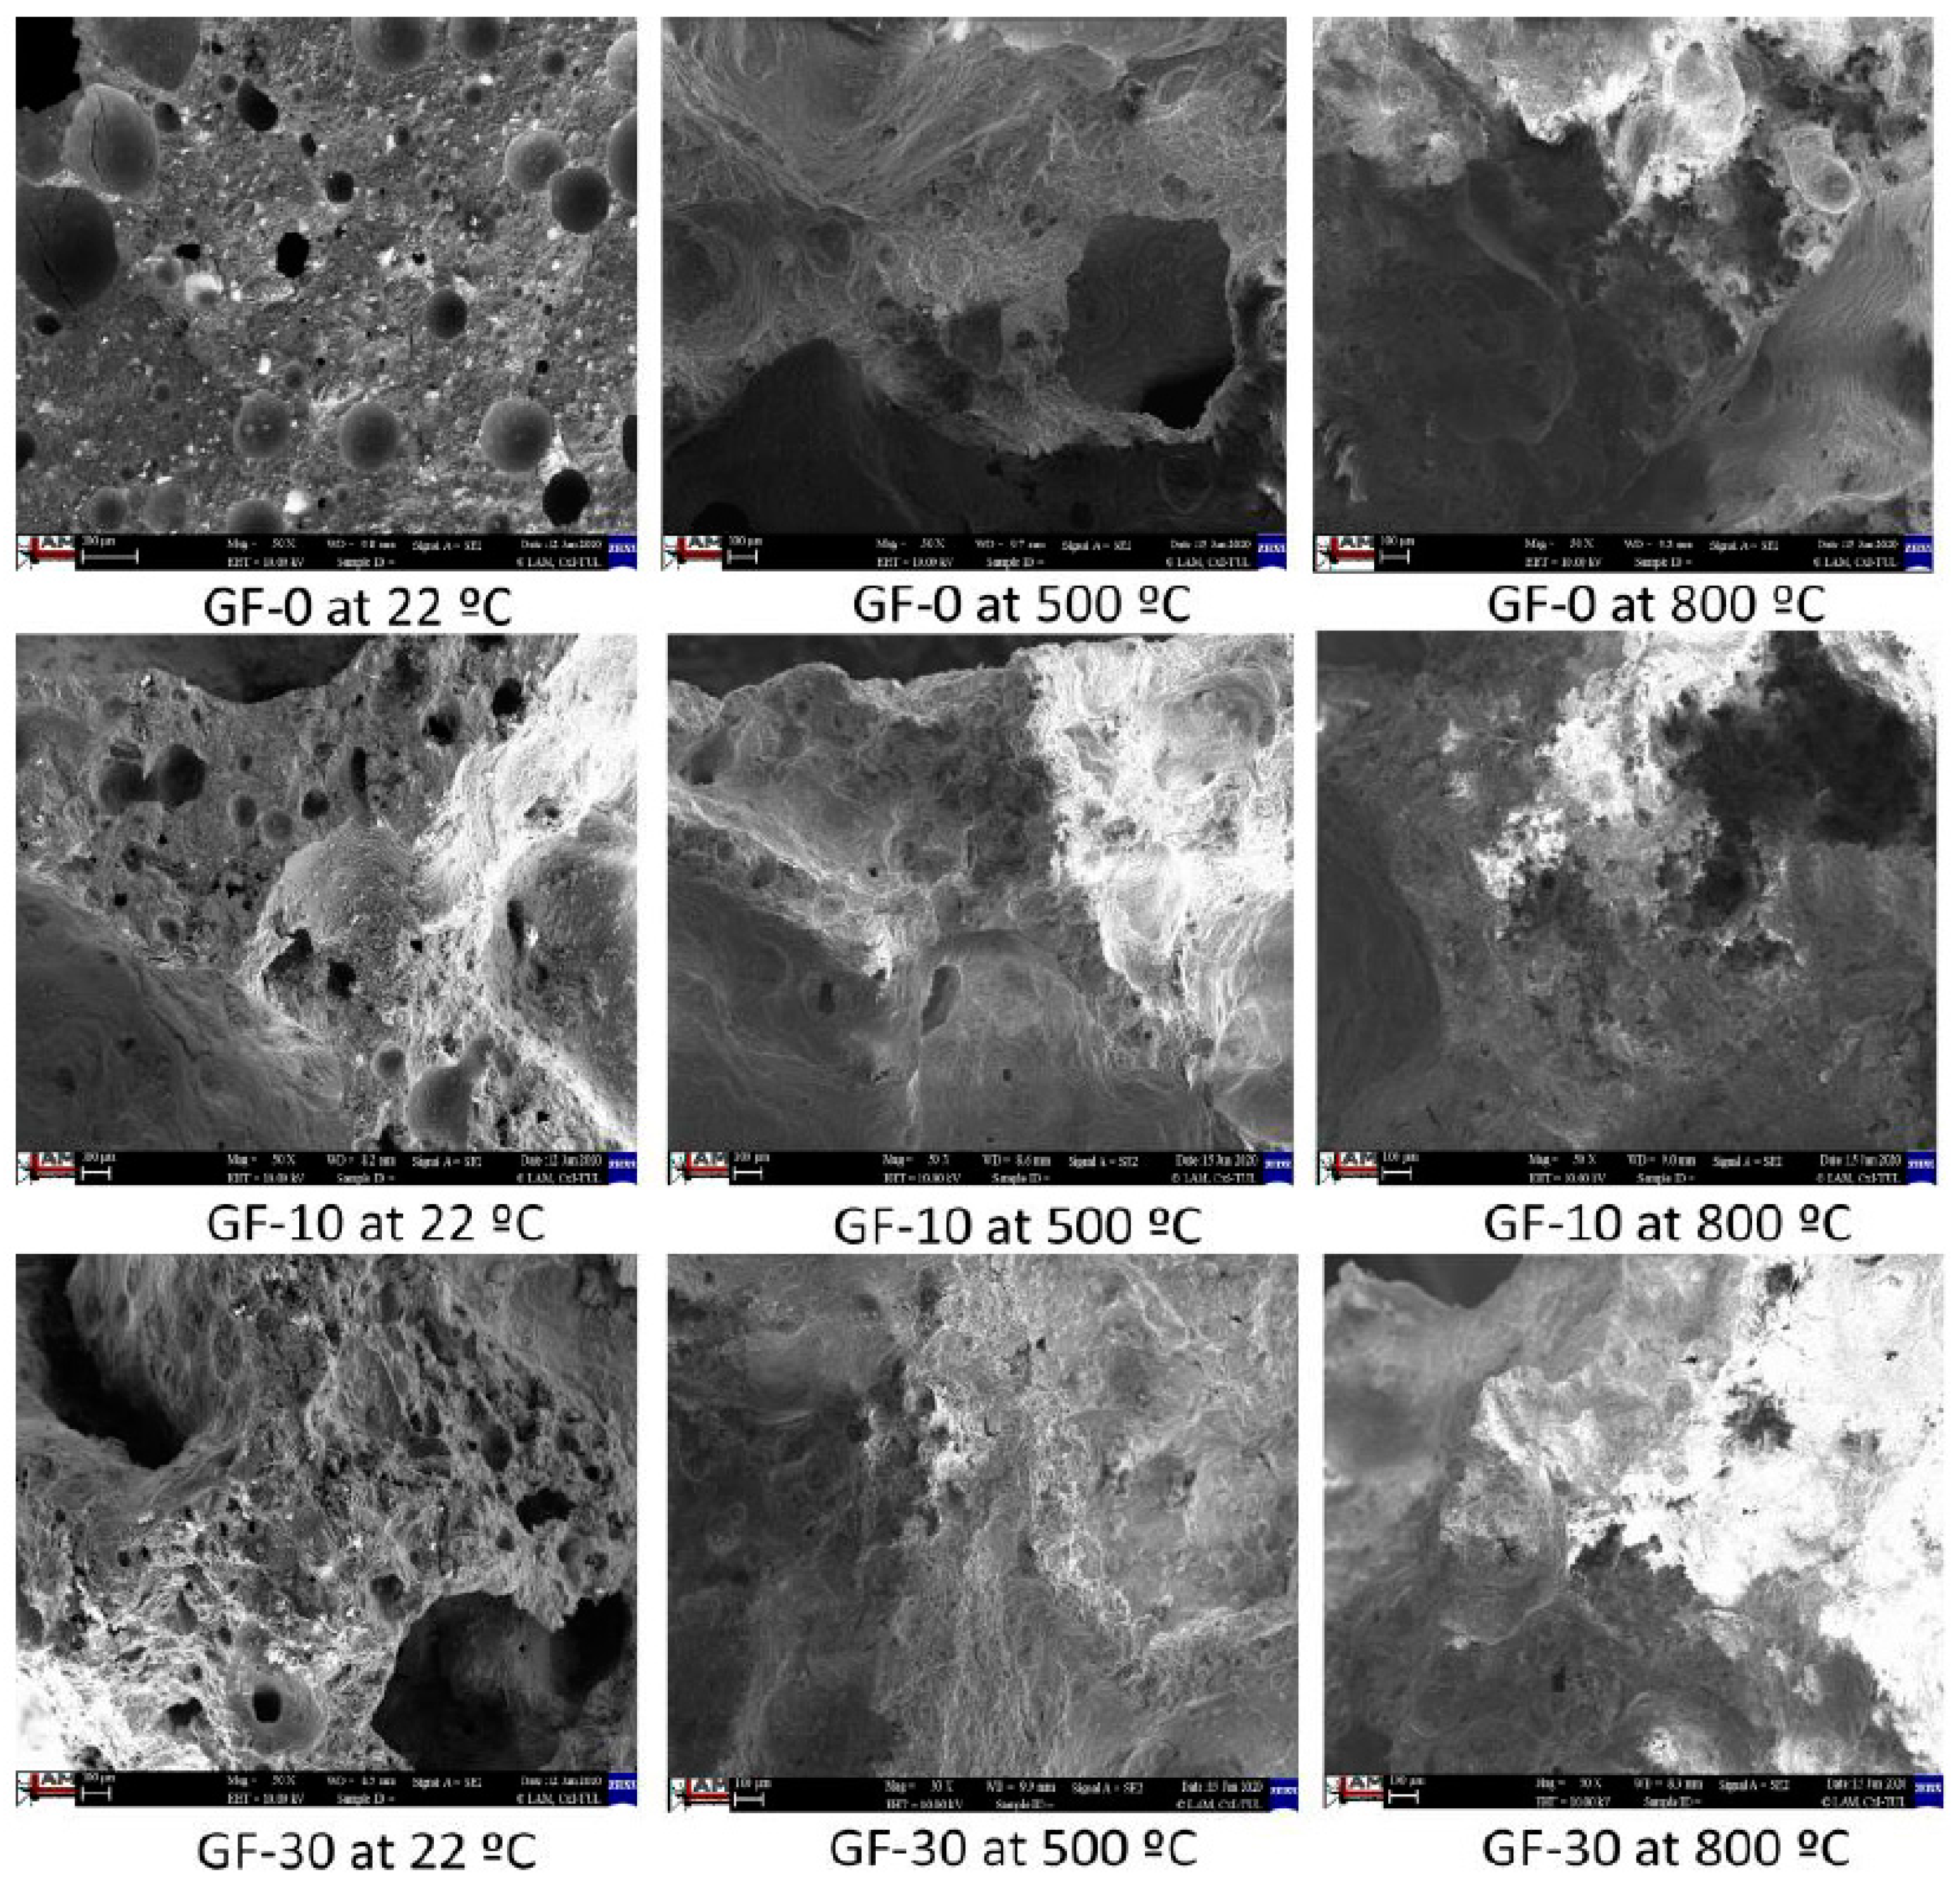
The main changes in the microstructure were demonstrated through SEM microscopy. Figure 11 indicates the clear distinction in the morphologies of the unheated foams and the heated foams, as seen in fracture sections of the tested samples. The pure foam exposed a microstructure with many pores, residual metakaolin particles, and microcracks. In contrast, the coke dust particles were closely combined with the geopolymer gel, resulting in a less-porous structure with fewer visible cracks. This result is consistent with the considerably higher mechanical strength of composite foams compared to the pure foams. After exposure to 500 °C and 800 °C, all the foam samples were sintered to form a very dense structure where only larger pores were left. The GF-10 sample showed a microstructure similar to those of the other ones. Therefore, the excellent thermal resistance of the GF-10 sample was impossible to explain by the SEM analysis.
4. Conclusions
The submitted paper presents the mechanical properties of composites made from geopolymer foams containing coke dust waste. The CDW was used in this work to substitute a portion of the geopolymer paste at 5%, 10%, 20%, and 30% by the geopolymer paste mass. The following conclusions can be drawn from the findings. The addition of CDW into pure geopolymer led to a homogenously foamed material by decreasing the collapse of pores before the hardening stage. As the amount of added CDW increased, the mechanical strength of the composite foams also tended to rise markedly. It was observed that there was a close relation between bulk density and thermal conductivity. With increasing CDW concentration, the insulation ability of the samples tended to reduce marginally due to the slight rise in density. Therefore, it can be concluded that CDW itself has no negative effects on the thermal conductivity of the geopolymer foam. Regarding the thermal resistance, the samples with 10% CDW concentration displayed impressive strength retention after exposure to all temperatures, suggesting that they were thermally resistant to damage. For the remaining composite foams, the compressive strength decreased significantly at exposure temperatures above 500 °C due to carbon degradation. However, the residual strength of these samples was not significantly different from that of pure geopolymer foam. It can be concluded that coke dust waste appears to be a useful filler in the production of geopolymer composite foams, from technical, economic, and environmental points of view.
Author Contributions
B.K. conceived of, designed, and performed the experiments; C.H.L. performed the tests, produced the graphics, and wrote the paper; P.L.—supervision; S.M. prepared the samples and measured thermal conductivity; T.B. obtained the data and SEM images; P.T. performed the experiments; K.P. conceived and designed the experiments. All authors have read and agreed to the published version of the manuscript.
Funding
The results of the project “Thermal nano insulation for automotive, aviation and aeronautics” registration number TH04020189 were obtained through the financial support of Technology Agency of the Czech Republic within the EPSILON Program.
Acknowledgments
This publication was written at the Technical University of Liberec, Faculty of Mechanical Engineering with the support of the Institutional Endowment for the Long Term Conceptual Development of Research Institutes, as provided by the Ministry of Education, Youth and Sports of the Czech Republic in the year 2020.
Conflicts of Interest
The authors declare no conflict of interest.
References
- Davidovits, J. Geopolymers: Ceramic-like inorganic polymers. J. Ceram. Sci. Technol. 2017, 8, 335–350. [Google Scholar]
- Kalaw, M.E.; Culaba, A.; Hinode, H.; Kurniawan, W.; Gallardo, S.; Promentilla, M.A. Optimizing and Characterizing Geopolymers from ternary blend of philippine coal fly ash, coal bottom ash and rice hull ash. Materials 2016, 9, 580. [Google Scholar] [CrossRef] [PubMed]
- Hájková, P. Kaolinite Claystone-Based Geopolymer Materials: Effect of Chemical Composition and Curing Conditions. Minerals 2018, 8, 444. [Google Scholar] [CrossRef] [Green Version]
- Prochon, P.; Zhao, Z.; Courard, L.; Piotrowski, T.; Michel, F.; Garbacz, A. Influence of Activators on Mechanical Properties of Modified Fly Ash Based Geopolymer Mortars. Materials 2020, 13, 1033. [Google Scholar] [CrossRef] [PubMed] [Green Version]
- Samantasinghar, S.; Singh, S.P. Effect of synthesis parameters on compressive strength of fly ash-slag blended geopolymer. Constr. Build. Mater. 2018, 170, 225–234. [Google Scholar] [CrossRef]
- Rocha, S.; Dias, D.P.; França, F.C.C.; Guerra, R.R.d.S.; Marques, L.R.d.C.d.O. Metakaolin-based geopolymer mortars with different alkaline activators. Constr. Build. Mater. 2018, 178, 453–461. [Google Scholar] [CrossRef]
- Xie, J.; Zhao, J.; Wang, J.; Wang, C.; Huang, P.; Fang, C. Sulfate Resistance of Recycled Aggregate Concrete with GGBS and Fly Ash-Based Geopolymer. Materials 2019, 12, 1247. [Google Scholar] [CrossRef] [Green Version]
- Yan, D.; Xie, L.; Qian, X.; Ruan, S.; Zeng, Q. Compositional Dependence of Pore Structure, Strengthand Freezing-Thawing Resistance of Metakaolin-Based Geopolymers. Materials 2020, 13, 2973. [Google Scholar] [CrossRef]
- Rovnaník, P.; Šafránková, K. Thermal Behaviour of Metakaolin/Fly Ash Geopolymers with Chamotte Aggregate. Materials 2016, 9, 535. [Google Scholar] [CrossRef]
- Peng, X.; Shuai, Q.; Li, H.; Ding, Q.; Gu, Y.; Cheng, C.; Xu, Z. Fabrication and Fireproofing Performance of the Coal Fly Ash-Metakaolin-Based Geopolymer Foams. Materials 2020, 13, 1750. [Google Scholar] [CrossRef] [Green Version]
- Punurai, W.; Kroehong, W.; Saptamongkol, A.; Chindaprasirt, P. Mechanical properties, microstructure and drying shrinkage of hybrid fly ash-basalt fiber geopolymer paste. Constr. Build. Mater. 2018, 186, 62–70. [Google Scholar] [CrossRef]
- Meyer, C. The greening of the concrete industry. Cem. Concr. Compos. 2009, 31, 601–605. [Google Scholar] [CrossRef]
- Su, L.V.; Pavlína, H.; Vladimir, K.; Totka, B.; Lukáš, V.; Hiep, L.C.; Kevin, C.S.; Amanda, P.P.; Louda., P. Thermal conductivity of reinforced geopolymer foams. Ceram. Silikáty 2019, 63, 365–373. [Google Scholar]
- Roviello, G.; Ricciotti, L.; Molino, A.J.; Menna, C.; Ferone, C.; Asprone, D.; Cioffi, R.; Ferrandiz-Mas, V.; Russo, P.; Tarallo, O. Hybrid Fly Ash-Based Geopolymeric Foams: Microstructural, Thermal and Mechanical Properties. Materials 2020, 13, 2919. [Google Scholar] [CrossRef]
- Leiva, C.; Luna-Galiano, Y.; Arenas, C.; Alonso-Fariñas, B.; Fernández-Pereira, C. A porous geopolymer based on aluminum-waste with acoustic properties. Waste Manag. 2019, 95, 504–512. [Google Scholar] [CrossRef]
- Feng, J.; Zhang, R.; Gong, L.; Li, Y.; Cao, W.; Cheng, X. Development of porous fly ash-based geopolymer with low thermal conductivity. Mater. Des. 2015, 65, 529–533. [Google Scholar] [CrossRef]
- Soltan, H.; Abdel-gawwad, H.A.; García, S.R.V.; Israde-alcántara, I. Fabrication and characterization of thermally-insulating coconut ash-based geopolymer foam. Waste Manag. 2018, 80, 235–240. [Google Scholar]
- Batool, F.; Bindiganavile, V. Quantification of factors influencing the thermal conductivity of cement- based foam. Cem. Concr. Compos. 2018, 91, 76–86. [Google Scholar] [CrossRef]
- Kaddami, A.; Pitois, O. Cement and Concrete Research A physical approach towards controlling the microstructure of metakaolin-based geopolymer foams. Cem. Concr. Res. 2019, 124, 105807. [Google Scholar] [CrossRef]
- Papa, E.; Medri, V.; Kpogbemabou, D.; Morinière, V.; Laumonier, J.; Vaccari, A. Porosity and insulating properties of silica-fume based foams. Energy Build. 2016, 131, 223–232. [Google Scholar] [CrossRef]
- Petlitckaia, S.; Poulesquen, A. Design of lightweight metakaolin based geopolymer foamed with hydrogen peroxide. Ceram. Int. 2019, 45, 1322–1330. [Google Scholar] [CrossRef]
- Rickard, W.D.A.; Van Riessen, A. Performance of solid and cellular structured fly ash geopolymers exposed to a simulated fire. Cem. Concr. Compos. 2014, 48, 75–82. [Google Scholar] [CrossRef]
- IARC Working Group on the Evaluation of Carcinogenic Risk to Humans. Chemical Agents and Related Occupations; (IARC Monographs on the Evaluation of Carcinogenic Risks to Humans, No. 100F.); International Agency for Research on Cancer: Lyon, France, 2012; COKE PRODUCTION. Available online: https://www.ncbi.nlm.nih.gov/books/NBK304422/ (accessed on 5 August 2020).
- Jastrzębska Spółka Węglowa, S. A. Available online: https://www.jsw.pl/en/for-contractors/coke-and-by-products (accessed on 29 July 2020).
- Yan, S.; Zhang, F.; Liu, J.; Ren, B.; He, P.; Jia, D.; Yang, J. Green synthesis of high porosity waste gangue microsphere/geopolymer composite foams via hydrogen peroxide modification. J. Clean. Prod. 2019, 227, 83–494. [Google Scholar] [CrossRef]
- Xiaowei, L.; Jean-charles, R.; Suyuan, Y. Effect of temperature on graphite oxidation behavior. Nucl. Eng. Des. 2004, 227, 273–280. [Google Scholar] [CrossRef]
- Azimi, E.A.; Abdullah, M.M.A.B.; Vizureanu, P.; Salleh, M.A.A.M.; Sandu, A.V.; Chaiprapa, J.; Yoriya, S.; Hussin, K.; Aziz, I.H. Strength Development and Elemental Distribution of Dolomite/Fly Ash Geopolymer Composite under Elevated Temperature. Materials 2020, 13, 1015. [Google Scholar] [CrossRef] [PubMed] [Green Version]
Figure 1.
Coke dust waste powder.

Figure 2.
XRD pattern of the coke dust waste.

Figure 3.
The sizes of the foam geopolymer samples prepared for testing: (a) samples for thermal conductivity test; (b) samples for flexural strength and compressive strength test.
Figure 3.
The sizes of the foam geopolymer samples prepared for testing: (a) samples for thermal conductivity test; (b) samples for flexural strength and compressive strength test.

Figure 4.
SEM images of the coke dust: (a) Particles’ shape; (b,c) Clusters of whiskers occurring on the surface of the coke dust particles; (d) Whiskers’ size.
Figure 4.
SEM images of the coke dust: (a) Particles’ shape; (b,c) Clusters of whiskers occurring on the surface of the coke dust particles; (d) Whiskers’ size.

Figure 5.
EDS spectrum: (a) Whisker; (b) Coke dust particle.

Figure 6.
The images of the foam samples containing different coke dust contents.

Figure 7.
Mechanical strength comparison of the geopolymer foam samples at the age of 28 days: (a) Flexural strength; (b) Compressive strength.
Figure 7.
Mechanical strength comparison of the geopolymer foam samples at the age of 28 days: (a) Flexural strength; (b) Compressive strength.

Figure 8.
The change in mass of the foam samples after being heated at elevated temperatures.

Figure 9.
The compressive strength of the samples after being heated at elevated temperatures.

Figure 10.
Compressive strength comparison of composite foams with pure foam samples (dotted line).

Figure 11.
SEM images of the pure foam and composite foams without and with exposure to temperatures of 500 °C and 800 °C.
Figure 11.
SEM images of the pure foam and composite foams without and with exposure to temperatures of 500 °C and 800 °C.


Table 1.
Chemical composition of the coke dust waste, determined by XRF (wt %).
| SiO2 | Al2O3 | Fe2O3 | SO3 | CaO | MgO | K2O | TiO2 | P2O5 | Na2O | LOI |
|---|---|---|---|---|---|---|---|---|---|---|
| 3.54 | 2.20 | 6.04 | 3.00 | 2.48 | 0.409 | 0.364 | 0.319 | 0.22 | 0.129 | 69.68 |
Table 2.
Mix proportions of the geopolymer foams.
| Geopolymer Paste (g) | Coke Dust Waste (g) | Al Powder (wt %) | |
|---|---|---|---|
| GF-0 | 1000 | 0 | 0.5 |
| GF-5 | 950 | 50 | |
| GF-10 | 900 | 100 | |
| GF-20 | 800 | 200 | |
| GF-30 | 700 | 300 |
Table 3.
The physical properties of the geopolymer foam samples.
| Sample No. | GF-0 | GF-5 | GF-10 | GF-20 | GF-30 |
|---|---|---|---|---|---|
| Bulk density (kg/m3) | 477.87 ± 16.59 | 444.73 ± 9.18 | 482.89 ± 11.26 | 486.54 ± 12.13 | 490.84 ± 8.89 |
| Water absorption (wt %) | 60.15 ± 0.91 | 66.89 ± 0.52 | 61.24 ± 2.90 | 58.17 ± 1.92 | 55.39 ± 1.05 |
| Thermal conductivity (W m−1 K−1) | 0.140 ± 0.010 | 0.121 ± 0.006 | 0.144 ± 0.006 | 0.148 ± 0.007 | 0.155 ± 0.006 |
Table 4.
Elemental analysis of the geopolymer foam composites at elevated temperatures (wt %).
| Sample No. | C | O | Na | Mg | Al | Si | S | K | Ca | Fe |
|---|---|---|---|---|---|---|---|---|---|---|
| GF-0-22 °C | 2.64 | 43.26 | 0.18 | 1.33 | 10.31 | 20.44 | 0.32 | 12.02 | 8.73 | 0.75 |
| GF-5-22 °C | 10.56 | 42.76 | 0.30 | 1.08 | 10.00 | 18.65 | 0.07 | 11.14 | 4.83 | 0.61 |
| GF-10-22 °C | 17.95 | 38.94 | 0.18 | 0.83 | 9.46 | 16.79 | 0.13 | 10.53 | 4.61 | 0.59 |
| GF-20-22 °C | 28.24 | 35.75 | 0.30 | 0.71 | 7.68 | 13.64 | 0.18 | 9.24 | 3.87 | 0.37 |
| GF-30-22 °C | 39.45 | 28.46 | 0.27 | 0.67 | 6.88 | 11.85 | 0.20 | 8.57 | 3.34 | 0.42 |
| GF-0-250 °C | 6.46 | 42.56 | 0.27 | 1.04 | 11.24 | 19.91 | 0.32 | 12.04 | 5.72 | 0.42 |
| GF-5-250 °C | 9.18 | 42.41 | 0.29 | 1.02 | 9.65 | 18.49 | 0.15 | 11.83 | 6.04 | 0.95 |
| GF-10-250 °C | 10.75 | 41.43 | 0.27 | 0.79 | 10.64 | 18.39 | 0.19 | 12.61 | 4.68 | 0.25 |
| GF-20-250 °C | 26.67 | 34.21 | 0.38 | 0.58 | 8.25 | 14.02 | 0.15 | 10.57 | 5.17 | 0.19 |
| GF-30-250 °C | 32.52 | 30.58 | 0.42 | 0.65 | 7.67 | 12.54 | 0.15 | 9.17 | 5.89 | 0.21 |
| GF-0-500 °C | 3.88 | 45.90 | 0.41 | 0.91 | 11.62 | 20.26 | 0.06 | 11.95 | 4.80 | 0.21 |
| GF-5-500 °C | 5.63 | 41.41 | 0.27 | 0.88 | 11.09 | 20.13 | 0.14 | 13.21 | 6.82 | 0.42 |
| GF-10-500 °C | 7.86 | 42.03 | 0.31 | 0.84 | 11.21 | 19.23 | 0.23 | 12.48 | 5.37 | 0.43 |
| GF-20-500 °C | 17.29 | 38.15 | 0.48 | 0.87 | 9.60 | 16.54 | 0.49 | 9.79 | 6.15 | 0.63 |
| GF-30-500 °C | 21.87 | 37.55 | 0.45 | 0.83 | 8.78 | 14.84 | 0.52 | 8.15 | 6.47 | 0.71 |
| GF-0-800 °C | 0.92 | 40.68 | 0.26 | 0.92 | 13.55 | 22.76 | 0.16 | 13.66 | 6.57 | 0.51 |
| GF-5-800 °C | 1.92 | 41.27 | 0.39 | 1.14 | 12.66 | 21.34 | 0.55 | 12.12 | 8.61 | 0.49 |
| GF-10-800 °C | 3.62 | 40.61 | 0.26 | 0.66 | 13.13 | 21.01 | 0.28 | 13.33 | 6.57 | 0.53 |
| GF-20-800 °C | 4.24 | 43.62 | 0.27 | 1.02 | 12.33 | 20.34 | 0.28 | 10.69 | 6.69 | 0.52 |
| GF-30-800 °C | 5.49 | 42.94 | 0.39 | 0.97 | 11.97 | 19.54 | 0.32 | 10.24 | 7.59 | 0.54 |
© 2020 by the authors. Licensee MDPI, Basel, Switzerland. This article is an open access article distributed under the terms and conditions of the Creative Commons Attribution (CC BY) license (http://creativecommons.org/licenses/by/4.0/).
Share and Cite
MDPI and ACS Style
Katarzyna, B.; Le, C.H.; Louda, P.; Michał, S.; Bakalova, T.; Tadeusz, P.; Prałat, K. The Fabrication of Geopolymer Foam Composites Incorporating Coke Dust Waste. Processes 2020, 8, 1052. https://doi.org/10.3390/pr8091052
AMA Style
Katarzyna B, Le CH, Louda P, Michał S, Bakalova T, Tadeusz P, Prałat K. The Fabrication of Geopolymer Foam Composites Incorporating Coke Dust Waste. Processes. 2020; 8(9):1052. https://doi.org/10.3390/pr8091052
Chicago/Turabian StyleKatarzyna, Buczkowska, Chi Hiep Le, Petr Louda, Szczypiński Michał, Totka Bakalova, Pacyniak Tadeusz, and Karol Prałat. 2020. "The Fabrication of Geopolymer Foam Composites Incorporating Coke Dust Waste" Processes 8, no. 9: 1052. https://doi.org/10.3390/pr8091052
Note that from the first issue of 2016, this journal uses article numbers instead of page numbers. See further details here.