Techno-Economic Analysis of Bio-Based Lactic Acid Production Utilizing Corn Grain as Feedstock


Department of Food, Agricultural and Biological Engineering, The Ohio State University, 110 FABE Building, 1680 Madison Avenue, Wooster, OH 44691, USA
*
Author to whom correspondence should be addressed.
Processes 2020, 8(2), 199; https://doi.org/10.3390/pr8020199
Submission received: 2 December 2019
/
Revised: 31 January 2020
/
Accepted: 1 February 2020
/
Published: 6 February 2020
(This article belongs to the Special Issue Process Simulation and Techno-Economic Analysis of Food and Bioproducts Processing Systems)
Abstract
:Lactic acid is an important chemical with numerous commercial applications that can be fermentatively produced from biological feedstocks. Producing lactic acid from corn grain could complement the use of already existing infrastructure for corn grain-based ethanol production with a higher value product. The objective of this study was to evaluate the techno-economic feasibility of producing 100,000 metric tons (t) of lactic acid annually from corn grain in a biorefinery. The study estimated the resources (equipment, raw materials, energy, and labor) requirements and costs to produce lactic acid from bacteria, fungi and yeast-based fermentation pathways. Lactic acid production costs were $1181, $1251 and $844, for bacteria, fungi and yeast, respectively. Genetically engineered yeast strains capable of producing lactic acid at low pH support significantly cheaper processes because they do not require simultaneous neutralization and recovery of lactic acid, resulting in lower requirements for chemical, equipment, and utilities. Lactic acid production costs were highly sensitive to sugar-to-lactic-acid conversion rates, grain price, plant size, annual operation hours, and potential use of gypsum. Improvements in process efficiencies and lower equipment and chemical costs would further reduce the cost of lactic acid production from corn grain.
1. Introduction
Lactic acid is one of the few biobased chemicals with applications in food, pharmaceuticals, cosmetics, and polymer industries. The global lactic acid demand is expected to increase from a market value of $2.1 billion in 2016 [1] to $9.8 billion by 2025 [2]. U.S. Department of Energy’s National Laboratories have also identified lactic acid as one of the few promising platform chemicals that can be further converted to other important chemicals, such as acrylic acid, propylene glycol, acetaldehyde, and 2,3-pentanedione and polymers such as poly-lactic acid [3]. Bio-based lactic acid can be produced from different sources, including agricultural residues and food waste [4,5,6,7,8]. Lactic acid production using sugarcane bagasse feedstock showed that cellulose-based processes have larger lactic acid production rates and lower production costs than hemicellulose-based processes; and gypsum-free scenarios had the lowest production costs [9]. Few other studies have evaluated the techno-economics of lactic acid production using other feedstocks such as sugarcane juice, food waste, and different technologies [10,11,12,13,14,15]. Lactic acid from starch-based biomass resources, such as corn grain, can be an attractive option for biorefineries in the U.S. Corn grain contains large fraction of starch, which can be hydrolyzed using enzymes to produce sugars, which can then be fermented to produce lactic acid [16]. Corn grain is extensively used for ethanol production in the U.S. and the technology to convert corn grain to fermentable sugars is well established [17]. Similar technology can be used to obtain sugars for lactic acid fermentation. Lactic acid production from corn grain has other advantages such as in place infrastructure for the production and processing, and well-established technology for the conversion of corn grain to sugars, which can contribute a major share in the U.S. biofuel and bioproducts market [18,19]. Sugars can be fermented to lactic acid using either lactic acid bacteria, fungi, or yeast [20]. The lactic acid purification and recovery processes after fermentation differ based on the microorganisms used for fermentation. The feedstock cost, pretreatment method, choice of fermentation organisms, and lactic acid yields affect the lactic acid production cost and its economic feasibility.
Despite huge potentials and recently growing interest in commercial lactic acid production from corn grain, literature lacks studies that evaluate the techno-economic feasibility of its commercial production. Analysis of fermentation pathways using different microorganism and their techno-economic feasibility can help determine the viable pathways for commercial lactic acid production. Thus, the objective of this study was to evaluate the techno-economic feasibility of lactic acid production from corn grain. The study estimated the resources required including, equipment; chemicals; consumables; utilities; and labor for commercial-scale lactic acid production based on three fermentation pathways using either lactic acid producing bacteria, fungi or yeast.
2. Materials and Methods
2.1. System Overview
This study analyzed the techno-economic feasibility of converting corn grain to lactic acid. A bio-based lactic acid production facility with an annual capacity of 100,000 metric tons (t), on the higher end, was considered for this analysis. The annual production capacity for lactic acid production facilities varies from a few thousand to about 140,000 t [21], with large facilities being established in recent years [22,23]. Lactic acid production is also expected to grow in the future [2]. Corn is extensively used for ethanol production in the U.S. [17]. The corn grain yield has increased steadily over the years [24] and thus, can be available as a feedstock for lactic acid production.
This analysis considered three fermentation pathways using (1) bacteria, (2) fungi and (3) yeast. The lactic acid yield from corn starch-based sugar using bacteria is high (Table 1). However, the lactic acid production pathway using bacteria (Lactobacillus sp.) requires optimal conditions that include pH between 5–7, temperature between 40–45 °C [25,26], and nutrients-rich and sterile conditions. The lactic acid produced during fermentation should be neutralized to maintain the pH, which adds a cost for the neutralization and recovery of lactic acid. Lactic acid fermentation can also be performed using fungi (Rhizopus sp.). Fungi can grow in a nutrient-limited environment compared to bacteria, and effectively ferment both hexose and pentose sugars [27,28,29]. However, fungal fermentation has a lower lactic acid yield due to the formation of other products, such as ethanol and fumaric acid [30]. Fungal fermentation process also requires aeration for higher lactic acid yields which increase lactic acid production costs. Lactic acid can also be produced using yeast, which can ferment at low pH levels and thus, eliminate the need to neutralize and recover lactic acid [23]. The yeast-based fermentation pathway has a high lactic acid yield.
2.2. Discrete Production Processes, Sections and Data Sources
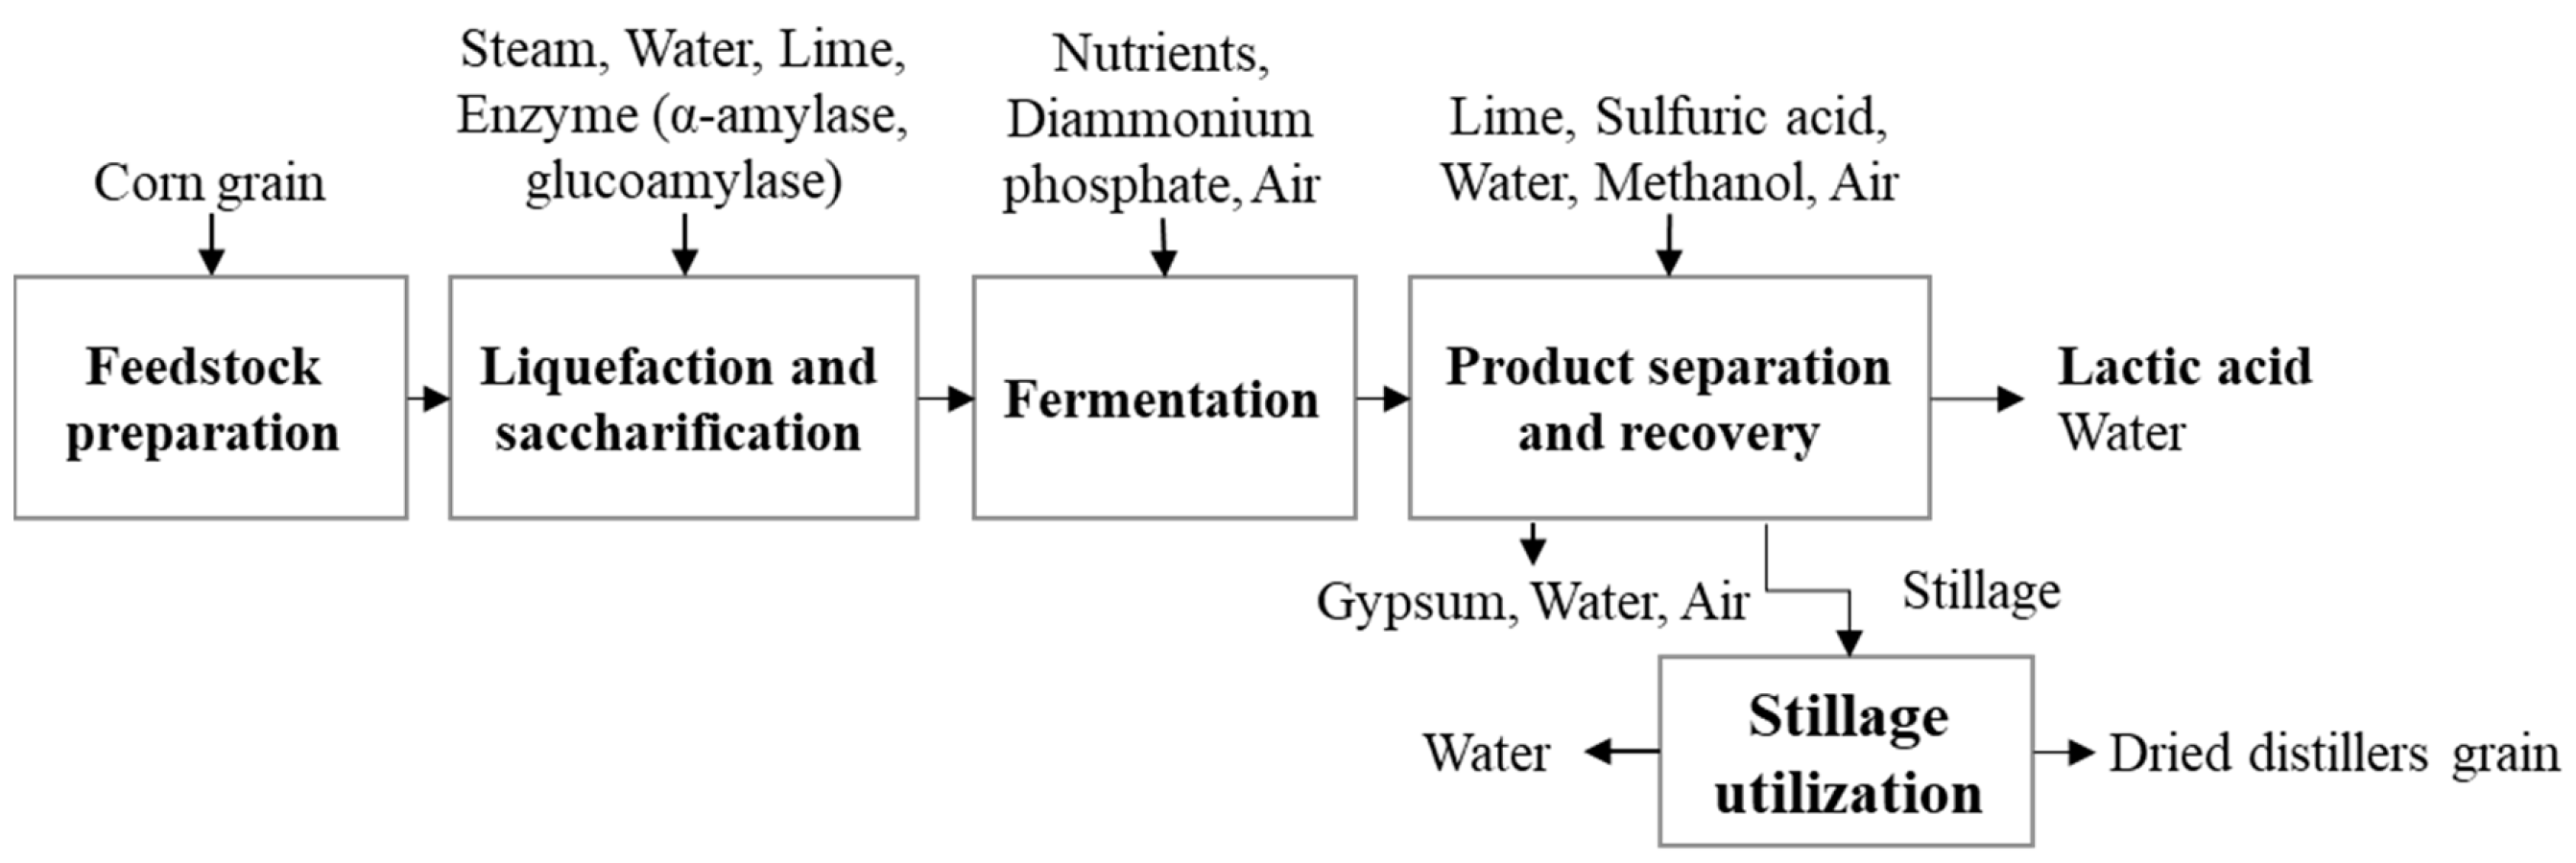
The analysis considered different distinct sections: feedstock preparation, liquefaction/jet cooking, saccharification, fermentation, product recovery, and stillage utilization, to convert corn grain to lactic acid (Figure 1). For these distinct sections, unit operations along with their conversion efficiencies, assumptions, and resources requirements are also considered in this analysis (Table 1) and discussed later.
2.2.1. Feedstock Preparation
This analysis considered corn grain delivered at 15% moisture content to the biorefinery. The composition of wet corn grain: moisture (15%), corn starch (61.2%), fiber (8.7%), protein (8%), oil (3.6%), simple sugars (2.2%), and mineral (1.2%) was obtained from previous studies [31,32,33]. The corn grain was assumed to be stored in silos after delivery to the biorefinery. The grain was then milled using a hammer mill (Figure 1) to reduce the particle size to fine flour, which exposes the starch for further processing and helps the enzyme to efficiently break down the starch to sugars. Dry milling process for corn grain was considered for this study as 90% of grain ethanol in the U.S. is produced from this process [17].
2.2.2. Liquefaction and Saccharification (Enzymatic Hydrolysis)
This study considered liquefaction and saccharification (enzymatic hydrolysis) to break the complex starch to simple sugars. During liquefaction, water is mixed with the fine corn flour and lime is added in the slurry to adjust the pH between 6 and 6.5 [35]. Corn grain is cooked at high temperature using steam in jet-cookers (Figure 1). The cooked slurry, also called mash, is then cooled to 80–90 °C and α-amylase enzyme is added while cooling, which further breaks down the starch into simpler sugars called dextrins [35]. Liquefaction is followed by the saccharification process where the mash is cooled to 30 °C and glucoamylase is added, which breaks down the dextrins to glucose (Figure 1). Simultaneous saccharification and fermentation (SSF) is common practice in most corn grain-based conversion systems in which saccharification usually occurs while the mash is transferred to the fermentation tanks and continues throughout fermentation.
2.2.3. Fermentation
The saccharified solution contains a mixture of fermentable sugars (glucose), corn fiber, protein, oil, and minerals, in addition to the unused chemicals from previous steps. Lactic acid can be produced by fermentation of glucose in the presence of either bacteria, fungi or yeast [52] in continuously stirred fermentation reactors (Figure 1). The pH of the fermentation slurry lowers as lactic acid is produced, which affects the viability and productivity of the microorganisms. Three fermentation pathways using bacteria, fungi and yeast were considered in this study. The effectiveness of the fermentation process depends on the lactic acid yields, lactic acid recovery and produced waste, and affects the lactic acid production cost (Figure 1). Corn steep liquor and diammonium phosphate (DAP) were considered as the nutrient and nitrogen source during fermentation, respectively.
2.2.4. Product Separation and Recovery
The lactic acid broth produced after fermentation has impurities which need to be separated and purified. Lactic acid produced using the yeast-based pathway do not need to be neutralized and precipitated, and directly undergo filtration. However, for bacteria and fungi-based pathways requiring lactic acid neutralization, the lactic acid separation process involving neutralization of the fermentation broth by lime followed by lactic acid recovery is preferred among few other routes due to its low overall cost [44]. The broth including calcium lactate is then acidified with sulfuric acid to produce lactic acid and gypsum cake. The gypsum cake produced from the process (Figure 1) is considered as a waste and collected and transported for disposal. However, in an optimistic scenario, it can be sold as crude gypsum depending on the market demand.
The filtered broth containing lactic acid also has other impurities such as residual sugar, color and other organic acids which need to be removed [44,53]. For all three pathways, lactic acid is further purified by esterification, hydrolysis, distillation, and drying processes (Figure 1) [44,54]. The study considered esterification of lactic acid using methanol to produce methyl lactate. The methyl lactate and other impurities are then distilled to separate methyl lactate while the impurities are fed to the stillage utilization section. The methyl lactate is then hydrolyzed and dried to obtain purified lactic acid.
2.2.5. Stillage Utilization
A large quantity of stillage is produced from commercial grain-based lactic acid production which mainly includes distiller’s dried grain and solubles (DDGS) and wastewater, as with conventional ethanol biorefinery [39]. The wastewater from stillage is considered as a waste stream in this analysis. The DDGS was obtained by centrifugation and drying of waste slurry after distillation (Figure 1). In this study, DDGS was sold as a byproduct.
2.3. Techno-Economic Modeling Overview
2.3.1. Process Modeling
The process model for this study was developed and analyzed using SuperPro Designer software v9.5 [37]. A lactic acid production facility was assumed to be operated 24 h/day for 330 days/year to account for equipment downtime and maintenance. The techno-economic model considered input parameters such as performance parameters (e.g., productivities and efficiencies of equipment; energy, fuel, and consumables required during each conversion step, yields for different conversion steps) and temporal parameters (e.g., feedstock loading and milling time, residence time for each conversion step). Equipment types and size, labor requirements, utilities requirements, and their costs were estimated for each conversion step (Supplementary Material, Table S1). The mass and energy balances based on stoichiometric equations and operation conditions for different conversion steps were used to estimate the equipment size and quantity, utilities, raw materials, and consumables.
2.3.2. Economic Analysis
The lactic acid production costs were estimated based on the total capital investment and operating costs. The total capital investment was estimated as the sum of direct fixed costs (DFC), working capital and start-up cost. The direct fixed cost included total plant costs (TPC) as well as contractor’s fee and contingencies. TPC included total plant direct and indirect costs. Total plant direct costs were estimated as a sum of equipment purchase cost (PC) of all the direct costs related with plant establishment and equipment installation (estimated as % of PC) (Table 2). The size and cost of the equipment were based on equipment sizes used in existing commercial- and pilot-scale biochemical plants [40], and were further adjusted for equipment sizing and inflation to the analysis year 2018 (Supplementary Material, Table S1). Total plant indirect costs include engineering and construction costs and are estimated as a percentage of plant direct costs (DC) (Table 2). Contractor’s fee and contingency were estimated as a percentage of TPC and included in the direct fixed costs (Table 2). Working capital for 1 month of operation was assumed for this analysis, which ensures that the biorefinery could continue its operations and included short-term costs for raw materials, consumables, labor, and utilities. The start-up cost (5% of direct fixed capital) considered in this analysis is a one-time expense incurred to set up and start a new biorefinery, which covers registration, salaries, and labor wages during facility development.
The lactic acid production cost was based on a plant service life of 30 years and includes facility-dependent, raw materials, consumables, labor, utilities, and waste management costs. The facility dependent cost is the cost related to the use of a facility, equipment maintenance, and other costs such as insurance, taxes, and factory overhead expenses. The costs of feedstock, chemicals and enzymes were obtained from previous studies (Table 1). The labor rate ($/h) was assumed to include the basic rate, benefits, supervision, operating supplies, and administration. Costs of utilities such as steam, cooling water, and electricity were also considered for this analysis (Table 2). The minimum selling price (MSP) of the lactic acid to achieve an internal rate of return (IRR) of 10% to ensure profitability was estimated using discounted cash flow analysis. Further financial analysis estimated the net present value (NPV), return on investment (ROI), payback period, and gross margin (GM) to obtain 10% IRR from the lactic acid production facility.
2.3.3. Sensitivity Analysis
The base case scenario for lactic acid production using average values of different input parameters was considered to estimate the lactic acid production cost. Sensitivity analysis was performed to evaluate the effect of variation in the different input parameters on lactic acid production cost by using the most pessimistic and optimistic values available for these parameters (Table 1).
The base case for plant capacity considered in this analysis was 100,000 t/y of lactic acid production. However, the location of the facility, feedstock availability and lactic acid demand could determine the production plant. The pessimistic and optimistic values for plant capacity and equipment costs were taken as ±20% of the base case plant size and equipment costs (Supplementary Material Table S1). Maintenance schedules, feedstock availability and market demand could affect the annual operation hours of the lactic acid biorefinery. The corn grain price varied between $135–290/t in the last 10 years depending on different factors including corn yield, availability and their demand for different uses [49]. The cost of consumables such as sulfuric acid, enzymes, nutrients, lime, and methanol can depend on their quality, availability, and demand of the consumables; and the location of the production facility. The gypsum produced in bacteria- and fungi-based pathways can be sold as crude gypsum [50] or can be disposed, which adds the disposal cost [51], thus impacting the overall lactic acid production costs.
3. Results and Discussion
3.1. Material Balance
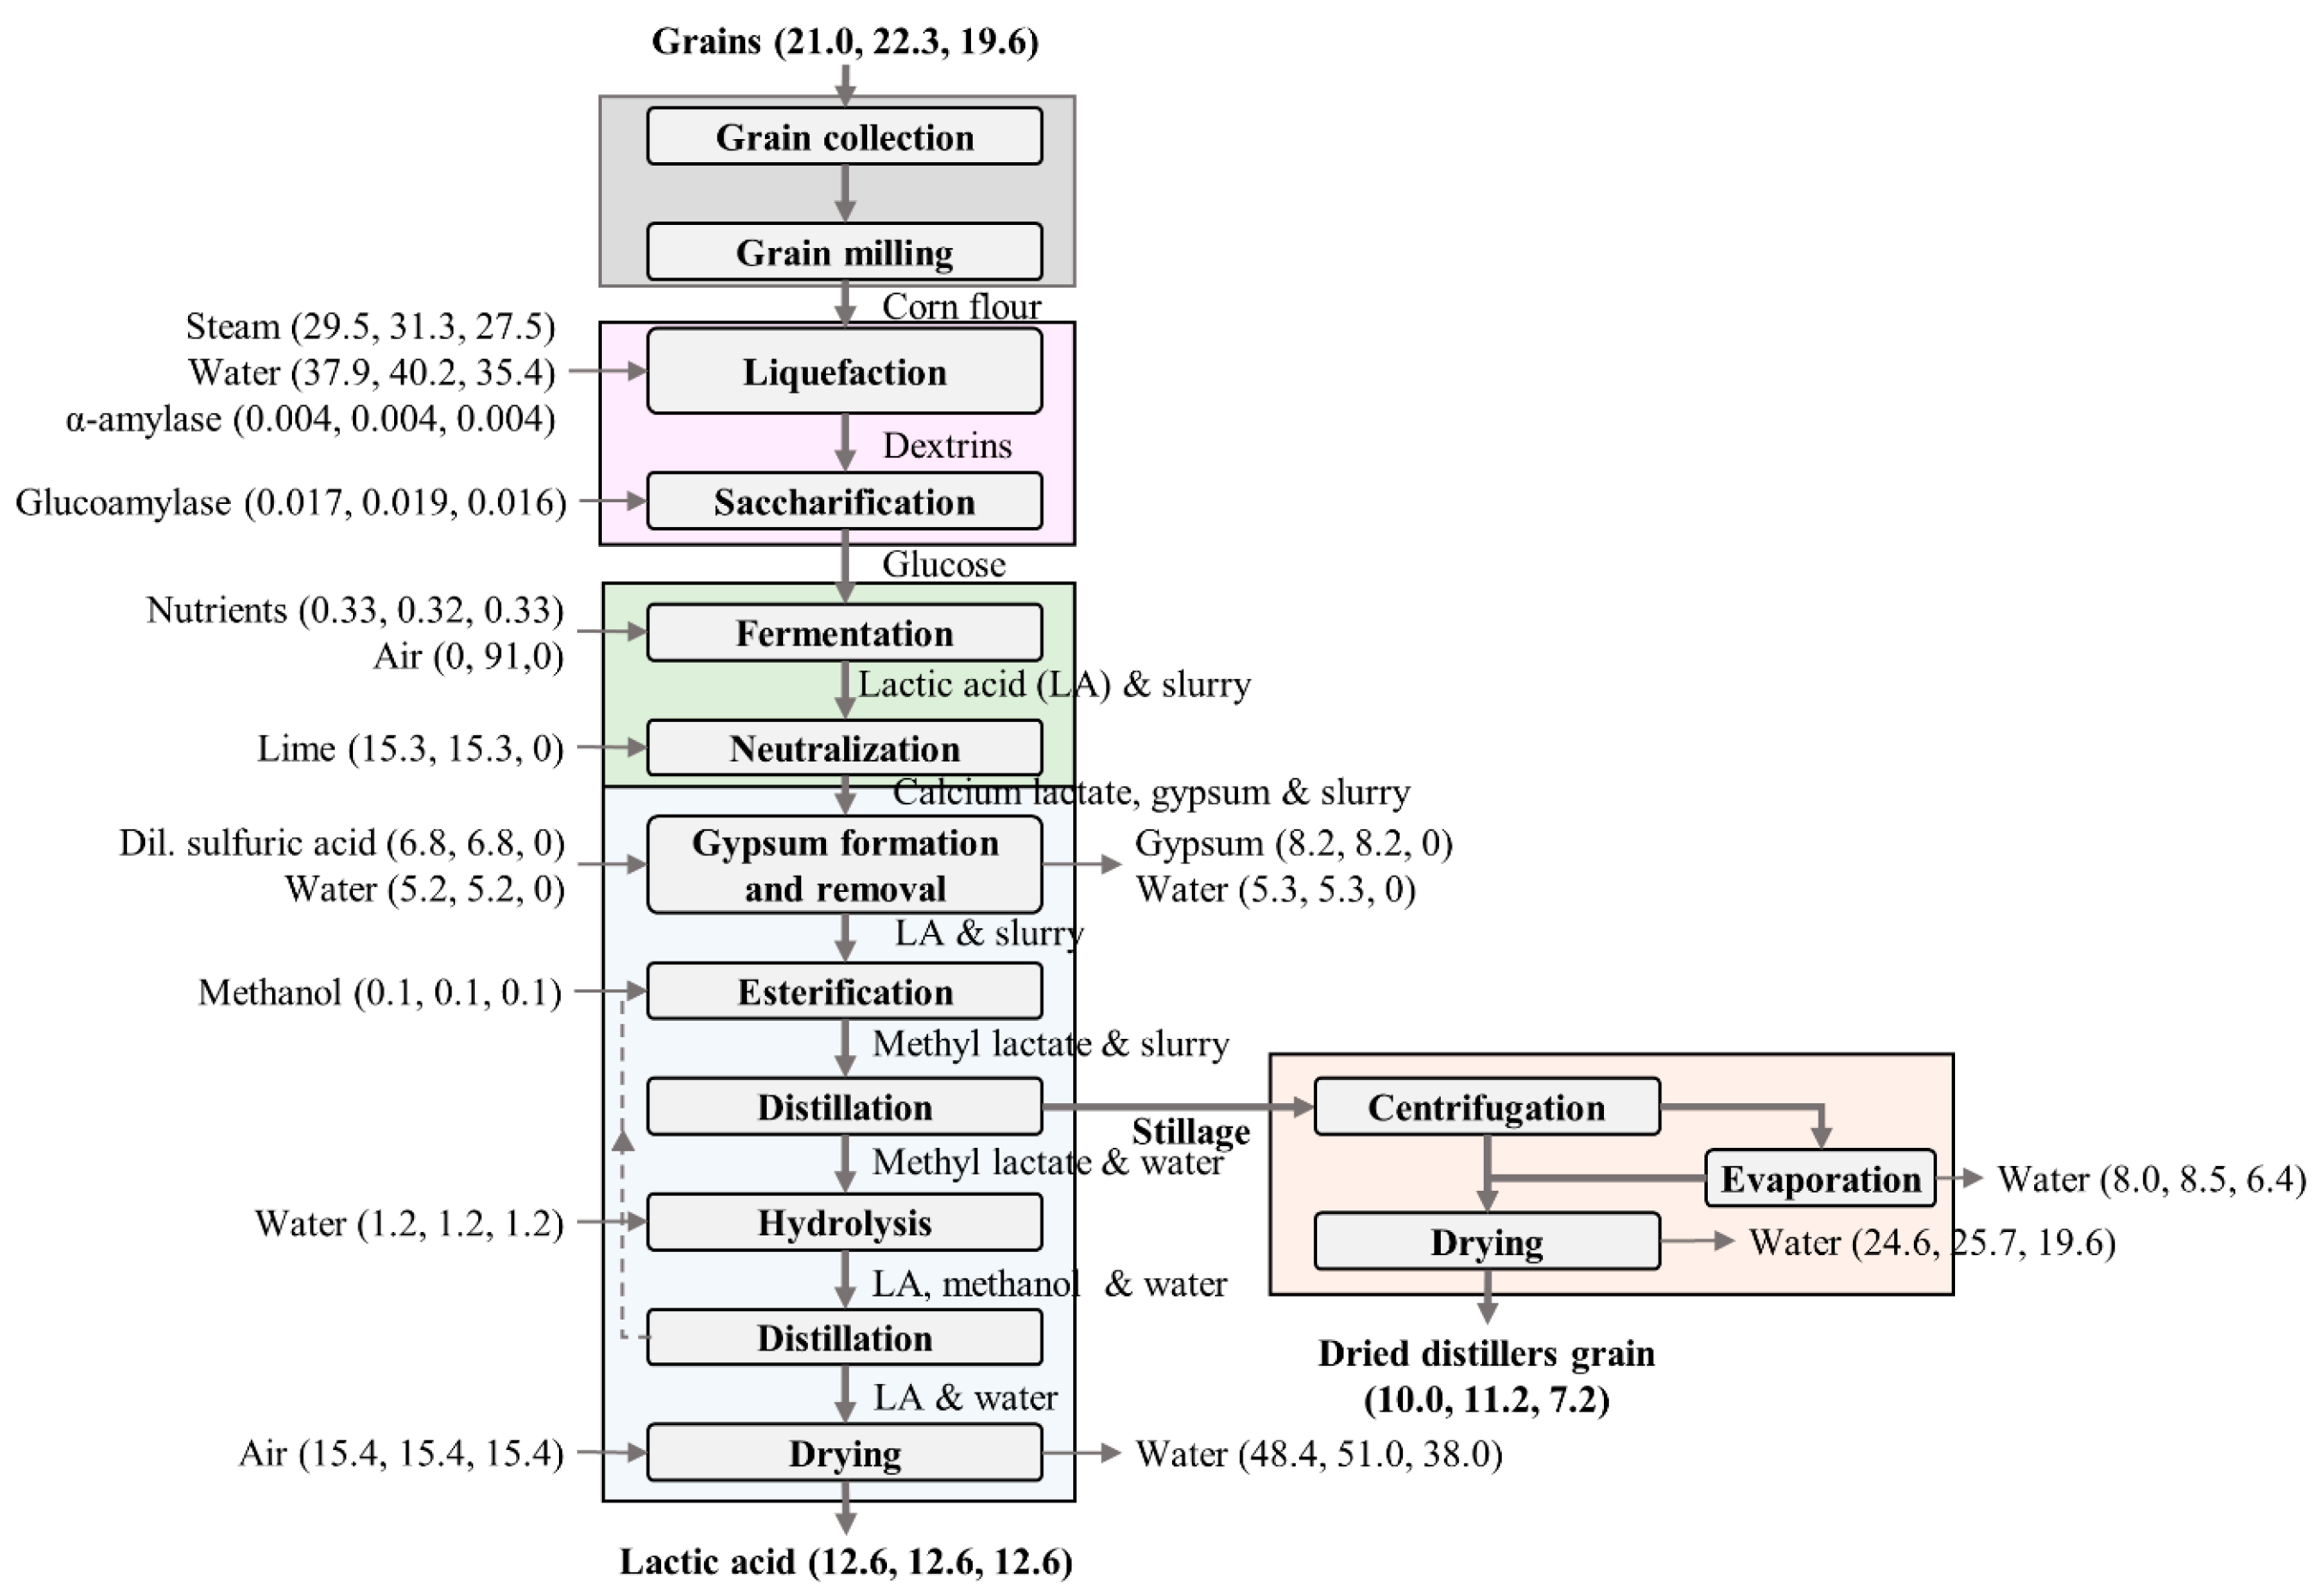
Lactic acid fermentation pathway using yeast required the lowest feedstock quantity due to s higher glucose-to-lactic-acid conversion rate (Figure 2). The amounts of alpha-amylase and glucoamylase enzymes for the conversion of corn starch to fermentable sugars were similar to feedstock requirement ratios for the three pathways. The fermentation step required similar amounts of nitrogen sources for all three pathways. The nutrient requirement was slightly higher for the fermentation pathways using bacteria and yeast than fungi. Lactic acid bacteria- and fungi-based fermentation pathways required 15.3 t/h of lime (30% calcium hydroxide) to neutralize the lactic acid during fermentation to produce calcium lactate and 6.8 t/h of sulfuric acid to recover the lactic acid from calcium lactate, producing large quantities of gypsum. All three pathways required similar quantities of methanol for esterification of lactic acid. In addition, all the pathways also required varying quantities of water and steam for different unit operations along the conversion process (Figure 2).
3.2. Equipment, Utilities and Labor Requirement
All the pathways required the same type, size and number of equipment for feedstock preparation, pretreatment and fermentation steps. The fungi-based fermentation pathway required an additional air compressor and filtration unit to aerate the fermentation process. The yeast-based fermentation pathway did not require lactic acid neutralization and thus, the reactor for recovering lactic acid from the calcium lactate and filter for gypsum removal was not necessary.
The external electrical energy requirement was highest for the fungi-based pathway due to additional electrical power requirements for the operation of the air compressor and filtration unit (Table 3). The yeast-based pathway had the lowest electrical energy requirement due to the removal of the equipment used for gypsum formation and removal. The fermentation step had the highest electricity requirement to operate large bioreactors. The yeast-based pathway also had lower steam and cooling water requirements than bacteria- and fungi-based pathways due to a reduction in material flow in the distillation step. The distillation process for lactic acid recovery required the highest amount of steam and cooling water.
The yeast-based fermentation pathway did not require any labor for the purification and recovery steps, and thus, had the lowest overall labor requirement (Table 4). The fungi-based pathway required additional labor hours to operate the aeration unit during the fermentation process, and thus, had higher labor requirements. Labor requirements for pretreatment and fermentation units were higher for all pathways as these processes require more equipment and frequent monitoring.
3.3. Capital Costs
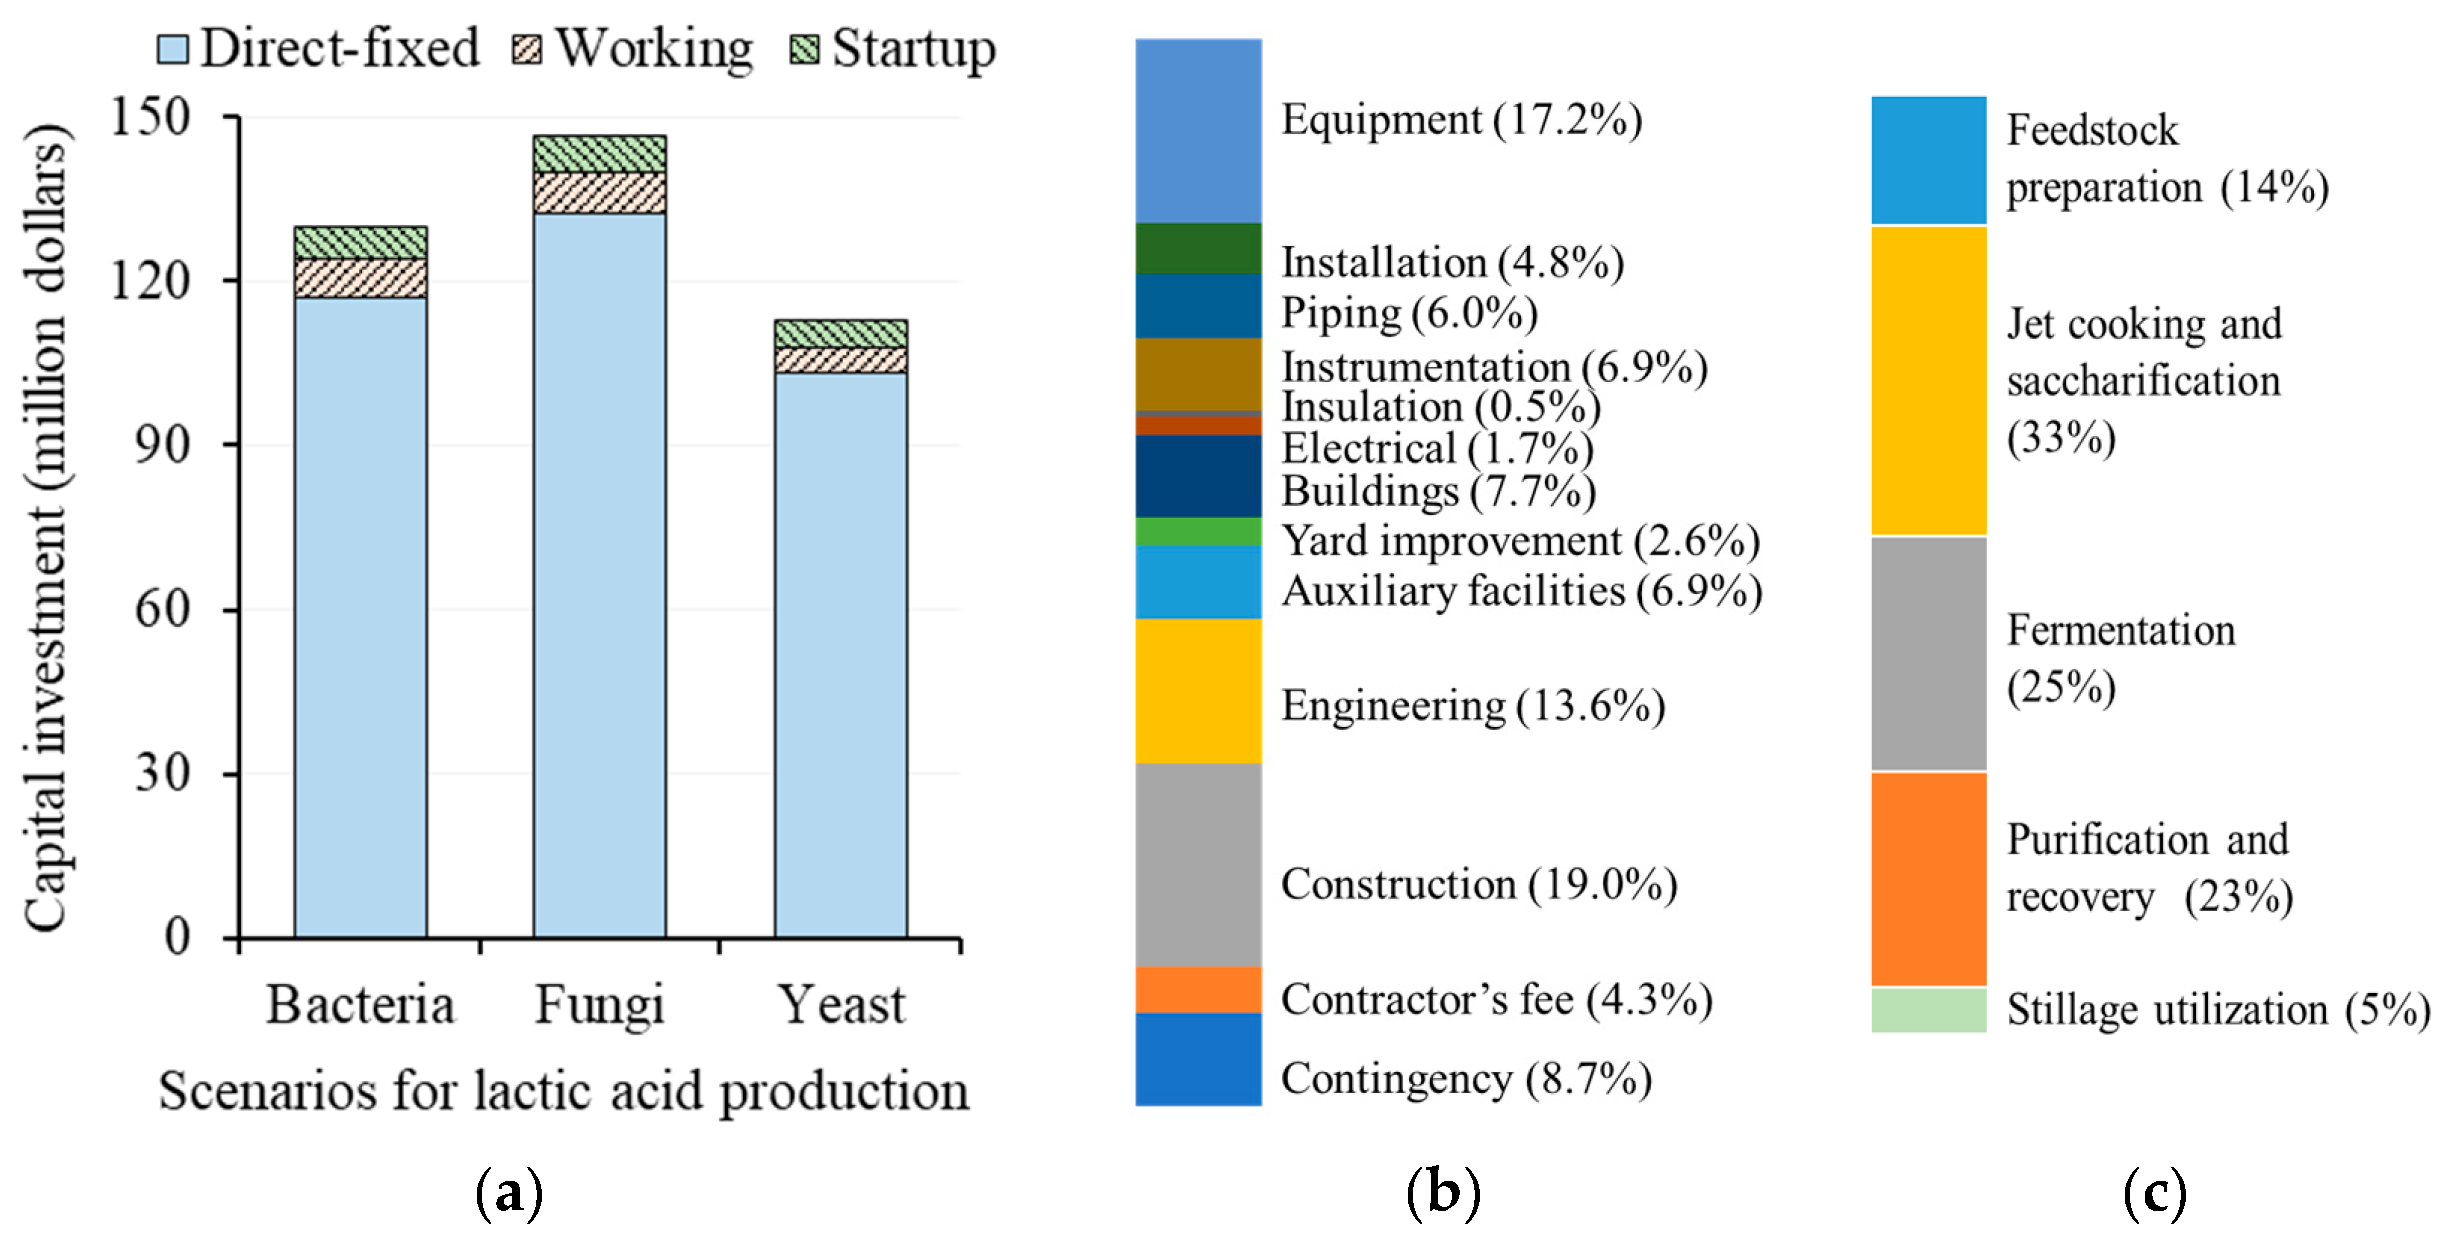
The total capital investment for a 100,000 t/y lactic production facility for bacteria-, fungi- and yeast-based pathways were ~$130, 147 and 113 million, respectively (Figure 3). The yeast-based pathway did not require the lactic acid neutralization, recovery processes and the investments associated with the purchase and installation of equipment needed for these processes, thus lowering total capital investments. The capital investment for the fungi-based pathway was highest, as this pathway requires a continuous supply of air for effective fermentation using fungi. This required an additional air compressor and filtration units, which increased the capital investment cost. The yeast-based pathway required lower working capital due to reduced chemicals, utilities, and labor requirements for lactic acid neutralization and recovery steps. The startup capital was estimated as 5% of direct fixed capital, and thus, followed a similar trend to the direct fixed capital costs.
3.4. Lactic Acid Production Costs
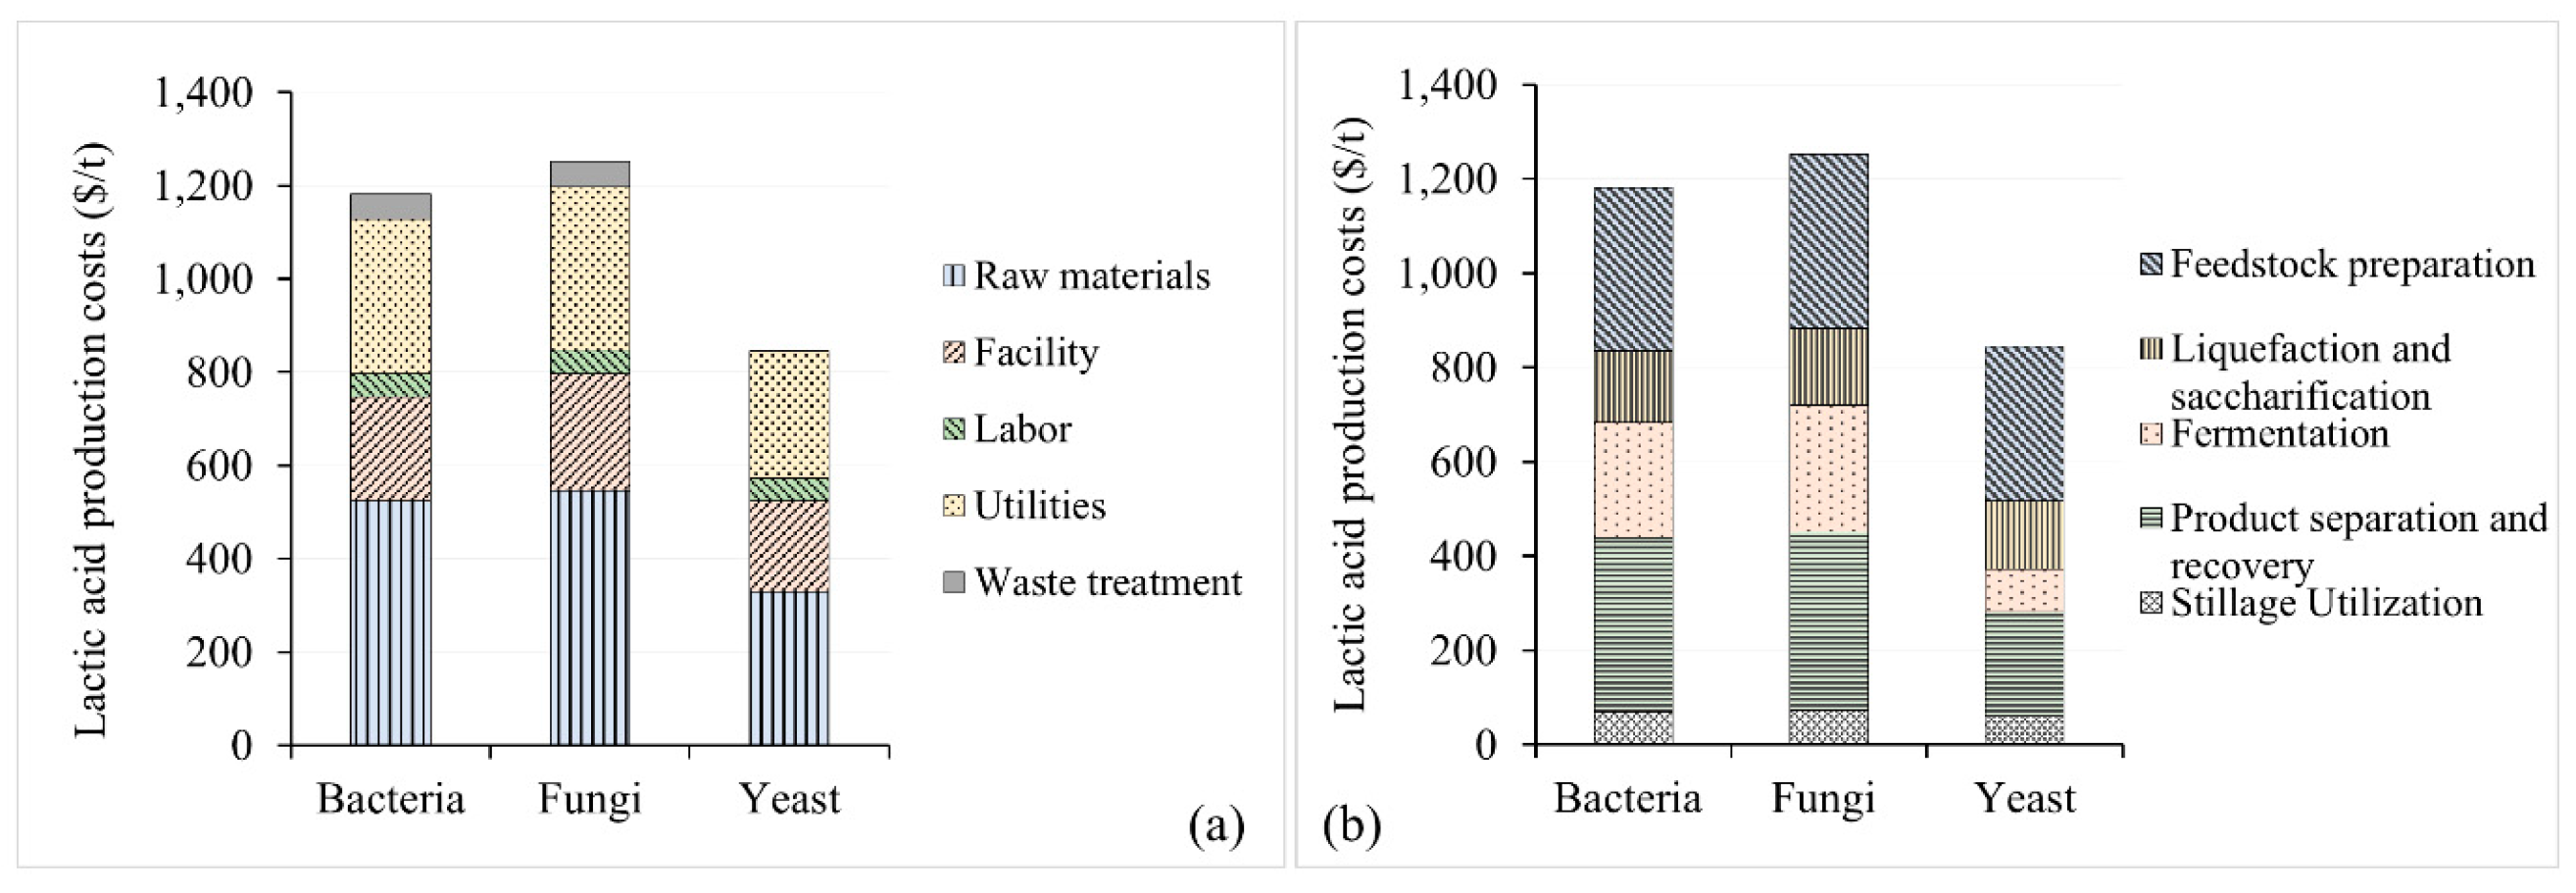
The total production costs of lactic acid from corn grain in a facility with an annual production capacity of 100,000 t/y for bacteria-, fungi- and yeast-based pathways were ~$1181/t, $1251/t and $844/t, respectively (Figure 4). Raw materials, facility and utility contributed the most to the lactic acid production costs. The raw materials accounted for 44%, 44% and 39% of the total lactic acid production costs for bacteria-, fungi- and yeast-based pathways, respectively. A major fraction of the raw materials cost was for procuring the corn grain. Corn grain cost contributed most to the lactic acid production costs associated with feedstock preparation. In addition, for bacteria- and fungi-based pathways, costs for lime and sulfuric acid used during the fermentation and lactic acid recovery process contributed to the raw material cost. Raw materials cost for the yeast-based pathway was 37% and 40% lower than bacteria- and fungi-based pathways, respectively, as it did not require chemicals such as lime to neutralize the lactic acid during fermentation and sulfuric acid and water to recover the lactic acid from the neutralized solution. The cost for the fermentation step was lower for the yeast-based pathway as it did not require lime for neutralization. The facilities contributed to 19%, 20% and 23% of the total lactic acid production costs for bacteria-, fungi- and yeast-based pathways, respectively. The fungi-based pathway had the highest facility-related costs due to the addition of an air compressor and filtration units. The yeast-based pathway did not require reactors for gypsum formation and removal, and thus, had the lowest facility-related costs. Utilities contributed to 28%, 28%, and 32% of the total lactic acid production cost for bacteria-, fungi- and yeast-based pathways, respectively. The fungi-based pathway had a higher utility requirement and cost to run the air compressor and filtration units, whereas the yeast-based pathway had lower utility costs due to the removal of the processes for gypsum formation and removal. Labor costs contributed between 4–6% of the total lactic acid production cost for all pathways. The waste treatment costs were higher for bacteria- and fungi-based pathways than the yeast-based pathway due to added costs to dispose waste produced during the gypsum removal process. The cost for product separation and recovery was lowest for the yeast-based pathway (Figure 4b) due to a reduction in utilities required for distillation and elimination of the processes for gypsum formation and removal, which also reduced chemical (sulfuric acid) requirements and costs.
3.5. Financial analysis
The lactic acid production costs ($/t) using corn grain for the three pathways were between $844–1251, respectively. Additional revenues ($/t lactic acid) from selling the distillers’ dried grain solubles (DDGS) were in between $79–125 (Table 5). The fungi-based pathway had lower sugar-to-lactic-acid conversion rates, and thus, the remaining organic matter was used as DDGS. Based on the unit production costs, unit revenues and 10% IRR (after tax), the minimum selling price ($/t) for lactic acid produced using corn grain was in the range $842–1226. The minimum selling price was within the range of lactic acid price in the market which varied from $650–2300/t, depending on the lactic acid grade and the vendors [3]. Based on the financial analysis, the yeast-based fermentation pathway was the most economically preferred lactic acid production pathway using corn grain.
3.6. Sensitivity Analysis
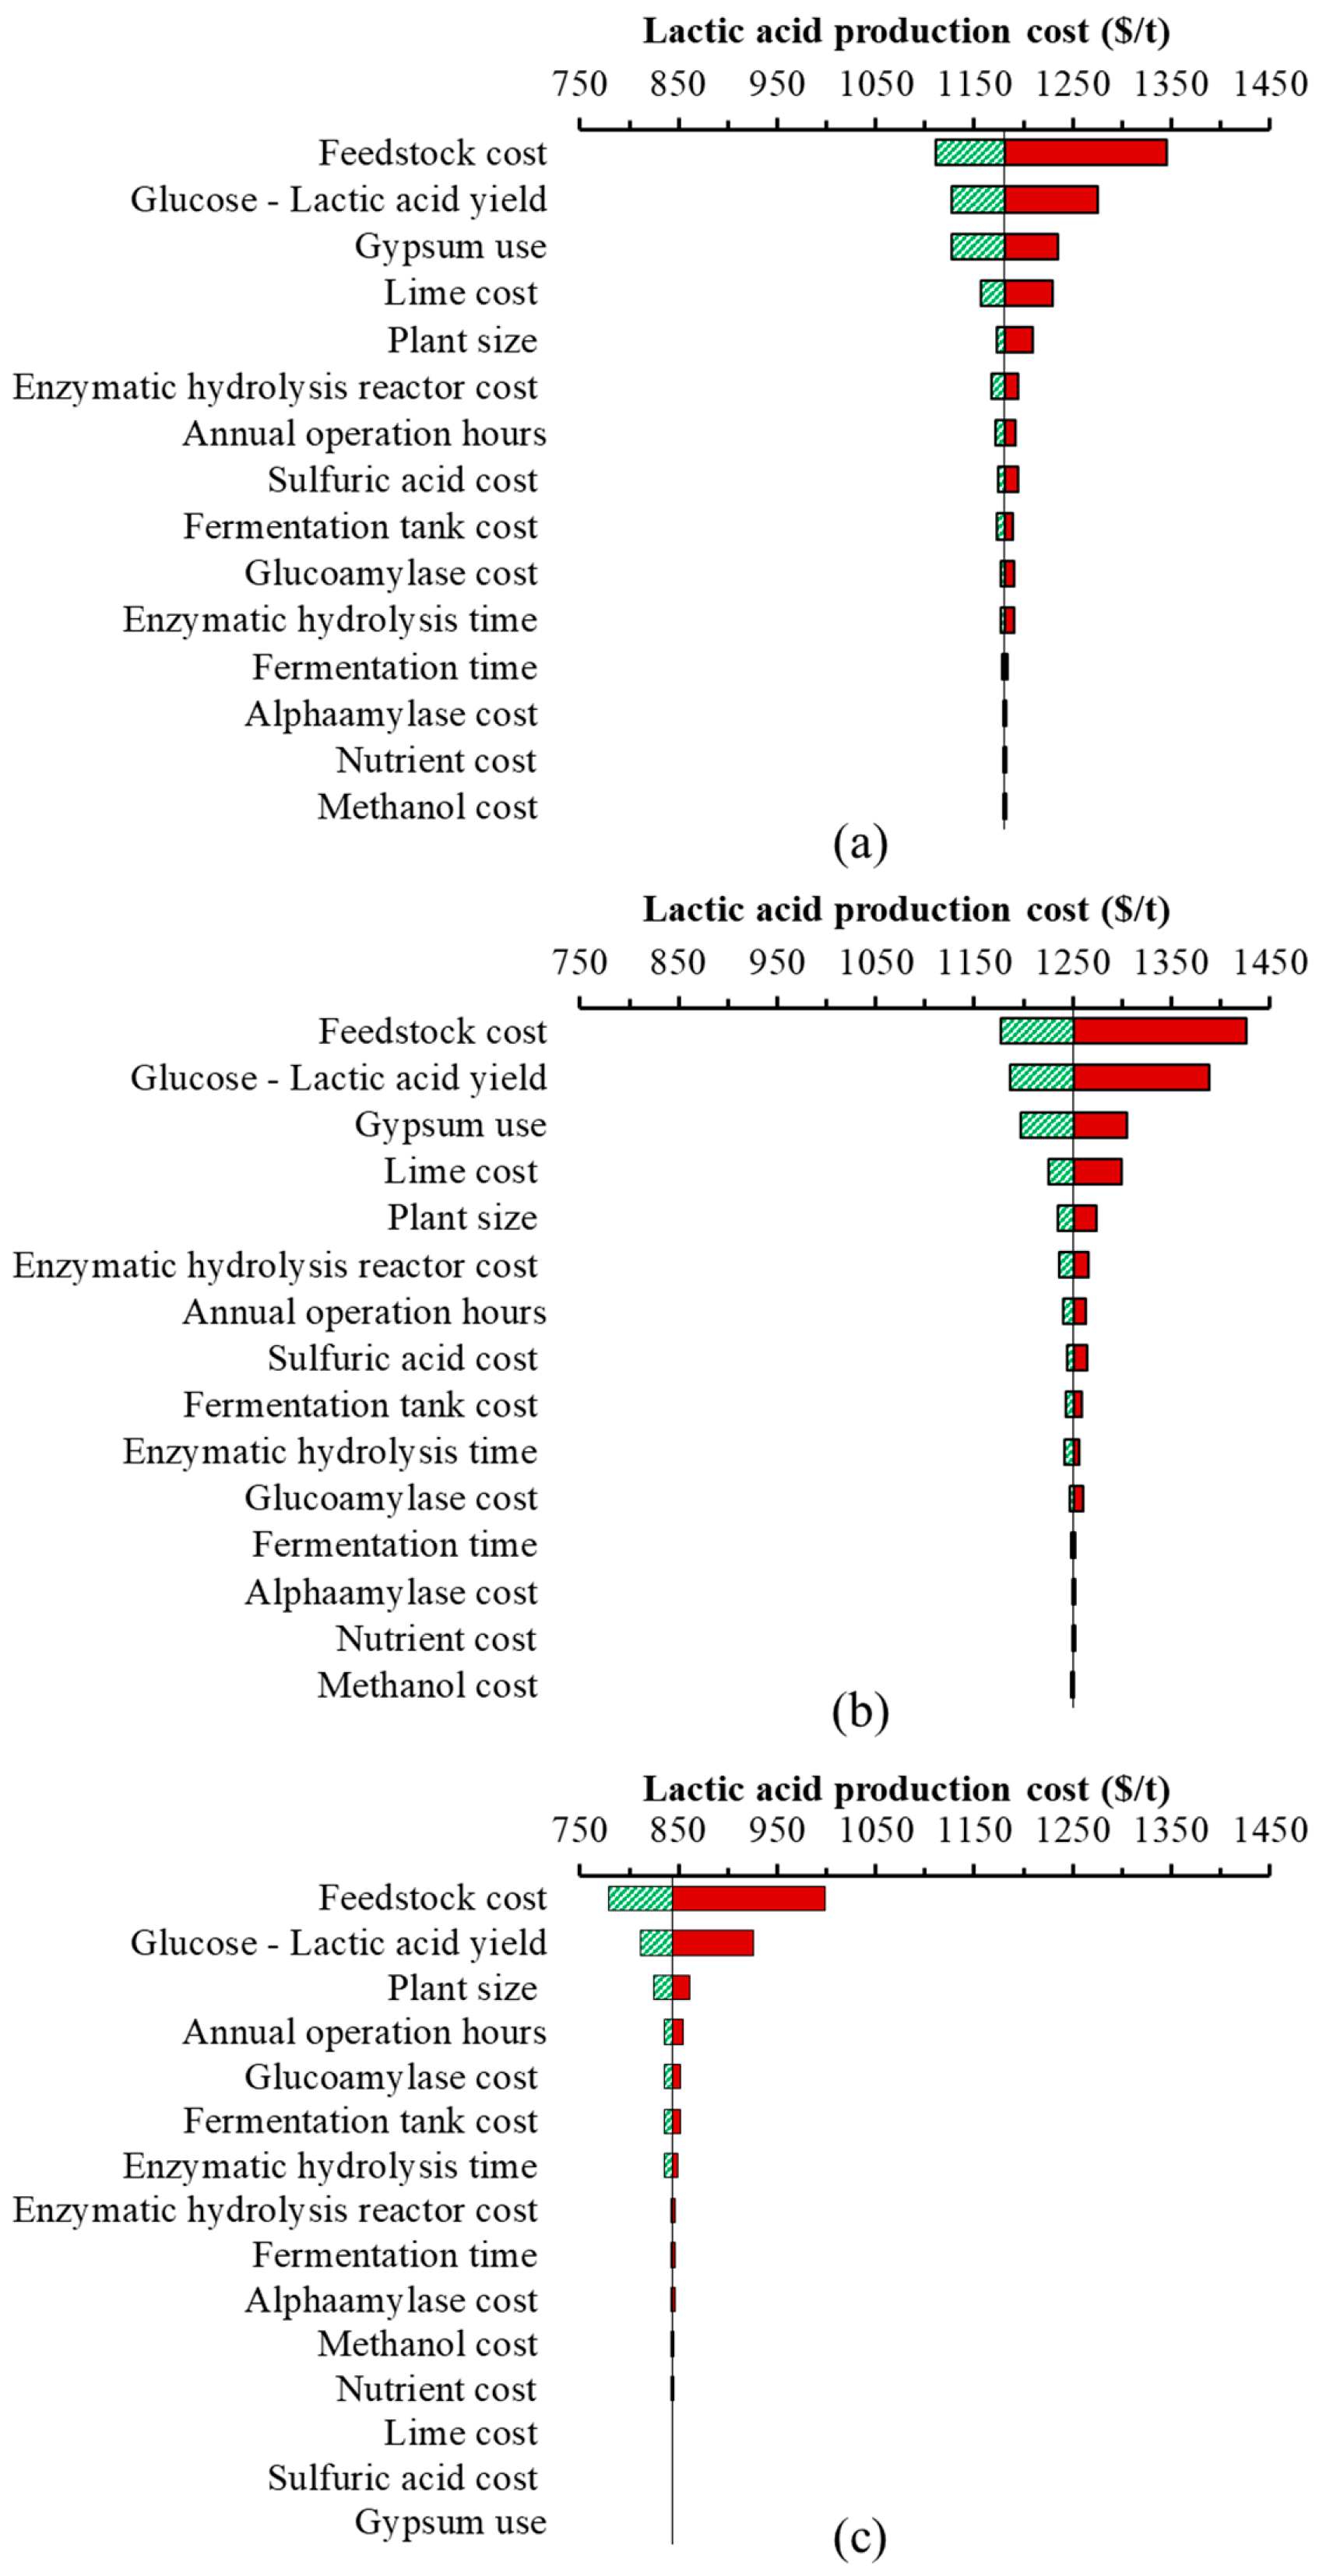
The sensitivity analysis indicated that the lactic acid production costs were most sensitive to glucose-to-lactic-acid conversion rate, feedstock costs, production plant size, lime cost, provision for gypsum use, enzymatic hydrolysis (saccharification) reactor cost, and annual operation hours (Figure 5). For all three pathways, lactic acid production costs were sensitive to a large variation in the sugar-to-lactic-acid conversion rates. Feedstock cost was one of the main contributors to lactic acid production cost as an increase in feedstock cost directly increased the unit cost of lactic acid production, and vice versa. Higher production plant size impacted the economy of scale and reduced the unit lactic acid production costs. An increase in reactor cost increased the capital investment cost and the lactic acid production cost. An increase in annual operation hours increased the yearly biorefinery productivity, and thus, increased the lactic acid production with the same capital investment. Gypsum use and lime costs also affected the lactic acid production cost for bacteria- and fungi-based pathways as large quantities of lime were required to neutralize the lactic acid during fermentation. A large quantity of gypsum produced during lactic acid recovery needed to be properly disposed or utilized, resulting in the variation in lactic acid production costs.
4. Conclusions
This study evaluated the techno-economics of lactic-acid production using corn grain from three fermentation pathways using bacteria, fungi and yeast. The minimum selling price for the lactic acid produced from corn grain using different fermentation pathways was comparable to the market price of lactic acid. The fermentation pathways using microorganisms, such as yeast, which can withstand low pH levels and have high lactic acid yields, had the lowest production costs. Improvements in process efficiencies and lower feedstock, equipment and chemical costs could further lower the production costs and improve the techno-economic feasibility of lactic acid production. Life cycle assessment of lactic acid production using different fermentation pathways and a comparison with petroleum-based lactic acid production could identify sustainable production pathways. The identification of a technically feasible, cost-effective and environmentally friendly lactic acid production method using bio-based resources could contribute to a sustainable bio-economy in the future.
Supplementary Materials
The following are available online at https://www.mdpi.com/2227-9717/8/2/199/s1, Figure S1: Detailed process flow of the processes (obtained from the SuperPro Designer software), Table S1: Technical data related to the equipment (base size, base cost, scale factor, number, size and cost).
Author Contributions
Ashish Manandhar conceived the idea, developed the model, performed the analysis and wrote the manuscript. Ajay Shah provided critical suggestions throughout the analysis and manuscript development process. All authors have read and agreed to the published version of the manuscript.
Funding
This work was supported partly by funding from United States Department of Agriculture NIFA (Award no. 2017-67021-26141) and United States Department of Agriculture Hatch project (Project no. 1021119).
Acknowledgments
The opinions expressed herein are those of the author(s) and do not necessarily reflect the views of the sponsoring agencies.
Conflicts of Interest
The authors declare no conflict of interest.
References
- Grand View Research. Lactic Acid Market Analysis By Application (Industrial, F&B, Pharmaceuticals, Personal Care) & Polylactic Acid (PLA) Market Analysis By Application (Packaging, Agriculture, Transport, Electronics, Textiles), And Segment Forecasts, 2018–2025. 2017. Available online: http://www.grandviewresearch.com/industry-analysis/lactic-acid-and-poly-lactic-acid-market (accessed on 25 March 2018).
- Grand View Research. Lactic Acid Market Size Worth $9.8Bn By 2025 & PLA To Reach $6.5Bn. 2017. Available online: http://www.grandviewresearch.com/press-release/global-lactic-acid-and-poly-lactic-acid-market (accessed on 21 March 2018).
- Biddy, M.J.; Scarlata, C.J.; Kinchin, C.M. Chemicals from Biomass: A Market Assessment of Bioproducts With Near-Term Potential; NREL Report NREL/TP-5100-65509; National Renewable Energy Laboratory: Golden, CO, USA, 2016. [Google Scholar]
- Morales, M.; Dapsens, P.Y.; Giovinazzo, I.; Witte, J.; Mondelli, C.; Papadokonstantakis, S.; Hungerbühler, K.; Pérez-Ramírez, J. Environmental and economic assessment of lactic acid production from glycerol using cascade bio-and chemocatalysis. Energy Environ. Sci. 2015, 8, 558–567. [Google Scholar] [CrossRef] [Green Version]
- Pleissner, D.; Demichelis, F.; Mariano, S.; Fiore, S.; Gutiérrez, I.M.N.; Schneider, R.; Venus, J. Direct production of lactic acid based on simultaneous saccharification and fermentation of mixed restaurant food waste. J. Clean. Prod. 2017, 143, 615–623. [Google Scholar] [CrossRef]
- Pleissner, D.; Neu, A.-K.; Mehlmann, K.; Schneider, R.; Puerta-Quintero, G.I.; Venus, J. Fermentative lactic acid production from coffee pulp hydrolysate using Bacillus coagulans at laboratory and pilot scales. Bioresour. Technol. 2016, 218, 167–173. [Google Scholar] [CrossRef] [Green Version]
- Bernardo, M.P.; Coelho, L.F.; Sass, D.C.; Contiero, J. L-(+)-Lactic acid production by Lactobacillus rhamnosus B103 from dairy industry waste. Brazilian J. Microbiol. 2016, 47, 640–646. [Google Scholar] [CrossRef] [Green Version]
- Reddy, L.V.; Kim, Y.-M.; Yun, J.-S.; Ryu, H.-W.; Wee, Y.-J. L-Lactic acid production by combined utilization of agricultural bioresources as renewable and economical substrates through batch and repeated-batch fermentation of Enterococcus faecalis RKY1. Bioresour. Technol. 2016, 209, 187–194. [Google Scholar] [CrossRef]
- Daful, A.G.; Goergens, J.F. Techno-economic analysis and environmental impact assessment of lignocellulosic lactic acid production. Chem. Eng. Sci. 2017, 162, 53–65. [Google Scholar] [CrossRef]
- Bastidas-Oyanedel, J.-R.; Schmidt, J. Increasing profits in food waste biorefinery—A techno-economic analysis. Energies. 2018, 11, 1551. [Google Scholar] [CrossRef] [Green Version]
- Bonk, F.; Bastidas-Oyanedel, J.-R.; Yousef, A.F.; Schmidt, J.E. Exploring the selective lactic acid production from food waste in uncontrolled pH mixed culture fermentations using different reactor configurations. Bioresour. Technol. 2017, 238, 416–424. [Google Scholar] [CrossRef]
- Kwan, T.H.; Pleissner, D.; Lau, K.Y.; Venus, J.; Pommeret, A.; Lin, C.S.K. Techno-economic analysis of a food waste valorization process via microalgae cultivation and co-production of plasticizer, lactic acid and animal feed from algal biomass and food waste. Bioresour. Technol. 2015, 198, 292–299. [Google Scholar] [CrossRef]
- Kwan, T.H.; Hu, Y.; Lin, C.S.K. Techno-economic analysis of a food waste valorisation process for lactic acid, lactide and poly (lactic acid) production. J. Clean. Prod. 2018, 181, 72–87. [Google Scholar] [CrossRef]
- Mandegari, M.A.; Farzad, S.; van Rensburg, E.; Görgens, J.F. Multi-criteria analysis of a biorefinery for co-production of lactic acid and ethanol from sugarcane lignocellulose. Biofuels Bioprod. Biorefining 2017, 11, 971–990. [Google Scholar] [CrossRef]
- Sikder, J.; Roy, M.; Dey, P.; Pal, P. Techno-economic analysis of a membrane-integrated bioreactor system for production of lactic acid from sugarcane juice. Biochem. Eng. J. 2012, 63, 81–87. [Google Scholar] [CrossRef]
- Eiteman, M.A.; Ramalingam, S. Microbial production of lactic acid. Biotechnol. Lett. 2015, 37, 955–972. [Google Scholar] [CrossRef]
- Renewable Fuels Association (RFA). Industry statistics: World Fuel Ethanol Production—2014 Production; Renewable Fuels Association (RFA): Ellisville, MO, USA, 2015. [Google Scholar]
- Hay, J.F. Corn for Biofuel Production Current Potential for Use as a Biofuel. Farm Energy. 2015, 3–5. [Google Scholar]
- Biofuel.org.uk. First Generation Biofuels. 2010. Available online: http://biofuel.org.uk/first-generation-biofuel.html (accessed on 6 March 2018).
- Abdel-Rahman, M.A.; Tashiro, Y.; Sonomoto, K. Recent advances in lactic acid production by microbial fermentation processes. Biotechnol. Adv. 2013, 31, 877–902. [Google Scholar] [CrossRef]
- Adom, F.K.; Dunn, J.B. Life cycle analysis of corn-stover-derived polymer-grade l-lactic acid and ethyl lactate: Greenhouse gas emissions and fossil energy consumption. Biofuels, Bioprod. Biorefining 2017, 11, 258–268. [Google Scholar] [CrossRef]
- Biomass Magazine. Total Corbion PLA Starts-Up 75,000-Tton-Per-Year Bioplastics Plant. 2018. Available online: http://biomassmagazine.com/articles/15800/total-corbion-pla-starts-up-75-000-ton-per-year-bioplastics-plant (accessed on 20 December 2018).
- Miller, C.; Fosmer, A.; Rush, B.; McMullin, T.; Beacom, D.; Suominen, P. Industrial Production of Lactic Acid. Compr. Biotechnol. Second Ed. 2011, 3, 179–188. [Google Scholar]
- Nielsen, R.L. Historical Corn Grain Yields for the U.S. Corny News Netw. 2017. Available online: http://www.agry.purdue.edu/ext/corn/news/timeless/YieldTrends.html (accessed on 26 March 2018).
- Åkerberg, C.; Hofvendahl, K.; Zacchi, G.; Hahn-Hägerdal, B. Modelling the influence of pH, temperature, glucose and lactic acid concentrations on the kinetics of lactic acid production by Lactococcus lactis ssp. lactis ATCC 19435 in whole-wheat flour. Appl. Microbiol. Biotechnol. 1998, 49, 682–690. [Google Scholar] [CrossRef]
- Hofvendahl, K.; Hahn–Hägerdal, B. Factors affecting the fermentative lactic acid production from renewable resources. Enzyme Microb. Technol. 2000, 26, 87–107. [Google Scholar] [CrossRef]
- Soccol, C.R.; Stonoga, V.I.; Raimbault, M. Production of L-lactic acid by Rhizopus species. World J. Microbiol. Biotechnol. 1994, 10, 433–435. [Google Scholar] [CrossRef]
- Rosenberg, M.; Krišofíková, L. Physiological restriction of the L-lactic acid production by Rhizopus arrhizus. Acta Biotechnol. 1995, 15, 367–374. [Google Scholar] [CrossRef]
- Zhang, Z.Y.; Jin, B.; Kelly, J.M. Production of lactic acid from renewable materials by Rhizopus fungi. Biochem. Eng. J. 2007, 35, 251–263. [Google Scholar] [CrossRef]
- Tay, A.; Yang, S.T. Production of L(+)-lactic acid from glucose and starch by immobilized cells of Rhizopus oryzae in a rotating fibrous bed bioreactor. Biotechnol. Bioeng. 2002, 80, 1–12. [Google Scholar] [CrossRef] [PubMed]
- Saini, J.K.; Saini, R.; Tewari, L. Lignocellulosic agriculture wastes as biomass feedstocks for second-generation bioethanol production: Concepts and recent developments. 3 Biotech. 2015, 5, 337–353. [Google Scholar] [CrossRef] [PubMed] [Green Version]
- Isikgor, F.H.; Becer, C.R. Lignocellulosic Biomass: A sustainable platform for production of bio-based chemicals and polymers. Polym. Chem. 2015, 6, 4497–4559. [Google Scholar] [CrossRef] [Green Version]
- Belyea, R.L.; Rausch, K.D.; Tumbleson, M.E. Composition of corn and distillers dried grains with solubles from dry grind ethanol processing. Bioresour. Technol. 2004, 94, 293–298. [Google Scholar] [CrossRef]
- National Renewable Energy Laboratory (NREL). Determining the Cost of Producing Ethanol from Corn Starch and Lignocellulosic Feedstocks; NREL/TP-580-28893; National Renewable Energy Laboratory: Golden, CO, USA, 2000. [Google Scholar]
- Oregon OSHA. Technical Manual, Ethanol Processing; Oregon OSHA: Durham, OR, USA, 1996. [Google Scholar]
- Alibaba.com. Costs of Alpha Amylase. 2018. Available online: http://www.alibaba.com/showroom/a--amylase-price.html (accessed on 12 November 2018).
- Intelligen Inc. SuperPro Designer Software Version 9.5; Intelligen Inc.: Scotch Plains, NJ, USA, 2018. [Google Scholar]
- Alibaba.com. Costs of Gluco Amylase. 2018. Available online: http://www.alibaba.com/trade/search?fsb=y&IndexArea=product_en&CatId=&SearchText=gluco+amylase (accessed on 12 November 2018).
- Kwiatkowski, J.R.; Mcaloon, A.J.; Taylor, F.; Johnston, D.B. Modeling the process and costs of fuel ethanol production by the corn dry-grind process. Ind. Crop. Prod. 2006, 23, 288–296. [Google Scholar] [CrossRef]
- Humbird, D.; Davis, R.; Tao, L.; Kinchin, C.; Hsu, D.; Aden, A.; Schoen, P.; Lukas, J.; Olthof, B.; Worley, M.; et al. Process Design and Economics for Biochemical Conversion of Lignocellulosic Biomass to Ethanol; NREL/LTP-5100-47764; National Renewable Energy Laboratory: Golden, CO, USA, 2011. [Google Scholar]
- Suskovic, J.; Novak, S.; Maric, V.; Matosic, S. Lactic acid fermentation kinetics on different carbon sources. Prehrambeno—Tehnol. Biotehnol. Rev. 1991, 29, 155–158. [Google Scholar]
- Trontel, A.; Bar, V.; Slavica, A.; Novak, S. Modelling the Effect of Different Substrates and Temperature on the Growth and Lactic Acid Production by Lactobacillus amylovorus DSM 20531T in Batch Process. Food Technol. Biotechnol. 2010, 48, 352–361. [Google Scholar]
- Kosakai, Y.; Park, Y.S.; Okabe, M. Enhancement of L(+)-lactic acid production using mycelial flocs of Rhizopus oryzae. Biotechnol. Bioeng. 1997, 55, 461–470. [Google Scholar] [CrossRef]
- Joglekar, H.G.; Rahman, I.; Babu, S.; Kulkarni, B.D.; Joshi, A. Comparative assessment of downstream processing options for lactic acid. Sep. Purif. Technol. 2006, 52, 1–17. [Google Scholar] [CrossRef]
- Index Mundi. Lime Prices in the United States. 2013. Available online: http://www.indexmundi.com/en/commodities/minerals/lime/lime_t5.html (accessed on 10 November 2018).
- ICIS. Sulfuric Acid Cost. Indic. Chem. Prices A-Z. 2018. Available online: http://www.icis.com/explore/commodities/chemicals/channel-info-chemicals-a-z/ (accessed on 17 June 2018).
- Painuly, G. Methanol Prices Skyrocket by 180% Over Last Year. Cost Insights. 2017. Available online: http://www.costinsights.com/methanol-prices-skyrocket (accessed on 12 December 2018).
- USDA. Weekly Distillers Grains Summary. 2019. Available online: http://www.ams.usda.gov/mnreports/nw_gr115.txt (accessed on 22 February 2019).
- Macrotrends. Corn Prices—45 Year Historical Chart. 2019. Available online: http://www.macrotrends.net/2532/corn-prices-historical-chart-data (accessed on 2 January 2019).
- Statista. Average Pprice of Crude Gypsum on a Free-on Board (FOB) Mine Basis in the U.S. from 2007 to 2017 (in U.S. Dollars Per Metric Ton). 2017. Available online: http://www.statista.com/statistics/219363/wallboard-products-crude-price-in-the-us/ (accessed on 21 December 2018).
- Laquatra, J.; Pierce, M.R. Waste Management at the Construction Site. Cornell Coop. Ext. 2002. Available online: https://dea.human.cornell.edu/sites/default/files/pdf/waste_management-booklet.pdf (accessed on 20 December 2018).
- Wang, Y.; Tashiro, Y.; Sonomoto, K. Fermentative production of lactic acid from renewable materials: Recent achievements, prospects, and limits. J. Biosci. Bioeng. 2014, 119, 10–18. [Google Scholar] [CrossRef]
- Abdel-Rahman, M.A.; Tashiro, Y.; Sonomoto, K. Lactic acid production from lignocellulose-derived sugars using lactic acid bacteria: Overview and limits. J. Biotechnol. 2010, 156, 286–301. [Google Scholar] [CrossRef]
- Filachione, E.M.; Fisher, C.H. Purification of Lactic Acid. Ind. Eng. Chem. 1946, 38, 228–232. [Google Scholar] [CrossRef]
- Trading Economics. United State Inflation Rate. 2018. Available online: https://tradingeconomics.com/united-states/inflation-cpi (accessed on 12 December 2018).
Figure 1.
Overview of conversion steps of corn grain to lactic acid.

Figure 2.
Material flow for lactic acid production from corn grain using three fermentation pathways using bacteria, fungi and yeast for a biorefinery with 100,000 t/yr production capacity (Note: All material flows are presented in t/h; first, second and third values within the parentheses represent material flows for bacteria, fungi and yeast-based pathways, respectively).

Figure 3.
Capital investment for the facility producing 100,000 t/y of lactic acid from corn grain using different fermentation pathways (a); share of different components in the direct-fixed capital for the facility using the bacteria-based pathway (b); cost share of equipment for different conversion steps for the facility using the bacteria-based pathway (c).

Figure 4.
Lactic acid production costs for the facility producing 100,000 t/y of lactic acid from corn grain using different fermentation pathways. (a) Contributions based on different process requirements, and (b) contributions based on different unit operations.
Figure 4.
Lactic acid production costs for the facility producing 100,000 t/y of lactic acid from corn grain using different fermentation pathways. (a) Contributions based on different process requirements, and (b) contributions based on different unit operations.

Figure 5.
Sensitivity analyses of different parameters on lactic acid production costs for fermentation pathways using (a) bacteria, (b) fungi and (c) yeast.
Figure 5.
Sensitivity analyses of different parameters on lactic acid production costs for fermentation pathways using (a) bacteria, (b) fungi and (c) yeast.


Table 1.
Technical parameters required to estimate the lactic acid production cost, and their range required for sensitivity analysis.
Table 1.
Technical parameters required to estimate the lactic acid production cost, and their range required for sensitivity analysis.
| Parameters | Unit | Average Values a | Pessimistic Value b | Optimistic Value b |
|---|---|---|---|---|
| Plant size c | t/yr. | 100,000 | 80,000 | 120,000 |
| Annual operation hours c | h | 7920 | 7560 | 8280 |
| Corn grain (feedstock)price d | $/t | 180 | 279 | 138 |
| Feedstock moisture content [31,32,33] | % | 15 | ||
| Liquefaction and saccharification | ||||
| Starch to dextrin [34,35] | % | 98 | ||
| Residence time [34,35] | min | 7 | ||
| Temperature [34,35] | °C | 120 | ||
| Alpha amylase addition based on feedstock flow [34,35] | % | 0.02 | ||
| Alpha amylase cost [36] | $/kg | 10 | 15 | 6 |
| Lime addition [34,35] | % | 0.01 | ||
| Residence time for enzymatic hydrolysis/saccharification [34,35] | h | 48 | 53 | 43 |
| Enzymatic hydrolysis/saccharification temperature [34,35] | °C | 60 | ||
| Enzymatic hydrolysis reactor cost [37] | $/unit | 713,000 | 855,600 | 570,400 |
| Glucoamylase addition [34,35] | % | 0.02 | ||
| Glucoamylase cost [38] | $/kg | 8 | 14 | 4 |
| Fermentation | ||||
| Fermentation temperature [34,39] | °C | 32 | ||
| Fermentation time [34,35,40] | h | 48 | 53 | 43 |
| Fermentation tank cost [40] | $/unit | 966,000 | ||
| Glucose to lactic acid conversion using bacteria [41,42] | % | 90 | 85 | 95 |
| Glucose to lactic acid conversion using fungi [30,43] | % | 85 | 75 | 92 |
| Glucose to lactic acid conversion using yeast [23] | % | 93 | 85 | 95 |
| Nutrient cost | $/kg | 0.15 | 0.18 | 0.12 |
| Product separation and recovery | ||||
| Distillation temperature (after esterification) [44] | °C | 101 | ||
| Distillation temperature (after hydrolysis) [44] | °C | 66 | ||
| Drying temperature [44] | °C | 110 | ||
| Lime cost [45] | $/t | 110 | 150 | 90 |
| Sulfuric acid cost [46] | $/t | 70 | 94 | 57 |
| Methanol cost [47] | $/t | 442 | 530 | 353 |
| Gypsum use cost e | $/t | −50 | −100 | 8 |
| Stillage utilization | ||||
| Drying temperature [44] | °C | 110 | ||
| Distillers dried grain and soluble cost [48] | $/t | 140 |
Note: a Average values are used for the base case scenario analysis. The results presented for resources requirements and costs are based on the average values. b Pessimistic and optimistic values are used for sensitivity analysis. c Assumed for the analysis. d Corn grain price was based on 10-year corn price in the U.S. [49]. e Gypsum can be disposed or utilized to produce different products. Gypsum use cost for the gypsum management/disposal is shown as a negative value whereas gypsum use as a byproduct is shown as a positive value [50,51].
Table 2.
Economic parameters for the lactic acid production process using corn grain.
| Time Parameters | Values | Capital Investment Parameters (Contd.) | Values |
|---|---|---|---|
| Analysis year * | 2018 | Buildings (% of PC) 3 | 45 |
| Year construction starts * | 2018 | Yard improvement (% of PC) 3 | 15 |
| Construction period (months) * | 18 | Auxilliary facilities (% of PC) 3 | 40 |
| Start-up period (months) * | 12 | Plant indirect cost (IC) parameters | |
| Project life (years) * | 30 | Engineering (% of DC) 3 | 20 |
| Inflation rate (%) 1 | 2.1 | Construction (% of DC) 3 | 20 |
| Financing parameters | Contractor’s fee (% of (DC + IC)) 3 | 5 | |
| Equity (%) | 40 | Contingencies (% of (DC + IC)) 3 | 10 |
| Loan term (years) | 12 | Annual operating cost parameters | Values |
| Loan interest (%) 2 | 8 | ||
| Depreciation method 2 | Straight line | Equipment maintenance (% of PC)3 | 10 |
| Depreciation period (years) 2 | 15 | Insurance (% of DFC) 3 | 1 |
| Income tax rate (%) 2 | 40 | Local taxes (% of DFC) 3 | 2 |
| Capital investment parameters | Overhead expense (% of DFC) 3 | 5 | |
| Plant direct costs (DC) parameters | Labor rate ($/h) 3 | 57 | |
| Process piping (% of equipment purchase cost (PC)) 3 | 35 | ||
| Instrumentation (% of PC) 3 | 40 | Electricity cost ($/kWh) 3 | 0.07 |
| Insulation (% of PC) 3 | 5 | Steam cost ($/t) 3 | 12 |
| Electrical (% of PC) 3 | 10 | Cooling water cost ($/t) 3 | 0.05 |
Note: * Modeling assumptions. 1 Values based on inflation rate in the U.S. from 2000 to 2017 [55]. 2 NREL report [40]. 3 Default value based on SuperPro Designer® software [37]. The equipment purchase cost (PC) is estimated from SuperPro designer based on the required size and number of equipment for the analysis year. The cost of the equipment used in the analysis is based on the base value and size of the equipment cost at base year (Supplementary Material Table S1).
Table 3.
Utilities requirements for different corn-grain-to-lactic-acid production pathways in a 100,000 t/y lactic acid production facility (based on average values reported in Table 1).
Table 3.
Utilities requirements for different corn-grain-to-lactic-acid production pathways in a 100,000 t/y lactic acid production facility (based on average values reported in Table 1).
| Pathways | Bacteria-Based | Fungi-Based | Yeast-Based |
|---|---|---|---|
| Electricity (kWh/h) | |||
| Feedstock preparation | 421 | 447 | 393 |
| Liquefaction and saccharification | 553 | 587 | 517 |
| Fermentation | 3440 | 4378 | 2848 |
| Product separation and recovery | 863 | 896 | 577 |
| Stillage utilization | 540 | 556 | 471 |
| Total electricity use | 5816 | 6863 | 4806 |
| Steam (t/h) | |||
| Feedstock preparation | - | - | - |
| Liquefaction and saccharification | 29.5 | 31.3 | 27.5 |
| Fermentation | - | - | - |
| Product separation and recovery | 218.4 | 227.9 | 180.4 |
| Stillage utilization | 60.1 | 63.0 | 48.0 |
| Total steam use | 308.0 | 322.2 | 255.9 |
| Cooling water (t/h) | |||
| Feedstock preparation | - | - | - |
| Liquefaction and saccharification | 1651 | 1753 | 1543 |
| Fermentation | 493 | 535 | 410 |
| Product separation and recovery | 5809 | 5983 | 4628 |
| Stillage utilization | 400 | 423 | 316 |
| Total cooling water use | 8353 | 8695 | 6898 |
Table 4.
Labor requirements (h/year) for different pathways of lactic acid production from corn grain.
Table 4.
Labor requirements (h/year) for different pathways of lactic acid production from corn grain.
| Pathways | Bacteria-Based | Fungi-Based | Yeast-Based |
|---|---|---|---|
| Feedstock preparation | 2489 | 2489 | 2489 |
| Liquefaction and saccharification | 24,891 | 24,891 | 24,891 |
| Fermentation | 23,275 | 24,596 | 23,057 |
| Product separation and recovery | 20,562 | 20,562 | 16,971 |
| Stillage utilization | 19,234 | 19,234 | 19,234 |
| Total | 90,452 | 91,773 | 86,643 |
Table 5.
Financial analysis for different lactic acid production pathways.
| Pathways | Bacteria-Based | Fungi-Based | Yeast-Based |
|---|---|---|---|
| Unit production cost ($/t) | 1181 | 1251 | 844 |
| Byproduct revenues ($/t) | 110 | 125 | 79 |
| Minimum selling price ($/t) | 1161 | 1226 | 842 |
| Gross margin (%) | 7.2 | 7.4 | 8.4 |
| Return on investment (%) | 13.1 | 13.0 | 13.1 |
| Payback period (years) | 7.6 | 7.7 | 7.6 |
| Net present value (million $) | 39.3 | 43.6 | 33.7 |
© 2020 by the authors. Licensee MDPI, Basel, Switzerland. This article is an open access article distributed under the terms and conditions of the Creative Commons Attribution (CC BY) license (http://creativecommons.org/licenses/by/4.0/).
Share and Cite
MDPI and ACS Style
Manandhar, A.; Shah, A. Techno-Economic Analysis of Bio-Based Lactic Acid Production Utilizing Corn Grain as Feedstock. Processes 2020, 8, 199. https://doi.org/10.3390/pr8020199
AMA Style
Manandhar A, Shah A. Techno-Economic Analysis of Bio-Based Lactic Acid Production Utilizing Corn Grain as Feedstock. Processes. 2020; 8(2):199. https://doi.org/10.3390/pr8020199
Chicago/Turabian StyleManandhar, Ashish, and Ajay Shah. 2020. "Techno-Economic Analysis of Bio-Based Lactic Acid Production Utilizing Corn Grain as Feedstock" Processes 8, no. 2: 199. https://doi.org/10.3390/pr8020199
Note that from the first issue of 2016, this journal uses article numbers instead of page numbers. See further details here.