
Research on Resilience Evaluation of Coal Industrial Chain and Supply Chain Based on Interval Type-2F-PT-TOPSIS
by
Anbo Wu
1,2,3,
Yue Sun
1,2,3,
Huiling Zhang
1,2,3,
Linhui Sun
1,2,3,
Xinping Wang
1,2,3 and
Boying Li
4,* 1
School of Management, Xi’an University of Science and Technology, Xi’an 710054, China
2
Energy Economic Research Center, Xi’an University of Science and Technology, Xi’an 710054, China
3
Human Factors and Management Ergonomics Research Center, Xi’an University of Science and Technology, Xi’an 710054, China
4
School of Political Science and International Relations, Tongji University, No. 1239 Siping Road, Yangpu District, Shanghai 200092, China
*
Author to whom correspondence should be addressed.
Processes 2023, 11(2), 566; https://doi.org/10.3390/pr11020566
Submission received: 31 December 2022
/
Revised: 29 January 2023
/
Accepted: 8 February 2023
/
Published: 13 February 2023
Abstract
:As unexpected events such as natural disasters, the COVID-19 pandemic, and overseas containment have caused inevitable shocks to the energy industrial chain and supply chain, the current global energy crisis is intensifying, and different countries and regions have adopted different strategies according to the characteristics of their own national resource endowments in order to cope with energy security. Maintaining the security of the coal industrial chain and supply chain is a prerequisite for energy security to be effectively ensured, considering the main position of coal in China’s energy. Therefore, in the face of multiple uncertain risk factors under today’s momentous changes, this paper constructs an industrial coal chain and supply chain resilience evaluation indicator system from the perspective of resilience, based on four representational capabilities of resilience, namely preparedness, absorptive capacity, recovery capacity, and adaptability, in order to profoundly understand and enhance the resilience of the coal industrial chain and supply chain. An integrated method combining Interval Type-2 Fuzzy Prospect Theory and Technique for Order Preference by Similarity to an Ideal Solution (Interval Type-2F-PT-TOPSIS) is proposed for evaluating the resilience level of the coal industrial chain and supply chain. In the case of Shaanxi Province in China, it was found that the worst level of resilience of the coal industrial chain and supply chain in Shaanxi Province was in 2018, and the best was in 2021. Finally, based on the evaluation results, recommendations are provided to the key nodes of the industrial chain and supply chain in Shaanxi Province with a view to improving their resilience levels to cope with uncertain risks.
1. Introduction
The industrial chain and supply chain originates from the continuous development and deep integration of the three chains of the value chain, supply chain, and industry chain, which is a new industrial organization form covering the value dimension, process dimension, and space-time dimension. The continuously optimized, and stable industrial chain and supply chain is a perfect interpretation of their security, which is an important support to guarantee the stability of the national infrastructure. In recent years, under the influence of overlapping factors such as the COVID-19 pandemic, geopolitical conflicts, and the promotion of green and low-carbon transformation, especially the Russia-Ukraine conflict that broke out in early 2022, the global energy industrial chain and supply chain have faced the most serious risks and challenges in nearly 50 years [1,2]. Under the changing world energy system, various risks and changes are also posing serious threats to the security of the energy industrial chain and supply chain, and countries are actively initiating emergency measures to maintain energy security. For instance, in the short term, the EU is diversifying its energy supply while it aims to deploy large-scale renewable energy production in the medium and long term [3].
As a major global economic power and the world’s largest consumer and net importer of energy, China’s energy development strategy is bound to have a profound impact on the changing global energy market situation. Due to its “coal-rich, oil-poor, gas-poor” energy endowment, China has a high degree of external dependence on some energy sources, such as oil. With the escalating conflict between Russia and Ukraine and the mutual sanctions between the US and European countries and Russia, oil exports have suffered a strong impact, while China has reached or is close to its peak in both coal and oil, in addition to the room for growth in natural gas production. Despite the abundance of solar and wind energy resources, due to the high technical costs of their development and the limitations of their own endowment, coal remains their main energy resource for now and in the medium to long term, and the high-quality development of the coal industry is vital to maintaining China’s energy security. However, in a volatile global environment, the increased probability of uncertain risk events such as dual-chain disruption risk, coal import sourcing risk, and information risk has led to the increased prominence of complex dual-chain management issues [4].
Some scholars have conducted a series of studies on risk management in the coal industry. Rao and Xiao et al. [5] argued that the selection of suppliers is critical to risk management when there are multiple suppliers available for procurement from the perspective of downstream companies in the coal supply chain. Brown and Teresa [6] found that the diversity of mineral resources supplied can also play a role in risk prevention and control. Meanwhile, some scholars have analyzed the risk management of a key node. Botha et al. [7] analyzed the risks faced in the logistics chain and suggested that stakeholders should cooperate in developing risk mitigation strategies in a holistic and integrated manner. Li et al. [8] found that by building a risk-benefit measurement model, this model could effectively avoid risks for all parties in the upstream and downstream companies (coal suppliers and power producers). However, existing studies have attempted to mitigate risk shocks through traditional supply chain risk management, but since the coal industry is more sensitive to economic fluctuations than other industries due to its special characteristics [9], the traditional risk management methods used above cannot effectively handle risks in the current highly uncertain global environment, and only a proactive risk management approach to deal with unforeseen risk disruptions [10] can prevent all disruptions from occurring. Increased resilience presents a new insight into the mitigation of uncertain risk shocks in the coal industrial chain and supply chain as a dynamic capability of systems that not only remain operational to resist disruptions when exposed to the effects of risk changes but also recover and learn to evolve quickly in a proactive and flexible manner following risk shocks [11].
The concept of “resilience” was first introduced in 1973 [12] and refers to the resistance of a system at the physical dimension to compression after an impact, i.e., engineering resilience. Over time, resilience has been refined and developed into ecological and evolutionary terms, as ecological and evolutionary resilience, which emphasize the ability of a system to prepare before a shock disruption and to recover, adapt and learn after a shock disruption. Ecological resilience differs from engineering resilience in that it does not only return to the original state as a steady state but may also have multiple steady states, returning to a state that is better or worse than the original state, while evolutionary resilience differs from ecological resilience in that evolutionary resilience emphasizes dynamic steady states (the system has steady states everywhere). However, there is no unified definition of the concept of industrial chain and supply chain resilience. This paper integrates the characteristics of the coal industrial chain and supply chain and the essential attributes of resilience and draws on the definition of energy system resilience by Sharifi and other scholars in the literature [13] to define the coal industrial chain and supply chain resilience as a series of preparation, absorption, recovery, and adaptation of each key node of the industrial and supply chain in the face of risk disruptions to ensure sustainable development. Specifically, it includes the availability, accessibility, affordability, and acceptability of coal supply, transportation, and distribution.
Evaluation of the level of resilience is the basis for its improvement. The literature on resilience research can be divided into four main categories: regional economies [14,15], system security [16,17], supply chains [18,19], and energy systems [20], which can be discussed in two specific aspects. The first is the construction of an indicator system of resilience influencing factors. Linkov et al. [21] first constructed an indicator system consisting of 16 resilience influencing factors based on the understanding of the essential characteristics of resilience and the four representational capabilities of resilience, which was filtered and supplemented by Roege [22] in response to characteristics of energy systems. Anyway, over time, different fields have gradually become involved in resilience research. Han and Pei [23], under the perspective of system security, also constructed an indicator system based on the representational capacity of resilience as the primary indicator to assess the resilience level of urban systems under exposure to rainfall disasters. Zhang et al. [24] considered the unstable economic development of the Guangdong-Hong Kong-Macao Greater Bay Area in the post-epidemic era and constructed a regional economic resilience evaluation system based on the characteristic dimensions of resilience. However, although a growing number of scholars have continued to enrich the indicator system for resilience evaluation from different fields, there is no single indicator system that can be applied to all events. In other words, the selection of a resilience evaluation indicator system needs to consider both the characteristics of the research problem and the essential properties of resilience theory. Second, for the selection of evaluation methods, scholars have adopted different methods to evaluate the level of resilience, which can be roughly divided into two categories: qualitative and quantitative and can provide a reference for this study on the level of resilience of the coal industrial chain and supply chain. Qualitative methods such as the analytic hierarchy process based on Grey Theory [25], the intuitive fuzzy analytic hierarchy process based on interval numbers [26], and TOPSIS [27]. With the continuous development of information technology and comprehensive evaluation theory, new methods such as cloud models and dynamic Bayesian networks have also been applied to resilience evaluation [23,28]. The most prominent quantitative method is the evaluation by calculating the area with the resilience evolution curve [17,29]. Alternatively, mathematical models have been developed, such as those based on game theory [30], linear programming [31], and structural equations [18]. However, there are three shortcomings in the existing studies. First, there is no resilience indicator system established based on the structural characteristics of the coal industrial chain and supply chain. Second, although there are various evaluation methods, in terms of qualitative evaluation methods, the personal preferences and decision-making tendencies of decision-makers make the evaluation results more subjective. On the other hand, in terms of quantitative methods, it is difficult to obtain data at all levels because of the multiple stakeholders involved in the coal industrial chain and supply chain.
Therefore, this study intends to address research shortcoming 1, mainly drawing on research related to energy system resilience and supply chain resilience, to construct a resilience influencing factor indicator system for the essential characteristics and structural features of the coal industrial chain and supply chain with the four characteristic capabilities of resilience. In order to address research shortcoming 2, this paper considers that the coal industrial chain and supply chain is a large and complex system composed of multiple stakeholders, and the data related to the factors affecting its resilience level are difficult to obtain or assess in a quantitative way, coupled with the uncertainty, ambiguity, and hesitation of decision makers, which makes the measurement theory based on fuzzy information the most appropriate for this study. Hence, the idea of fuzzy set theory is utilized in the paper. In this theory, the affiliation function of a type-1 fuzzy set is a specific real number, which provides a certain degree of the description of the uncertainty of the problem, but for real problems with high levels of uncertainty, an affiliation of a real number is still subject to certain limitations. As an extension of type-1 fuzzy set theory, type-2 fuzzy sets have their upper and lower affiliation functions as a type-1 fuzzy set, respectively, which can better describe and solve fuzzy uncertainty decision problems. Moreover, considering the advantages of interval type-2 fuzzy sets over other type-2 fuzzy sets in terms of affiliation function selection and calculation, interval type-2 fuzzy sets are thus regarded as the core idea of this study. In addition, in order to effectively evaluate the resilience level of the coal industrial chain and supply chain, this study considers the integrated method of interval type-2 fuzzy sets and TOPSIS. TOPSIS, as an effective multi-indicator integrated evaluation method, is particularly suitable for evaluating the same research object in different time dimensions or evaluating different research objects in the same time dimension by constructing positive and negative ideal solutions to the evaluation problem and ranking the relative merits of the existing evaluation objects according to their relative closeness to the ideal solution. However, TOPSIS has two shortcomings: for one, it is difficult to determine the weight of indicators; and for another, traditional TOPSIS assumes that decision-makers are perfectly rational, but this is not achievable in real-life situations. Therefore, in order to make the evaluation results more objective and realistic, a number of factors are considered in this study. First, the relative entropy method based on hamming distance is used to obtain the decision-maker weights based on a combination of subjective and objective weights, and then the interval fuzzy Analytical Hierarchy Process (AHP) is integrated to obtain the indicator weights. In order to combine the evaluation model with practical cases, the model is applied to the coal supply chain in Shaanxi Province, which is a typical coal-producing and consuming province in China and is of great significance for resilience evaluation. Finally, the evaluation results are used to propose actionable countermeasures to improve the level of resilience.
The rest of the paper is organized as follows: Section 2 introduces the construction of the indicator system of factors influencing the resilience of the coal industrial chain and supply chain; Section 3 introduces the construction of the evaluation model; Section 4 presents the evaluation results obtained by applying the established evaluation model to the case; Section 5 presents the analysis of the results and suggestions for countermeasures; and Section 6 presents the conclusions.
2. Construction of an Indicator System for Influencing Factors of Resilience of Coal Industrial Chain and Supply Chains
In this paper, through reviewing the domestic and international literature on “coal supply chain,” “coal industry,” “energy industry,” “industrial chain and supply chain”, “supply chain resilience,” “energy security,” “coal industry chain security,” and the other relevant literature, we integrate the structural points of the coal industrial chain and supply chain and four characteristics of resilience (preparedness, absorptive capacity, recovery capacity and adaptability [32]). In addition, experts in the field of the coal industry were invited to conduct several discussions and finally determined a resilience influencing factor indicator system constructed by four primary indicators and 13 secondary indicators. The relationship between the resilience level of the coal industrial chain and supply chain and the evaluation indicators and influencing factors is expressed by the following formula: In this paper, according to the definition of the resilience of the coal industrial chain and supply chain, four characteristic capabilities of resilience (preparedness, absorptive capacity, recovery capacity, and adaptivity) are used as primary indicators, and the influencing factors of resilience under each capability are considered as secondary indicators from the perspective of coal industrial chain and supply chain members (government, upstream industry, and downstream enterprises) to construct the indicator system [32]. The relationship between the resilience level of the coal industrial chain and supply chain and the evaluation indicators and influencing factors is expressed by the following formula:
where R denotes risk resilience of coal industrial chain and supply chain, Abs denotes preparedness, Res denotes absorptive capacity, Rec denotes recovery capacity, Ada denotes adaptability, and respectively denote the factors influencing the resilience of the coal industrial chain and supply chain under each capacity in four dimensions upstream industry (Coal source), midstream enterprises (Coal transportation), government, and downstream enterprises (Coal consumption). Then indicator system for evaluating the resilience of coal industrial chain and supply chain is as shown in Table 1.
- (1)
- Preparedness is the basis for the resilience performance level of the coal industrial chain and supply chain, which is expressed as the risk prevention effect. In particular, risk management refers to the ability of enterprises to warn, plan, assess, avoid, and control risks before they come [33]; The scale of emergency coal reserves refers to the coal spot reserves, capacity reserves, and resource reserves established in advance by the government and enterprises to cope with possible estimation errors, omissions and uncertainties during the operation of the industrial coal chain in order to maintain sustainable production and operation activities. It serves the primary purpose of responding to energy supply shortages in times of emergency and securing China’s energy supply, thereby safeguarding the normal operation of the national economy and defense requirements.
- (2)
- Absorptive capacity refers to the ability of the coal industrial chain and supply chain to absorb and withstand risk after a risk disruption occurs and to mitigate adverse impacts. Key factors affecting the absorptive capacity of the coal industrial chain and supply chain include the diversity of emergency behavior, the efficiency of information transfer, and the ability to secure emergency coal reserves. When risks occur, the diversity of emergency behavior of enterprises contributes to the rapid identification of the main characteristics of risks and thus successfully respond to them to improve the level of chain resilience [34,35]; the closer the relationship between firms and social service organizations, the more timely and accurate the information received in the event of external disruptions, and the more efficient the handling of external disruptions [36,37], as well as the more it helps all parties to come together to respond to risks to quickly return to normal, thereby increasing resilience; Coal emergency reserve security is the maintenance of additional coal reserves by members of the industrial chain and supply chain to ensure continuity of operations in the event of a disruption, albeit at the cost of additional inventory costs, but also reduces the potential for supply chain discontinuity. Therefore, there is a trade-off between maintaining additional reserves and reducing the impact of disruption. The capacity to secure emergency coal reserves is one of the key factors in the rapid recovery of the industrial coal chain and supply chain following a risk disruption.
- (3)
- Recovery capacity refers to the ability of the coal industrial chain and supply chain nodes to operate in a timely manner to recover their normal operational functions from risky disruptions. In particular, a higher level of coal industry technology allows the industrial chain and supply chain to recover quickly after a risk disruption [38]; an enhanced level of service organization development can help companies integrate their resource supply networks and enhance their ability to act quickly under uncertain and unexpected conditions [39,40]; excellent industrial resource competitiveness is one of the key factors affecting the rapid recovery of imported coal sources after a risk disruption; higher coal reserves can provide a bottom-up effect to meet critical demand after a risky disruption in the coal industrial chain and supply chain.
- (4)
- Adaptability refers to the ability of the coal industrial chain and supply chain to learn from experience after risk disruptions, including the innovative capacity of the coal industry in science and technology, the level of product market development, the emergency coal reserve mechanism, and the emergency coal transport layout. The scientific and technological innovation capacity of the coal industry is the core driver of its healthy and orderly development, representing the system’s ability to adapt to external risk disruptions. When the coal industrial chain and supply chain is exposed to risk disruptions, the level of science and technology in each segment of the chain largely determines the time and speed of its return to normal operation; the level of product market development represents the development potential of the industry; the higher the development potential, the higher its resource utilization rate [41]; after the occurrence of risk disruptions, the discovery of the potential for improvement and upgrading in the coal emergency reserve mechanism can provide the industry with more effective emergency management. In terms of transportation, lessons should be actively learned, and various modes of coal transportation, such as road, rail, and waterway pipelines, should be scientifically laid out so as to effectively coordinate overall operations.
3. Evaluation of Coal Industrial Chain and Supply Chain Resilience Based on Interval Type-2 Fuzzy Numbers
3.1. Interval Type-2 Fuzzy Numbers
3.1.1. Definition
Definition 1.
[42]: Type-2 fuzzy number is
where x is the type-2 affiliation function of ; . can also be expressed as:
where .
Definition 2.
[42]: A type-2 fuzzy set is denoted as an interval type-2 fuzzy set if = 1 for all . That is:
where .
Definition 3.
[42]: If the upper and lower bound subordinate functions of interval type-2 fuzzy numbers are trapezoidal fuzzy numbers, they are denoted as interval trapezoidal type-2 fuzzy numbers, and interval trapezoidal type-2 fuzzy numbers are a special case of interval type-2 fuzzy numbers. That is:
where and are type-1 fuzzy sets, are reference points for , denotes the affiliation of an element in to the upper trapezoidal affiliation function , and denotes the affiliation of an element to the lower trapezoidal affiliation function , .
3.1.2. The Algorithms of Interval Type-2 Fuzzy Numbers
Let any two interval type-2 fuzzy numbers and . The fundamental algorithms [43] are as follows:
- (1)
- Addition
- (2)
- Multiplication
- (3)
- Scalar multiplication
- (4)
- Power operation
- (5)
Hence, the distance of each indicator from the positive and negative ideal solution can be obtained as:
3.1.3. Interval Type-2 Fuzzy AHP Algorithm
The AHP algorithm proposed by Saaty [45] has become one of the most popular multi-attribute decision-making methods due to its rational hierarchical structure and clear, logical relationships. Subsequently, considering that many decision-making environments are uncertain, Buckley et al. [46] extended the AHP algorithm to fuzzy AHP by fusing it with fuzzy sets. In this paper, we employ the interval type-2 fuzzy AHP algorithm to calculate the weights of indicators.
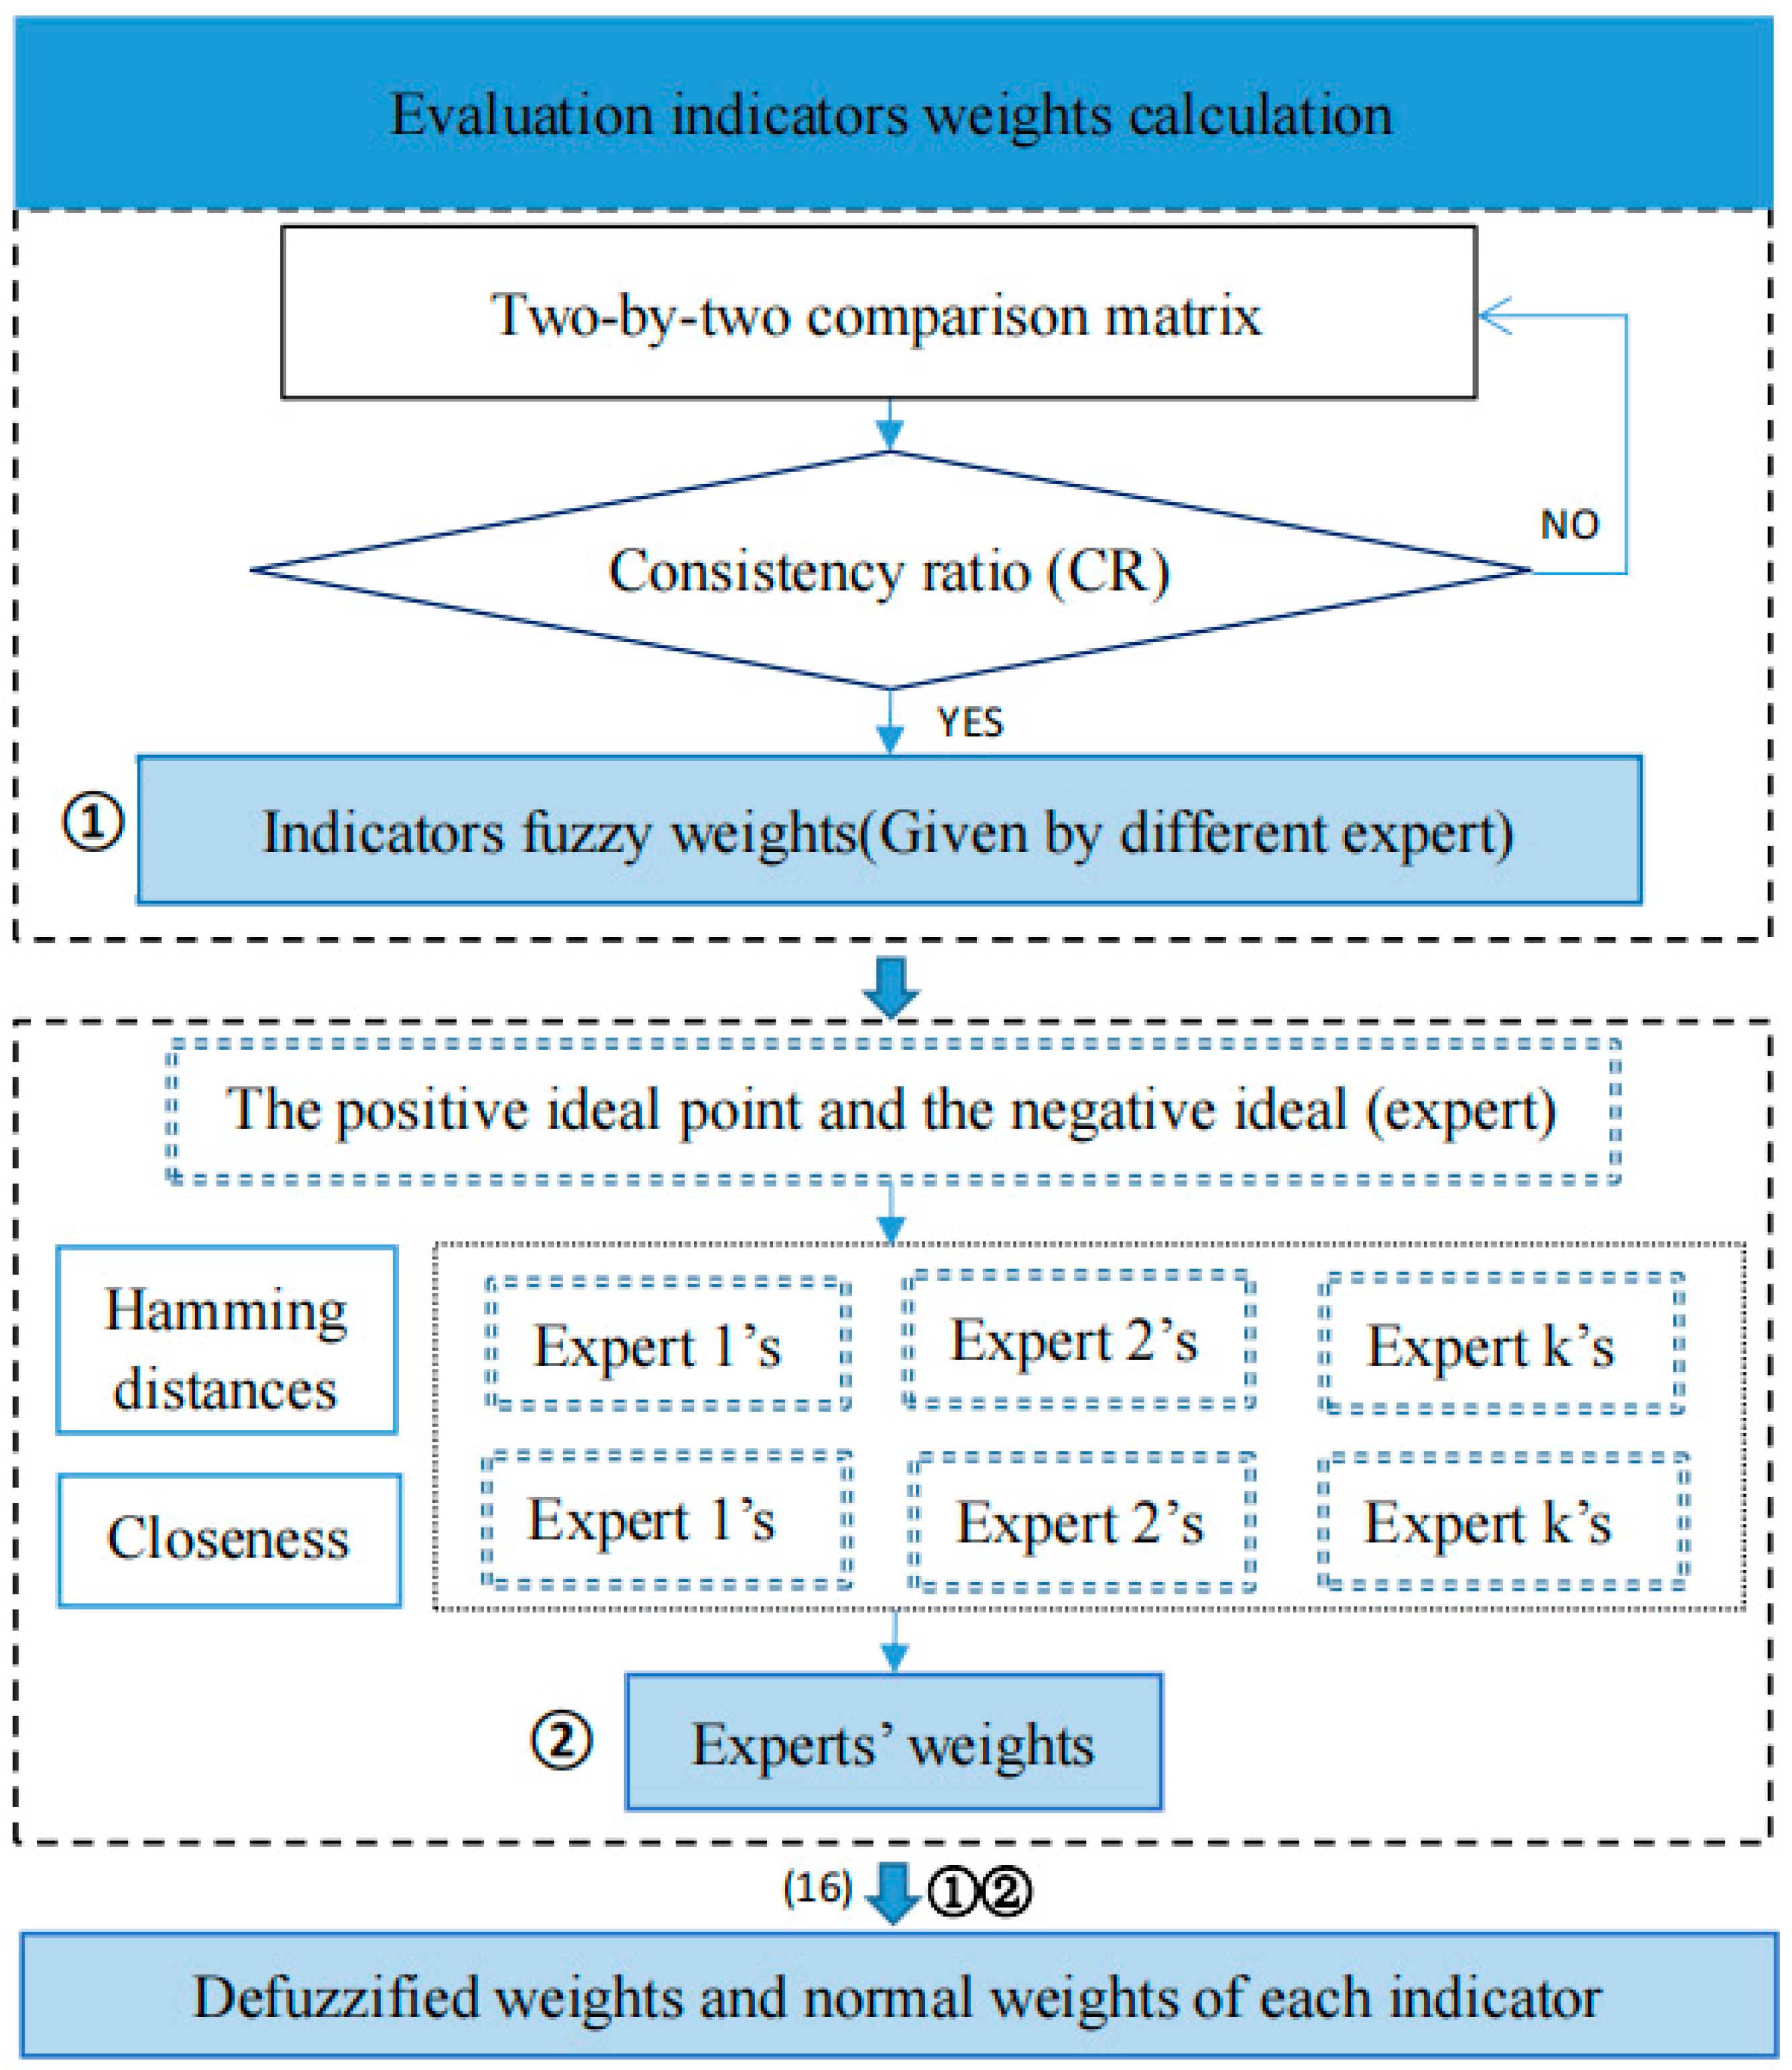
The steps of the interval type-2 fuzzy AHP algorithm are as follows (see Figure 1):
Step 1: Construct a two-by-two comparison matrix of interval type-2 fuzzy numbers for the indicators.
Since it is often difficult for decision-makers to provide interval type-2 fuzzy numbers directly, a semantic form is more suitable for the way of thinking and habits of decision-makers. The relationship between the semantic values and the interval type-2 fuzzy numbers are shown in Table 2.
Step 2: Check the consistency of the interval type-2 fuzzy number comparison matrix.
In order to identify the consistency ratio (CR) of the matrix, the general consistency index CI is first obtained:
where , is a maximum eigenvalue, w is the eigenvector corresponding to the maximum eigenvalue. The consistency ratio (CR) of the matrix can be obtained from the following equation:
When , the comparison matrix is considered to be consistent otherwise, the elements of the matrix need to be adjusted to achieve consistency.
Step 3: The interval type-2 fuzzy number comparison matrices made by the experts are assembled separately using the geometric mean method:
Step 4: Calculate the fuzzy weights of different experts for the same indicators:
where A represents the fuzzy interval number corresponding to the indicator in the post-assembly comparison matrix.
As in traditional AHP, the transferability and consistency of the decision maker’s personal preferences can have a large impact on the decision outcome. In order to minimize this effect and make the decision outcome more objective, although most studies have used aggregation methods AIJ (aggregation of individual judgment) [47] and AIP (aggregation of individual preferences) [48], both of these aggregation methods apply weighted arithmetic or geometric averaging. However, studies have shown [49,50] that distance-based aggregation techniques are significantly better than AIJ and AIP. Therefore, this paper is inspired by the literature [50] and proposes a relative entropy method based on Hamming distance, taking into account that the linguistic variables are represented as interval type-2 fuzzy numbers.
First, the decision maker weights are determined based on the evaluation results given by the decision maker, and the weights of each attribute are further calculated after the decision maker weights are derived. The specific calculation steps are as follows:
Step 5: After obtaining the fuzzy weights (interval type-2 fuzzy numbers) of different experts for the same indicator from step 4, the comprehensive evaluation value of each expert for the same indicator is compared, and the ideal positive point and ideal negative point based on the experts under each indicator are determined, where and . represents the evaluation value of the indicator by the expert.
Step 6: Calculate the Hamming distances and between the comprehensive evaluation values of different experts for each indicator to the positive and negative ideal points, respectively.
Step 7: Calculate the coefficient of closeness for the same indicator for different experts separately.
Step 8: Based on the calculation results of step 7, the weight of the same expert in the comprehensive evaluation of different indicators is obtained, and finally, the weight of decision-maker is obtained.
Step 9: Multiply the weights of decision makers with the weights of attributes, i.e., to obtain the objective indicator weights given by each expert respectively, and further apply the arithmetic average method to aggregate the indicator weights given by all experts, and finally perform defuzzification to obtain the defuzzified weights and normal weights of each indicator. The defuzzification formula is as follows:
3.2. Type-2F-PT-TOPSIS Based Evaluation Method
3.2.1. Prospect Theory
Behavioral psychologists have found that people are not fully rational when making decisions but are finitely rational. Based on this, in 1979, Tversky [51] proposed the prospect theory. Prospect theory suggests that people are influenced by their own subjective judgments when making decisions and that different people have different subjective criteria. In other words, the prospect value of a solution is the criterion for people’s decision-making, which better explains why people make actual decisions that deviate from the expected utility theory, which is well accepted by academics. Prospective value is determined through a combination of probability weighting functions and value functions:
where is the probability weighting function, and is the value function.
The specific form of the value function is as follows:
where indicates the difference between attribute xi and reference point x0. indicates that the decision maker feels a ‘gain,’ while , on the other hand, indicates that the decision-maker feels a ‘loss.’ and are both risk attitude coefficients and , . Larger and indicate that the decision expert tends to take more risks; is the loss aversion coefficient, usually taken as , indicating that the decision expert is more sensitive to losses. This paper draws on the literature and takes and does not use probability weights, where because Tversky [51] found that assigning parameters to this data set was more consistent with the empirical data.
3.2.2. TOPSIS Method
In 1981, the TOPSIS method was proposed by Hwang and Yoon [52], which is a ranking method that approximates the ideal solution. The core idea of the method is to calculate the Euclidean distance between the evaluation object and the positive and negative ideal solutions, thus obtaining the relative degree of closeness and finally ranking them according to that degree of closeness. The traditional TOPSIS calculation steps are as follows:
Step 1: The initial decision matrix X is normalized to obtain a normalized decision matrix .
Step 2: Construct a weighted normalized matrix
where is the weight of the attribute j and .
Step 3: Determine the positive ideal solution and the negative ideal solution .
Step 4: Calculate the distance between each decision solution and the positive ideal solution and the negative ideal solution , respectively.
Step 5: The closeness of each solution to the most ideal solution is calculated individually.
Obviously, when , , the optimal decision solution is a negative ideal solution; when , , the optimal decision solution is a positive ideal solution.
Step 6: The overall ranking of the closeness of all decision options . The greater , the better the corresponding decision option .
3.2.3. Type-2F-PT-TOPSIS Method
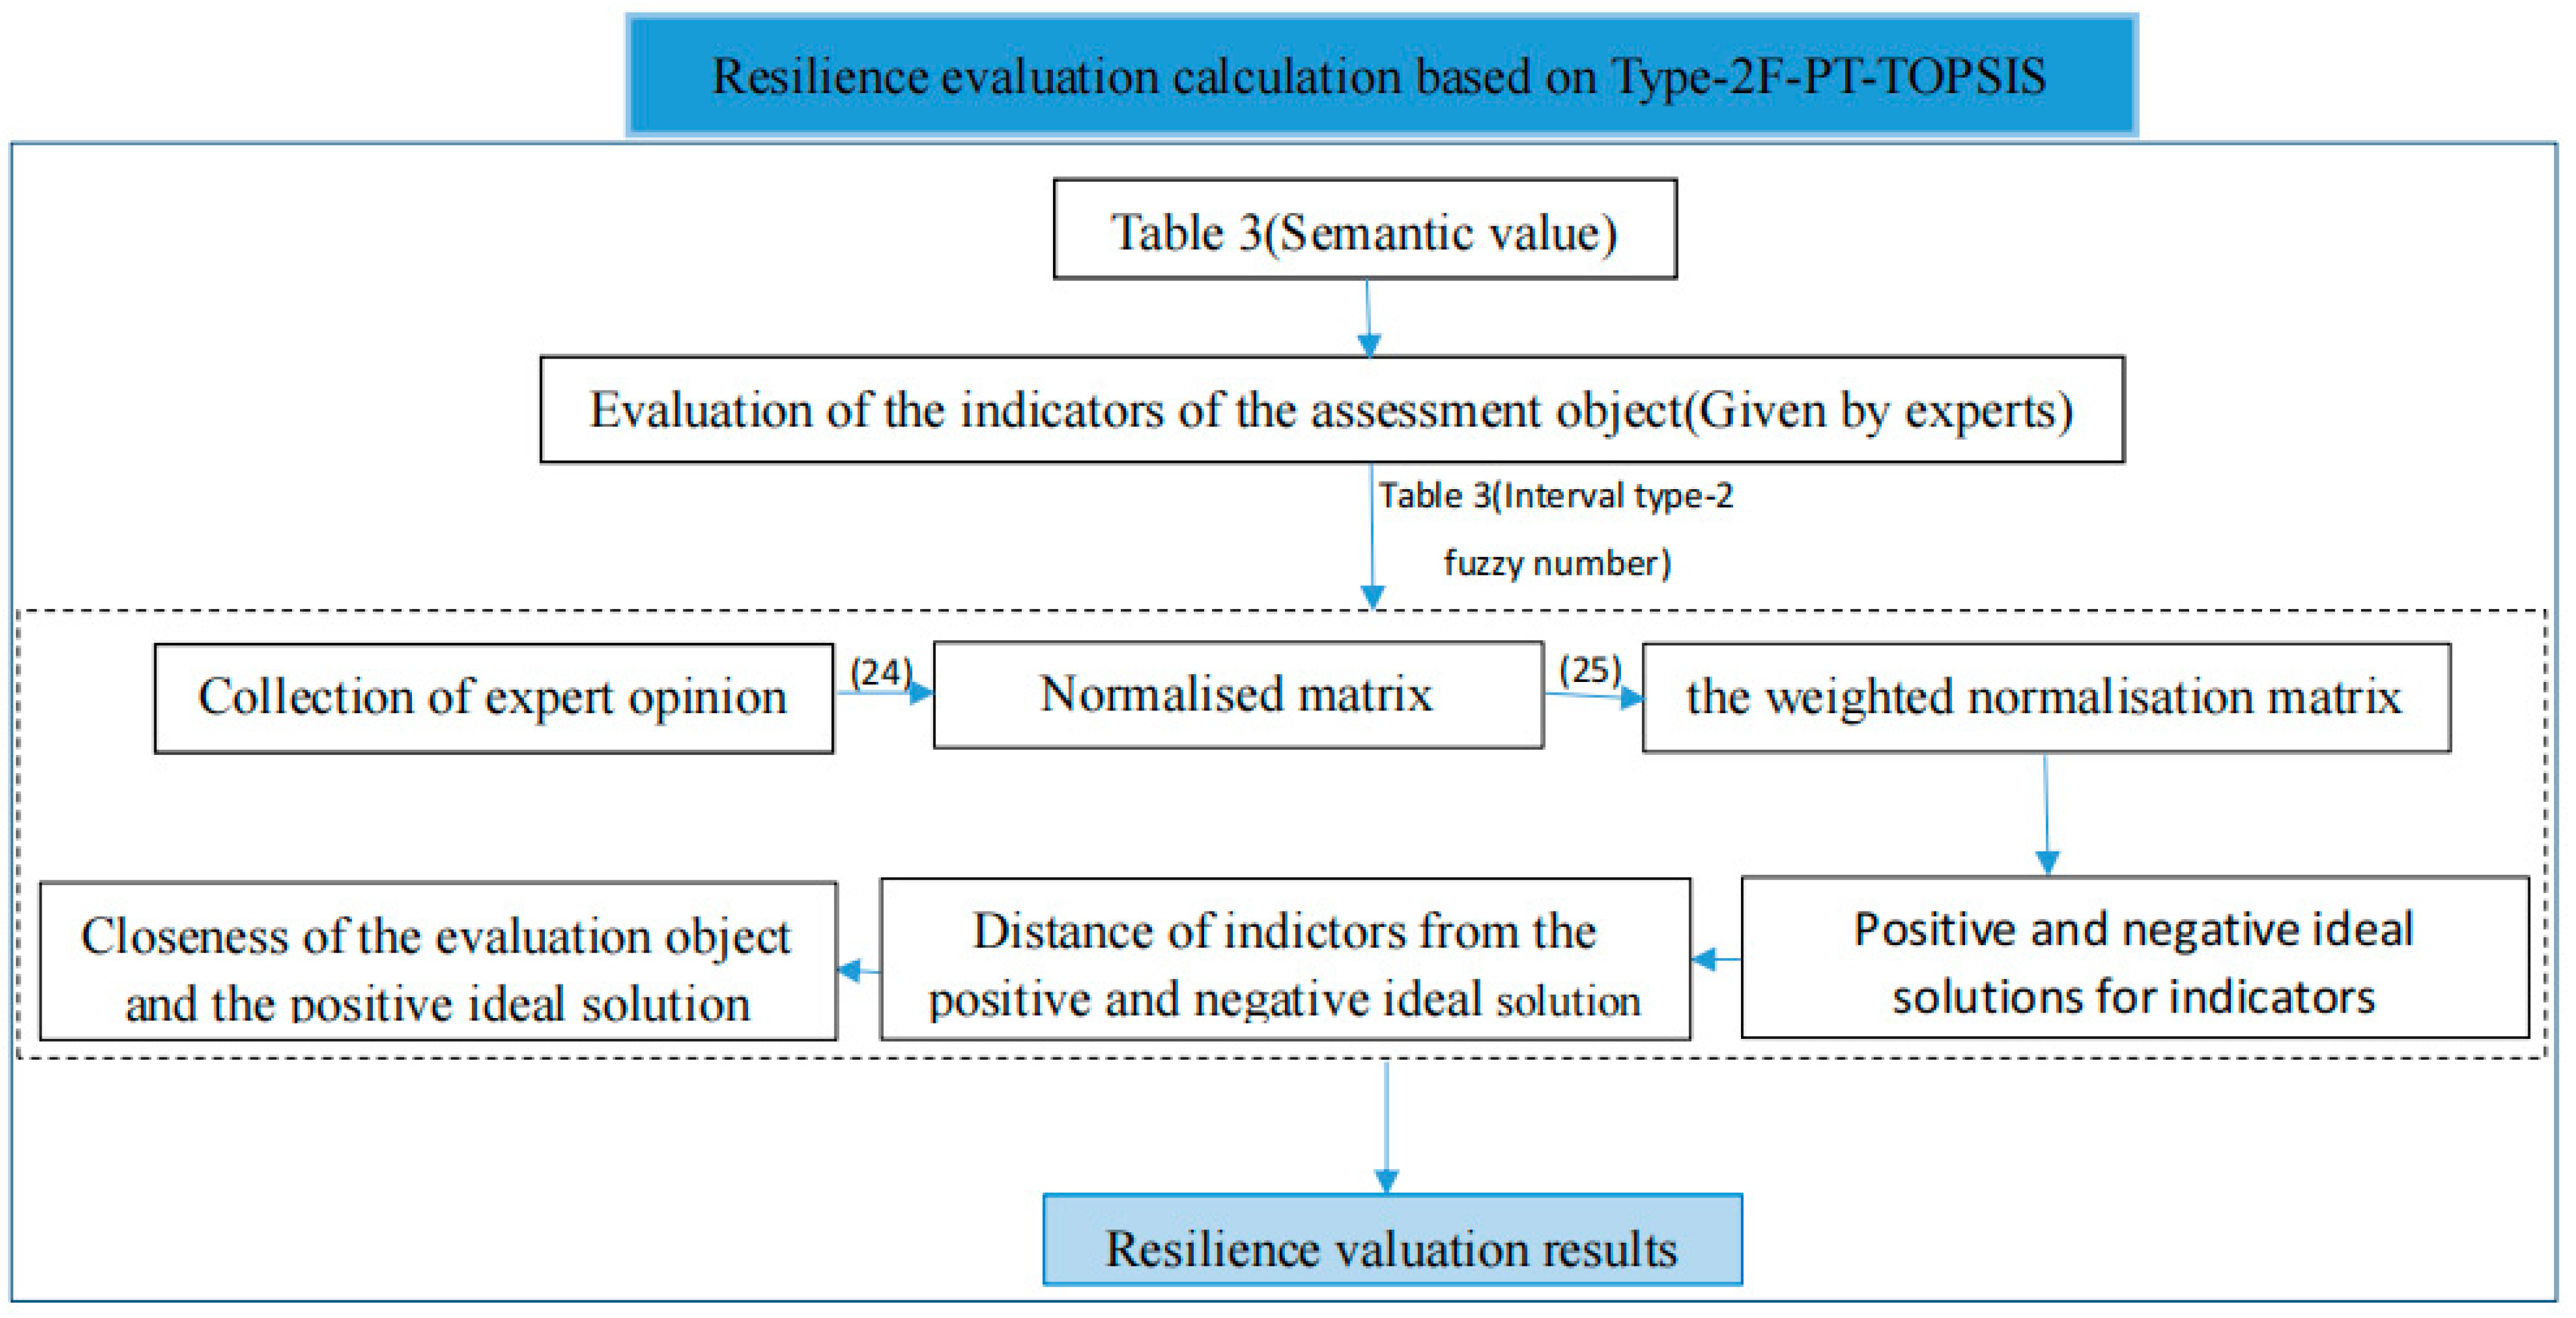
The combination of prospect theory and the TOPSIS method considers the influence of psychological factors in people’s decision-making, and it improves on the traditional TOPSIS method, making the ranking results more objective and reasonable. In addition, due to the increasing complexity of current multi-attribute evaluation problems, in most cases, decision experts are unable to provide a definitive evaluation result. To better solve this problem, in the evaluation model of this paper, type-2 fuzzy variables are also introduced to solve the uncertainty and ambiguity of the problem. The specific calculation steps are as follows (see Figure 2):
Step 1: Based on Table 3, q experts are invited to evaluate the level of resilience under m indicators, and the linguistic value evaluation matrix of the decision expert is obtained and converted into an interval type-2 fuzzy number evaluation matrix .
Step 2: Set the experts’ interval type-2 fuzzy number rating matrices using geometric averaging:
Step 3: Normalize to obtain the normalized matrix .
Step 4: Construct the weighted normalization matrix .
where is the weight of indicator j.
Step 5: Determine the positive and negative ideal solutions.
Step 6: Based on the formula for the distance between trapezoidal interval type-2 fuzzy sets, integrated prospect theory, and TOPSIS calculate the distance between each indicator and the positive and negative ideal solutions, expressed as:
When ,
When ,
Step 7: Calculate the degree of closeness of each indicator value to the optimal ideal solution
It can be seen that is a negative ideal solution when and is a positive ideal solution when .
Step 8: All decisions are ranked in terms of their closeness . A higher value means that they are closer to a positive ideal solution, which means a higher level of resilience in this paper.
4. Case Study
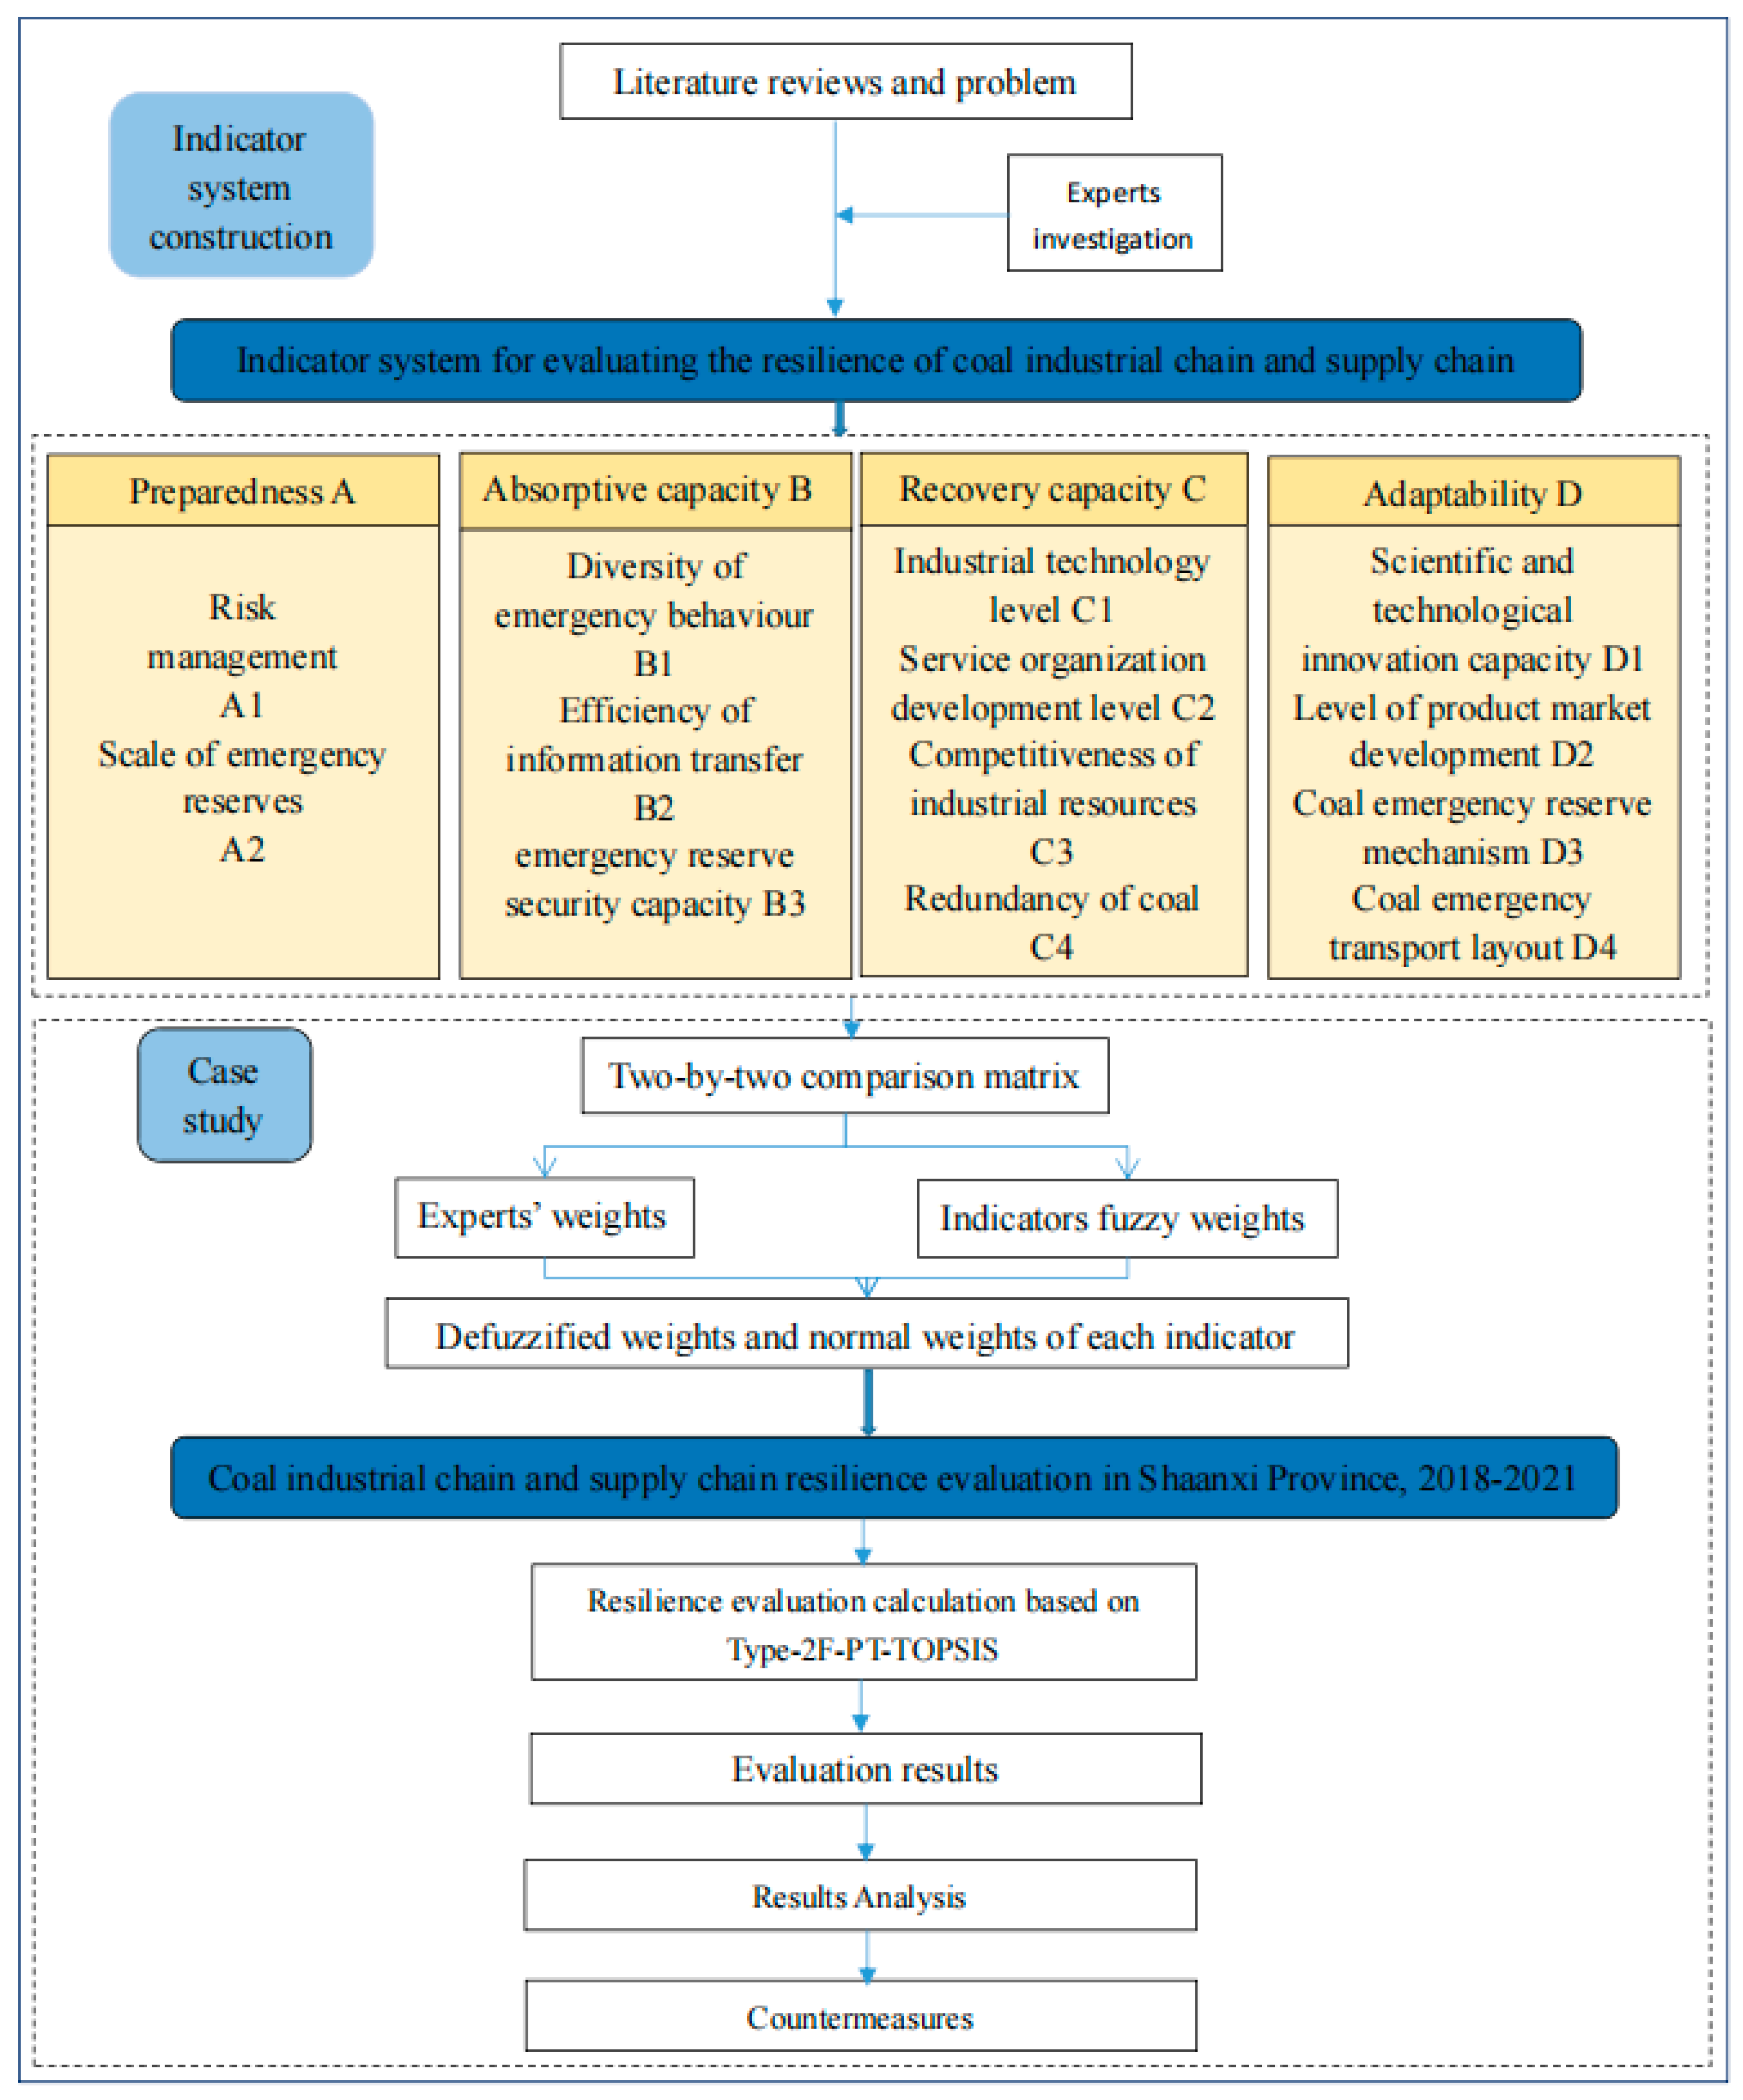
Shaanxi is a province in which coal production ranks third in China and has a wide range of products, basically covering all end products of the coal chemical industry, including new coal-to-oil, coal-to-methanol, and coal-to-olefin, in addition to the traditional ammonia and coking. Coal plays a pivotal role in the province’s economic development, making Shaanxi Province an important energy and chemical base in China. Therefore, the model constructed in this paper is applied to the evaluation of the industrial coal chain and supply chain resilience in Shaanxi Province from 2018 to 2021, which has important demonstration and reference significance. The experts in Shaanxi Province were invited to offer guidance, and evaluate the resilience level of Shaanxi Province in recent years using Type-2F-PT-TOPSIS, analyze the shortcomings factors affecting its industrial and supply chain resilience level, and propose corresponding countermeasures. The technical roadmap for this study is shown in Figure 3.
4.1. Calculation of Weights of Resilience Evaluation Indicator
Four experts in the field of the coal industry in Shaanxi Province were invited for this study. Among them, two are professors from research institutions specializing in safety management in the coal industry; one is a government department commissioner, and one is a corporate director of Shaanxi Coal and Chemical Industry Group Co. The background, ideas, methodology, indicator design, and objectives related to this study were first explained to the experts in the early stage, and then they were asked to make a two-by-two comparison of the importance of resilience evaluation indicators of the coal industrial chain and supply chain relative to the target layer based on their research or experience in the field. The secondary indicators under absorptive capacity were used as an example. As shown in Table 4, a consistency test was conducted based on Equations (10) and (11).
The consistency test of each comparison matrix by Equations (10) and (11) shows that their CRs are all less than 0.1. Thus, each comparison matrix passes the consistency test.
As shown in Table 5, Table 6, Table 7 and Table 8, the fuzzy weights of different experts for the same indicators are calculated according to Equations (12) and (13).
Combining Table 5, Table 6, Table 7 and Table 8 with Equations (14) and (15), the weights assigned to the four experts in rating the secondary indicators under the absorptive capacity dimension are calculated as follows:
By using the same method as above to calculate the primary indicator weights and the remaining secondary indicator weights, the normal and defuzzified weights for each indicator are obtained by combining step 9 and Equation (15) as shown in the Table 9.
Then the secondary indicator global weights are obtained by multiplying the primary indicator weights and its secondary indicator weights as shown in the Table 10.
4.2. Calculation of Resilience Level of Coal Industrial Chain and Supply Chain in Shaanxi Province
We invited four more experienced executives and employee representatives from enterprises at the key nodes to evaluate the resilience level of Shaanxi’s coal industrial chain and supply chain in recent years based on their historical data and work experience as shown in the Table 11, Table 12, Table 13 and Table 14.
From Equations (23)–(25), using the geometric mean method to aggregate and standardize the expert rating scale, we can obtain results as shown in the Table 15, Table 16, Table 17 and Table 18.
The positive and negative ideal solutions corresponding to each evaluation indicator are determined according to Equation (26), as shown in Table 19 below.
The distance between each indicator and the positive and negative ideal solution is calculated from Equation (27), as shown in Table 20 below.
The closeness of the resilience level of the industrial coal chain and supply chain in Shaanxi Province to the positive ideal solution in 2018–2021 is calculated by Equations (9) and (24).
In summary, in terms of the resilience level of the industrial coal chain and supply chain in Shaanxi Province from 2018–2021, it can be seen that .
5. Results Analysis and Countermeasures
5.1. Results Analysis
This paper uses the relative entropy of hamming distance based on interval type-2 fuzzy set to obtain the weights of decision makers with comprehensive subjective and objective assignments and combines Prospect Theory and TOPSIS to evaluate the resilience level of the coal industrial chain and supply chain in Shaanxi Province. Because of the combination of multiple theoretical calculation methods, the overall values of the resilience evaluation results derived from this paper are small. The results still show that the resilience level was best in 2021 and worst in 2018. Detailed analyses are presented below.
Despite the large size of the coal industrial chain and supply chain in Shaanxi Province and the completeness of the industrial system, it is still inevitably affected by the uncertainty and complexity of changes from different parties. It is evident from the evaluation results that as the level of technological development in the coal industry continues to rise, the level of industrial technology and technological innovation used to cope with risk disruptions is relatively low in 2018 but high in 2021. As a result of some of the ‘stranglehold’ technologies in coal equipment manufacturing, the supply and production capacity of the upstream industries in the supply chain is limited, resulting in the inability to function as an effective emergency coal reserve mechanism.
In 2019, resilience maintained a relatively stable level. This is mainly because the COVID-19 pandemic appeared at the end of the year, and the initial ripple effect was small. As a result, the awareness of upstream and downstream companies in the industrial chain and supply chain to take precautions was weak. For example, there was no significant replenishment across the region after de-stocking. As the COVID-19 pandemic spread until 2020, the COVID-19 pandemic broke out, and the coal supply in Shaanxi exceeded demand. Faced with the sudden disruption of the epidemic, previous conventional risk management measures were not able to respond effectively to this unexpected event. In addition, Shaanxi Province is a major coal-producing province, but as most of the regional coal supply is based on motor transport, the initial epidemic prevention resulted in low availability of motor fleets. Moreover, the logistics restrictions varied across the regions, resulting in low overall logistics efficiency, most of which were also affected by the epidemic leading to poor transportation and thus insufficient power to guarantee the emergency reserve capacity for the logistics dispatch of coal raw materials and products, ultimately leading to a low level of overall resilience of the coal industrial chain and supply chain in Shaanxi Province in 2020.
The evaluation results for 2021 show that the overall resilience level of the coal industrial chain and supply chain in Shaanxi Province is good. This is mainly due to the fact that in the post-epidemic period, various stakeholders in the industrial and supply chain have strengthened their cooperation, built up their preparedness and recovery capabilities, and enhanced their systemic risk management in order to reverse the chaotic situation caused by the initial phase of the epidemic as soon as possible. A standing reserve mechanism was also actively established in many locations to enable an effective response to sudden supply disruptions, severe shortages, and other energy emergencies. However, even with many aspects heading in the positive direction, there are still weaknesses that need to be addressed. In terms of coal reserves in Shaanxi Province, there are a large number of coal resources, but in the current market situation where coal prices are high, and demand exceeds supply, many mines are only interested in mining from the middle in order to “convert” coal resources into cash as soon as possible, regardless of how thick the coal seam is, which ultimately causes some minerals to be unable to be mined back and reserves to be greatly reduced.
5.2. Countermeasures
Based on the evaluation results of the coal industry and supply chain resilience level in Shaanxi Province, this paper proposes strategies to improve the resilience level.
- (1)
- In the context of the current energy security and carbon neutrality constraints, the coal industry and supply chain should actively strengthen the establishment of a collaborative innovation mechanism for a clean and low-carbon coal industrial and supply chain. Key nodal enterprises should increase investment in intelligent and green coal technology innovation, actively undertake core technology research and development, and precisely conduct emergency regulation in order to effectively play the role of coal as a bailout.
- (2)
- With the increasing number of uncertain risk factors, only by establishing a sound risk warning mechanism for the coal industrial chain and supply chain can the entire staff be better motivated to form a strong working force to effectively integrate the coal supply network. This can be achieved through training to strengthen the operational capabilities of staff, enhancing their proficiency in emergency operation facilities, and improving the emergency responsibility system.
- (3)
- Based on the overall operation of the coal industry, “ensure stable supplies and prices” is an important factor influencing the level of development of the coal product market. Therefore, it is necessary to actively organize and promote large coal enterprises and power companies, and other coal-consuming enterprises to sign coal medium and long collaboration contracts, strengthen the supervision of contract performance, and strictly implement the “benchmark price + floating price” for pricing to build a win-win market mechanism of upstream and downstream cooperation.
- (4)
- In view of the decreasing recoverable coal reserves year by year, regional governments should strengthen the supervision and management of coal resources production, actively train employees of key nodal enterprises in the development of mineral resources technology, establish targeted policies to regulate the operational behavior of employees, and organize monitoring visits to upstream and downstream enterprises irregularly to understand the latest developments in the industrial chain and supply chain. Meanwhile, attention should be paid to the feasibility of emergency facilities and emergency behavior.
6. Conclusions
In the context of the COVID-19 pandemic, geopolitical conflicts, and green low-carbon transformation, this study effectively investigates the resilience level of the coal industrial chain and supply chain, aiming to guide the enterprises involved in the chain to identify the vulnerable parts of the organization in time, so that they can formulate and adjust their strategies to enhance the resilience level of the industry. Specifically,
- (1)
- A coal industrial chain and supply chain resilience evaluation indicator system is constructed based on the four representations of resilience, namely preparedness, absorptive capacity, recovery capacity, and adaptability, which includes four primary indicators and 13 secondary indicators;
- (2)
- Considering the complexity, ambiguity, and uncertainty of the decision-making problems as well as the different individual capabilities and behavioral preferences of decision-makers, the relative entropy method based on hamming distance measurement is first applied to obtain the weights of decision-makers with comprehensive subjective and objective assignments, and then the interval type-2 fuzzy-prospect theory-TOPSIS resilience evaluation model is further constructed. This comprehensive evaluation method takes advantage of the cognitive differences of multiple subjects to evaluate the objectives in an integrated, scientific, and effective manner;
- (3)
- Taking the Shaanxi Province, a typical mineral-resource-endowed province in China, as an example, the evaluation results are in line with its actual situation of it. It also proves that the calculation method used in this paper is an effective method for evaluating the resilience of the coal industrial chain and supply chain. In addition, the research results of this paper can provide effective theoretical support and a decision-making basis for the sustainable development of the industrial coal chain and supply chain under momentous changes in today’s environment and can also provide new ideas for the sustainable development of coal supply by the relevant enterprises in the industrial and supply chain;
- (4)
- This paper constructs an industrial coal chain and supply chain resilience evaluation indicator system consisting of qualitative indicators. Although these qualitative indicators are reasonable and necessary, and the relative entropy method based on hamming distance and the prospect theory are introduced to obtain objective evaluation results, it is still impossible to completely avoid the bias caused by factors such as experts’ perceptions and personal preferences on the final results. Therefore, in further research, other quantitative indicators should be considered in order to improve the resilience evaluation indicator system.
Author Contributions
Conceptualization, A.W., Y.S. and L.S.; methodology, A.W. and X.W.; software, H.Z.; investigation, A.W. and Y.S.; data curation, H.Z. and B.L.; writing—original draft preparation, A.W., Y.S. and L.S.; writing—review and editing, A.W. and Y.S.; funding acquisition, A.W., L.S., X.W. and B.L. All authors have read and agreed to the published version of the manuscript.
Funding
This research was funded by Research and Planning Fund for Humanities and Social Sciences of the Ministry of Education (22YJAZH104), Special Scientific Research Plan of Shaanxi Provincial Department of Education—Humanities and Social Sciences (20JK0232), Key Projects of the Prosperity and Development Plan of Philosophy and Social Sciences of Xi’an University of Science and Technology (2019SZ01, 2020SZ03), ‘Chenguang Program’ from the Shanghai Education Development Foundation and Shanghai Municipal Education Commission (No. 19CG24).
Data Availability Statement
Not applicable.
Acknowledgments
The authors appreciate the support from Xi’an University of Science and Technology and Tongji University.
Conflicts of Interest
The authors declare no conflict of interest.
References
- Kruczkiewicz, A.; Klopp, J.; Fisher, J.; Brenaon, C. Compound risks and complex emergencies require new approaches to preparedness. Proc. Natl. Acad. Sci. USA 2021, 118, e2106795118. [Google Scholar] [CrossRef]
- Zhou, X.Y.; Lu, G.; Xu, Z.C.; Yan, X.Q.; Khu, S.T.; Yang, J.F.; Zhao, J. Influence of Russia-Ukraine war on the global energy and food security. Resour. Conserv. Recycl. 2023, 188, 106657. [Google Scholar] [CrossRef]
- Blanchard, O.; Pisani-Ferry, J. Fiscal support and monetarg vigilance: Economic policy implications of the Russia-Ukraine war for the European Union. Policy Briefs 2022. [Google Scholar]
- Um, J.; Han, N. Understanding the relationships between global supply chain risk and supply chain resilience: The role of mitigating strategies. Supply Chain. Manag. Int. J. 2020, 26, 240–255. [Google Scholar] [CrossRef]
- Rao, C.; Xiao, X.; Goh, M.; Zheng, J.; Wen, J. Compound mechanism design of supplier selection based on multi-attribute auction and risk management of supply chain. Comput. Ind. Eng. 2017, 105, 63–75. [Google Scholar] [CrossRef]
- Brown, T. Measurement of mineral supply diversity and its importance in assessing risk and criticality. Resour. Policy 2018, 58, 202–218. [Google Scholar] [CrossRef]
- Botha, A.; Badenhorst-Weiss, J.A. Risk management in a bulk coal export logistic chain: A stakeholder perspective. J. Transp. Supply Chain. Manag. 2019, 13, 1–16. [Google Scholar] [CrossRef]
- Li, W.; Wu, C.; Dong, H.; Wang, H.; Li, M. Risk measurement and optimization model of coal generation contracts for the difference between prospect MV and normal triangular fuzzy stochastic variables. Kybernetes 2016, 45, 1323–1339. [Google Scholar] [CrossRef]
- Wang, D.; Shi, Y.; Wan, K. Integrated evaluation of the carrying capacities of mineral resource-based cities considering synergy between subsystems. Ecol. Indic. 2020, 108, 105701. [Google Scholar] [CrossRef]
- Scholten, K.; Scott, P.S.; Fynes, B. Mitigation processes–antecedents for building supply chain resilience capabilities. Supply Chain. Manag. 2014, 19, 211–228. [Google Scholar] [CrossRef]
- Jüttner, U.; Maklan, S. Supply chain resilience in the global financial crisis: An empirical study. Supply Chain. Manag. Int. J. 2011, 16, 246–259. [Google Scholar] [CrossRef]
- Holling, C.S. Engineering Resilience Versus Ecological Resilience; The National Academies Press: Washington, DC, USA, 1996. [Google Scholar]
- Sharifi, A.; Yamagata, Y. Principles and criteria for assessing urban energy resilience: A literature review. Renew. Sustain. Energy Rev. 2016, 60, 1654–1677. [Google Scholar] [CrossRef]
- Wang, X.; Li, M. Determinants of regional economic resilience to economic crisis: Evidence from Chinese economies. Sustainability 2022, 14, 1–25. [Google Scholar] [CrossRef]
- Gong, H.W.; Hassink, R.; Tan, J.; Huang, D.C. Regional resilience in times of a pandemic crisis: The case of COVID-19 in China. Tijdschr. Voor Econ. En Soc. Geogr. 2020, 111, 497–512. [Google Scholar] [CrossRef] [PubMed]
- Kong, J.; Zhang, C.; Simonovic, S.P. A two-stage restoration resource allocation model for enhancing the resilience of interdependent infrastructure systems. Sustainability 2019, 11, 1–16. [Google Scholar] [CrossRef]
- Ouyang, M.; Dueñas-Osorio, L.; Min, X. A three-stage resilience analysis framework for urban infrastructure systems. Struct. Saf. 2012, 36, 23–31. [Google Scholar] [CrossRef]
- Zouari, D.; Ruel, S.; Viale, L. Does digitalising the supply chain contribute to its resilience? Int. J. Phys. Distrib. Logist. Manag. 2020, 51, 149–180. [Google Scholar] [CrossRef]
- Karbassi Yazdi, A.; Mehdiabadi, A.; Wanke, P.F.; Monajemzadeh, N.; Luiz Correa, H.; Tan, Y. Developing supply chain resilience: A robust multi-criteria decision analysis method for transportation service provider selection under uncertainty. Int. J. Manag. Sci. Eng. Manag. 2022, 1–14. [Google Scholar] [CrossRef]
- Wang, Z.; Chen, Z.; Ma, C.; Wennersten, R.; Sun, Q. Nationwide Evaluation of Urban Energy System Resilience in China Using a Comprehensive Index Method. Sustainability 2022, 14, 2077. [Google Scholar] [CrossRef]
- Linkov, I.; Eisenberg, D.A.; Bates, M.E. Measurable resilience for actionable policy. Environ. Sci. Technol. 2013, 47, 10108–10110. [Google Scholar] [CrossRef]
- Roege, P.E.; Collier, Z.A.; Mancillas, J.; McDonagh, J.A.; Linkov, L. Metrics for energy resilience. Energy Policy 2014, 72, 249–256. [Google Scholar] [CrossRef]
- Qiao, H.; Pei, J. Urban stormwater resilience assessment method based on cloud model and TOPSIS. Int. J. Environ. Res. Public Health 2021, 19, 38. [Google Scholar] [CrossRef] [PubMed]
- Chen, Z.; Tang, B.; Zhang, Y. Analysis of spatio-temporal characteristics of urban economic resilience and influencing factors in Guangdong-Hong Kong-Macao Greater Bay Area. Front. Public Health 2022, 1913, 1–14. [Google Scholar]
- Rathore, R.; Thakkar, J.J.; Jha, J.K. A quantitative risk assessment methodology and evaluation of food supply chain. Int. J. Logist. Manag. 2017, 28, 1272–1293. [Google Scholar] [CrossRef]
- Ayyildiz, E. Interval valued intuitionistic fuzzy analytic hierarchy process-based green supply chain resilience evaluation methodology in post COVID-19 era. Environ. Sci. Pollut. Res. 2021. [Google Scholar] [CrossRef]
- Xun, X.; Yuan, Y. Research on the urban resilience evaluation with hybrid multiple attribute TOPSIS method: An example in China. Nat. Hazards 2020, 103, 557–577. [Google Scholar] [CrossRef]
- Cai, B.; Zhang, Y.P.; Wang, H.F.; Liu, Y.H.; Ji, R.J.; Gao, C.T.; Kong, X.D.; Liu, J. Resilience evaluation methodology of engineering systems with dynamic-Bayesian-network-based degradation and maintenance. Reliab. Eng. Syst. Saf. 2021, 209, 107464. [Google Scholar] [CrossRef]
- Afgan, N.; Veziroglu, A. Sustainable resilience of hydrogen energy system. Int. J. Hydrog. Energy 2012, 37, 5461–5467. [Google Scholar] [CrossRef]
- Mulyono, N.B. Mutual support in energy sector: Toward energy resilience. Procedia Comput. Sci. 2015, 60, 1041–1050. [Google Scholar] [CrossRef]
- He, P.; Ng, T.S.; Su, B. Energy-economic recovery resilience with Input-Output linear programming models. Energy Econ. 2017, 68, 177–191. [Google Scholar] [CrossRef]
- Wang, D.L.; Wang, Y.D.; Huang, Z.Y.; Cui, R. Understanding the resilience of coal industry ecosystem to economic shocks: Influencing factors, dynamic evolution and policy suggestions. Resour Policy 2020, 67, 101682. [Google Scholar] [CrossRef]
- Pettit, T.J.; Croxton, K.L.; Fiksel, J. Ensuring supply chain resilience: Development and implementation of an assessment tool. J. Bus. Logist. 2013, 34, 46–76. [Google Scholar] [CrossRef]
- Li, B.; Xiang, P.C.; Hu, M.M.; Zhang, C.B.; Dong, l. The vulnerability of industrial symbiosis: A case study of Qijiang Industrial Park, China. J. Clean. Prod. 2017, 157, 267–277. [Google Scholar] [CrossRef]
- Wang, X.; Zhang, C.; Deng, J.; Su, C.; Gao, Z.J. Analysis of factors influencing miners’ unsafe behaviors in intelligent mines using a novel hybrid MCDM model. Int. J. Environ. Res. Public Health 2022, 19, 7368. [Google Scholar] [CrossRef] [PubMed]
- Selway, M.; Stumptner, M.; Mayer, W.; Jordan, A.; Grossmann, G.; Schrefl, M. A conceptual framework for large-scale ecosystem interoperability and industrial product lifecycles. Data Knowl. Eng. 2017, 109, 85–111. [Google Scholar] [CrossRef]
- Yu, Z.; Xiao, R.; Li, X. A Resilience Approach to Symbiosis Networks of Ecoindustrial Parks Based on Cascading Failure Model. Math. Probl. Eng. 2013, 2013, 372368. [Google Scholar] [CrossRef]
- Wen, H.; Mi, W.; Fan, S.; Liu, M.; Cheng, X.; Wang, H. Determining the reasonable volume required to inject liquid CO2 into a single hole and displace CH4 within the coal seam in bedding boreholes: Case study of SangShuPing coal mine. Energy 2022, 266, 126522. [Google Scholar] [CrossRef]
- Neves, A.; Godina, R.; Azevedo, S.; Matias, J.C.O. A comprehensive review of industrial symbiosis. J. Clean. Prod. 2019, 247, 119113. [Google Scholar] [CrossRef]
- Li, X.; Xiao, R. Analyzing network topological characteristics of eco-industrial parks from the perspective of resilience: A case study. Ecol. Indic. 2017, 74, 403–413. [Google Scholar] [CrossRef]
- Zhou, C.S.; Shi, C.Y.; Wang, S.J.; Zhang, G.J. Estimation of eco-efficiency and its influencing factors in Guangdong province based on Super-SBM and panel regression models. Ecol. Indic. 2018, 86, 67–80. [Google Scholar] [CrossRef]
- Mendel, J.M.; John, R.I.; Liu, F. Interval Type-2 Fuzzy Logic Systems Made Simple. IEEE Trans. Fuzzy Syst. 2006, 14, 808–821. [Google Scholar] [CrossRef]
- Lee, L.W.; Chen, S.M. A new method for fuzzy multiple attributes group decision-making based on the arithmetic operations of interval type-2 fuzzy sets. International Conference on Machine Learning & Cybernetics. IEEE 2008, 6, 3084–3089. [Google Scholar]
- Ju, Y.; Ju, D.; Wang, A.; Ju, M.Y. GRP method for multiple attribute group decision making under trapezoidal interval type-2 fuzzy environment. J. Intell. Fuzzy Syst. 2017, 33, 3469–3482. [Google Scholar] [CrossRef]
- Saaty, R.W. The analytic hierarchy process—What it is and how it is used. Math. Model. 1987, 9, 161–176. [Google Scholar] [CrossRef]
- Buckley, J.J.; Feuring, T.; Hayashi, Y. Fuzzy hierarchical analysis. IEEE Int. Conf. Fuzzy Syst. 1999, 5, 1009–1013. [Google Scholar]
- Aczel, J.; Alsina, C. On synthesis of judgements. Socio-Econ. Plan. Sci. 1986, 20, 333–339. [Google Scholar] [CrossRef]
- Ishizaka, A.; Labib, A. Selection of new production facilities with the Group Analytic Hierarchy Process Ordering method. Expert Syst. Appl. 2011, 38, 7317–7325. [Google Scholar] [CrossRef]
- Amenta, P.; Ishizaka, A.; Lucadamo, A.; Marcarelli, G.; Vyas, V. Computing a common preference vector in a complex multi-actor and multi-group decision system in Analytic Hierarchy Process context. Ann. Oper. Res. 2020, 284, 33–62. [Google Scholar] [CrossRef]
- Duleba, S.; Szadoczki, Z. Comparing aggregation methods in large-scale group AHP: Time for the shift to distance-based aggregation. Expert Syst. Appl. 2022, 196, 116667. [Google Scholar] [CrossRef]
- Tversky, D.K.A. Prospect Theory: An Analysis of Decision under Risk. Econometrica 1979, 47, 263–292. [Google Scholar]
- Hwang, C.L.; Yoon, K.P. Multiple Attribute Decision Making: Methods and Applications. A State-of-the-Art Survey; Springer: Berlin/Heidelberg, Germany, 2011. [Google Scholar] [CrossRef]
Figure 1.
Flow chart for calculating indicator weights.

Figure 2.
Flow chart for resilience evaluation and calculation based on Type-2F-PT-TOPSIS.

Figure 3.
Technical roadmap for coal industrial chain and supply chain resilience evaluation.


Table 1.
Indicator system for evaluating the resilience of coal industrial chain and supply chain.
| Primary Indicator | Secondary Indicator |
|---|---|
| Preparedness A | Risk management A1 |
| Scale of emergency coal reserves A2 | |
| Absorptive capacity B | Diversity of emergency behavior B1 |
| Efficiency of information transfer B2 | |
| Coal emergency reserve security capacity B3 | |
| Recovery capacity C | Industrial technology level C1 |
| Service organization development level C2 | |
| Competitiveness of industrial resources C3 | |
| Redundancy of coal C4 | |
| Adaptability D | Scientific and technological innovation capacity D1 |
| Level of product market developmentD2 | |
| Coal emergency reserve mechanism D3 | |
| Coal emergency transport layout D4 |
Table 2.
The relationship between the semantic values and the interval type-2 fuzzy numbers.
| Semantic Value | Interval Type-2 Fuzzy Number | Reciprocal Value of Interval Type-2 Fuzzy Number |
|---|---|---|
| Extremely strong (AS) | ((7, 8, 9, 9; 1, 1), (7.2, 8.2, 8.8, 9; 0.8, 0.8)) | ((0.11, 0.11, 0.12, 0.14; 1, 1), (0.11, 0.11, 0.12, 0.14; 0.8, 0.8)) |
| Very strong (VS) | ((5, 6, 8, 9; 1, 1), (5.2, 6.2, 7.8, 8.8; 0.8, 0.8)) | ((0.11, 0.12, 0.17, 0.2; 1, 1), (0.11, 0.13, 0.16, 0.19; 0.8, 0.8)) |
| Generally strong (FS) | ((3, 4, 6, 7; 1, 1)), (3.2, 4.2, 5.8, 6.8; 0.8, 0.8)) | ((0.14, 0.17, 0.25, 0.33; 1, 1), (0.15, 0.17, 0.24, 0.31; 0.8, 0.8)) |
| Slightly strong (SS) | ((1, 2, 4, 5; 1, 1), (1.2, 2.2, 3.8, 4.8; 0.8, 0.8)) | ((0.2, 0.25, 0.5, 1; 1, 1), (0.21, 0.26, 0.45, 0.83; 0.8, 0.8)) |
| Equal (E) | ((1, 1, 1, 1; 1, 1), (1, 1, 1, 1; 1, 1)) | ((1, 1, 1, 1; 1, 1), (1, 1, 1, 1; 1, 1)) |
Table 3.
Relationship between rated linguistic variables and interval type-2 fuzzy numbers.
| Semantic Value | Interval Type-2 Fuzzy Number |
|---|---|
| Very poor (VP) | ((0, 0, 0, 1; 1, 1),(0, 0, 0, 0.5; 0.9, 0.9)) |
| Poor (VP) | ((0, 1, 1, 3; 1, 1),(0.5, 1, 1, 2; 0.9, 0.9)) |
| Less poor (MP) | ((1, 3, 3, 5; 1, 1),(2, 3, 3, 4; 0.9, 0.9)) |
| General (F) | ((3, 5, 5, 7; 1, 1),(4, 5, 5, 6; 0.9, 0.9)) |
| Moderately good (MG) | ((5, 7, 7, 9; 1, 1),(6, 7, 7, 8; 0.9, 0.9)) |
| Good (G) | ((7, 9, 9, 10; 1, 1),(8, 9, 9, 9.5; 0.9, 0.9)) |
| Very good (VG) | ((9, 10, 10, 10; 1, 1),(9.5, 10, 10, 10; 0.9, 0.9)) |
Table 4.
Comparison matrix of the importance of secondary indicators under absorptive capacity.
| Absorptive Capacity | B1 | B2 | B3 |
|---|---|---|---|
| B1 | E, E, E, E | 1/VS, 1/VS, 1/FS, E | 1/FS, E, 1/FS, 1/FS |
| B2 | VS, FS, FS, E | E, E, E, E | E, 1/AS, E, 1/SS |
| B3 | FS, E, FS, FS | E, AS, E, SS | E, E, E, E |
Table 5.
Expert 1’s fuzzy weights for the evaluation of secondary indicators under the absorptive capacity dimension.
Table 5.
Expert 1’s fuzzy weights for the evaluation of secondary indicators under the absorptive capacity dimension.
| Expert 1 | |
|---|---|
| B1 | ((0.0738, 0.0748, 0.0833, 0.0922; 1, 1), (0.0739, 0.0752, 0.0819, 0.0900; 0.8, 0.8)) |
| B2 | ((0.5024, 0.4938, 0.4803, 0.4729; 1, 1), (0.5005, 0.4924, 0.4817, 0.4745; 0.8, 0.8)) |
| B3 | ((0.4237, 0.4314, 0.4364, 0.4349; 1, 1), (0.4257, 0.4324, 0.4364, 0.4354; 0.8, 0.8)) |
Table 6.
Expert 2’s fuzzy weights for the evaluation of secondary indicators under the absorptive capacity dimension.
Table 6.
Expert 2’s fuzzy weights for the evaluation of secondary indicators under the absorptive capacity dimension.
| Expert 2 | |
|---|---|
| B1 | ((0.1671, 0.1661, 0.1741, 0.1837; 1, 1), (0.1667, 0.1659, 0.1733, 0.1815; 0.8, 0.8)) |
| B2 | ((0.2216, 0.2303, 0.2511, 0.2650; 1, 1), (0.2237, 0.2329, 0.2492, 0.2624; 0.8, 0.8)) |
| B3 | ((0.6113, 0.6036, 0.5748, 0.5512; 1, 1), (0.6097, 0.6011, 0.5774, 0.5562; 0.8, 0.8)) |
Table 7.
Expert 3’s fuzzy weights for the evaluation of secondary indicators under the absorptive capacity dimension.
Table 7.
Expert 3’s fuzzy weights for the evaluation of secondary indicators under the absorptive capacity dimension.
| Expert 3 | |
|---|---|
| B1 | ((0.0866, 0.0871, 0.0984, 0.1116; 1, 1), (0.0864, 0.0876, 0.0966, 0.1084; 0.8, 0.8)) |
| B2 | ((0.4567, 0.4565, 0.4508, 0.4442; 1, 1), (0.4568, 0.4562, 0.4517, 0.4458; 0.8, 0.8)) |
| B3 | ((0.4567, 0.4565, 0.4508, 0.4442; 1, 1), (0.4568, 0.4562, 0.4517, 0.4458; 0.8, 0.8)) |
Table 8.
Expert 4’s fuzzy weights for the evaluation of secondary indicators under the absorptive capacity dimension.
Table 8.
Expert 4’s fuzzy weights for the evaluation of secondary indicators under the absorptive capacity dimension.
| Expert 4 | |
|---|---|
| B1 | ((0.2050, 0.1731, 0.1462, 0.1397; 1, 1), (0.1965, 0.1689, 0.1478, 0.1409; 0.8, 0.8)) |
| B2 | ((0.2293, 0.1981, 0.1842, 0.2014; 1, 1), (0.2206, 0.1944, 0.1834, 0.1954; 0.8, 0.8)) |
| B3 | ((0.5656, 0.6289, 0.6695, 0.6589; 1, 1), (0.5829, 0.6367, 0.6688, 0.6637; 0.8, 0.8)) |
Table 9.
Normal and defuzzified weights for the indicator system.
| Indicator | Defuzzified Weights | Normal Weights |
|---|---|---|
| A | 0.011 | 0.05 |
| A1 | 0.033 | 0.14 |
| A2 | 0.205 | 0.86 |
| B | 0.953 | 0.40 |
| B1 | 0.035 | 0.15 |
| B2 | 0.712 | 0.30 |
| B3 | 0.132 | 0.55 |
| C | 0.105 | 0.44 |
| C1 | 0.131 | 0.55 |
| C2 | 0.026 | 0.11 |
| C3 | 0.055 | 0.23 |
| C4 | 0.026 | 0.11 |
| D | 0.026 | 0.11 |
| D1 | 0.117 | 0.49 |
| D2 | 0.016 | 0.07 |
| D3 | 0.046 | 0.20 |
| D4 | 0.058 | 0.25 |
Table 10.
Global weights of the indicator system.
| Global Weights | ||
|---|---|---|
| A | 0.05 | |
| A1 | 0.14 | 0.01 |
| A2 | 0.86 | 0.04 |
| B | 0.40 | |
| B1 | 0.15 | 0.06 |
| B2 | 0.30 | 0.12 |
| B3 | 0.55 | 0.22 |
| C | 0.44 | |
| C1 | 0.55 | 0.24 |
| C2 | 0.11 | 0.05 |
| C3 | 0.23 | 0.10 |
| C4 | 0.11 | 0.05 |
| D | 0.11 | |
| D1 | 0.49 | 0.05 |
| D2 | 0.07 | 0.01 |
| D3 | 0.20 | 0.02 |
| D4 | 0.25 | 0.03 |
Table 11.
Resilience rating scale of Shaanxi Province coal industrial chain and supply chain (2018).
Table 11.
Resilience rating scale of Shaanxi Province coal industrial chain and supply chain (2018).
| Expert | 2018 | ||||||||||||
|---|---|---|---|---|---|---|---|---|---|---|---|---|---|
| A1 | A2 | B1 | B2 | B3 | C1 | C2 | C3 | C4 | D1 | D2 | D3 | D4 | |
| K1 | F | G | F | F | MG | F | MG | MG | G | F | MG | F | F |
| K2 | G | MG | MG | G | MG | F | F | G | G | F | G | F | F |
| K3 | MG | F | MG | G | MG | F | F | MG | VG | MP | G | F | MP |
| K4 | F | MG | F | MG | G | MP | F | G | MG | F | VG | F | MP |
Table 12.
Resilience rating scale of Shaanxi Province coal industrial chain and supply chain (2019).
Table 12.
Resilience rating scale of Shaanxi Province coal industrial chain and supply chain (2019).
| Expert | 2019 | ||||||||||||
|---|---|---|---|---|---|---|---|---|---|---|---|---|---|
| A1 | A2 | B1 | B2 | B3 | C1 | C2 | C3 | C4 | D1 | D2 | D3 | D4 | |
| F | MG | MG | F | MG | MG | F | G | MG | F | G | F | F | |
| MG | MG | G | G | MG | F | F | G | F | F | G | F | F | |
| MG | MG | F | G | G | F | MG | G | MG | MP | VG | F | MP | |
| F | F | F | VG | VG | MP | F | MG | G | F | G | F | MP | |
Table 13.
Resilience rating scale of Shaanxi Province coal industrial chain and supply chain (2020).
Table 13.
Resilience rating scale of Shaanxi Province coal industrial chain and supply chain (2020).
| Expert | 2020 | ||||||||||||
|---|---|---|---|---|---|---|---|---|---|---|---|---|---|
| A1 | A2 | B1 | B2 | B3 | C1 | C2 | C3 | C4 | D1 | D2 | D3 | D4 | |
| K1 | MG | MG | MP | MG | MG | F | MG | VG | F | F | MG | F | MG |
| K2 | MG | MG | MG | F | F | MG | MP | G | F | MG | F | MG | MG |
| K3 | MP | F | MP | F | MG | G | F | MG | MG | MG | MG | MG | F |
| K4 | F | F | F | MP | MG | F | F | MG | MG | F | F | MG | MG |
Table 14.
Resilience rating scale of Shaanxi Province coal industrial chain and supply chain (2021).
Table 14.
Resilience rating scale of Shaanxi Province coal industrial chain and supply chain (2021).
| Expert | 2021 | ||||||||||||
|---|---|---|---|---|---|---|---|---|---|---|---|---|---|
| A1 | A2 | B1 | B2 | B3 | C1 | C2 | C3 | C4 | D1 | D2 | D3 | D4 | |
| K1 | MG | G | MP | F | MG | MG | MG | MG | F | MG | G | G | MG |
| K2 | G | MG | F | MG | G | MG | MG | G | MP | MG | F | MG | MG |
| K3 | F | MG | MG | MP | G | G | MG | G | F | F | MG | MG | F |
| K4 | MG | F | MG | F | VG | G | F | VG | F | MG | G | G | MG |
Table 15.
Expert rating aggregation form (2018).
| 2018 | |
|---|---|
| A1 | ((0.0042, 0.0063, 0.0063, 0.0081; 1, 1), (0.0053, 0.0063, 0.0063, 0.0072; 0.9, 0.9)) |
| A2 | ((0.0191, 0.0274, 0.0274, 0.0347; 1, 1), (0.0233, 0.0274, 0.0274, 0.0311; 0.9, 0.9)) |
| B1 | ((0.0232, 0.0355, 0.0355, 0.0476; 1, 1), (0.0294, 0.0355, 0.0355, 0.0416; 0.9, 0.9)) |
| B2 | ((0.0625, 0.0876, 0.0876, 0.1069; 1, 1), (0.0751, 0.0876, 0.0876, 0.0974; 0.9, 0.9)) |
| B3 | ((0.1197, 0.1640, 0.1640, 0.2033; 1, 1), (0.1418, 0.1640, 0.1640, 0.1837; 0.9, 0.9)) |
| C1 | ((0.0547, 0.1056, 0.1056, 0.1544; 1, 1), (0.0807, 0.1056, 0.1056, 0.1301; 0.9, 0.9)) |
| C2 | ((0.0170, 0.0272, 0.0272, 0.0373; 1, 1), (0.0221, 0.0272, 0.0272, 0.0322; 0.9, 0.9)) |
| C3 | ((0.0592, 0.0794, 0.0794, 0.0949; 1, 1), (0.0693, 0.0794, 0.0794, 0.0872; 0.9, 0.9)) |
| C4 | ((0.0343, 0.0434, 0.0434, 0.0487; 1, 1), (0.0389, 0.0434, 0.0434, 0.0461; 0.9, 0.9)) |
| D1 | ((0.0114, 0.0220, 0.0220, 0.0322; 1, 1), (0.0168, 0.0220, 0.0220, 0.0271; 0.9, 0.9)) |
| D2 | ((0.0069, 0.0087, 0.0087, 0.0097; 1, 1), (0.0078, 0.0087, 0.0087, 0.0092; 0.9, 0.9)) |
| D3 | ((0.0060, 0.0100, 0.0100, 0.0140; 1, 1), (0.0080, 0.0100, 0.0100, 0.0120; 0.9, 0.9)) |
| D4 | ((0.0052, 0.0116, 0.0116, 0.0177; 1, 1), (0.0085, 0.0116, 0.0116, 0.0147; 0.9, 0.9)) |
Table 16.
Expert rating aggregation form (2019).
| 2019 | |
|---|---|
| A1 | ((0.0039, 0.0059, 0.0059, 0.0079; 1, 1), (0.0049, 0.0059, 0.0059, 0.0069; 0.9, 0.9)) |
| A2 | ((0.0176, 0.0257, 0.0257, 0.0338; 1, 1), (0.0217, 0.0257, 0.0257, 0.0298; 0.9, 0.9)) |
| B1 | ((0.0253, 0.0378, 0.0378, 0.0489; 1, 1), (0.0316, 0.0378, 0.0378, 0.0434; 0.9, 0.9)) |
| B2 | ((0.0724, 0.0957, 0.0957, 0.1098; 1, 1), (0.0843, 0.0957, 0.0957, 0.1029; 0.9, 0.9)) |
| B3 | ((0.1386, 0.1793, 0.1793, 0.2087; 1, 1), (0.1591, 0.1793, 0.1793, 0.1943; 0.9, 0.9)) |
| C1 | ((0.0622, 0.1149, 0.1149, 0.1645; 1, 1), (0.0893, 0.1149, 0.1149, 0.1398; 0.9, 0.9)) |
| C2 | ((0.0170, 0.0272, 0.0272, 0.0373; 1, 1), (0.0221, 0.0272, 0.0272, 0.0322; 0.9, 0.9)) |
| C3 | ((0.0644, 0.0845, 0.0845, 0.0974; 1, 1), (0.0744, 0.0845, 0.0845, 0.0910; 0.9, 0.9)) |
| C4 | ((0.0239, 0.0343, 0.0343, 0.0434; 1, 1), (0.0291, 0.0343, 0.0343, 0.0389; 0.9, 0.9)) |
| D1 | ((0.0114, 0.0220, 0.0220, 0.0322; 1, 1), (0.0168, 0.0220, 0.0220, 0.0271; 0.9, 0.9)) |
| D2 | ((0.0075, 0.0092, 0.0092, 0.0100; 1, 1), (0.0084, 0.0092, 0.0092, 0.0096; 0.9, 0.9)) |
| D3 | ((0.0060, 0.0100, 0.0100, 0.0140; 1, 1), (0.0080, 0.0100, 0.0100, 0.0120; 0.9, 0.9)) |
| D4 | ((0.0052, 0.0116, 0.0116, 0.0177; 1, 1), (0.0085, 0.0116, 0.0116, 0.0147; 0.9, 0.9)) |
Table 17.
Expert rating aggregation form (2020).
| 2020 | |
|---|---|
| A1 | ((0.0029, 0.0052, 0.0052, 0.0073; 1, 1), (0.0041, 0.0052, 0.0052, 0.0063; 0.9, 0.9)) |
| A2 | ((0.0155, 0.0237, 0.0237, 0.0317; 1, 1), (0.0196, 0.0237, 0.0237, 0.0277; 0.9, 0.9)) |
| B1 | ((0.0118, 0.0253, 0.0253, 0.0378; 1, 1), (0.0188, 0.0253, 0.0253, 0.0316; 0.9, 0.9)) |
| B2 | ((0.0311, 0.0574, 0.0574, 0.0822; 1, 1), (0.0447, 0.0574, 0.0574, 0.0699; 0.9, 0.9)) |
| B3 | ((0.0968, 0.1416, 0.1416, 0.1859; 1, 1), (0.1193, 0.1416, 0.1416, 0.1638; 0.9, 0.9)) |
| C1 | ((0.1011, 0.1512, 0.1512, 0.1956; 1, 1), (0.1263, 0.1512, 0.1512, 0.1736; 0.9, 0.9)) |
| C2 | ((0.0130, 0.0239, 0.0239, 0.0343; 1, 1), (0.0186, 0.0239, 0.0239, 0.0291; 0.9, 0.9)) |
| C3 | ((0.0630, 0.0815, 0.0815, 0.0949; 1, 1), (0.0723, 0.0815, 0.0815, 0.0883; 0.9, 0.9)) |
| C4 | ((0.0194, 0.0296, 0.0296, 0.0397; 1, 1), (0.0245, 0.0296, 0.0296, 0.0346; 0.9, 0.9)) |
| D1 | ((0.0194, 0.0296, 0.0296, 0.0397; 1, 1), (0.0245, 0.0296, 0.0296, 0.0346; 0.9, 0.9)) |
| D2 | ((0.0039, 0.0059, 0.0059, 0.0079; 1, 1), (0.0049, 0.0059, 0.0059, 0.0069; 0.9, 0.9)) |
| D3 | ((0.0088, 0.0129, 0.0129, 0.0169; 1, 1), (0.0108, 0.0129, 0.0129, 0.0149; 0.9, 0.9)) |
| D4 | ((0.0132, 0.0193, 0.0193, 0.0254; 1, 1), (0.0163, 0.0193, 0.0193, 0.0223; 0.9, 0.9)) |
Table 18.
Expert rating aggregation form (2021).
| 2021 | |
|---|---|
| A1 | ((0.0048, 0.0069, 0.0069, 0.0087; 1, 1), (0.0058, 0.0069, 0.0069, 0.0078; 0.9, 0.9)) |
| A2 | ((0.0191, 0.0274, 0.0274, 0.0347; 1, 1), (0.0233, 0.0274, 0.0274, 0.0311; 0.9, 0.9)) |
| B1 | ((0.0177, 0.0312, 0.0312, 0.0438; 1, 1), (0.0247, 0.0312, 0.0312, 0.0376; 0.9, 0.9)) |
| B2 | ((0.0311, 0.0574, 0.0574, 0.0822; 1, 1), (0.0447, 0.0574, 0.0574, 0.0699; 0.9, 0.9)) |
| B3 | ((0.1508, 0.1909, 0.1909, 0.2143; 1, 1), (0.1710, 0.1909, 0.1909, 0.2028; 0.9, 0.9)) |
| C1 | ((0.1420, 0.1905, 0.1905, 0.2277; 1, 1), (0.1663, 0.1905, 0.1905, 0.2092; 0.9, 0.9)) |
| C2 | ((0.0220, 0.0322, 0.0322, 0.0423; 1, 1), (0.0271, 0.0322, 0.0322, 0.0372; 0.9, 0.9)) |
| C3 | ((0.0685, 0.0868, 0.0868, 0.0974; 1, 1), (0.0777, 0.0868, 0.0868, 0.0922; 0.9, 0.9)) |
| C4 | ((0.0000, 0.0147, 0.0147, 0.0260; 1, 1), (0.0100, 0.0147, 0.0147, 0.0206; 0.9, 0.9)) |
| D1 | ((0.0220, 0.0323, 0.0322, 0.0423; 1, 1), (0.0271, 0.0322, 0.0322, 0.0372; 0.9, 0.9)) |
| D2 | ((0.0052, 0.0073, 0.0073, 0.0089; 1, 1), (0.0063, 0.0073, 0.0073, 0.0081; 0.9, 0.9)) |
| D3 | ((0.0118, 0.0159, 0.0159, 0.0190; 1, 1), (0.0139, 0.0159, 0.0159, 0.0174; 0.9, 0.9)) |
| D4 | ((0.0132, 0.0193, 0.0193, 0.0254; 1, 1), (0.0163, 0.0193, 0.0193, 0.0223; 0.9, 0.9)) |
Table 19.
Positive and negative ideal solutions for each indicator.
| Indicator | Positive Ideal Solution | Negative Ideal Solution |
|---|---|---|
Table 20.
Distance of corresponding indicators from positive and negative ideal solutions during 2018–2021.
Table 20.
Distance of corresponding indicators from positive and negative ideal solutions during 2018–2021.
| 2018 (+; −) | 2019 (+; −) | 2020 (+; −) | 2021 (+; −) | |
|---|---|---|---|---|
| A1 | 0.0026; 0.0021 | 0.0039; 0.0015 | 0.0066; 0.0000 | 0.0000; 0.0030 |
| A2 | 0.0000; 0.0059 | 0.0063; 0.0036 | 0.0133; 0.0000 | 0.0000; 0.0059 |
| B1 | 0.0083; 0.0150 | 0.0000; 0.0176 | 0.0396; 0.0000 | 0.0224; 0.0092 |
| B2 | 0.0263; 0.0375 | 0.0000; 0.0460 | 0.1036; 0.0000 | 0.1036; 0.0000 |
| B3 | 0.0745; 0.0287 | 0.0350; 0.0451 | 0.1276; 0.0000 | 0.0000; 0.0567 |
| C1 | 0.2111; 0.0000 | 0.1907; 0.1343 | 0.1067; 0.0545 | 0.0000; 0.0938 |
| C2 | 0.0177; 0.0056 | 0.0177; 0.0056 | 0.0279; 0.0000 | 0.0000; 0.0124 |
| C3 | 0.0244; 0.0000 | 0.0096; 0.0076 | 0.0175; 0.0040 | 0.0000; 0.0108 |
| C4 | 0.0000; 0.0364 | 0.0291; 0.0264 | 0.0419; 0.0210 | 0.0820; 0.0000 |
| D1 | 0.0334; 0.0000 | 0.0334; 0.0000 | 0.0100; 0.0114 | 0.0000; 0.0148 |
| D2 | 0.0024; 0.0045 | 0.0000; 0.0053 | 0.0119; 0.0000 | 0.0075; 0.0024 |
| D3 | 0.0200; 0.0000 | 0.0200; 0.0000 | 0.0108; 0.0048 | 0.0000; 0.0089 |
| D4 | 0.0261; 0.0000 | 0.0261; 0.0000 | 0.0000; 0.0116 | 0.0000; 0.0116 |
Disclaimer/Publisher’s Note: The statements, opinions and data contained in all publications are solely those of the individual author(s) and contributor(s) and not of MDPI and/or the editor(s). MDPI and/or the editor(s) disclaim responsibility for any injury to people or property resulting from any ideas, methods, instructions or products referred to in the content. |
© 2023 by the authors. Licensee MDPI, Basel, Switzerland. This article is an open access article distributed under the terms and conditions of the Creative Commons Attribution (CC BY) license (https://creativecommons.org/licenses/by/4.0/).
Share and Cite
MDPI and ACS Style
Wu, A.; Sun, Y.; Zhang, H.; Sun, L.; Wang, X.; Li, B. Research on Resilience Evaluation of Coal Industrial Chain and Supply Chain Based on Interval Type-2F-PT-TOPSIS. Processes 2023, 11, 566. https://doi.org/10.3390/pr11020566
AMA Style
Wu A, Sun Y, Zhang H, Sun L, Wang X, Li B. Research on Resilience Evaluation of Coal Industrial Chain and Supply Chain Based on Interval Type-2F-PT-TOPSIS. Processes. 2023; 11(2):566. https://doi.org/10.3390/pr11020566
Chicago/Turabian StyleWu, Anbo, Yue Sun, Huiling Zhang, Linhui Sun, Xinping Wang, and Boying Li. 2023. "Research on Resilience Evaluation of Coal Industrial Chain and Supply Chain Based on Interval Type-2F-PT-TOPSIS" Processes 11, no. 2: 566. https://doi.org/10.3390/pr11020566
Note that from the first issue of 2016, this journal uses article numbers instead of page numbers. See further details here.