
Combined Effect of Ultrasound and Microwave Power in Tangerine Juice Processing: Bioactive Compounds, Amino Acids, Minerals, and Pathogens

1
Department of Nutrition and Dietetics, Tekirdağ Namik Kemal University, Tekirdağ 59030, Turkey
2
Department of Food Technology, Tekirdag Namık Kemal University, Tekirdag 59830, Turkey
*
Author to whom correspondence should be addressed.
Processes 2022, 10(10), 2100; https://doi.org/10.3390/pr10102100
Submission received: 1 October 2022
/
Revised: 12 October 2022
/
Accepted: 13 October 2022
/
Published: 17 October 2022
(This article belongs to the Special Issue Bio-Active Compounds in Food Production)
Abstract
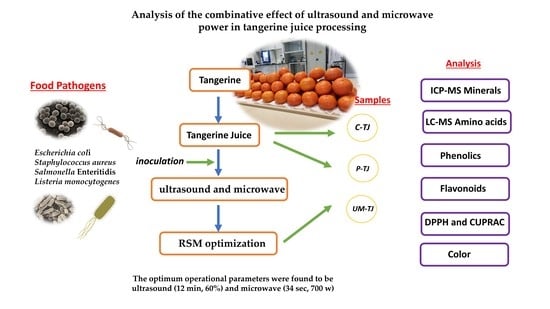
:The inhibition of Escherichia coli ATCC 25922 (E. coli), Staphylococcus aureus ATCC6538 (S. aureus), Salmonella Enteritidis ATCC 13076 (S. Enteritidis), and Listeria monocytogenes DSM12464 (L. monocytogenes) is one of the main aims of the food industry. This study was the first in which the use of ultrasound and microwave power were applied to optimize the values of the bioactive components, amino acids, and mineral compositions of tangerine juice and to inhibit Escherichia coli, Staphylococcus aureus, Salmonella Enteritidis, and Listeria monocytogenes. The response surface methodology (RSM) was used to describe the inactivation kinetics, and the effects of ultrasound treatment time (X1: 12–20 min), ultrasound amplitude (X2:60–100%), microwave treatment time (X3: 30–40 s), and microwave power (X4:200–700 W). The optimum parameters applied to a 5-log reduction in E. coli were determined as ultrasound (12 min, 60%) and microwave (34 s, 700 W). The optimum condition ultrasound–microwave treatment was highly effective in tangerine juice, achieving up to 5.27, 5.12, and 7.19 log reductions for S. aureus, S. Enteritidis, and L. monocytogenes, respectively. Ultrasound–microwave treatment increased the total phenolic compounds and total amino acids. While Cu, K, Mg, and Na contents were increased, Fe and Ca contents were lower in the UM-TJ (ultrasound–microwave-treated tangerine juice) sample. In this case, significant differences were detected in the color values of ultrasound–microwave-treated tangerine juice (UM-TJ) (p < 0.05). The results of this study showed that ultrasound–microwave treatment is a potential alternative processing and preservation technique for tangerine juice, resulting in no significant quality depreciation.
1. Introduction
Citrus, including varieties with high economic value, is a plant family endemic to subtropical climates. Citrus fruits have benefits for human health, such as antioxidant, anti-inflammatory, antitumor, and antimicrobial activities, due to their bioactive compounds (carotenoids, flavonoids, vitamins, and essential oils) [1,2].
Food safety is a global health concern, and pathogenic diseases from bacteria are very important. Fruit juices can support the growth microorganisms such as spoilage microorganisms and foodborne pathogens because they contain a wide variety of important and complex nutrients [3]. Escherichia coli (E. coli) is a Gram-negative bacillus that causes intestinal and extraintestinal illness in humans [4]. E.coli has good adhesion ability to surfaces and internalization in fresh products [5]. There are hundreds of identified E. coli strains, and they cause diverse intra-abdominal, newborn meningitis, urinary tract infections, skin, soft, and pulmonary infections, and intestinal pathologies [6]. Staphylococcus aureus (S. aureus) is among the most impactful foodborne bacterial pathogens. S. aureus can cause septicemia, toxic shock syndrome, fatal endocarditis, and food poisoning [7]. Salmonella Enteritidis (S. Enteritidis) spp. is one of the most frequent foodborne pathogens. Salmonella can survive at low pH [8]. Salmonellosis infection, as a serious health concern, causes gastroenteritis, vomiting, diarrhea, nausea, headache, typhoid fever, septicemia, and death [9]. Listeria monocytogenes (L. monocytogenes) is a stress-resistant foodborne gram-positive pathogen. Although the incidence of listeriosis cases is low, due to the severity of the disease, it has a high fatality rate [10,11,12].
The main fruit juice technology applied is heat treatment. Due to thermal processing, the quality of fruit juice, many compounds can easily be affected [13]. There has been a trend towards new application technologies to prevent the negative impact of pasteurization on the quality characteristics of fruit juices [14].
Ultrasound treatment is a nonthermal technology that is defined as the application of soundwaves with a frequency of ~20 kHz that pass over the human hearing threshold [15,16]. Ultrasound technology has provided good results in terms of maintaining the concentration of bioactive compounds, and the physicochemical, microbiological, and sensory qualities as preservation alternatives for fruit juices [13]. Several fruit and vegetable juice matrices have been studied, such as beetroot [17], pomegranate [18], blackberry [19], apple [20], cloudy apple [21], Chinese bayberry [22], strawberry [23], soursop nectar [24], persimmon [25], and pumpkin juice [26]. Microbial inactivation depends on the ultrasound processing parameters, the type of microorganism, and the food matrix [27]. Due to the low lethality of ultrasound, this technology is frequently combined with other innovative techniques to provide higher inhibition [28,29,30]. Microwave energy causes dielectric heating induced by the rotation of dipoles in foods and brings about the breakdown of the cell walls [31]. Microwaves are electromagnetic waves whose frequencies vary from 300 MHz to 300 GHz [32]. There are several studies in the literature on the advantages and effects of microwaves on food quality [33,34,35]. Microwave treatment has advantages, such as a lower equipment surface temperature, energy efficiency, rapid volumetric heating, uniform heating, and the possible preservation of food quality, thus making it more efficient than conventional heating. A combined process using ultrasound and microwave power can be a good alternative to pasteurization [3,36].
When reviewing the literature, it was found that there was a lack of research on the combination of ultrasound and microwave being applied and modeled with response surface methodology (RSM) in tangerine juice. In this particular study, Gümüldür tangerine (Citrus unshiu Marcovitch) with geographical indication was preferred. The aim of the present study was to optimize a combined microwave and ultrasound process using response surface methodology to achieve E. coli inactivation (five logarithmic cycles) in tangerine juice. At the same time, the amino acids, phenolic compounds, and minerals components in tangerine juice treated with thermal pasteurization and ultrasound–microwave were compared.
2. Materials and Methods
2.1. Obtaining the Tangerine Juice
The type of mandarin used in the study was Gümüldür tangerine (Citrus unshiu Marcovitch) with geographical indication. Tangerines were collected from a local producer (İzmir, Turkey). The tangerines were washed in running water and peeled, and the seeds were removed. They were then cut into two pieces and squeezed using a blender, without any preservative, (Waring Commercial Blender Model HGB2WTS3, St. Louis, MO, USA) to obtain the juice. This was used as a control (without pasteurization or ultrasound–microwave treatment). The control sample was stored in bottles at −18°C until analyses were performed.
2.2. Microbial Strain Preparation and Inoculation in Tangerine Juice
E. coli ATCC 25922, S. aureus ATCC6538, S. Enteritidis ATCC 13076, and L. monocytogenes DSM12464 (Tekirdag Namik Kemal University Nutrition and Dietetic Department Collection) were used in this study. All pathogen strains were stored at −80 °C in brain heart infusion (BHI, Oxoid Ltd., Basingstoke, UK) with 20% glycerol. A loopful of each culture was inoculated in tryptic soy broth (Merck, Darmstadt, Germany) for 24 h at 37 °C, while the culture of L. monocytogenes was incubated in aseptic conditions at 30 °C for 48 h. Three sequential transfers were performed to reinvigorate the bacteria. The concentrations of the cultures were adjusted to 109–1010 CFU/mL using the McFarland standard turbidity. Next, 100 mL of tangerine juice was individually inoculated with an aliquot of 1 mL of E. coli, S. aureus, S. Enteritidis, and L. monocytogenes to obtain a final concentration of approximately 107–108 CFU/mL.
2.3. Thermal Pasteurization, Ultrasound, and Microwave Treatments
Tangerine juice was pasteurized at 85 °C for 2 min in a water bath (WB-22-P Germany) and then cooled to 4 °C. This was the pasteurized tangerine juice [13]. The use of ultrasound as a pre-treatment before microwave is more effective than when used in post-treatment [3]. Microwave treatment after ultrasound treatment was selected for the study since more effective results were obtained in the preliminary analyses. At the same time, in our preliminary studies, U-time (ultrasound treatment time), amplitude, M-time (microwave treatment time) and microwave treatment values were determined to achieve the effective inhibition of test bacteria. The ultrasound treatment was performed in an ultrasonic bath using tangerine juice inoculated with E. coli, S. aureus, S. Enteritidis, and L. monocytogenes (26 kHz, Hielscher Ultrasonics Model UP200St, Berlin, Germany) at 60%, 80%, and 100% amplitude for 12, 16, and 20 min. Fruit juice samples were brought to room temperature before processing. Next, irradiation was carried out in a microwave (Samsung ME711K, Kuala Lumpur, Malaysia) at 200, 450, and 700 W for 30, 35, and 40 s.
2.4. Microbial Analysis
Due to the dilution process, the samples (pasteurization, ultrasound–microwave) were rapidly cooled before plating. Right after the microwave and pasteurization treatments, and the control sample aliquots (1 mL) of tangerine juice were serially diluted to 108, 107, 106, 105, 104, 103, 102, and 101 CFU/mL and spread-plated in triplicate onto Trypticase Soy Agar (Merck, Darmstadt, Germany) culture medium in a standard Petri dish (90 mm). After 48 h at 37 °C, the surviving bacterial count was determined. The inactivation effects of the logarithmic cycles were estimated by log10 N, where N is the microbe level at the end incubation time.
2.5. Modeling Inactivation
The response surface method (RSM) was used to determine the effects of the combination treatments of microwave and ultrasound on the inhibition of food pathogens of tangerine juice. The results and experimental design were analyzed using Minitab Statistical Analysis Software (Minitab version 18.1.1, Minitab Inc., Pittsburgh, PA, USA). Box–Behnken Design (BBD) was used to optimize the process variables. As the four input factors, the ultrasound time, ultrasound amplitude, microwave time, and microwave power were used. The levels and parameters of the inputs are shown in Table 1. According to the coded values formulated in Table 1, a total of 31 experiments were performed to optimize the process variables presented in Table 2.
The response data were applied using the quadratic equation to suit the polynomial equation, as follows:
where represents the predicted response, is the constant coefficient, and are the variables, is the linear coefficient of the input factor , is the quadratic coefficient of the input factor , is the coefficient for the different interactions between input factors and (i ≠ j), and is the error of the model.
2.6. Determination of Bioactive Compounds
The total phenolic contents (TPCs) of the tangerine samples were detected using the Folin–Ciocalteu method. All analyses were performed in triplicate. The absorbance was measured on a UV–VIS spectrophotometer (SP-UV/VIS-300SRB, Spectrum Instruments, Victoria, Australia) at a wavelength of 765 nm. After the measurement, the results were expressed as milligrams of gallic acid equivalents per liter (mg GAE/L) [37]. The total flavonoid content (TFC) was determined according to the colorimetric technique [38]. The concentrations were calculated colorimetrically using a UV spectrophotometer (Spectrum Instrument, SP-UV/VIS-300SRB, Victoria, Australia) at 510 nm. The antioxidant capacity of the tangerine juice was determined using the CUPRAC method (Cu (II) ion-reducing antioxidant capacity), previously described by Apak et al. (2006) [39]. The DPPH scavenging activity method was used to determine the antioxidant activity of the tangerine juice samples, as described by Grajeda-Iglesias et al. (2016) [40].
2.7. Analysis of Amino Acids
The amino acid composition was determined using a method described by Bilgin et al. (2019), with slight modification [41]. Briefly, chromatographic separation was completed in an analysis time of 7.5 min with gradient-programmed mobile phases A and B and a flow of 0.7 mL/min. MS/MS analyses were conducted on an Agilent 6460 triple quadruple LC-MS (Agilent Technologies, Waldbronn, Germany) equipped with an electrospray ionization interface. The mass detector parameters were as follows set: gas temperature 150 °C, gas flow 10 L/min, nebulizer pressure 40 psi and capillary voltage +2000 volts. Analyses were performed with three replicates for each sample. The results are expressed in mg/100 mL.
2.8. Analysis of Minerals
The mineral content of the tangerine juice was determined using a method previously described by Sezer et al. (2019) [42]. For the samples, aluminum (Al), silver (Ag), cobalt (Co), calcium (Ca), copper (Cu), chromium (Cr), iron (Fe), manganese (Mn), magnesium (Mg), sodium (Na), zinc (Zn), nickel (Ni), and lead (Pb) content analyses were performed with a simultaneous inductively coupled plasma atomic emission spectrometer (Thermo Scientific iCap 6000 Dual view, Cheshire, UK). Cadmium (Cd) and potassium (K) quantity analyses were performed with a flame atomic absorption spectrophotometer (Thermo Scientific iCE 3000 Series, Cheshire, UK).
2.9. Determination of Color Parameters
The change in color was checked using a Hunter Lab colorimeter (Color Measuring Device PCE-CSM 5, Marl, Germany). L* is a measure of light and darkness, a* indicates redness-greenness, and b* indicates yellowness-blueness. The chroma (C), hue angle (h), and ΔE (total color change) were expressed according to Equations (2)–(4). Analyses were performed with three replicates for each sample.
2.10. Statistical Analysis
The experimental data were processed using SPSS 22.0 (SPSS Inc., Chicago, IL, USA) and SigmaPlot 12.0 Statistical Analysis (Systat Software, Inc., San Jose, CA, USA) to indicate the variables with statistically significant effects (p < 0.05). The model fit the experimental data, and all the experiments were carried out in a random order. Variance analysis (ANOVA) was performed. The Pearson correlation coefficients were calculated with OriginPro version 2020b (OriginLab, Northampton, MA, USA).
3. Results and Discussion
3.1. Optimization Conditions Inhibition of Pathogens
The experimental and predictive results of the inhibition of the pathogen values in the tangerine juice samples at different amplitudes and microwave times are given in Table 2. The experimental data obtained were subjected to the second-order polynomial regression model. The results of the RSM optimization via the second-order polynomial regression model for the E. coli, S. Enteritidis, S. aureus, and L. monocytogenes responses are given in Equations (5)–(8).
Table 3 shows the analysis of variance (ANOVA) for E. coli, S. aureus, S. Enteritidis, and L. monocytogenes. The linear effects of (p < 0.001) and (p < 0.001) applied to the tangerine juice samples on E. coli, S. aureus, S. Enteritidis, and L. monocytogenes values were found to be statistically significant. The values of the model used in the study for E. coli, S. aureus, S. Enteritidis, and L. monocytogenes were found to fit at 99.85, 99.11, 99.71, and 99.98 levels, respectively (Table 3).
The optimum ultrasound–microwave conditions with RSM were determined for the inactivation (five logarithmic cycles) of E. coli (Table 4). The optimum operational parameters were found to be ultrasound (12 min, 60%) and microwave (34 s, 700 w).
Central composite design (CCD) response surface methodology (RSM) was applied to improve the inhibition properties of the pathogens in the tangerine juice. The experimental values for the inhibition of the pathogens by processed tangerine juice are given in Table 2. Table 3 shows the results of the variance analysis of the data in Table 2, as well as those of the regression analysis. The ANOVA results were used to evaluate the success of the model. The E. coli model, with a high F-value (754.12) and associated low p-value (<0.0001), indicated that the RSM model was highly fitted. It also proved that the model is suitable for the optimization and estimation of variation since the p-value and the F-value of the lack of fit are insignificant. In addition, it had high responses with the coefficient of determination value (99.85%) and the adjusted coefficient of determination value (99.72). A quadratic polynomial regression equation was prepared by RSM to evaluate the relationship between the ultrasound–microwave treatment parameters and the E. coli inhibition parameters in Table 2. The equation is given below (5).
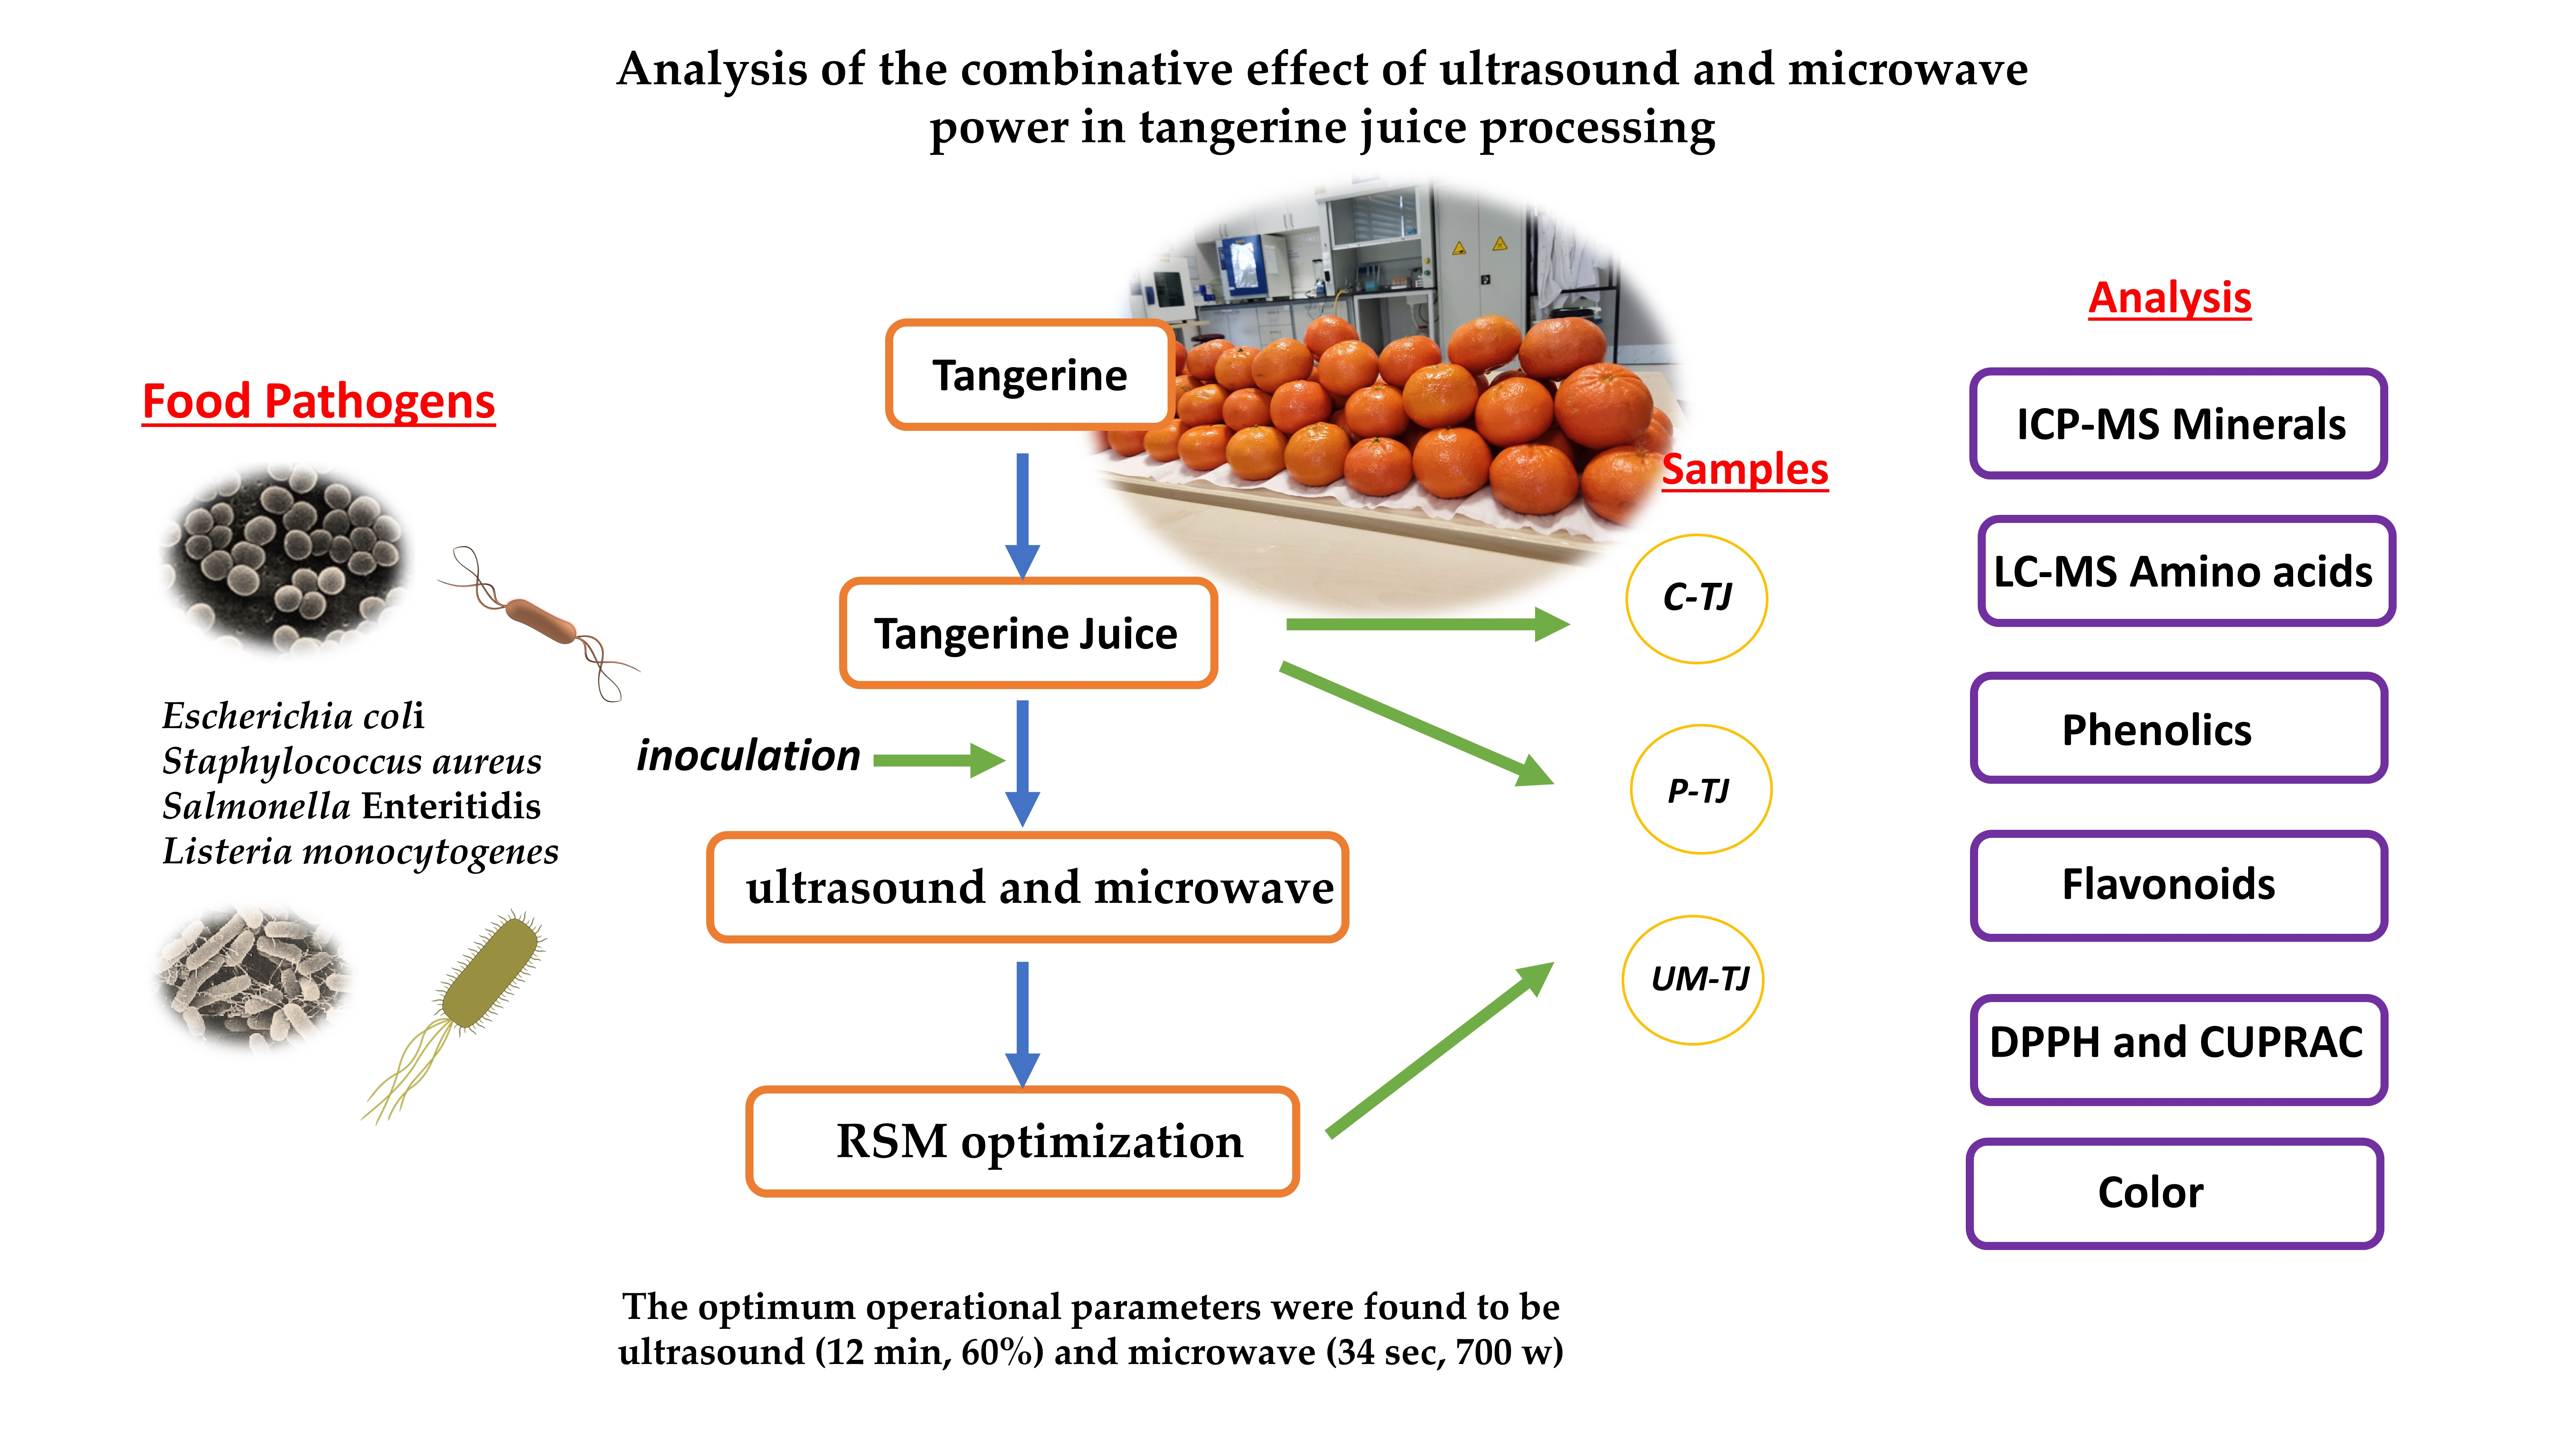
Analyses of the independent variables revealed that , , , , , and were all statistically significant (p < 0.05, p < 0.001). Three-dimensional response surface plots were drawn to more intuitively show the effect of the ultrasound–microwave combination application on E. coli inactivation (Figure 1). The results in the figure show that E. coli inactivation was positively correlated with the ultrasound–microwave parameters. It was determined that E. coli inactivation in the tangerine juice increased at longer and higher , , and values. The optimization conditions of 12 min of ultrasound time, 60% amplitude, 34 s of microwave time, and 700 W power application were determined to validate the predictive model (Table 4). Under these conditions, the E. coli was reduced to 5.0 log CFU/mL. Based on the optimum conditions, the inactivation value was determined as 5.1 log CFU/mL after three replicate experiments. These results confirm that the model was reliable, practical, and accurate in this study.
Similarly to this study, Kernou et al. [3] reported that an 8-log reduction in E. coli ATCC 25922 was obtained in orange juice using microwave at 900 W for 30 s after 20 min of ultrasound treatment. Zia et al. (2019) reported that microwave treatment significantly increased microbial inactivity as compared to ultrasound and control of the sugar cane juice [43]. According to Traore et al. (2020), the ultrasound treatment of cabbage significantly inactivated E. coli and Salmonella spp. The authors correlated the loss of the metabolic potentiality to the loss of bacterial membrane integrity [44]. Samani et al. (2018) used RSM for the optimization of sour cherry juice, reducing the E. coli content to zero, with minimum energy consumption and maximum vitamin C retention. The researchers found that the optimization values were 352.21 W of microwave power, a 49.94 °C temperature, 475.13 W of ultrasound power, and 6 min of exposure time [45].
As shown below, a quadratic polynomial regression Equation (6) was created by RSM to evaluate the relationship between the ultrasound–microwave treatment parameters and S. aureus inhibition in Table 2.
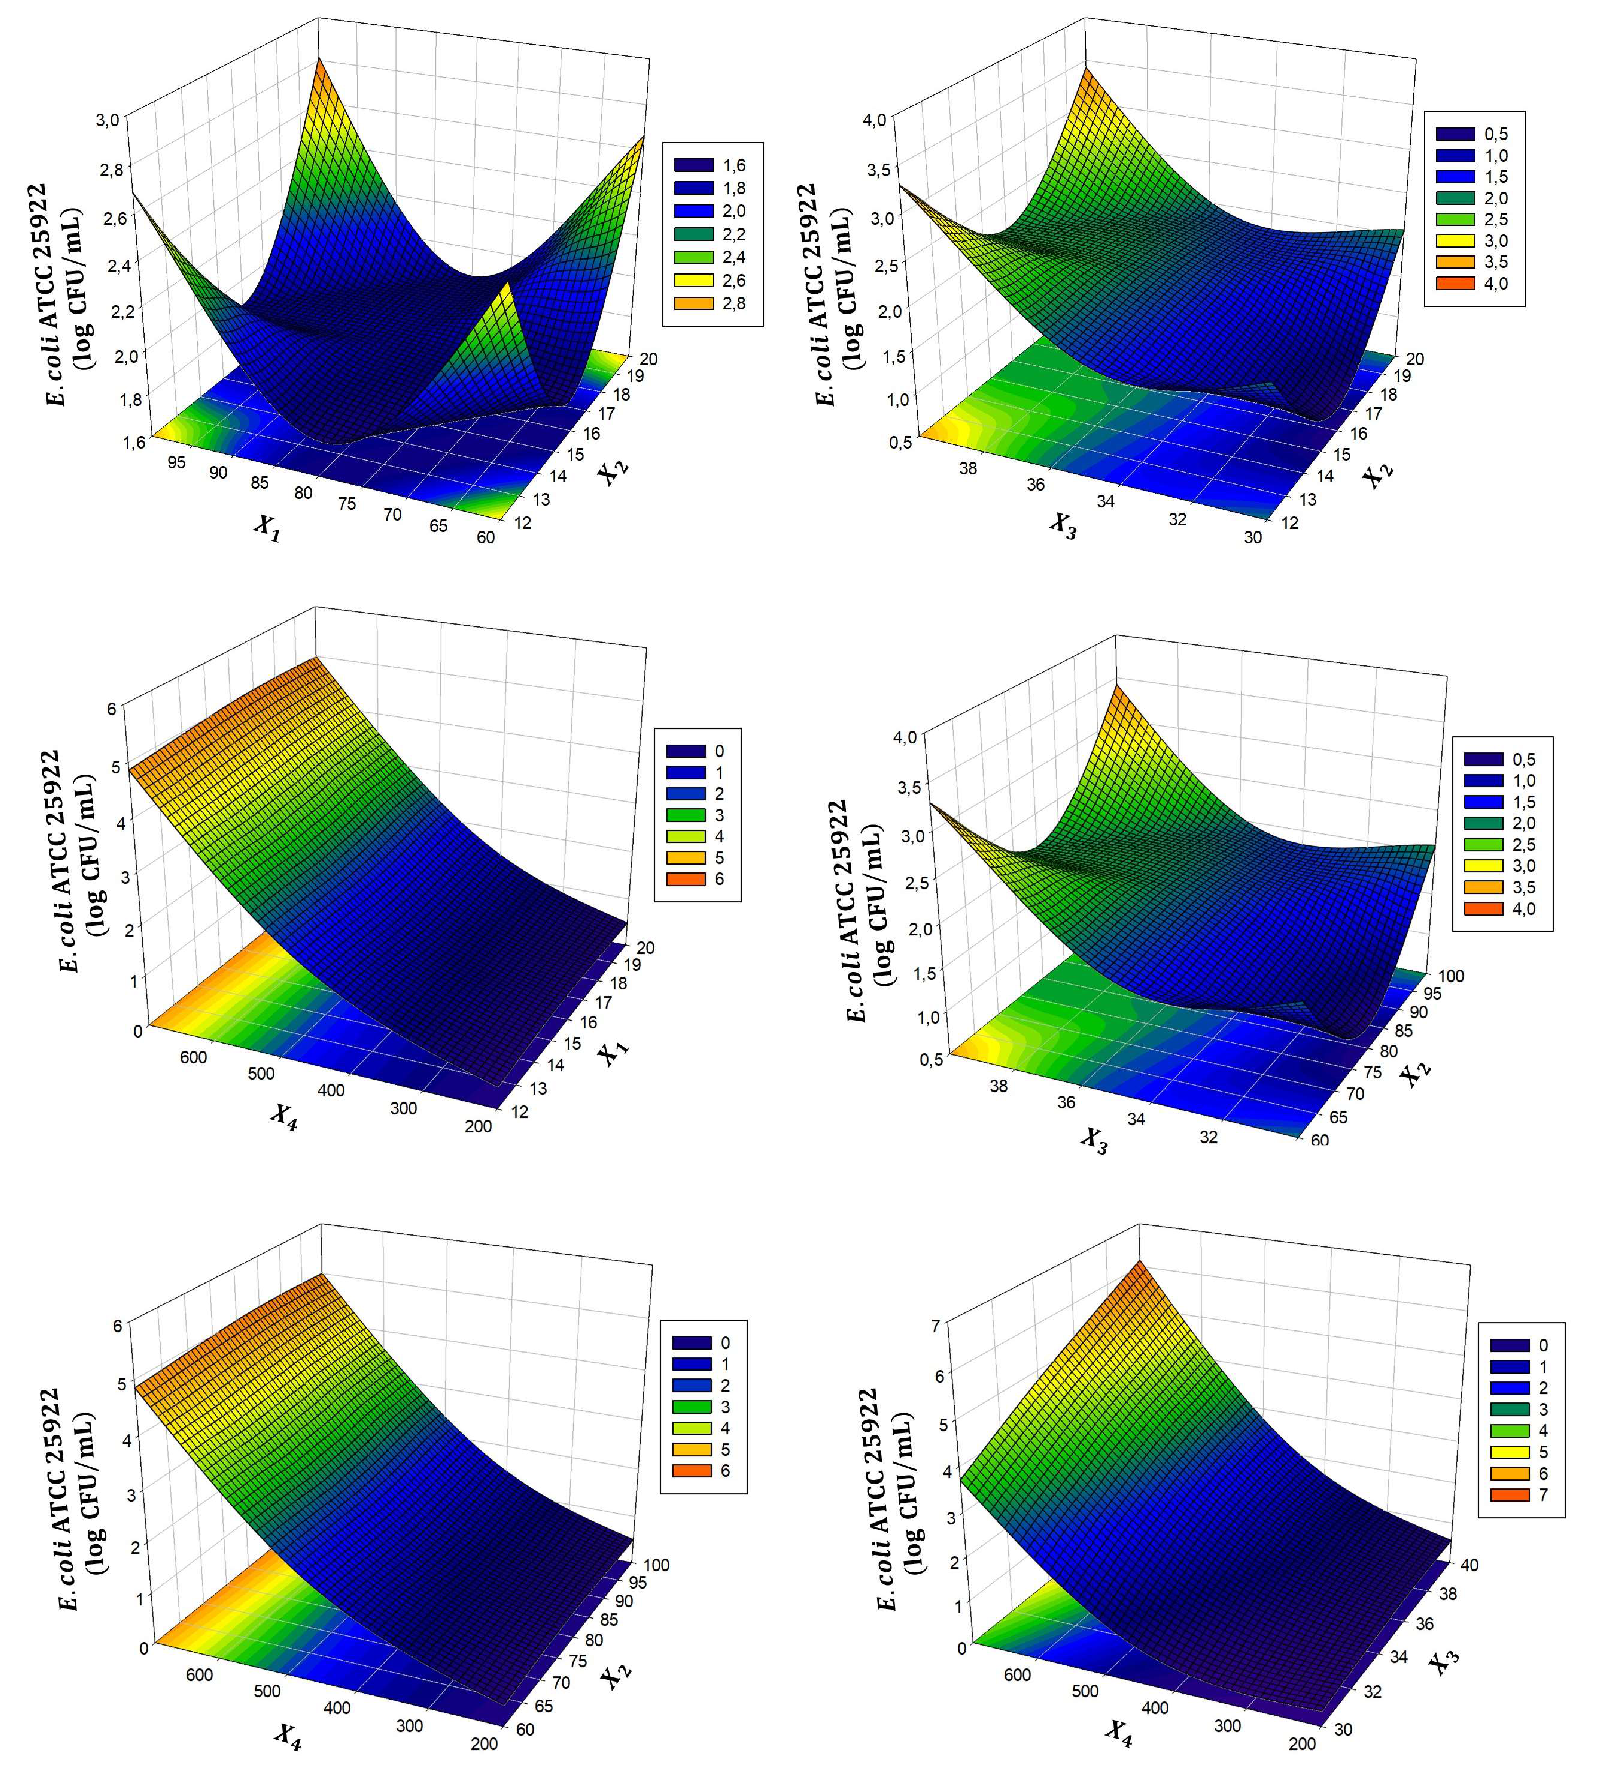
The results show that the appropriate model for S. aureus in tangerine juice adjusted the coefficient of determination around the value (99.11%) and the corrected coefficient of determination value (98.34%) (Table 3). The ANOVA indicated that the microwave time and power ( and ) and microwave time () interactions were the most important parameters (p < 0.001). The response surface plots showing the effects of the independent variables on S. aureus inhibition in tangerine juice are shown in Figure 2. It was observed that increases in the independent factors (, , , ) increased the inhibition effect on S. aureus. It was determined that S. aureus was reduced to 5.27 log CFU/mL. Three replicates of the experiments were performed based on the optimum preparation conditions for S. aureus. A value of 5.20 log CFU/mL was determined in the repeated result for the reliability of the model.
Similar to our study, Hashemi et al. (2019) reported that after microwave 800 W, the inactivation time of S. aureus was 70 s in cantaloupe juice [46]. Shaw et al. (2021) reported that 80D resulted in an approximate 4-log reduction in S. aureus with pulsed microwave radiation treatment [47]. He et al. (2021) investigated the inactivation effect of (3.33 W/mL, 3 min) and thyme essential oil nanoemulsion (TEON) (0.375 mg/mL) treatment, reducing S. aureus populations by 3.21 log CFU/mL [48]. Similar results were found by Soleimanzadeh et al. (2018), which indicated a 37.5 μm amplitude, 14 min ultrasound treatment caused a 6 CFU/mL reduction in S. aureus [49]. Another study showed that ultrasound treatment (600 W, 5 min) and then heating (63 °C, 5 min) could reduce S. aureus to 1.58 log CFU/mL in milk [50].
Equation (7) shows the optimal quadratic polynomial model for S. Enteritidis of tangerine juice obtained from the response surface methodology.
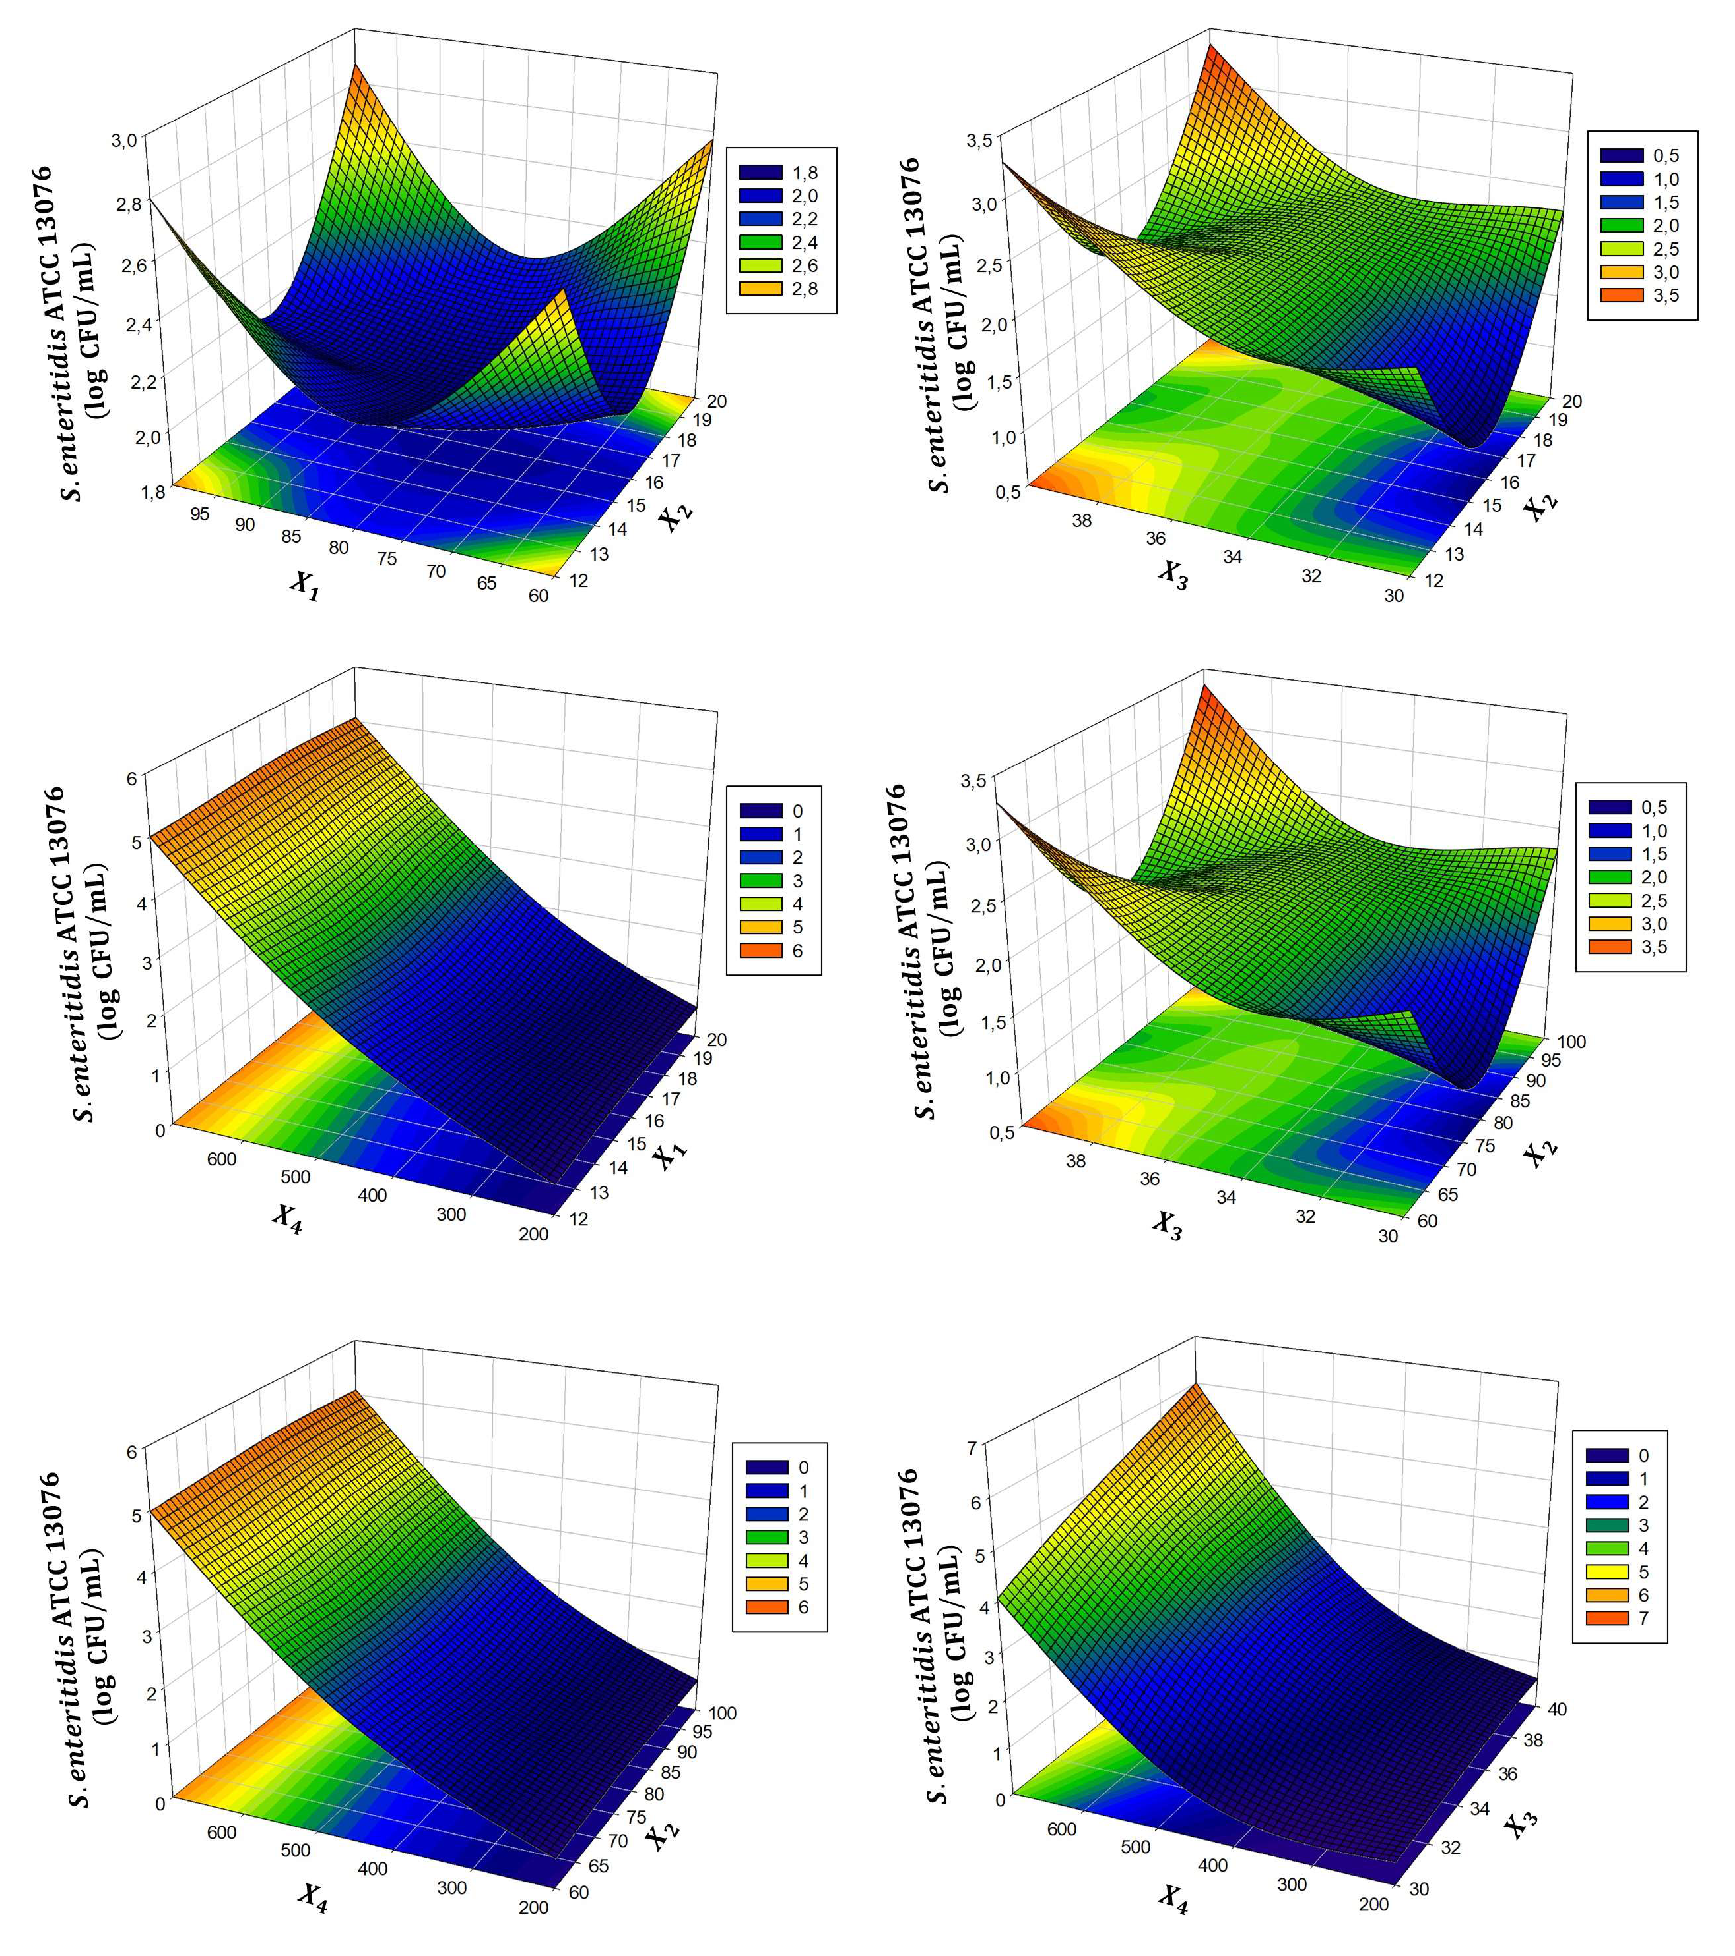
The results determined the value of the coefficient of determination (99.71%) and the corrected coefficient of determination (99.45%) of the fit model in tangerine juice for S. enteritidis (Table 3). The results of the independent variables , , , , , and show statistical significance (p < 0.05, p < 0.001). A high F-value (387.14) and low p-value (<0.0001) were detected in the S. Enteritidis model, and the RSM model was found to be highly predictive. Thus, the S. Enteritidis optimization was proven to be satisfactory. The response surface plots showing the effects of the independent variables on S. Enteritidis inhibition in tangerine juice are shown in Figure 3. It was determined that S. Enteritidis decreased by 5.12 log CFU/mL with combined ultrasound and microwave treatment under optimization conditions. The success of the experiment was proven by determining a value of 5.20 log CFU/mL in the repeated result for the reliability of the model.
Similar to this research, microwave heating at 220 to 660 W reduced Salmonella spp. numbers in tahini by 0.5 to 4.8 log10 CFU/g, with a range from 6.18 to 0.50 min D-values [51]. Huang et al. (2006) reported that high pressure processing and ultrasound treatments could achieving of 3.2 log cycles reduction for S. Enteritidis. [52]. Xiufang et al. (2020) found that ultrasound caused a reduction in 3.31 log cycles in S. Typhimurium at 968 W/cm2 and 35 °C for 20 min in liquid whole egg [53]. Ferrario and Guerrero (2016) reported a 6.3 log CFU reduction in S. Enteritidis in ultrasound (600 W, 20 kHz) and pulsed-light (3800 V, 1.27 J/cm2)-treated apple juice [54].
As shown below, a quadratic polynomial regression Equation (8) was created by RSM to evaluate the relationship between the ultrasound–microwave treatment parameters and L. monocytogenes inhibition, as shown in Table 2.
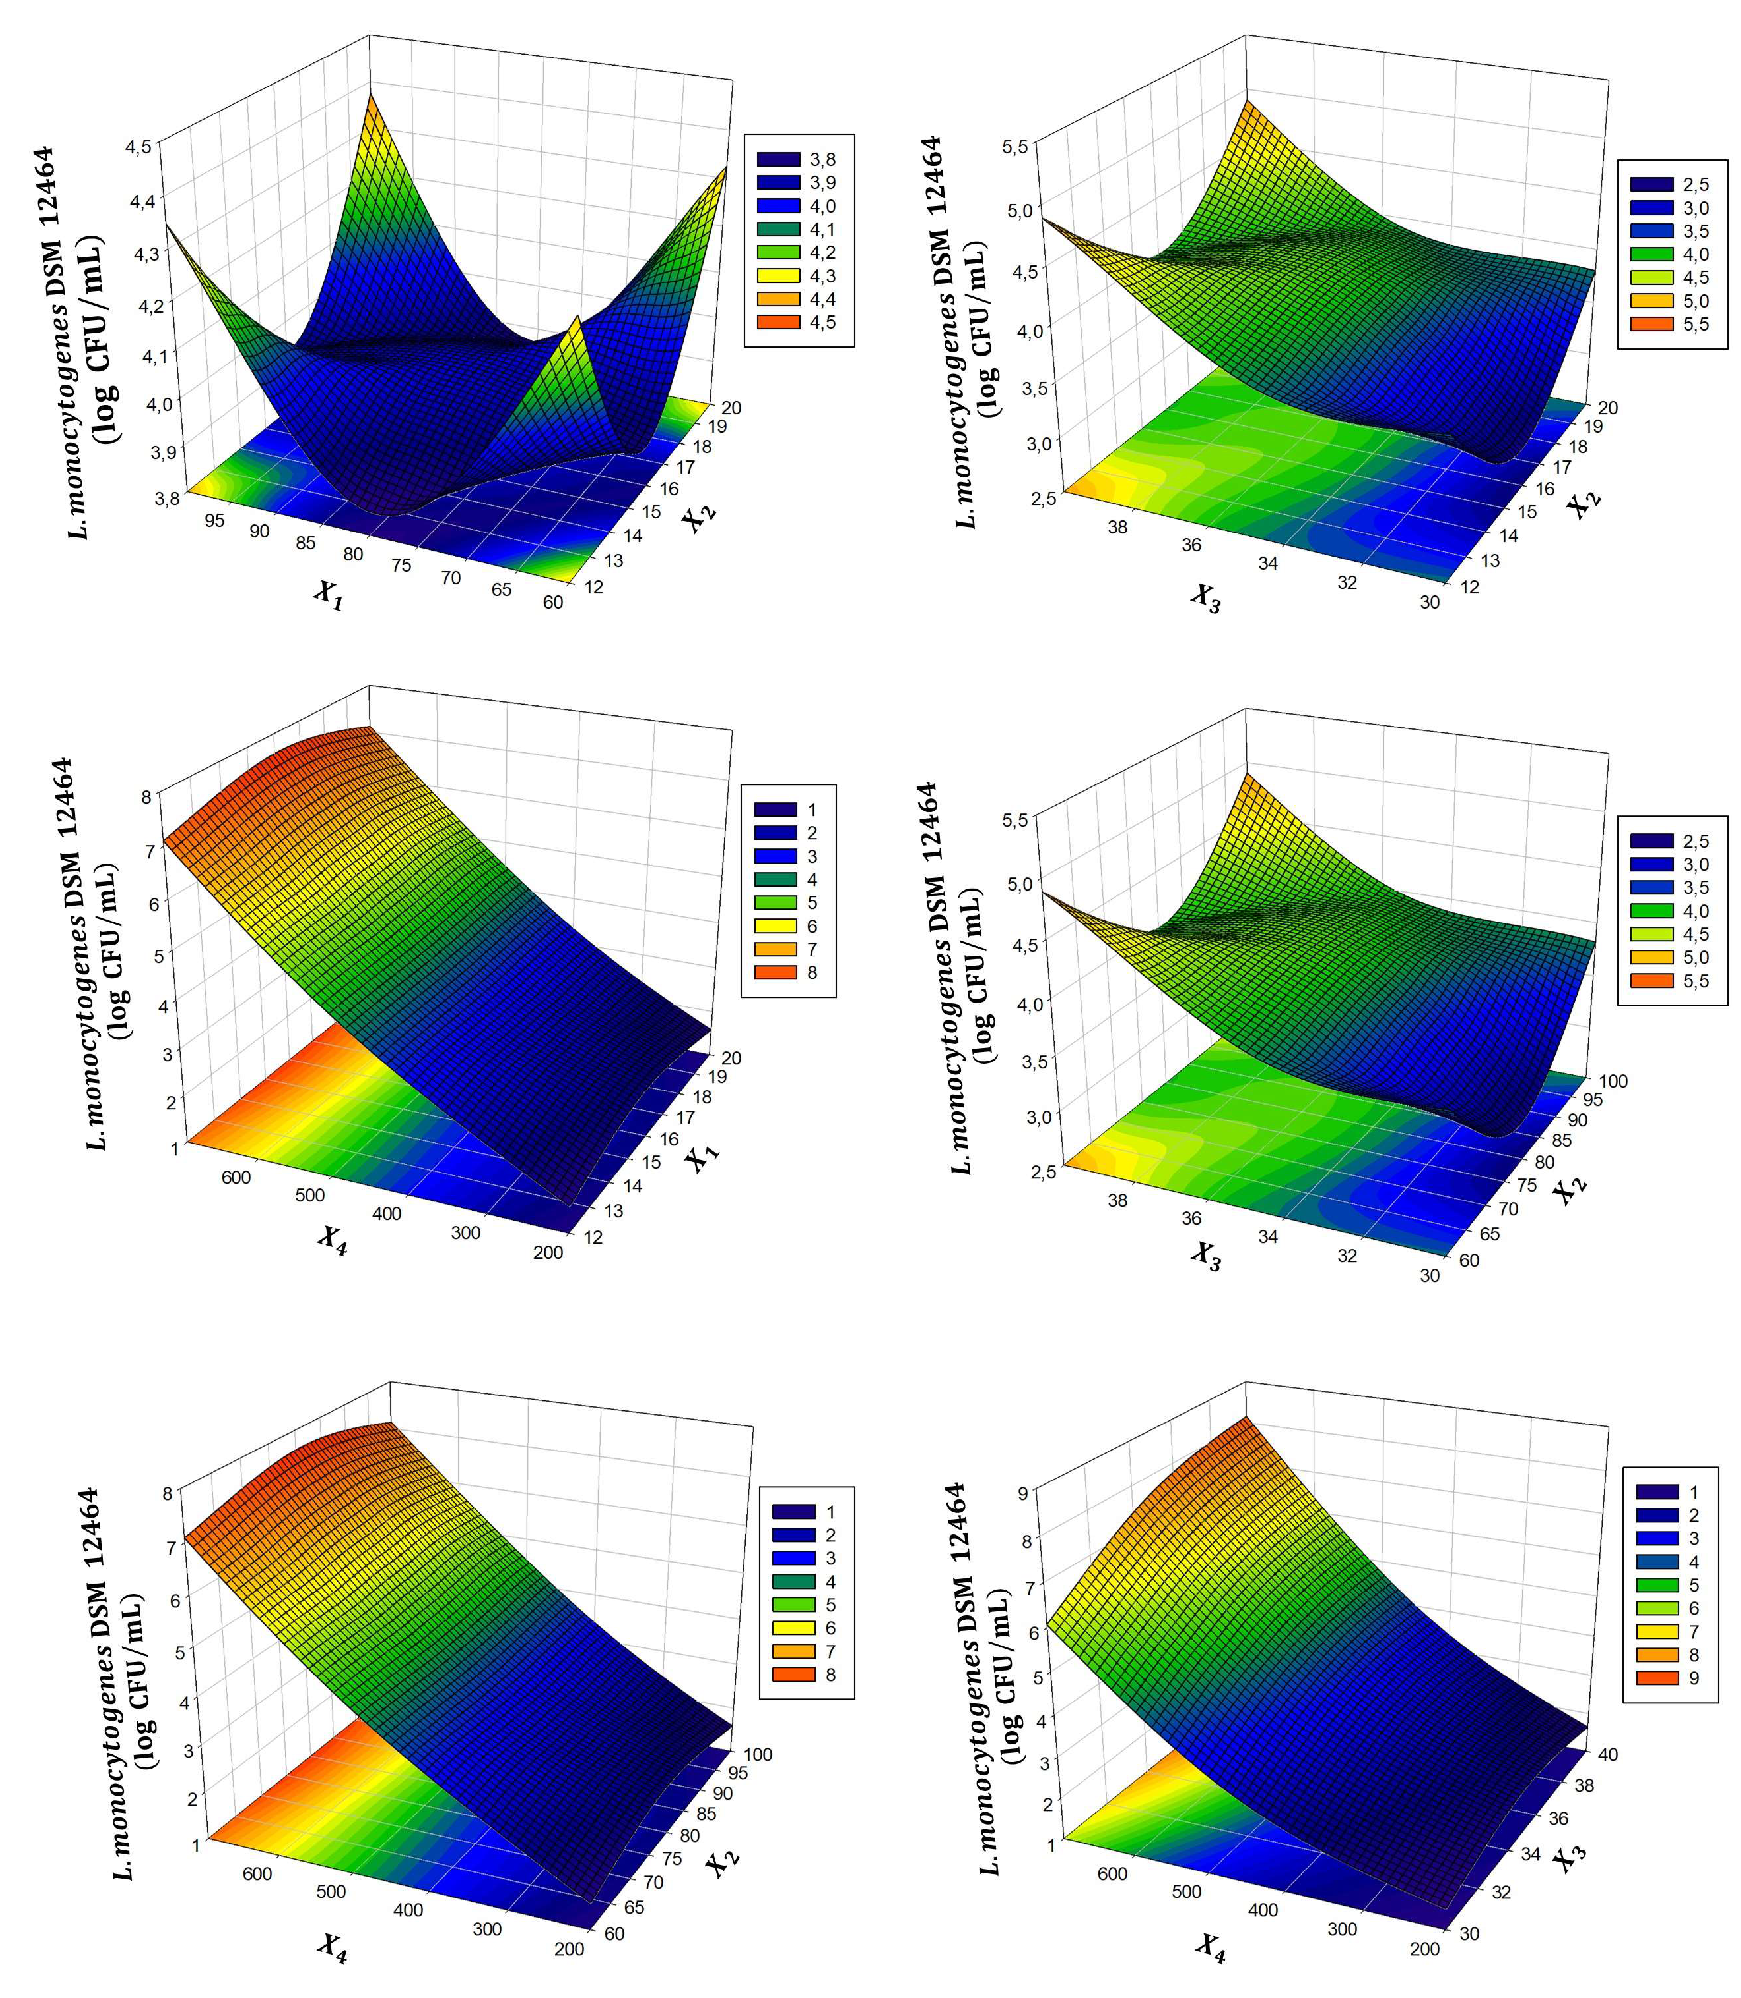
The results show the value of the L. monocytogenes model coefficient of determination in tangerine juice (99.98%) and the corrected coefficient of determination (98.95%) (Table 3). In the ANOVA results, it was determined that the microwave time () and microwave power () were the most important parameters in their interactions (p < 0.001). Interactions between the same independent parameters were also found to be significant (p < 0.001). In the two-way interaction, only was found to be statistically significant (p < 0.001). The response surface plots showing the effect of independent variables on the inhibition of L. monocytogenes in tangerine juice are shown in Figure 4. As seen in Table 3, the high F-value (754.12) and low p-value (<0.0001) of the L. monocytogenes model were more satisfactory than for the other pathogens (p < 0.0001). It was determined that the L. monocytogenes in decreased by 7.19 log CFU/mL under the optimization conditions. The highest level of inhibition was obtained compared to the other pathogens. Based on the optimum preparation conditions for L. monocytogenes, a value of 7.10 log CFU/mL was determined for the reliability of the model in triplicate experiments.
Similar reductions to those found in this study were found by Picouet, et al. (2009); after microwave treatment at 652 W and 35 s, a 7-log reduction in Listeria innocua in apple purée was achieved [55]. Das et al. (2020) used an RSM model for the optimization of a 5-log decrease in the L. monocytogenes count in bottle gourd (Lagenaria siceraria) juice and found that the condition was 750 W of microwave yield power, a 70 °C temperature, 80% amplitude, and 15 min [56]. According to Siguemoto et al. (2018), under treatment by microwave radiation at 1000 W (P′abs = 1.57 W/mL) for 130 s, a 5-log reduction in the L. monocytogenes in apple juice was reported [57]. In a study by Park et al. (2018), treating fresh-cut endives with ultrasound (40 KHz and 140 W) decreased L. monocytogenes by 0.40 log CFU/mL [58]. The higher values obtained in this study may be due to both the differences in the fruit juices applied and the application of the ultrasound treatment before microwave treatment.
As shown in Table 2, the treatment of 20 min, 100 amplitude, 40 s, and 700 W had the highest inhibitory effects on the tested pathogens. Pathogen inactivation by ultrasound and microwave treatment has been investigated in many studies for liquid food safety [59,60,61,62]. In a sample group receiving 700 W microwave treatment, the numbers of L. monocytogenes were not detectable after 35 s. In a study by Trujillo-Mayol et al. (2019), L. monocytogenes was more sensitive to ultrasound–microwave-treated avocado peel extracts than S. aureus [63]. Similarly, in another study, L. monocytogenes was observed to become more sensitive to heat treatment after growth in an acidifying growth medium [64]. In addition, it can be seen in Table 2 that E. coli was the most resistant to ultrasound–microwave treatment than the other tested pathogens. In a previous study, the results showed that Salmonella Typhimurium and L. monocytogenes had lower heat resistance and acid adaptability compared to E. coli in orange juice [65]. Similarly, Mendes-Oliveria (2020) and Song and Kang (2016) observed that E. coli showed more resistance than Salmonella spp. to microwave heating [33,66]. It was also reported that the susceptibility of pathogens did not only depend on the use of treatment such as ultrasound, but was also affected by the food matrix [67]. The data in the literature on the effects of microwave treatment on the survival of microorganisms are vary because the process parameters are different [68]. In the literature, the primary mechanisms for microbial inactivation using ultrasound are acoustic cavitation and acoustic streaming. These mechanisms can inactivate pathogens by mechanical, thermal, and chemical effects [16]. Microwave, which carries out heating by converting electromagnetic energy into heat through selective absorption and dissipation, differs from conventional heating by convection and conduction. There is no holding period because microwaves generate heat constantly [57]. Increasing the ultrasonic power and duration may cause the destruction of microorganism cells by ultrasonic waves. With increasing wave power, the number of bubbles formed in the liquid increases, and this causes an increase in cavitation, which explains the reason for the inhibition of pathogens. In addition, the rapid temperature effect created by microwave power and time explains the effect of the ultrasound–microwave combination on pathogens.
3.2. Determination of Bioactive Compounds
Phenolic compounds are plant secondary metabolites that consist of aromatic rings coupled to one or more hydroxyl group [69]. The results of the TPC, TFC, DPPH, and CUPRAC values in the tangerine juice samples are given in Figure 5. The TPC, TFC, DPPH, and CUPRAC increased after the ultrasound–microwave treatment. These results show that the ultrasound–microwave treatment was the most impactful when compared to pasteurization in the tangerine juice samples. A high positive correlation was found between the total phenols and total antioxidants (Figure 6). Several researchers have found higher phenolic compounds and antioxidants in ultrasound–microwave-treated brown macroalgae compared to ultrasound and microwave separately, and have also found higher flavonoid compounds in ultrasound–microwave-treated Eucommia ulmoides leaves [70,71]. Plazzato et al. (2020) reported that the total phenolic and flavonoid contents (317 mg GAE and 120 mg QE) of frozen peach waste were enhanced by increasing the microwave power, ultrasound amplitude, and treatment time [72]. Likewise, Trujillo-Mayol et al. (2019) reported that the ultrasound–microwave treatment resulted in higher TPC (281.4 ± 0.2 mg GAE), TFC (62.0 ± 0.4 mg QE), and DPPH (779.1 ± 0.6 μg TEAC) in avocado peel extracts [63]. Furthermore, Alonso-Carrillo et al. (2017) reported significantly higher total phenolic contents and higher radical scavenging ability in Satureja macrostema using ultrasound–microwave [73]. Lohani and Muthukumarappan (2021) reported that when sorghum flour was exposed to high-energy ultrasound, it increased the free phenolic content too [74]. The increase in bioactive compounds as a result of the combination applied to tangerine juice may be caused by the destruction of the cells by the cavitation effect, which is caused by the ultrasound amplitude and instantaneous temperature increase.
3.3. Analysis of Amino Acid
Ultrasound-microwave treatment did not change the amino acid composition of tangerine juice, except in cystine and histidine, but significant increases were observed in the amounts of alanine, arginine, proline, glycine, ornithine, lysine, methionine, phenylalanine, leucine, isoleucine, tyrosine, serine, threonine, and valine compared to the C-TJ and P-TJ samples (Table 5). Proline, arginine and aspartic acid were detected in all samples as major amino acids. Proline has important metabolic and physiological roles such as in the synthesis of hydroxyproline, arginine, ornithine, polyamines, glutamate, and protein, the regulation of gene expression and cell differentiation, signaling via some reactions, and scavenging oxidants [75]. Furthermore, Noman et al. (2020) reported that after ultrasound–microwave enzymatic hydrolysis treatment, leucine, tyrosine, valine, methionine, phenylalanine, isoleucine, and histidine were increased but threonine, arginine, lysine, serine, glycine, alanine, and proline were decreased in Chinese sturgeon (Acipenser sinensis), in disagreement with the results of this study [76]. Das et al. (2020) reported, similar to the present study, that alanine, arginine, glutamic acid, serine, tyrosine, methionine, isoleucine, and phenylalanine were increased in bottle gourd (Lagenaria siceraria) juice using microwave followed by ultrasound (MW-US) treatment compared to pasteurization [56]. The key role of the amino acid increase was the exposure of more regions inside the molecules to external conditions after the reactions occurring during ultrasound treatment. This accelerated proteolysis and then more peptide bonds were broken in the amino acids [77].
3.4. Analysis of Minerals
Minerals are important for biological actions and are essential nutrients for humans [78]. The results of the minerals analyses of the C-TJ, P-TJ, and UMT-TJ samples are indicated in Table 6. Decreases were detected in Cu, Fe, Zn, Mn, Na, and Mg with thermal pasteurization. K was dominant in juices, and significant differences were detected in the PT-TJ and UMT-TJ samples compared to the control sample; the values were 2281.62 ± 0,10 mg/L and 1981.56 ± 0.16 mg/L, respectively. After ultrasound–microwave treatment, significant increases in Zn, Mg, Na, and Cu were detected compared to the control juice sample. The main reason for the change in mineral substances is cavitation in ultrasound treatment. A high negative correlation was found between Mn and K (Figure 6). The increases in the concentrations of Mg and Zn are in accordance with the investigations reported by Erdal et al., (2022), who found a similar influence and significant reductions in Ca when ultrasound–microwave treatment was applied to gilaburu vinegar samples [62]. Wang et al. (2020) reported similar increases in US–UV treated mango juice, but our results regarding Ca showed the opposite trend to that study [79]. The ultrasound process can form different species, and a longer sonication time can reduce ions in the liquid phase. The increase in minerals can result in the destruction of the cellular structure during ultrasound treatment, and the migration of the minerals in the cells to the solution [80,81].
3.5. Color Analysis
The color parameters (L*, a*, b*, C, h°, and ΔE) of control (untreated), ultrasound–microwave and pasteurization-treated tangerine juice samples are shown in Table 7. The b* values show a high correlation with the bioactive compounds (Figure 6). When the a* values of the samples were examined, no significant differences were found between the P-TJ and UM-TJ values (p > 0.05). The L* and b* values were higher in the UM-TJ group compared to those in the C-TJ group (p < 0.05). Thus, it can be concluded that ultrasound–microwave treatment results in a lighter and increasingly yellow appearance. Pérez-Grijalba et al. (2018) and Zia et al. (2019) also reported that ultrasound–microwave treatment ensured increased L*, a*, and b* color parameters in blackberry juice and sugarcane juice [43,82]. It was similarly reported that the L* value increased as a result of thermosonication treatment in quince juice and tomato juice enriched with anthocyanin. Contrary to our study, the researchers also found an increase in the a* value [83,84]. The application of ultrasound–microwave treatment led to a higher luminosity value, with significant differences (p <0.05). Similar results were reported by Alves et al. (2020) in ultrasound-treated (35 kHz, 750 W,60 °C, 10 min) tangerine juice [13]. In fruit juices, there may be increases in L* values after the partial precipitation of suspended particles due to the homogenizing effect of ultrasound treatment [85]. Statistically significant differences were found between the b* values of the samples (p < 0.05). Das et al. (2020), in parallel to our study, found b* value increases in ultrasound–microwave-treated (70 °C 750 W, 80% amplitude, and 15 min) bottle gourd (Lagenaria siceraria) juice [57]. Raju and Deka (2018) reported that the b* value was decreased after thermosonication treatment in blood fruit (Haematocarpus validus) juice [86]. On the contrary, an increase was detected after ultrasound–microwave treatment was applied to tangerine juice. To better define the effects of pasteurization and ultrasound–microwave treatments on tangerine juice, the variations in total color change (ΔE) were examined. The P-TJ (4.88 ± 0.42) and UM-TJ (5.59 ± 1.17) groups showed fewer ΔE changes and had similar advantages. When the overall results were examined, the effects of the ultrasound–microwave treatment on the tangerine juice were significant.
4. Conclusions
In this work, the effects of ultrasound and microwave on the inhibition of E. coli, S. Enteritidis, S. aureus, and L. monocytogenes, and furthermore, on the contents of bioactive compounds and amino acids, the mineral composition, antioxidant activity, and color in tangerine juice were evaluated. The RSM optimization fit well with the measured experimental results. The significant parameters of ultrasound–microwave-treated tangerine juice, thermal pasteurization-treated tangerine juice, and control tangerine juice were compared. E. coli was the most resistant to the ultrasound–microwave treatment than the other tested pathogens. The ultrasound–microwave treatment also contributed to the increase in the total amino acids, polyphenols, and flavonoids, which were not observed for Ca or Fe. A high correlation was determined between phenolic and flavonoids and antioxidants. The results show that ultrasound and microwave processing technologies can ensure the food safety of tangerine juice. In future studies, ultrasound and microwave treatment effects, such as sensory properties and aroma profile, should be examined.
Author Contributions
Conceptualization, N.T.D. and S.Y.; data curation, N.T.D.; formal analysis, N.T.D. and S.Y.; funding acquisition, N.T.D. and S.Y.; investigation, N.T.D. and S.Y.; methodology, N.T.D. and S.Y.; project administration, N.T.D.; resources, N.T.D. and S.Y.; software, N.T.D. and S.Y; supervision, N.T.D. and S.Y.; validation, N.T.D.; visualization, N.T.D. and S.Y.; writing—original draft, N.T.D. and S.Y.; writing—review and editing, N.T.D. and S.Y. All authors have read and agreed to the published version of the manuscript.
Funding
This research received no external funding.
Institutional Review Board Statement
Not applicable.
Informed Consent Statement
Not applicable.
Data Availability Statement
Not applicable.
Conflicts of Interest
The authors declare no conflict of interest.
References
- Ertek, N.; Dağdemir, V.; Keskin, A. Marketing Margins and Economic Analysis of the Mandarin Market in Turkey. Atatürk Univ. J. Agric. Fac. 2020, 51, 119–125. [Google Scholar] [CrossRef]
- Kaplan, E.; Taşova, M.; Gülse Bal, H.S. Consumer Preferences According to Fruit Drying Methods: Sunburst Type Mandarin Example. Turkish J. Agric. Eng. Res. 2020, 1, 425–440. [Google Scholar] [CrossRef]
- Kernou, O.N.; Belbahi, A.; Amir, A.; Bedjaoui, K.; Kerdouche, K.; Dairi, S.; Aoun, O.; Madani, K. Effect of sonication on microwave inactivation of Escherichia coli in an orange juice beverage. J. Food Process Eng. 2021, 44, 1–9. [Google Scholar] [CrossRef]
- Niveditha, A.; Pandiselvam, R.; Prasath, V.A.; Singh, S.K.; Gul, K.; Kothakota, A. Application of cold plasma and ozone technology for decontamination of Escherichia coli in foods- a review. Food Control 2021, 130, 108338. [Google Scholar] [CrossRef]
- Luna-Guevara, J.J.; Arenas-Hernandez, M.M.P.; Martínez De La Peña, C.; Silva, J.L.; Luna-Guevara, M.L. The Role of Pathogenic E. coli in Fresh Vegetables: Behavior, Contamination Factors, and Preventive Measures. Int. J. Microbiol. 2019, 2019, 2894328. [Google Scholar] [CrossRef] [PubMed] [Green Version]
- Denamur, E.; Clermont, O.; Bonacorsi, S.; Gordon, D. The population genetics of pathogenic Escherichia coli. Nat. Rev. Microbiol. 2020, 19, 37–54. [Google Scholar] [CrossRef]
- Schneider, G.; Schweitzer, B.; Steinbach, A.; Pertics, B.Z.; Cox, A.; Kőrösi, L. Antimicrobial efficacy and spectrum of phosphorous-fluorine co-doped tio2 nanoparticles on the foodborne pathogenic bacteria campylobacter jejuni, salmonella typhimurium, enterohaemorrhagic e. Coli, yersinia enterocolitica, shewanella putrefaciens, lister. Foods 2021, 10, 1786. [Google Scholar] [CrossRef]
- Cheng, R.M.; Churey, J.J.; Worobo, R.W. Inactivation of Salmonella enterica and spoilage microorganisms in orange juice treated with dimethyl dicarbonate (DMDC). Int. J. Food Microbiol. 2018, 285, 152–157. [Google Scholar] [CrossRef] [PubMed]
- Sohrabi, H.; Majidi, M.R.; Khaki, P.; Jahanban-Esfahlan, A.; de la Guardia, M.; Mokhtarzadeh, A. State of the art: Lateral flow assays toward the point-of-care foodborne pathogenic bacteria detection in food samples. Compr. Rev. Food Sci. Food Saf. 2022, 21, 1868–1912. [Google Scholar] [CrossRef]
- Guerreiro, D.N.; Pucciarelli, M.G.; Tiensuu, T.; Gudynaite, D.; Boyd, A.; Johansson, J.; García-Del Portillo, F.; O Byrne, C.P. Acid stress signals are integrated into the σB-dependent general stress response pathway via the stressosome in the food-borne pathogen Listeria monocytogenes. PLOS Pathog. 2022, 18, e1010213. [Google Scholar] [CrossRef]
- Parsons, C.; Brown, P.; Kathariou, S. Use of Bacteriophage Amended with CRISPR-Cas Systems to Combat Antimicrobial Resistance in the Bacterial Foodborne Pathogen Listeria monocytogenes. Antibiotics 2021, 10, 308. [Google Scholar] [CrossRef]
- Zhang, X.; Wang, S.; Chen, X.; Qu, C. Review controlling Listeria monocytogenes in ready-to-eat meat and poultry products: An overview of outbreaks, current legislations, challenges, and future prospects. Trends Food Sci. Technol. 2021, 116, 24–35. [Google Scholar] [CrossRef]
- Alves, L.; de, L.; dos Santos, R.L.; Bayer, B.L.; Devens, A.L.M.; Cichoski, A.J.; Mendonça, C.R.B. Thermosonication of tangerine juice: Effects on quality characteristics, bioactive compounds, and antioxidant activity. J. Food Process. Preserv. 2020, 44, 1–9. [Google Scholar] [CrossRef]
- Rodríguez, M.; Oteiza, J.; Giannuzzi, L.; Zaritzky, N. Evaluation of mutagenicity associated with Escherichia coli inactivation in UV-treated orange juice. Toxicol. Environ. Chem. 2016, 99, 315–330. [Google Scholar] [CrossRef]
- Sánchez-Rubio, M.; Alnakip, M.E.A.; Abouelnaga, M.; Taboada-Rodriguez, A.; Marin-Iniesta, F. Use of thermosonication for inactivation of E. coli O157:H7 in fruit juices and fruit juice/reconstituted skim milk beverages. Acta Hortic. 2018, 1194, 267–274. [Google Scholar] [CrossRef]
- Nunes, B.V.; da Silva, C.N.; Bastos, S.C.; de Souza, V.R. Microbiological Inactivation by Ultrasound in Liquid Products. Food Bioprocess Technol. 2022, 15, 2185–2209. [Google Scholar] [CrossRef]
- Ramírez-Melo, L.M.; del SocorroCruz-Cansino, N.; Delgado-Olivares, L.; Ramírez-Moreno, E.; Zafra-Rojas, Q.Y.; Hernández-Traspeña, J.L.; Suárez-Jacobo, Á. Optimization of antioxidant activity properties of a thermosonicated beetroot (Beta vulgaris L.) juice and further in vitro bioaccessibility comparison with thermal treatments. LWT 2022, 154, 112780. [Google Scholar] [CrossRef]
- Alabdali, T.A.M.; Icyer, N.C.; Ozkaya, G.U.; Durak, M.Z. Effect of Stand-Alone and Combined Ultraviolet and Ultrasound Treatments on Physicochemical and Microbial Characteristics of Pomegranate Juice. Appl. Sci. 2020, 10, 5458. [Google Scholar] [CrossRef]
- Ramírez-Moreno, E.; Zafra-Rojas, Q.Y.; Arias-Rico, J.; Ariza-Ortega, J.A.; Alanís-García, E.; Cruz-Cansino, N. Effect of ultrasound on microbiological load and antioxidant properties of blackberry juice. J. Food Process. Preserv. 2018, 42, e13489. [Google Scholar] [CrossRef]
- Tremarin, A.; Canbaz, E.A.; Brandão, T.R.S.; Silva, C.L.M. Modelling Alicyclobacillus acidoterrestris inactivation in apple juice using thermosonication treatments. LWT 2019, 102, 159–163. [Google Scholar] [CrossRef]
- Shen, Y.; Zhu, D.; Xi, P.; Cai, T.; Cao, X.; Liu, H.; Li, J. Effects of temperature-controlled ultrasound treatment on sensory properties, physical characteristics and antioxidant activity of cloudy apple juice. LWT 2021, 142, 111030. [Google Scholar] [CrossRef]
- Li, J.; Cheng, H.; Liao, X.; Liu, D.; Xiang, Q.; Wang, J.; Chen, S.; Ye, X.; Ding, T. Inactivation of Bacillus subtilis and quality assurance in Chinese bayberry (Myrica rubra) juice with ultrasound and mild heat. LWT 2019, 108, 113–119. [Google Scholar] [CrossRef]
- Tomadoni, B.; Cassani, L.; Moreira, M.D.R.; Ponce, A.; Agüero, M.V. Natural Antimicrobials Combined with Ultrasound Treatments to Enhance Quality Parameters and Safety of Unpasteurized Strawberry Juice. Int. J. Fruit Sci. 2019, 20, S178–S197. [Google Scholar] [CrossRef]
- Anaya-Esparza, L.M.; Velázquez-Estrada, R.M.; Sayago-Ayerdi, S.G.; Sánchez-Burgos, J.A.; Ramírez-Mares, M.V.; García-Magaña, M.; de Lourdes Montalvo-González, E. Effect of thermosonication on polyphenol oxidase inactivation and quality parameters of soursop nectar. LWT—Food Sci. Technol. 2017, 75, 545–551. [Google Scholar] [CrossRef]
- Park, J.J.; Olawuyi, I.F.; Lee, W.Y. Influence of Thermo-sonication and Ascorbic Acid Treatment on Microbial Inactivation and Shelf-Life Extension of Soft Persimmon (Diospyros kaki T.) Juice. Food Bioprocess Technol. 2021, 14, 429–440. [Google Scholar] [CrossRef]
- Demir, H.; Kılınç, A. Effect of batch and continuous thermosonication on the microbial and physicochemical quality of pumpkin juice. J. Food Sci. Technol. 2019, 56, 5036–5045. [Google Scholar] [CrossRef]
- Anaya-Esparza, L.M.; Velázquez-Estrada, R.M.; Roig, A.X.; García-Galindo, H.S.; Sayago-Ayerdi, S.G.; Montalvo-González, E. Thermosonication: An alternative processing for fruit and vegetable juices. Trends Food Sci. Technol. 2017, 61, 26–37. [Google Scholar] [CrossRef]
- Fonteles, T.V.; Karolina De Araújo Barroso, M.; De Godoy, E.; Filho, A.; Andre, F.; Fernandes, N.; Rodrigues, S. Ultrasound and Ozone Processing of Cashew Apple Juice: Effects of Single and Combined Processing on the Juice Quality and Microbial Stability. Processes 2021, 9, 2243. [Google Scholar] [CrossRef]
- Sagong, H.-G.; Lee, S.-Y.; Chang, P.-S.; Heu, S.; Ryu, S.; Choi, Y.-J.; Kang, D.-H. Combined effect of ultrasound and organic acids to reduce Escherichia coli O157:H7, Salmonella Typhimurium, and Listeria monocytogenes on organic fresh lettuce. Int. J. Food Microbiol. 2011, 145, 287–292. [Google Scholar] [CrossRef]
- Hashemi, S.M.B.; Roohi, R.; Mahmoudi, M.R.; Granato, D. Modeling inactivation of Listeria monocytogenes, Shigella sonnei, Byssochlamys fulva and Saccharomyces cerevisiae and ascorbic acid and β-carotene degradation kinetics in tangerine juice by pulsed-thermosonication. LWT 2019, 111, 612–621. [Google Scholar] [CrossRef]
- Lalou, S.; Ordoudi, S.A.; Mantzouridou, F.T. On the Effect of Microwave Heating on Quality Characteristics and Functional Properties of Persimmon Juice and Its Residue. Foods 2021, 10, 2650. [Google Scholar] [CrossRef]
- Vignali, G.; Gozzi, M.; Pelacci, M.; Stefanini, R. Non-conventional Stabilization for Fruit and Vegetable Juices: Overview, Technological Constraints, and Energy Cost Comparison. Food Bioprocess Technol. 2022, 15, 1729–1747. [Google Scholar] [CrossRef]
- Mendes-Oliveira, G.; Deering, A.J.; San Martin-Gonzalez, M.F.; Campanella, O.H. Microwave pasteurization of apple juice: Modeling the inactivation of Escherichia coli O157:H7 and Salmonella Typhimurium at 80–90 °C. Food Microbiol. 2020, 87, 103382. [Google Scholar] [CrossRef]
- Chizoba Ekezie, F.G.; Sun, D.W.; Han, Z.; Cheng, J.H. Microwave-assisted food processing technologies for enhancing product quality and process efficiency: A review of recent developments. Trends Food Sci. Technol. 2017, 67, 58–69. [Google Scholar] [CrossRef]
- Tang, J.; Hong, Y.K.; Inanoglu, S.; Liu, F. Microwave pasteurization for ready-to-eat meals. Curr. Opin. Food Sci. 2018, 23, 133–141. [Google Scholar] [CrossRef]
- Li, S.; Zhang, R.; Lei, D.; Huang, Y.; Cheng, S.; Zhu, Z.; Wu, Z.; Cravotto, G. Impact of ultrasound, microwaves and high-pressure processing on food components and their interactions. Trends Food Sci. Technol. 2021, 109, 1–15. [Google Scholar] [CrossRef]
- Singleton, V.; Rossi, A. Colorimetry of total phenolics with phosphomolybdic-phosphotungstic acid reagent. Am. J. Enol. Vitic. 1965, 16, 144–158. [Google Scholar]
- Zhishen, J.; Mengcheng, T.; Jianming, W. The determination of flavonoid contents in mulberry and their scavenging effects on superoxide radicals. Food Chem. 1999, 64, 555–559. [Google Scholar] [CrossRef]
- Apak, R.; Güçlü, K.; Özyürek, M.; Esin Karademir, S.; Erçağ, E. The cupric ion reducing antioxidant capacity and polyphenolic content of some herbal teas. Int. J. Food Sci. Nutr. 2006, 57, 292–304. [Google Scholar] [CrossRef]
- Grajeda-Iglesias, C.; Salas, E.; Barouh, N.; Baréa, B.; Panya, A.; Figueroa-Espinoza, M.C. Antioxidant activity of protocatechuates evaluated by DPPH, ORAC, and CAT methods. Food Chem. 2016, 194, 749–757. [Google Scholar] [CrossRef]
- Bilgin, Ö.; Çarli, U.; Erdoğan, S.; Emrah Maviş, M.; Göksu Gürsu, G.; Yilmaz, M. Karadeniz’de (Sinop Yarımadası Civarı) Avlanan İzmarit Balığı, Spicara smaris (Linnaeus, 1758), Etinin LC-MS/MS Kullanarak Amino Asit İçeriğinin Tespiti ve Ağırlık-Boy İlişkisi. Türk Tarım ve Doğa Bilim. Derg. 2019, 6, 130–136. [Google Scholar] [CrossRef]
- Sezer, B.; Apaydin, H.; Bilge, G.; Boyaci, I.H. Detection of Pistacia vera adulteration by using laser induced breakdown spectroscopy. J. Sci. Food Agric. 2019, 99, 2236–2242. [Google Scholar] [CrossRef]
- Zia, S.; Khan, M.R.; Zeng, X.A.; Sehrish; Shabbir, M.A.; Aadil, R.M. Combined effect of microwave and ultrasonication treatments on the quality and stability of sugarcane juice during cold storage. Int. J. Food Sci. Technol. 2019, 54, 2563–2569. [Google Scholar] [CrossRef]
- Traore, M.B.; Sun, A.; Gan, Z.; Senou, H.; Togo, J.; Fofana, K.H. Antimicrobial capacity of ultrasound and ozone for enhancing bacterial safety on inoculated shredded green cabbage (Brassica oleracea var. capitata). Can. J. Microbiol. 2020, 66, 125–137. [Google Scholar] [CrossRef]
- Hosseinzadeh Samani, B.; Khoshtaghaza, M.H.; Minaee, S.; Abbasi, S. Modeling the Simultaneous Effects of Microwave and Ultrasound Treatments on Sour Cherry Juice Using Response Surface Methodology. J. Agric. Sci. Technol. 2015, 17, 837–846. [Google Scholar]
- Hashemi, S.M.B.; Gholamhosseinpour, A.; Niakousari, M. Application of microwave and ohmic heating for pasteurization of cantaloupe juice: Microbial inactivation and chemical properties. J. Sci. Food Agric. 2019, 99, 4276–4286. [Google Scholar] [CrossRef]
- Shaw, P.; Kumar, N.; Mumtaz, S.; Lim, J.S.; Jang, J.H.; Kim, D.; Sahu, B.D.; Bogaerts, A.; Choi, E.H. Evaluation of non-thermal effect of microwave radiation and its mode of action in bacterial cell inactivation. Sci. Rep. 2021, 11, 14003. [Google Scholar] [CrossRef]
- He, Q.; Zhang, L.; Song, L.; Zhang, X.; Liu, D.; Hu, Y.; Guo, M. Inactivation of Staphylococcus aureus using ultrasound in combination with thyme essential oil nanoemulsions and its synergistic mechanism. LWT 2021, 147, 111574. [Google Scholar] [CrossRef]
- Soleimanzadeh, B.; Amoozandeh, A.; Shoferpour, M.; Yolmeh, M. New approaches to modeling Staphylococcus aureus inactivation by ultrasound. Ann. Microbiol. 2018, 68, 313–319. [Google Scholar] [CrossRef]
- Li, J.; Wang, J.; Zhao, X.; Wang, W.; Liu, D.; Chen, S.; Ye, X.; Ding, T. Inactivation of Staphylococcus aureus and Escherichia coli in milk by different processing sequences of ultrasound and heat. J. Food Saf. 2019, 39, e12614. [Google Scholar] [CrossRef]
- Osaili, T.M.; Al-Nabulsi, A.A.; Al Sheikh, Y.M.; Alaboudi, A.R.; Olaimat, A.N.; Al-Holy, M.; Al-Rousan, W.M.; Holley, R.; Jo, A.A.A. Inactivation of Salmonella spp., Escherichia coli O157:H7 and Listeria monocytogenes in Tahini by Microwave Heating. Foods 2021, 10, 2972. [Google Scholar] [CrossRef] [PubMed]
- Huang, E.; Mittal, G.S.; Griffiths, M.W. Inactivation of Salmonella enteritidis in Liquid Whole Egg using Combination Treatments of Pulsed Electric Field, High Pressure and Ultrasound. Biosyst. Eng. 2006, 94, 403–413. [Google Scholar] [CrossRef]
- Bi, X.; Wang, X.; Chen, Y.; Chen, L.; Xing, Y.; Che, Z. Effects of combination treatments of lysozyme and high power ultrasound on the Salmonella typhimurium inactivation and quality of liquid whole egg. Ultrason. Sonochem. 2020, 60, 104763. [Google Scholar] [CrossRef]
- Ferrario, M.; Guerrero, S. Effect of a continuous flow-through pulsed light system combined with ultrasound on microbial survivability, color and sensory shelf life of apple juice. Innov. Food Sci. Emerg. Technol. 2016, 34, 214–224. [Google Scholar] [CrossRef]
- Picouet, P.A.; Landl, A.; Abadias, M.; Castellari, M.; Viñas, I. Minimal processing of a Granny Smith apple purée by microwave heating. Innov. Food Sci. Emerg. Technol. 2009, 10, 545–550. [Google Scholar] [CrossRef]
- Das, M.J.; Das, A.J.; Chakraborty, S.; Baishya, P.; Ramteke, A.; Deka, S.C. Effects of microwave combined with ultrasound treatment on the pasteurization and nutritional properties of bottle gourd (Lagenaria siceraria) juice. J. Food Process. Preserv. 2020, 44, e14904. [Google Scholar] [CrossRef]
- Siguemoto, É.S.; Gut, J.A.W.; Martinez, A.; Rodrigo, D. Inactivation kinetics of Escherichia coli O157:H7 and Listeria monocytogenes in apple juice by microwave and conventional thermal processing. Innov. Food Sci. Emerg. Technol. 2018, 45, 84–91. [Google Scholar] [CrossRef] [Green Version]
- Park, J.; Kang, J.-H.; Song, K. Bin Improving the Microbial Safety of Fresh-Cut Endive with a Combined Treatment of Cinnamon Leaf Oil Emulsion Containing Cationic Surfactants and Ultrasound. J. Microbiol. Biotechnol. 2018, 28, 503–509. [Google Scholar] [CrossRef]
- Alenyorege, E.A.; Ma, H.; Ayim, I.; Aheto, J.H.; Hong, C.; Zhou, C. Reduction of Listeria innocua in fresh-cut Chinese cabbage by a combined washing treatment of sweeping frequency ultrasound and sodium hypochlorite. LWT 2019, 101, 410–418. [Google Scholar] [CrossRef]
- Nadeem, M.; Ghaffar, A.; Hashim, M.M.; Murtaza, M.A.; Ranjha, M.M.A.N.; Mehmood, A.; Riaz, M.N. Sonication and Microwave Processing of Phalsa Drink: A Synergistic Approach. Int. J. Fruit Sci. 2021, 21, 993–1007. [Google Scholar] [CrossRef]
- Campos, L.; Seixas, L.; Dias, S.; Peres, A.M.; Veloso, A.C.A.; Henriques, M. Effect of Extraction Method on the Bioactive Composition, Antimicrobial Activity and Phytotoxicity of Pomegranate By-Products. Foods 2022, 11, 992. [Google Scholar] [CrossRef]
- Erdal, B.; Yıkmış, S.; Demirok, N.T.; Bozgeyik, E.; Levent, O. Effects of Non-Thermal Treatment on Gilaburu Vinegar (Viburnum opulus L.): Polyphenols, Amino Acid, Antimicrobial, and Anticancer Properties. Biology 2022, 11, 926. [Google Scholar] [CrossRef] [PubMed]
- Trujillo-Mayol, I.; Céspedes-Acuña, C.; Silva, F.L.; Alarcón-Enos, J. Improvement of the polyphenol extraction from avocado peel by assisted ultrasound and microwaves. J. Food Process Eng. 2019, 42. [Google Scholar] [CrossRef]
- Sharma, M.; Adler, B.B.; Harrison, M.D.; Beuchat, L.R. Thermal tolerance of acid-adapted and unadapted Salmonella, Escherichia coli O157:H7, and Listeria monocytogenes in cantaloupe juice and watermelon juice. Lett. Appl. Microbiol. 2005, 41, 448–453. [Google Scholar] [CrossRef] [PubMed]
- Lee, J.Y.; Kim, S.S.; Kang, D.H. Effect of pH for inactivation of Escherichia coli O157:H7, Salmonella Typhimurium and Listeria monocytogenes in orange juice by ohmic heating. LWT - Food Sci. Technol. 2015, 62, 83–88. [Google Scholar] [CrossRef]
- Song, W.J.; Kang, D.H. Influence of water activity on inactivation of Escherichia coli O157:H7, Salmonella Typhimurium and Listeria monocytogenes in peanut butter by microwave heating. Food Microbiol. 2016, 60, 104–111. [Google Scholar] [CrossRef]
- Park, J.S.; Ha, J.W. Ultrasound treatment combined with fumaric acid for inactivating food-borne pathogens in apple juice and its mechanisms. Food Microbiol. 2019, 84, 103277. [Google Scholar] [CrossRef]
- Malinowska-Pańczyk, E.; Królik, K.; Skorupska, K.; Puta, M.; Martysiak-Żurowska, D.; Kiełbratowska, B. Microwave heat treatment application to pasteurization of human milk. Innov. Food Sci. Emerg. Technol. 2019, 52, 42–48. [Google Scholar] [CrossRef]
- Yusoff, I.M.; Mat Taher, Z.; Rahmat, Z.; Chua, L.S. A review of ultrasound-assisted extraction for plant bioactive compounds: Phenolics, flavonoids, thymols, saponins and proteins. Food Res. Int. 2022, 157, 111268. [Google Scholar] [CrossRef]
- Garcia-Vaquero, M.; Ummat, V.; Tiwari, B.; Rajauria, G. Exploring Ultrasound, Microwave and Ultrasound–Microwave Assisted Extraction Technologies to Increase the Extraction of Bioactive Compounds and Antioxidants from Brown Macroalgae. Mar. Drugs 2020, 18, 172. [Google Scholar] [CrossRef] [Green Version]
- Wang, X.; Peng, M.J.; Wang, Z.H.; Yang, Q.L.; Peng, S. Ultrasound-microwave assisted extraction of flavonoid compounds from Eucommia ulmoides leaves and an evaluation of their antioxidant and antibacterial activities. Arch. Biol. Sci. 2020, 72, 211–221. [Google Scholar] [CrossRef] [Green Version]
- Plazzotta, S.; Ibarz, R.; Manzocco, L.; Martín-Belloso, O. Optimizing the antioxidant biocompound recovery from peach waste extraction assisted by ultrasounds or microwaves. Sonochemistry 2019, 63, 104954. [Google Scholar] [CrossRef]
- Alonso-Carrillo, N.; Aguilar-Santamaría, M.; de los ÁngelesAguilar-Santamaría, M.; Vernon-Carter, E.J.; Jiménez-Alvarado, R.; Cruz-Sosa, F.; Román-Guerrero, A. Extraction of phenolic compounds from Satureja macrostema using microwave-ultrasound assisted and reflux methods and evaluation of their antioxidant activity and cytotoxicity. Ind. Crops Prod. 2017, 103, 213–221. [Google Scholar] [CrossRef]
- Lohani, U.C.; Muthukumarappan, K. Study of continuous flow ultrasonication to improve total phenolic content and antioxidant activity in sorghum flour and its comparison with batch ultrasonication. Ultrason. Sonochem. 2021, 71, 105402. [Google Scholar] [CrossRef]
- Li, P.; Wu, G. Roles of dietary glycine, proline, and hydroxyproline in collagen synthesis and animal growth. Amino Acids 2018, 50, 29–38. [Google Scholar] [CrossRef]
- Noman, A.; Qixing, J.; Xu, Y.; Abed, S.M.; Obadi, M.; Ali, A.H.; AL-Bukhaiti, W.Q.; Xia, W. Effects of ultrasonic, microwave, and combined ultrasonic-microwave pretreatments on the enzymatic hydrolysis process and protein hydrolysate properties obtained from Chinese sturgeon (Acipenser sinensis). J. Food Biochem. 2020, 44. [Google Scholar] [CrossRef]
- Zhao, Y.; Zheng, Y.; Li, Z.; Jiang, Y.; Zhuang, W.; Zheng, B.; Tian, Y. Effects of ultrasonic pretreatments on thermodynamic properties, water state, color kinetics, and free amino acid composition in microwave vacuum dried lotus seeds. Dry. Technol. 2020, 38, 534–544. [Google Scholar] [CrossRef]
- Benmeziane, A.; Boulekbache-Makhlouf, L.; Mapelli-Brahm, P.; Khaled Khodja, N.; Remini, H.; Madani, K.; Meléndez-Martínez, A.J. Extraction of carotenoids from cantaloupe waste and determination of its mineral composition. Food Res. Int. 2018, 111, 391–398. [Google Scholar] [CrossRef]
- Wang, J.; Liu, Q.; Xie, B.; Sun, Z. Effect of ultrasound combined with ultraviolet treatment on microbial inactivation and quality properties of mango juice. Ultrason. Sonochem. 2020, 64, 105000. [Google Scholar] [CrossRef]
- Sánchez, E.; Sanjuán, N.; Cárcel, J.A.; Benedito, J. Aplicación de los ultrasonidos en las industrias de productos lácteos y derivados (y II): Ultrasonidos de alta intensidad. Aliment. Equipos Tecnol. 1998, 17, 135–141. [Google Scholar]
- Carvalho, L.R.F.; Souza, S.R.; Martinis, B.S.; Korn, M. Monitoring of the ultrasonic irradiation effect on the extraction of airborne particulate matter by ion chromatography. Anal. Chim. Acta 1995, 317, 171–179. [Google Scholar] [CrossRef]
- Pérez-Grijalba, B.; García-Zebadúa, J.C.; Ruíz-Pérez, V.M.; Téllez-Medina, D.I.; García-Pinilla, S.; Guzmán-Gerónimo, R.I.; Mora-Escobedo, R. Biofunctionality, colorimetric coefficients and microbiological stability of blackberry (Rubus fructicosus var. Himalaya) juice under microwave/ultrasound processing. Rev. Mex. Ing. Química 2018, 17, 13–28. [Google Scholar] [CrossRef]
- Yıkmış, S.; Aksu, H.; Çöl, B.G.; Alpaslan, M. Thermosonication processing of quince (Cydonia Oblonga) juice: Effects on total phenolics, ascorbic acid, antioxidant capacity, color and sensory properties. Ciência e Agrotecnologia 2019, 43, 1–15. [Google Scholar] [CrossRef]
- Lafarga, T.; Ruiz-Aguirre, I.; Abadias, M.; Viñas, I.; Bobo, G.; Aguiló-Aguayo, I. Effect of Thermosonication on the Bioaccessibility of Antioxidant Compounds and the Microbiological, Physicochemical, and Nutritional Quality of an Anthocyanin-Enriched Tomato Juice. Food Bioprocess Technol. 2019, 12, 147–157. [Google Scholar] [CrossRef] [Green Version]
- Tiwari, B.K.; Muthukumarappan, K.; O’Donnell, C.P.; Cullen, P.J. Colour degradation and quality parameters of sonicated orange juice using response surface methodology. LWT - Food Sci. Technol. 2008, 41, 1876–1883. [Google Scholar] [CrossRef]
- Raju, S.; Deka, S.C. Influence of thermosonication treatments on bioactive compounds and sensory quality of fruit (Haematocarpus validus) juice. J. Food Process. Preserv. 2018, 42, e13701. [Google Scholar] [CrossRef]
Figure 1.
Three-dimensional response surface plots showing the influence of process factors on E. coli ATCC 25922: (X1) ultrasound time (min); (X2) ultrasound amplitude (%); (X3) microwave time (s); (X4) microwave power (W).
Figure 1.
Three-dimensional response surface plots showing the influence of process factors on E. coli ATCC 25922: (X1) ultrasound time (min); (X2) ultrasound amplitude (%); (X3) microwave time (s); (X4) microwave power (W).

Figure 2.
Three-dimensional response surface plots representing the effect of process variable on S. aureus ATCC 6538: (X1) ultrasound time (min); (X2) ultrasound amplitude (%); (X3) microwave time (s); (X4) microwave power (W).
Figure 2.
Three-dimensional response surface plots representing the effect of process variable on S. aureus ATCC 6538: (X1) ultrasound time (min); (X2) ultrasound amplitude (%); (X3) microwave time (s); (X4) microwave power (W).

Figure 3.
Three-dimensional response surface plots representing the effect of process variable on S. Enteritidis ATCC 13076: (X1) ultrasound time (min); (X2) ultrasound amplitude (%); (X3) microwave time (s); (X4) microwave power (W).
Figure 3.
Three-dimensional response surface plots representing the effect of process variable on S. Enteritidis ATCC 13076: (X1) ultrasound time (min); (X2) ultrasound amplitude (%); (X3) microwave time (s); (X4) microwave power (W).

Figure 4.
Three-dimensional response surface plots representing the effect of process variable on L. monocytogenes DSM 12464: (X1) ultrasound time (min); (X2) ultrasound amplitude (%); (X3) microwave time (s); (X4) microwave power (W).
Figure 4.
Three-dimensional response surface plots representing the effect of process variable on L. monocytogenes DSM 12464: (X1) ultrasound time (min); (X2) ultrasound amplitude (%); (X3) microwave time (s); (X4) microwave power (W).

Figure 5.
Total phenolic content (A), total flavonoid content (B), radical scavenging activity (C), and cupric reducing antioxidant capacity (D) of untreated tangerine juice (C-TJ), thermally pasteurized tangerine juice (P-TJ), ultrasound–microwave-treated tangerine juice (UM-TJ). Characters atop bars indicate statistically significant differences. Analyses were performed with three replicates. (ns: no significant; * p < 0.05; ** p < 0.01), *** p < 0.001).

Figure 6.
Pearson’s correlation coefficients of bioactive compounds, amino acids, and mineral and color values of tangerine juice samples.
Figure 6.
Pearson’s correlation coefficients of bioactive compounds, amino acids, and mineral and color values of tangerine juice samples.


Table 1.
Independent variable values and their corresponding proportions used in RSM.
| Independent Variable | Level | ||
|---|---|---|---|
| −1 | 0 | 1 | |
| U-time (min, X1 ) | 12 | 16 | 20 |
| Amplitude (%, X2 ) | 60 | 80 | 100 |
| M-time (s, X3) | 30 | 35 | 40 |
| Microwave power (Watt, X4) | 200 | 450 | 700 |
U-Time: ultrasound treatment time, M-Time: microwave treatment time.
Table 2.
Experimental studies on the inhibition of pathogens proposed by Box–Behnken Design (BBD) and experimental design matrix and response based on predicted values.
Table 2.
Experimental studies on the inhibition of pathogens proposed by Box–Behnken Design (BBD) and experimental design matrix and response based on predicted values.
| Sample | Encoded Independent Variables | Dependent Variables (Log Reduction) | ||||||||||
|---|---|---|---|---|---|---|---|---|---|---|---|---|
| Ultrasound | Microwave | Response 1 | Response 2 | Response 3 | Response 4 | |||||||
| X1- Time (min) | X2- Amplitude (%) | X3- Time (s) | X4- Power (W) | E.coli ATCC 25922 (Log CFU/mL) | S. aureus ATCC 6538 (Log CFU/mL) | S. Enteritidis ATCC 13076 (Log CFU/mL) | L. monocytogenes DSM 12464 (Log CFU/mL) | |||||
| Experimental Data | RSM Predicted | Experimental Data | RSM Predicted | Experimental Data | RSM Predicted | Experimental Data | RSM Predicted | |||||
| 1 | 12 | 60 | 30 | 700 | 3.81 | 3.61 | 3.75 | 3.93 | 3.88 | 4.00 | 5.88 | 6.03 |
| 2 | 20 | 100 | 40 | 700 | 6.68 | 6.32 | 6.36 | 6.33 | 6.07 | 6.10 | 8.00 | 8.16 |
| 3 | 20 | 100 | 30 | 200 | 0.44 | 0.42 | 0.48 | 0.49 | 0.55 | 0.53 | 1.55 | 1.55 |
| 4 | 12 | 100 | 40 | 700 | 6.25 | 6.13 | 6.13 | 6.24 | 5.86 | 5.99 | 8.00 | 8.15 |
| 5 | 20 | 80 | 35 | 450 | 1.85 | 1.86 | 1.72 | 1.96 | 2.00 | 2.23 | 3.78 | 3.87 |
| 6 | 20 | 60 | 40 | 700 | 6.23 | 6.13 | 6.11 | 6.26 | 5.84 | 5.99 | 8.00 | 8.14 |
| 7 | 20 | 100 | 30 | 700 | 3.93 | 3.85 | 3.85 | 4.16 | 3.97 | 4.15 | 6.03 | 6.12 |
| 8 | 16 | 80 | 35 | 450 | 1.83 | 1.73 | 1.70 | 1.67 | 1.98 | 1.94 | 3.85 | 3.90 |
| 9 | 12 | 60 | 40 | 200 | 0.58 | 0.50 | 0.51 | 0.39 | 0.63 | 0.60 | 1.59 | 1.64 |
| 10 | 20 | 60 | 30 | 200 | 0.35 | 0.31 | 0.22 | 0.29 | 0.43 | 0.44 | 1.5 | 1.48 |
| 11 | 16 | 80 | 35 | 450 | 1.83 | 1.73 | 1.70 | 1.67 | 1.98 | 1.94 | 3.85 | 3.90 |
| 12 | 16 | 80 | 35 | 450 | 1.83 | 1.73 | 1.70 | 1.67 | 1.98 | 1.94 | 3.85 | 3.90 |
| 13 | 16 | 80 | 35 | 450 | 1.83 | 1.73 | 1.70 | 1.67 | 1.98 | 1.94 | 3.85 | 3.90 |
| 14 | 16 | 80 | 35 | 450 | 1.83 | 1.73 | 1.70 | 1.67 | 1.98 | 1.94 | 3.85 | 3.90 |
| 15 | 12 | 80 | 35 | 450 | 1.83 | 1.77 | 1.72 | 1.88 | 2.03 | 2.18 | 3.84 | 3.85 |
| 16 | 16 | 80 | 35 | 200 | 0.56 | 0.55 | 0.49 | 0.55 | 0.61 | 0.64 | 2.01 | 2.07 |
| 17 | 20 | 60 | 40 | 200 | 0.60 | 0.54 | 0.54 | 0.45 | 0.64 | 0.63 | 1.64 | 1.64 |
| 18 | 20 | 100 | 40 | 200 | 0.63 | 0.67 | 0.56 | 0.56 | 0.67 | 0.70 | 1.65 | 1.66 |
| 19 | 16 | 60 | 35 | 450 | 1.83 | 1.76 | 1.73 | 1.86 | 1.96 | 2.07 | 3.84 | 3.89 |
| 20 | 16 | 100 | 35 | 450 | 1.86 | 1.88 | 1.74 | 1.99 | 1.87 | 2.15 | 3.89 | 3.93 |
| 21 | 12 | 100 | 30 | 700 | 3.87 | 3.71 | 3.82 | 4.07 | 3.94 | 4.08 | 5.95 | 6.09 |
| 22 | 16 | 80 | 30 | 450 | 0.97 | 0.79 | 0.81 | 0.44 | 0.81 | 0.9 | 2.73 | 2.88 |
| 23 | 20 | 60 | 30 | 700 | 3.85 | 3.68 | 3.78 | 4.00 | 3.90 | 4.03 | 5.90 | 6.05 |
| 24 | 16 | 80 | 35 | 450 | 1.83 | 1.73 | 1.70 | 1.67 | 1.98 | 1.94 | 3.85 | 3.90 |
| 25 | 12 | 100 | 30 | 200 | 0.42 | 0.36 | 0.38 | 0.41 | 0.49 | 0.49 | 1.51 | 1.51 |
| 26 | 16 | 80 | 35 | 700 | 5.11 | 5.02 | 4.90 | 5.28 | 4.73 | 5.12 | 7.53 | 7.61 |
| 27 | 12 | 60 | 30 | 200 | 0.18 | 0.32 | 0.05 | 0.23 | 0.36 | 0.45 | 1.47 | 1.45 |
| 28 | 16 | 80 | 35 | 450 | 1.83 | 1.73 | 1.70 | 1.67 | 1.98 | 1.94 | 3.85 | 3.90 |
| 29 | 16 | 80 | 40 | 450 | 1.98 | 2.11 | 0.83 | 1.6 | 1.66 | 1.95 | 4.04 | 3.99 |
| 30 | 12 | 60 | 40 | 700 | 6.21 | 6.01 | 6.03 | 6.18 | 5.79 | 5.93 | 8.00 | 8.15 |
| 31 | 12 | 100 | 40 | 200 | 0.61 | 0.56 | 0.55 | 0.48 | 0.64 | 0.63 | 1.64 | 1.64 |
Table 3.
Analysis of variance in a regression model of the central combination test.
| Source | DF | Adj SS | Adj MS | F-Value | p-Value | Adj SS | Adj MS | F-Value | p-Value | Adj SS | Adj MS | F-Value | p-Value | Adj SS | Adj MS | F-Value | p-Value |
|---|---|---|---|---|---|---|---|---|---|---|---|---|---|---|---|---|---|
| E.coli ATCC 25922 | S. aureus ATCC 6538 | S. Enteritidis ATCC 13076 | L. monocytogenes DSM 12464 | ||||||||||||||
| Model | 14 | 116.80 | 8.34 | 754.12 | 0.000 | 114.461 | 8.1758 | 127.77 | 0.000 | 98.99 | 7.07 | 387.14 | 0.000 | 144.41 | 10.32 | 4750.77 | 0.000 |
| Linear | 4 | 103.91 | 25.98 | 2348.09 | 0.000 | 99.394 | 24.8484 | 388.34 | 0.000 | 89.49 | 22.37 | 1224.89 | 0.000 | 137.57 | 34.39 | 15839.34 | 0.000 |
| 1 | 0.04 | 0.04 | 3.2 | 0.092 | 0.025 | 0.0252 | 0.39 | 0.539 | 0.01 | 0.01 | 0.6 | 0.450 | 0.00 | 0.00 | 0.74 | 0.402 | |
| 1 | 0.06 | 0.06 | 5.48 | 0.033 | 0.071 | 0.0713 | 1.11 | 0.307 | 0.02 | 0.02 | 1.25 | 0.279 | 0.01 | 0.01 | 4.38 | 0.053 | |
| 1 | 7.90 | 7.90 | 714.24 | 0.000 | 6.127 | 6.1266 | 95.75 | 0.000 | 4.97 | 4.97 | 272.32 | 0.000 | 5.60 | 5.60 | 2577.92 | 0.000 | |
| 1 | 95.91 | 95.91 | 8669.42 | 0.000 | 93.17 | 93.1705 | 1456.09 | 0.000 | 84.48 | 84.48 | 4625.37 | 0.000 | 131.96 | 131.96 | 60774.32 | 0.000 | |
| Square | 4 | 7.96 | 1.99 | 179.78 | 0.000 | 10.648 | 2.662 | 41.60 | 0.000 | 6.33 | 1.58 | 86.63 | 0.000 | 3.09 | 0.77 | 355.81 | 0.000 |
| 1 | 0.02 | 0.02 | 1.69 | 0.212 | 0.163 | 0.1627 | 2.54 | 0.130 | 0.18 | 0.18 | 10.08 | 0.006 | 0.01 | 0.01 | 2.11 | 0.165 | |
| 1 | 0.02 | 0.02 | 2.1 | 0.167 | 0.175 | 0.1754 | 2.74 | 0.117 | 0.07 | 0.07 | 3.99 | 0.063 | 0.00 | 0.00 | 0.14 | 0.714 | |
| 1 | 0.20 | 0.20 | 17.75 | 0.001 | 1.095 | 1.0953 | 17.12 | 0.001 | 0.69 | 0.69 | 37.6 | 0.000 | 0.57 | 0.57 | 261.29 | 0.000 | |
| 1 | 3.05 | 3.05 | 275.66 | 0.000 | 3.895 | 3.8951 | 60.87 | 0.000 | 2.20 | 2.20 | 120.22 | 0.000 | 2.18 | 2.18 | 1004.32 | 0.000 | |
| 2-Way Interaction | 6 | 4.94 | 0.82 | 74.36 | 0.000 | 4.419 | 0.7366 | 11.51 | 0.000 | 3.18 | 0.53 | 28.98 | 0.000 | 3.76 | 0.63 | 288.36 | 0.000 |
| 1 | 0.01 | 0.00 | 0.43 | 0.519 | 0 | 0.0002 | 0.00 | 0.951 | 0.00 | 0.00 | 0.11 | 0.742 | 0.00 | 0.00 | 0.12 | 0.737 | |
| 1 | 0.00 | 0.00 | 0.24 | 0.631 | 0 | 0 | 0.00 | 0.987 | 0.00 | 0.00 | 0.05 | 0.822 | 0.00 | 0.00 | 0.37 | 0.552 | |
| 1 | 0.01 | 0.01 | 0.5 | 0.492 | 0 | 0.0003 | 0.00 | 0.949 | 0.00 | 0.00 | 0.08 | 0.777 | 0.00 | 0.00 | 0.03 | 0.860 | |
| 1 | 0.00 | 0.00 | 0.03 | 0.874 | 0.007 | 0.0066 | 0.10 | 0.752 | 0.00 | 0.00 | 0.01 | 0.920 | 0.00 | 0.00 | 1.5 | 0.239 | |
| 1 | 0.00 | 0.00 | 0.34 | 0.566 | 0.002 | 0.0018 | 0.03 | 0.868 | 0.00 | 0.00 | 0.06 | 0.811 | 0.00 | 0.00 | 0.03 | 0.866 | |
| 1 | 4.92 | 4.92 | 444.6 | 0.000 | 4.411 | 4.4105 | 68.93 | 0.000 | 3.17 | 3.17 | 173.54 | 0.000 | 3.75 | 3.75 | 1728.13 | 0.000 | |
| Error | 16 | 0.18 | 0.01 | 1.024 | 0.064 | 0.29 | 0.02 | 0.04 | 0.00 | ||||||||
| Lack of Fit | 10 | 0.18 | 0.02 | * | * | 1.024 | 0.1024 | * | * | 0.29 | 0.03 | * | * | 0.04 | 0.00 | * | * |
| Pure Error | 6 | 0.00 | 0.00 | 0 | 0 | 0 | 0 | 0.00 | 0.00 | ||||||||
| Total | 30 | ||||||||||||||||
| 99.85% | 99.11% | 99.71% | 99.98% | ||||||||||||||
| Adj | 99.72% | 98.34% | 99.45% | 99.95% | |||||||||||||
| Pred. | 99.07% | 96.28% | 98.95% | 99.89% | |||||||||||||
X1: Ultrasound time; X2: ultrasound amplitude; X3: microwave power; X4: microwave time df: degrees of freedom. R2; coefficient of determination. p < 0.05, significant differences; p < 0.01, very significant differences. * Doesn’t matter in statistical calculation.
Table 4.
The optimization values according to RSM.
| Variable | Setting | |||
|---|---|---|---|---|
| X1- Time (min) | 12 | |||
| X2- Amplitude (%) | 60 | |||
| X3- Time (s) | 34 | |||
| X4- Power (W) | 700 | |||
| Response (UM-TJ) | Fit | SE Fit | 95% CI | 95% PI |
| E.coli ATCC 25922 (log CFU/mL) | 5.00 | 0.0909 | (4.8072; 5.1928) | (4.7052; 5.2947) |
| S. aureus ATCC 6538 (log CFU/mL) | 5.27 | 0.219 | (4.803; 5.730) | (4.558; 5.975) |
| S. Enteritidis ATCC 13076 (log CFU/mL) | 5.12 | 0.117 | (4.868; 5.363) | (4.737; 5.494) |
| L. monocytogenes DSM 12464 (log CFU/mL) | 7.19 | 0.0403 | (7.1021; 7.2729) | (7.0569; 7.3181) |
CI: confidence interval; PI: prediction interval.
Table 5.
Effects of C-TJ, P-TJ, and UM-TJ on free amino acids (mg/100 mL).
| Amino Acid Content (mg/100 mL) | Samples | ||
|---|---|---|---|
| C-TJ | P-TJ | UM-TJ | |
| Alanine (Ala) | 13.84 ± 0.01 b | 10.68 ± 0.02 a | 18.79 ± 0.01 c |
| Arginine (Arg) | 105.58 ± 0.1 b | 90.59 ± 0.16 a | 115.64 ± 0.36 c |
| Aspartic Acid (Asp) | 46.22 ± 0.07 b | 25.97 ± 0.01 a | 80.69 ± 0.04 a |
| Cysteine (Cys) | n.d | n.d | 0.01 ± 0.01 |
| Glutamic Acid (Glu) | 7.74 ± 0.01 b | 4.78 ± 0.00 a | 13.45 ± 0.01 a |
| Glycine (Gly) | 1.39 ± 0.01 a | 1.46 ± 0.00 b | 1.53 ± 0.00 c |
| Histidine (His) | n.d | n.d | 0.22 ± 0.00 |
| Isoleucine (Ile) | 0.17 ± 0.01 b | 0.08 ± 0.00 a | 1.00 ± 0.00 c |
| Leucine (Leu) | 0.55 ± 0.01 b | 0.43 ± 0.00 a | 2.01 ± 0.00 c |
| Lysine (Lys) | 1.55 ± 0.01 b | 0.75 ± 0.00 a | 7.07 ± 0.01 c |
| Methionine (Met) | 0.15 ± 0.01 b | 0.10 ± 0.00 a | 0.69 ± 0.01 c |
| Ornithine (Orn) | 3.27 ± 0.00 b | 2.65 ± 0.01 a | 3.86 ± 0.01 c |
| Phenylalanine (Phe) | 0.43 ± 0.01 a | 0.33 ± 0.01 a | 2.43 ± 0.05 b |
| Proline (Pro) | 202.41 ± 0.06 b | 143.09 ± 0.09 a | 220.40 ± 0.24 c |
| Serine (Ser) | 13.26 ± 0.00 b | 9.60 ± 0.00 a | 16.77 ± 0.06 c |
| Threonine (Thr) | 2.57 ± 0.01 b | 1.51 ± 0.02 a | 3.85 ± 0.01 c |
| Tyrosine (Tyr) | 0.82 ± 0.00 b | 0.31 ± 0.00 a | 1.68 ± 0.00 c |
| Valine (Val) | 1.12 ± 0.00 b | 0.70 ± 0.00 a | 3.01 ± 0.00 c |
| Totals (mg/100 mL) | 401.02 ± 0.04 a | 293.01 ± 0.23 b | 493.05 ± 0.48 c |
The results are presented as the mean ± standard deviation (n = 3). C-TJ: untreated tangerine juice P-TJ: thermally pasteurized tangerine juice; UM-TJ: ultrasound–microwave treated tangerine juice. a–c Values with different letters within each line are significantly different (p < 0.05).
Table 6.
Effects of C-TJ, P-TJ, and UM-TJ on minerals (mg/L).
| Minerals (Minerals (mg/L) | Samples | ||
|---|---|---|---|
| C-TJ | P-TJ | UM-TJ | |
| Ag | n.d | n.d | n.d |
| Al | 0.05 ± 0.00 a | n.d | 0.05 ± 0.00 a |
| Ca | 125.49 ± 0.01 a | 106.45 ± 0.01 b | 81.16 ± 0.01 c |
| Cd | n.d | n.d | n.d |
| Co | n.d | n.d | n.d |
| Cr | n.d | n.d | n.d |
| Cu | 0.60 ± 0.01 b | 0.26 ± 0.00 c | 1.05 ± 0.00 a |
| Fe | 1.68 ± 0.01 a | 0.78 ± 0.15 b | 1.13 ± 0.01 b |
| K | 1834.16 ± 0.06 c | 2281.62 ± 0.10 a | 1981.56 ± 0.16 b |
| Mg | 41.96 ± 0.03 b | 27.96 ± 0.02 c | 54.16 ± 0.01 a |
| Mn | 0.27 ± 0.00 a | 0.17 ± 0.00 b | 0.26 ± 0.00 a |
| Na | 9.32 ± 0.00 b | 8.12 ± 0.01 c | 9.46 ± 0.00 a |
| Ni | n.d | n.d | n.d |
| Pb | n.d | n.d | n.d |
| Zn | 0.64 ± 0.00 b | 0.46 ± 0.00 c | 0.86 ± 0.01 a |
The results are presented as the mean ± standard deviation (n = 3). C-TJ: untreated tangerine juice P-TJ: thermally pasteurized tangerine juice; UM-TJ: ultrasound–microwave treated tangerine juice: n.d: not detected. a–c Values with different letters within each line are significantly different (p < 0.05).
Table 7.
Analysis results of color values of L*, a*, b*, C, and h° of C-TJ, P-TJ, and UM-TJ samples.
Table 7.
Analysis results of color values of L*, a*, b*, C, and h° of C-TJ, P-TJ, and UM-TJ samples.
| Analyzes | Samples | |||
|---|---|---|---|---|
| C-TJ | P-TJ | UM-TJ | ||
| Color | L* | 50.24 ± 0.74 a | 52.85 ± 0.72 b | 55.72 ± 0.61 c |
| a* | 12.36 ± 0.58 b | 9.90 ± 0.42 a | 11.30 ± 0.36 b | |
| b* | 14.46 ± 0.25 b | 11.26 ± 0.28 a | 15.50 ± 0.12 c | |
| Chroma (C) | 19.02 ± 0.56 b | 15.00 ± 0.47 a | 19.19 ± 0.21 b | |
| Hue angle (h°) | 49.49 ± 0.85 a | 48.68 ± 0.69 a | 53.91 ± 0.94 b | |
| ΔE | - | 4.88 ± 0.42 | 5.59 ± 1.17 | |
C-TJ: untreated tangerine juice P-TJ: thermally pasteurized tangerine juice; UM-TJ: ultrasound–microwave treated tangerine juice; ΔE: total color change. a–c Values with different letters within each line are significantly different (p < 0.05).
Publisher’s Note: MDPI stays neutral with regard to jurisdictional claims in published maps and institutional affiliations. |
© 2022 by the authors. Licensee MDPI, Basel, Switzerland. This article is an open access article distributed under the terms and conditions of the Creative Commons Attribution (CC BY) license (https://creativecommons.org/licenses/by/4.0/).
Share and Cite
MDPI and ACS Style
Demirok, N.T.; Yıkmış, S. Combined Effect of Ultrasound and Microwave Power in Tangerine Juice Processing: Bioactive Compounds, Amino Acids, Minerals, and Pathogens. Processes 2022, 10, 2100. https://doi.org/10.3390/pr10102100
AMA Style
Demirok NT, Yıkmış S. Combined Effect of Ultrasound and Microwave Power in Tangerine Juice Processing: Bioactive Compounds, Amino Acids, Minerals, and Pathogens. Processes. 2022; 10(10):2100. https://doi.org/10.3390/pr10102100
Chicago/Turabian StyleDemirok, Nazan Tokatlı, and Seydi Yıkmış. 2022. "Combined Effect of Ultrasound and Microwave Power in Tangerine Juice Processing: Bioactive Compounds, Amino Acids, Minerals, and Pathogens" Processes 10, no. 10: 2100. https://doi.org/10.3390/pr10102100
Note that from the first issue of 2016, this journal uses article numbers instead of page numbers. See further details here.