

A Review on Data-Driven Quality Prediction in the Production Process with Machine Learning for Industry 4.0

1
School of Computer Science and Engineering, Vellore Institute of Technology, Chennai 600127, India
2
Project Manager (R&D), Digital Engineering Services, Photon Inc., Chennai 600089, India
3
School of Engineering, University of Greenwich, Kent ME4 4TB, UK
*
Author to whom correspondence should be addressed.
Processes 2022, 10(10), 1966; https://doi.org/10.3390/pr10101966
Submission received: 22 August 2022
/
Revised: 19 September 2022
/
Accepted: 21 September 2022
/
Published: 29 September 2022
(This article belongs to the Special Issue Machine Learning and Optimization Algorithms for Data Analysis and Other Engineering Applications)
Abstract
:The quality-control process in manufacturing must ensure the product is free of defects and performs according to the customer’s expectations. Maintaining the quality of a firm’s products at the highest level is very important for keeping an edge over the competition. To maintain and enhance the quality of their products, manufacturers invest a lot of resources in quality control and quality assurance. During the assembly line, parts will arrive at a constant interval for assembly. The quality criteria must first be met before the parts are sent to the assembly line where the parts and subparts are assembled to get the final product. Once the product has been assembled, it is again inspected and tested before it is delivered to the customer. Because manufacturers are mostly focused on visual quality inspection, there can be bottlenecks before and after assembly. The manufacturer may suffer a loss if the assembly line is slowed down by this bottleneck. To improve quality, state-of-the-art sensors are being used to replace visual inspections and machine learning is used to help determine which part will fail. Using machine learning techniques, a review of quality assessment in various production processes is presented, along with a summary of the four industrial revolutions that have occurred in manufacturing, highlighting the need to detect anomalies in assembly lines, the need to detect the features of the assembly line, the use of machine learning algorithms in manufacturing, the research challenges, the computing paradigms, and the use of state-of-the-art sensors in Industry 4.0.
1. Introduction
The state of industrial engineering that we see today is the result of consecutive advancements in the field of manufacturing in terms of innovation and economic development. Generally, the industrial revolution has been considered as the ongoing process that was initiated in the late 18th century, but four major changes in the field of manufacturing are the reason for what the industry looks like right now. These four major changes are often regarded as the pioneer that brought landscape changes in the manufacturing industry, so they are generally classified as the industrial revolution that shaped the manufacturing industry. A revolution builds on the knowledge gained from previous revolutions and creates progressively complex networks for commercial exchange. The foremost industrial revolution came in the late 18th century, mainly aimed at the benefits of mechanisms. The main focus of the 1st industrial revolution was to find a substitute for humans or animals by the means of mechanical labour. The machines of this time required a large amount of energy and were generally situated near the source of the energy, such as coal. The means of energy generation was also limited to coal as modern sources of energy, such as solar energy, hydro energy, and wind energy, were not discovered yet. This combination of machines situated near the energy source gave rise to a new form of living, called industrial cities.
These towns tend to be situated near an energy source and had a well-connected transportation network. New forms of manufacturing activities emerged in these cities as they grew in terms of population. These manufacturing activities include steel, textiles, tools, etc. Thus, by the use of mechanisms, machines were created using conventional energy sources, and these attracted the population, which brought more manufacturing activities. As the relationship between man and machine grew more and more, this created complex commercial relations and an advanced form of manufacturing.
The principle of the 2nd revolution was based on mass production along assembly lines, which helped in scaling up the output of the manufacturing industries. The 2nd revolution assisted in the advancement of the workforce, task, procedure, and machine coordination. This coordination also helped in growing the output of the manufacturing industries. The introduction of specialty and connection in manufacturing engineering, which gave rise to several manufacturing parks, was one of the primary outputs of the 2nd revolution (industrial belts). The access to electricity at a cheaper cost also fuelled the development of these industrial parks in the 2nd revolution. The 2nd industrial revolution had a heavy dependence on modern telecommunication systems, such as radios, telegraphs, and telephones, for better communication among these interdependent manufacturing ecosystems. In this era, we experienced a major shift in the aspect of manufacturing units and the place of energy sources. Due to the development of long-distance transportation, such as railway and ferry services, we were able to create manufacturing parks at locations that were far from coal mining cities, as the coals were transported to the respective locations by the means of railway and ferry services. The 3rd industrial revolution took place in the late 20th century, where the driving factor of the advancement in manufacturing was automation. As the burden of employing humans for doing repetitive work in the manufacturing industry increased, the industrialist focused on finding an alternate solution to the problem. This gave rise to the deployment of computer-aided manufacturing processes. Computers took a central role, as many processes in manufacturing were assisted by the computers. This gave rise to the Computer-Aided Design (CAD) package besides Computer-Aided Manufacturing (CAM) in the industrial engineering industry.
Computer-Aided Design (CAD) is the process of designing the parts to be manufactured with the assistance of a computer. By using a computer to design the parts, the accuracy of the part to be produced increases and computers are easily able to simulate the conditions in which the manufactured part will be used. In turn, Computer-Aided Manufacturing (CAM) is a process in which the software and computer-controlled machinery are combined to manufacture the part. CAM increases the accuracy of the product by neglecting the error possibility caused by a human operator. During the 3rd industrial revolution, globalization played a vital role as the trade policies between the countries were relaxed and low-cost labour from developing countries was available as a suitable alternative to mechanization. So, globalization greatly benefited the manufacturing industry as it enabled minimum input costs, especially related to labour and technology sharing among various manufacturing countries.
The term “Industry 4.0” was first used in the Federal Republic of Germany in 2011 during the “Hannover Fair”. The event’s objective was to unveil a new German financial strategy related to high initiatives, heralding the start of the 4th industrial revolution [1,2]. In the 4th industrial revolution, it was accepted that industrialization was the main cause of environmental degradation. So, in the 4th industrial revolution, the main aim of the manufacturing industry is to create a viable and sustainable ecosystem that minimizes the degradation of the environment. The manufacturing industry in the industrial revolution focuses on improving the product life cycle, collaborative manufacturing along with cyber-physical systems, and applying industrial principles, such as decentralizing, virtualization, and interoperability. Manufacturing’s emphasis has switched from mass production to smaller batch manufacturing, which can result in a more exact reaction to variations in the request curve while also reducing production waste [3]. Figure 1 shows the four industrial revolutions.
Industry 4.0 also works on complete network communication between companies, factories, suppliers, logistics, resources, customers, etc. This will assist the company in staying current with real-time demand curve fluctuations. Industry 4.0 primarily focuses on creating “smart factories” [4], where items may be distinguished and located at all periods by stakeholders. The stakeholders will also be able to know the history of the product, the current status of the product, and all the possible routes the product has to reach its target state. Thus, the stakeholders can efficiently guide the product to its target state and reduce the transportation time to a minimum. As a result, Industry 4.0 encompasses a wide variety of critical factors for the evolution of a sustainable industrial sector. Minimizing waste, the wise utilization of natural resources, efficient usage of raw materials, high power capacity, and streamlining production time are all vital values for the sector’s long-term management. In this paper, we aim to find the recent trends and changes that have taken place after Industry 4.0 concerning machine learning.
The rest of the paper is organized as follows: Section 1 deals with a summary of the four industrial revolutions that took place in the manufacturing sector; Section 2 describes the background of existing technologies; Section 3 highlights the need to detect the anomalies and features of an assembly line; Section 4 deals with machine learning algorithms; Section 5 discusses the research challenges; Section 6 discusses the computing paradigm; Section 7 discusses the state-of-the-art sensors used in Industry 4.0; Section 8 shows a multi-level graph approach of Industry 4.0; Section 9 contain the conclusions; and Section 10 discusses future work.
2. Background
Industry 4.0 is enabled by the following technologies (Figure 2).
- (a)
- Big Data
In Industry 4.0, information from production is evaluated and processed to propose data-driven solutions to current problems. This necessitates a well-defined, complicated structure of the manufacturing facility, as well as many Industrial Internet of Things (IIoT) sensors capable of monitoring operations in real time and sending data for processing. A large amount of data is created when several sensors are used to examine any given stage of a manufacturing process. These data must then be saved to comprehend the performance evaluation of the manufacturing process and to modify the process as needed. As a result, big data management is required for effective data management and storage.
Leite M et al. [5] described the need for big data in Industry 4.0. As more sensors are used, and where these sensors can communicate with one another, a complex network of data is created. These data must be mined, evaluated, and preserved since it is the property of the supplied organization. The authors also mentioned the properties of these data that must be dealt with, which are volume, variety, velocity, value, and veracity. The authors then used a case study to examine the differences between the data collected using processing procedures and data received from social media.
- (b)
- Real-Time Optimization
Leite et al. [5] described the real-time optimization of the supply chain in the era of Industry 4.0. The authors attempted to achieve supply-chain process solutions that are internationally optimal and adaptable in the manufacturing business. The authors attempted to concentrate on the supply-chain market’s planning and scheduling phases. Planners can deal with market uncertainty by improving the planning and scheduling processes.
The authors also emphasized the sustainable process as a new need that may be met by real-time process optimization. This will allow for eco-friendly operation while also lowering costs. To discover the best answer to the challenges presented during the planning and scheduling phases, the authors adopted a meta-heuristic method.
- (c)
- Cloud Computing
Yen et al. [6] focused on improving the speed of production performance. The authors underlined the need of increasing productivity to offer the product to the organization. The fourth industrial revolution places a strong emphasis on cyber-physical systems. Yen et al. [6] classified cyber-physical systems into three broad categories: cloud services, sensor infrastructure, and embedded systems. The authors also emphasized the significance of cloud services, which enable data storage and security while also allowing employees to access services or data regardless of their physical presence in a specific geographic region. The cloud storage service offloads server maintenance to a third party while ensuring the data’s security and availability for the consumer. This allows a manufacturing organization to simply expand and descale their infrastructure based on their needs without incurring infrastructure costs. The second advantage of cloud services is to provide services to the customer without the physical installation of any specific software. Finally, cloud services allow for a more seamless transformation and transfer of data both within and outside the cloud architecture. These contribute to increased manufacturing process productivity.
- (d)
- Cyber-Physical System
Jazdi et al. [7] described the importance of cyber-physical systems to lead in the new industrial revolution, namely, the data-centric Industry 4.0. The authors also compared the cyber-physical system to a typical embedded system, with the main distinction being the intercommunication capability provided by the cyber-physical system. Jazdi et al. [7] also showed that a cyber-physical system with the help of the Internet of Things presents the capability of smart networking, mobility, and flexibility.
- (e)
- Additive Manufacturing
Ugur M Dilberoglu et al. [8] emphasized the need for additive manufacturing and its importance in Industry 4.0. According to the authors, as mass customization becomes possible in smart factories, the need of meeting customers’ demands for minute detail has been stressed. This is possible by using additive manufacturing methods. As a result, additive manufacturing has gained widespread acceptance in the fields of aerospace manufacturing, automobile manufacturing, pharmaceutical manufacturing, and so on.
- (f)
- Cobots
Rinat Galin et al. [9] suggested how robots can collaborate with humans to complete a given task efficiently. One of the most visible aspects of Industry 4.0 is the usage of robots in manufacturing. Robots are more efficient and precise than humans in performing repetitive tasks in the industry. The authors divided industrial robots into three categories: industrial robotics, collaborative robots, and mobile/semi-autonomous robots. An industrial robot is reprogrammable and inflexible to a position. Collaborative robots aid people in completing tasks while being near the operator. The third type of robot is a semi-autonomous mobile robot that follows the operator’s instructions.
- (g)
- Machine Learning
Machine Learning is the process of evaluating previous data and solving current issues. Machine learning has been a prominent topic in the implementation of Industry 4.0, with a focus on data-centric solutions. Machine learning is divided into three categories: machine learning, deep learning, and artificial intelligence. Machine Learning takes a shallow learning approach to the data to provide a given output, while deep learning itself tries to find the correlation before providing any given output. To make repetitious tasks autonomous, artificial intelligence uses machine learning or a deep learning technique.
- (h)
- Augmented Reality
Volker Paelke et al. [10] suggested the use of augmented reality in a smart factory environment. Augmented reality may simulate the real environment, allowing workers to receive more hands-on training. Workers will be able to work more efficiently as a result of this. A shift from a command line interface to a graphical user interface, to augment reality, is also suggested by the authors. The graphical user interface was able to offer a visual depiction of the task, whereas augmented reality can assist in fully visualizing the environment in which the work is to be completed. The authors also discussed how to employ video see-through, optical see-through, and projection for a more effective training experience for workers.
- (i)
- Internet of Things
In Industry 4.0, data collection and data sharing play a vital role in providing data solutions to smart factories. As a result, cyber-physical systems are used to create smart sensors that gather and interact with one another. The Industrial Internet of Things (IIOT) infrastructure is utilized for communication among these sensors and data collection. Wan et al. [11] defined IIoT as the ability to collect data from various sensors in the network securely and forward the given data to the cloud services for analysis of the data. As a result, the IIoT bridges the gap in collecting and transferring sensitive data from sensors to cloud infrastructure.
3. Anomaly Detection
In data science, the process of identifying events and observations that deviate from the usual pattern in the dataset is called anomaly detection. Outliers are different from anomalies. In a given dataset, the data are closed together based on any given standard deviation of the mean or median. There can be some extreme data points that can be distributed evenly or unevenly in a fixed range. These extremes can be very large or very small, depending on the orientation of the entire dataset. These extremes present in the data are called outliers. An anomaly is a term that can be used instead of outliers interchangeably.
There can be multiple reasons why an outlier is present in a dataset. The most common reason is human error, which is produced while collecting the data. For example: take the value “999” instead of “666”. Such type inconsistencies greatly affect the dataset negatively. However, the magnitude to which the outlier affects the data is still unknown, but it can completely change the perception of the data. So, the elimination of such a dataset becomes necessary. For example, for 10 observations (1, 2, 3, 4, 5, 6, 7, 8, 9, 100). Here, N = 10, and the sum of the number = 145. The mean of the 10 observations is 14.5, but on closer inspection, we observe that of all the data in the observation area in the 1-unit incremental order, only the last one is supposed to be “10”, but instead it is “100”. This “100” can be considered an outlier. Now, if we consider “10” at the 10th position of the observation, then the mean would be 5.5. This clearly shows that an outlier in the dataset had pulled the mean towards itself. Thus, giving the wrong perception of the dataset. In the case of the median, there would be no change as it solely focuses on the central tendency.
To need to detect an outlier in our dataset is very important. This can be achieved by identifying the data points whose difference between the mean and median is very high. For this, the help of data visualization can be considered, such as scatterplots and boxplots or violin plots. Through these data visualization techniques, we can easily detect the presence of any outliers in the dataset. Taken from Osama Abdelrahman et al. [12], outlier data are shown in Figure 3 and Figure 4. Anomaly data can be grouped into three main categories:
- (a)
- Point Anomaly
In a point anomaly, there are single independent data instances that show deviation in their behaviour compared to other data instances in the dataset. In Figure 5, samples of point anomalies are shown in 2D (two-dimensional space).
- (b)
- Context Anomaly
A context anomaly, also called contextual anomaly and condition anomaly, is where data instances can be considered as an anomaly in a given situation only; i.e., the data points are normal in another context. Contextual anomaly is commonly seen in time-series data streams.
- (c)
- Collective Anomaly
A collective anomaly can be considered as a collection of various data instances that appear to be normal when considered individually, but show irregularity when considered in a group or a bigger picture. The whole group of data will show deviation from the normal data instances. To prevent or eliminate the outlier, we must first detect an outlier in the dataset. It might happen that the data are not scaled and are exponentially increasing and decreasing; this pattern is viewed as an outlier in the dataset. So, before eliminating the outlier, we need to first scale the data in the dataset. Depending on the number of outliers present in the data, we can take the measures. If the anomaly is minute, then eliminating the anomaly points will not affect the dataset. If the outliers are more than the sampling, the data is more meaningful; also, using the median instead of the mean will work, as the median calculates the central tendency to reduce the effect of an outlier in the dataset. Finally, it is advised to take suggestions from a domain expert for a proper understanding of the data.
Features of Assembly Line
For assembly lines, precise configuration and essential management strategies are employed to increase efficiency and effectiveness. For effective management, factors such as scheduling, industrial environment, and assembly line balancing are taken into consideration. Since the inception of the assembly line at the Highland Park Ford Plant in Michigan, which may be recognized as the “Industrial Revolution” of the modern era, significant progress has indeed been made in manufacturing. Today, an assembly line is integrated with intelligent sensors, the Industrial Internet of Things (IIOT), sophisticated machinery, scientific management planning, etc. Bortolini et al. [13] describe the various dimensions that are considered in assembly system design, as shown in Figure 6, which are discussed as follows:
- (a)
- Balancing
Balancing is the most researched topic in the field of assembly-line design. In this context, academic scholars and experts have established models and means for optimizing production-line tasks at the workstation. For this, the objective function is taken into consideration and a set of constraints is made to satisfy the objective function. This results in the optimization of various attributes that are associated with the assembly system, such as time and cost.
- (b)
- Sequencing
The sequencing metric is the brief-stretch counterpart of the balancing dimension. In diverse-model assembly lines, numerous product models from the shared product family fulfil the requirements of mass customization. So, to minimize the workstation load and to fulfilling the customer’s demand, sequencing is done on the assembly line product model.
- (c)
- Material feeding
In an assembly line, several products are employed. These models work independently but in sync with other product models. So, each product models require an independent material requirement, which is required to be fed into the assembly line at different time intervals. So, the need to feed the right materials at the right locations can be solved using the material feeding process.
- (d)
- Equipment selection
To reduce the operational cost of the assembly line up to date, machines and sensors are required to be installed at the assembly station. As a result, a necessity for equipment system configuration is to pick which apparatus to purchase and install at the workplace to minimize operational costs.
- (e)
- Learning effect
The learning effect predicts an inverse link between an employee’s number of job duplications and work length. In today’s manufacturing environment, an assembly line is massively customized, and the product’s life expectancy cycle is quite short. So, the introduction of new products in the assembly system causes reduced productivity due to the training of the workers. To decrease this time consumption, an analysis of the learning effect on the assembly system is done.
- (f)
- Ergonomic risk
Ergonomic risk is the physical stress that the worker induces while working for a prolonged period. Often, the workers in the assembly system suffer from musculoskeletal disorders, due to repeated operations and the high frequency thereof. So, the workstations must be ergonomically friendly to the workforce working in the workstation. With the advent of the 4th industrial revolution, data-driven approaches are encouraged, and the decisions taken regarding the assembly line systems are done using data-driven decision-making. These gave rise to various skills, such as cyber-physical systems (CPS), the Internet of Things (IoT), cloud computing, machine learning, collaborative robots (co-bots), augmented reality, and additive manufacturing.
4. Machine Learning Algorithms in Manufacturing
With the advancement in data-collection approaches, concepts such as a Smart Plant and Internet-of-Things (IoT) have become widespread, as described by Ziqui Kang [14]. The use of IoT has exponentially increased in the manufacturing sector in the last decade. The sensors used in Industry 4.0 and IoT can collect data in real time and on-site from the production lines. Machine learning has been used in Industry 4.0 to effectively accomplish complex tasks, such as forecasting, analysis, strategy, and predictive modelling, using past information. Therefore, the industry nowadays is focusing mostly on data-dependent approaches. It has also been discovered that superior-quality data and massive data collections may vastly enhance the accuracy of the model deployed in machine learning algorithms. When working with such a machine learning algorithm, it is critical to use a suitable algorithm to address a specific problem. Machine learning can be broadly classified as follows (Figure 7).
- (a)
- Supervised Learning
A machine learning algorithm in supervised machine learning constructs a function from the relevant input or multiple inputs and provides output as a set of labelled trained data. This function is based on the pattern that can be observed between the given input and output of the machine learning algorithms. Supervised machine learning expects data to be cleaned in terms of feature variety and assumes parameter optimization by using a given machine learning algorithm.
- (b)
- Unsupervised Learning
The unsupervised machine learning method does not need labelled training data for its usage and implementation. Since there is no understanding of the connections between the input and output of the information, unsupervised machine learning techniques are often deployed. Unsupervised machine learning algorithms are often employed when the correlations between the data input and output are unknown to the user.
- (c)
- Semi-supervised Learning
The supervised and unsupervised methods deal with labelled data and unlabelled data completely, but some datasets are such that only a minor portion is labelled, but which cannot be neglected. Such data cannot be analysed by supervised and unsupervised machine learning algorithms. To deal with such algorithms, semi-supervised machine algorithms are used.
- (d)
- Reinforcement Learning
Reinforcement learning majorly deals with real-time analysis of the data. Here, the agent observes the environment in which it is placed. All the actions that the agent performs will result in some reward to the agent. The reward can be positive or negative, depending on whether the action by the agent is fruitful in achieving the stated goal.
Different techniques that are used in machine learning to solve the given problems are as follows:
- i.
- Regression: In regression, input features are mapped to a continuous numerical value. The output value can be a number or a floating value.
- ii.
- Classification: Similar to regression, in classification, the inputs are mapped to one of the output values, but here in the case of classification, the output values are discrete. In the case of binary classification, the values can be zero or one, while in the case of continuous values, the output consists of several classes.
- iii.
- Clustering: In the case of clustering, the data are classified into several groups. These groups are created based on similarities in the behaviour or characteristics of the data present in the same group.
- iv.
- Data Reduction: Data reduction is done on the dataset to reduce the number of features or records present in the dataset. We can enhance the precision of the machine learning algorithms by lowering the number of rows that have some missing data or irrelevant data. By eliminating features that are irrelevant to the problem at hand, we could enhance the accuracy of the machine learning algorithm, which is also called the feature-extraction process.
- v.
- Anomaly Detection: In a given dataset, there can be some data that are misrepresented in the dataset taken into the consideration. Adding those data to the algorithm will reduce the accuracy of the algorithm, so the removal of those anomalous data becomes necessary from the data.
Some of the widely used machine learning algorithms in Industry 4.0 are discussed below:
- i.
- Isolation Forest:
The isolation Forest approach, initially suggested by Fei Tony Liu et al. [15], is one of the most successful in anomaly identification. The isolation forest is a tree-based anomaly identification system based on decision tree methodology.
The isolation forest divides the data into different branches, depending on a randomly chosen threshold value. This branching procedure is repeated until each data point in the provided dataset is isolated. Once the data have been isolated, the isolation seeks to locate the data points that required the fewest iterations when compared to other elements in the dataset during the isolation process. Thus, as compared to other isolation-detection methods, this approach to finding outliers offers the Isolation Forest approach a distinct edge in detecting outliers explicitly. The unsupervised machine learning approach is used to classify the Isolation Forest.
In industry 4.0, Isolation Forest algorithms have been extensively used in the detection of anomaly behaviours in manufacturing operations. So, the possibility of detecting some unusual characteristics has been widely used in the manufacturing of automobiles and electrical appliances such as plugs and sockets.
- ii.
- Decision Tree:
Decision Tree was originally enhanced by Ross J Quinlan et al. [16], who proposed the ID3 decision tree method, which used Entropy Information Gain. In the present period, Ross J Quinlan’s ID3 and Classification and Regression Tree (CART) contributions are frequently employed in offering data-related solutions.
A Decision Tree is a type of supervised machine learning that predicts based on the Gini Index value and the Entropy Information Gain. Decision Trees are commonly utilized in classification issues. The decision tree’s base is referred to as the root, and a number of nodes branch from these nodes, which are referred to as leaf nodes. The decision nodes branch based on the Gini index value. Finally, a leaf node emerges from the decision nodes and is in charge of the data’s final classification.
Being one of the oldest machine learning algorithms, the Decision Tree still finds its relevance in the data-driven manufacturing era of Industry 4.0. A decision tree has been widely used in predicting the number of defective engines that do not comply with global performance standards.
- iii.
- K-Nearest Neighbour:
K-Nearest Neighbour, proposed by Evelyn Fix et al. [17], is one of the most ancient and successful machine learning algorithms. This algorithm is commonly used to provide current solutions to industrial difficulties. The K-Nearest Neighbour machine learning classification method is non-parametric and supervised. The K-Nearest Neighbour algorithm’s basic criterion is that it assigns the provided data point to the group of data that is closest to the data point. The distance between a data point and a data cluster is calculated using Euclidean distance or Manhattan distance.
One of the crucial machine learning algorithms for supervised learning of the data, K-Nearest Neighbour is used in smart factories for detecting inconsistencies in the manufacturing of hard disks. In the manufacturing of electronic appliances of switches and sockets, K-Nearest Neighbour is used in the detection of anomaly data and finding the root cause and reasons for its occurrence.
- iv.
- Naive Bayes:
Naive Bias is a probabilistic learning approach that is being employed in many data-driven solutions. Thomas Bayes was the first to invent the term “Nave Bayes” in 1702.
The word naive refers to the primary premise on which the algorithm is built, which is that each attribute in the provided data is completely independent and has no link between them. This implies that changing any variable in one feature does not influence the variable connected with the other feature. The Bayes rule, commonly known as conditional probability, is followed by Nave Bayes. In today’s era of data-driven solutions, Naive Bayes has been particularly used in detecting anomaly behaviour in the log files of hard-disk manufacturing.
- v.
- Support Vector Machines:
Cai et al. [18] describe the support vector machine (SVM) algorithm. SVM is a supervised machine learning approach in which the classified data are projections in a hyperplane, which is an n-dimensional Euclidean space with an n-1 dimensional subset dividing the space into two disconnected halves. The data will be separated into multiple clusters by the decision boundary along either side. These decision boundaries are based on a variety of mathematical kernels, including the radial bias function, sigmoid, polynomial, nonlinear, linear, and so on.
The application of Support Vector Machine (SVM) has been extensive in finding irregular behaviour in hard-disk manufacturing, detecting defects on steel surfaces, visual industrial defect detections, and also finding the root cause of the given problem. This suggests that the Support Vector Machine is one of the most important machine learning algorithms in Industry 4.0.
- vi.
- Random Forest:
The author Leo Breiman et al. [19] proposed a bagging-based technique for solving classification and non-classification issues without the need for any specific algorithm. This Random Forest algorithm employs supervised machine learning methods.
The input is initially segmented and fed to numerous decision trees concurrently in the Random Forest method. For classification issues, the majority output from all trees is evaluated, whereas the aggregate value is utilized for non-classification problems. This approach addresses the low bias and high variance issue noticed in decision tree algorithms since it is not dependent on any specific algorithm.
Random Forest is one such machine learning algorithm that has seen a wide variety of applications in various fields, ranging from healthcare to finance, housing, tourism, etc. Random Forest has also shown promising results in the field of manufacturing. In Random Forest, as no single tree dominates the output, its results are unbiased. In production plants, Random Forest has been utilized to analyse Internet of Things (IoT)-based sensors to monitor and control various manufacturing processes.
- vii.
- Logistic Regression:
David Cox et al. [20] described Logistic Regression, which resulted in the solution of a classification issue. Logistic Regression (LR) applies supervised machine learning to a classification issue. The most significant advantage of LR is that it converts continuous data into a categorized output. This is accomplished by employing a sigmoid mathematical function, which determines a fixed threshold value between 0 and 1. All incoming variables are then identified depending on whether they are in the above or below cluster based on the threshold value.
Logistic Regression has been used in data-driven factories for observing the data from the sensors and predicting the machine’s operational life. This enables the operator to schedule systematic maintenance of the machines associated with the production process and prevent bottleneck time in production processes.
The following Table 1 represents various algorithms that are used in the production processes.
5. Research Challenges
As the manufacturing industry moves from four industrial revolutionary stages, rapid changes took place in the manufacturing sector. Concepts such as productivity were introduced, as well as where to optimize the manufacturing operations, how to reduce the cost of manufacturing and thus increase profit as much as possible. Emphasizing collaborative work was given more attention, and this gave rise to the Total Quality Management (TQM) process for better optimization of manufacturing operations. With the rising of Industry 4.0, the demand for making data-driven decisions has increased tremendously. By making data-driven decisions we can satisfy the modular needs of the customers. The amount of wastage can also be reduced by producing the product on the given parameters that provide the optimal output. This can be achieved by analysing past trends in the changes of the parameters that govern the production process. Further, with historical data, we can predict the requirement of raw materials that will be required at any time of a given production process. However, the conventional method for designing and implementing the manufacturing processes requires to be updated with the modern means of approaches that rely heavily on data analysis of historical data.
6. Computing Paradigm
Machine learning is a computational method that can be used effectively in various domains. Machine learning can be used to predict the need for maintenance in the machine. Conventionally, the machines are serviced based on fixed parameters; but, with time, the degradation in the performance of the machines takes place. So, the effectiveness of servicing the machines reduces with time. The normal statistical method fails to predict the time interval for the maintenance of the machine. So, machine learning algorithms can be used to predict the accurate time interval for machine maintenance.
Time-series data analysis, Gaussian mixture models, and multivariate linear regression were the three machine learning algorithms utilized by Gauri Shah et al. [31] to detect anomalies in engine-based machines. In linear regression, a linear relationship between a dependent and an independent variable is used to predict the values of the dependent variables. The multivariate linear regression model is used as the number of input parameters is more than one. For deciding the threshold, a Gaussian mixture model was used. The data used in the paper [31] were not continuous so time series data analysis was used. Once outliers are discovered using machine learning models and the parameter limits are known, we can detect anomalies in machine performance in real-time and alert maintenance crews to execute precautionary maintenance and maximize machine uptime; this will enable to increase in the machine’s operational lifespan.
Bas van Stein et al. [21] mainly focussed on finding an anomaly detection algorithm for their BMW dataset. The database includes information regarding steel coils used to manufacture various automotive body components, including side edges, roofs, and structural components, including B-pillars. To create the various components of cars, different types of materials are used, requiring different machine settings. The creation of a final product is highly complex as the process of material selection and corresponding machine setting is highly dimensional. Data-mining algorithms are used at the start of the production chain to estimate the places where problems may arise. Though most of the characteristics are still unknown at this moment in the production process, the outlier detection approach is very essential at this early stage. However, using anomaly detection techniques at this early stage is a big challenge.
Conventional mathematical models, such as Optimal Operational Control and Real-Time Optimization, are used, but these mathematical models fail to detect external disturbances and noise. Another crucial disadvantage produced by adopting the mathematical formula is that it cannot entirely optimize the manufacturing process. Due to these limitations, a data-determined method is required to monitor and optimize the production process. The advantage of using a data-driven approach is that it requires minimum knowledge and understanding of the domain area. The data-driven approach also incorporates noise in the data and these noises can be reduced. In [21], the authors propose the use of Global Local Outlier Probabilities (GLOSS) for outlier detection. It was observed that GLOSS works well in detecting outliers in high-dimensional data compared to Local Outlier Factor (LOF) and Local Correlation Integral (LOCI).
Finally, in [21], unsupervised machine learning techniques, such as intrusion detection systems, were used for measurement to find areas of incoming blanks and rapid deviations. Following the detection of outliers or anomalies in the data, forecasting data-driven models, including such Random Forest, were used to validate the algorithm on historical data, containing the properties of the materials, specifications of the product, and a quality pointer towards the inability to forecast the expected outcome of the inbound steel blank before stamp. The machine settings may be set depending upon those machine learning models to obtain the appropriate material qualities for the steel blank.
The objective of the study by David Muhr et al. [22] was to divide the data according to the relevant domain information and determine if the effectiveness of outlier detection algorithms is enhanced for a malfunctioning internal combustion engine. To see if the effect of data partitioning on high-dimensional vibration data is taken from the internal combustion assembly line. A divide and conquer technique, which is based on data portioning, is taken into consideration for anomaly detection where abundant unlabelled data are available. After the engine has been put together, the data from the assembly line is gathered and sent for a cold test. During this test, an electric motor is linked to the engine and different indicators for torque, force, temperatures, mechanical vibrations, and sound discharge are monitored. The study of the vibration in the internal combustion engine is very complicated as the internal combustion engine is very complex in terms of design. So, usually, the gathered vibration based on the above parameters is measured and the anomaly is manually detected by a graphical representation of the above data by the technician. In [22], by using machine learning methods, the threshold value was determined for deciding if the engine has failed the test. As defined by Chandola et al. [32], an anomaly is “the problem of finding the patterns in the data that do not conform to the expected behaviour”.
The detection of anomalies in the data can be classified into three classifications: (1) supervised anomaly detection, where ground-truth labels are available for both normal and anomalous instances; (2) semi-supervised outlier detection, where the trained data consists of solely normal cases, and abnormalities differ from the learned model; and (3) unsupervised outlier detection, where no labels are required and abnormalities are assumed to reside in the minimum concentration region of the data. Generally, the data are available in supervised form; however, there might be inconsistencies in the previous labelling. So, in this paper, unsupervised anomaly detection methods were used. To detect the algorithm, three algorithms were used. The 1st algorithm with the Local Outlier Factor (LOF) was used where local outliers were detected based on how isolated the data is from its surrounding neighbourhood data points. The 2nd algorithm used was One-Class Support Vector Machine (OCSVM), which is principled on Support Vector Machine, where only positive examples are considered while outliers are considered as negative examples. In the 3rd algorithm, Isolation Forest (I Forest) was used for anomaly detection, where anomalies are isolated without profiling the normal instances. Further, the data used were partitioned and compared with the results of non-partitioned data, to see the effect, as shown in Figure 8.
The Area Under Receiver Operating Characteristics (AUROC) score was utilized to compare the outcomes of various abnormality-detection algorithms, where a perfect ranking would provide an AUROC value of 1 and the lowest score would yield a value of 0. The result showed that data partitioning increased the AUROC score in each algorithm and further averaging and maximizing all three algorithms also increases the AUROC score. Thanatarn Pattarakavin et al. [23] worked on the production line of a hard-disk manufacturing firm in Thailand. Hard drives are produced using a highly sophisticated procedure that includes hundreds of automated equipment that operate continuously to produce the given product. If an abnormality occurs, the entire production line is halted, and the diagnostic crew inspects each machine to determine the origin of the anomaly. This process is time-consuming as it stops the production line till the diagnostic team finds the root cause of the error. In an autonomous manufacturing line, all of the equipment is tracked using different types of sensors, and the logs from such sensors are utilized to determine the reason for the issue. So, by using the machine learning method on these log files, the prediction of anomalies can be done, which will help the diagnostic engineers to solve the issue in less time and more effectively. The machines used in manufacturing the hard disk are tightly synchronized and collaborate and communicate to keep the production running smoothly.
When any anomaly is detected, the production line is stopped, and the cause of the disruption is identified and solved quickly. Log files from all the machines are diagnosed. These log files contain information; some of them can be useless to the diagnostic team, and some information needs to be removed. This process of removal of the unimportant message is very complicated and requires a human expert. A considerable amount of the error is caused by operators, called human errors, but which are easy to detect by the operator. In turn, a large amount of error is caused by the software part of the production line. So, to detect anomalies caused by the software part of the production, machine learning algorithms are used on log files obtained from the machines involved in the manufacturing process.
The dataset used in [23] is a head stack assembly (HAS) used in hard-disk manufacturing, as shown in Figure 9. Note that the process sequence is the same as given in Figure 10. In [23], for data visualization and data analysis, the authors use orange canvas software. To extract the critical information before data visualization, pre-processing of the data from the log files is done to remove unnecessary data present in the log files. All the transactions present in the log file are separated and placed into the individual transaction. In the log file, each operation is described as a process. Using machine learning methods, the author can correctly extract eleven parameters that may be utilized to anticipate the abnormality. Here, the three machine learning algorithms are Naive Bayes, Support Vectoring Machine (SVM), and k-Nearest Neighbour (k-NN), with Decision Tree also taken into consideration for predicting anomalies in the data. Classification performance (CA), F1 Score, Precision, and Recall are among the outcomes, with F1 being the harmonics average of Precision and Recall. To evaluate the different machine learning models, Recall and Precision were employed.
The dataset was split into 10 sections, nine of which were utilized for learning the parameters and one for testing. All the machine learning methods performed well, according to the results. To detect anomalies in the dataset, SVM and Decision Tree performed well, as the dataset was highly unbiased due to the implementation of six sigma in manufacturing. In six sigma, only 3.4 defects are allowed per million opportunities. The overall best performance was achieved using Support Vector Machine (SVM). Dorin Moldovan et al. [24] aimed to study and analyse machine learning techniques that are applied to the SECOM dataset, which is a dataset based on the semiconductor manufacturing process. The dataset consists of noisy data, high-dimensional feature space, and imbalanced data. Here, feature selection was based on three techniques: Principal Component Analysis (PCA), Boruta Algorithm, and Multivariate Adaptive Regression Spline (MARS). The papers used Logistic Regression (LR), Gradient Boosted Trees (GB), and Random Forest (RF) to validate the feature selection.
For the industry to cope with the rapidly changing needs of customers, suppliers, and logistics providers, and for material procurement, it has to implement a data-driven approach for correcting, updating, optimizing, and controlling the production process by taking into account external and internal stimuli, including parameters outside the factory as well as inside the factory during the manufacturing process. To achieve the goal of obtaining data-driven decision-making in the manufacturing process, the stakeholders focus on collecting the data from all the components that directly or indirectly participate in the manufacturing process. The industry largely relies on cutting-edge embedded control structures, sophisticated controller machine learning algorithms, and enhanced sensing instruments for the collection and analysis of this data. In the field of production process management, the use of large amounts of data and various advanced machine learning algorithms leads to several benefits, including early detection of quality problems, better decision-making on defects and quality enhancement, and prediction of new product failures. In this regard, analysis of sensor data has greatly contributed to avoiding costly human interventions and reducing manufacturing waste.
In Dorin Moldovan et al. [24], the SECOM dataset was cleaned as shown in Figure 11; then, the features were extracted, and sampling of the data was done before applying machine learning algorithms. The need for going through all these processes is because the data were highly imbalanced and consisted of various missing values in it. Data cleaning is to prepare the data, as part of preprocessing. Here, all the missing values in the dataset (which is represented by “NaN”) need to be removed, filled using the mean of the feature, and finally the data are normalized between the interval of [0,1]. The objective of feature selection is the process of eliminating those features that do not contribute to classification. These three techniques are discussed in [24]. The first is the Bourta algorithm, in which the algorithm identifies the variables that are associated with the Random Forest Classification algorithm. By considering the Residual Sum of Squares (RSS), the Multivariate Adaptive Regression Spline (MARS) decides which features are important. Furthermore, Principal Component Analysis (PCA) is used to turn a set of statistically independent attributes into a set of associated ones, known as the principal components. The result of all these feature selections is shown in Table 2.
Further, in [24], the authors discussed cross-validation to validate the machine algorithm. This 5-fold approach was used where 4-fold became a training dataset and 1-fold was the testing dataset for the algorithm. Two approaches were used to reduce overfitting. The first is Under Sampling of Majority Class (where the amount of majority class examples is equal to the amount of minority class examples) using WEKA software, and the second is Synthetic Minority Oversampling Technique (SMOTE), which oversamples minority class data using the k-Nearest Neighbour algorithm among the nearest minority class values. In [24], machine learning algorithms such as Gradient Boost (GB), Random Forest (RF), and Logistic Regression (LR) were applied to all the changes to the dataset. The metrics used for comparison are as follows:
In the components of the confusion matrix, Equations (1)–(4), TP denotes True Positive, FP denotes False Positive, FN denotes False Negative, and TN is True Negative. It was then discovered that when the data was unsampled, for precision, the best value (0.8944) was obtained when choosing Logistic Regression and using the Bourta algorithm. Using the Random Forest algorithm and the Bourta feature selection, the Precision was modified and improved when the majority class was under-sampled (0.9154). For oversampling of the minority class (0.9050), precision was obtained using Logistic Regression and the MARS algorithm. The False Positive rate for the unsampled value was 0.7559 when all the features and Logistic Regression were used. The Bourta algorithm was used to select features, and Random Forest (RF) was used to classify using the False Positive rate (0.2547) for the majority class. A False Positive rate of 0.4374 was obtained when the minority class was oversampled and a Logistic Regression algorithm was used for the classification.
In Weizhong Yan et al. [25], a condition-based critical maintenance method was used to minimize the power plant functional and maintenance (O&M) costs, particularly in industrial gas turbine power plants. For this approach, the author used the Extreme Learning Machine Learning (ELM) algorithm. Yan et al. [25] described an anomaly that occurs very rarely compared to the normal instances in the data. As a result, the authors gathered Thermal Couples (TC) facts, which have been implemented in the turbine stages, in the dataset. Within the combustion chamber, fuel and pressurized air are combined and combusted; this hot gas then flows through numerous turbine stages, where thrust/power is created. Monitoring the exhaust gas temperatures in the exhaust of the gas turbine section will help in getting combustor abnormalities using a Thermal Couple (TC). In the dataset collected, there is a 27-combustor chamber and the Thermal Couple (TC) collects the exhaust temperature from this combustor. The data were collected for one year. In the dataset collected, there are 10 events where abnormalities were observed. These 10 events are spread over 30 samples, which have generated around 300 abnormal sample instances. In turn, the normal instance included in the data consists of 47,575 instances. The general architecture of the whole process is shown in Figure 12.
In the dataset, there are a total of 27 thermocouples features, so the author applied deep learning stacked autoencoder (SDAE) on the raw sensor measurements. The autoencoder gave 12 features that were responsible to generate abnormalities in the dataset. The machine learning classifiers were based on these 12 characteristics. Extreme Learning Machines (ELM) are a sort of feed-forward neural net developed by Huang et al. [33]. Just as with traditional feed-forward neural networks, which employ weights and biases, ELM neuron connections are chosen at random and fixed; thus, they do not need to be trained. Thus, ELM training is often limited to determining the relationship between the unseen and output layers. The minimum squares of the unseen layer yield matrix can be used to do this. Due to such relationships in the ELM network, they are fast and have a better-generalized performance. Weizhong Yan et al. [25] used four types of machine learning algorithms: Isolation Forest, one-class ELM with an RBF kernel and sigmoid activation function, one-class ELM without any kernel, and one-class Support Vector Machine (one-class SVM). Isolation Forest is an anomaly-identification approach proposed by Liu et al. [34], in which it is assumed that the outlier is smaller and different from the regular data, and therefore their binary tree has a shorter average route length than normal data trees. In the paper, the author used three lengths and five levels of sub-samples. One class of SVM uses a hyper-plane that separates the dataset from the origin so that the hyperplane is as close to the datapoint as possible. Yan et al. [25] concluded their article by pointing out that when 5-fold cross-validation was utilised, they found that kernel-one class ELM performed best in terms of the ROC curve and area-under-curve (AUC), trailed by one-class ELM (non-kernel), one-class SVM, and Isolation Forest.
Jan Lehr et al. [26] have developed an alternative to visual inspection used for quality control in the industry using machine learning approaches. Here, a dataset was created using a two-step approach, which reduces the size of the data and complexity of the data. For the dataset used in this article, the author tested two methods: convolutional neural network (CNN) and convolutional autoencoder (CAE). It takes a lot of work to produce characteristics that must be manually developed for optical examination. Krizhevsky et al. [35] were the first to use a neural network for image processing. It uses Convolutional Neural Network (CNN) with AlexNet. CNN was further developed by Jie Hu et al. [36]. Even though neural networks were able to produce great results, the industry could not accept their usage because of the lack of availability of the large dataset required to train the neural networks. However, CNN showed promising results for computer vision applications. Liu et al. [27] and Goodfellow et al. [37] implemented surface inspection using a Generative Adversarial Network (GAN) and One Class Classifier (OCC). Here, 10,000 images were taken for training purposes. Furthermore, CNN encoders are appropriate for texture-quality inspection in a manufacturing setting, according to research by Grunwald et al. [38]. Staar et al. [28] also used CNN for industrial applications and Czimmermann et al. [29] analysed various methods and AI approaches to visual defect detection of surfaces. In all the above papers, the authors concluded that the use of neural networks yields good results. However, Jan Lehr et al. [26] used a dataset that is not considered large enough for the usage of neural networks. So, Jan Lehr et al. [26] used a dataset that was created by Bergmann et al. [30]. Javaid et al. [39] used an unsupervised clustering method to detect surface defects in the manufacturing process. For quality assurance, Jan Lehr et al. [26] used the method by which
- (a)
- A multi-matrix camera system creates images of the objects, and various machine learning techniques, such as CNNs and CAEs, are applied to the data. Here, the defect is less, so it is treated as an anomaly; this will convert the machine learning algorithm from multi-class classification to OCC.
- (b)
- The next step will be the anomalies clustering using an unsupervised machine learning technique, and these clusters are labelled by the employees and classified into critical and uncritical defects.
The dataset created using the aforementioned methods can contain both basic and complicated designs, with an edge length ranging from the line, with a minimum of 3 mm, to a maximum of 500 mm. To get the images, a multimedia matrix camera is used, and to obtain a high-quality image, the product is placed on the conveyor belt, and the illumination is diffused to avoid light reflections. In the datasets, two non-symmetric complex shapes are considered: one is defect-free and another one is defective. The materials used in the product are made out of aluminium and their images were captured from different scenarios at an angle of 30 degrees and 50 degrees. The dataset created in this manner consisted of 102 defect-free images and 23 images containing defective products. Furthermore, the product was placed on a turntable with four-degree steps in horizontal directions. Only 90 defect-free photos were used to train the classifier. The remaining images were used to evaluate the levels of accuracy of the faulty and fault-free images. The aim was towards generating embeddings that are low-dimensional representations of the images. Further, Convolutional Autoencoder (CAE) and Convolutional Neural Network (CNN) were used. It was discovered that the embedding of fault-free images was near to each other, but the embedding of faulty images was far apart. So, using Euclidian distance, the author was able to detect if the product is defective or not. For feature extraction, ResNet-18 was used. A pre-trained ImageNet was considered. This approach is called “pre-trained”; also, modified ResNet-18 was used with a learning rate of le-8. Another dataset was used to test the model’s resilience, which would be the MVTec dataset published by Bergmann et al. [30]. In conclusion, CAE performed worst for defect-free images. Pre-trained CNN performed well for non-defective images and performed well for defective images, while fine-tuned CNN performed best with defective as well as defect-free images. Figure 13 shows an example photo of a single item captured in a 4-degree increment.
7. State-of-the-Art Sensors Used in Industry 4.0
Mohd Javaid et al. [39] described sensors as “the device which senses the input stimulus from the physical environment, and produces a digital output is called sensors”. This is shown in Figure 13. The physical parameters can be a quantity, property, or any given condition. The intake stimulus can also be any other environmental phenomenon, such as pressure, force, fluid flow, radiation, heat, motion, wetness (moisture), or other environmental parameters. The output can be a signal such as voltage, amperage, capacitor, resistance, frequency, and so on. This reaction output is either transformed into a legible display or delivered via an electronic wave network for other functions. Any system that wants to be automated and intelligent needs sensors. A variety of sensors are offered on the market depending on their appropriateness and uses. These sensors are produced in mass or can be produced based on individual customers’ demands. According to a report by Javaid et al. [39], sensors would form the core of any automation system in Industry 4.0, to boost productivity through automation. With the help of sensors, tracking of products and machines can be done in real time, and an automated control system will minimize the plant’s maintenance cost. Through digitalization, production mobility can be improved, which gives a competitive edge to the manufacturing firms in the market. These are all features incorporated in Industry 4.0. So, sensors play a very important role in smart industries.
Mohd Javaid et al. [39] described that sensors are linked with multiple devices and systems present in a facility, as shown in Figure 14. This combination of sensors and the Industrial Internet of Things (IIoT) has made ordinary sensors capable of measuring combustion, making them “Intelligent Sensors”. These intelligent sensors can collect the data and can perform some level of computation on hand. The architecture of such intelligent sensors can be complex. The sensors need to be very compact and their main advantage is that they can be installed to monitor places that are considered hazardous for human beings. Andreas Schutze et al. [40], Mohd Javaid et al. [39], and Abid Haleem et al. [41] further detail the improved capacity of the sensors that can now assess machine noise, signal degradation, and the reaction of dynamics, in addition to other things that were before restricted. Shan Wang et al. [42], Daniel Schmidt et al. [43], and Ali S et al. [44], in their papers, explained how smart factories incorporated various principles across cross-disciplines, such as emerging sensor technology, artificial intelligence, robotics, big data, smart valves, cloud computing, and automation in control systems, to improve product quality, reduce the production cost, and acquire new markets. All the above-mentioned technologies communicate with each other efficiently under the same roof as the Industrial Internet of Things (IIoT). The main aim of using sensors is to eliminate the risks involved with human error caused by the operators operating the machines. Compared to humans, sensors are reliable and can remotely detect and record feedback from changes in the parameter that the sensor is monitoring using electrical signals. The advantages that the sensors give over the conventional method are (a) effective decision-making; and (b) self-optimization for automation of production lines. In Figure 15, the different sensors serving Industry 4.0 are shown.
In the Industry 4.0 context, the data received from these sensors may be used for a variety of tasks, including predictive maintenance, automation, asset condition monitoring, asset condition analysis, and overall process flow automation. Using sensors, the industry can achieve cost-effective and trustworthy knowledge of the materials before procuring them. This can be very beneficial for the pharmaceuticals and chemicals industry. Sensors along with robots are used for choosing the path based on their perceived environment. Sensors in the robot help the robot to take proper decisions in various dynamic situations. Thus, sensors combined with robotics are at the forefront in terms of innovation and research. Using sensors, the void in production can be eliminated in real-time using material and inventory knowledge from the sensors, which continuously collect data from the production plant and material inventory stores. Once the data collected from the sensors are uploaded to the cloud, then analysis of the data starts, which will predict the pattern for the production facilities. From these patterns, the decision makers can make data-driven decisions for material procurement, inventory management, machine maintenance, product packaging, etc. The data further will also help in maximizing production, forecasting loss, forecasting material scrape age, maintaining, planning, replenishing, and lagging inventory automatically. Here, during all the above-mentioned decisions, there is minimum to no involvement of the operator, thus reducing the burden on the operators and workers in the production facilities. Advanced machine learning methods are utilized for data analysis.
The steps followed by sensors are shown in Figure 16. First, the flow of the environment parameters needed to be sensed goes through sensing the panel. Then, as the sensor senses the parameters, it monitors the parameters. Then the sensed parameter is collected and converted into the data. These data can further be used for either the decision-making process or can be analysed by the sensors themselves. The final output from the sensor can be viewed on the panel. All sensors utilized in Industry 4.0 constitute sophisticated sensors, and all these sensors play an important part in building the Internet of Things (IoT) systems that have altered the industry. The entire manufacturing ecosystem would crumble until stability and consistency are maintained by these sensor-dependent systems. This projects the dependency and reliability needed by today’s production systems regarding the collection and sensing of data. In Figure 17 and Figure 18, the capabilities of the sensors for Industry 4.0 and the classification of the sensors instruments in Industry (Manufacturing) 4.0 are shown.
8. Multi-Level Graph of Industry 4.0
The phrase “Industry 4.0” was coined in 2011 during the Hanover Conference. Blaz Rodic et al. [45] explained that Industry 4.0 connects the business departments and entire production chain to be integrated by means of digitalization. According to KPMG (2016), during the product development cycle, all departments linked with the manufacturing ecosystem, such as R&D, sales, customers, equipment manufacturers, and so on, are all consulted, as shown in Figure 19 (a multi-level graph approach to Industry 4.0). Industry 4.0 allows for greater openness during the product-development process. Industry 4.0 also attempts to transform the production approach from a centralized to a decentralized manufacturing process, to meet the client’s mass customization requests.
Small and medium-sized businesses benefit greatly from Industry 4.0’s decentralized approach (SMEs). SMEs are important to the economy in terms of job creation. By utilizing additive manufacturing, the SME gains a distinct edge in meeting the market’s need for tiny tailored products.
Cyber-physical Systems (CPS) are critical to the success of the Fourth Industrial Revolution. CPS draws together technologies that were previously functioning separately to create an integrated complex network of sustainable manufacturing environments. Because the working approach in Industry 4.0 is decentralized, precise monitoring and control are essential. As a result, smart sensors with the capacity to connect and gather data effectively were developed. These smart sensors might replace previous sensors that were based on basic embedded systems.
As the application of these smart sensors expanded, so did the necessity to link them. As a result, the present sensors have been digitized, allowing them to gather and send data automatically without the need for human involvement via the Industrial Internet of Things (IIoT). All data generated have to be preserved safely and without loss. The cloud provided the necessary infrastructure for discrete and secure data storage. Finally, statistical information may be gathered from the acquired data to propose solutions to a particular problem utilizing machine learning techniques. As a result, Industry 4.0 was able to integrate significant technologies to create a manufacturing environment that is safe, dependable, modular, and scalable.
9. Conclusions
How Industry 4.0 is transforming the manufacturing sector is examined in this paper. Every manufacturing process is connected to high-tech sensors. These sensors collect data that indicate how the machines are behaving in a specific environment. To maximize the production of a manufactured product, these data are further used as historical data and fed into a machine learning algorithm. The output of the algorithm determines the optimum parameters needed to maximize production. Furthermore, the inconsistencies in the data can also be used to determine the factors that have degraded the quality of the manufactured product, thus enabling data to be used to observe and stimulate the parameters in manufacturing that allow maximum output. As a result, the quality of the manufactured product can be improved by detecting and eliminating these inconsistencies. The paper presents a review of quality assessment in various production processes. The paper also provides a summary of the four industrial revolutions that have occurred in manufacturing, highlighting the need to detect anomalies on assembly lines, the need to detect the features of assembly lines, the various machine learning algorithms used by manufacturers, the research challenges, as well as the computing paradigms and state-of-the-art sensors used in Industry 4.0.
The paper discusses, in detail, the major factors that led to the contribution of the industrial revolution and how each revolution has shaped the manufacturing industry. Subsequently, the paper discusses the background of the various technologies that are integrated under the umbrella of Industry 4.0. Further, a discussion on anomalies, their types, and how they affect the manufacturing process, is done. The paper also discusses the use of machine learning in manufacturing and how it can be used to detect and eliminate anomalies in the manufacturing process. The paper also aims at discussing the challenges of manufacturing regarding productivity and quality, which can be improved using the modern manufacturing process. Further, a discussion on the literature survey of various production processes, and how machine learning is used in real time, is conducted. In this paper, we also introduce the sensors and their types used in the production processes. Using a multi-level graph, emphasis is put on the complete integration of the manufacturing environment. Towards the end of the paper, we conclude the paper with the aim to discuss the use of machine learning and how the data are generated using sensors and an overview of Industry 4.0. Finally, a discussion on the future work and the need for training of the existing workforce in the manufacturing industry is completed.
10. Future Work
Industry 4.0 has focused on the interplay between humans and machines. As a result, new collaborative robots, also known as Cobots, are being created. The emphasis of Industry 4.0 has been on integrating a man–machine environment, with much effort put into making the machine efficient. However, the current difficulty is giving appropriate training to the existing workforce to handle such a complex network of man–machine ecosystems. As a result, personnel must get specialized training, and chatbots powered by Natural Language Processing (NLP) can be quite useful.
Mario Casillo et al. [46] discussed using chatbots for effective training of the workforce. Chatbots may also be used to assist employees by reminding them of any pending work or training they have to complete. Personalization in chatbots can therefore aid to boost worker efficiency. The author provides information on creating a chatbot that includes a Topic Generator, Domain Generator, Dialogue Ontology Generator, Interaction Quality Monitoring, Man–Machine Interaction Monitor, and Context-Awareness Assistant. The smart factory chatbot should be able to help employees in real time, give efficient training, and customize the teaching based on the worker’s learning capacity. Currently, work is scarce in the field of chatbot support, which needs extensive investigation in the future.
Author Contributions
Conceptualization, A.Q.M. and K.J.; methodology, K.J.; formal analysis, S.H.; resources, A.Q.; data curation, A.K.S.; writing—original draft preparation, K.F.T.; supervision, A.Q., A.K.S. and K.F.T. All authors have read and agreed to the published version of the manuscript.
Funding
This research received no external funding.
Institutional Review Board Statement
Not applicable.
Informed Consent Statement
Not applicable.
Conflicts of Interest
The authors declare that they have no interest.
References
- Mosconi, F. The New European Industrial Policy: Global Competitiveness and the Manufacturing Renaissance; Routledge: London, UK, 2015. [Google Scholar]
- Lee, J. Industry 4.0 in Big Data Environment. Ger. Harting Mag. 2013, 16, 8–10. [Google Scholar]
- Carvalho, N.; Chaim, O.; Cazarini, E.; Gerolamo, M. Manufacturing in the fourth industrial revolution: A positive prospect in sustainable manufacturing. Procedia Manuf. 2018, 21, 671–678. [Google Scholar] [CrossRef]
- Yan, J.; Meng, Y.; Lu, L.; Li, L. Industrial big data in an industry 4.0 environment: Challenges, schemes, and applications for predictive maintenance. IEEE Access 2017, 5, 23484–23491. [Google Scholar] [CrossRef]
- Leite, M.; Pinto, T.P.; Alves, C. A real-time optimization algorithm for the integrated planning and scheduling problem towards the context of industry 4.0. FME Trans. 2019, 47, 775–781. [Google Scholar] [CrossRef]
- Yen, C.-T.; Liu, Y.-C.; Lin, C.-C.; Kao, C.-C.; Wang, W.-B.; Hsu, Y.-R. Advanced manufacturing solution to industry 4.0 trend through sensing network and Cloud Computing technologies. In Proceedings of the 2014 IEEE International Conference on Automation Science and Engineering (CASE), New Taipei, Taiwan, 18–22 August 2014; pp. 1150–1152. [Google Scholar] [CrossRef]
- Jazdi, N. Cyber physical systems in the context of Industry 4.0. In Proceedings of the 2014 IEEE International Conference on Automation, Quality and Testing, Robotics, Cluj-Napoca, Romania, 22–24 May 2014; pp. 1–4. [Google Scholar]
- Dilberoglu, U.M.; Gharehpapagh, B.; Yaman, U.; Dolen, M. The role of additive manufacturing in the era of industry 4.0. Procedia Manuf. 2017, 11, 545–554. [Google Scholar] [CrossRef]
- Galin, R.; Meshcheryakov, R. Automation and robotics in the context of Industry 4.0: The shift to collaborative robots. In IOP Conference Series: Materials Science and Engineering; IOP Publishing: Bristol, UK, 2019; Volume 537, p. 032073. [Google Scholar]
- Paelke, V. Augmented reality in the smart factory: Supporting workers in an industry 4.0. environment. In Proceedings of the 2014 IEEE Emerging Technology and Factory Automation (ETFA), Barcelona, Spain, 6–19 September 2014; pp. 1–4. [Google Scholar]
- Wan, J.; Tang, S.; Shu, Z.; Li, D.; Wang, S.; Imran, M.; Vasilakos, A.V. Software-defined industrial internet of things in the context of industry 4.0. IEEE Sens. J. 2016, 16, 7373–7380. [Google Scholar] [CrossRef]
- Abdelrahman, O.; Keikhosrokiani, P. Assembly line anomaly detection and root cause analysis using machine learning. IEEE Access 2020, 8, 189661–189672. [Google Scholar] [CrossRef]
- Bortolini, M.; Ferrari, E.; Gamberi, M.; Pilati, F.; Faccio, M. Assembly system design in the Industry 4.0 era: A general framework. IFAC-Paper 2017, 50, 5700–5705. [Google Scholar] [CrossRef]
- Kang, Z.; Cagatay, C.; Bedir, T. Machine learning applications in production lines: A systematic literature review. Comput. Ind. Eng. 2020, 149, 106773. [Google Scholar] [CrossRef]
- Liu, F.T.; Ting, K.M.; Zhou, Z.H. Isolation forest. In Proceedings of the 2008 Eighth IEEE International Conference on Data Mining, Washington, DC, USA, 15–19 December 2008; pp. 413–422. [Google Scholar]
- Salzberg, S.L. C4.5: Programs for Machine Learning by J. Ross Quinlan. Morgan Kaufmann Publishers, Inc., 1993. Mach. Learn. 1994, 16, 235–240. [Google Scholar] [CrossRef] [Green Version]
- Fix, E.; Hodges, J.L. Discriminatory analysis. Nonparametric discrimination: Consistency properties. Int. Stat. Rev./Rev. Int. Stat. 1989, 57, 238–247. [Google Scholar] [CrossRef]
- Cai, Y.D.; Ricardo, P.W.; Jen, C.H.; Chou, K.C. Application of SVM to predict membrane protein types. J. Theor. Biol. 2004, 226, 373–376. [Google Scholar] [CrossRef]
- Breiman, L. Randomizing outputs to increase prediction accuracy. Mach. Learn. 2000, 40, 229–242. [Google Scholar] [CrossRef]
- Cox, D.R. The regression analysis of binary sequences. J. R. Stat. Soc. Ser. B Methodol. 1958, 20, 215–232. [Google Scholar] [CrossRef]
- Van Stein, B.; Van Leeuwen, M.; Wang, H.; Purr, S.; Kreissl, S.; Meinhardt, J.; Bäck, T. Towards data driven process control in manufacturing car body parts. In Proceedings of the 2016 International Conference on Computational Science and Computational Intelligence (CSCI), Las Vegas, NV, USA, 15–17 December 2016; pp. 459–462. [Google Scholar]
- Muhr, D.; Tripathi, S.; Jodlbauer, H. Divide and conquer anomaly detection: A case study predicting defective engines. Procedia Manuf. 2020, 42, 57–61. [Google Scholar] [CrossRef]
- Pattarakavin, T.; Chongstitvatana, P. Detection of Machines Anomaly from Log Files in Hard Disk Manufacturing Process. In Proceedings of the 2016 International Conference on Multimedia Systems and Signal Processing (ICMSSP), Taipei, Taiwan, 3–5 September 2016; pp. 60–63. [Google Scholar]
- Moldovan, D.; Cioara, T.; Anghel, I.; Salomie, I. Machine learning for sensor-based manufacturing processes. In Proceedings of the 2017 13th IEEE International Conference on Intelligent Computer Communication and Processing (ICCP), Cluj-Napoca, Romania, 7–9 September 2017; pp. 147–154. [Google Scholar]
- Yan, W. One-class extreme learning machines for gas turbine combustor anomaly detection. In Proceedings of the 2016 International Joint Conference on Neural Networks (IJCNN), Vancouver, BC, Canada, 24–29 July 2016; pp. 2909–2914. [Google Scholar]
- Lehr, J.; Sargsyan, A.; Pape, M.; Philipps, J.; Krüger, J. Automated optical inspection using anomaly detection and unsupervised defect clustering. In Proceedings of the 2020 25th IEEE International Conference on Emerging Technologies and Factory Automation (ETFA), Vienna, Austria, 8–11 September 2020; Volume 1, pp. 1235–1238. [Google Scholar]
- Liu, K.; Li, A.; Wen, X.; Chen, H.; Yang, P. Steel surface defect detection using GAN and one-class classifier. In Proceedings of the 2019 25th International Conference on Automation and Computing (ICAC), Lancaster, UK, 5–7 September 2019; pp. 1–6. [Google Scholar]
- Staar, B.; Lütjen, M.; Freitag, M. Anomaly detection with convolutional neural networks for industrial surface inspection. Procedia CIRP 2019, 79, 484–489. [Google Scholar] [CrossRef]
- Czimmermann, T.; Ciuti, G.; Milazzo, M.; Chiurazzi, M.; Roccella, S.; Oddo, C.M.; Dario, P. Visual-based defect detection and classification approaches for industrial applications—A survey. Sensors 2020, 20, 1459. [Google Scholar] [CrossRef]
- Bergmann, P.; Fauser, M.; Sattlegger, D.; Steger, C. MVTec AD–A comprehensive real-world dataset for unsupervised anomaly detection. In Proceedings of the IEEE/CVF Conference on Computer Vision and Pattern Recognition, Long Beach, CA, USA, 15–20 June 2019; pp. 9592–9600. [Google Scholar]
- Shah, G.; Tiwari, A. Anomaly detection in lloT: A case study using machine learning. In Proceedings of the ACM India Joint International Conference on Data Science and Management of Data; ACM: New York, NY, USA, 2018; pp. 295–300. [Google Scholar]
- Chandola, V.; Banerjee, A.; Kumar, V. Survey of anomaly detection. ACM Comput. Surv. CSUR 2009, 41, 1–72. [Google Scholar] [CrossRef]
- Huang, G.B.; Zhu, Q.Y.; Siew, C.K. Extreme learning machine: Theory and applications. Neurocomputing 2006, 70, 489–501. [Google Scholar] [CrossRef]
- Liu, Y.; Tang, C.; Xi, N.; Tan, J. Proceedings of the 2008 IEEE International Conference on Information and Automation, ICIA 2008: Message from conference organizers. In Proceedings of the 2008 IEEE International Conference on Information and Automation, ICIA 2008, Changsha, China, 20–23 June 2008. [Google Scholar]
- Krizhevsky, A.; Sutskever, I.; Hinton, G.E. Imagenet classification with deep convolutional neural networks. Adv. Neural Inf. Process. Syst. 2012, 25, 263–278. [Google Scholar] [CrossRef]
- Hu, J.; Shen, L.; Sun, G. Squeeze-and-excitation networks. In Proceedings of the IEEE Conference on Computer Vision and Pattern Recognition, Salt Lake City, UT, USA, 18–22 June 2018; pp. 7132–7141. [Google Scholar]
- Goodfellow, I.J. On distinguishability criteria for estimating generative models. arXiv 2014, arXiv:1412.6515. preprint. [Google Scholar]
- Grunwald, M.; Hermann, M.; Freiberg, F.; Laube, P.; Franz, M.O. Optical surface inspection: A novelty detection approach based on CNN-encoded texture features. In Applications of Digital Image Processing XLI; International Society for Optics and Photonics: Washington, DC, USA, 2018; Volume 10752, p. 107521E. [Google Scholar]
- Javaid, M.; Haleem, A.; Singh, R.P.; Rab, S.; Suman, R. Significance of sensors for industry 4.0: Roles, capabilities, and applications. Sens. Int. 2021, 2, 100110. [Google Scholar] [CrossRef]
- Schütze, A.; Helwig, N.; Schneider, T. Sensors 4.0–smart sensors and measurement technology enable Industry 4.0. J. Sens. Sens. Syst. 2018, 7, 359–371. [Google Scholar] [CrossRef]
- Haleem, A.; Javaid, M. Additive manufacturing applications in industry 4.0: A review. J. Ind. Integr. Manag. 2019, 4, 1930001. [Google Scholar] [CrossRef]
- Wang, S.; Fang, Y.; He, H.; Zhang, L.; Li, C.A.; Ouyang, J. Wearable stretchable dry and self-adhesive strain sensors with conformal contact to skin for high-quality motion monitoring. Adv. Funct. Mater. 2021, 31, 2007495. [Google Scholar] [CrossRef]
- Schmidt, D.; Villalba Diez, J.; Ordieres-Meré, J.; Gevers, R.; Schwiep, J.; Molina, M. Industry 4.0 lean shopfloor management characterization using EEG sensors and deep learning. Sensors 2020, 20, 2860. [Google Scholar] [CrossRef]
- Ali, S.; Singh, R.P.; Javaid, M.; Haleem, A.; Pasricha, H.; Suman, R.; Karloopia, J. A review of the role of smart wireless medical sensor network in COVID-19. J. Ind. Integr. Manag. 2020, 5, 413–425. [Google Scholar] [CrossRef]
- Rodič, B. Industry 4.0 and the new simulation modelling paradigm. Organizacija 2017, 50, 193. [Google Scholar] [CrossRef] [Green Version]
- Casillo, M.; Colace, F.; Fabbri, L.; Lombardi, M.; Romano, A.; Santaniello, D. Chatbot in industry 4.0: An approach for training new employees. In Proceedings of the 2020 IEEE International Conference on Teaching, Assessment, and Learning for Engineering (TALE), Takamatsu, Japan, 8–11 December 2020; pp. 371–376. [Google Scholar]
Figure 1.
The four industrial revolutions.

Figure 2.
Enabling technologies of Industry 4.0.

Figure 3.
Outliers in a boxplot.

Figure 4.
Outliers in a scatterplot.

Figure 5.
An example of an anomaly in 2D (two-dimensional space) where “O1” and “O2” are point anomalies, “N1” and “N2” are collective anomalies, and “O3” is a collective anomaly.
Figure 5.
An example of an anomaly in 2D (two-dimensional space) where “O1” and “O2” are point anomalies, “N1” and “N2” are collective anomalies, and “O3” is a collective anomaly.

Figure 6.
Dimensions of assembly system design.

Figure 7.
Classification of artificial intelligence and machine learning.

Figure 8.
Engine vibration data were utilized to evaluate partitioning and non-partitioning abnormality identification systems.
Figure 8.
Engine vibration data were utilized to evaluate partitioning and non-partitioning abnormality identification systems.

Figure 9.
Head stack assembly process used in the hard disk.

Figure 10.
HSA process sequence.

Figure 11.
Machine Learning steps for the SECOM dataset.

Figure 12.
The overall system architecture.

Figure 13.
Every ninth image shows an example photo of a single item captured in 4-degree increments.
Figure 13.
Every ninth image shows an example photo of a single item captured in 4-degree increments.

Figure 14.
A sensor’s input and output signals are shown in a schematic diagram.

Figure 15.
Sensors with various capabilities for Industry 4.0.

Figure 16.
Sensor operation in the context of Industry 4.0.

Figure 17.
Instrumentation for Industry (Manufacturing) 4.0.

Figure 18.
Classification of the sensors in Industry 4.0.

Figure 19.
Multi-level graph of Industry 4.0.


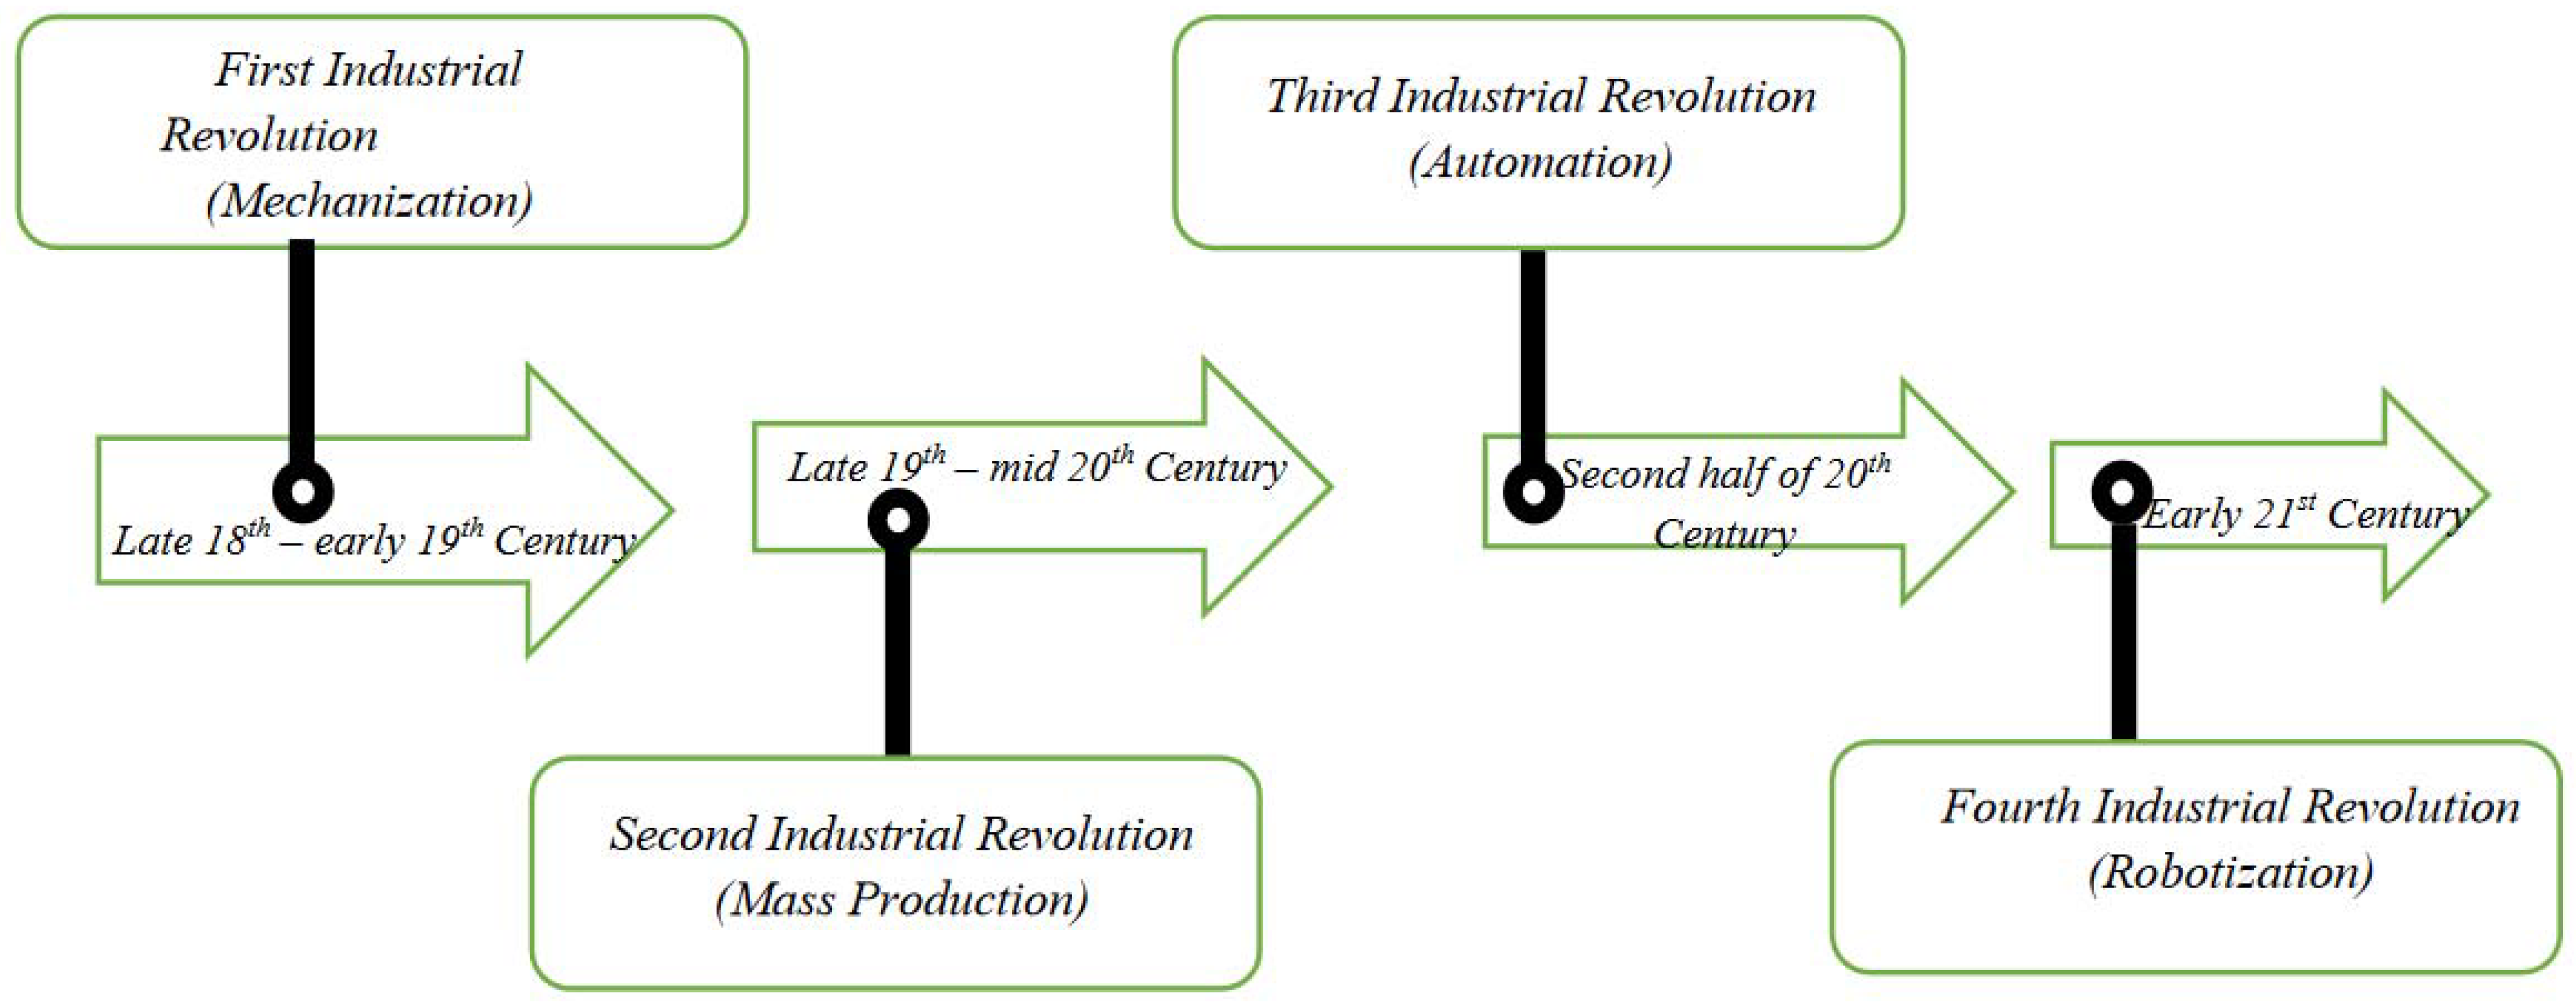
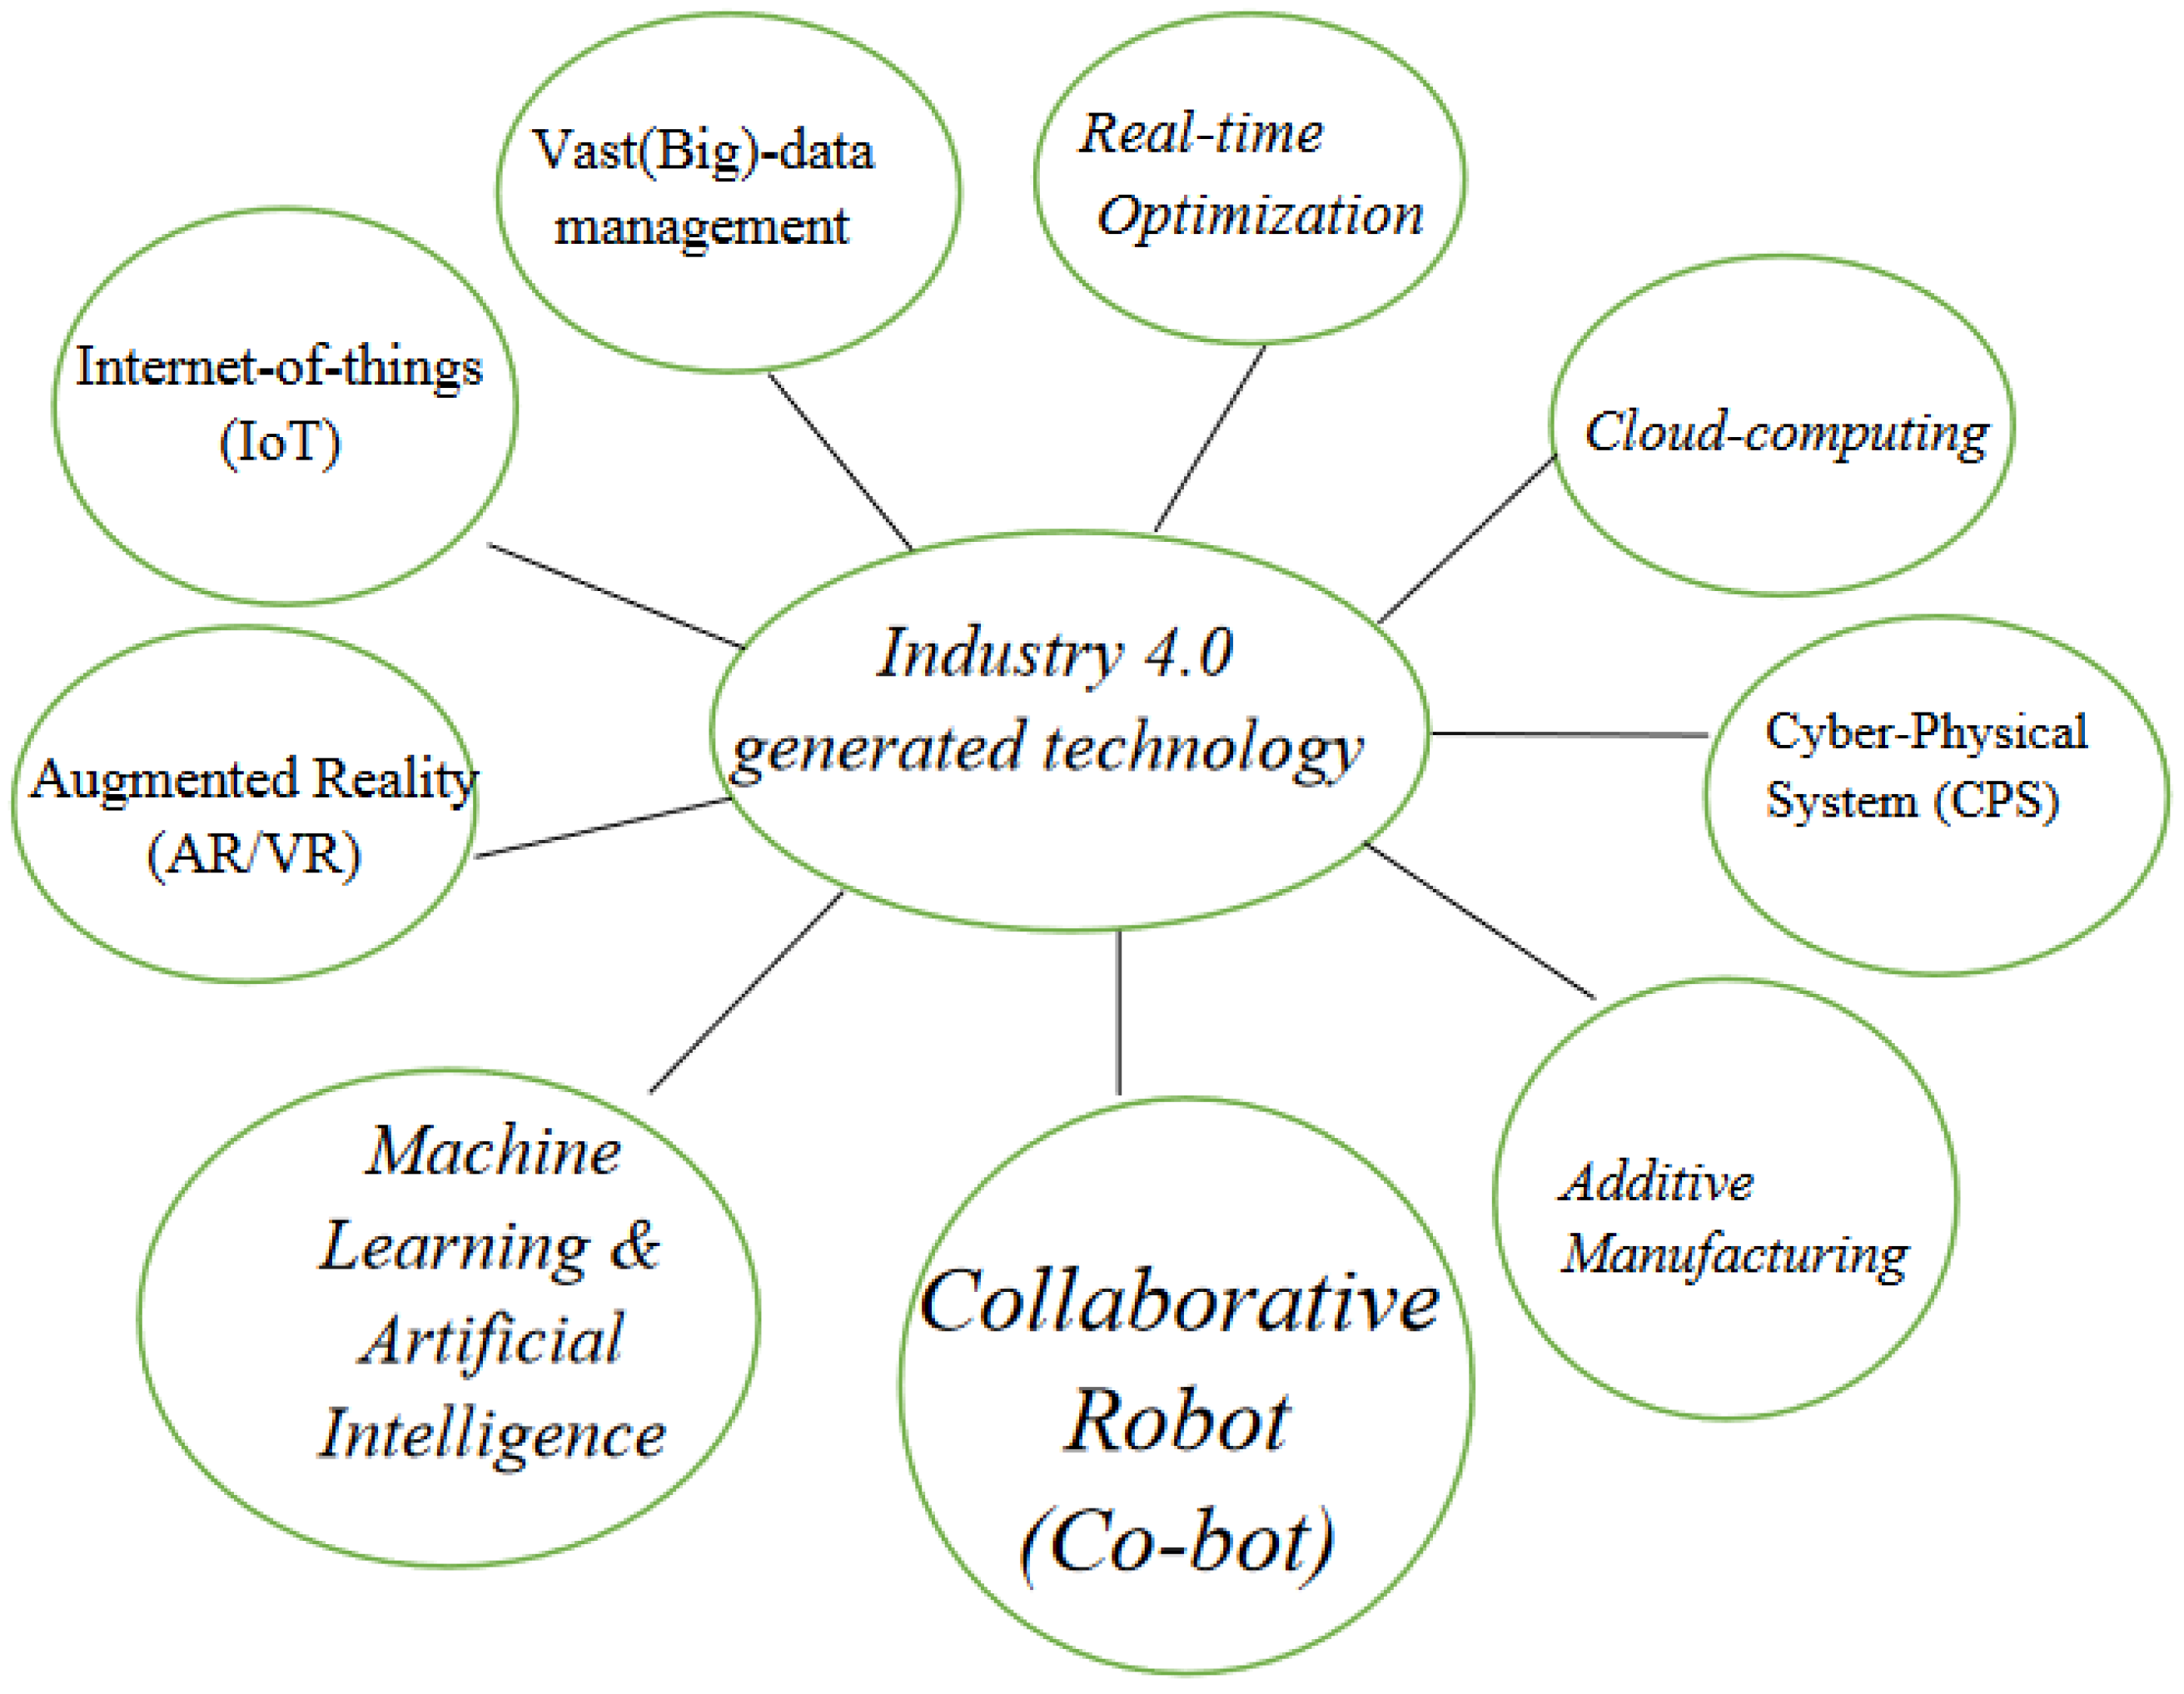
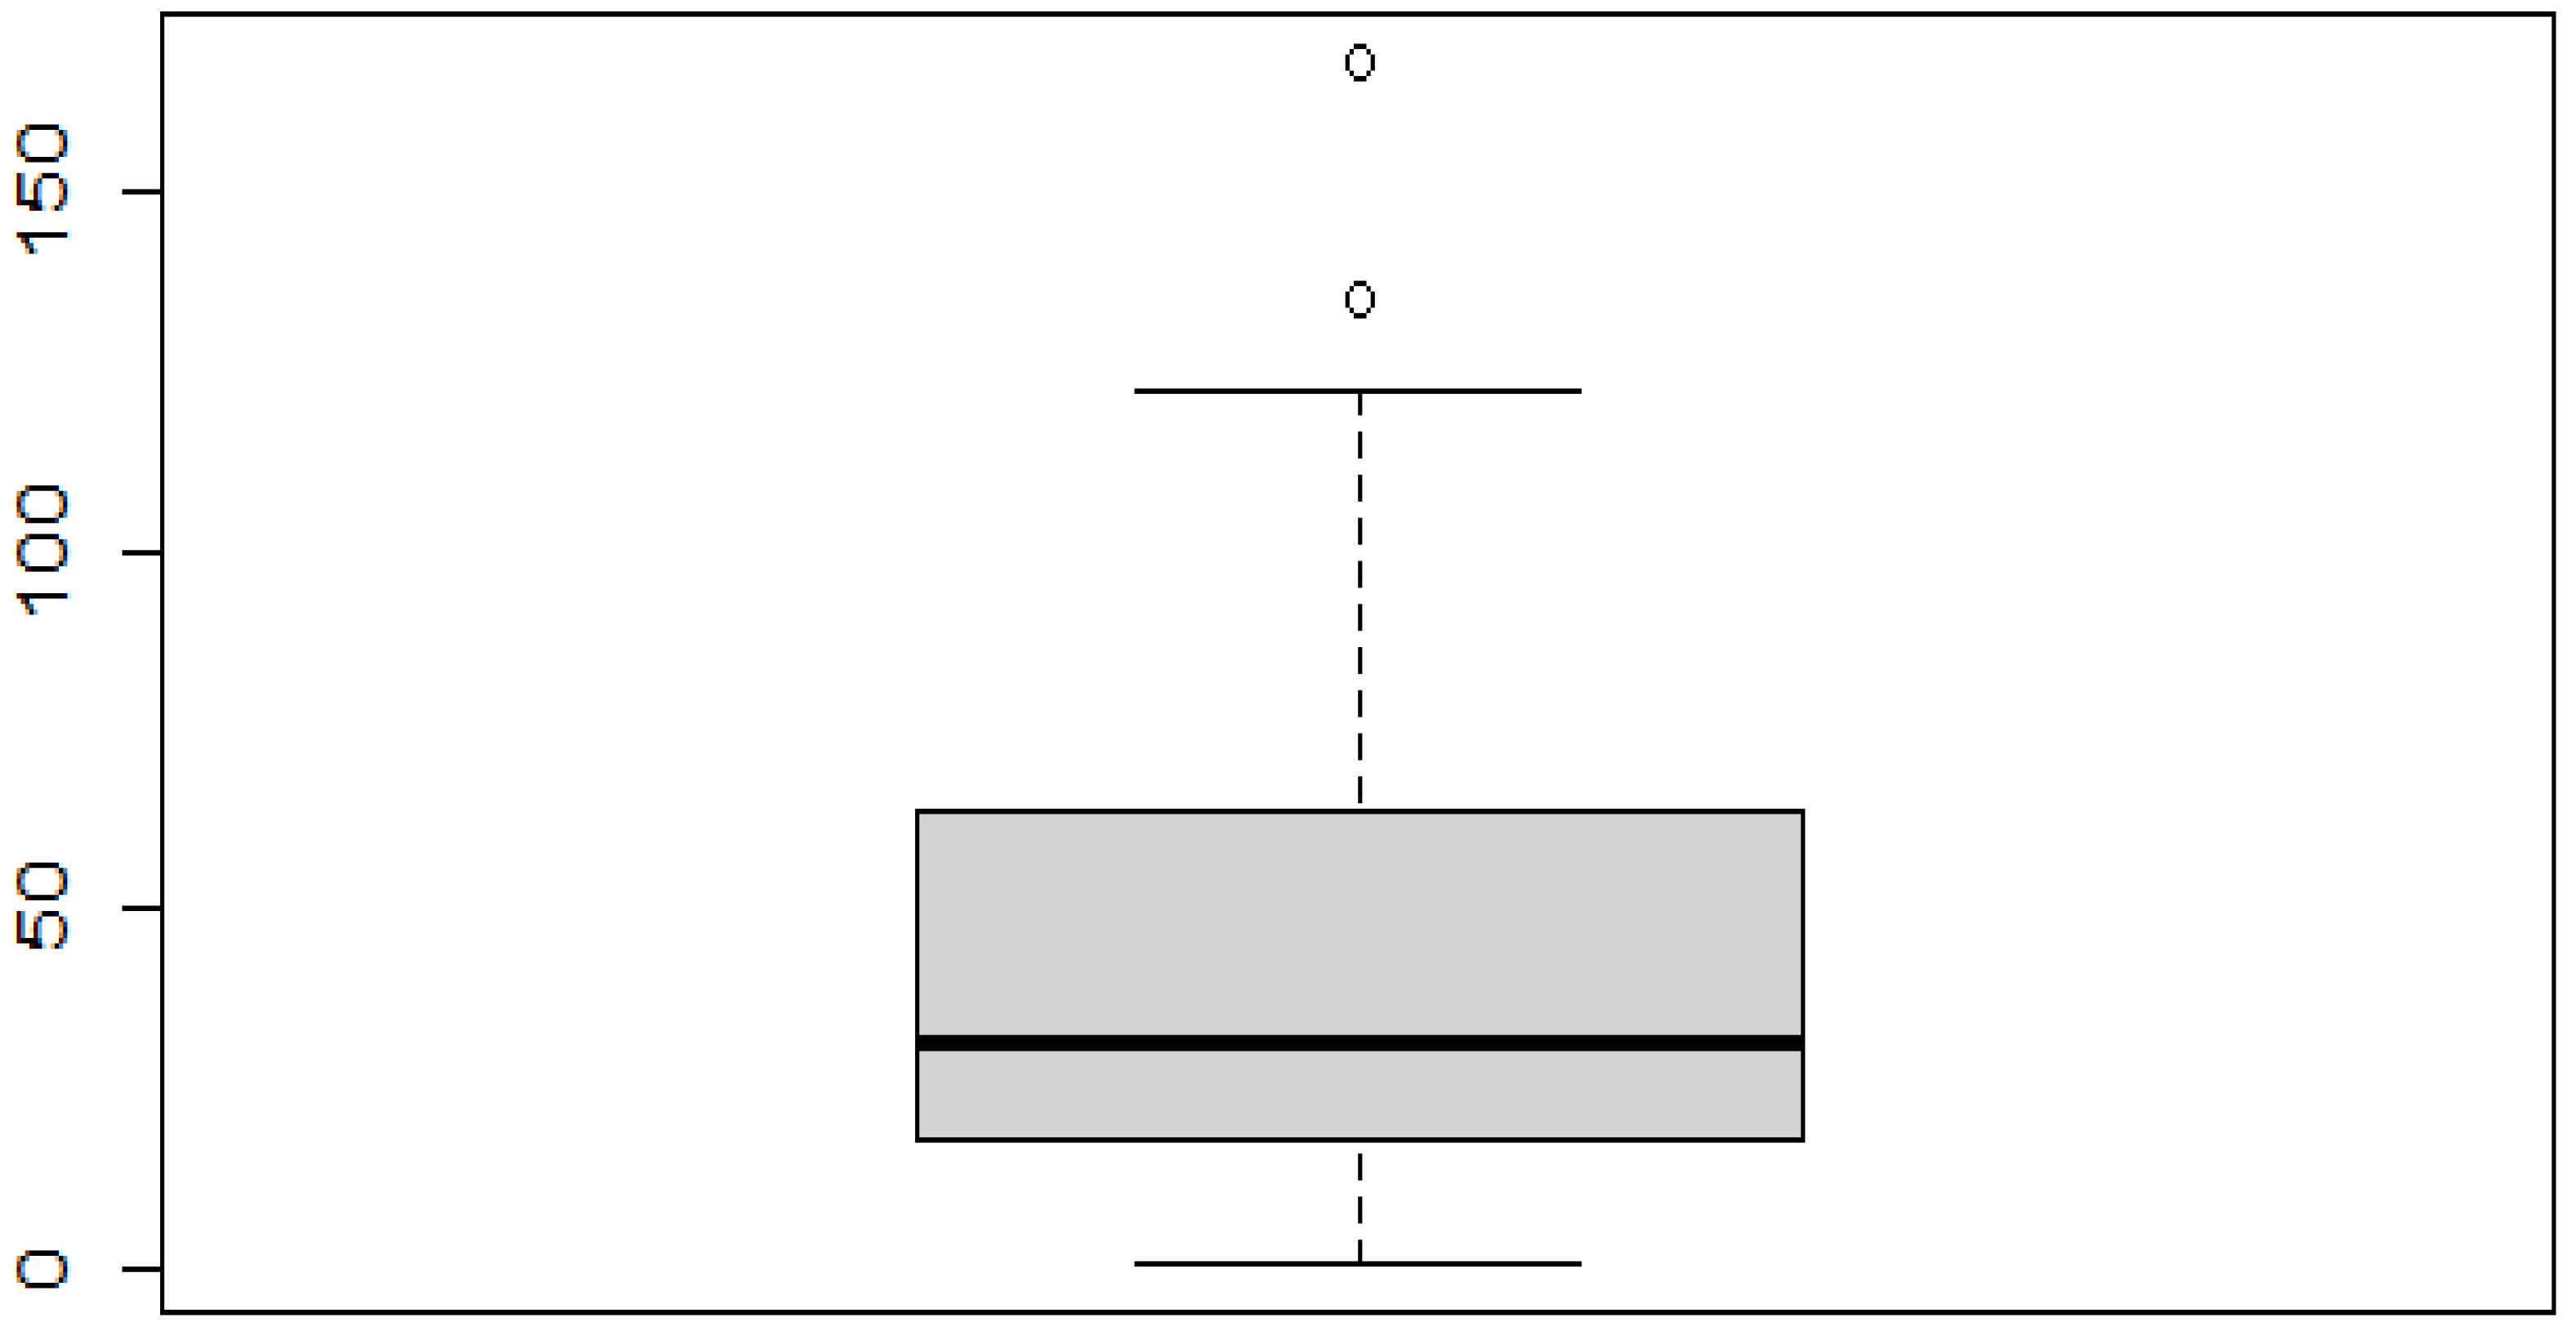
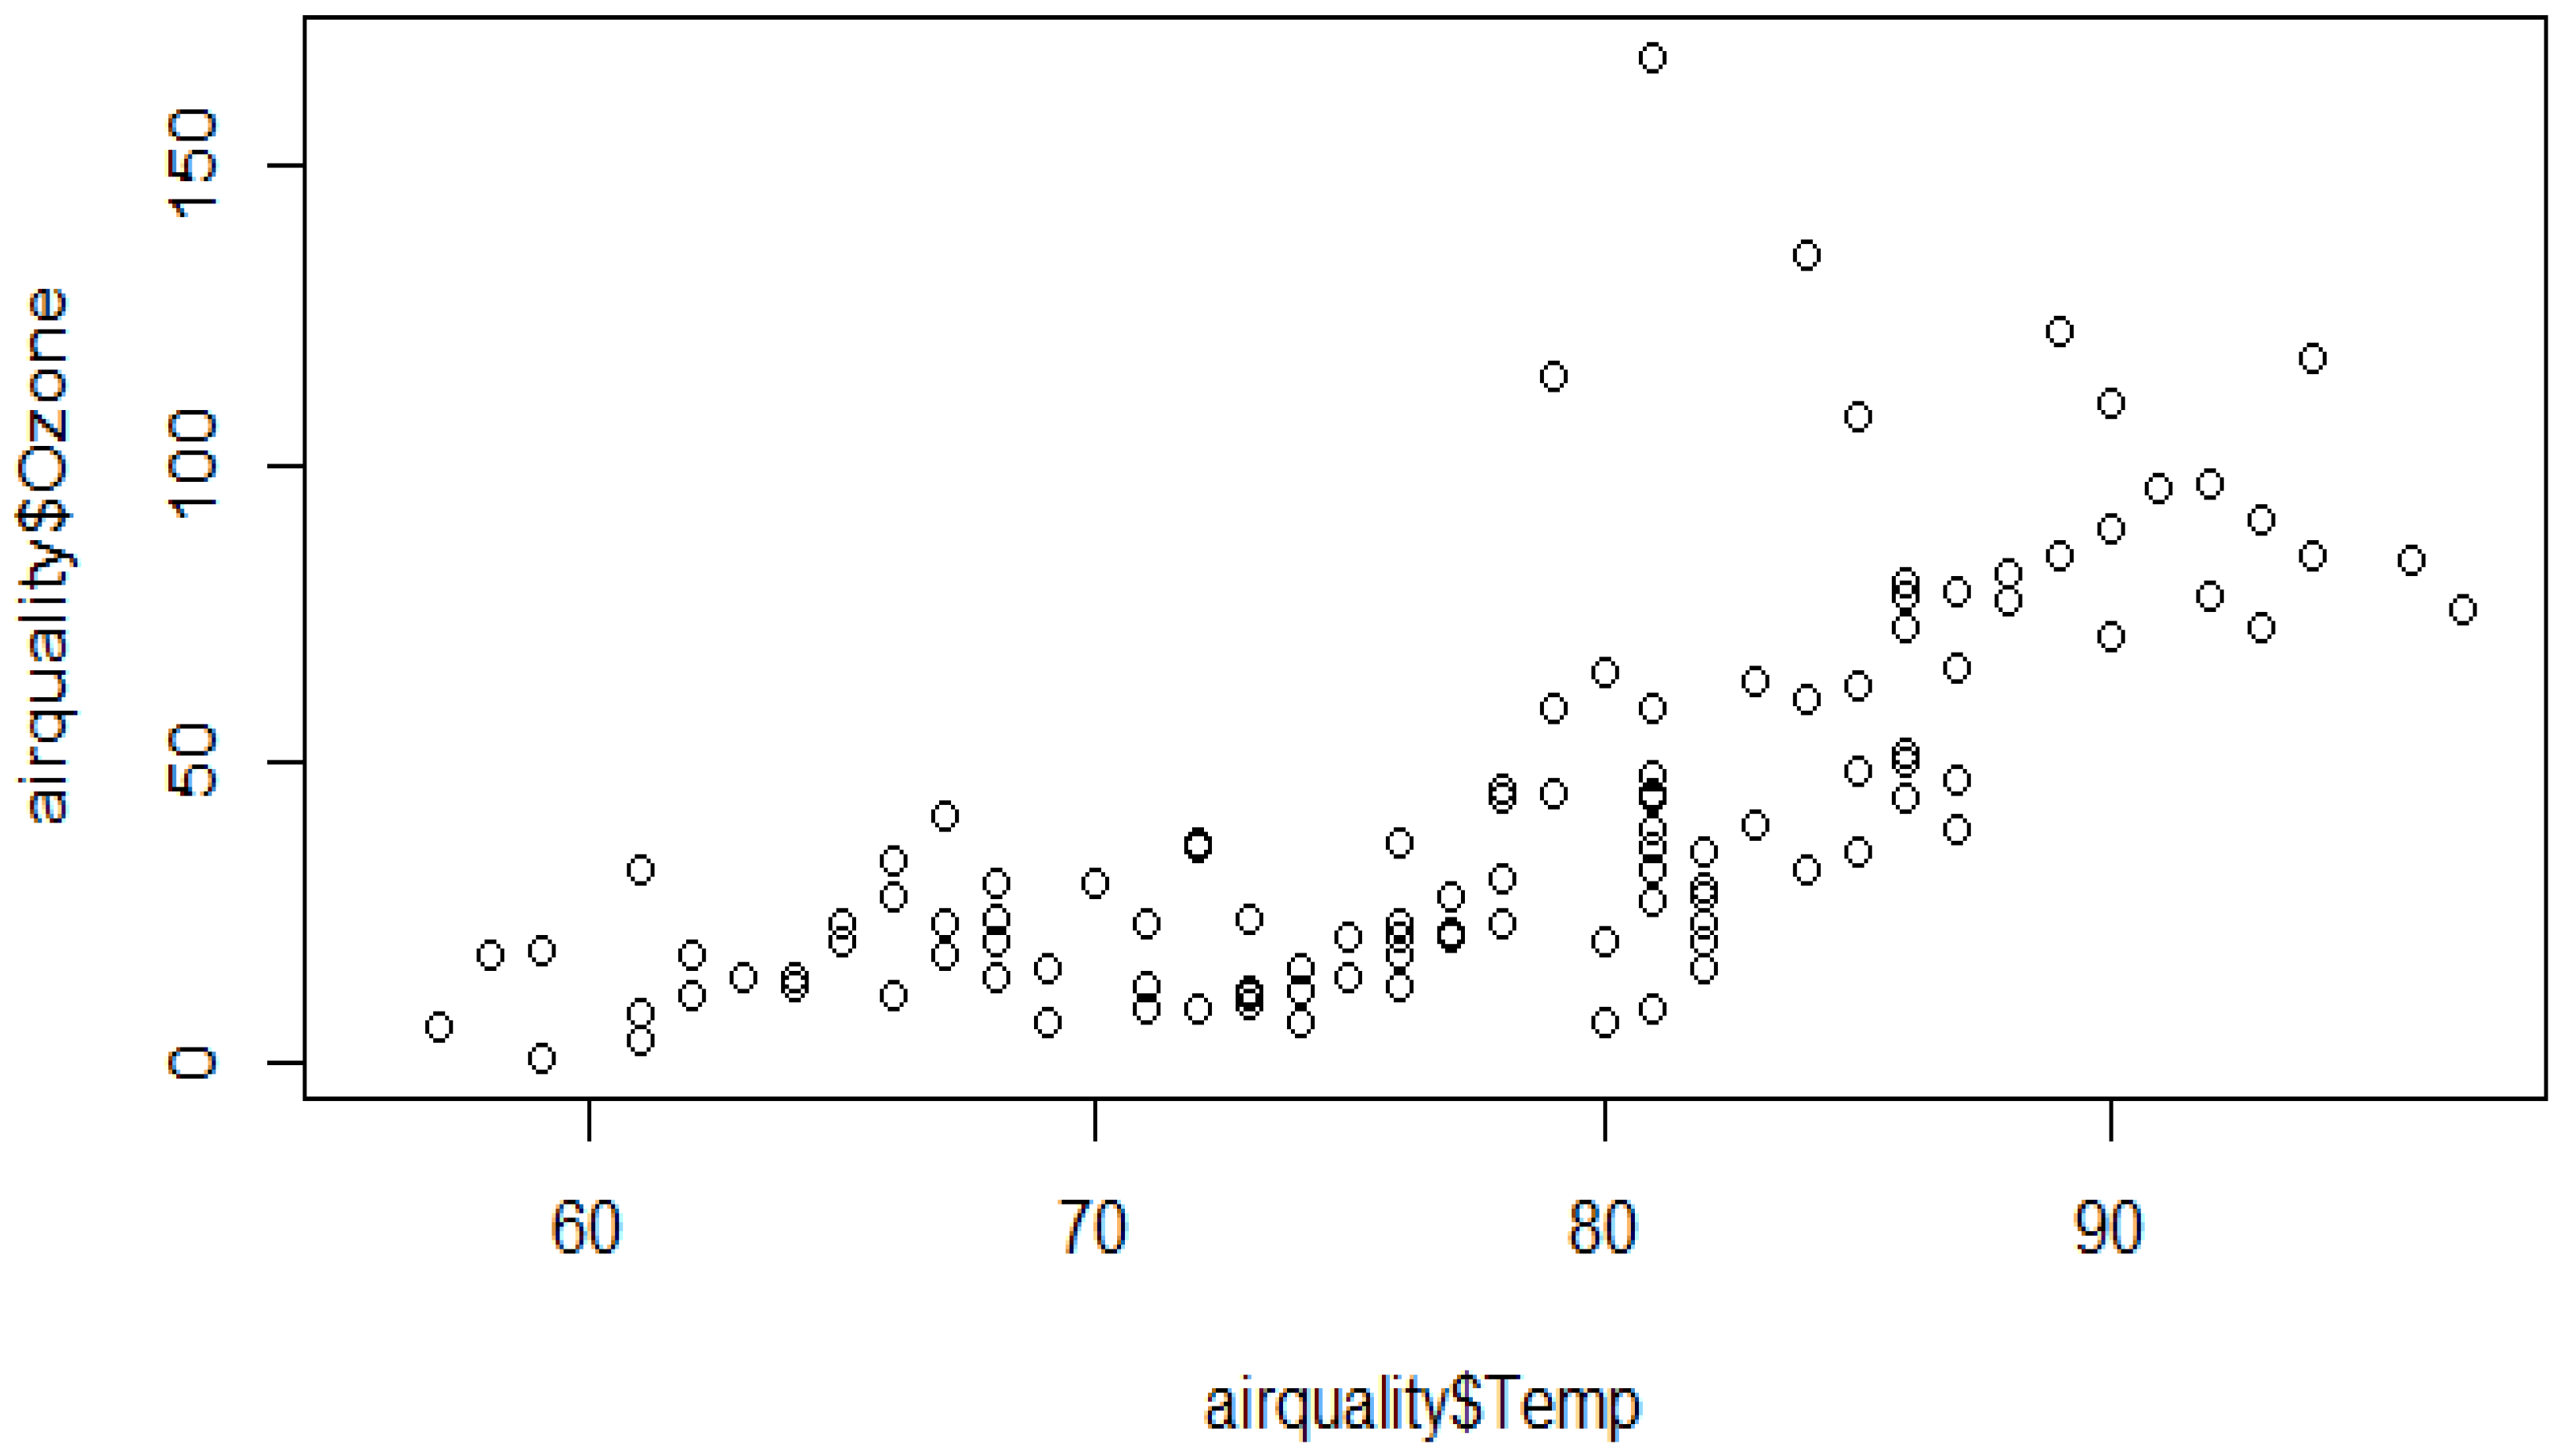
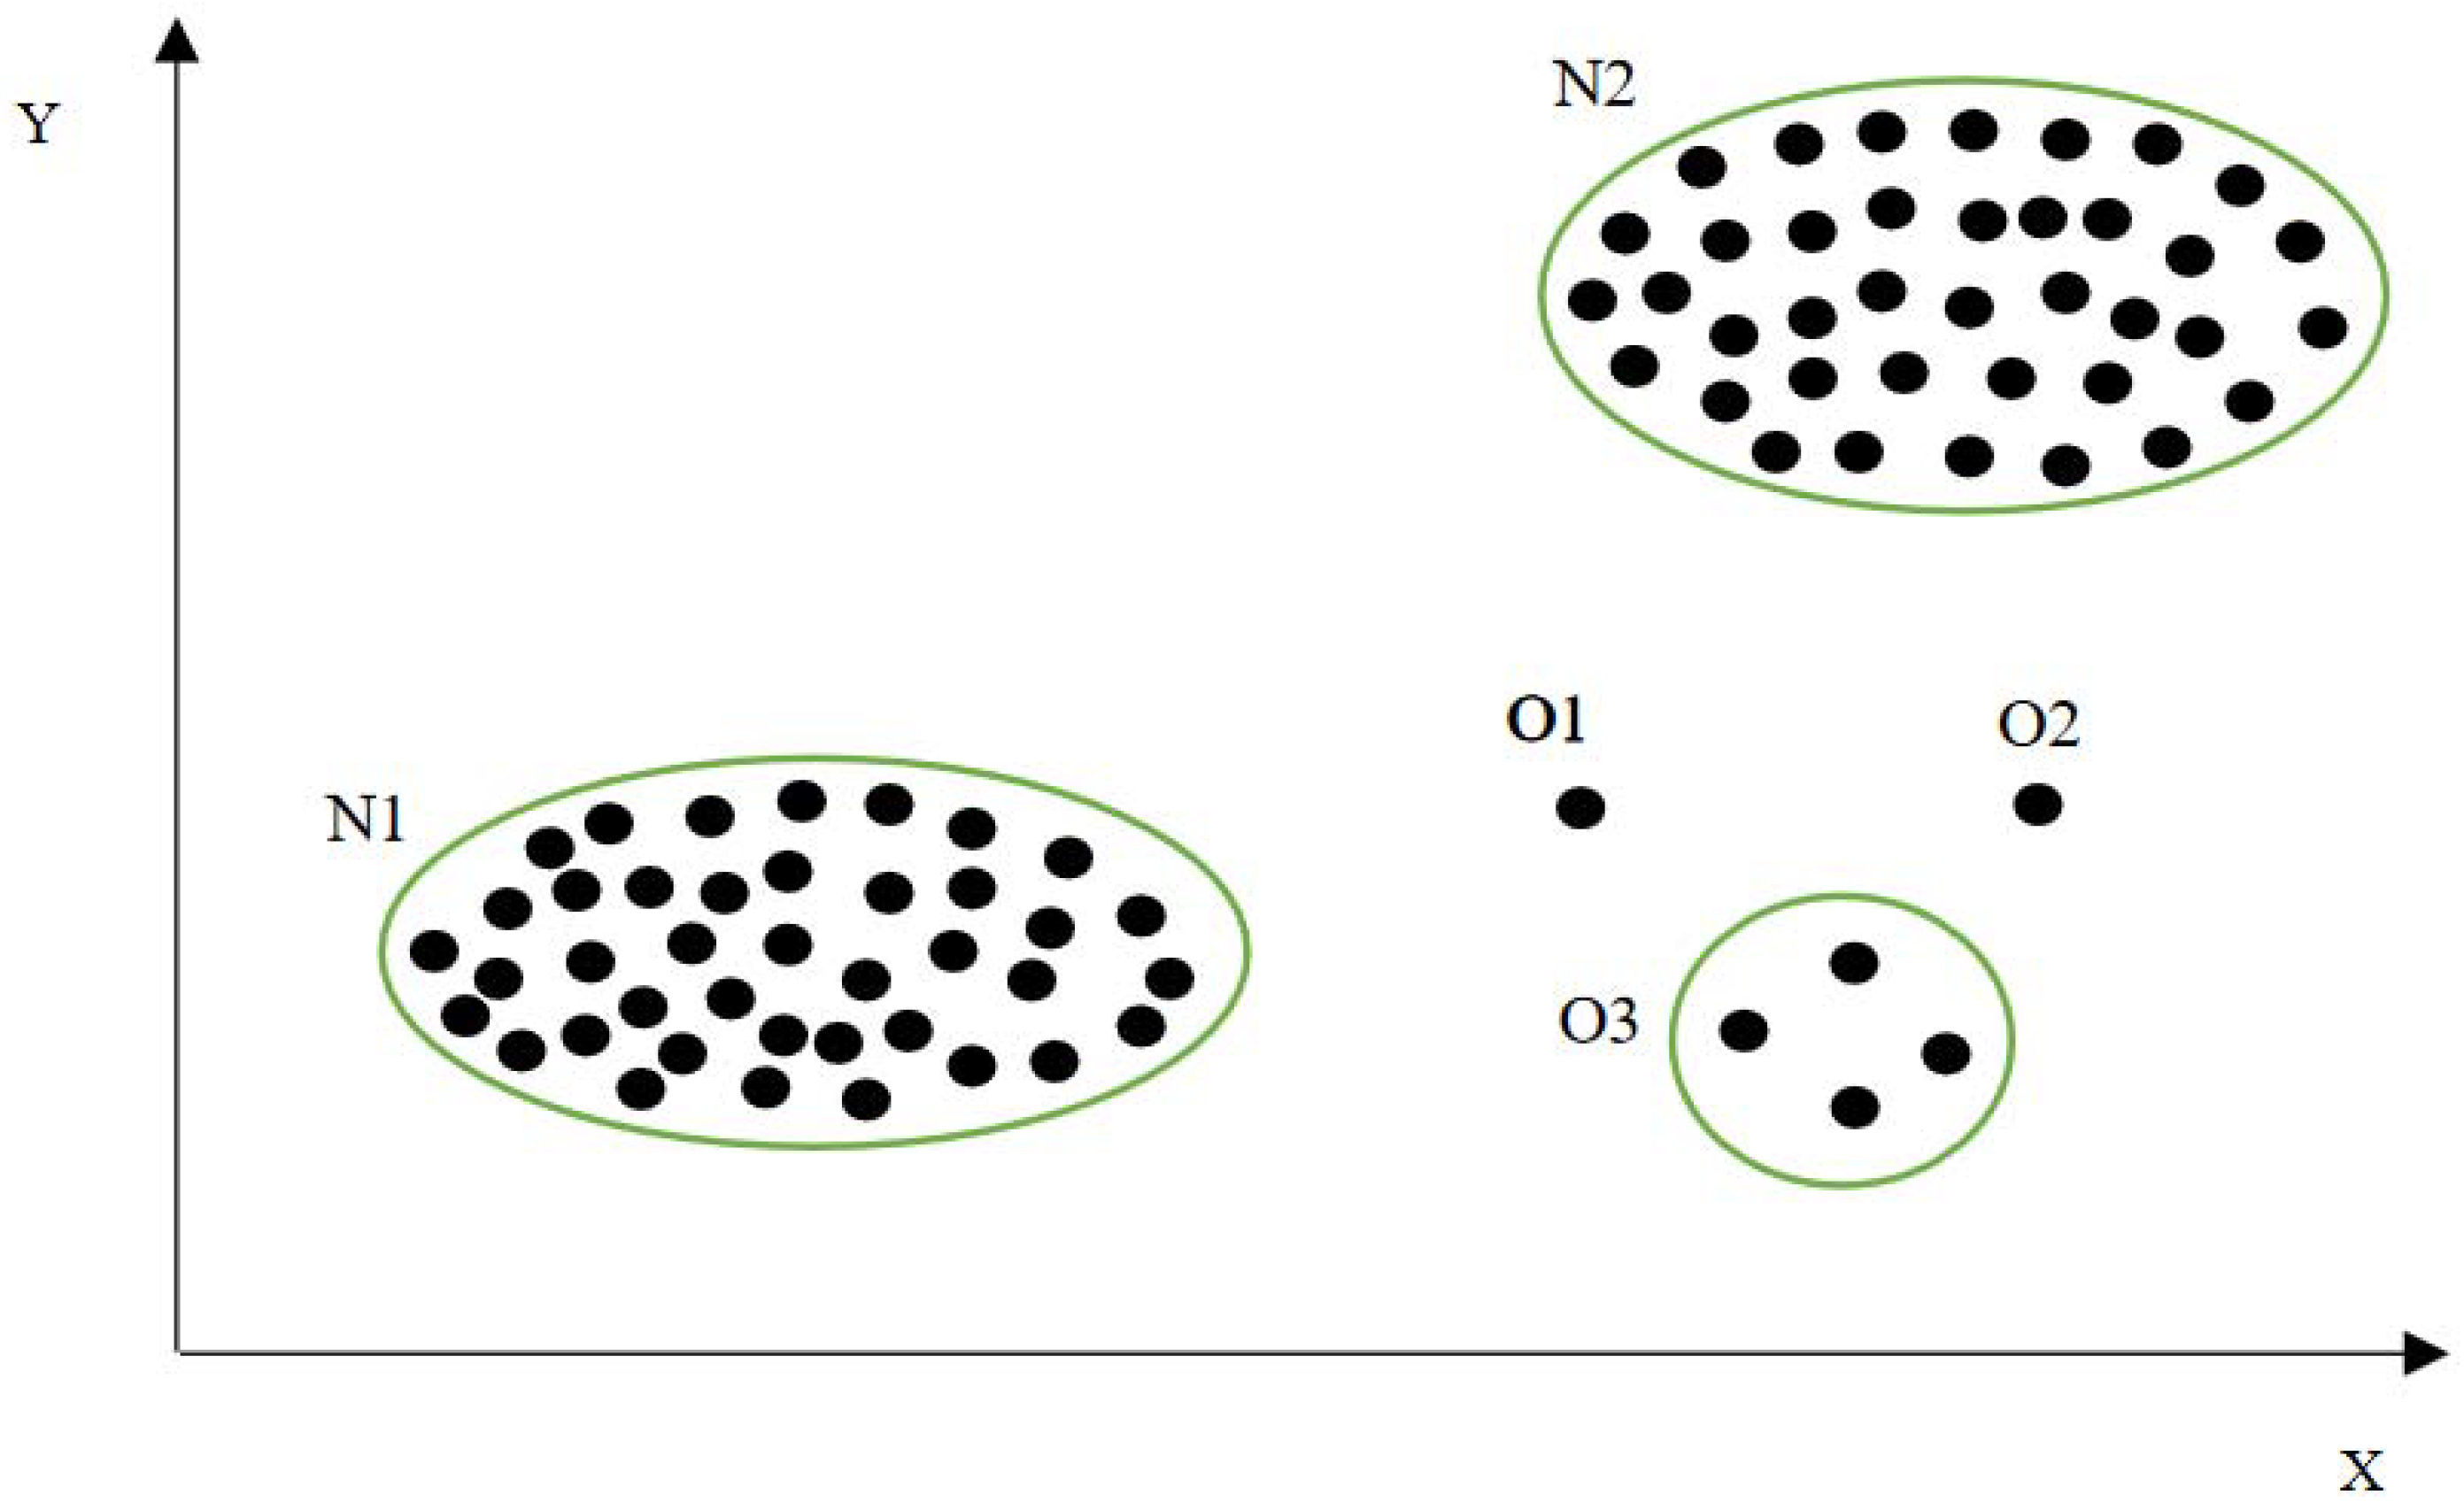
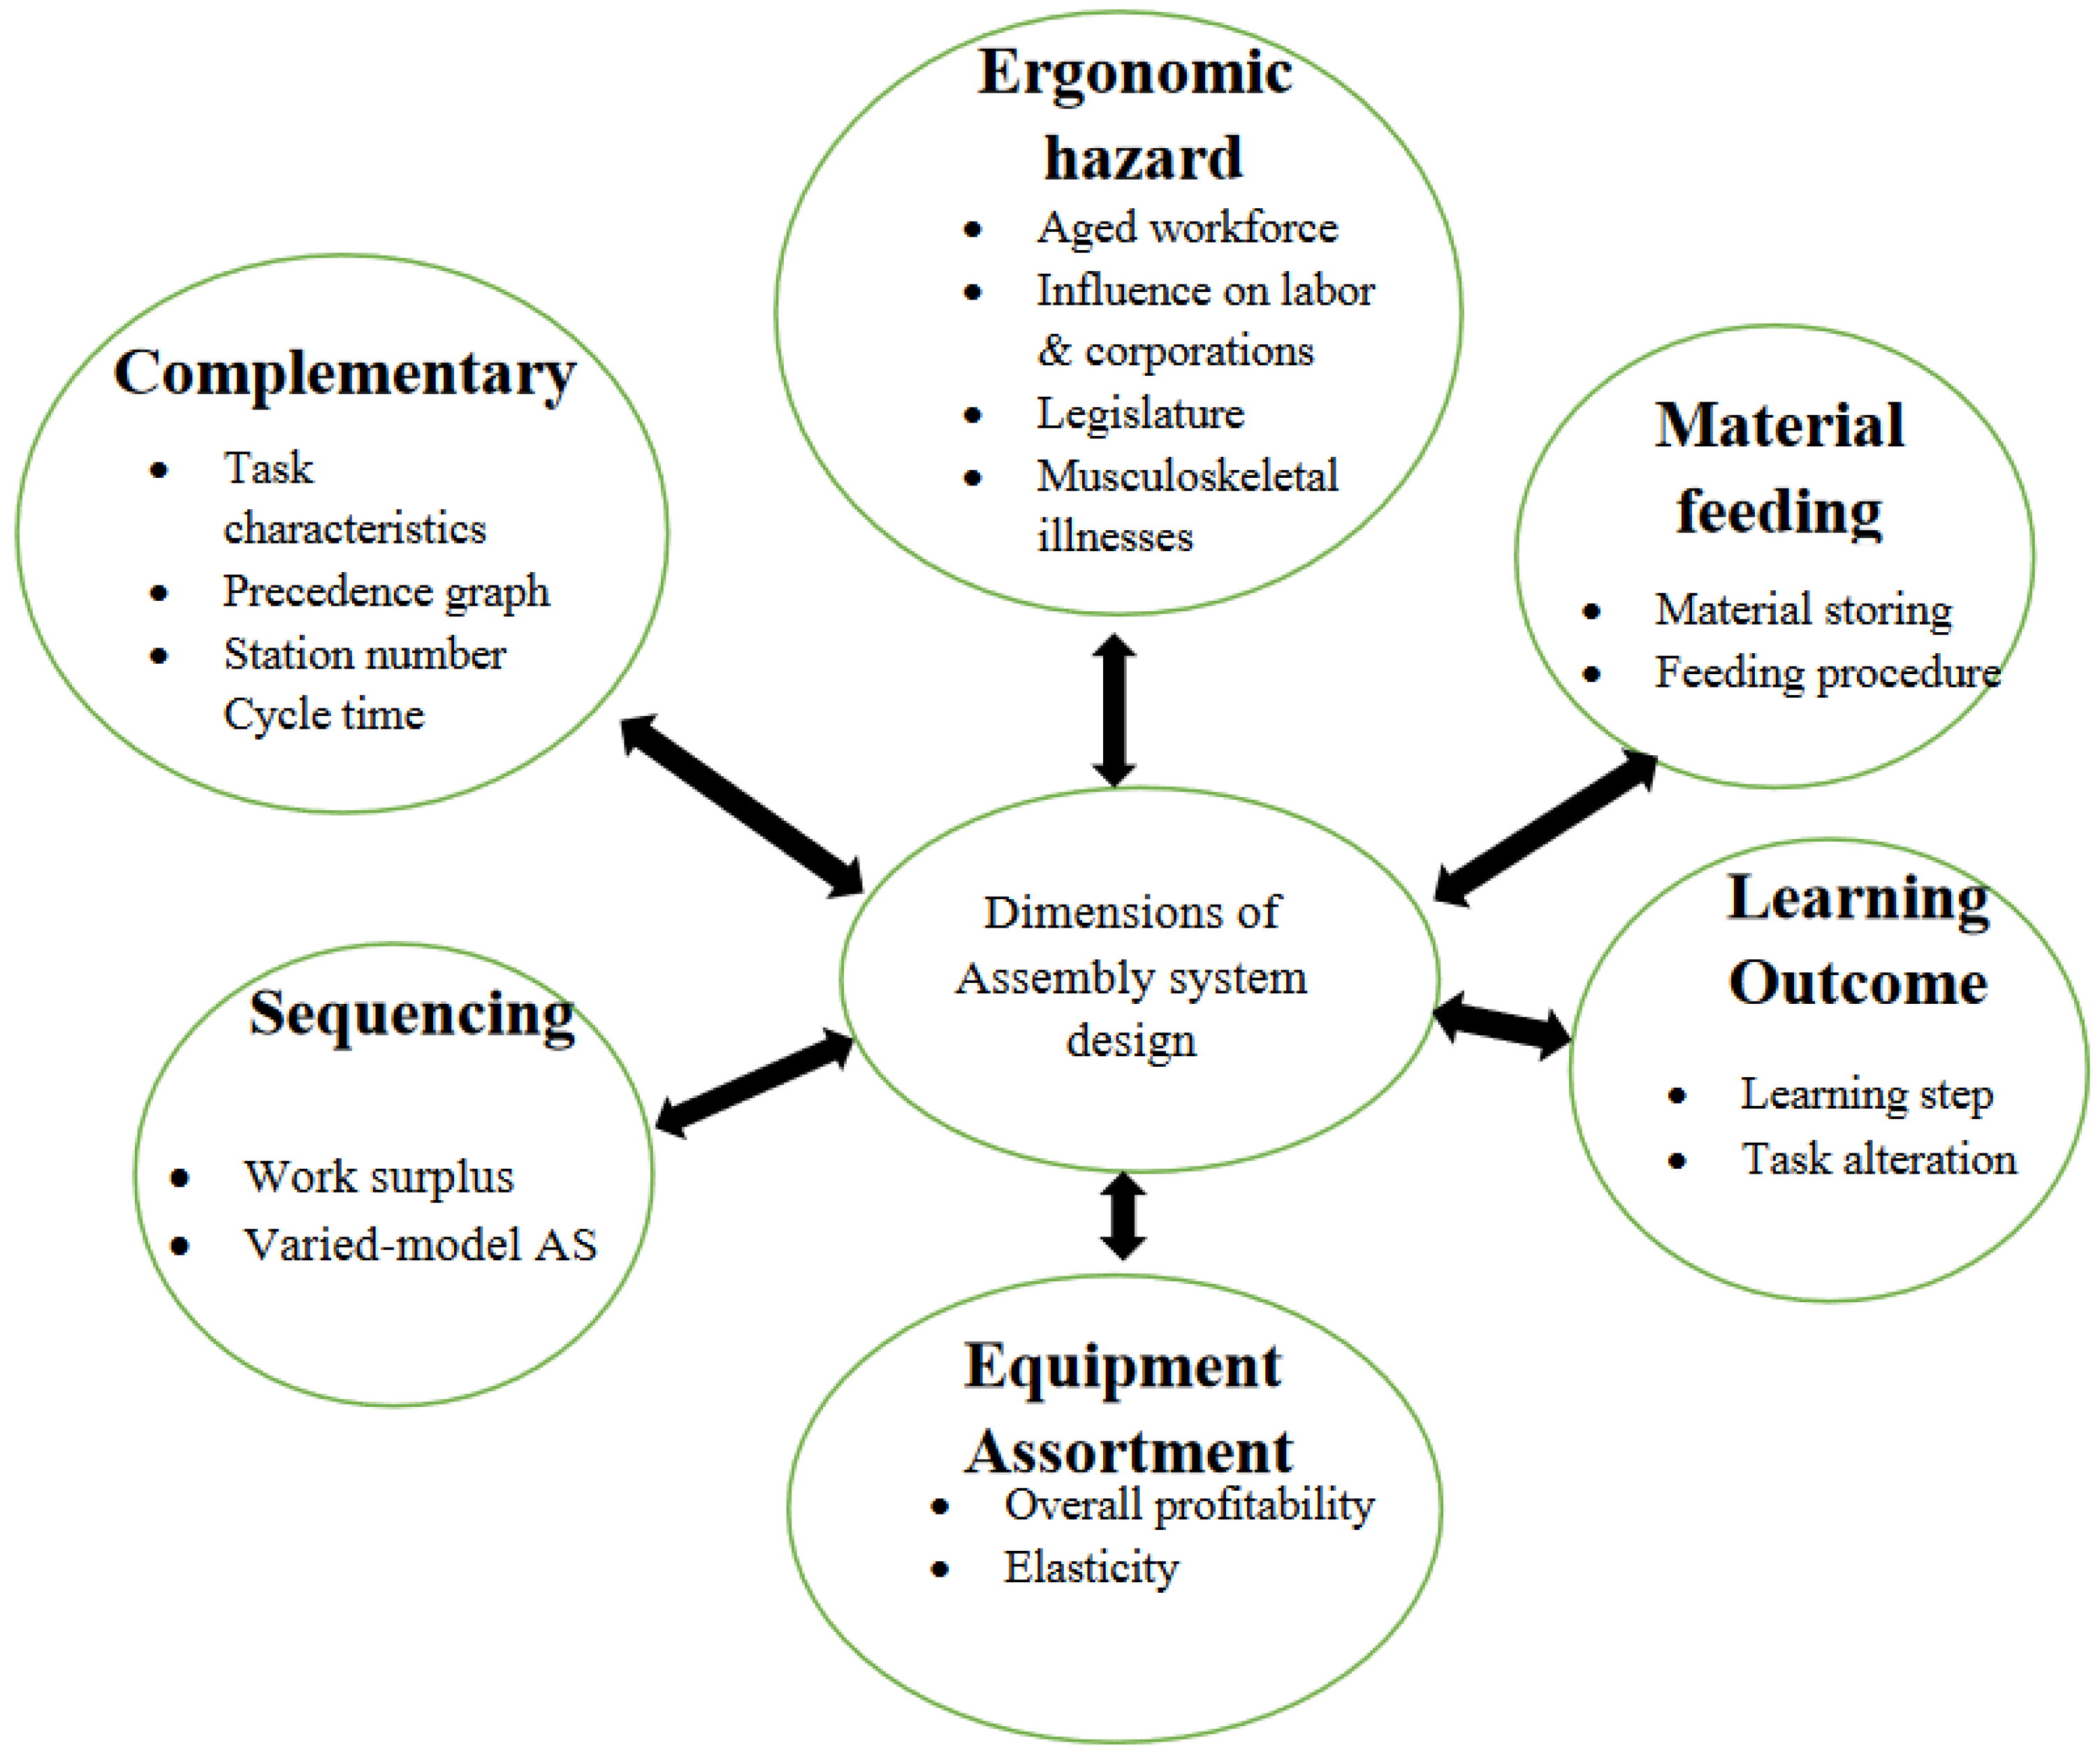
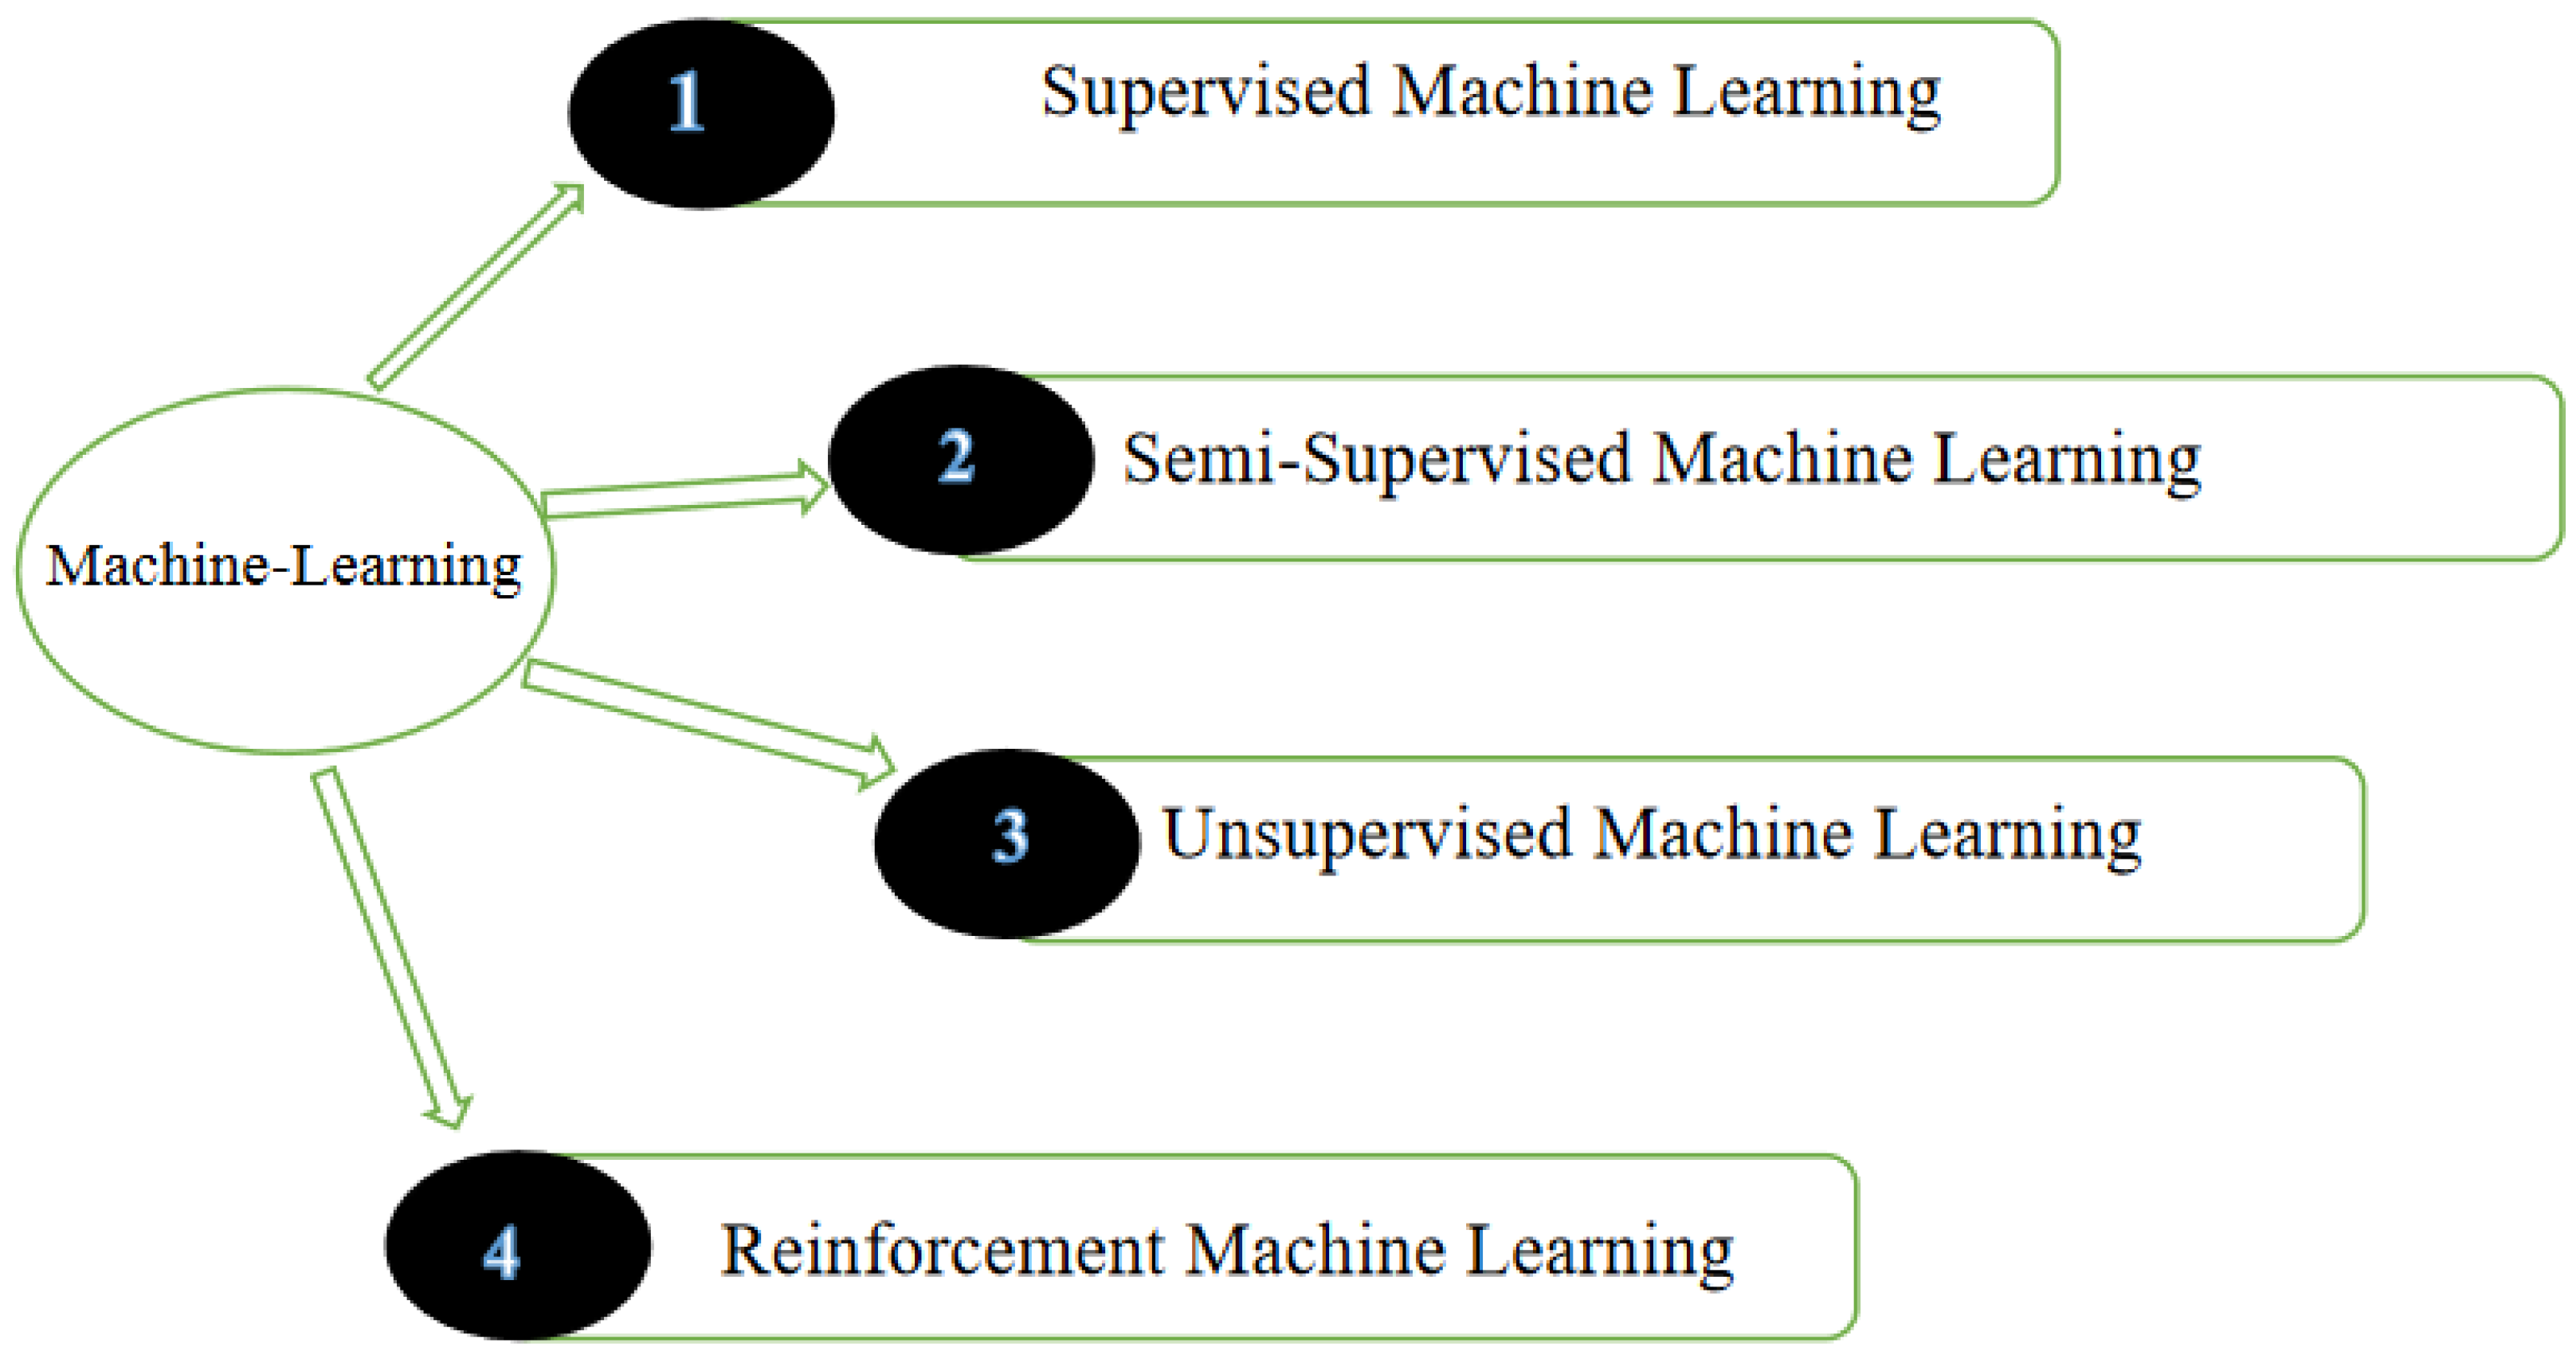
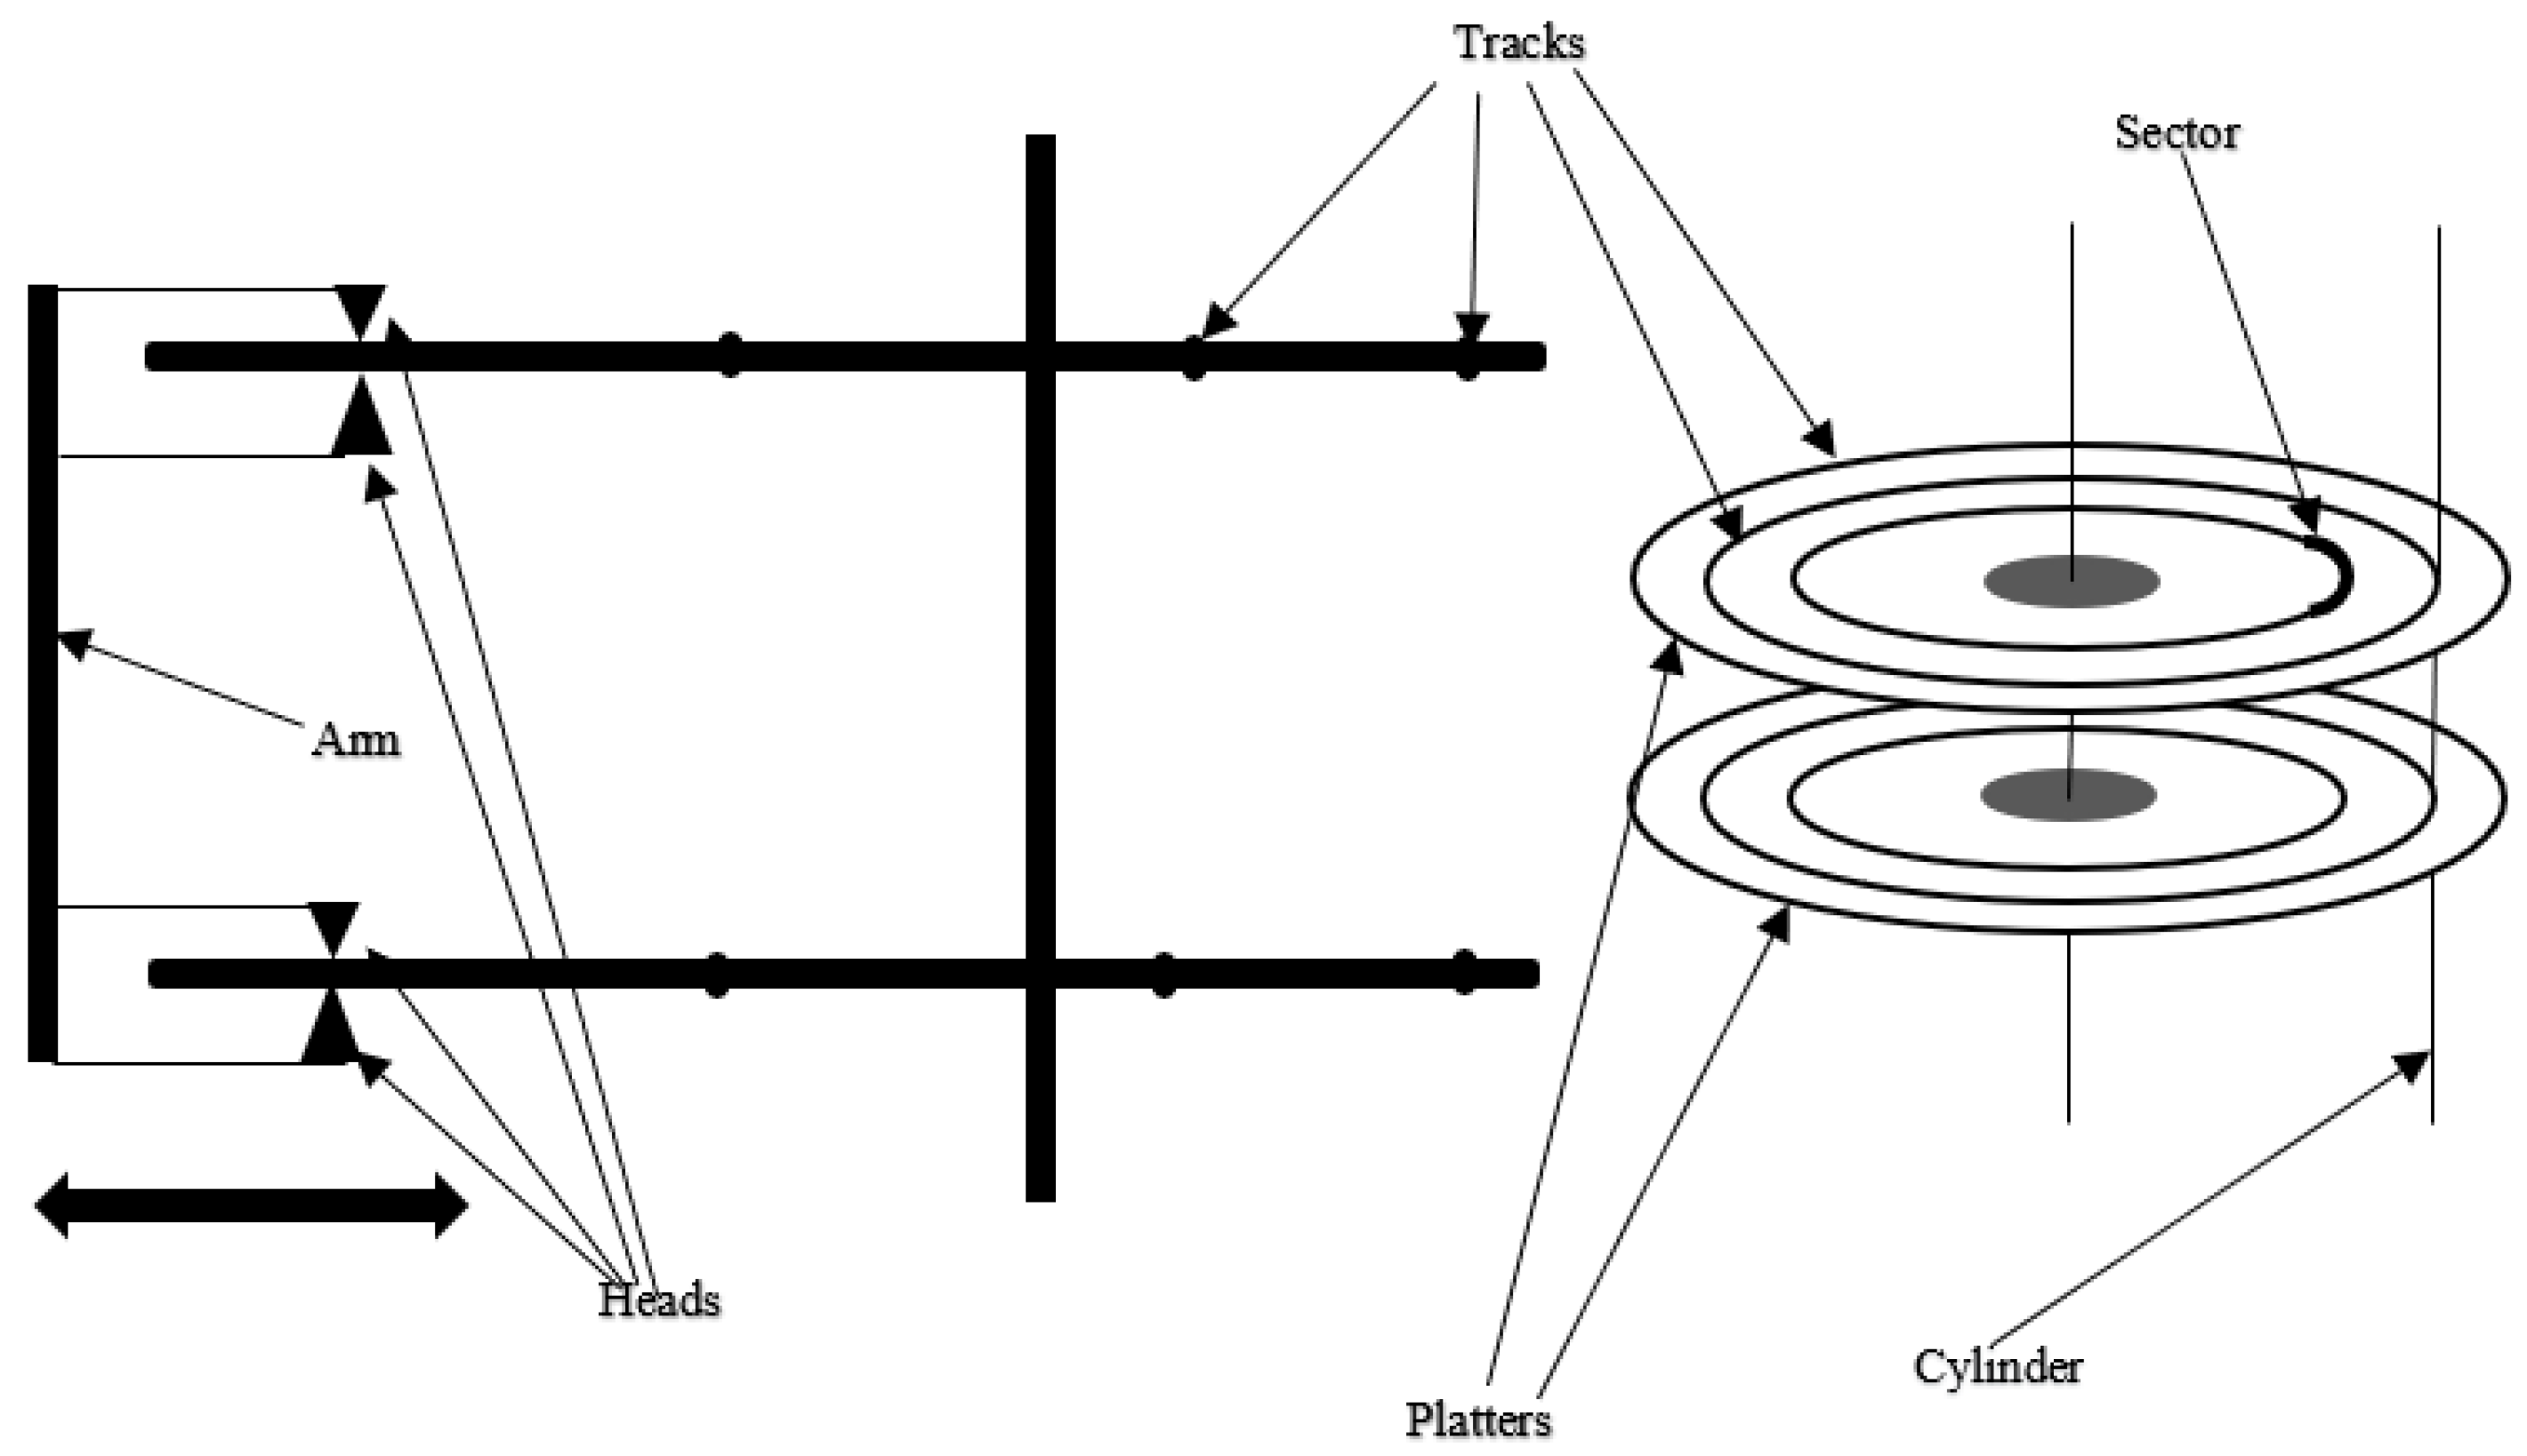
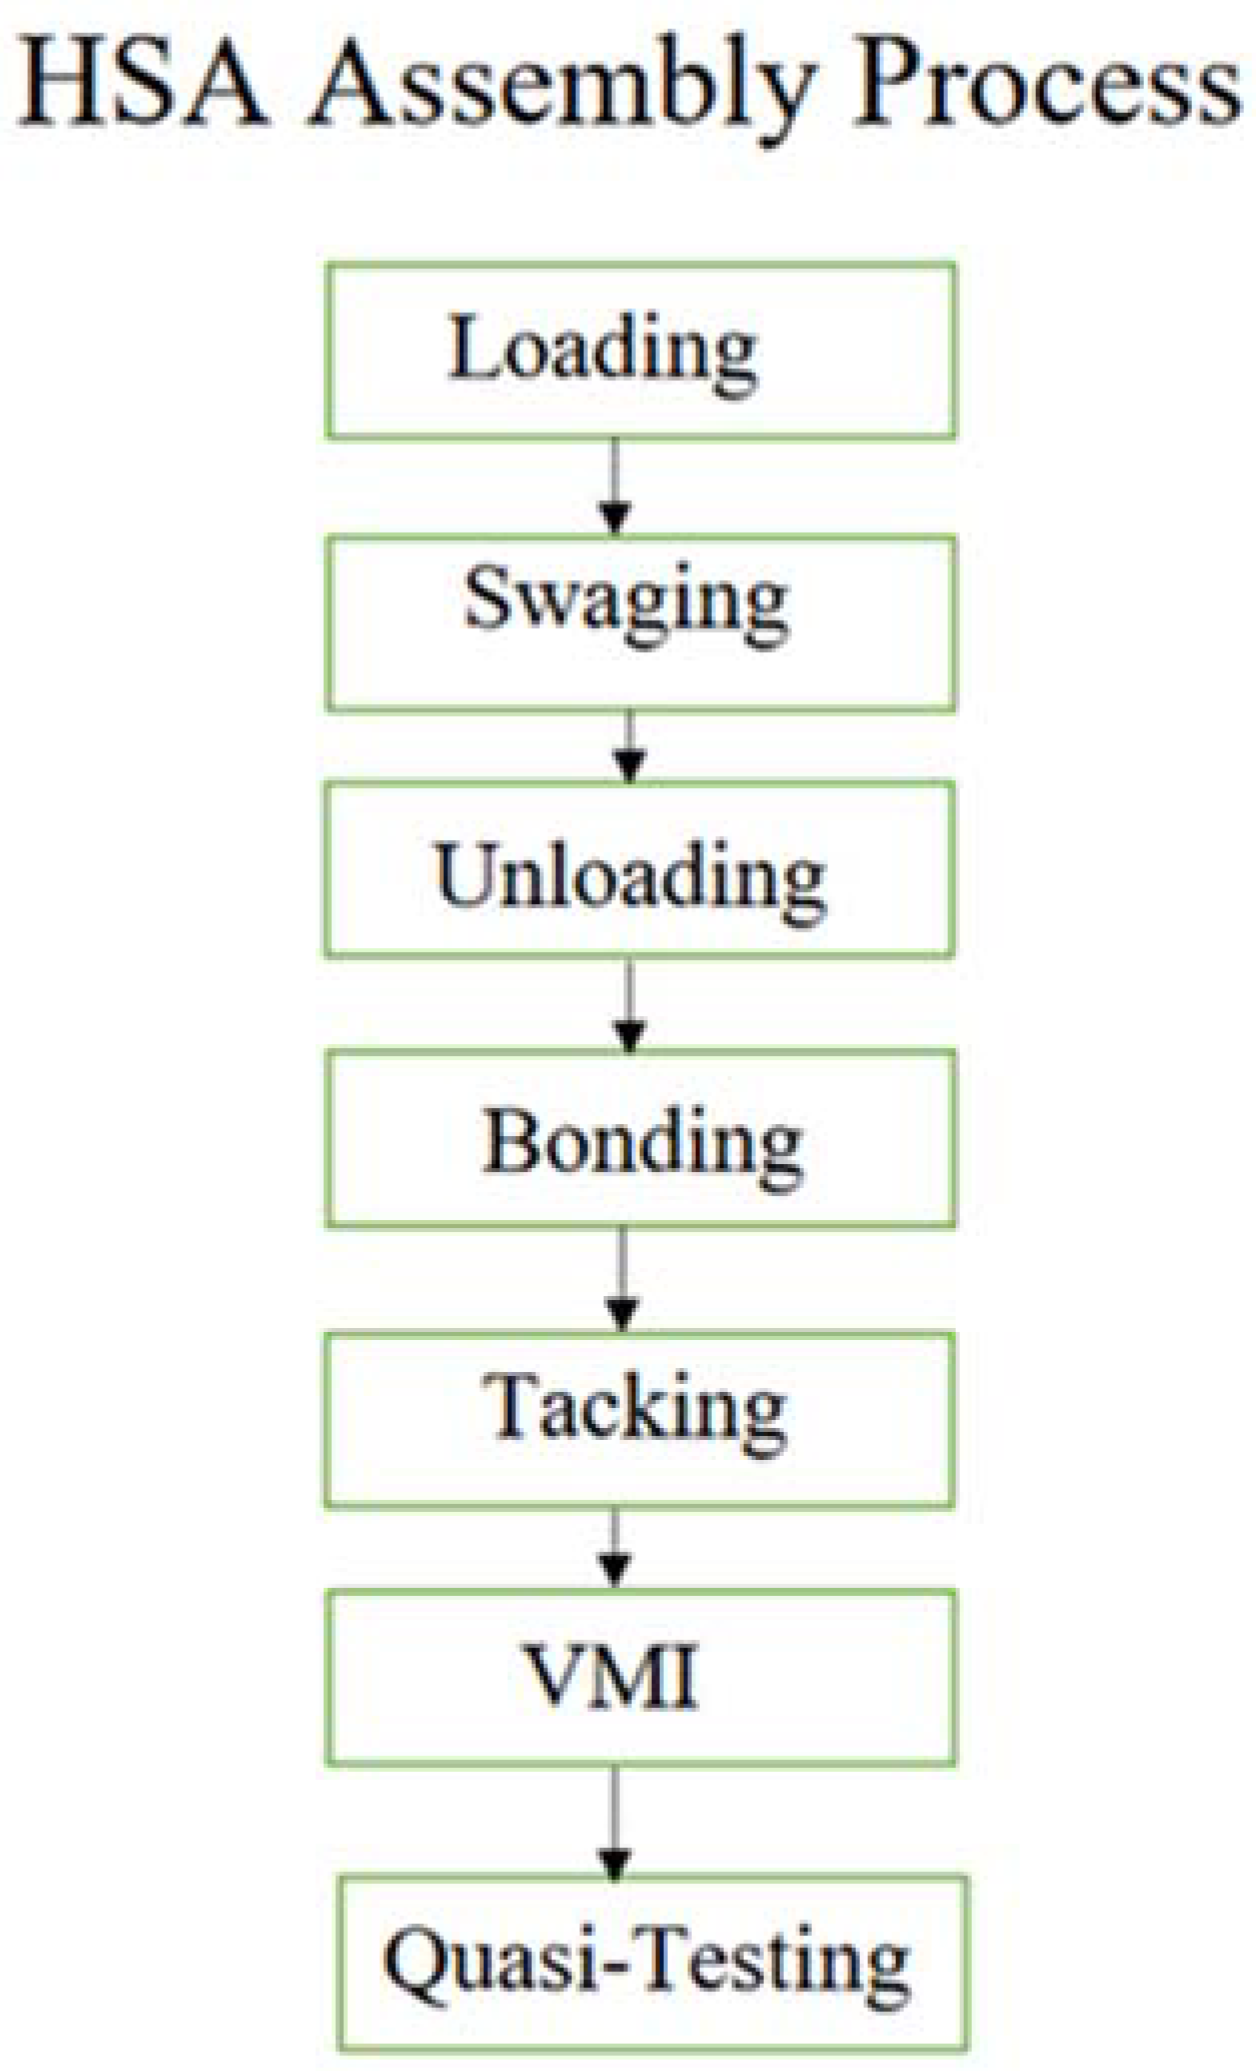
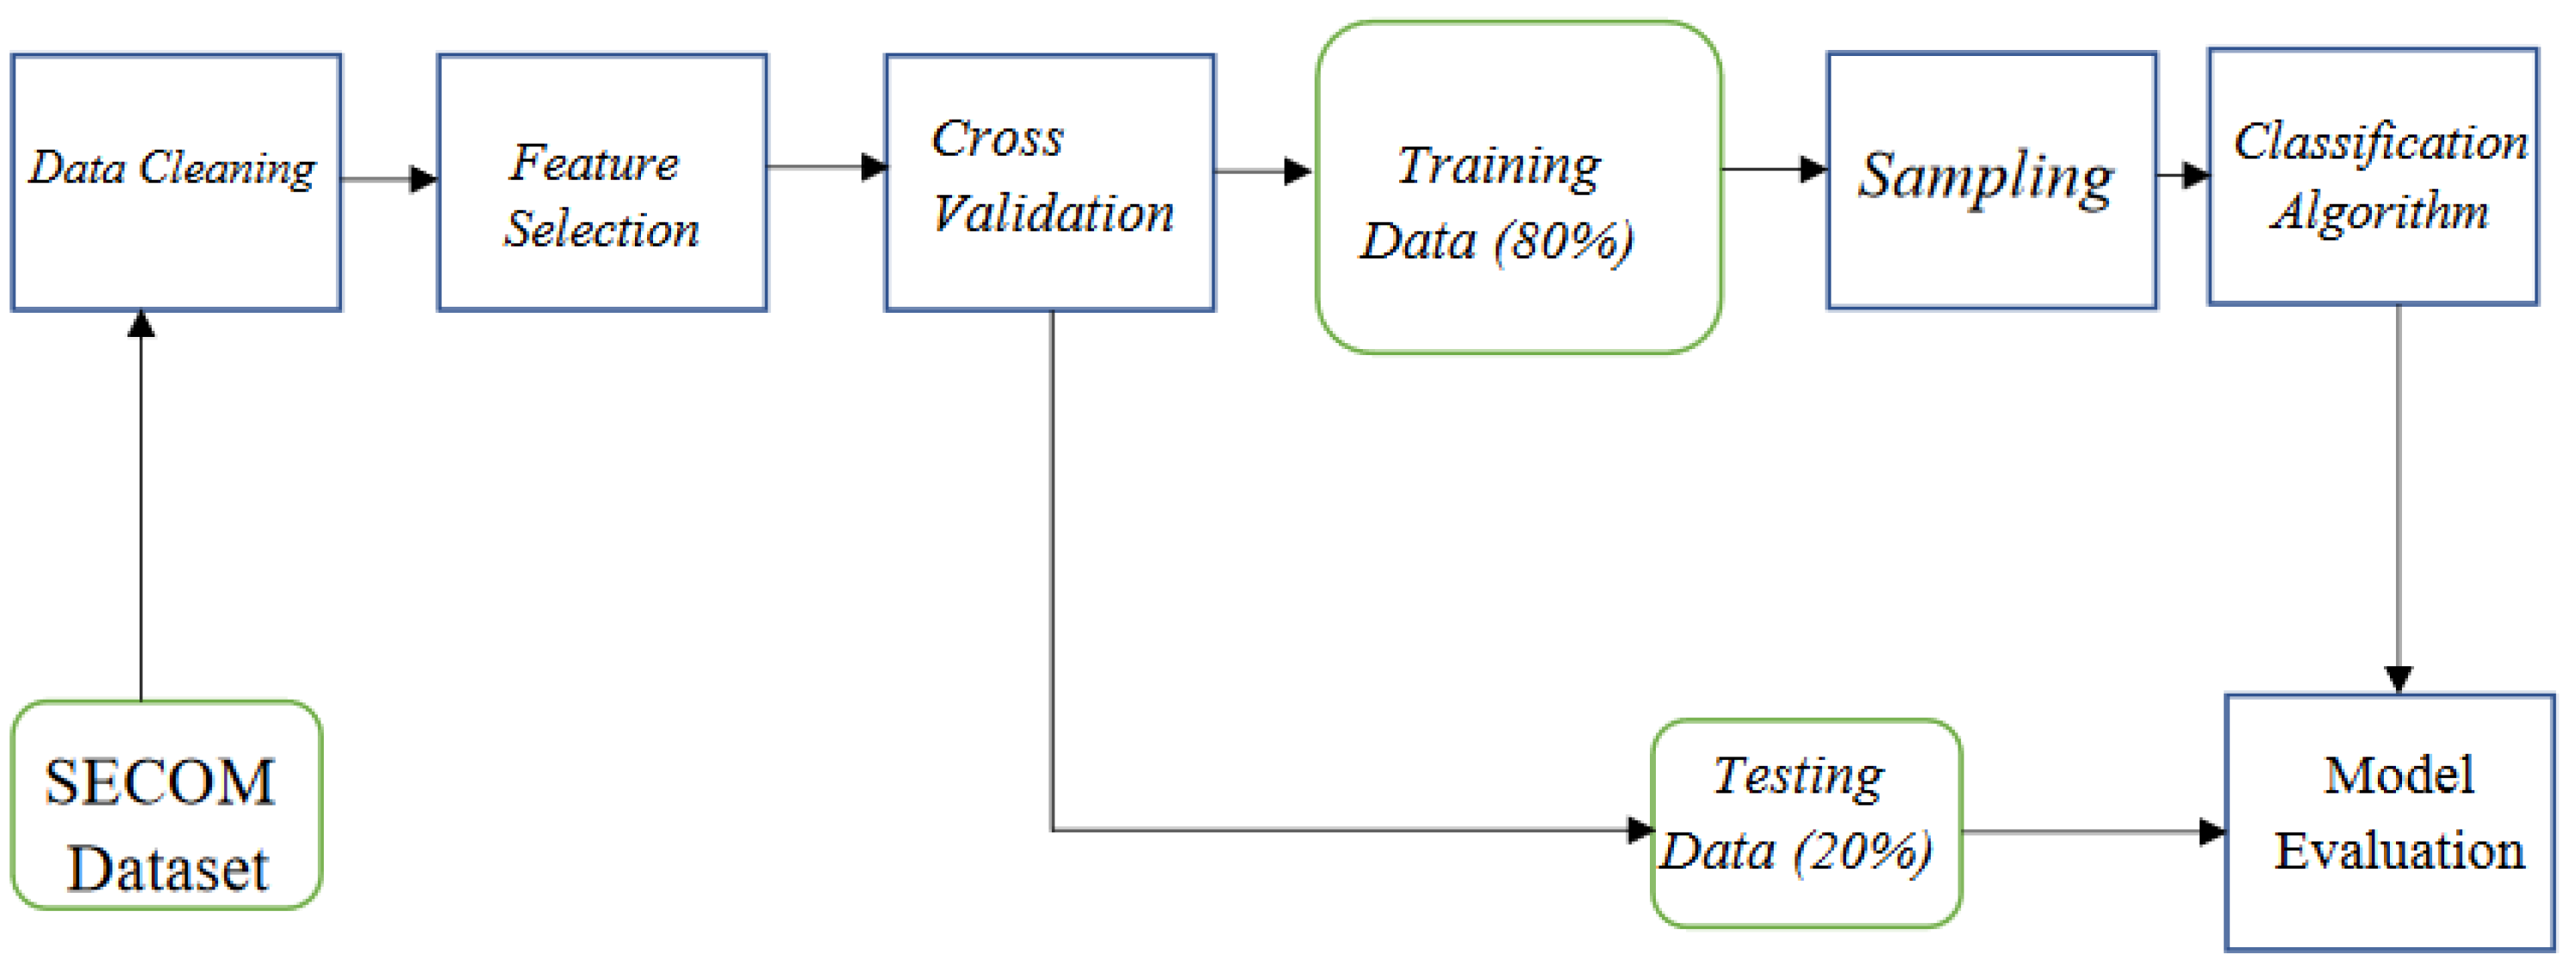
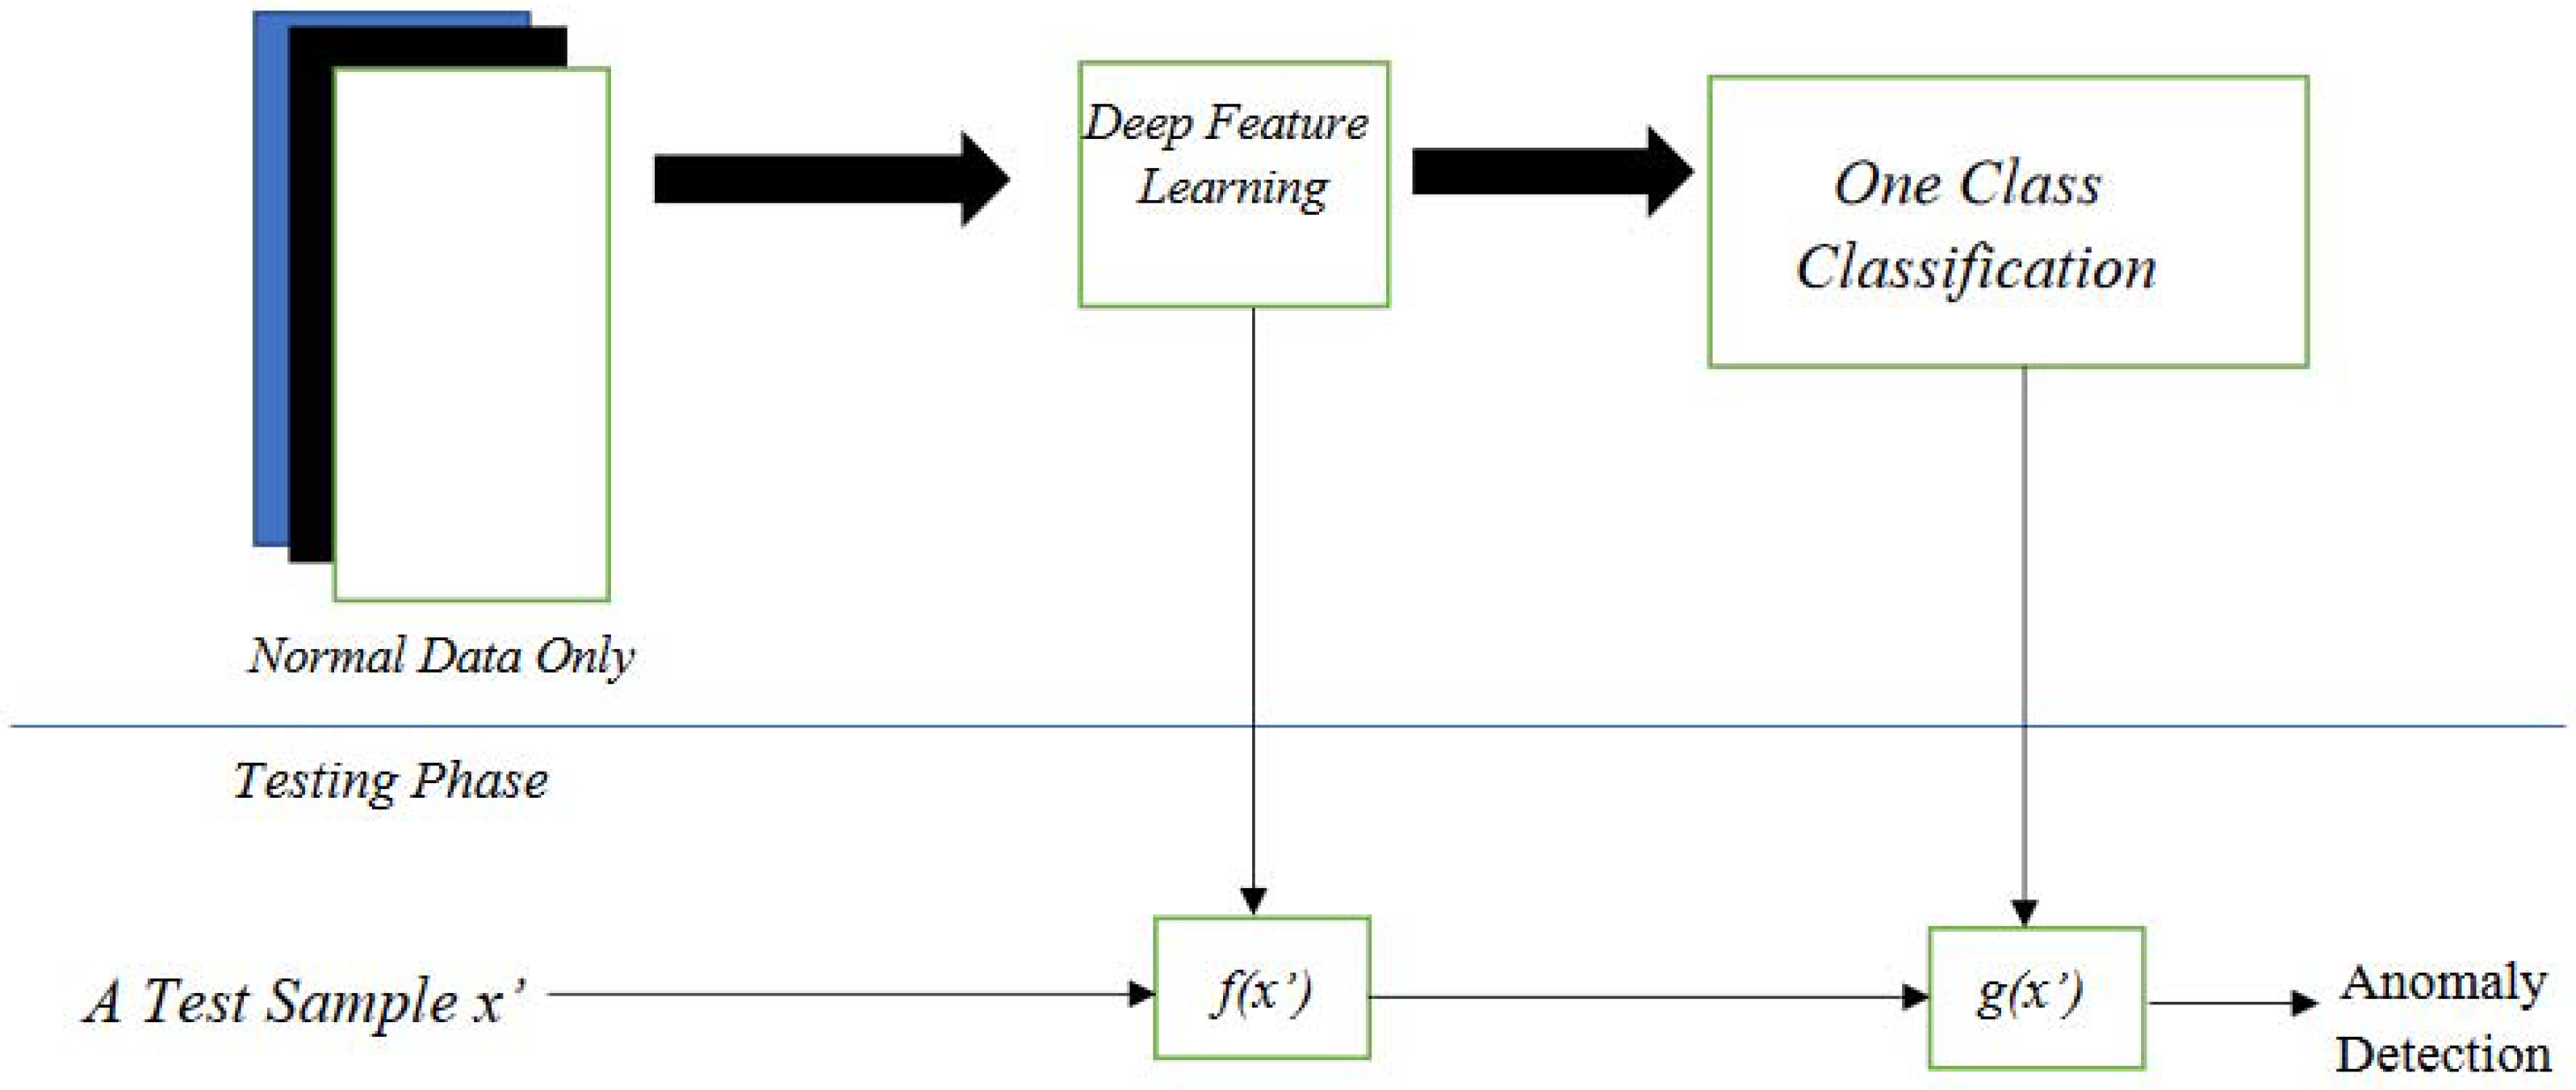
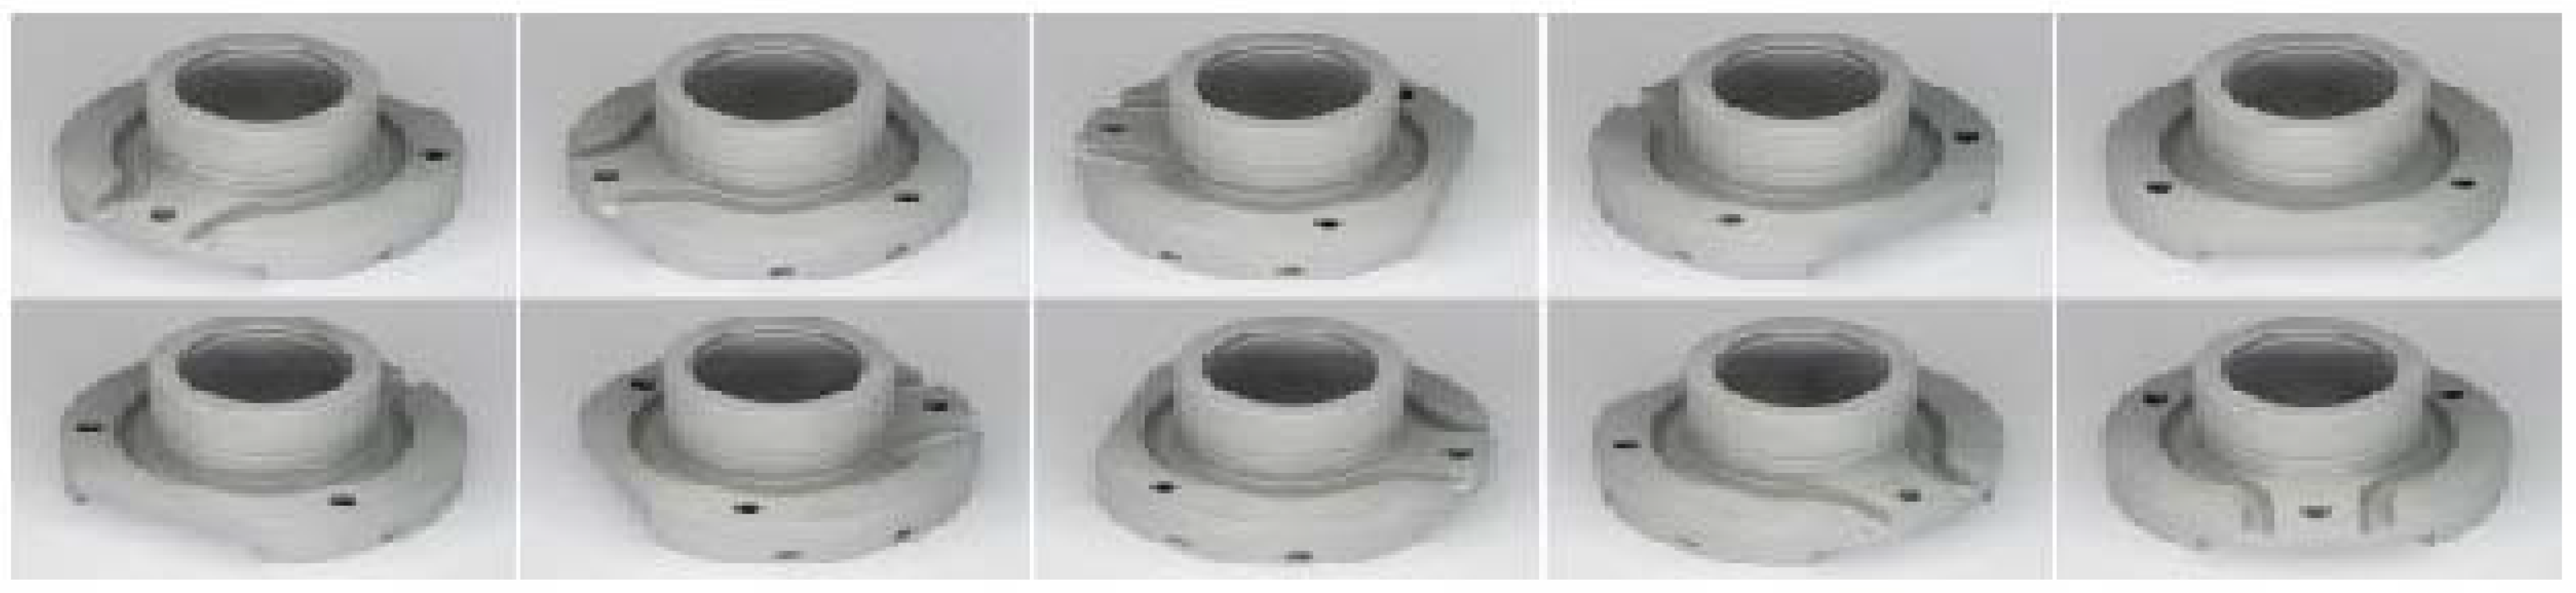
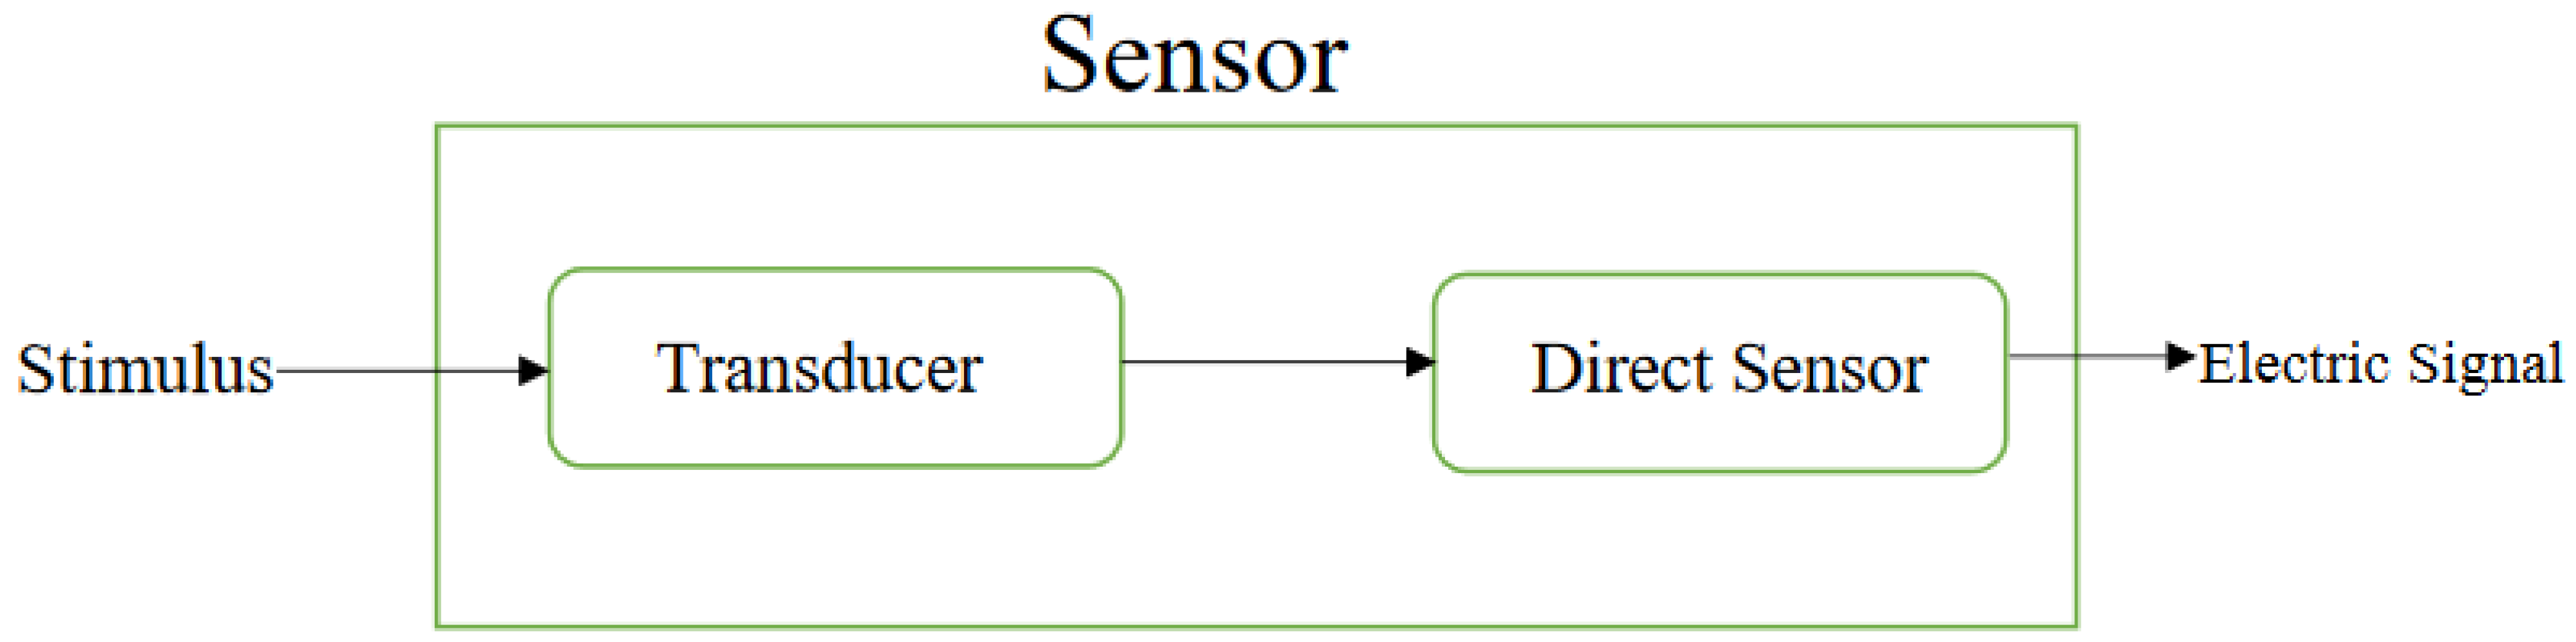
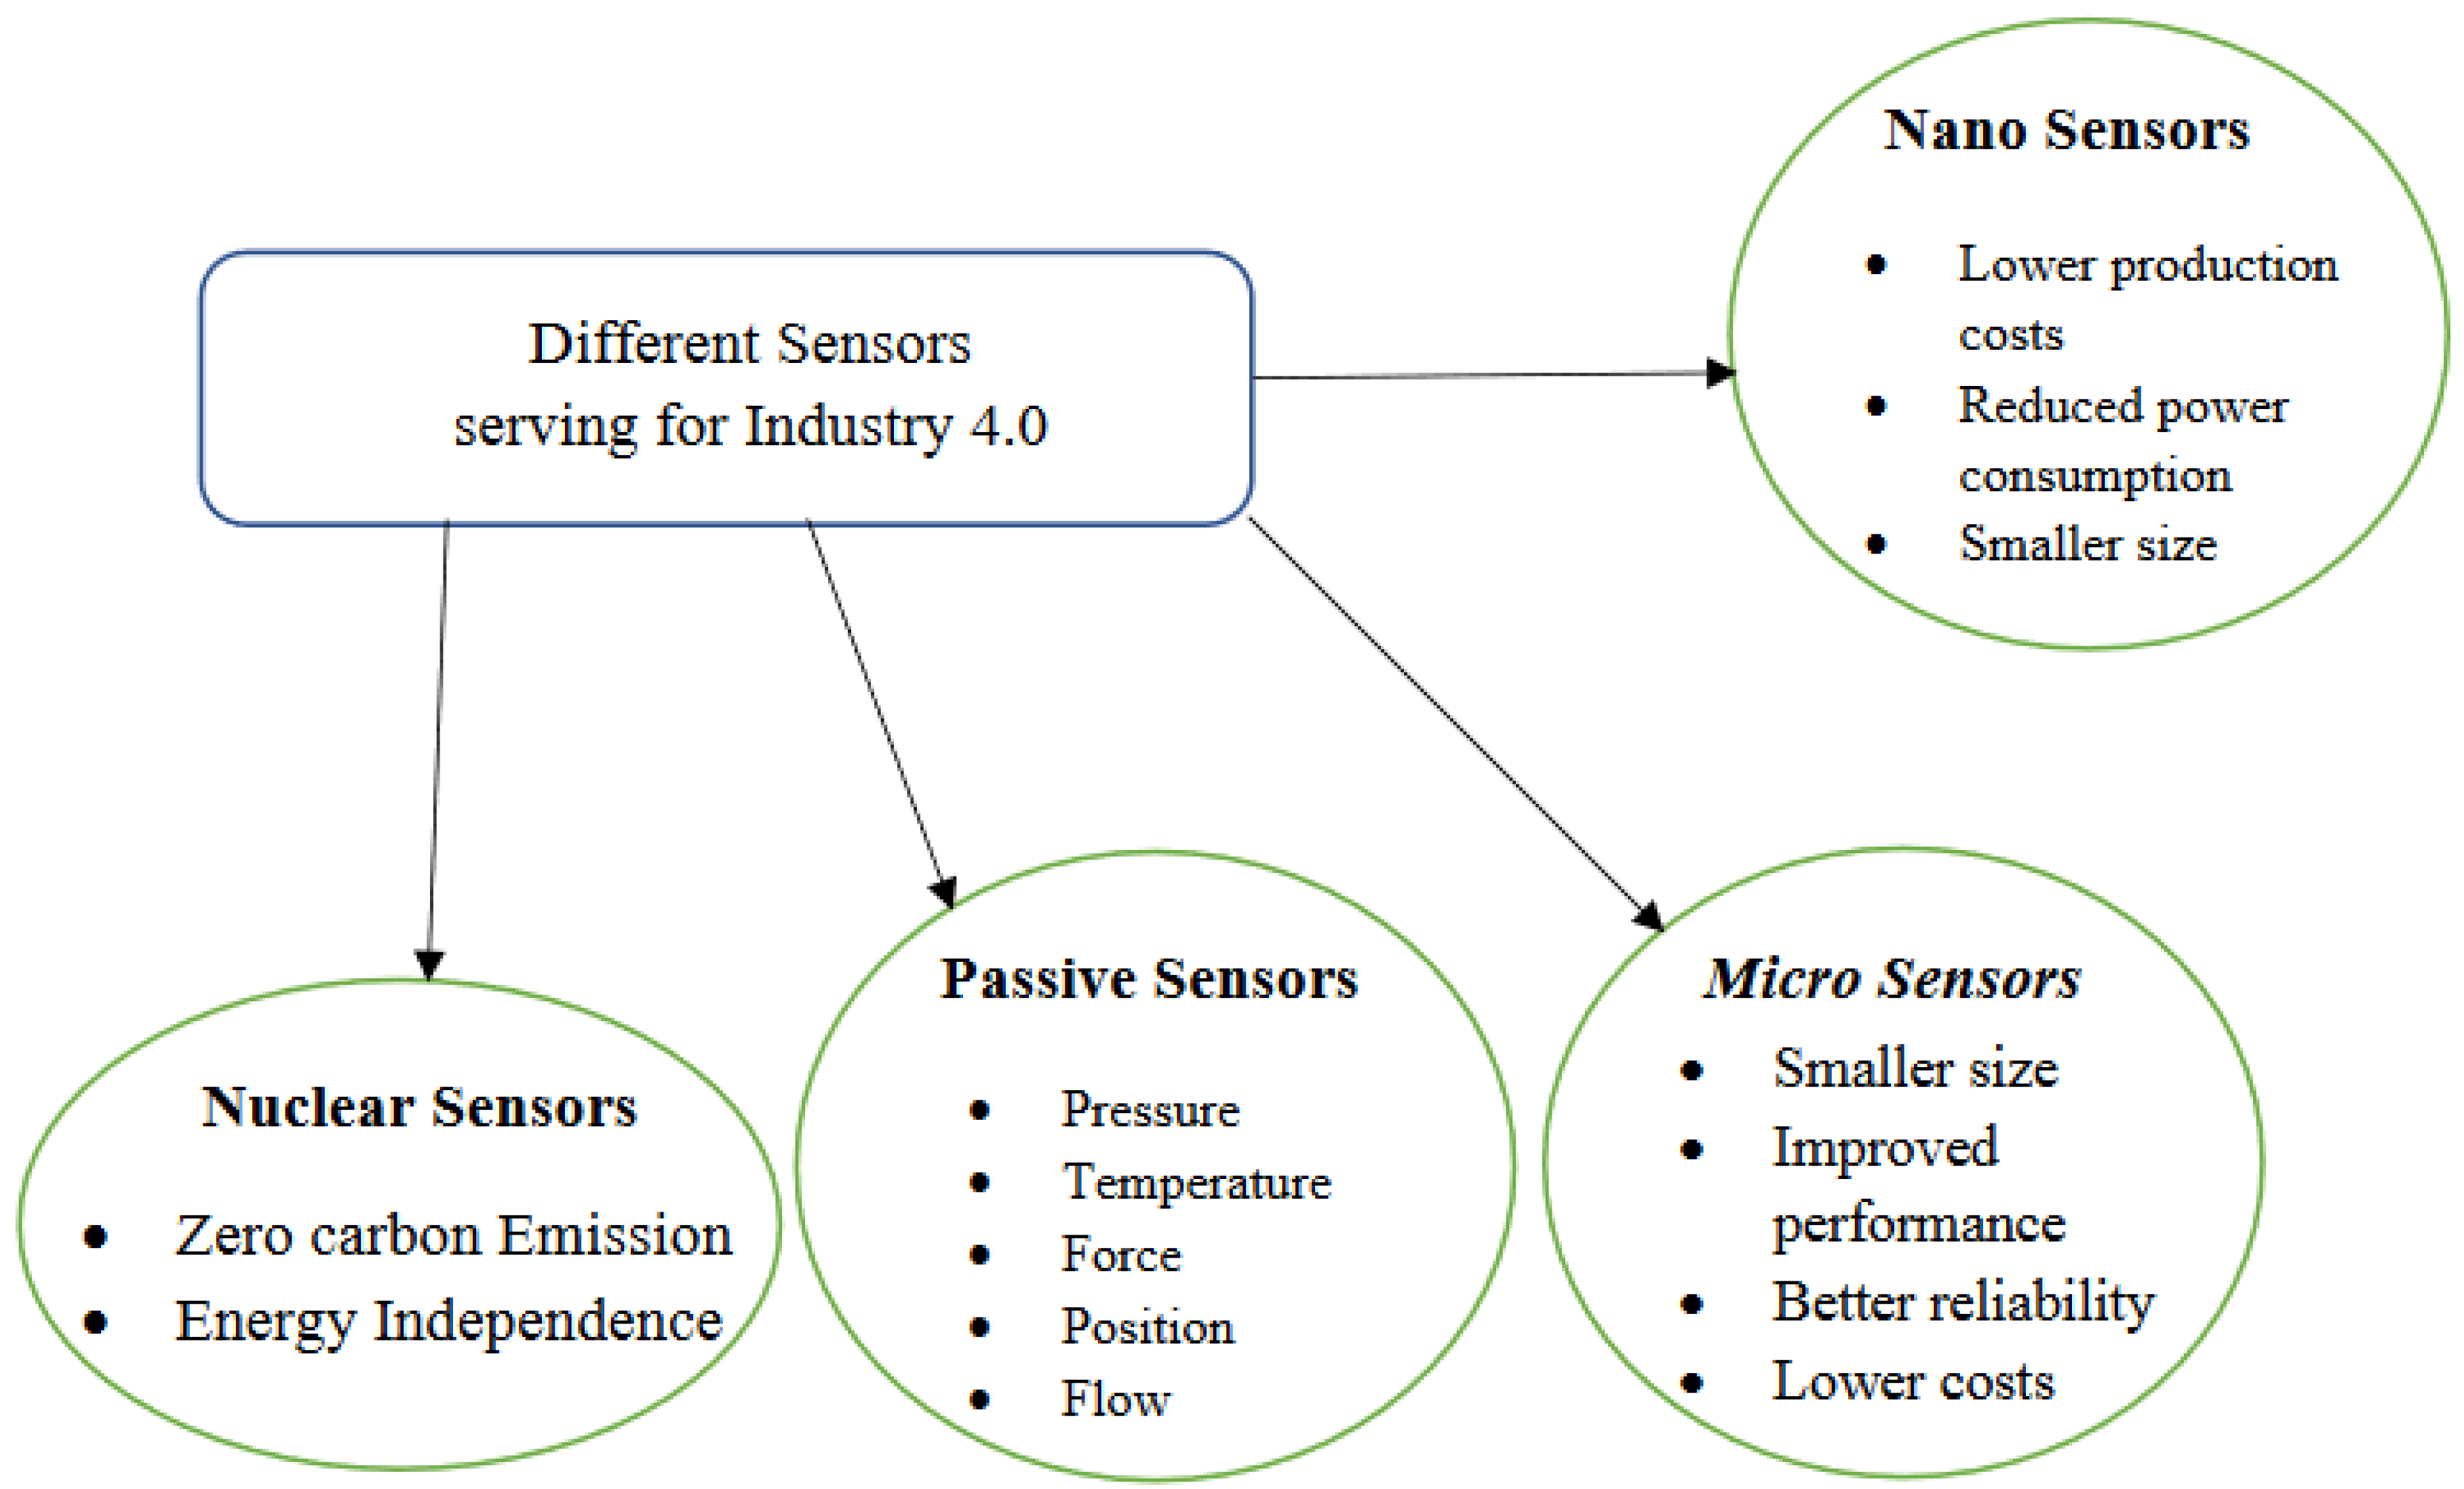
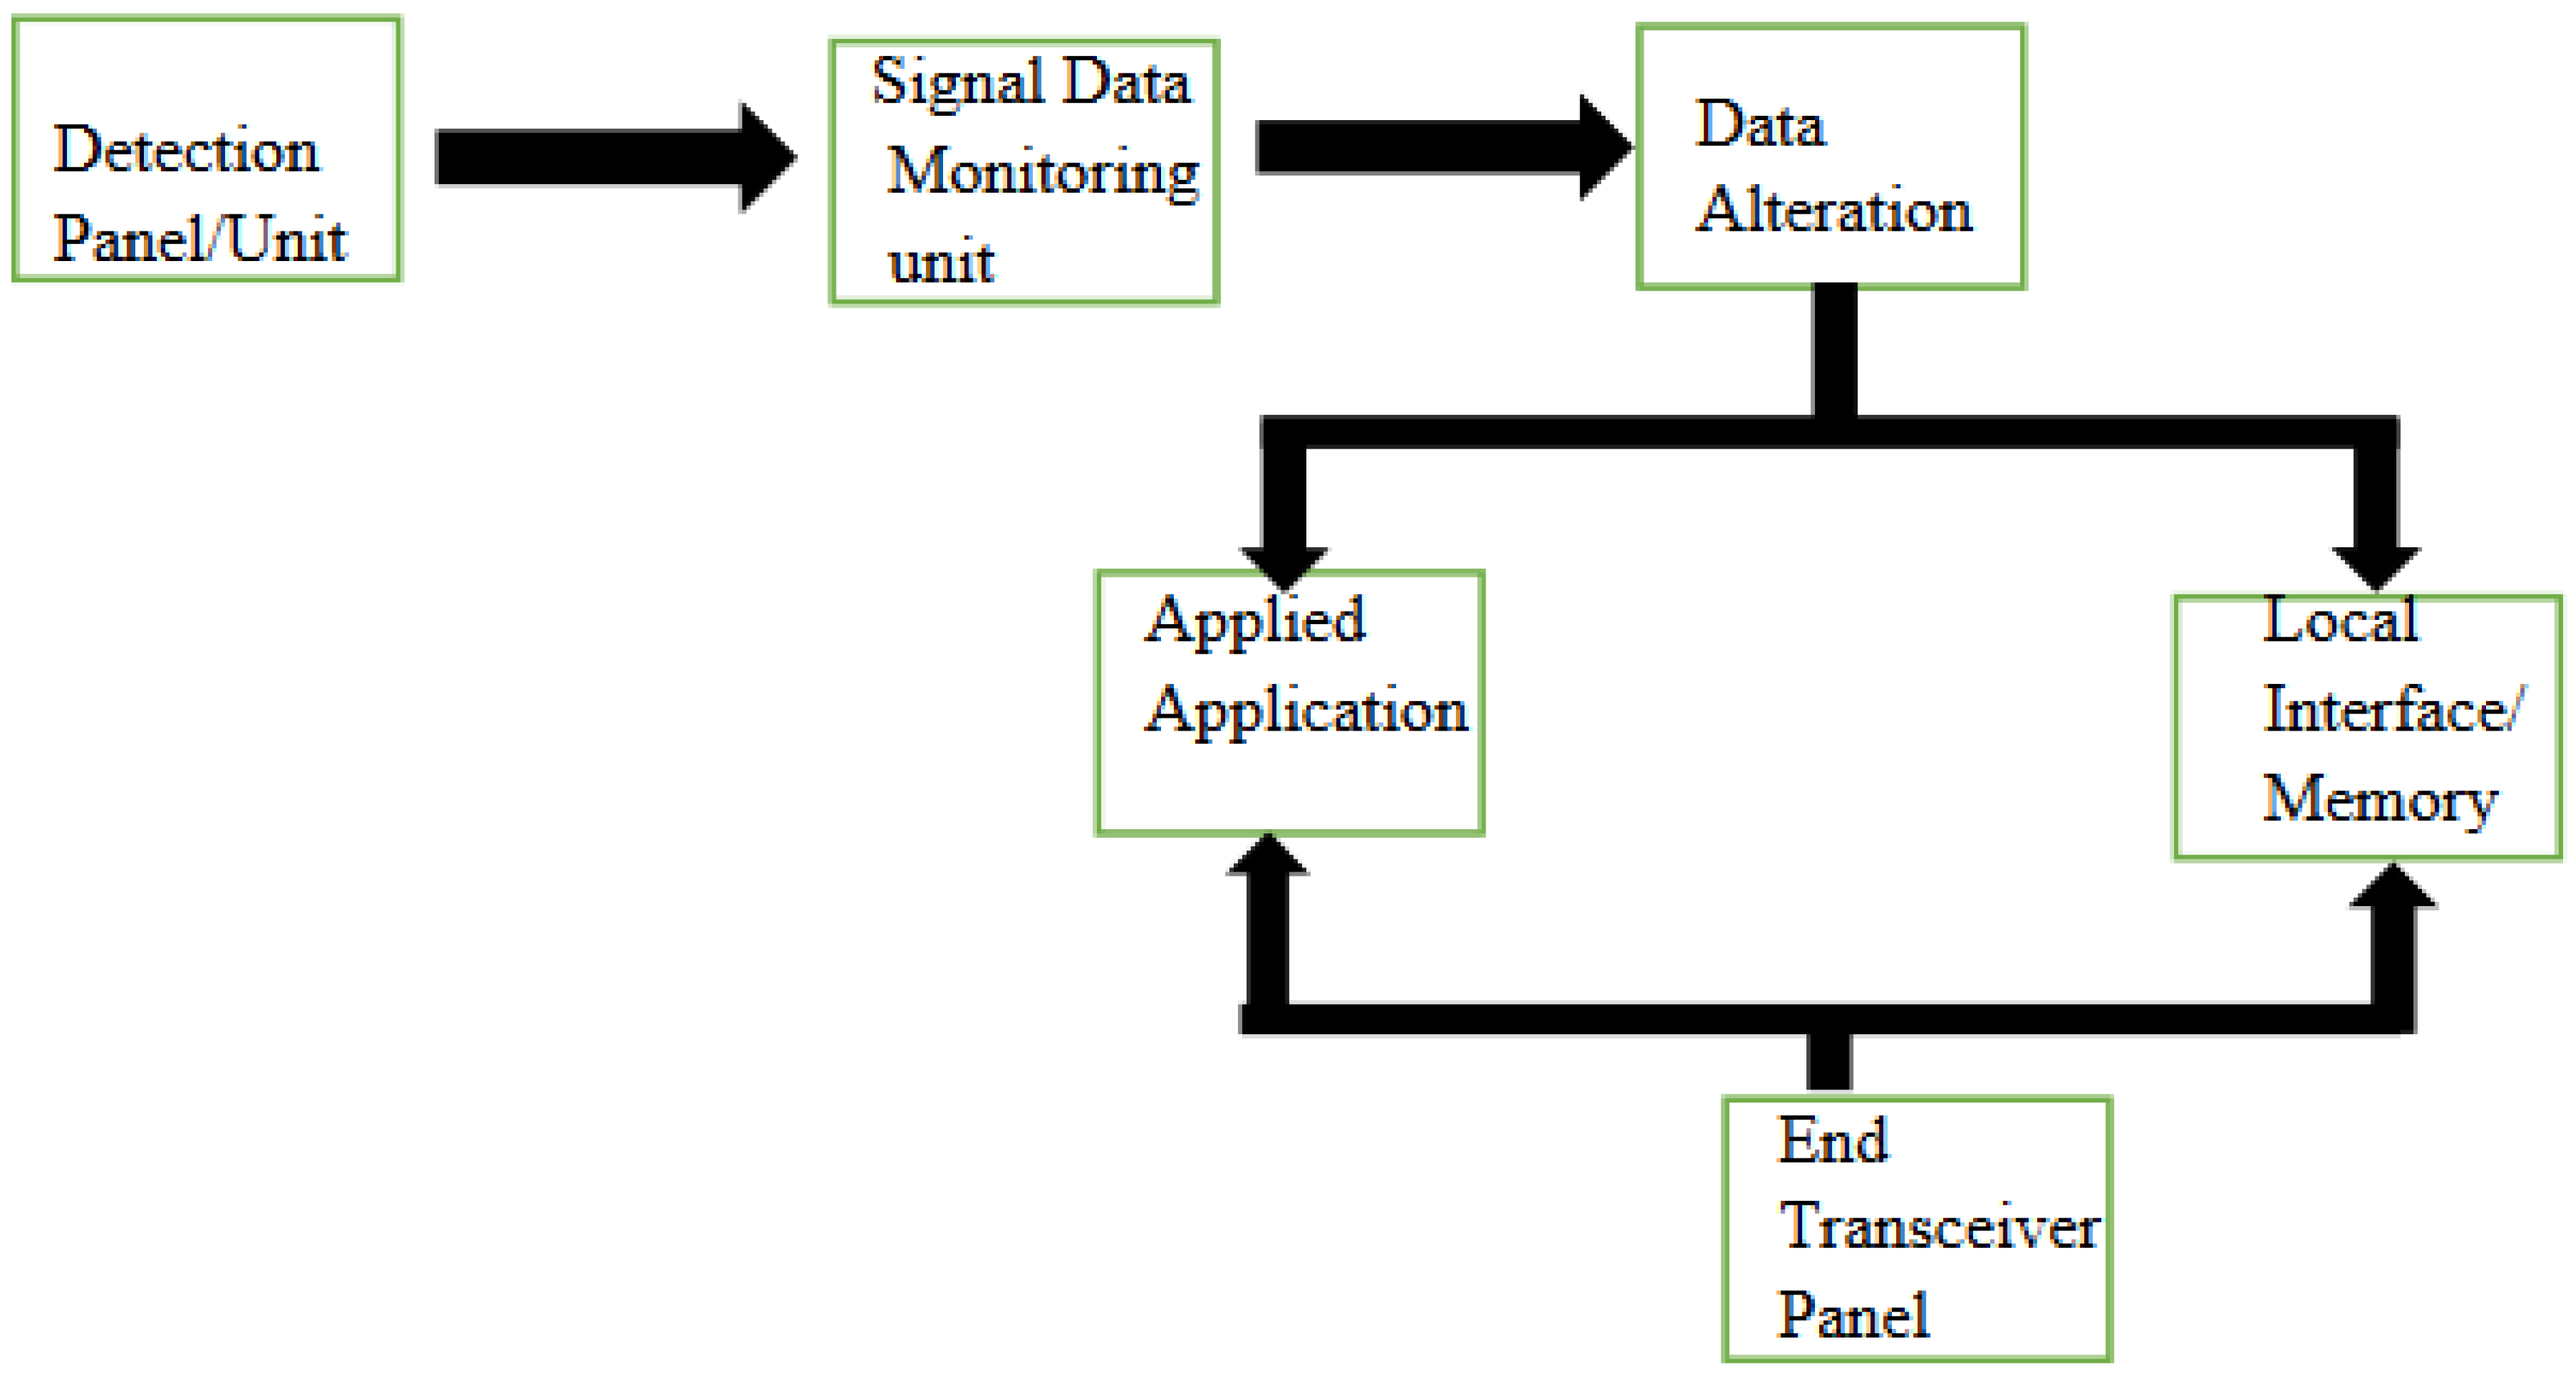
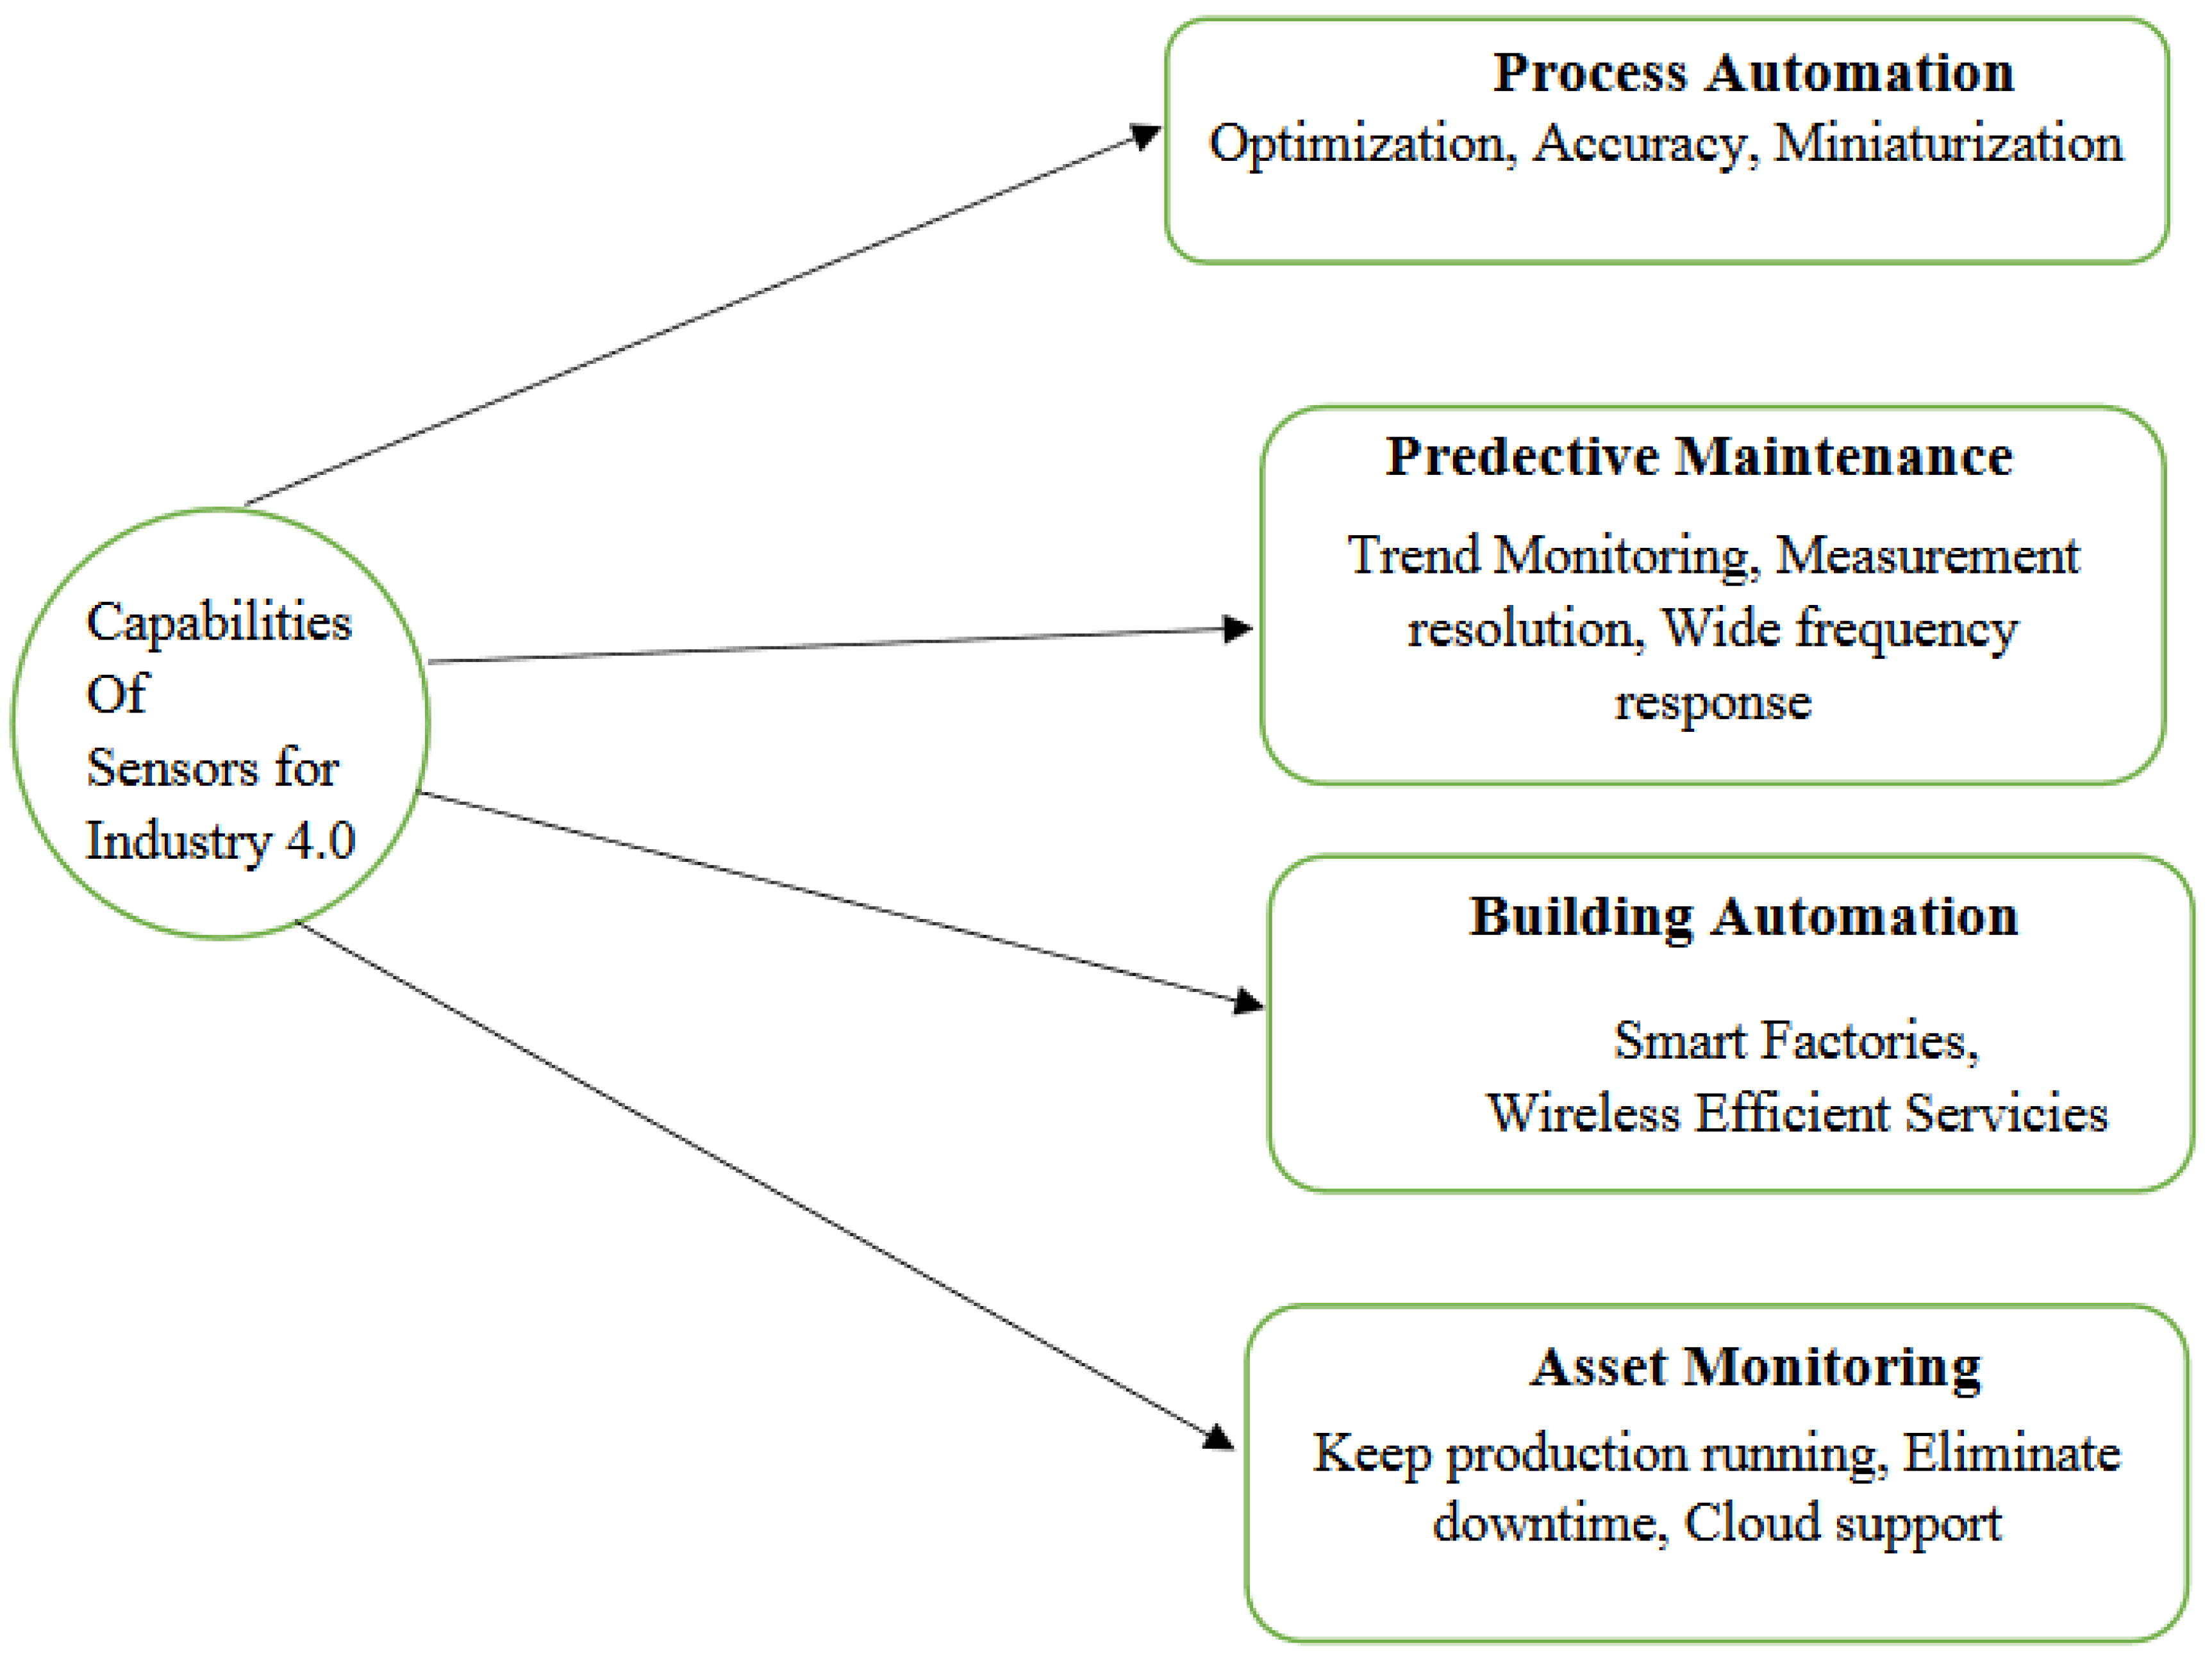
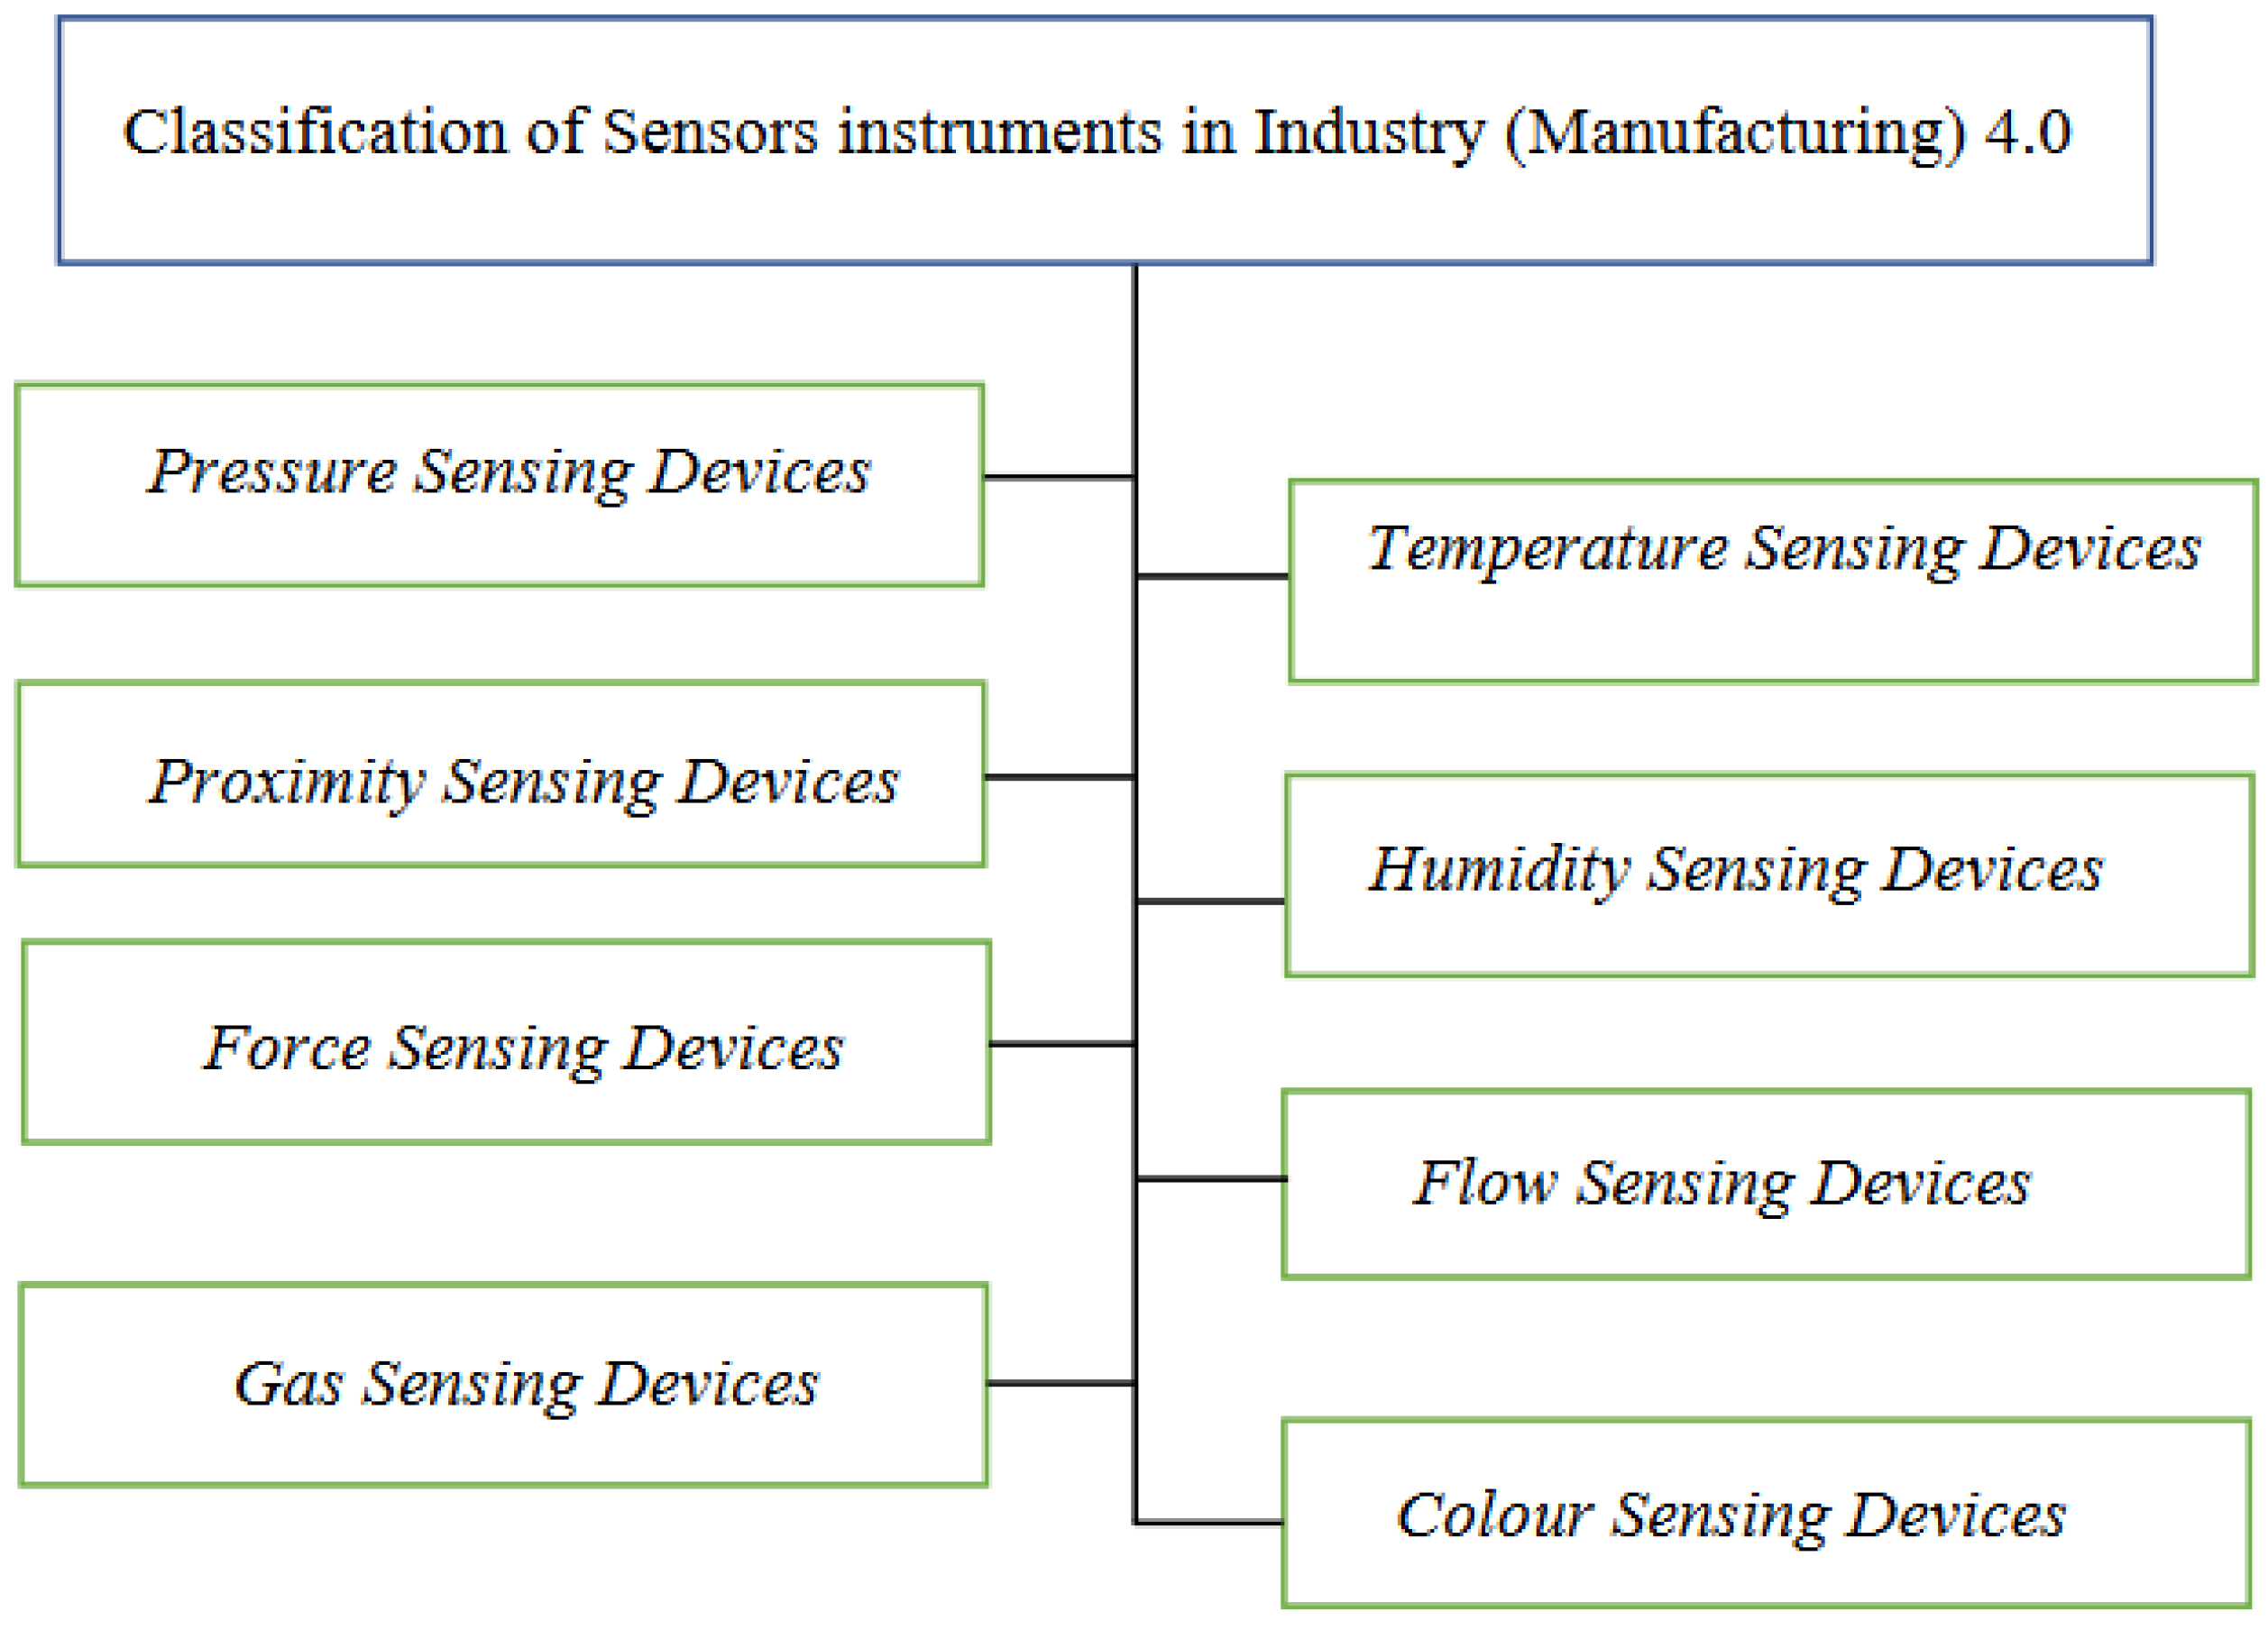
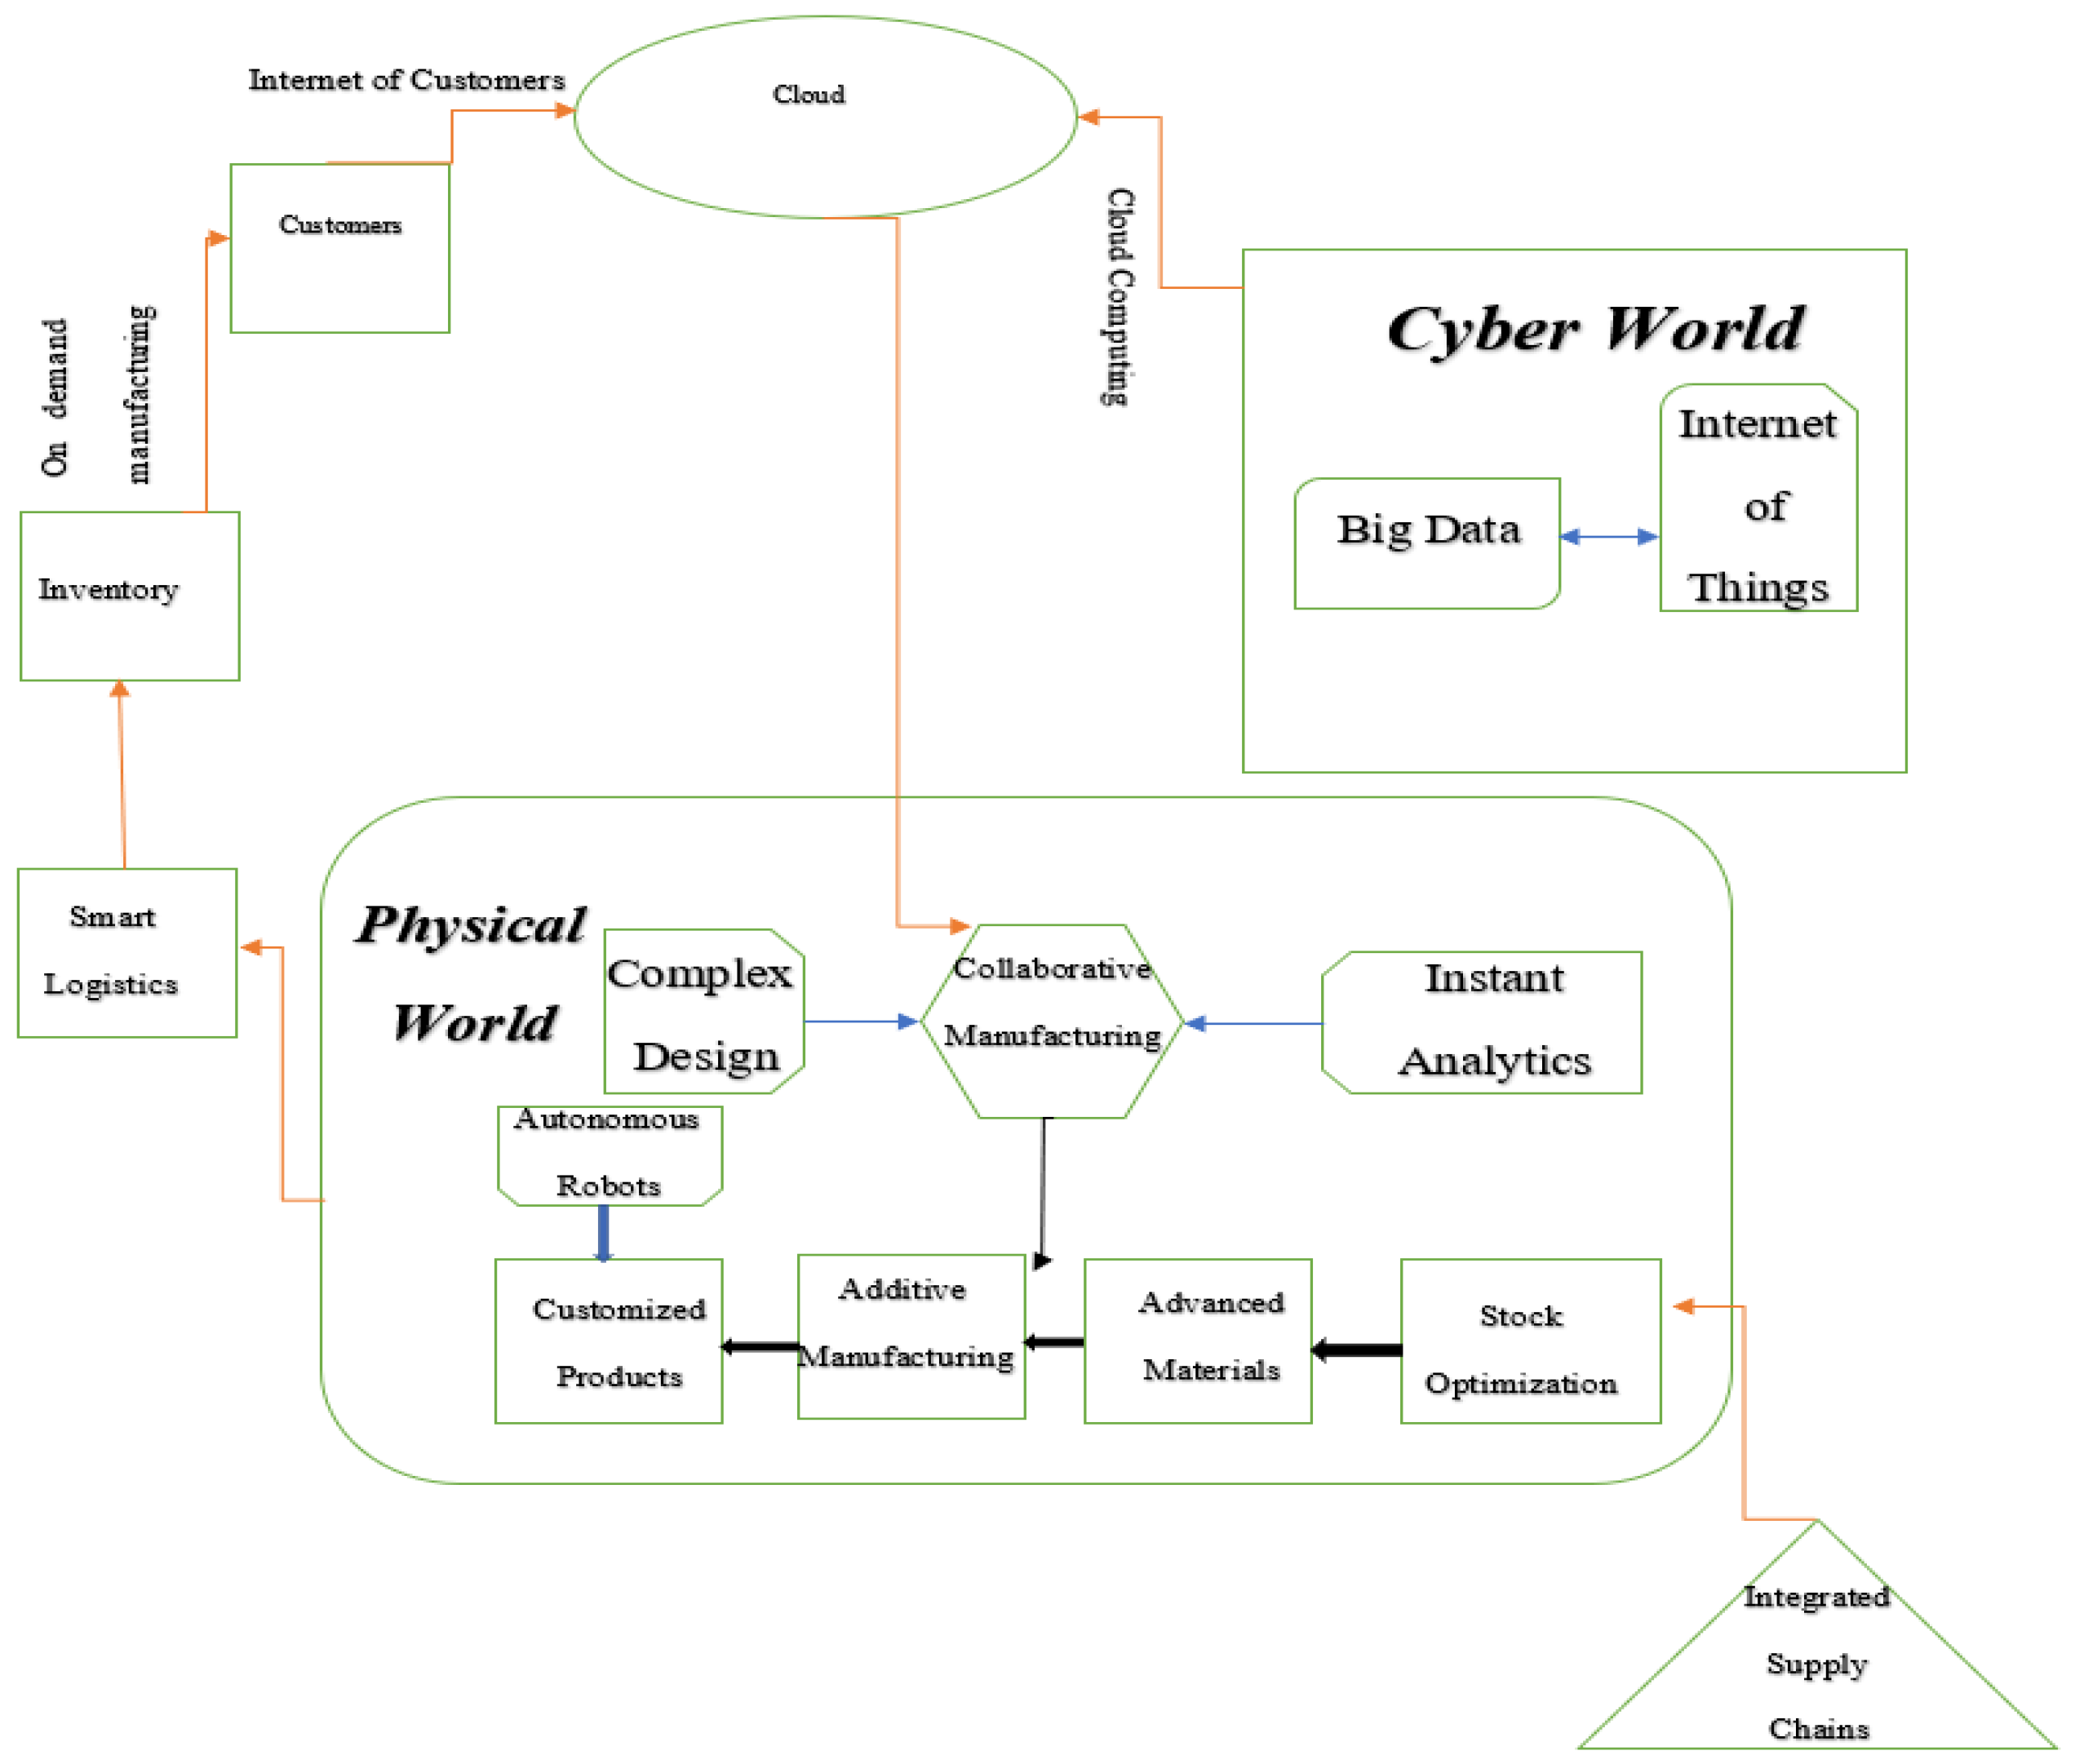
Table 1.
Various algorithms are used in production processes regarding machine learning.
| Authors | Key Contributions | Algorithms |
|---|---|---|
| Van Stein et al. [21] | Anomaly detection in car manufacturing was done | Global Local Outlier in Sub-Space (GLOSS) |
| David Muhr et al. [22] | Predict the anomaly detection has been used to predict defective engines. | Isolation Forest (I-Forest), Partitioning Local Outlier Factor (PLOF), One-Class SVM (OCSVM), Local Outlier Factor (LOF) |
| Thanatarn Pattarakavin et al. [23] | An inconsistency in the log data files from the hard disc manufacturing conditions was determined. | Decision Tree, K-Nearest Neighbour (k-NN), Naïve Bayes, Support Vector Machine (SVM) |
| Dorian Moldovan et al. [24] | Machine learning based on sensor control in the manufacturing process was detected | Gradient Boosted Trees (GBT), Random Forest (RF), Logistic Regression (LR) |
| Weizhong Yan et al. [25] | Reducing operation and maintenance costs of gas turbine engines using anomaly detection was done | One-class ELM (OCELM), Isolation Forest (IForest), One-class SVM (OCSVM), Non-kernel based One-class ELM |
| Lehr et al. [26] | Anomaly detection on the core failures of Die-Casting was detected | Local Outlier Factor (LOF), One-class SVM (OCSVM) |
| Kun Liu et al. [27] | Defects on Steel surface were detected | One-class SVM, Generative Adversarial Networks (GANs) |
| Benjamin Staar et al. [28] | Abnormalities on ImageNet data for surface inspection were detected | Convolutional Neural Network (CNN) |
| Tamas Czimmermann er al [29] | Visual defect detection for Industrial applications was detected | Support Vector Machine (SVM), k-Nearest Neighbour (k-NN) |
| Benjamin Staar et al. [30] | CNN-based surface inspection in industrial applications was done | Convolutional Neural Network (CNN) |
| Osama Abdelrahman et al. [12] | Anomaly detection and root cause analysis on assembly line manufacturing was done | Histogram-based Outlier Score (HBOS), One-class SVM (OCSVM), Isolation Forest (IForest), k-Nearest Neighbour (k-NN), Clustering-Based Approaches for Outlier Detection (CBLOF), Local Outlier Factor (LOF), Angle-based Outlier detection (ABOD) |
Table 2.
Comparing various selection techniques used for feature extraction.
| Feature Selection Algorithm | Number of Features Selected | Understandings |
|---|---|---|
| Bourta algorithm | 22 | Uses Random Forest (RF) as default |
| MARS | 10 | Used for Regression Analysis |
| PCA | 111 | Utilizes the use of orthogonal linear transformation |
Publisher’s Note: MDPI stays neutral with regard to jurisdictional claims in published maps and institutional affiliations. |
© 2022 by the authors. Licensee MDPI, Basel, Switzerland. This article is an open access article distributed under the terms and conditions of the Creative Commons Attribution (CC BY) license (https://creativecommons.org/licenses/by/4.0/).
Share and Cite
MDPI and ACS Style
Md, A.Q.; Jha, K.; Haneef, S.; Sivaraman, A.K.; Tee, K.F. A Review on Data-Driven Quality Prediction in the Production Process with Machine Learning for Industry 4.0. Processes 2022, 10, 1966. https://doi.org/10.3390/pr10101966
AMA Style
Md AQ, Jha K, Haneef S, Sivaraman AK, Tee KF. A Review on Data-Driven Quality Prediction in the Production Process with Machine Learning for Industry 4.0. Processes. 2022; 10(10):1966. https://doi.org/10.3390/pr10101966
Chicago/Turabian StyleMd, Abdul Quadir, Keshav Jha, Sabireen Haneef, Arun Kumar Sivaraman, and Kong Fah Tee. 2022. "A Review on Data-Driven Quality Prediction in the Production Process with Machine Learning for Industry 4.0" Processes 10, no. 10: 1966. https://doi.org/10.3390/pr10101966
Note that from the first issue of 2016, this journal uses article numbers instead of page numbers. See further details here.