
Identification of Four Chicken Breeds by Hyperspectral Imaging Combined with Chemometrics

1
School of Food and Drug, Qingyuan Polytechnic, Qingyuan 511510, China
2
College of Engineering, South China Agricultural University, Guangzhou 510642, China
3
College of Food Science, South China Agricultural University, Guangzhou 510642, China
*
Author to whom correspondence should be addressed.
Processes 2022, 10(8), 1484; https://doi.org/10.3390/pr10081484
Submission received: 18 March 2022
/
Revised: 10 April 2022
/
Accepted: 11 April 2022
/
Published: 28 July 2022
(This article belongs to the Special Issue Applications of Molecular Spectroscopy in Agri-Food Science and Manufacturing Processes)
Abstract
:The current study aims to explore the potential of the combination of hyperspectral imaging and chemometrics in the rapid identification of four chicken breeds. The hyperspectral data of four chicken breeds were collected in the range of 400–900 nm. Five pretreatment methods were used to pretreat the original spectra. The important characteristic wavelength variables were extracted by random frog (RF), successive projection algorithm (SPA), and competitive adaptive reweighted sampling (CARS) algorithms. The classification models were established by using support vector machine (SVM), k-nearest neighbor (KNN), and partial least squares-discriminant analysis (PLS-DA). The results showed that the mean normalization pretreatment method was preferable, and overall classification accuracy of SVM-based models was higher than that of KNN-based and PLS-DA-based models. The correct classification rate (CCR) of the full-spectrum SVM model (Full-SVM) could reach 96.25%. The SPA method extracted 13 important wavelengths, and the SVM model based on SPA (SPA-SVM) achieved 90% CCR. This study can provide a theoretical reference for the discriminant analysis of chicken breeds.
1. Introduction
With the improvement of living standards and the changes in dietary structure, the consumption of livestock and poultry fresh meat, especially chicken, is increasing rapidly, and consumers’ requirements for meat quality are also increasing [1]. Various chicken breeds have different levels of price and quality. Identifying the geographic origin of chicken is not only conducive to protecting the interests of consumers, but also conducive to protecting regional brands and preventing counterfeiting [2]. For instance, Qingyuan chicken (Guangdong) is one of the high-quality chicken breeds in China. It has been listed in the national catalogue of livestock and poultry genetic resources protection and has become a product of national geographical indication protection [3]. Other domestic chicken breeds, such as Tuxiang chicken (Guangxi), Black bone chicken (Jiangxi), and Butter chicken (Beijing), are also deeply loved by local residents because of their unique flavor. In addition, chicken is rich in selenium, vitamin E, amino acids, unsaturated fatty acids, and phospholipids, which contribute to human health [4]. Thus, it is a meaningful goal to identify Qingyuan chicken and other chicken breeds.
The traditional meat quality detection methods include chemical analysis, instrumental analysis, and sensory analysis. Chemical analysis methods include molecular technology [5], protein detection [6], metabolic technology [7], and DNA method [8]. Although the above methods have achieved good results, these methods have some disadvantages, such as cumbersome operation, time-consuming, high cost, and damaged samples. Meanwhile, the local market supervision department also urgently needs a fast method to prevent high-quality chicken from being counterfeited by other chicken breeds with low recognition and low quality.
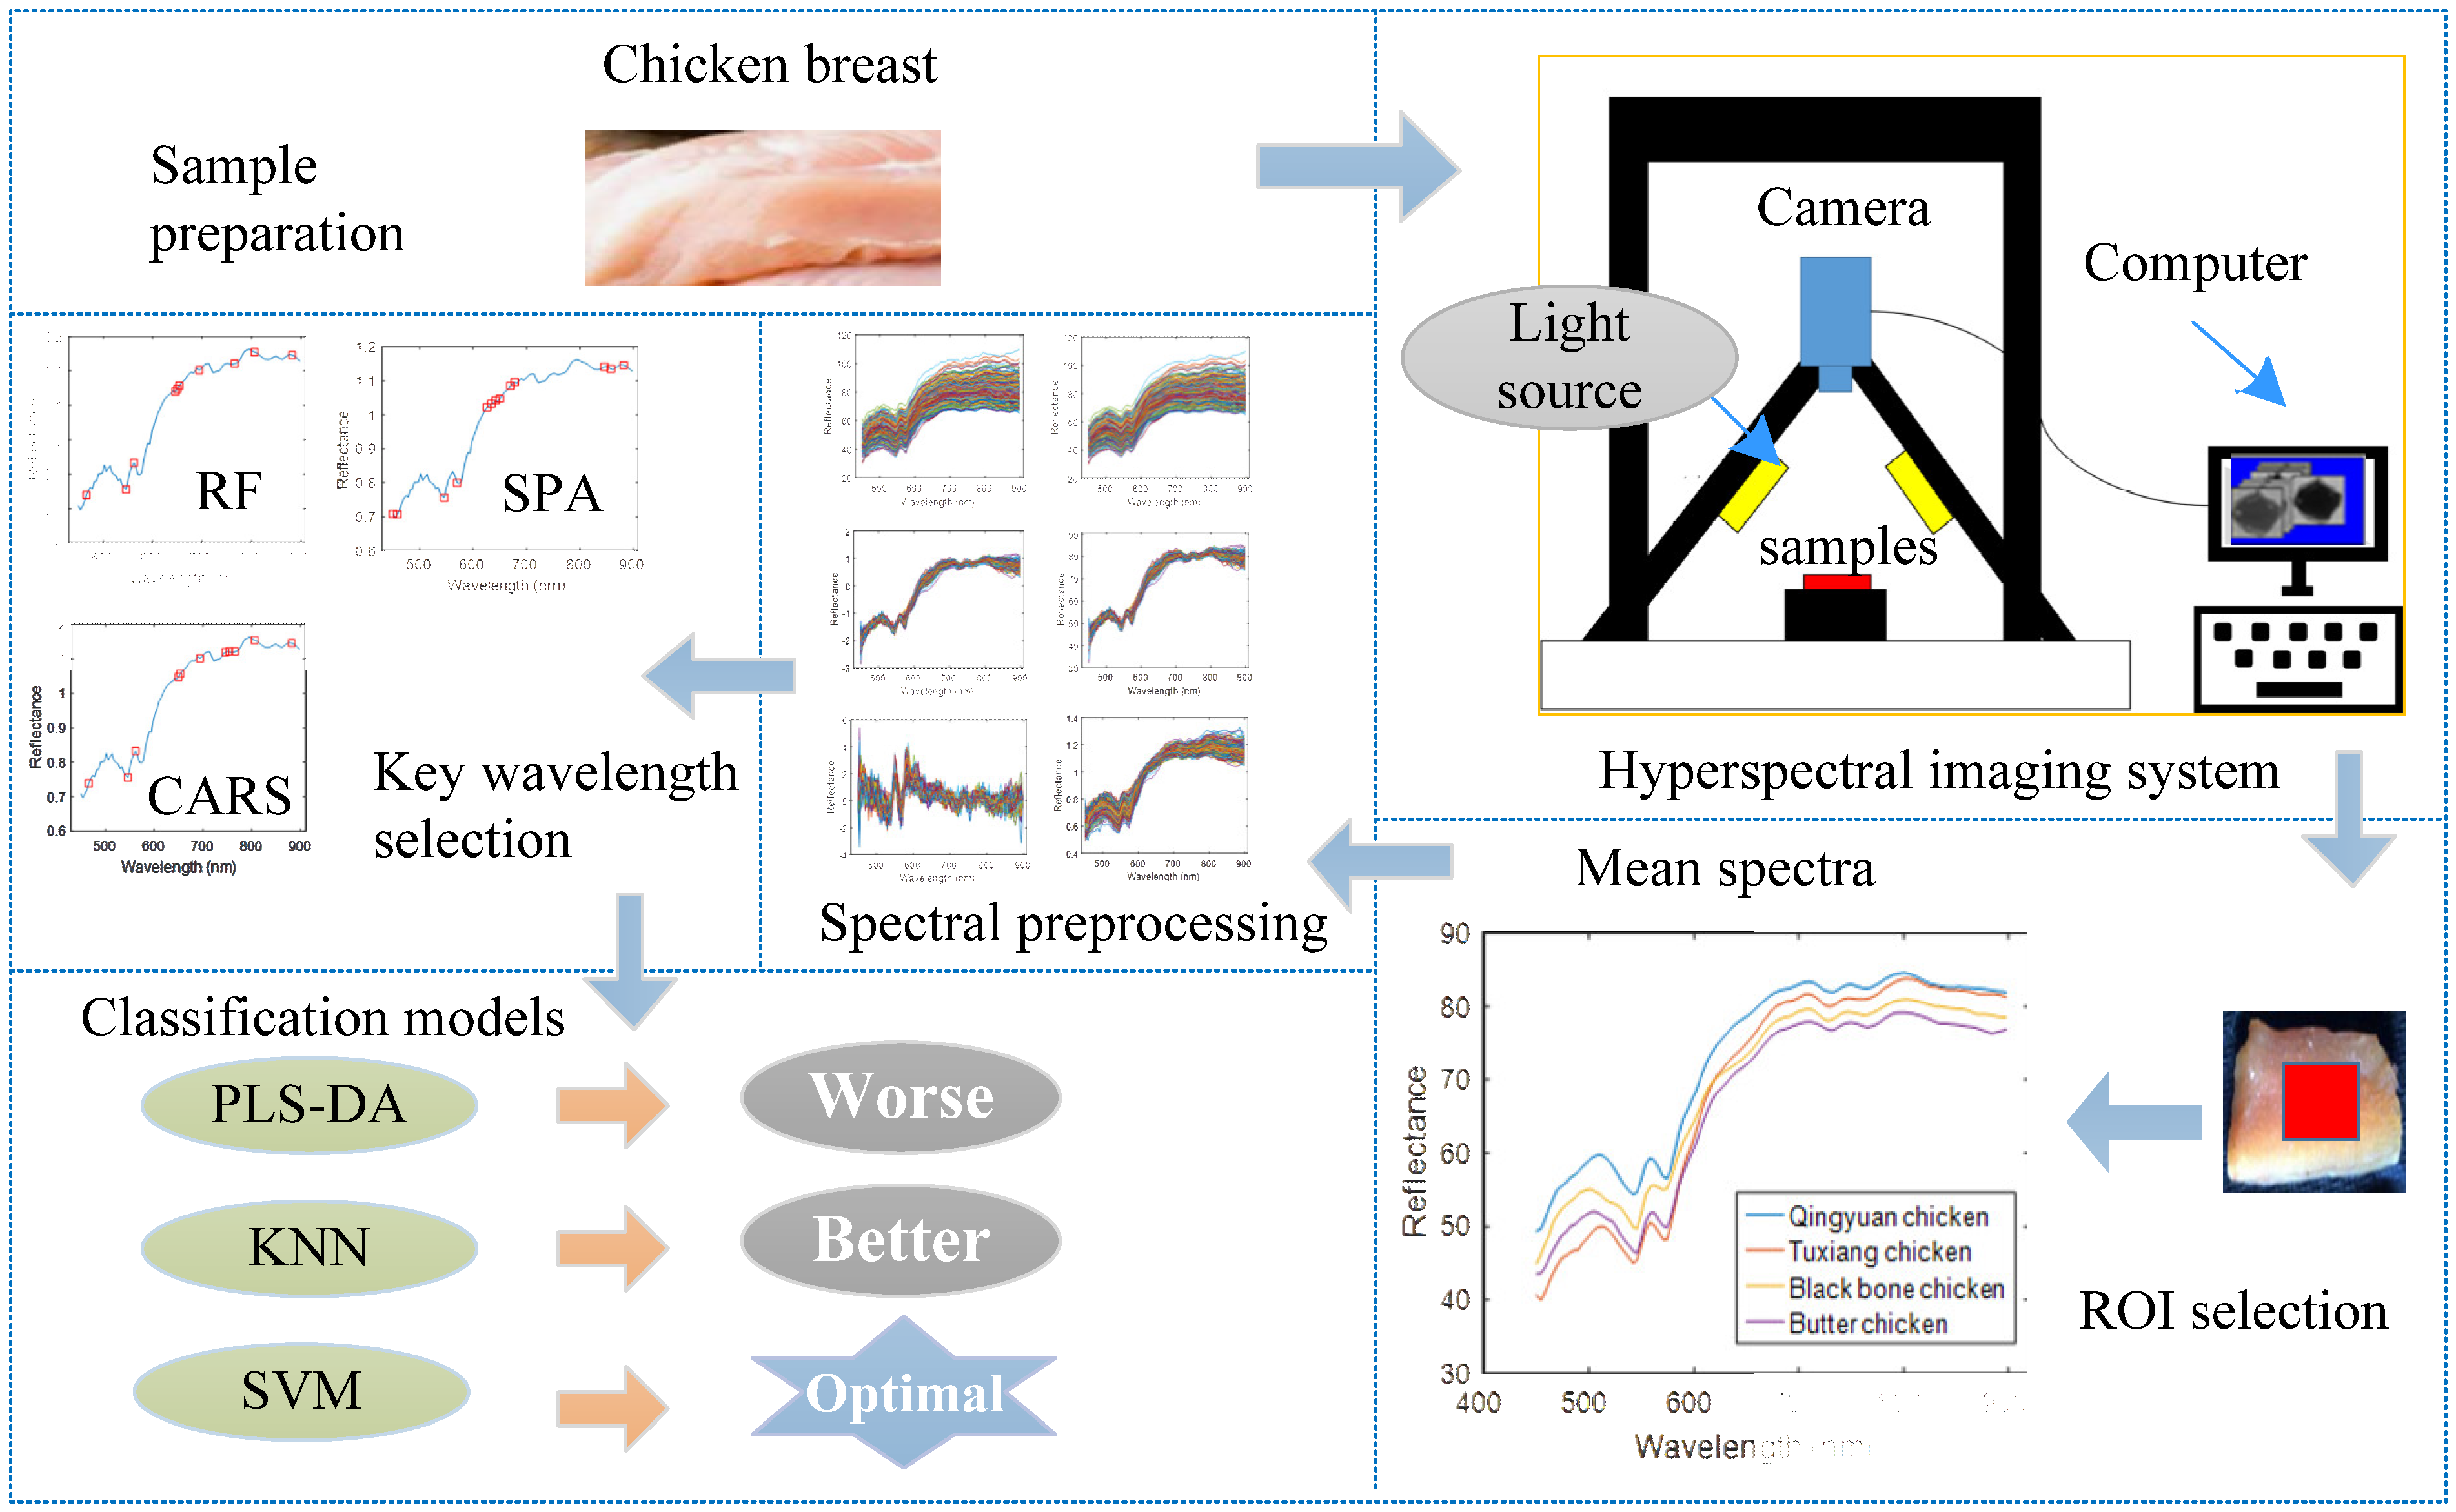
Hyperspectral imaging (HSI) technology, as a fast and efficient emerging technology, is in a leading position in the field of meat quality detection. This technology combines imaging with spectral information and has more comprehensive information than other spectral technologies [9]. In recent years, HSI technology has been applied to the freshness and adulteration detection of various meat categories, such as beef [10], pork [11], duck [12], and fish [13]. In addition, HSI has been used to predict the freshness attributes and textural properties of chicken breast meat, such as total viable count [14], TBARS [15], tenderness [16], and moisture contents [17]. To our knowledge, it is considered to have the ability to replace the traditional detection methods. However, few papers have been published on the identification of chicken breeds using HSI technology. The main steps of this study are described in Figure 1, and the aims of this work were to (a) explore a rapid classification method of four chicken breeds by using visible near-infrared HSI (in the range of 450–900 nm); (b) analyze the influences of different pretreatment methods and extract optimal variables based on three characteristic wavelength-selection methods; (c) build SVM-based, KNN-based, and PLS-based models to achieve good classification results.
2. Materials and Methods
2.1. Sample Preparation
Four representative local chicken breeds were selected, including Qingyuan chicken (Guangdong), Tuxiang chicken (Guangxi), Black bone chicken (Jiangxi), and Butter chicken (Beijing). The chicken samples were provided by Wens Foodstuff Group Co., Ltd. (Yunfu, China) and Guandong Tinoo’s Food Co., Ltd. (Qingyuan, China). A total of 120 chickens (30 chickens per breed) were slaughtered, and their chicken breasts were taken out, stored in a 0~4 °C refrigerator, and quickly transported to the laboratory. In the present experiment, the chicken breasts were cut into 5 cm × 5 cm × 2 cm pieces and placed in the fresh-keeping box according to the breeds; finally, 240 chicken breast fillets (60 chicken breast fillets per breed) were collected for spectroscopic detection.
2.2. Hyperspectral Image Acquisition
The HSI system is composed of a imaging spectrometer (SOC710VP) equipped with CCD camera, two light sources (Fiber-Lite DC 950, New York, NY, USA), and data acquisition software SOC710 (Taiwan, China). The HSI system works in reflection mode, and the spectral range belongs to the visible and near-infrared regions of 400–1000 nm. In the process of obtaining spectral information, the whole system was covered with black flannelette to avoid the interference of external light sources. The steps to obtain the original image were as follows: (a) after the instrument was warmed up for 30 min, the white board was placed on the platform to collect a white reference images; (b) the light source was turned off and the lens was covered with a lens cover to obtain a dark reference image; and (c) the chicken breast samples were placed in the center of the platform one by one to obtain the original image. As a result, 60 spectral images were obtained for each chicken breed.
2.3. Selection of Region of Interest and Acquisition of Spectral Data
The selection of the region of interest (ROI) was an important step and was related to the accuracy of the classification model. The software ENVI 5.2 (ITT Visual Information Solutions, Boulder, CO, USA) was used to select ROI and export spectral data. The “Rectangular mode” was selected to draw ROI regions of different sizes in the spectral image, and then the spectral pixels in the ROI were counted as the current sample spectrum. As a result, a total of 240 spectral data were obtained, which were divided into calibration set and prediction set according to the ratio of 2:1.
2.4. Data Processing and Analysis
2.4.1. Principal Component Analysis
Principal component analysis (PCA) was performed to observe the clustering trend of unknown data. PCA is an unsupervised data analysis and dimensionality reduction method, which is mainly used for cluster analysis of spectral data [18]. This process is usually carried out before multivariate data modeling in order to visualize the clustering trend of data in a two-dimensional or three-dimensional space.
2.4.2. Spectral Pretreatment
In addition to containing useful information, the sample spectra were also disturbed by external factors (i.e., light scattering and environmental noise), which had a great impact on the later modeling [19]. The original spectral data were processed by five common preprocessing methods, including Savitzky–Golay smoothing (SG), standard normal variate (SNV), multiplicative scattering correction (MSC), first derivative (FD), and mean normalization (MN). MSC and SNV were used for the correction of scattered light and baseline variation. SG was used for smooth filtering and noise reduction. FD was used to eliminate baseline and linear trends. MN was used to amplify the spectral difference. The influence of the above pretreatment methods on the modeling was compared and analyzed.
2.4.3. Key Wavelength Selection Method
HSI data contain rich information, but the full wavelength spectrum usually has some problems, such as time-consuming modeling, noise interference, and collinearity [20]. The random frog (RF), successive projection algorithm (SPA), and competitive adaptive reweighted sampling (CARS) methods were used to extract the key characteristic wavelengths. Specifically, RF uses probability to describe the importance of each wavelength variable [21]. SPA is a forward iterative selection method, which selects the minimum collinear variable quantum set by a projection method [22]. CARS uses Monte Carlo sampling strategy to generate multiple wavelength variable subsets and then uses an exponential decay function (EDF) and adaptive weighted sampling to find the subset with the smallest cross-validation root mean square error (RMSECV) [23]. Generally, these methods have a strong ability to select key characteristic variables, but their working principles are different.
2.4.4. Modeling Algorithms
Support vector machine (SVM) is a supervised machine learning algorithm that can be used for the linear and nonlinear classification or regression problems [24]. The basic principle of SVM is to set the hyperplane by mapping the nonlinear problem in the input space to the linear problem in the high-dimensional feature space, and the samples can be separated through the hyperplane. SVM contains several common kernel functions, such as the linear kernel function, the polynomial kernel function, the radial basis function (RBF), and the sigmoid kernel function. K-nearest neighbor (KNN) is also a machine learning algorithm, which classifies by measuring the distance between different eigenvalues. The K value directly determines the accuracy of the model. Partial least squares-discriminant analysis (PLS-DA) is a popular linear multivariable modeling algorithm, which is often used to analyze data with strong collinearity, noise, and redundant variables [18]. The above algorithms were applied to modeling and comparison.
2.5. Model Evaluation
The model performance was evaluated based on the correct classification rate (CCR) of the calibration set and prediction set, and the CCR was computed by Equation (1).
where NT is the number of total samples in the calibration set or prediction set, and Nc represents the number of correctly classified samples.
3. Results and Discussion
3.1. Mean Spectra
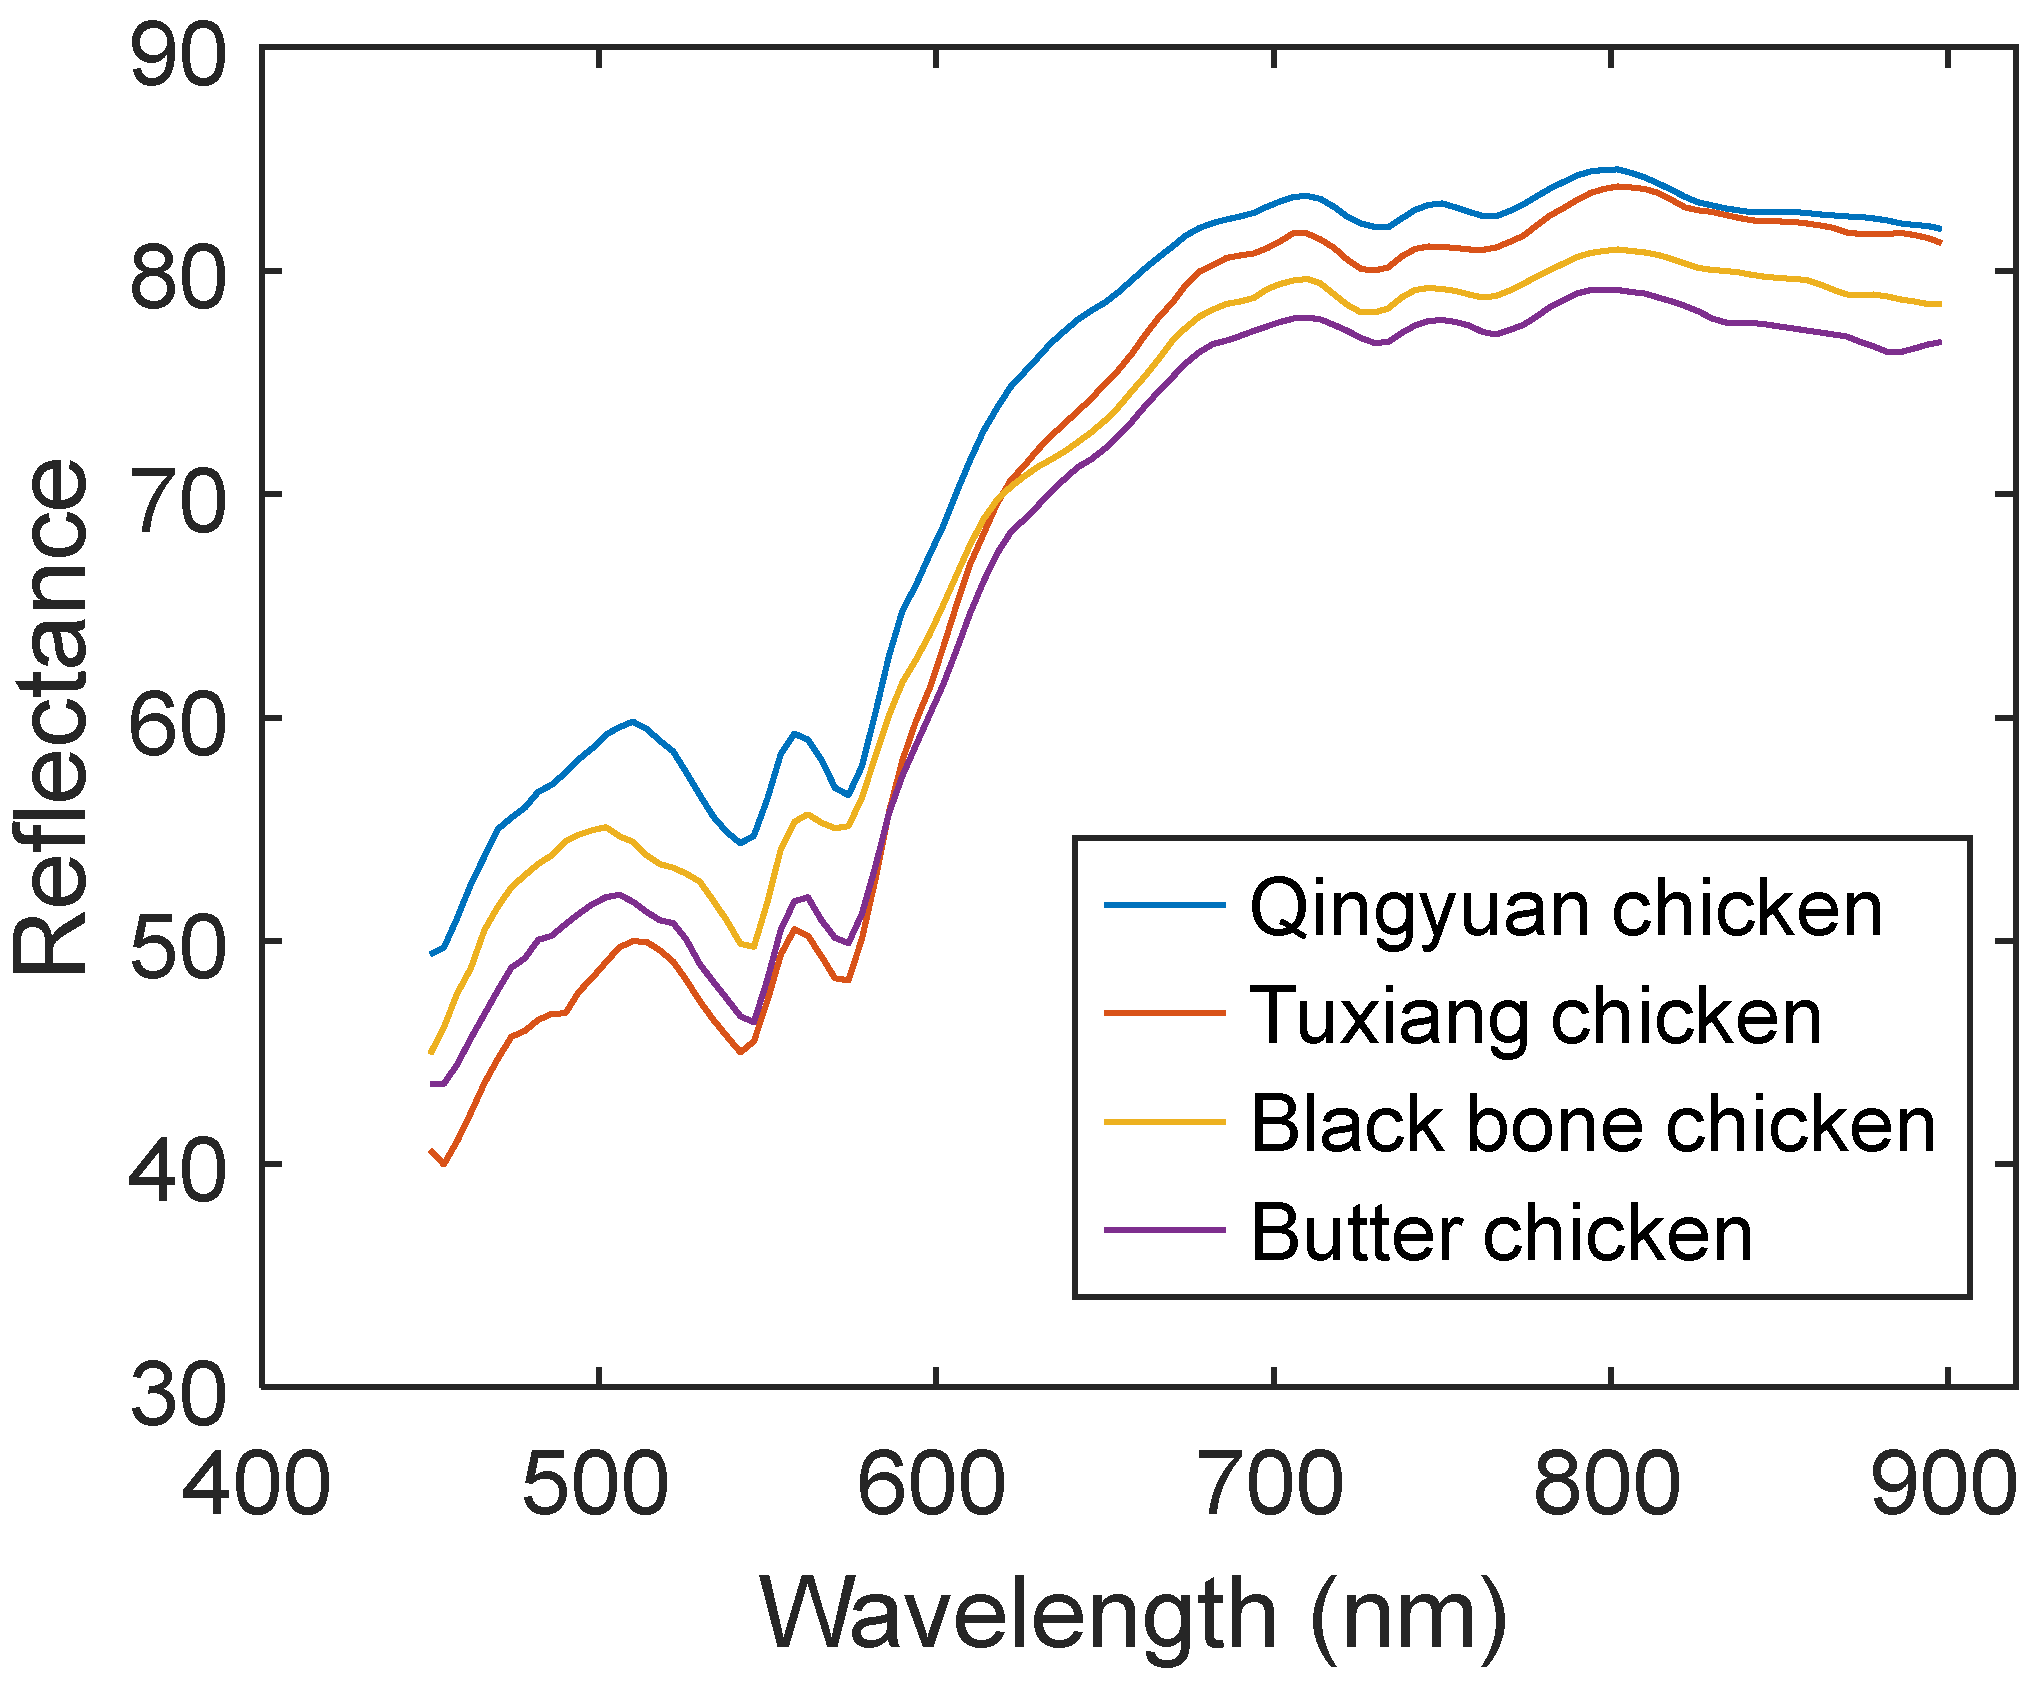
Figure 2 shows the full-wavelength original mean spectrum of the tested chicken breast sample in the range of 450–900 nm. It can be seen that the spectral curves of the four chicken breeds have similar trends, but the amplitude changes are slightly different, which may have been caused by chemical characteristics among different breeds [25]. Among them, the absorption peaks concentrated near 540 nm and 570 nm are assigned as chicken myoglobin [16]; the region at 690–760 nm is regarded as the functional group of water molecules [17]. In general, there are obvious differences among the spectral curves of the four chicken breeds, but they overlap each other in some spectral ranges.
3.2. PCA Explanatory Analysis
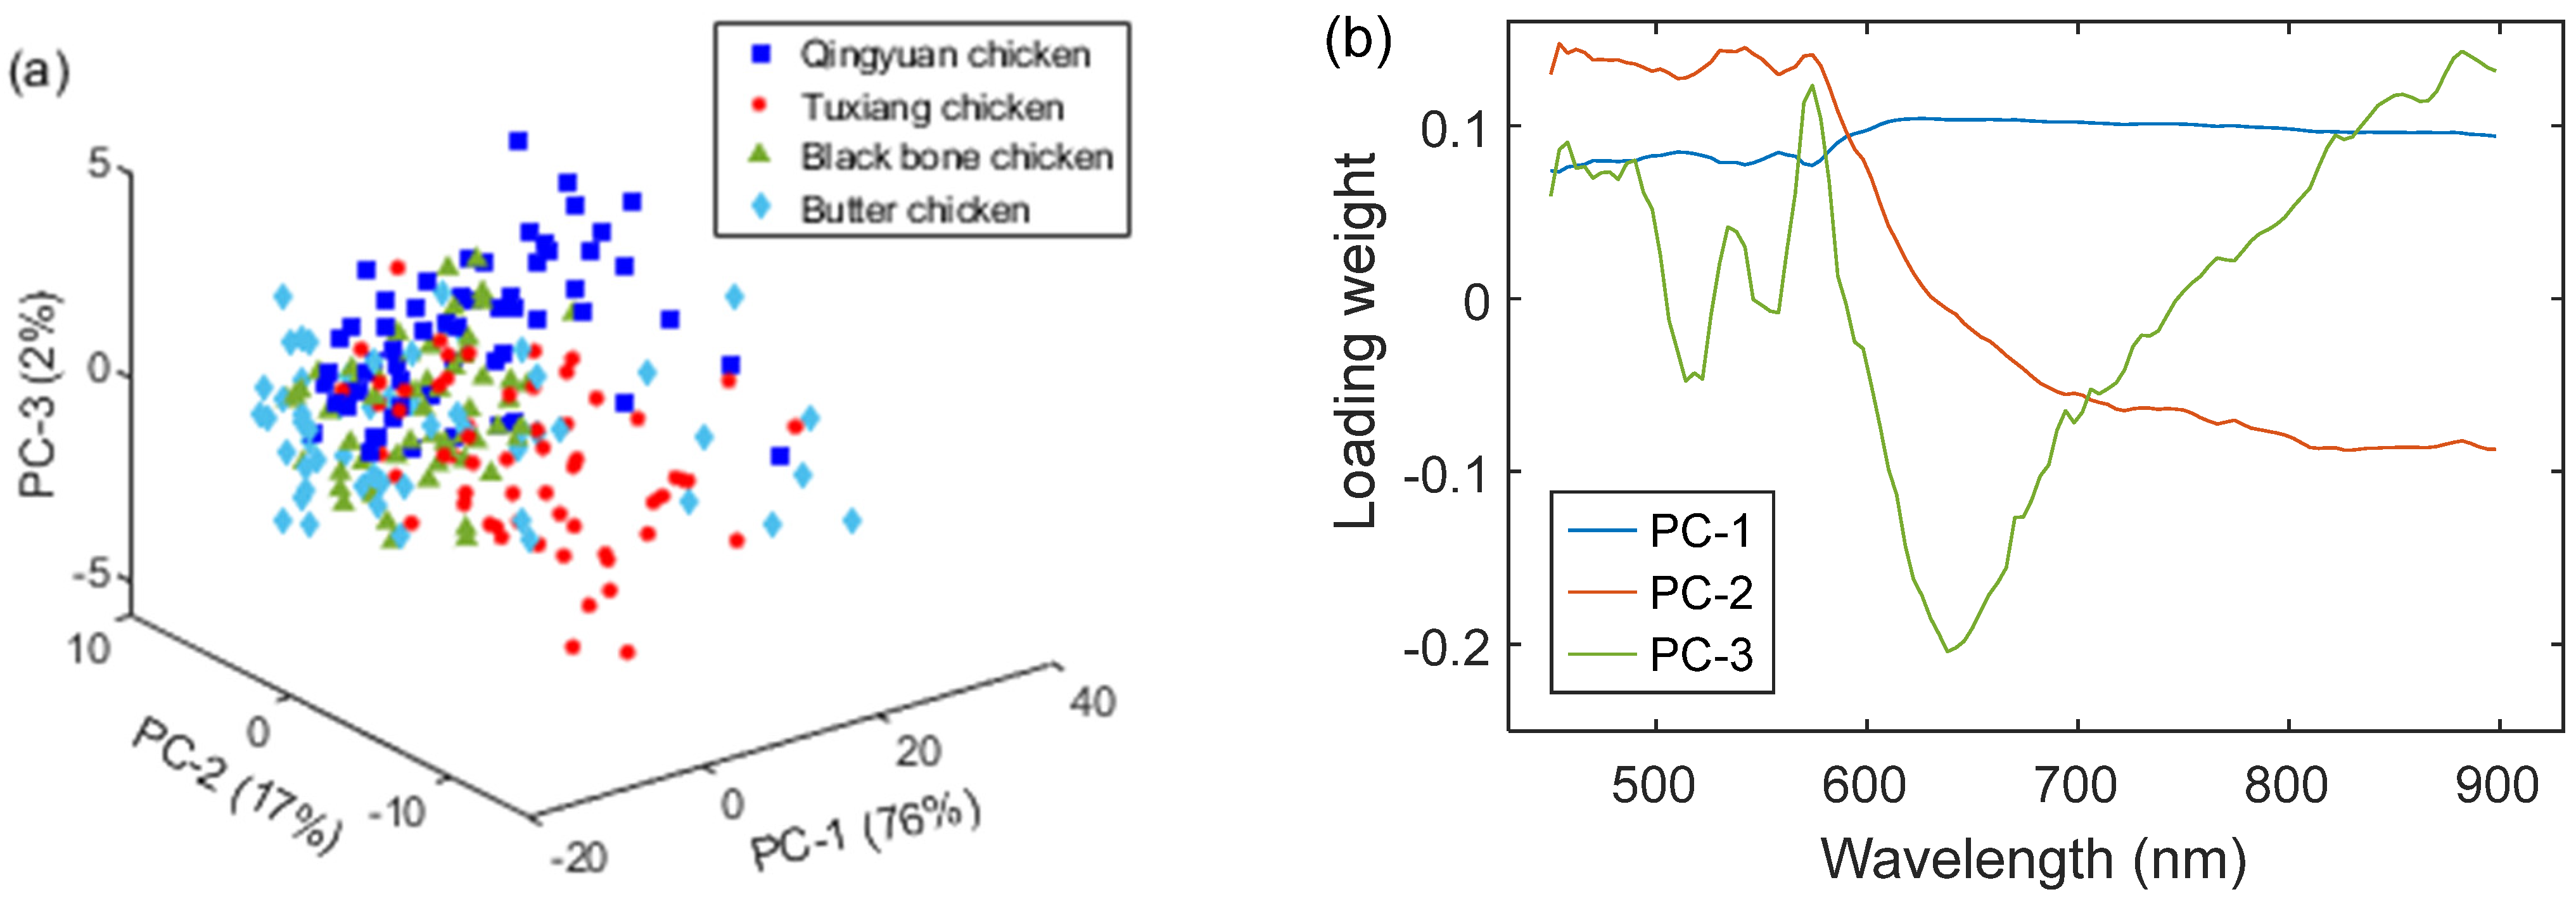
As an unsupervised tool, principal component analysis (PCA) was often used to visualize the cluster trend of the high-dimensional data [26]. A preliminary PCA exploration of the original spectra was carried out. Figure 3a shows the three-dimensional scatter plots of all spectral samples. It can be observed that the four clusters representing different chicken breeds showed a slight separation using PC-1, PC-2, and PC-3, which separately explained 76% (PC-1), 17% (PC-2), and 2% (PC-3) of the spectral variability in the data. On the other hand, to further explore which variables in the full bands had a great impact on modeling, the loading weight was calculated to present the important peaks. As shown in Figure 3b, the wavelengths at 454, 515, 542, 558, 574, 638, and 882 nm had a major impact in distinguishing differen chicken breeds. On the whole, PCA showed poor separation in the dataset, and different clusters overlapped to a certain degree. There is a need to further use multivariate data analysis technology to achieve better discrimination results.
3.3. Pretreatment of Original Spectra
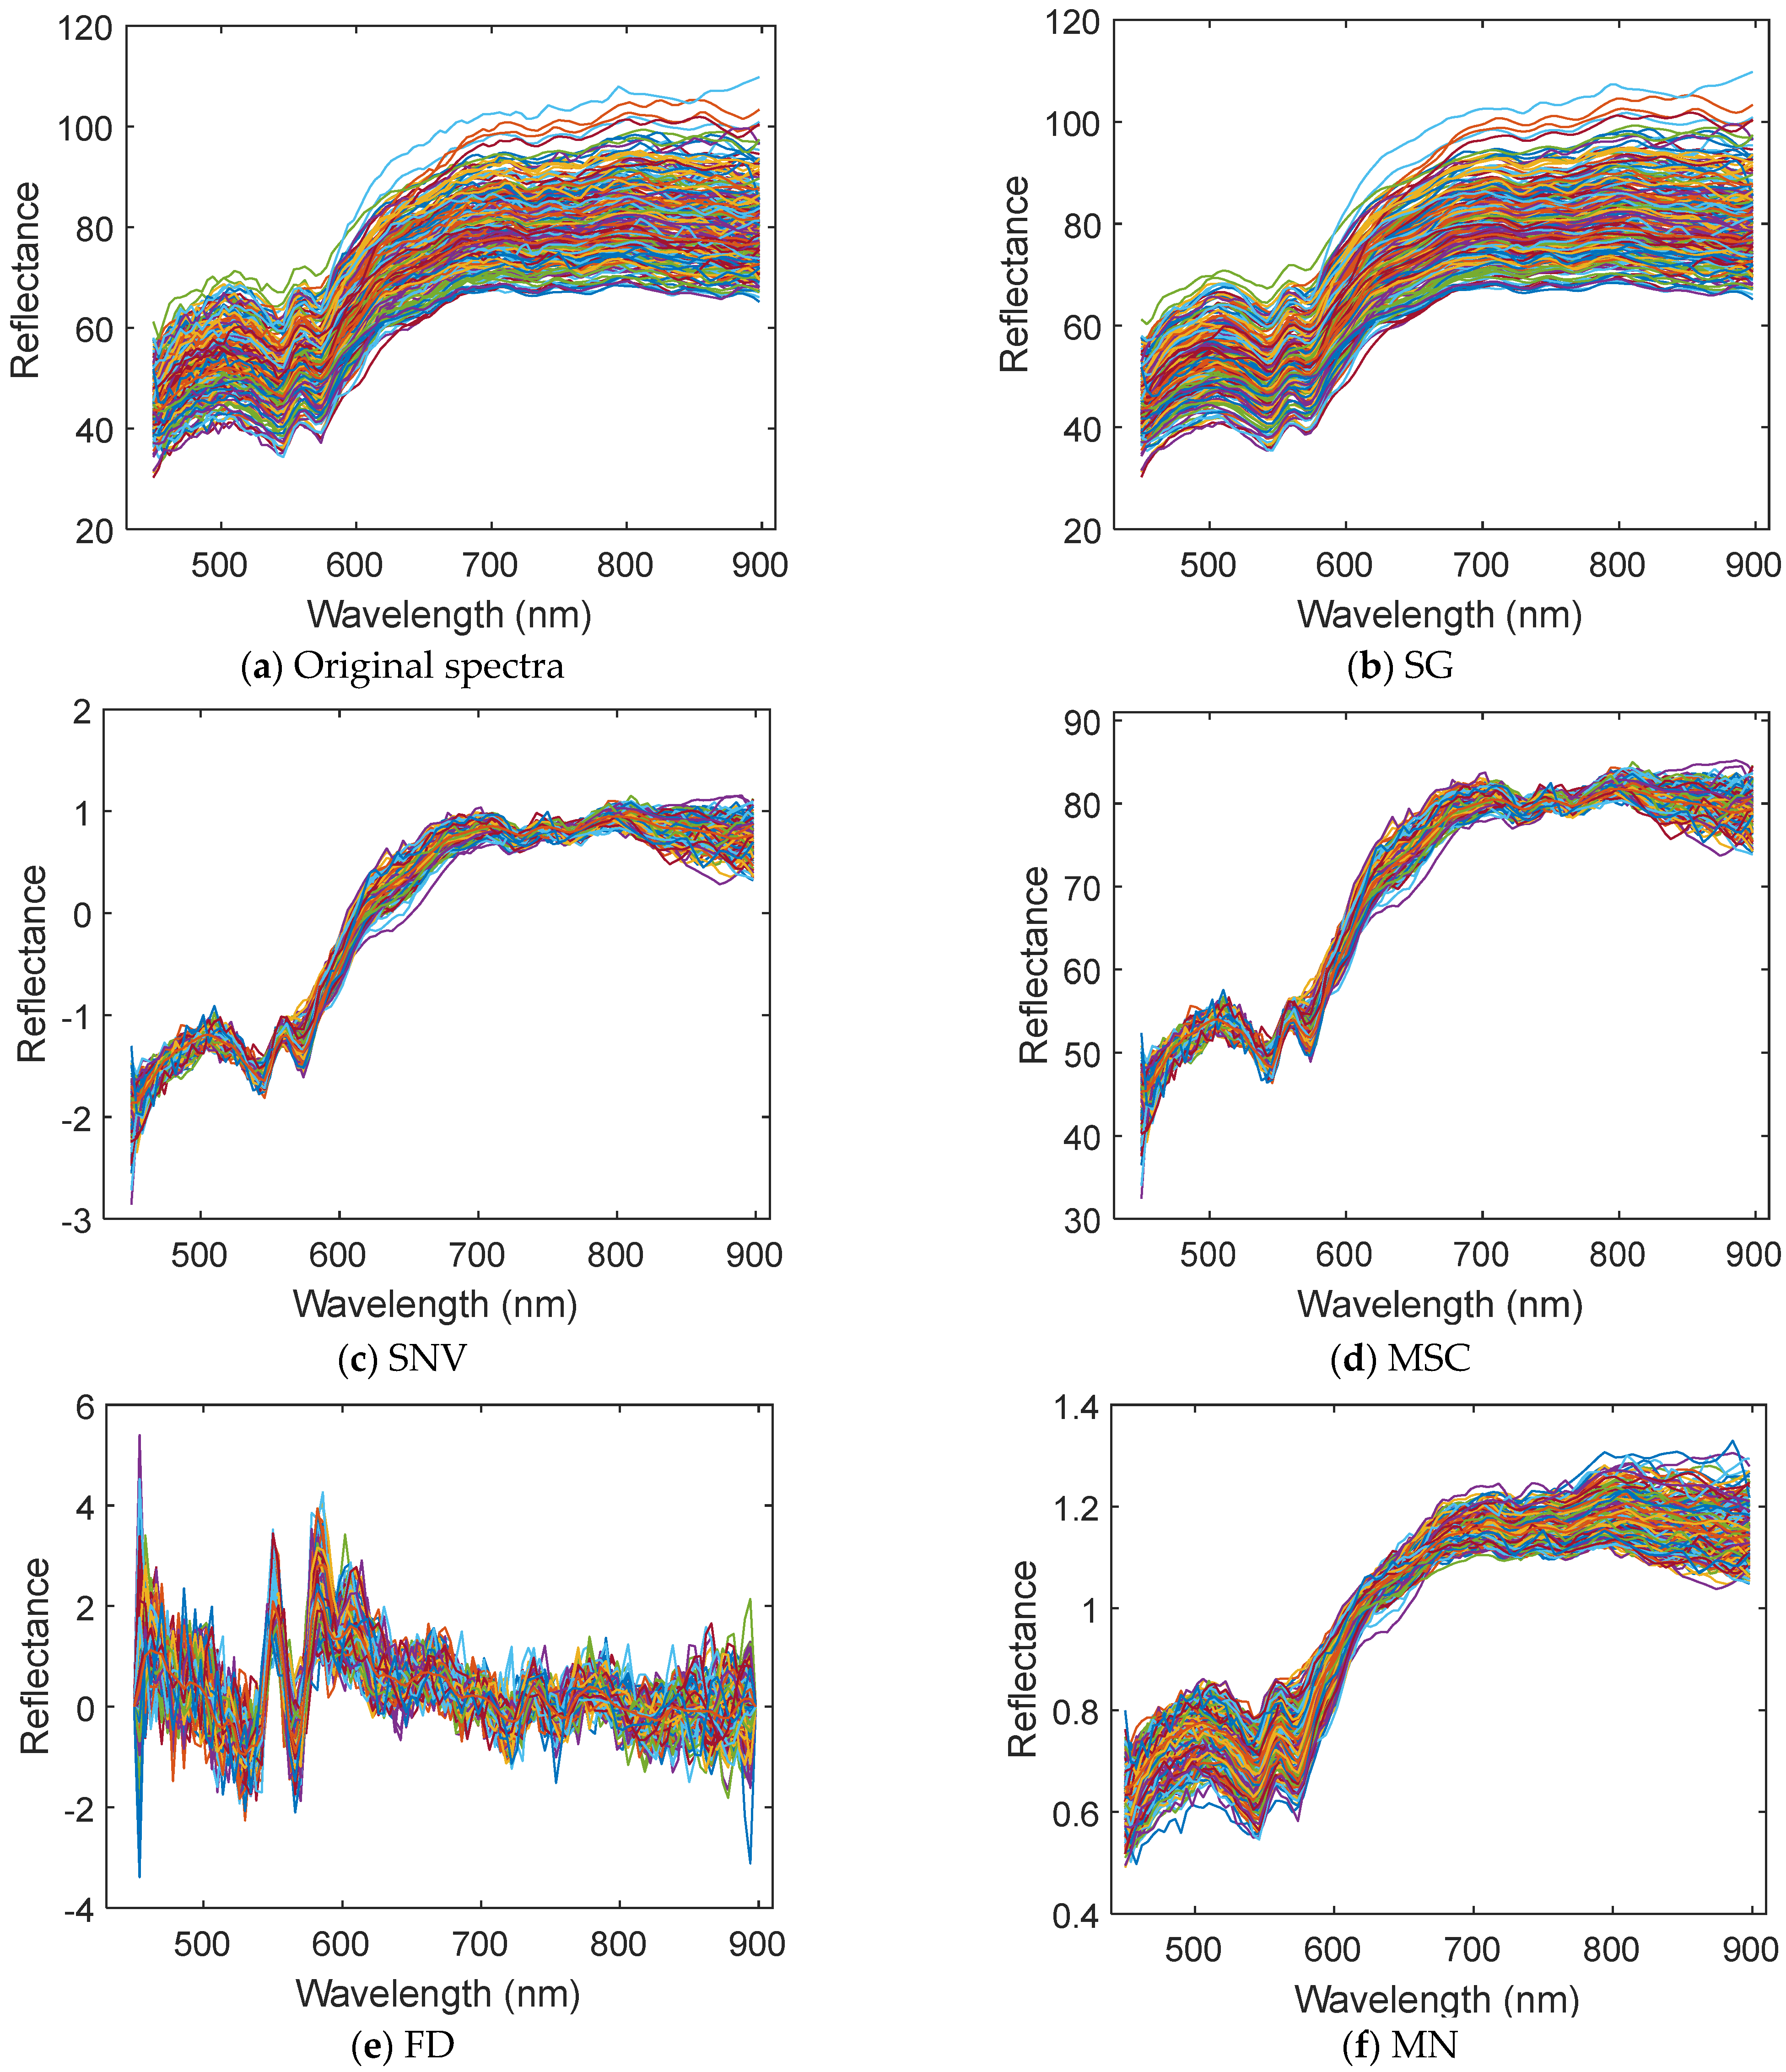
Figure 4 shows the results of processing the original spectra by SG, SNV, MSC, FD, and MN methods, respectively. It can be found that SNV, MSC, FD, and MN methods made the spectral samples more concentrated and eliminated the effects of different spectral scattering and baseline [25,27]. SG method kept the appearance of the original spectra and reduced the high-frequency noise of the spectra.
3.4. Multivariate Data Analysis
3.4.1. Comparison of Different Pretreatment Methods
Table 1 shows the impact of different preprocessing methods on the accuracy of the SVM model. It can be seen from Table 1 that although the model with SG preprocessing performed poorly, the performances of the model established by other preprocessing methods were better than that of the model established using the raw dataset. Among them, the model established by MN method produced the highest accuracy, with 100% in the calibration set and 96.25% in the prediction set. For the SNV, MSC, and FD methods, the model accuracies on the prediction set were 93.75%, 92.50%, and 93.75%, respectively, which were slightly lower than that of MN method. The accuracy of the SG method was similar to the original modeling results, which may be related to the removal of some important information in the preprocessing process. In general, the MN method was determined as the best pretreatment method, and then the key wavelength variables were selected from the spectrum pretreated by the MN method.
3.4.2. Important Wavelength Selection
In this section, the spectra pretreated by the MN method were used for key wavelength selection of RF, SPA, and CARS to establish different simplified models.
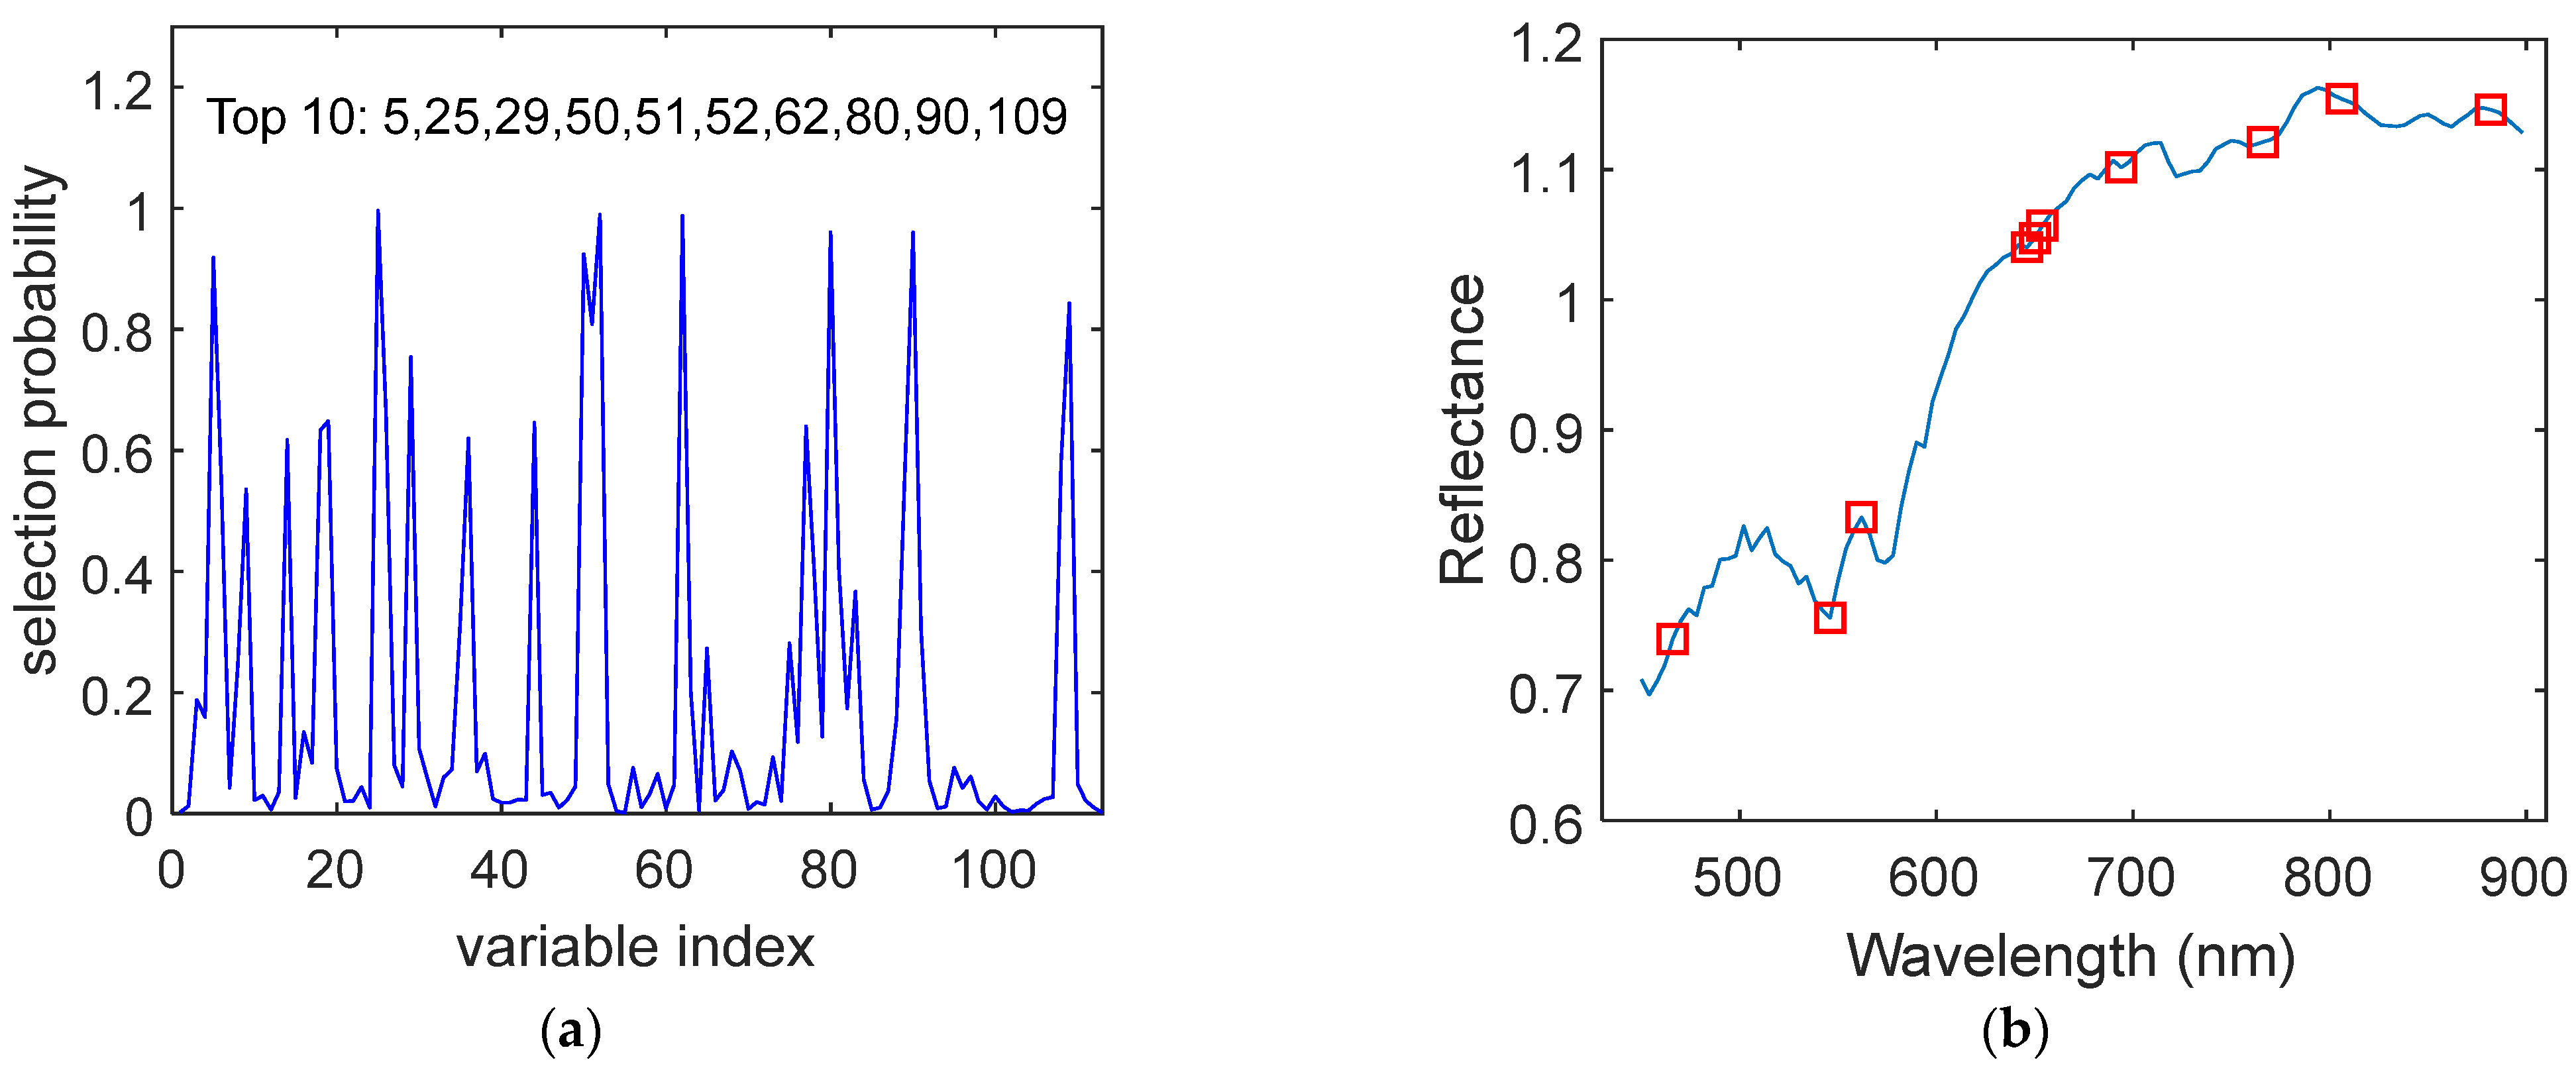
In RF processing, the algorithm was run 1000 times to calculate the average selection probability of each wavelength variable. The greater the probability of variable selection, the more important the variable is to the model. As shown in Figure 5a, the top 10 variables with the highest probability were selected as the key characteristic wavelengths, and their positions were marked in the full spectrum of Figure 5b.
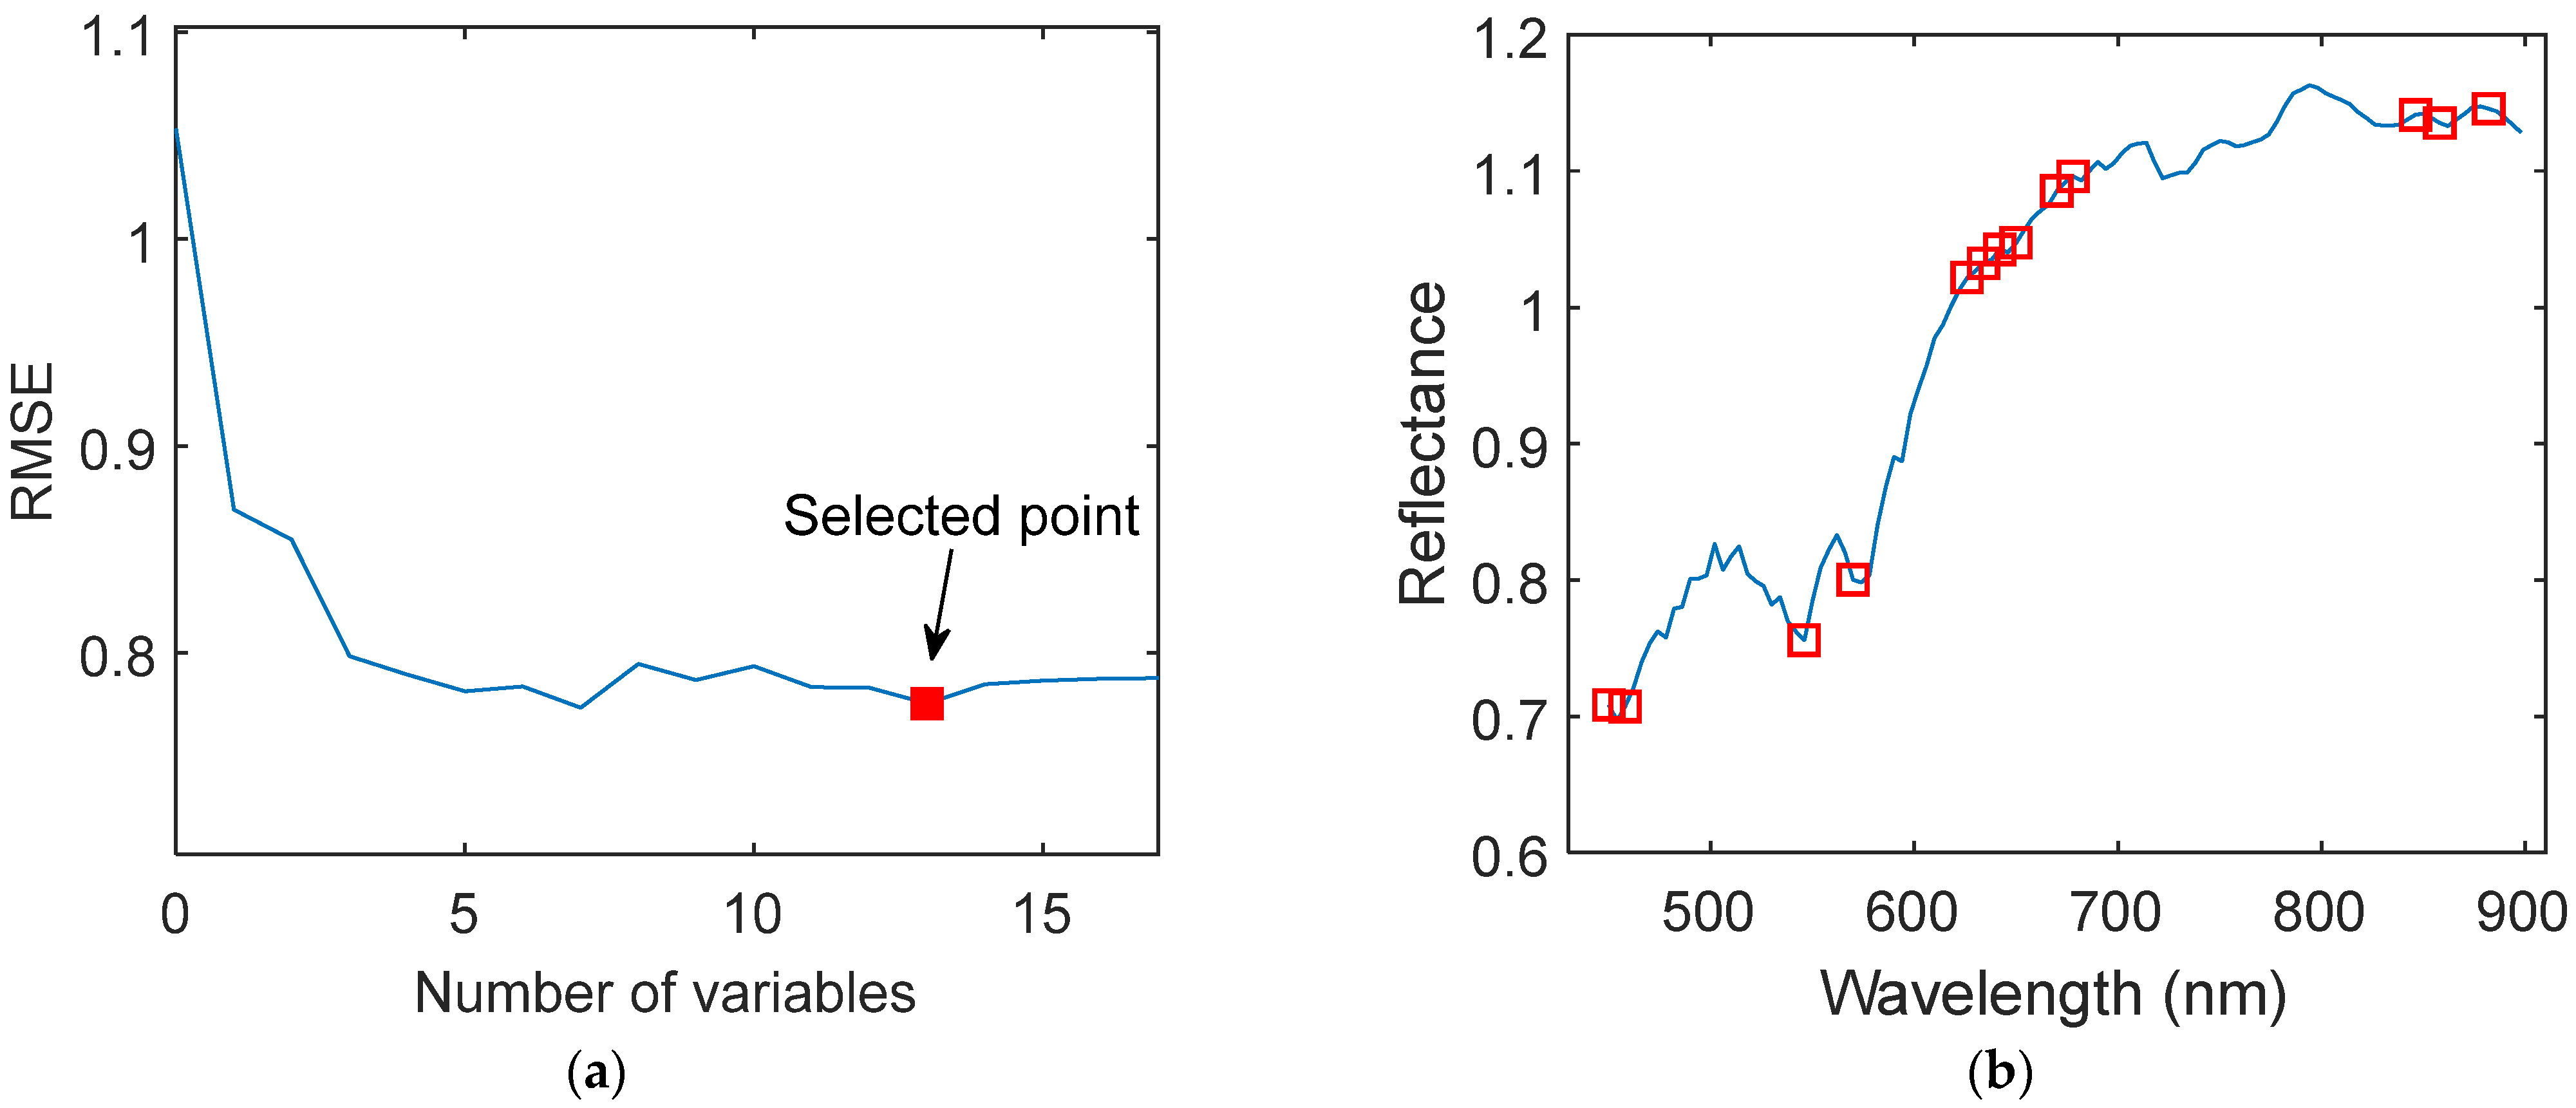
In the SPA process, we set the maximum number of selected wavelengths to 30, and the variation curve of root mean square error (RMSE) with the number of characteristic wavelengths is shown in Figure 6a. With the increase in the x-axis characteristic wavelength, the Y-axis RMSE decreased sharply at first and then slowly. The RMSE was used to determine the optimal characteristic wavelengths, and the optimal number of characteristic wavelengths is 13. The distribution of the characteristic wavelengths selected by SPA is shown in Figure 6b.
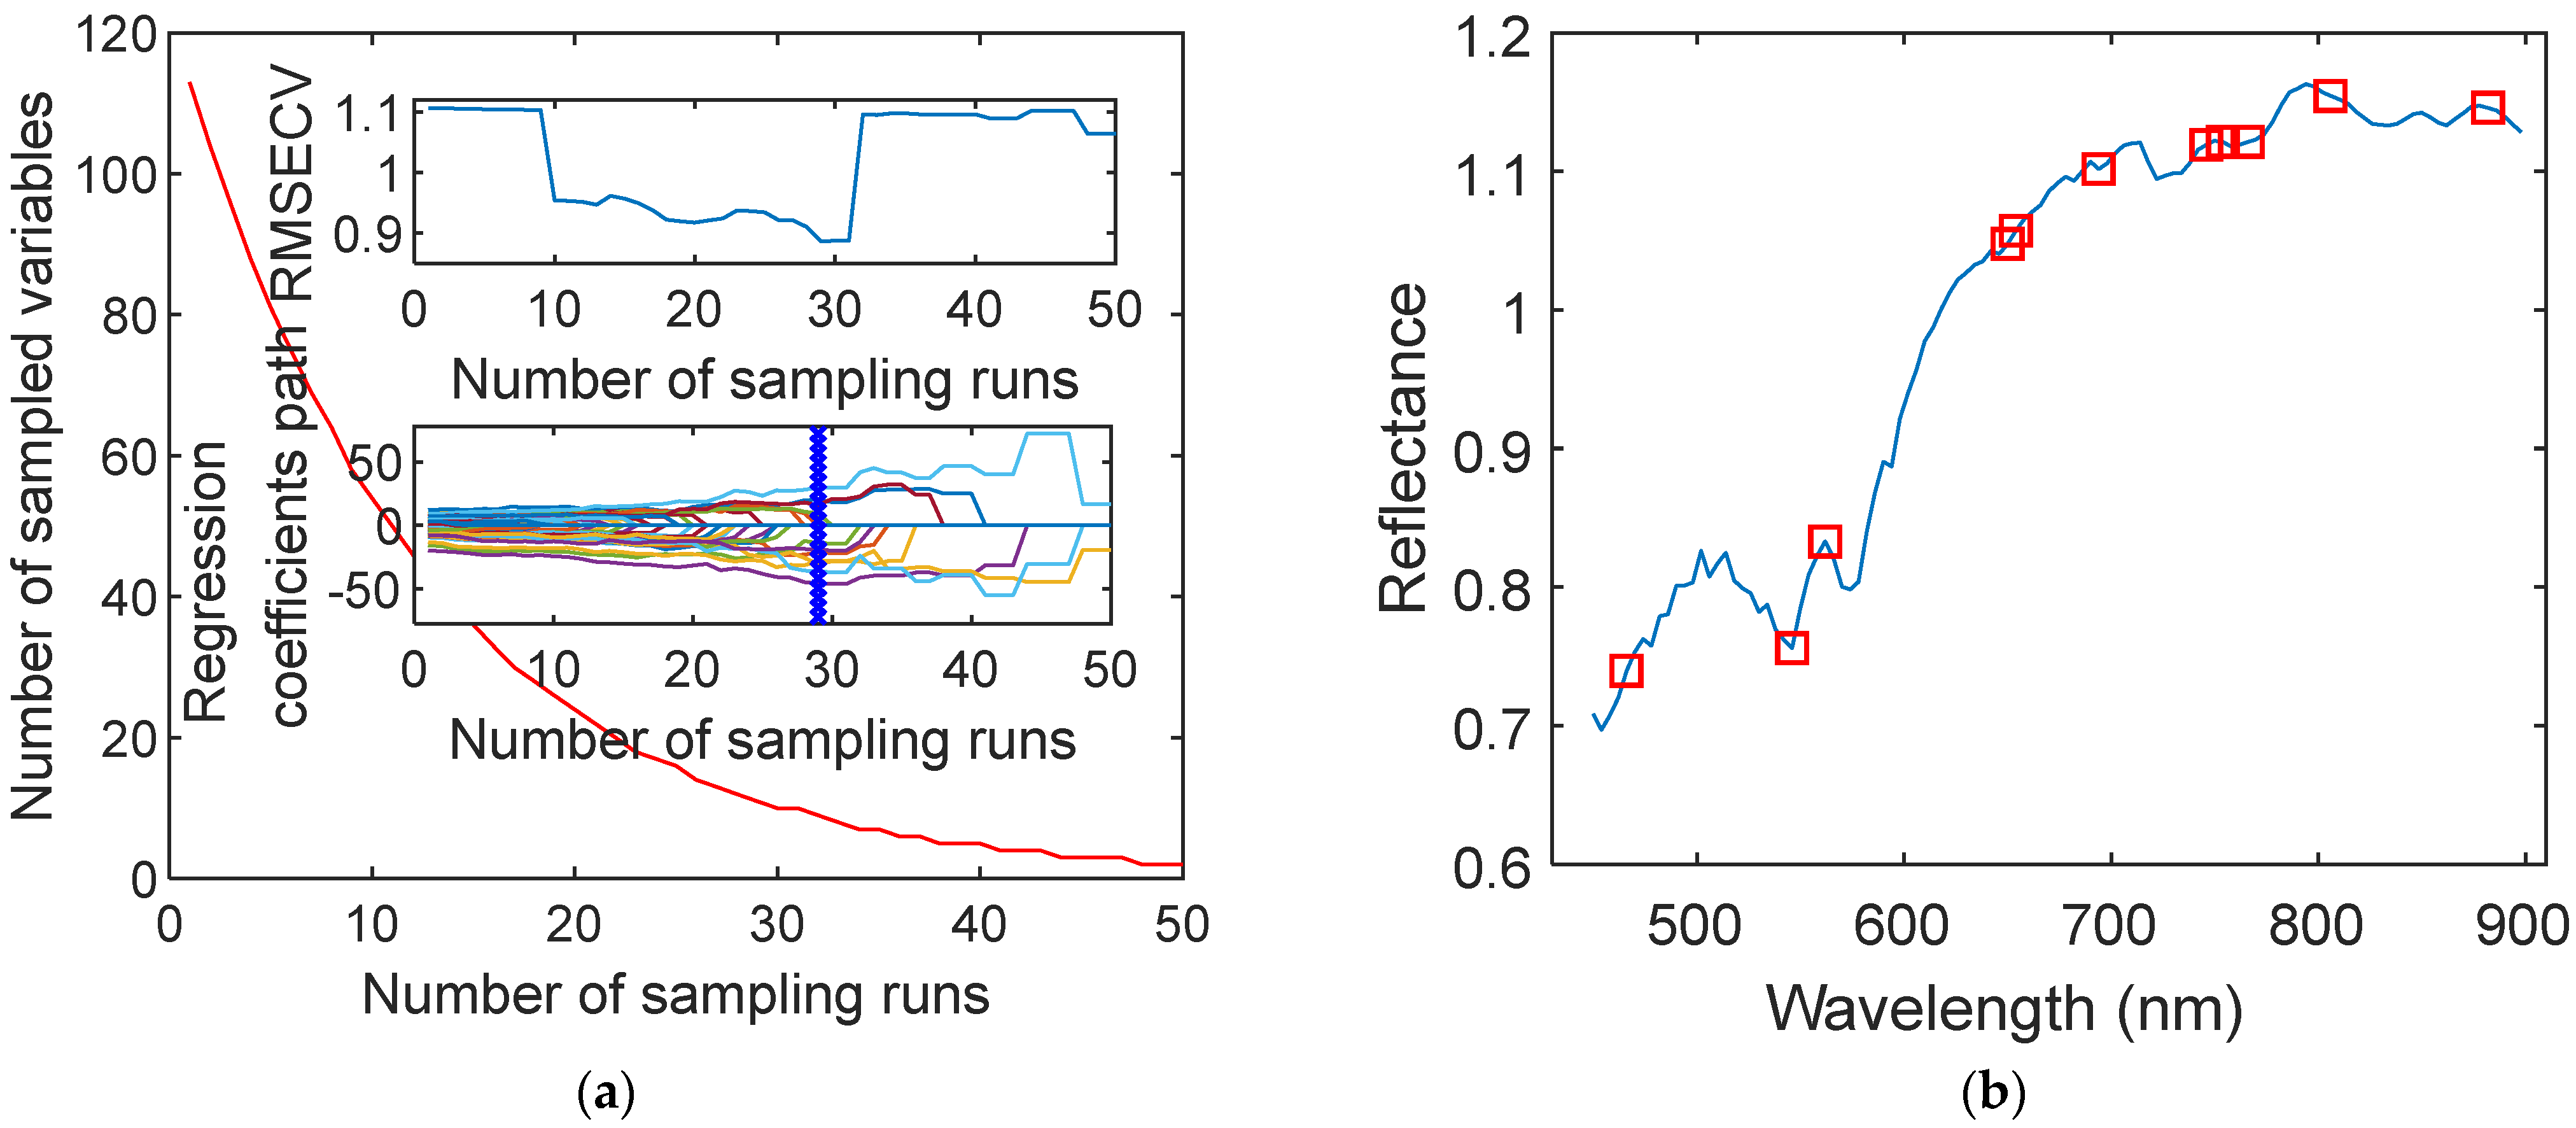
In CARS, the number of Monte Carlo samples was set to 50. As can be seen in Figure 7a, with the increase in sampling time, the root mean square error of cross validation (RMSECV) first decreases due to the removal of redundant wavelengths and noise, and then some useful information may be removed in the continuous variable screening process, resulting in the gradual increase in RMSECV. The position marked with blue “+” represents the minimum RMSECV value and the best subset of the selected variables. Therefore, a total of 11 key characteristic wavelength variables were selected, and their distributions in the full spectrum are shown in Figure 7b.
3.4.3. Comparison of Models Based on Important Wavelengths
In this experiment, the PLS-DA and KNN algorithms were used to compare the performance of the SVM model. The full spectrum variables and important characteristic wavelengths were used as input variables to establish SVM-based, KNN-based, and PLSDA-based classification models.
As shown in Table 2, it can be seen that the RF, SPA, and CARS algorithms compressed the number of input variables but also decreased the accuracy of the models. Specifically, the accuracies of RF-SVM, SPA-SVM, and CARS-SVM on the prediction set were 85%, 90% and 86.25%, respectively. The reason for the decrease in accuracy may be the removal of important wavelengths in the wavelength-extraction process. However, the complexity of the model was simplified, and the calculation time was shorter than that when using the full wavelength. The extraction of wavelength is meaningful to save training time. On the other hand, the KNN combined with RF, SPA, and CARS produced good results, and all results were slightly worse than that of SVM-based models. The accuracies of Full-KNN, RF-KNN, SPA-KNN, and CARS-KNN on the prediction set were 85%, 71.25%, 82.50% and 72.50%, respectively. However, PLS-DA-based models delivered the worst results, namely that the accuracies of Full-PLS-DA, RF-PLS-DA, SPA-PLS-DA, and CARS-PLS-DA were 56.25%, 53.75%, 42.50, and 55.00, respectively.
For the RF, SPA, and CARS methods, the classification results of SPA were better than those of RF and CARS in most cases, which shows that the SPA method not only effectively reduced the number of wavelengths, but also ensured the accuracy of the models as much as possible. In general, the SVM-based and KNN-based models had great potential in chicken breeds identification, and SPA-SVM model achieved the best classification accuracy when reducing the number of wavelength variables.
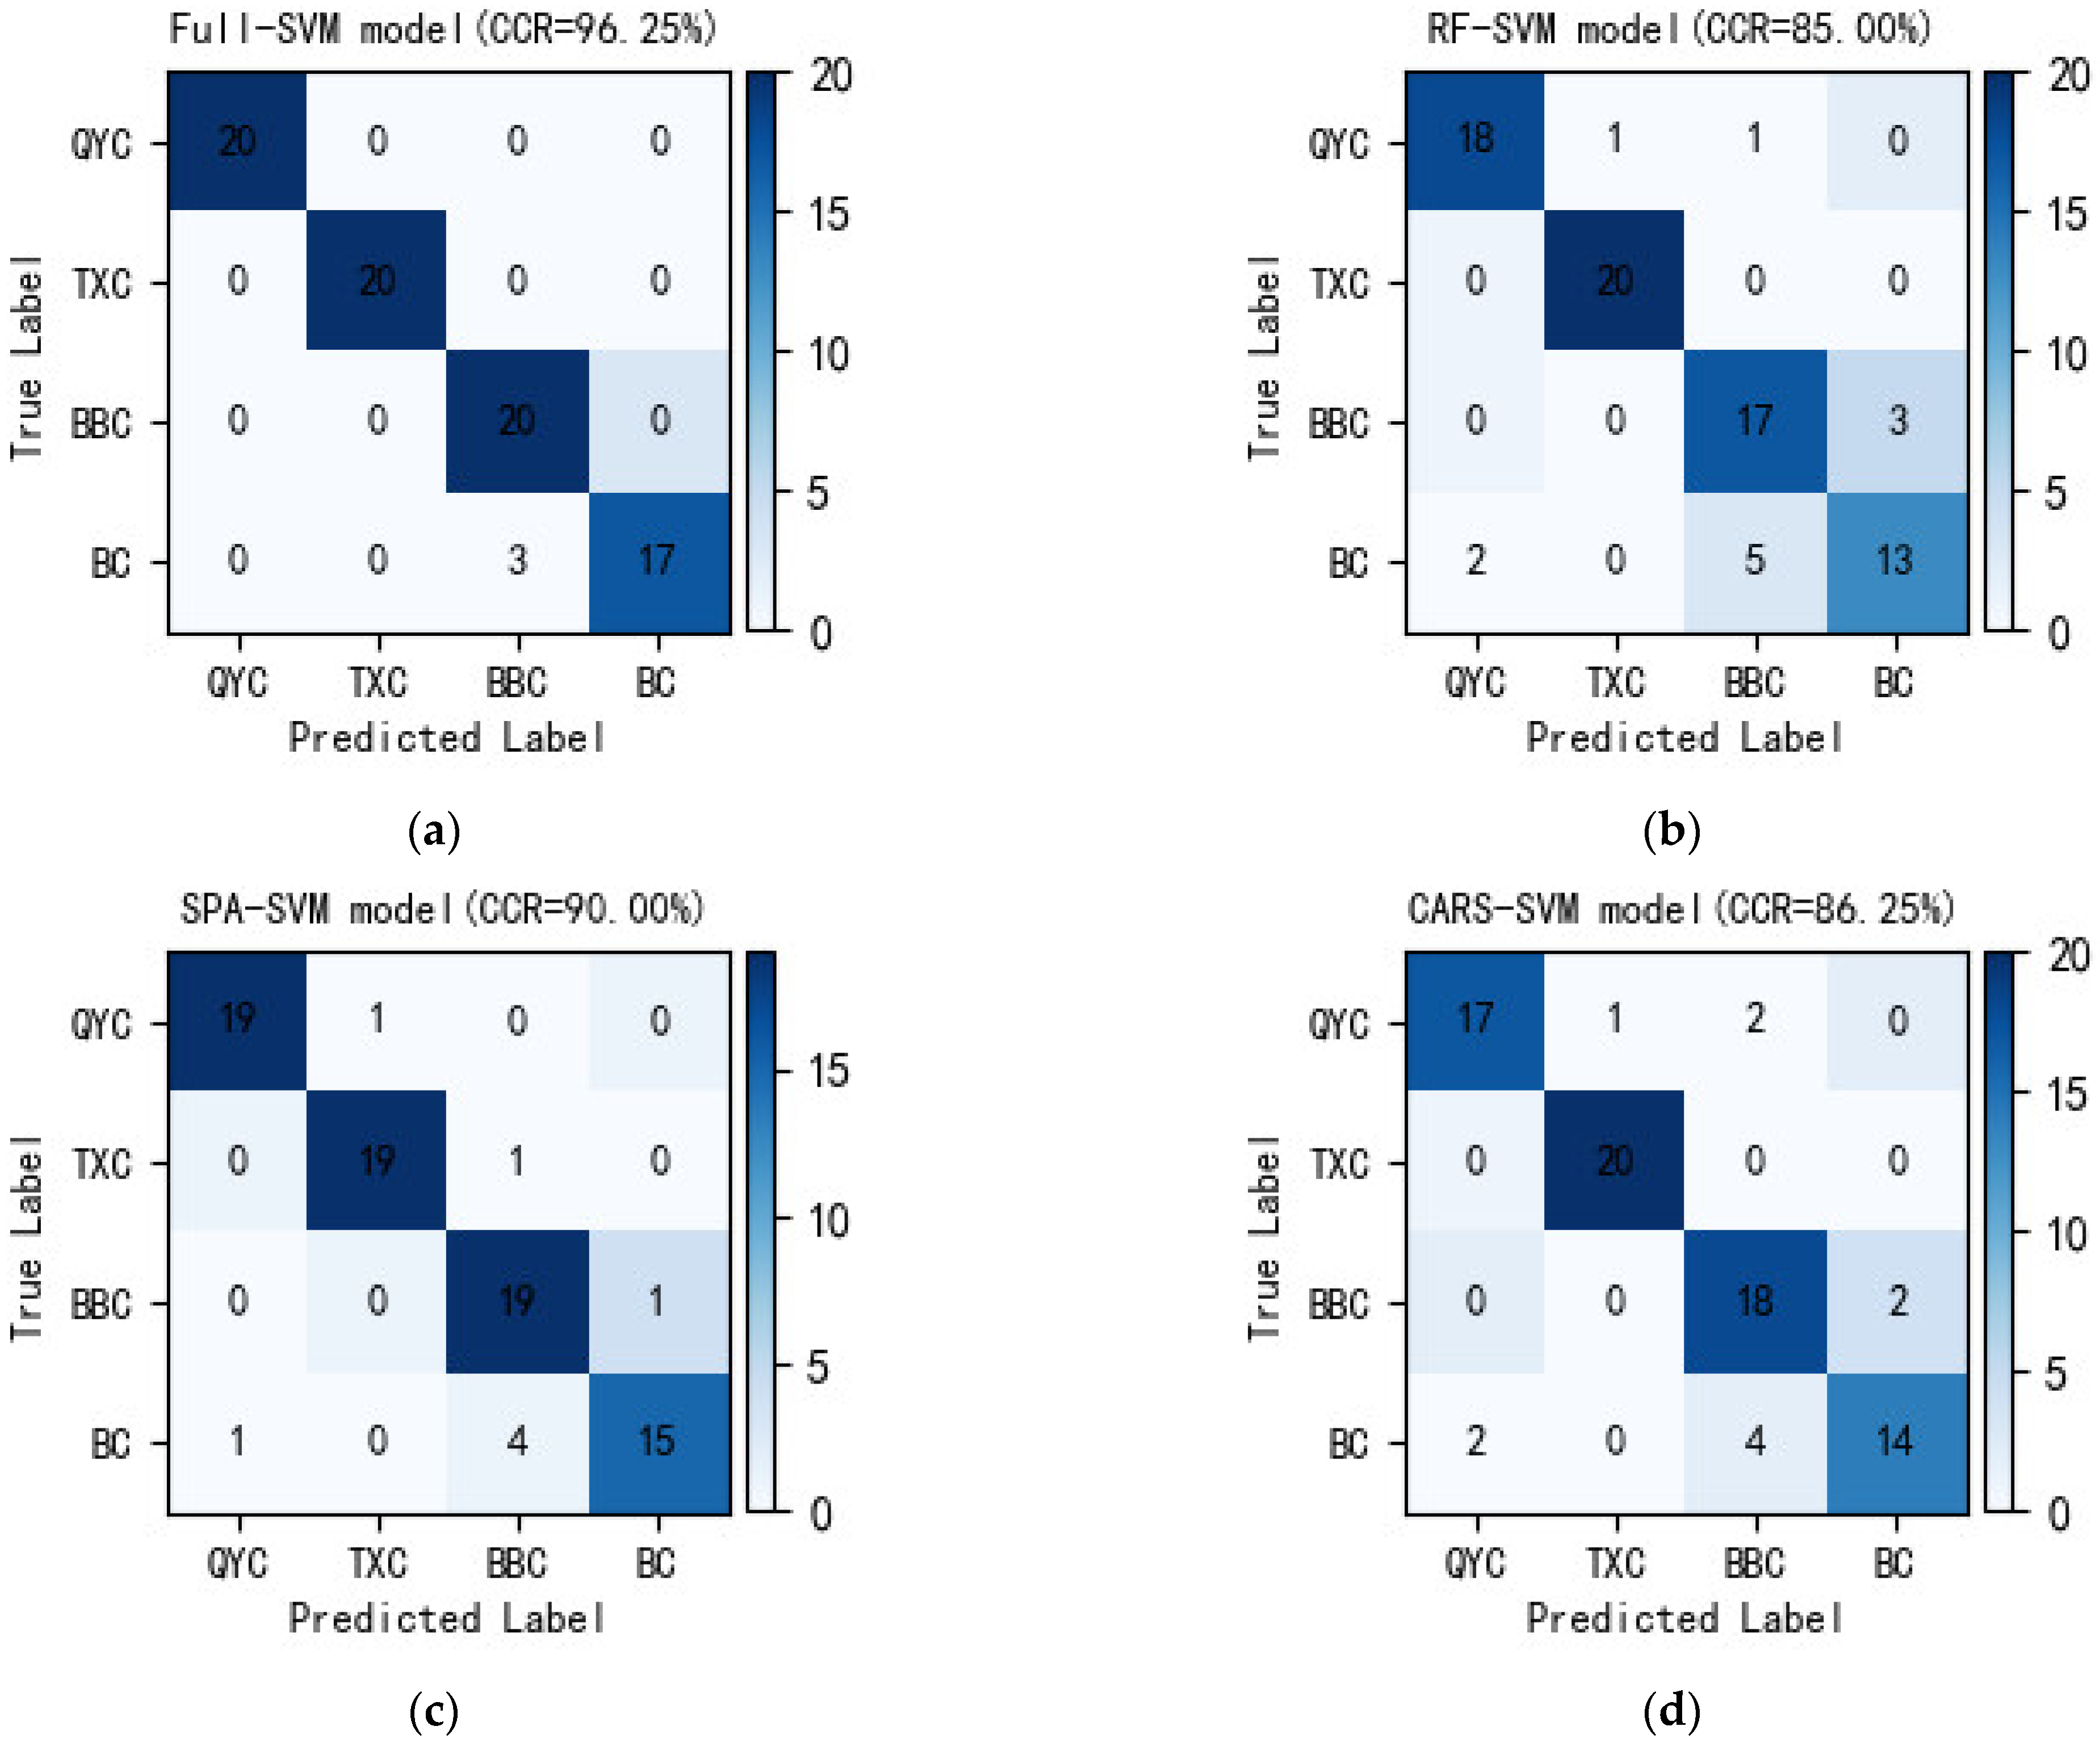
Figure 8 shows the confusion matrix of the Full-SVM, RF-SVM, SPA-SVM, and CARS-SVM models in the prediction process. It can be seen that all models easily distinguished QYC, TXC, and BBC. However, for BC, all models had large classification errors, and several samples of BC were classified as BBC. Compared with the Full-SVM model, the SPA-SVM model only needs 13 spectral variables to achieve satisfactory generalization results, with 90% CCR.
In this study, HSI technology has been proved to be a feasible method for identifying Qingyuan chicken and other chicken breeds. Because of the genetic differences, geographical environment, feeding mode, and other reasons, the chemical composition and texture of the four chicken breeds may be different [28,29]. As shown in Figure 2, it is noted that the mean spectrum of the different chicken breeds varies, which verifies this possibility. In addition, a previous paper reported the identification of free-range and broiler chickens using HSI in combination with spectra and texture data, and the SVM model among the established classification models obtained the optimal results, with a high CCR of 93.33% [30]. Good results have been obtained in other studies of chicken breed classification. HSI was coupled with multivariate analysis to identify and authenticate Beijing-you chicken among four common chicken breeds, and the CCR of the prediction set reached 92% [25]. In our work, an SVM-based model also showed good classification results, with the CCR above 90%. In terms of simplifying the model, the number of characteristic wavelengths extracted by SPA method accounted for 11.2% (13/116) of the full spectrum, which reduced the calculation cost. In general, HSI technology is a promising industrial application method, which provides a technical basis for tracing the origin of chicken.
4. Conclusions
In this work, HSI technology combined with chemometrics was used as an effective tool to identify four common chicken breeds. The MN method was the optimal pretreatment for the original spectra. SPA was the optimal feature variables extraction method in reducing the dimensions of spectral data. In general, the Full-SVM model based on the full spectrum reached CCR of 96.25%, and the SPA-SVM model based on important wavelengths reached CCR of 90%. The results contribute to the application of HSI technology in the identification of chicken breeds.
In addition, this work only involved chicken breast samples from four geographical origins. In future studies, the origins of chicken should be expanded to make HSI technology more widely used. In terms of important variable extraction, the optimal model (SPA-SVM) only achieved 90% CCR. Hybrid variable extraction methods should be considered further to establish a stable and accurate chicken breed classification model.
Author Contributions
Conceptualization, T.C. and N.Z.; methodology, T.C. and P.L.; software, P.L. and J.M.; validation, T.C; formal analysis, P.L.; investigation, J.M.; resources, T.C. and N.Z.; data curation, N.Z.; writing—original draft preparation, T.C.; visualization, P.L.; writing—review and editing, X.T. and N.Z.; supervision, J.M.; funding acquisition, X.T. and N.Z. All authors have read and agreed to the published version of the manuscript.
Funding
This research was supported by Qingyuan Science and Technology Plan [2022KJJH063] Guangdong Science and Technology Plan [2021XNYNYKJHZGJ001, 2021B1212040009], Agricultural and Rural Plan of Guangdong Province [5100-F19406], and Guangzhou Science and Technology Plan [201903010063].
Institutional Review Board Statement
Not applicable.
Informed Consent Statement
Not applicable.
Data Availability Statement
The hyperspectral data used to support the findings of this study are available from the corresponding author upon request.
Conflicts of Interest
The authors declare no conflict of interest.
References
- Weng, K.; Huo, W.; Li, Y.; Zhang, Y.; Zhang, Y.; Chen, G.; Xu, Q. Fiber characteristics and meat quality of different muscular tissues from slow- and fast-growing broilers. Poult. Sci. 2022, 101, 101537. [Google Scholar] [CrossRef] [PubMed]
- Yan, S.; Tiantian, Z.; Haihua, C.; Kun, X. Determination of Geographic Origin of Chicken Based on Near Infrared Spectroscopy. J. Chin. Inst. Food Sci. Technol. 2014, 14, 198–204. [Google Scholar] [CrossRef]
- Yingying, G.; Guoge, H.; Jingcheng, Z.; Keke, H. Present situation, problems and Countermeasures of Qingyuan Chicken Breeding. Anim. Breed. Feed 2019, 1, 117–119. [Google Scholar] [CrossRef]
- Alagawany, M.; Farag, M.R.; Dhama, K.; Patra, A. Nutritional significance and health benefits of designer eggs. Worlds. Poult. Sci. J. 2018, 74, 317–330. [Google Scholar] [CrossRef]
- Jia, M.; Zhang, Z.; Li, J.; Ma, X.; Chen, L.; Yang, X. Molecular imprinting technology for microorganism analysis. TrAC-Trends Anal. Chem. 2018, 106, 190–201. [Google Scholar] [CrossRef]
- Sentandreu, M.A.; Fraser, P.D.; Halket, J.; Patel, R.; Bramley, P.M. A proteomic-based approach for detection of chicken in meat mixes. J. Proteome Res. 2010, 9, 3374–3383. [Google Scholar] [CrossRef] [PubMed]
- Trivedi, D.K.; Hollywood, K.A.; Rattray, N.J.W.; Ward, H.; Trivedi, D.K.; Greenwood, J.; Ellis, D.I.; Goodacre, R. Meat, the metabolites: An integrated metabolite profiling and lipidomics approach for the detection of the adulteration of beef with pork. Analyst 2016, 141, 2155–2164. [Google Scholar] [CrossRef] [PubMed] [Green Version]
- Xu, Y.; Zhong, P.; Jiang, A.; Shen, X.; Li, X.; Xu, Z.; Shen, Y.; Sun, Y.; Lei, H. Raman spectroscopy coupled with chemometrics for food authentication: A review. TrAC-Trends Anal. Chem. 2020, 131, 116017. [Google Scholar] [CrossRef]
- Feng, Y.Z.; Sun, D.W. Determination of total viable count (TVC) in chicken breast fillets by near-infrared hyperspectral imaging and spectroscopic transforms. Talanta 2013, 105, 244–249. [Google Scholar] [CrossRef]
- Liu, H.; Ji, Z.; Liu, X.; Shi, C.; Yang, X. Non-destructive determination of chemical and microbial spoilage indicators of beef for freshness evaluation using front-face synchronous fluorescence spectroscopy. Food Chem. 2020, 321, 126628. [Google Scholar] [CrossRef]
- Ma, J.; Sun, D.W.; Pu, H. Spectral absorption index in hyperspectral image analysis for predicting moisture contents in pork longissimus dorsi muscles. Food Chem. 2016, 197, 848–854. [Google Scholar] [CrossRef] [PubMed]
- Qiao, L.; Tang, X.; Dong, J. A feasibility quantification study of total volatile basic nitrogen (TVB-N) content in duck meat for freshness evaluation. Food Chem. 2017, 237, 1179–1185. [Google Scholar] [CrossRef] [PubMed]
- Cheng, J.H.; Sun, D.W. Hyperspectral imaging as an effective tool for quality analysis and control of fish and other seafoods: Current research and potential applications. Trends Food Sci. Technol. 2014, 37, 78–91. [Google Scholar] [CrossRef]
- Wang, H.; He, H.; Ma, H.; Chen, F.; Kang, Z.; Zhu, M.; Wang, Z.; Zhao, S.; Zhu, R. LW-NIR hyperspectral imaging for rapid prediction of TVC in chicken flesh. Int. J. Agric. Biol. Eng. 2019, 12, 180–186. [Google Scholar] [CrossRef] [Green Version]
- Xiong, Z.; Sun, D.W.; Pu, H.; Xie, A.; Han, Z.; Luo, M. Non-destructive prediction of thiobarbituric acid reactive substances (TBARS) value for freshness evaluation of chicken meat using hyperspectral imaging. Food Chem. 2015, 179, 175–181. [Google Scholar] [CrossRef] [PubMed]
- Jiang, H.; Yoon, S.C.; Zhuang, H.; Wang, W.; Lawrence, K.C.; Yang, Y. Tenderness classification of fresh broiler breast fillets using visible and near-infrared hyperspectral imaging. Meat Sci. 2018, 139, 82–90. [Google Scholar] [CrossRef]
- Kandpal, L.M.; Lee, H.; Kim, M.S.; Mo, C.; Cho, B.K. Hyperspectral reflectance imaging technique for visualization of moisture distribution in cooked chicken breast. Sensors 2013, 13, 13289–13300. [Google Scholar] [CrossRef] [Green Version]
- Akowuah, T.O.S.; Teye, E.; Hagan, J.; Nyandey, K. Rapid and Nondestructive Determination of Egg Freshness Category and Marked Date of Lay using Spectral Fingerprint. J. Spectrosc. 2020, 2020, 8838542. [Google Scholar] [CrossRef]
- Chen, H.; Song, Q.; Tang, G.; Feng, Q.; Lin, L. The Combined Optimization of Savitzky-Golay Smoothing and Multiplicative Scatter Correction for FT-NIR PLS Models. ISRN Spectrosc. 2013, 2013, 642190. [Google Scholar] [CrossRef] [Green Version]
- Zhong, N.; Li, Y.P.; Li, X.Z.; Guo, C.X.; Wu, T. Accurate prediction of salmon storage time using improved Raman spectroscopy. J. Food Eng. 2021, 293, 110378. [Google Scholar] [CrossRef]
- Li, H.D.; Xu, Q.S.; Liang, Y.Z. Random frog: An efficient reversible jump Markov Chain Monte Carlo-like approach for variable selection with applications to gene selection and disease classification. Anal. Chim. Acta 2012, 740, 20–26. [Google Scholar] [CrossRef] [PubMed]
- Li, P.; Ma, J.; Zhong, N. Raman spectroscopy combined with support vector regression and variable selection method for accurately predicting salmon fillets storage time. Optik 2021, 247, 167879. [Google Scholar] [CrossRef]
- Wu, D.; Sun, D.W. Potential of time series-hyperspectral imaging (TS-HSI) for non-invasive determination of microbial spoilage of salmon flesh. Talanta 2013, 111, 39–46. [Google Scholar] [CrossRef] [PubMed]
- Cheng, J.H.; Sun, D.W.; Zeng, X.A.; Pu, H. Bin Non-destructive and rapid determination of TVB-N content for freshness evaluation of grass carp (Ctenopharyngodon idella) by hyperspectral imaging. Innov. Food Sci. Emerg. Technol. 2014, 21, 179–187. [Google Scholar] [CrossRef]
- Zhang, B.; Gao, S.; Jia, F.; Liu, X.; Li, X. Categorization and authentication of Beijing-you chicken from four breeds of chickens using near-infrared hyperspectral imaging combined with chemometrics. J. Food Process Eng. 2020, 43, e13553. [Google Scholar] [CrossRef]
- Zhu, H.; Xu, J.L. Authentication and provenance of walnut combining fourier transform mid-infrared spectroscopy with machine learning algorithms. Molecules 2020, 25, 4987. [Google Scholar] [CrossRef]
- Wu, T.; Zhong, N.; Yang, L. Study on identification of counterfeit salmon meat based on infrared spectroscopy. Spectrosc. Spectr. Anal. 2017, 37, 3078–3082. [Google Scholar] [CrossRef]
- Habicht, C.; Smith, C.T.; Barclay, A.; Hoyt, H.A.; Turnquist, K.; Larson, W.A. Discriminating among Pacific salmon, rainbow trout, and Atlantic salmon species using common genetic screening methods. J. Fish Wildl. Manag. 2019, 10, 228–240. [Google Scholar] [CrossRef] [Green Version]
- Wu, T.; Zhong, N.; Yang, L. Identification of Adulterated and Non-adulterated Norwegian Salmon Using FTIR and an Improved PLS-DA Method. Food Anal. Methods 2018, 11, 1501–1509. [Google Scholar] [CrossRef]
- Xiong, Z.; Sun, D.W.; Pu, H.; Zhu, Z.; Luo, M. Combination of spectra and texture data of hyperspectral imaging for differentiating between free-range and broiler chicken meats. LWT 2015, 60, 649–655. [Google Scholar] [CrossRef]
Figure 1.
Schematic of the combination of HSI and chemometrics for chicken breeds identification.

Figure 2.
Mean spectra of four chicken breeds.

Figure 3.
PCA score and loading weight of the original spectral dataset. (a) PCA score. (b) Loading weight.
Figure 3.
PCA score and loading weight of the original spectral dataset. (a) PCA score. (b) Loading weight.

Figure 4.
Different spectral pretreatment results.

Figure 5.
Characteristic wavelengths selected by the RF algorithm. (a) Selection probability of each wavelength variable. (b) Distribution of key wavelengths.
Figure 5.
Characteristic wavelengths selected by the RF algorithm. (a) Selection probability of each wavelength variable. (b) Distribution of key wavelengths.

Figure 6.
Characteristic wavelengths selected by the SPA algorithm. (a) RMSE in SPA method. (b) Distribution of key wavelengths.
Figure 6.
Characteristic wavelengths selected by the SPA algorithm. (a) RMSE in SPA method. (b) Distribution of key wavelengths.

Figure 7.
Characteristic wavelengths selected by the CARS algorithm. (a) Processes of CARS selecting characteristic wavelength. (b) Distribution of key wavelengths.
Figure 7.
Characteristic wavelengths selected by the CARS algorithm. (a) Processes of CARS selecting characteristic wavelength. (b) Distribution of key wavelengths.

Figure 8.
Confusion matrixes of the SVM-based models in the prediction set. (a) Full-SVM. (b) RF-SVM. (c) SPA-SVM. (d) CARS-SVM. Note: QYC, TXC, BBC, and BC represent Qingyuan chicken, Tuxiang chicken, Black bone chicken, and Butter chicken, respectively.
Figure 8.
Confusion matrixes of the SVM-based models in the prediction set. (a) Full-SVM. (b) RF-SVM. (c) SPA-SVM. (d) CARS-SVM. Note: QYC, TXC, BBC, and BC represent Qingyuan chicken, Tuxiang chicken, Black bone chicken, and Butter chicken, respectively.


Table 1.
Full wavelength modeling results using the SVM model and different pretreatment methods.
| Pretreatment | Model | Calibration Set | Prediction Set | ||
|---|---|---|---|---|---|
| Correct/Total Number | CCR (%) | Correct/Total Number | CCR (%) | ||
| None | SVM | 146/160 | 91.25 | 58/80 | 72.50 |
| SG | SVM | 145/160 | 90.63 | 56/80 | 70.00 |
| SNV | SVM | 160/160 | 100 | 75/80 | 93.75 |
| MSC | SVM | 152/160 | 95.00 | 74/80 | 92.50 |
| FD | SVM | 159/160 | 99.38 | 75/80 | 93.75 |
| MN | SVM | 160/160 | 100 | 77/80 | 96.25 |
Table 2.
Classification results by key important wavelengths coupled with SVM, KNN, and PLS-DA.
| Model | Number of Wavelengths | Calibration Set | Prediction Set | ||
|---|---|---|---|---|---|
| Correct/Total Number | CCR (%) | Correct/Total Number | CCR (%) | ||
| Full-SVM | 116 | 160/160 | 100 | 77/80 | 96.25 |
| RF-SVM | 10 | 160/160 | 100 | 68/80 | 85.00 |
| SPA-SVM | 13 | 156/160 | 97.50 | 72/80 | 90.00 |
| CARS-SVM | 11 | 160/160 | 100 | 69/80 | 86.25 |
| Full-KNN | 116 | 155/160 | 96.88 | 68/80 | 85.00 |
| RF-KNN | 10 | 144/160 | 90.00 | 57/80 | 71.25 |
| SPA-KNN | 13 | 146/160 | 91.25 | 66/80 | 82.50 |
| CARS-KNN | 11 | 136/160 | 85.00 | 58/80 | 72.50 |
| Full-PLS-DA | 116 | 87/160 | 54.38 | 45/80 | 56.25 |
| RF-PLS-DA | 10 | 89/160 | 55.63 | 43/80 | 53.75 |
| SPA-PLS-DA | 13 | 73/160 | 45.63 | 34/80 | 42.50 |
| CARS-PLS-DA | 11 | 85/160 | 53.13 | 44/80 | 55.00 |
Publisher’s Note: MDPI stays neutral with regard to jurisdictional claims in published maps and institutional affiliations. |
© 2022 by the authors. Licensee MDPI, Basel, Switzerland. This article is an open access article distributed under the terms and conditions of the Creative Commons Attribution (CC BY) license (https://creativecommons.org/licenses/by/4.0/).
Share and Cite
MDPI and ACS Style
Cheng, T.; Li, P.; Ma, J.; Tian, X.; Zhong, N. Identification of Four Chicken Breeds by Hyperspectral Imaging Combined with Chemometrics. Processes 2022, 10, 1484. https://doi.org/10.3390/pr10081484
AMA Style
Cheng T, Li P, Ma J, Tian X, Zhong N. Identification of Four Chicken Breeds by Hyperspectral Imaging Combined with Chemometrics. Processes. 2022; 10(8):1484. https://doi.org/10.3390/pr10081484
Chicago/Turabian StyleCheng, Tiande, Peng Li, Junchao Ma, Xingguo Tian, and Nan Zhong. 2022. "Identification of Four Chicken Breeds by Hyperspectral Imaging Combined with Chemometrics" Processes 10, no. 8: 1484. https://doi.org/10.3390/pr10081484
Note that from the first issue of 2016, this journal uses article numbers instead of page numbers. See further details here.