
CFD-DEM Study of Bridging Mechanism of Particles in Ceramic Membrane Pores under Surface Filtration Conditions


College of Electromechanical Engineering, Qingdao University of Science and Technology, Qingdao 266061, China
*
Authors to whom correspondence should be addressed.
Processes 2022, 10(3), 475; https://doi.org/10.3390/pr10030475
Submission received: 24 January 2022
/
Revised: 20 February 2022
/
Accepted: 23 February 2022
/
Published: 26 February 2022
(This article belongs to the Section Separation Processes)
Abstract
:In the surface filtration process with pores larger than the particle size, the formation of particle bridges plays a crucial role in the filter cake structure and the filtration efficiency throughout the filtration process. First, to understand the microscopic information required for the bridging mechanism, we use the two-way coupling of computational fluid dynamics (CFD)–discrete element method (DEM) to simulate the deposition characteristics of particles in the pores of ceramic membranes. Next, by dynamically observing the deposition morphology and bridging process of particles, the bridging mechanism was revealed at the level of a single hole. Then, we studied the influence of particle concentration and inlet velocity on the bridge erection process. The results show that the bridging function of particles runs through the clean filtration stage and the transition stage. Particle concentration and inlet flow rate have a crucial influence on the formation of particle bridges and filtration efficiency.
1. Introduction
With rapid economic development, especially in the modern industry based on energy consumption, we suffer from air pollution problems [1]. Various high-temperature dusty fumes from industrial manufacturing, coal combustion, vehicle emissions, and waste incineration affect the life of equipment and product quality and cause serious harm to the environment, climate, and public health [2,3,4]. Ceramic membranes have become one of the most effective materials for filtering high-temperature flue gas due to their excellent thermal stability, chemical stability, high mechanical strength, corrosion resistance, and thermal shock resistance [2,5,6,7].
Generally speaking, the flow of smoke dust and other particles in a ceramic membrane is a typical gas–solid two-phase flow [8]. During the filtration process, particles are captured by the ceramic membrane and deposited. Therefore, the whole filtration process is related to gravity settling and inertial impact of particles, interception of membranes and filter cakes, and Brownian diffusion [9,10]. During the initial stages of filtration, most of the particles pass through the filter media, and only a fraction of them are captured by the ceramic membrane, resulting in a slight increase in pressure drop. As the number of deposited particles continues to increase, the deposited particles begin to play a significant role in the particle capture process. Soon, the deposited particles will bridge at the entrance of the filter medium channel so that the particles are blocked and deposited on the surface of the filter medium to form a filter cake, thus entering the filter cake filtration stage. At this time, the filter cake plays an interception role, and the filter medium only supports the filter cake [11]. It can be seen that the bridging process of particles has an essential influence on the initial stage of filter cake filtration, and only after the formation of particle bridges will the particles slowly accumulate to form a filter cake. In addition, the formation of particle bridges determines the filtration efficiency of the entire filtration process to a large extent. However, although the formation of particle bridges plays a crucial role in forming the filter cake and the filtration efficiency throughout the filtration process, little research has been performed on the mechanism of particle bridge formation.
Previous studies on particle bridges have mainly focused on macroscopic parameters that affect the formation of particle bridges, such as particle concentration, particle diameter, physicochemical properties of filter media, and filtration speed [12,13,14,15]. Although the visualization study of micropore blockage brings convenience to the experimental study of particle bridging [16], the process of particle bridging is often completed quickly. Therefore, these detailed resolutions depending on the micron scale of the filter media are challenging to achieve through experiments. Furthermore, for micron-sized particles, the interaction between particles plays a critical role in the process of particle bridging [12]. However, due to the limitations of the existing technology, the experimental results also cannot provide microscopic information on the interaction between particles. Therefore, a method combining the discrete element method with computational fluid dynamics (DEM-CFD) is proposed to describe the dynamics of the particles in a two-phase flow [17,18,19,20].
The CFD-DEM coupling solution method is a novel calculation method that can characterize the actual shape of particles, physical parameters, and the collision process between particles [21]. It can also analyze the interaction between fluid and particles, thus overcoming observation limitations in micro-scale experiments. There are two commonly used CFD-DEM coupling models: the Eulerian–Lagrangian model and Eulerian–Eulerian model. The Eulerian–Lagrangian approach traces each particle trajectory and represents the solid phase as discrete points of the domain, while the liquid phase is simulated as a continuous phase. Therefore, the coupling model ignores the influence of particles on the fluid and belongs to one-way coupling. Qian et al. [1] used the Eulerian–Lagrangian method to study the gas–solid two-phase flow in fiber filter media and analyzed the particle deposition morphology, instantaneous pressure drop, and filtration efficiency. However, the clogging process of the filter cake is not involved. The Eulerian–Eulerian model, also known as the two-fluid model (TFM), treats particle–fluid dynamic behavior as a continuum on a macro level by averaging the physics across many particles. Therefore, the Eulerian–Eulerian model considers the momentum exchange between the liquid and solid phases and considers the effect of particles on the liquid phase, which is a two-way coupling between the solid and liquid phases. Therefore, the CFD-DEM gas-solid two-phase coupling method is ideal for finding out the formation mechanism of filter cake. Deshpande et al. [22,23] simulated the flow characteristics of particles in a packed bed by the CFD-DEM bidirectional coupling method. They studied the influence of monodisperse and monodisperse spherical particles on the filter cake during filtration under different flow conditions and the complex interdependence of particle sphericity, porosity, and pressure drop of filter cake with various fluid conditions. Puderbach et al. [24], based on CFD-DEM coupling technology, numerically simulated the microscopic deposition process between polydisperse particles in the early stage of filter cake formation. The developed four-way coupling allows a detailed understanding of the micromechanics of cake formation and interaction between particles. The filter media and filter cake resistance simulated by filter cake are in good agreement with the experimental results of the pressing shell. Comparing three-dimensional simulation and empirical research shows that analytical CFD-DEM coupling has excellent potential in analyzing and optimizing the filter cake filtration process. Tao et al. [20] used the CFD-DEM coupling method to simulate the migration and deposition behavior of particles on the fiber membrane and described the formation process and mechanism of particle bridges on the fiber membrane in detail. Additionally, Hund et al. [25] used the method of CFD-DEM coupling to describe the formation mechanism of particle bridges in the process of solid–liquid separation and studied the time variation of particle deposition bridges under different particle concentrations and feed flow rates. The simulation results are compared with the theoretical calculation model and previous experimental results, and the accuracy of the simulation results is verified.
In this project, we established a three-dimensional model of the ceramic membrane pores and used the CFD-DEM bidirectional coupling method to simulate the bridging mechanism of particles in the ceramic membrane pores, considering adhesion force. Additionally, we measured macroscopic parameters such as pressure drop and filtration efficiency and provided the microscopic information needed to understand the bridging mechanism. The main work includes the following aspects. (1) The filtering process and CFD-DEM bidirectional coupling method are briefly introduced. (2) The calculation models of particle movement and gas flow are given, and the calculation settings, including boundary and initial conditions, are given. (3) The bridging process of particles and the microstructure of filter cake are analyzed in detail, and the effects of particle concentration and inlet flow rate on the bridging process are discussed.
2. Model and Methods
2.1. Numerical Models
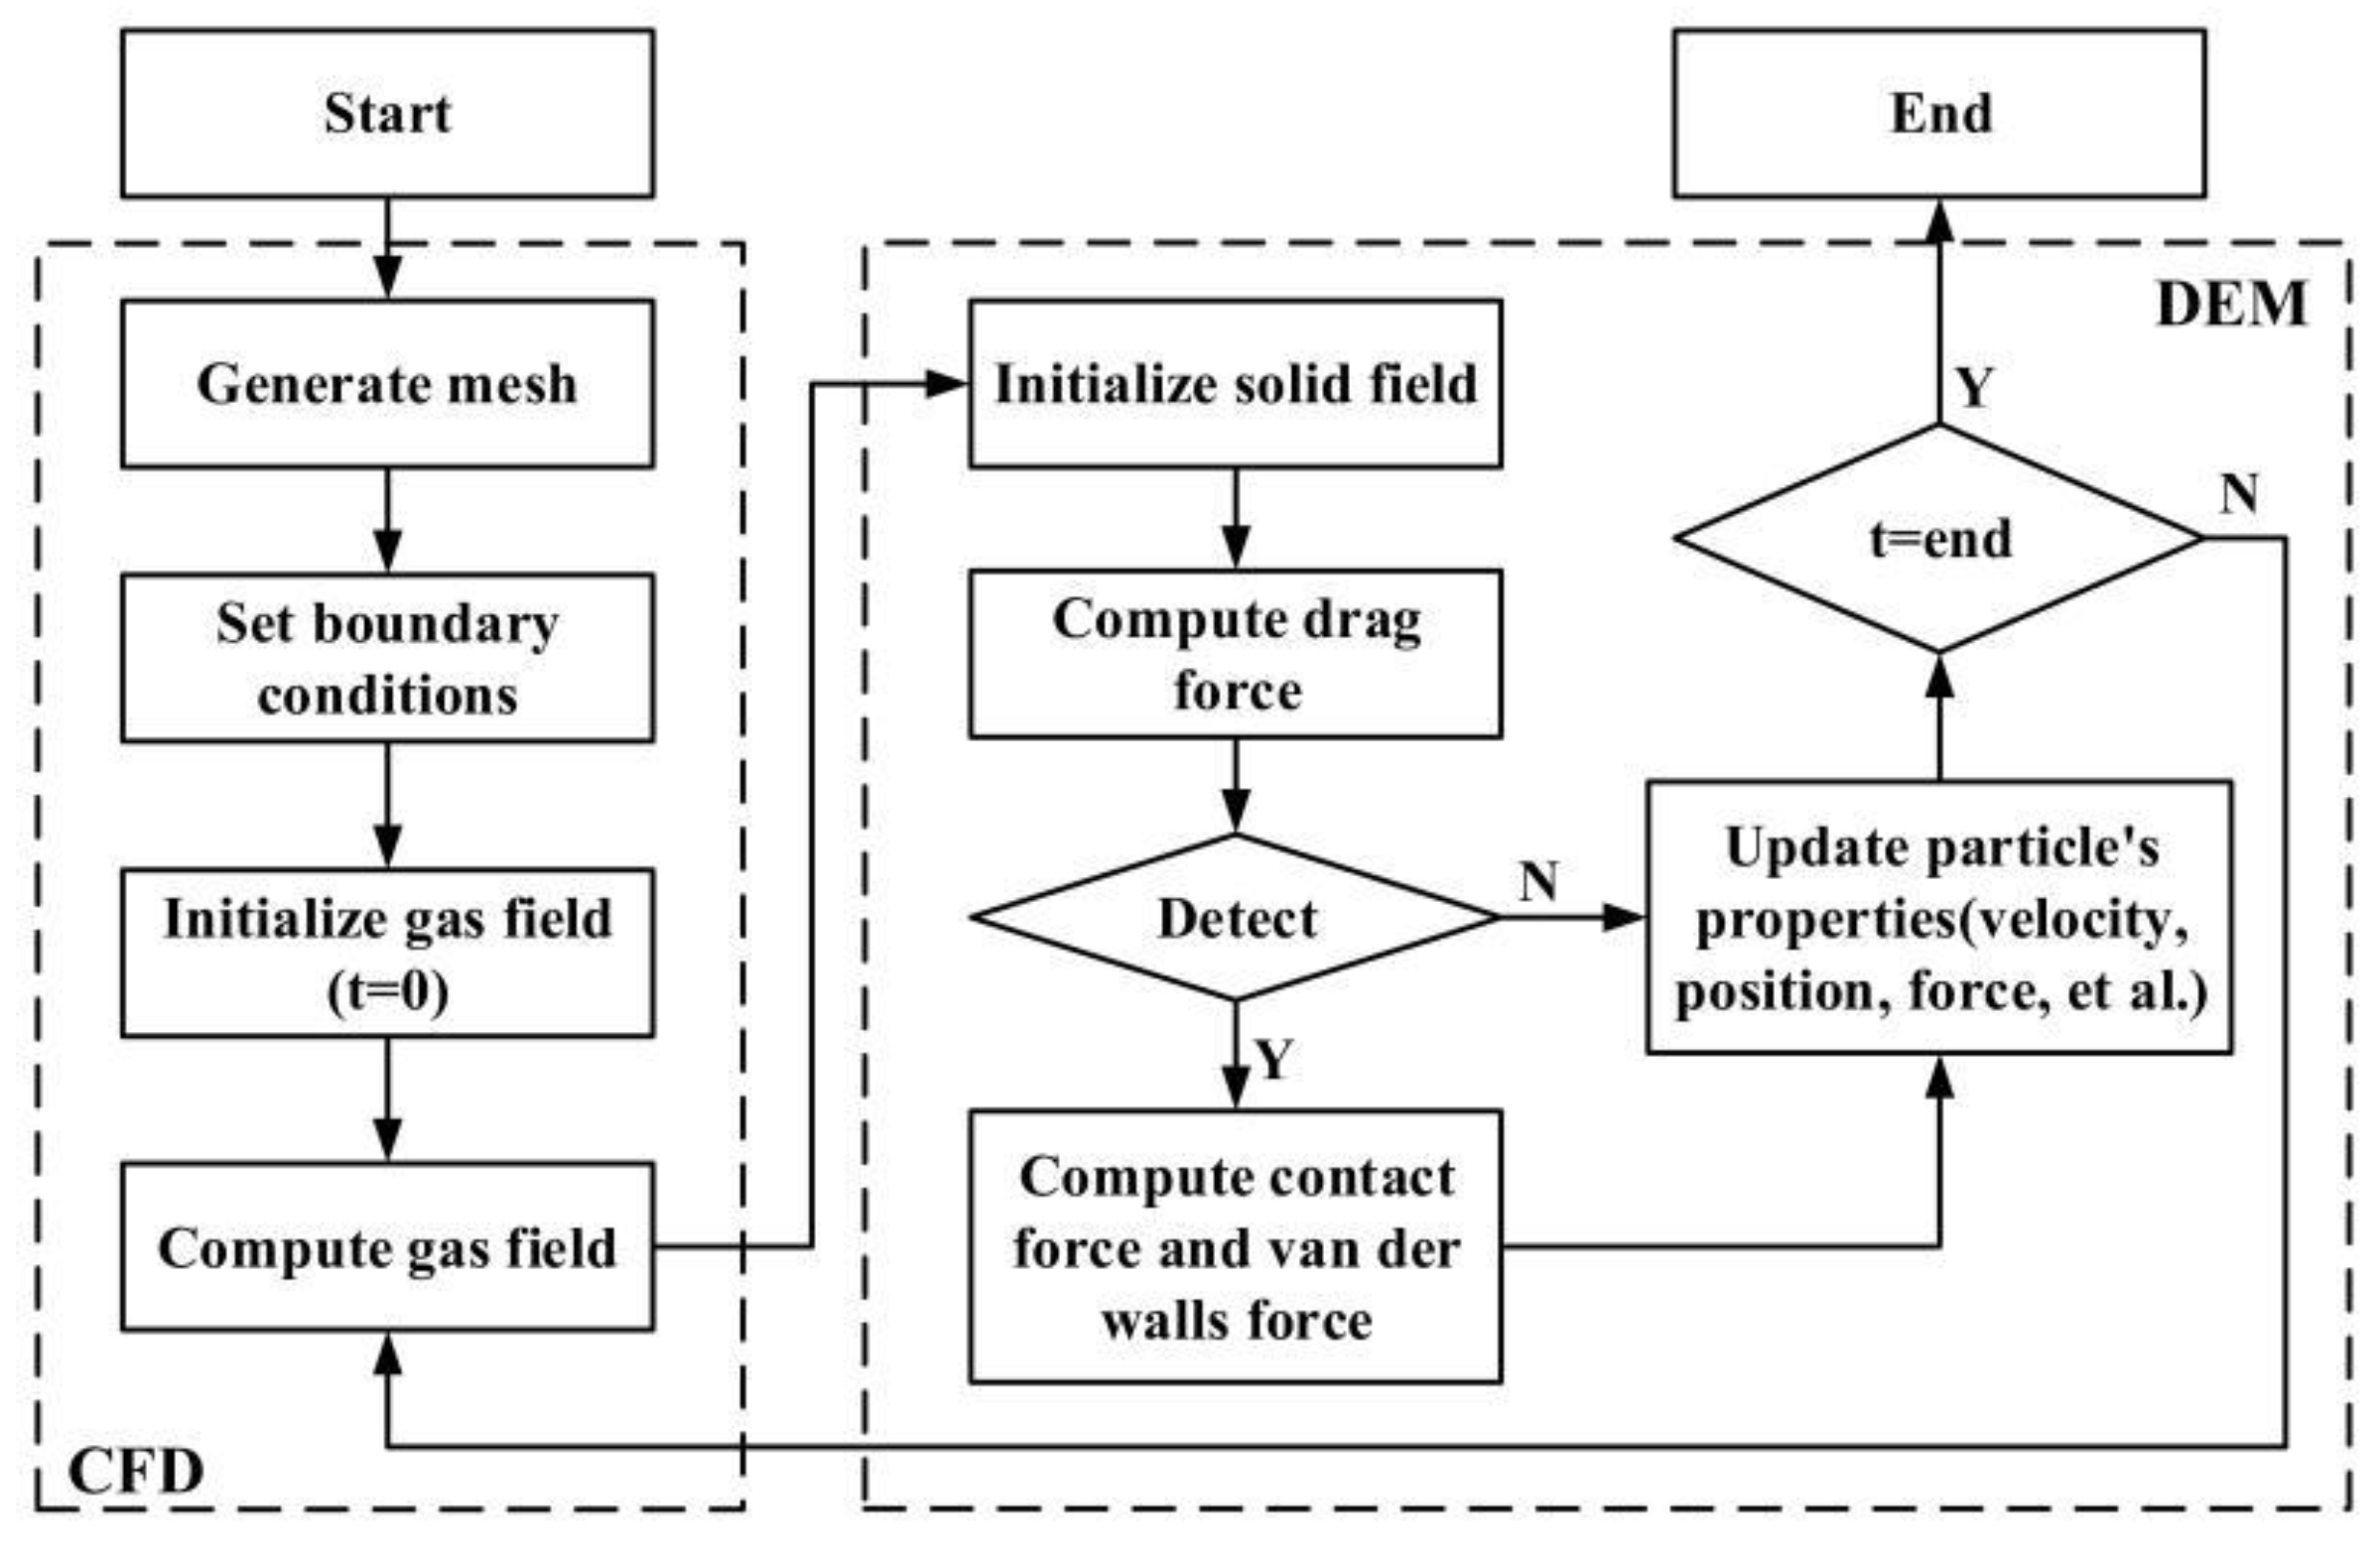
This project used the Eulerian–Eulerian model to simulate the bridging process of particles in the ceramic membrane. The Euler–Euler model considered the momentum exchange between gas and particles and the two-phase coupling between particles and gas. In the coupling process, the Navier–Stokes equation described the gas motion, while Newton’s second law obtained the motion of particles, and Newton’s third law realized the coupling between them. The flowchart of coupling is shown in Figure 1.
2.1.1. Fluid Phase Equation
In the Eulerian model, considering the influence of particles on fluid, a different volume fraction phase (grid cell porosity) is introduced into the Navier–Stokes equation to realize the two-phase coupling of fluid to particle and particle to fluid. The continuity equation and momentum equation of the fluid phase are, respectively, expressed as follows [19,26]:
where is the fluid viscosity, ; is the fluid velocity, m/s; is the fluid density, kg/m3; is the sum of the fluid resistance; is the force acting on the grid cell volume, N; and is the grid cell volume, m3.
2.1.2. Particle Phase Equation
Newton’s second law solves the particle phase motion, and the particle motion equation is [27]:
where is the particle mass, kg; is the particle velocity, m/s; is the moment of inertia of the particle, kg·m2; is the particle rotational speed, rad/s; and is the particle collision torque, N·m.
The fluid drag force on the particles is calculated by Equation (6) [28,29]:
where is the fluid drag force on the particle, N; is the projected area of the particle, m2; and is the drag force coefficient, which depends on the Reynolds number , which can be calculated by Equation (7).
is the sum of the gravity and buoyancy of the particles, which can be calculated by Equation (8):
where is the sum of the gravity and buoyancy of the particles, N; and is the particle density, kg/m3.
is the virtual mass force that cannot be omitted in the simulation of gas–solid two-phase flow [27,30], which can be calculated by Equation (9):
where is the virtual mass force, N; and is the virtual mass factor, the default value is 0.5.
is the pressure gradient force caused by the pressure gradient when the particles move in the flow field [31], and its expression is:
where is the pressure gradient force, N. When particles are in a high-velocity fluid, the high velocity gradient creates a pressure difference across the particle surface, which generates lift. The Saffman lift [32] () can be calculated by Equation (11):
where is the Saffman lift, N; is the particle diameter, m; and is the fluid rotation velocity which is given by:
is a kind of lift [33] due to the rotation of particles in the flow field, which can be calculated by Equation (13):
where the Magnus lift force coefficient can be calculated, which allows an extension of this lift force to higher particle Reynolds numbers [34]:
where is the Reynolds number of particle rotation and is given by:
where is the Reynolds number of the particle for the Saffman lift force. This Reynolds number is given by:
is the contact force between particles, and its expression is [27]:
where is the normal force acting on the particle after particle collision, is the tangential force acting on the particle after particle collision, and its expressions are:
where is the equivalent elastic modulus, Pa; is Poisson’s ratio; is the equivalent contact radius, m; is the normal displacement, m; is the tangential displacement, m; and is the equivalent shear modulus, Pa.
In addition, considering the surface energy effect of materials and the influence of van der Waals force in the contact area, the JKR model is selected between particles and between particles and ceramic membrane to describe the adhesion between materials accurately. The contact stress of particle is defined by the overlap and surface energy as follows [35,36]:
where is the particle collision force, N; is equivalent Young’s modulus, Pa; is the equivalent radius, m; is the surface energy, J/m2; and is the contact radius, m.
2.2. Geometry and Computational Domain
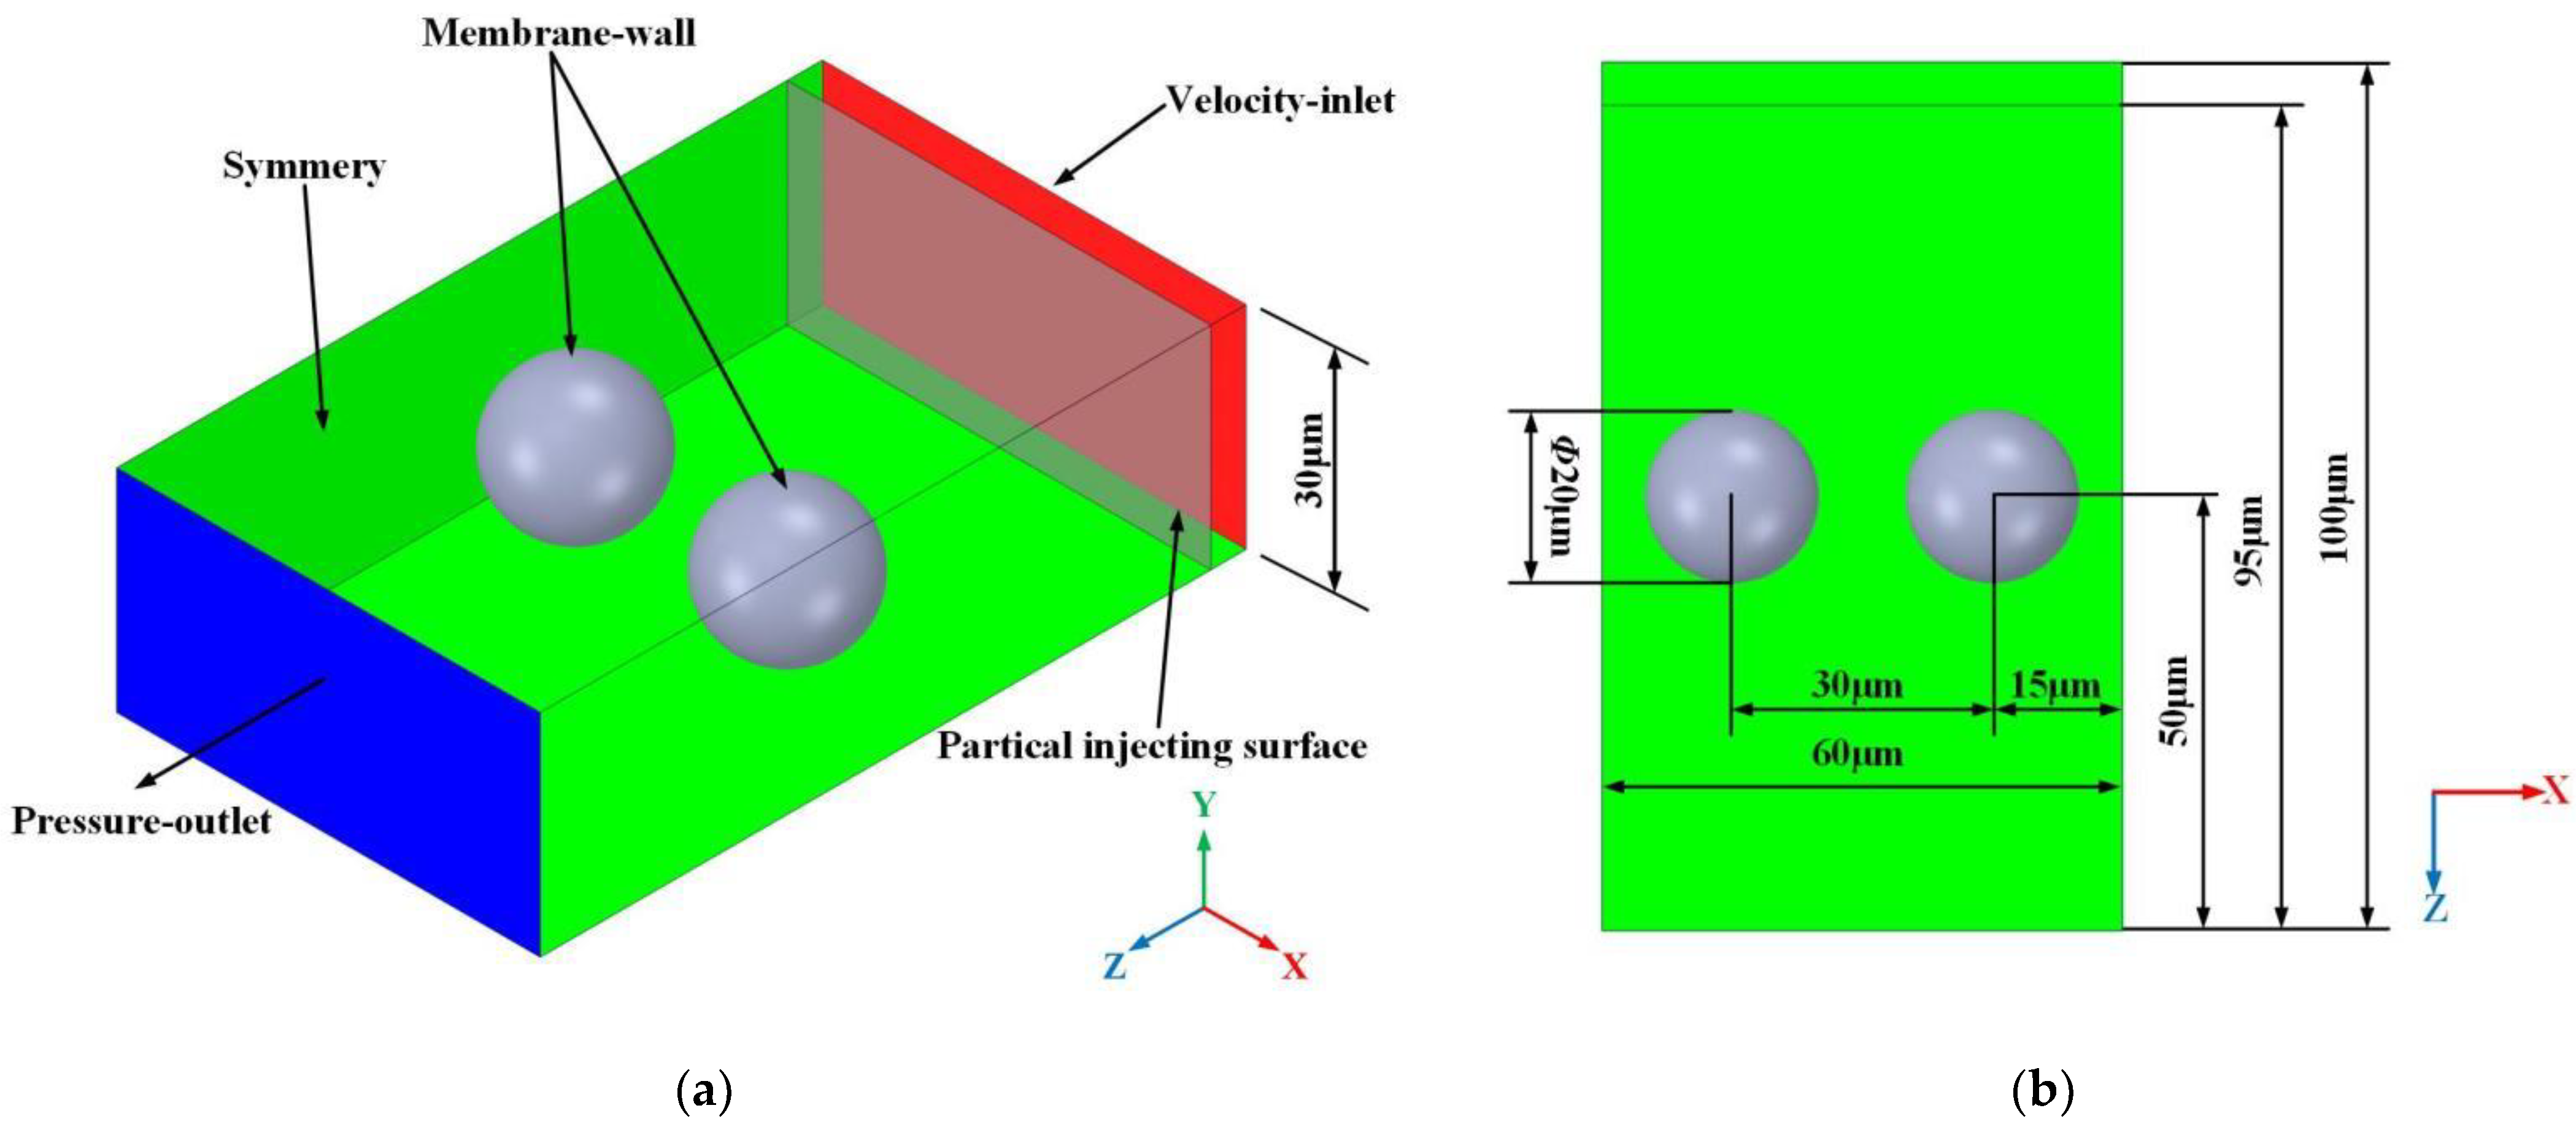
Figure 2 is a schematic diagram of the structure of the ceramic membrane pores and the size of the computational domain. To study the bridging process of particles in ceramic membrane pores, two ceramic particle balls of diameter 20 μm were used to construct ceramic membrane pores. The modeling method is analogous to the suspended particle method in the preparation method of porous ceramic membrane [37]. From the real microscopic morphology of the ceramic membrane, it can be seen that the filter channel is formed by the accumulation of ceramic particle balls with shapes similar to spheres. Therefore, the ceramic membrane model under a single pore used is also simplified according to the actual morphology of the ceramic membrane. Since spherical particles have high computational efficiency for simple contact, we use spherical particles to simplify ceramic particle balls [38]. At this time, it is necessary to artificially increase the rolling friction coefficient of spherical particles to show some characteristics of non-spherical particles [39]. In addition, the diameter of ceramic particle balls is selected according to the size of suspended particles commonly used in the preparation of a microfiltration membrane. In contrast, the distance between two ceramic particle balls is determined according to the actual pore size of the ceramic membrane used in high-temperature dusty flue gas treatment. The computational domain of the gas phase is set in the range of , , . To enable the generated particles to fully enter the flow field, the particle generation surface is placed behind the gas inlet. Therefore, the computational domain of the discrete phase is set in the ranges of , , and In addition, to ensure uniform inlet velocity of particles and prevent the back-flow phenomenon in the simulation process, the calculation domain size was lengthened along the fluid flow direction in the simulation model.
2.3. Boundary Conditions and Parameter Settings
Coupling EDEM 2020 and Fluent 2020R2 were used to calculate particles movement and fluid field based on UDF (User-Defined Function). In the coupling process, the gas inlet adopts a velocity inlet, and the outlet adopts a pressure outlet. According to the characteristics of the filter medium, the surface of the ceramic particle sphere is set as a no-slip boundary condition. At the same time, to eliminate the influence of boundary on the gas flow, the boundary on the side of the computational domain is set as the symmetric boundary condition. When the gas-phase calculation converges, particles begin to be generated from the particle generation surface (i.e., the particle injection surface) and enter the discrete domain driven by the airflow. As the calculation progresses, the particles not captured passing through the membrane pores will flow out from the gas outlet and not save the attributes (velocities, positions, interaction forces) of these particles in the DEM model. The computational parameters in the simulation are shown in Table 1 and Table 2.
3. Results and Discussion
3.1. Bridging Process
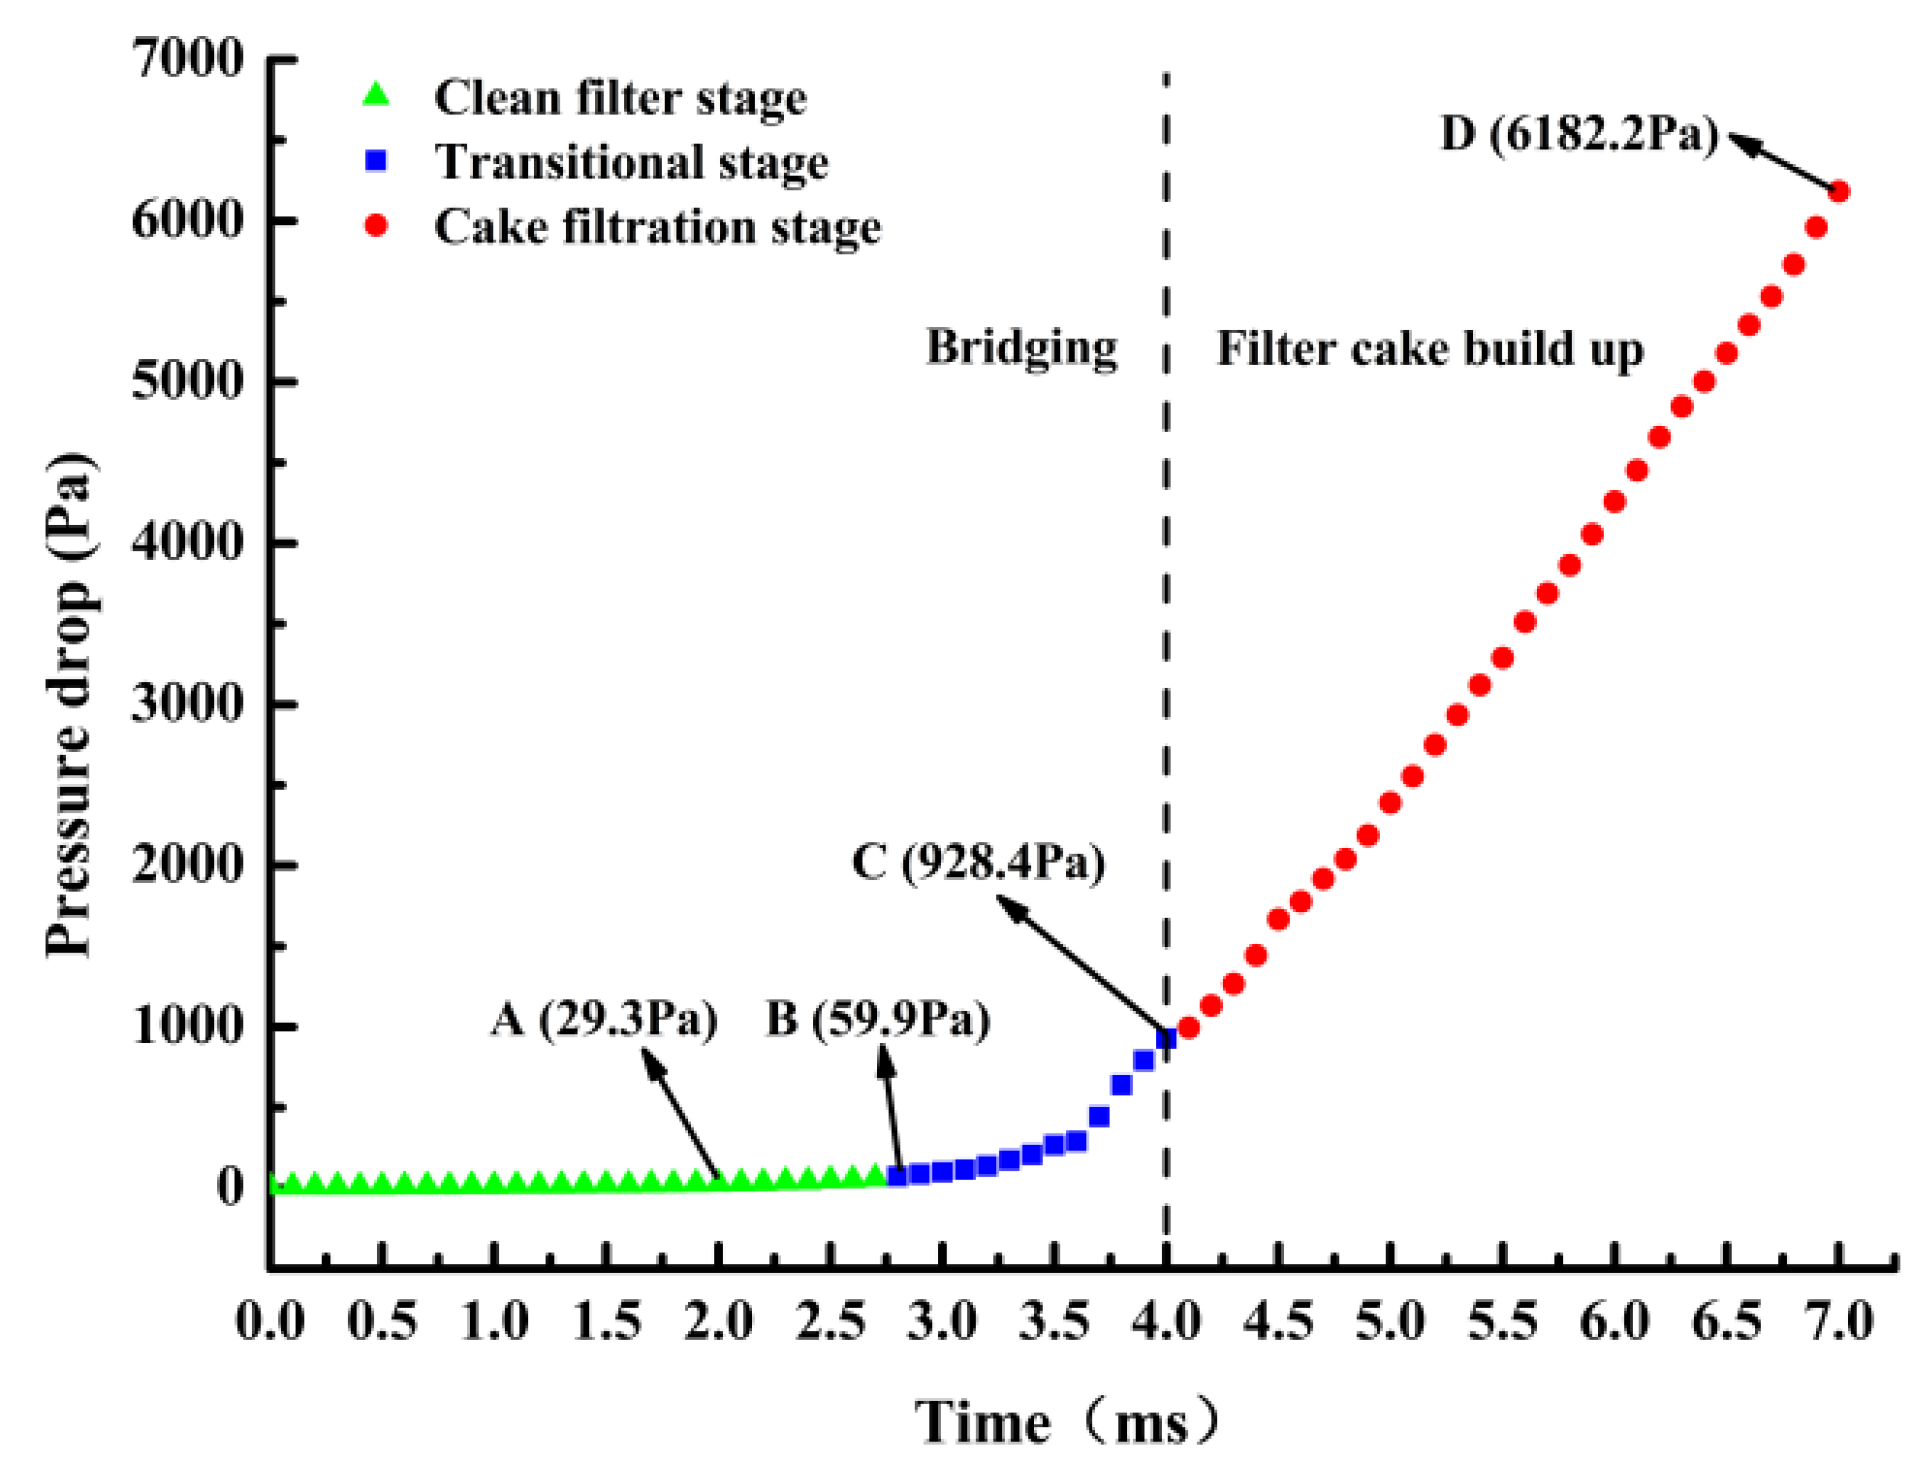
The bridging process of particles is very complicated, and many factors need to be considered. Therefore, the collision and adhesion of particle–particle, particle–membrane, and the interaction between particles and fluids are fully considered. The bridging process of particles was studied under the conditions of an inlet velocity and a suspension concentration . Figure 3 shows a typical relationship between pressure drop and filtration time. It can see in Figure 3, according to the rising rate of the pressure drop, that the whole filtration process can be divided into three different stages: clean filtration stage, transition stage, and cake filtration stage [20]. The particle bridging process runs through all cleaning filtration stages and the transition stages.
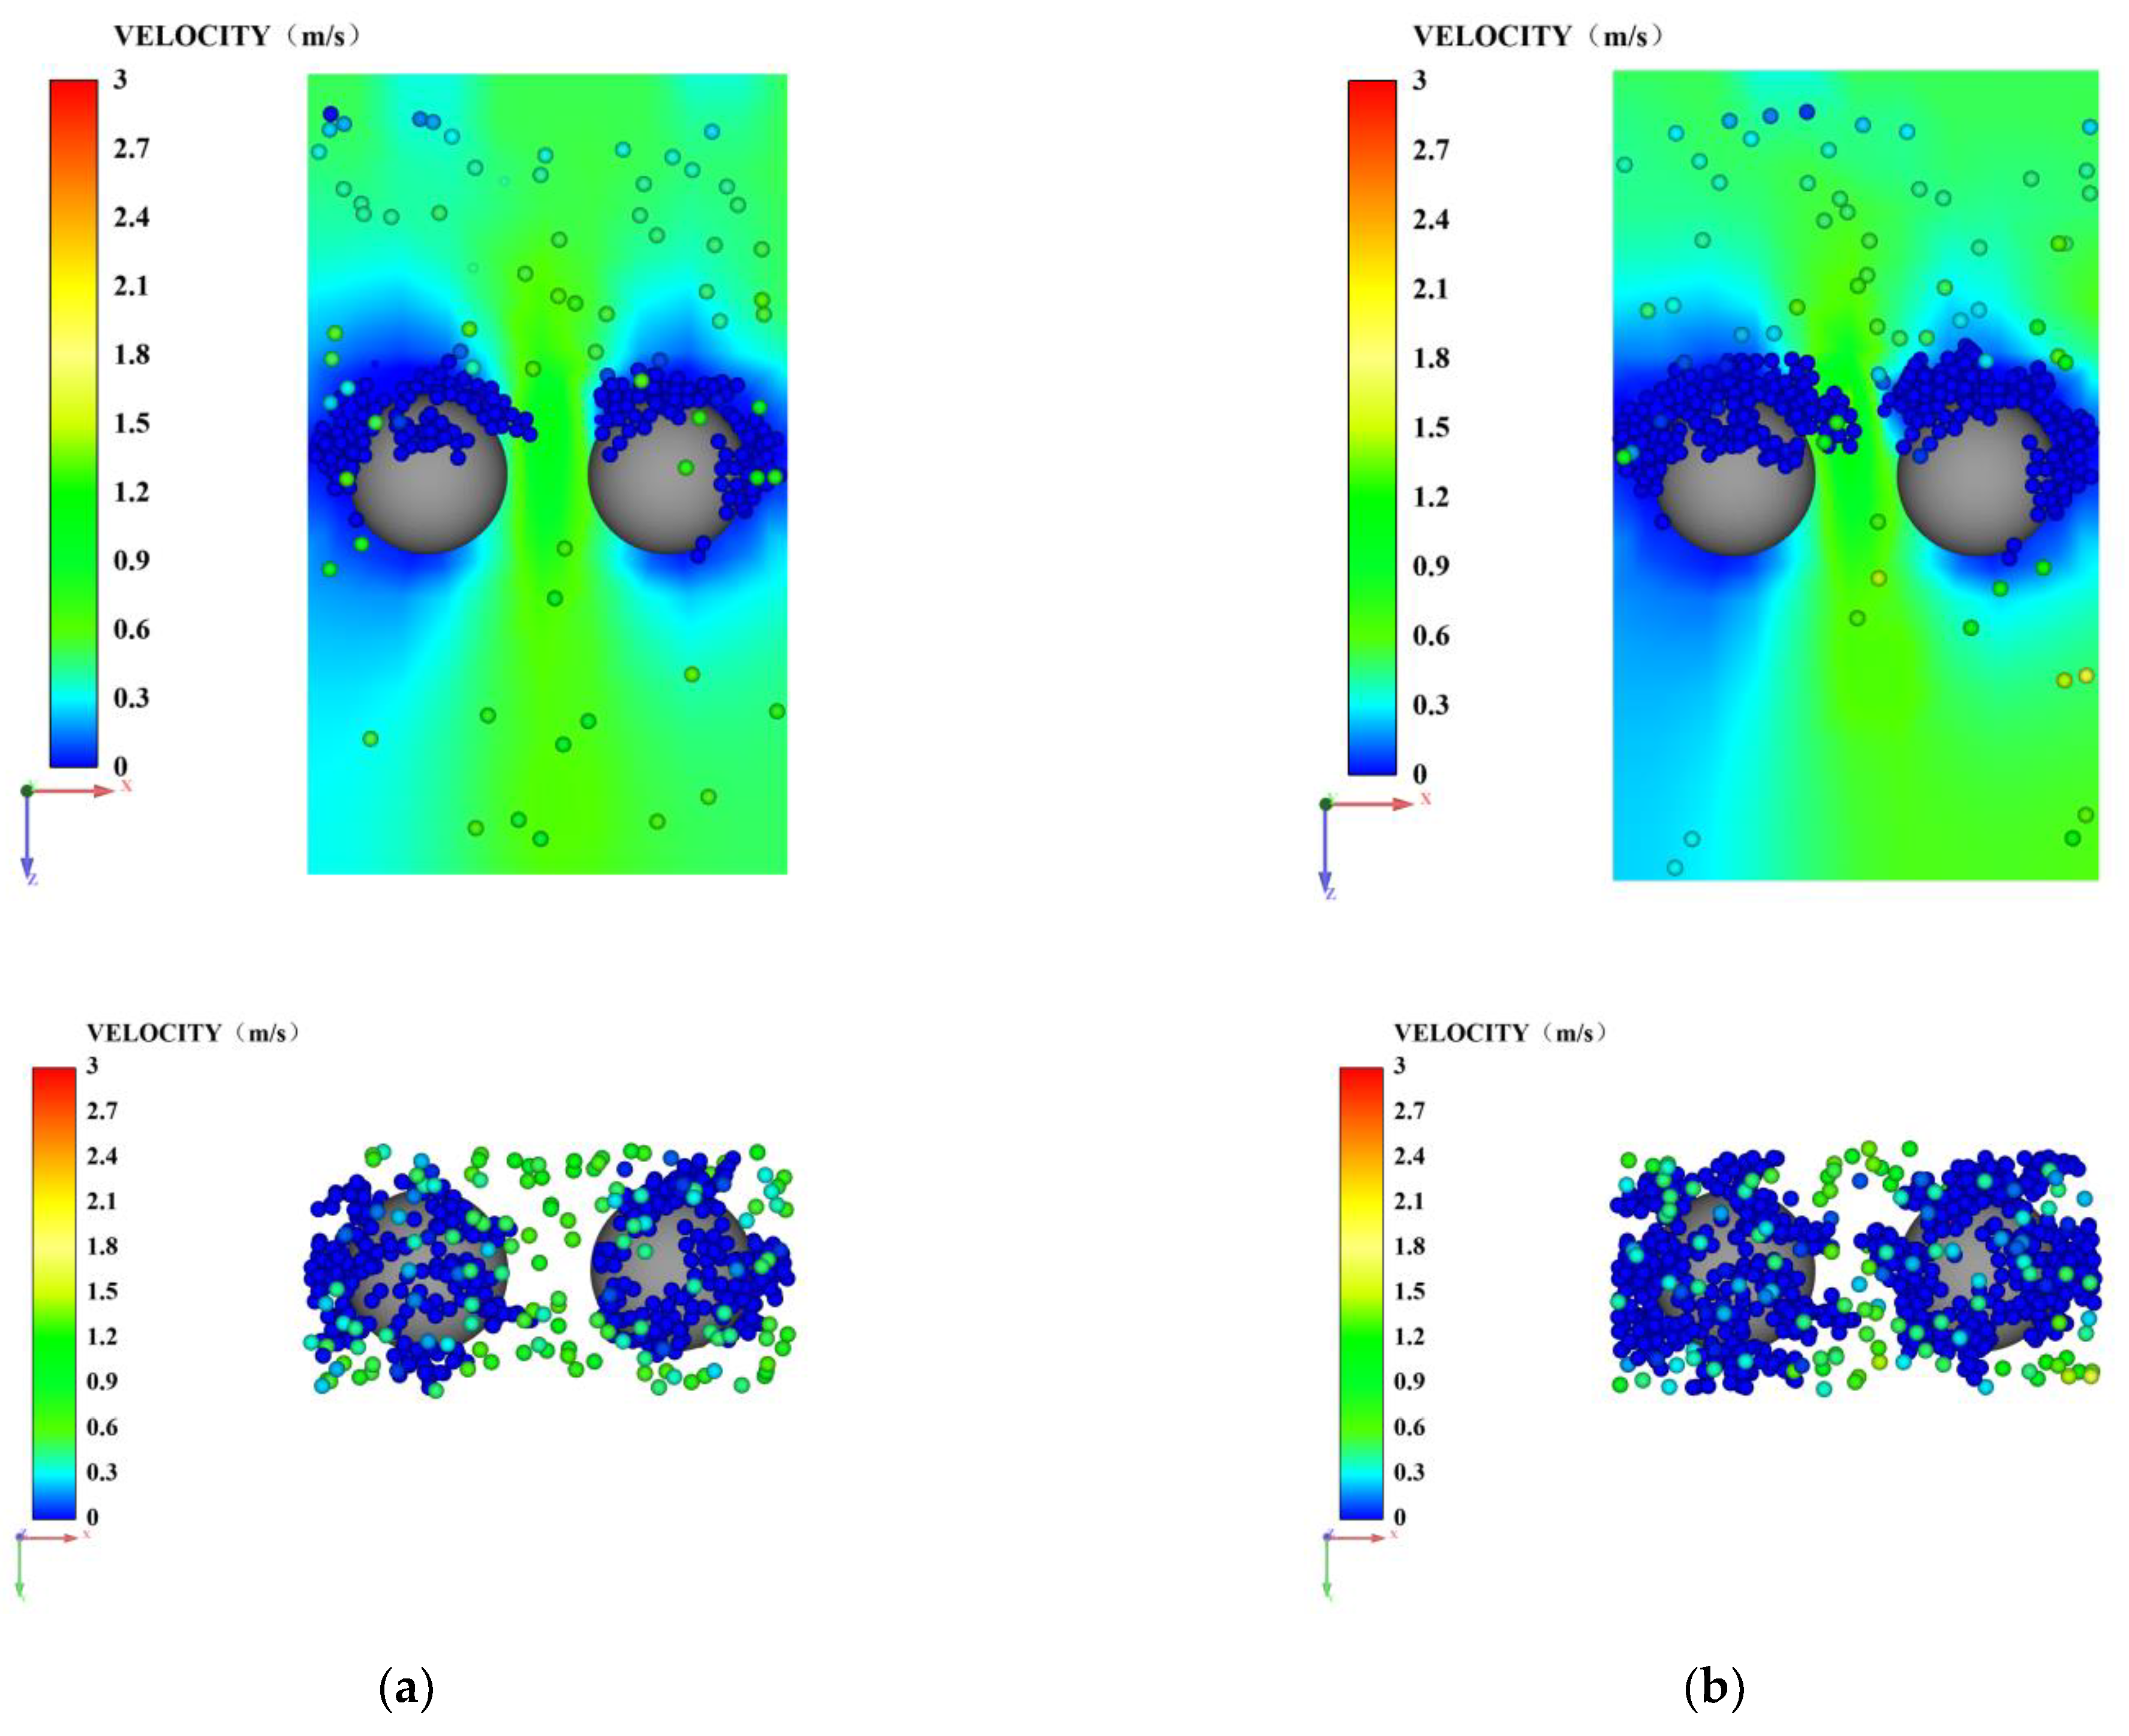
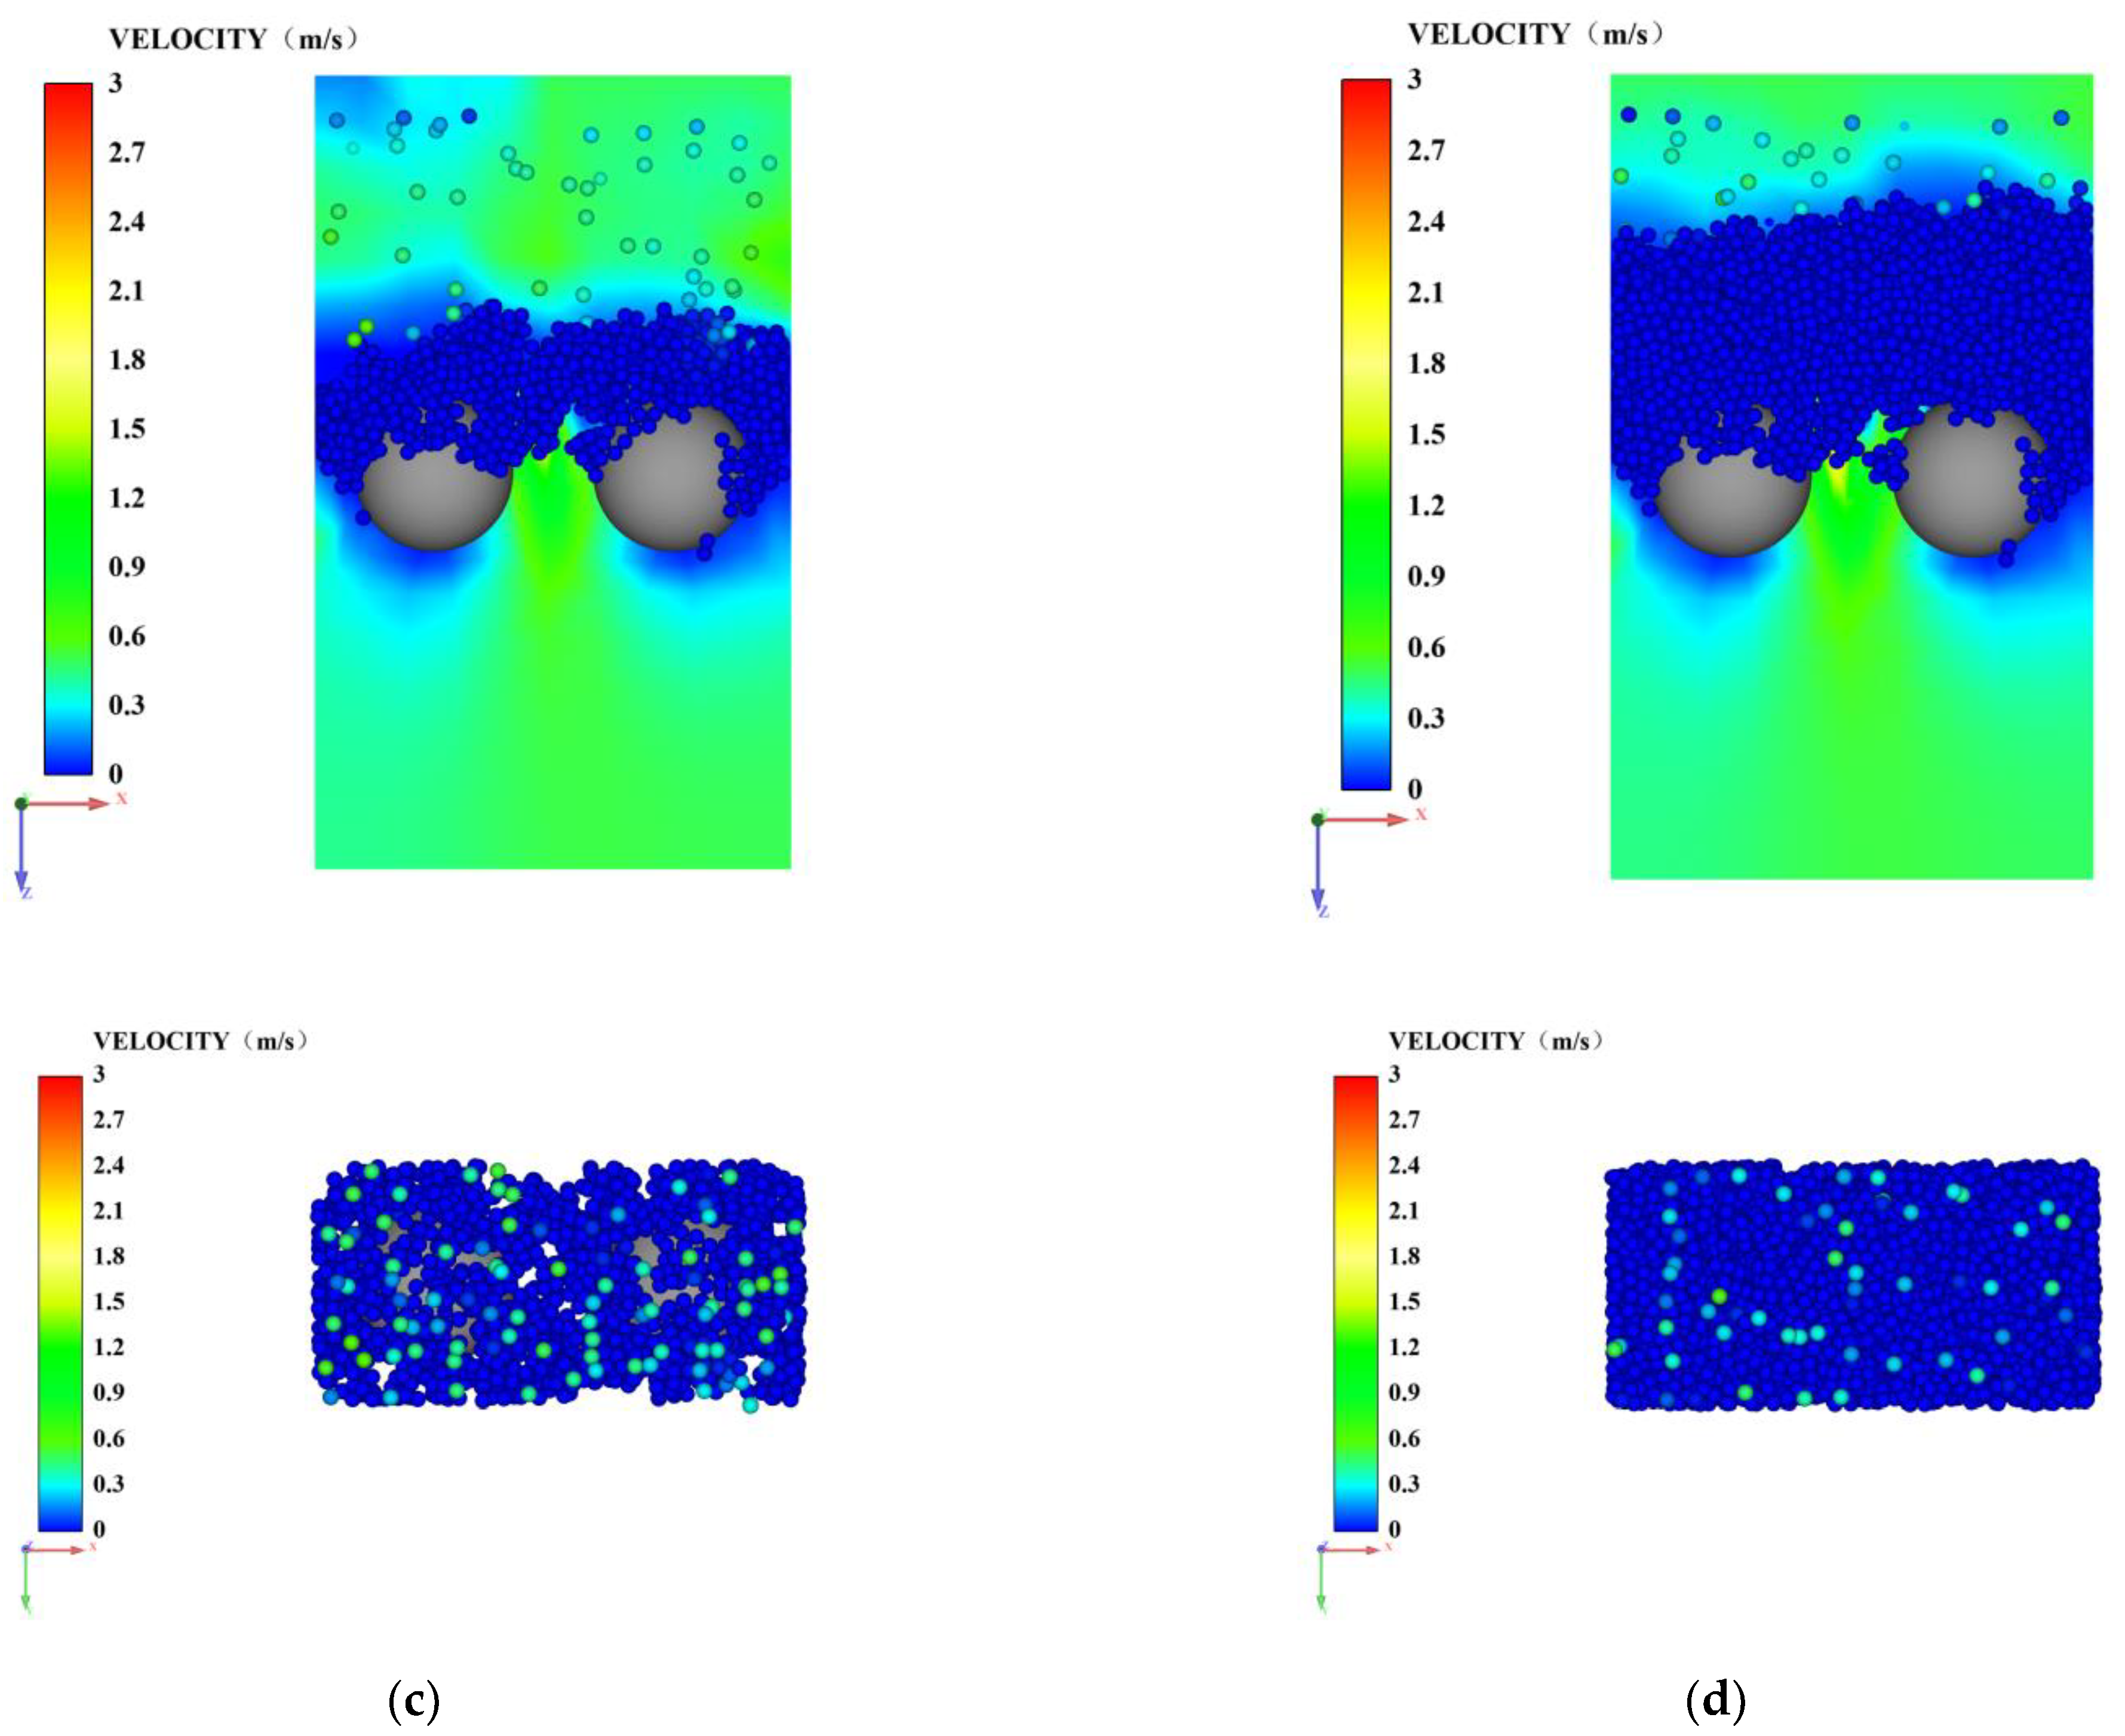
In the cleaning filtration stage (before point B), the particles gradually reach around the ceramic membrane under the action of the fluid. A few particles are directly captured by the adhesion of the membrane surface due to contact with the membrane surface, while most particles pass through the membrane pores and flow out of the calculation domain with the fluid. Because the capture efficiency of particles is relatively low in the cleaning filtering stage, the pressure drop increases slowly. Point A in Figure 4 shows the deposition morphology of the particles on the ceramic membrane, and the particles are almost uniformly deposited on the membrane surface, without affecting the opening degree of membrane pores due to the deposition of the particles, which further explains the reason why the pressure drop slowly rises.
The deposited particles began to play a significant role in the capture process with the filtration process. At this time, the particles were captured by the ceramic membrane and were deposited. As particles entered the transition stage (B–C) from the cleaning filtering stage, the morphology of the deposited particles changed significantly. Point B in Figure 4 shows that the deposits on both sides began to extend into the membrane pores to form dendritic structures. The dendritic structure extended with the continuous deposition of particles, until it connected into a bridge in the membrane pores. It can be seen from point C in Figure 4 that at this time, the membrane pores are entirely closed, and the particles can no longer pass through the membrane pores and deposit on the particle bridge to generate filter cake and then enter the filter cake filtration stage. In the filter cake filtration stage (C–D), the filter cake played the role of interception, and the ceramic membrane only supported the filter cake. The pressure difference increases linearly with time because the membrane pores were completely closed, and no particles could pass through the pores.
Our results were compared with the research results of Tao et al. [20] on the bridging mechanism of particles on a fiber membrane under a single pore to verify the accuracy of the model proposed in this paper. Tao et al. believe that the filtration process can be divided into three stages according to the rising pressure drop rate: clean filtration stage, transition stage, and filter cake stage. In the clean filtration stage, each fiber works independently, except for being affected by other fibers through the variation of the flow field due to the two-way interactions between fluid and particles or a fiber. In the transition stage, the deposits on the two fibers start to become connected. Despite the short duration, this stage reveals essential changes in particle capture mechanisms. The particle chains on the fore side of fibers repeatedly lodged down into the gap between fibers to form bridges, which significantly enhanced the particle capture efficiency. At the end of this stage, a clogged state with almost impossible penetration of newly incoming particles through the pore was reached. Then, the deposited particles began to grow into filter cakes in the filter cake stage, and the pressure drop began to increase linearly. This is consistent with the characteristics of different filtration stages in the ceramic membrane filtration process. Thus, it is proved that the research results of the bridging process using this model are accurate.
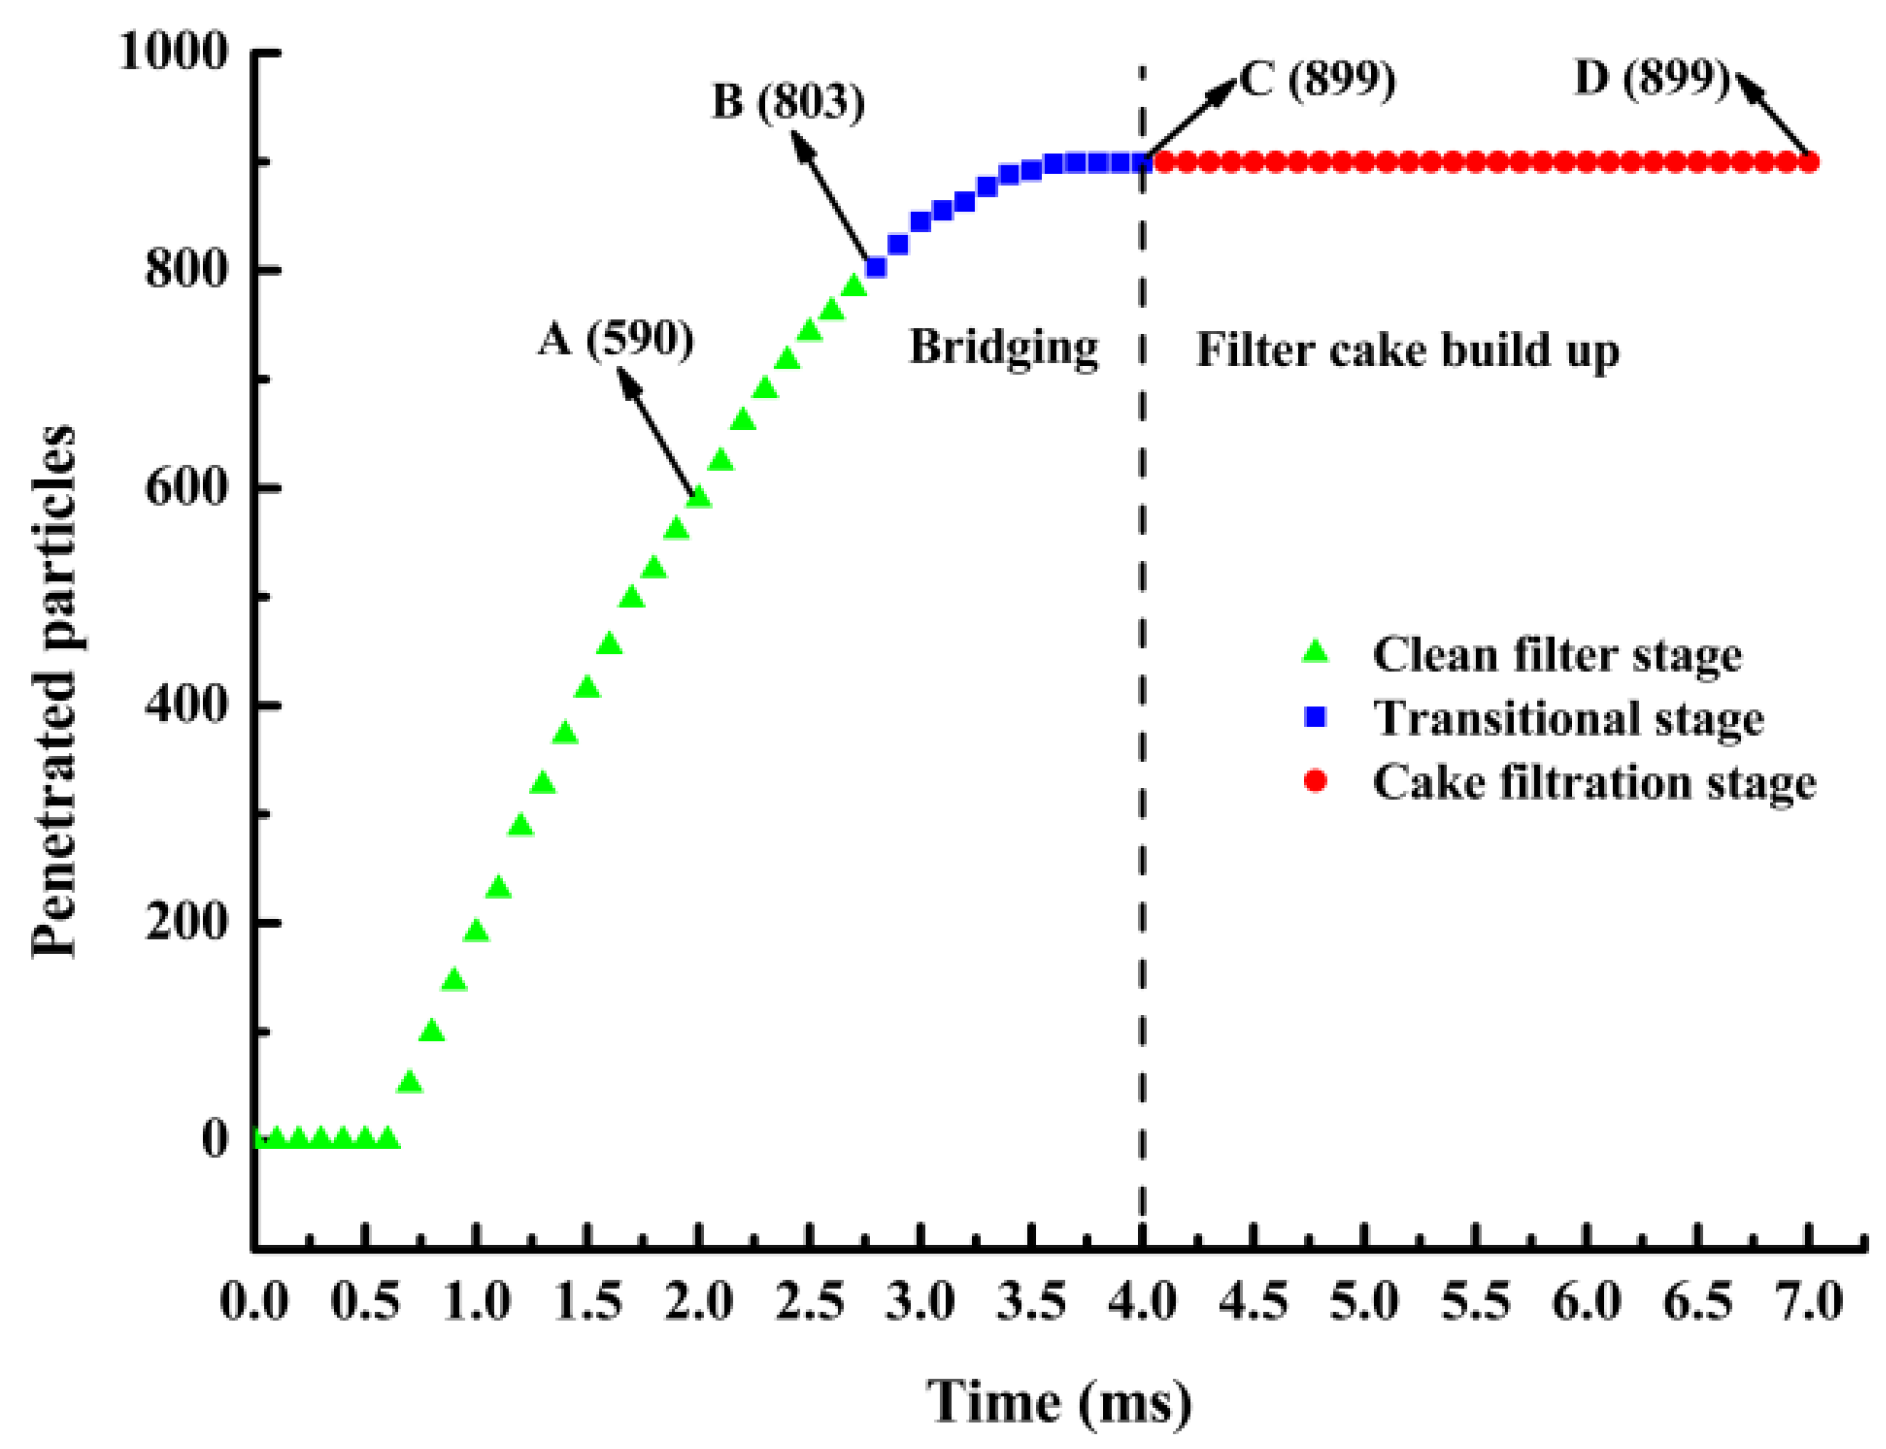
Looking back at the whole filtration process, we can find that the bridging time of the particles is concise, but it plays a vital role in the whole filtration process. Figure 5 presents the curve of the cumulative number of particles passing through with time. Particle injection started at t = 0.5 ms. In the cleaning filtration stage, most particles can pass through the pores due to the opening of the membrane pores, and the number of particles passing through the pores increases significantly. However, with the formation of particle bridges, more and more particles are trapped. Until t = 4.0 ms, the particle bridge is completely formed, and no particles can pass through the pores after the filter cake filtering stage. A total of 4666 particles were captured in the whole filtration process, but only 197 particles were directly captured by the membrane, accounting for only 4.2% of the total number of captured particles. The results further show that the formation of particle bridges plays a crucial role in the filtration efficiency of the whole filtration process.
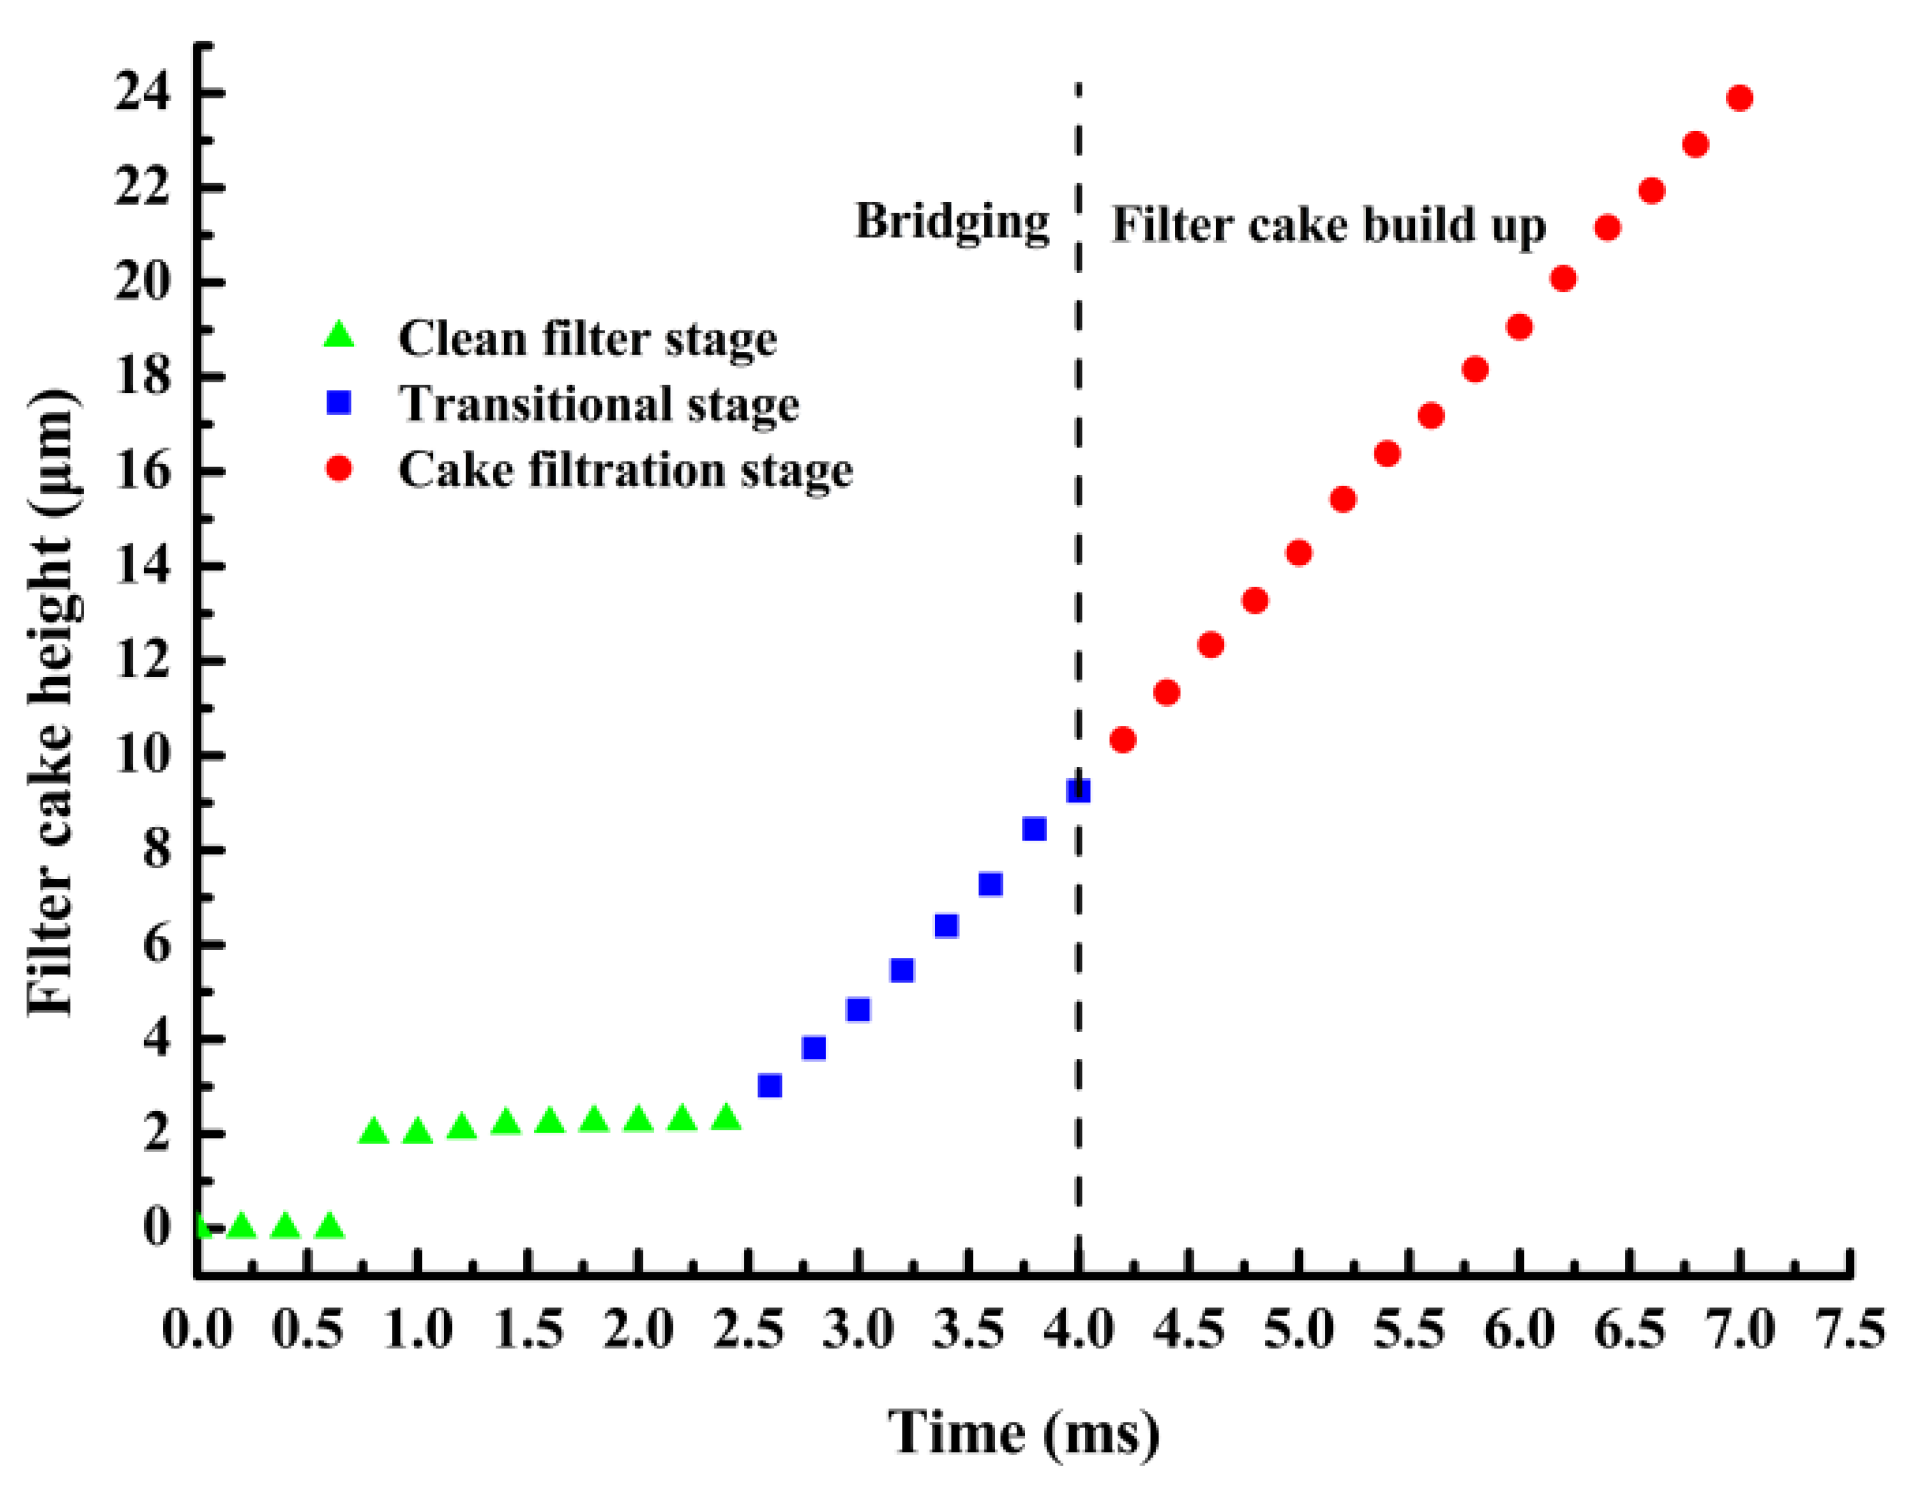
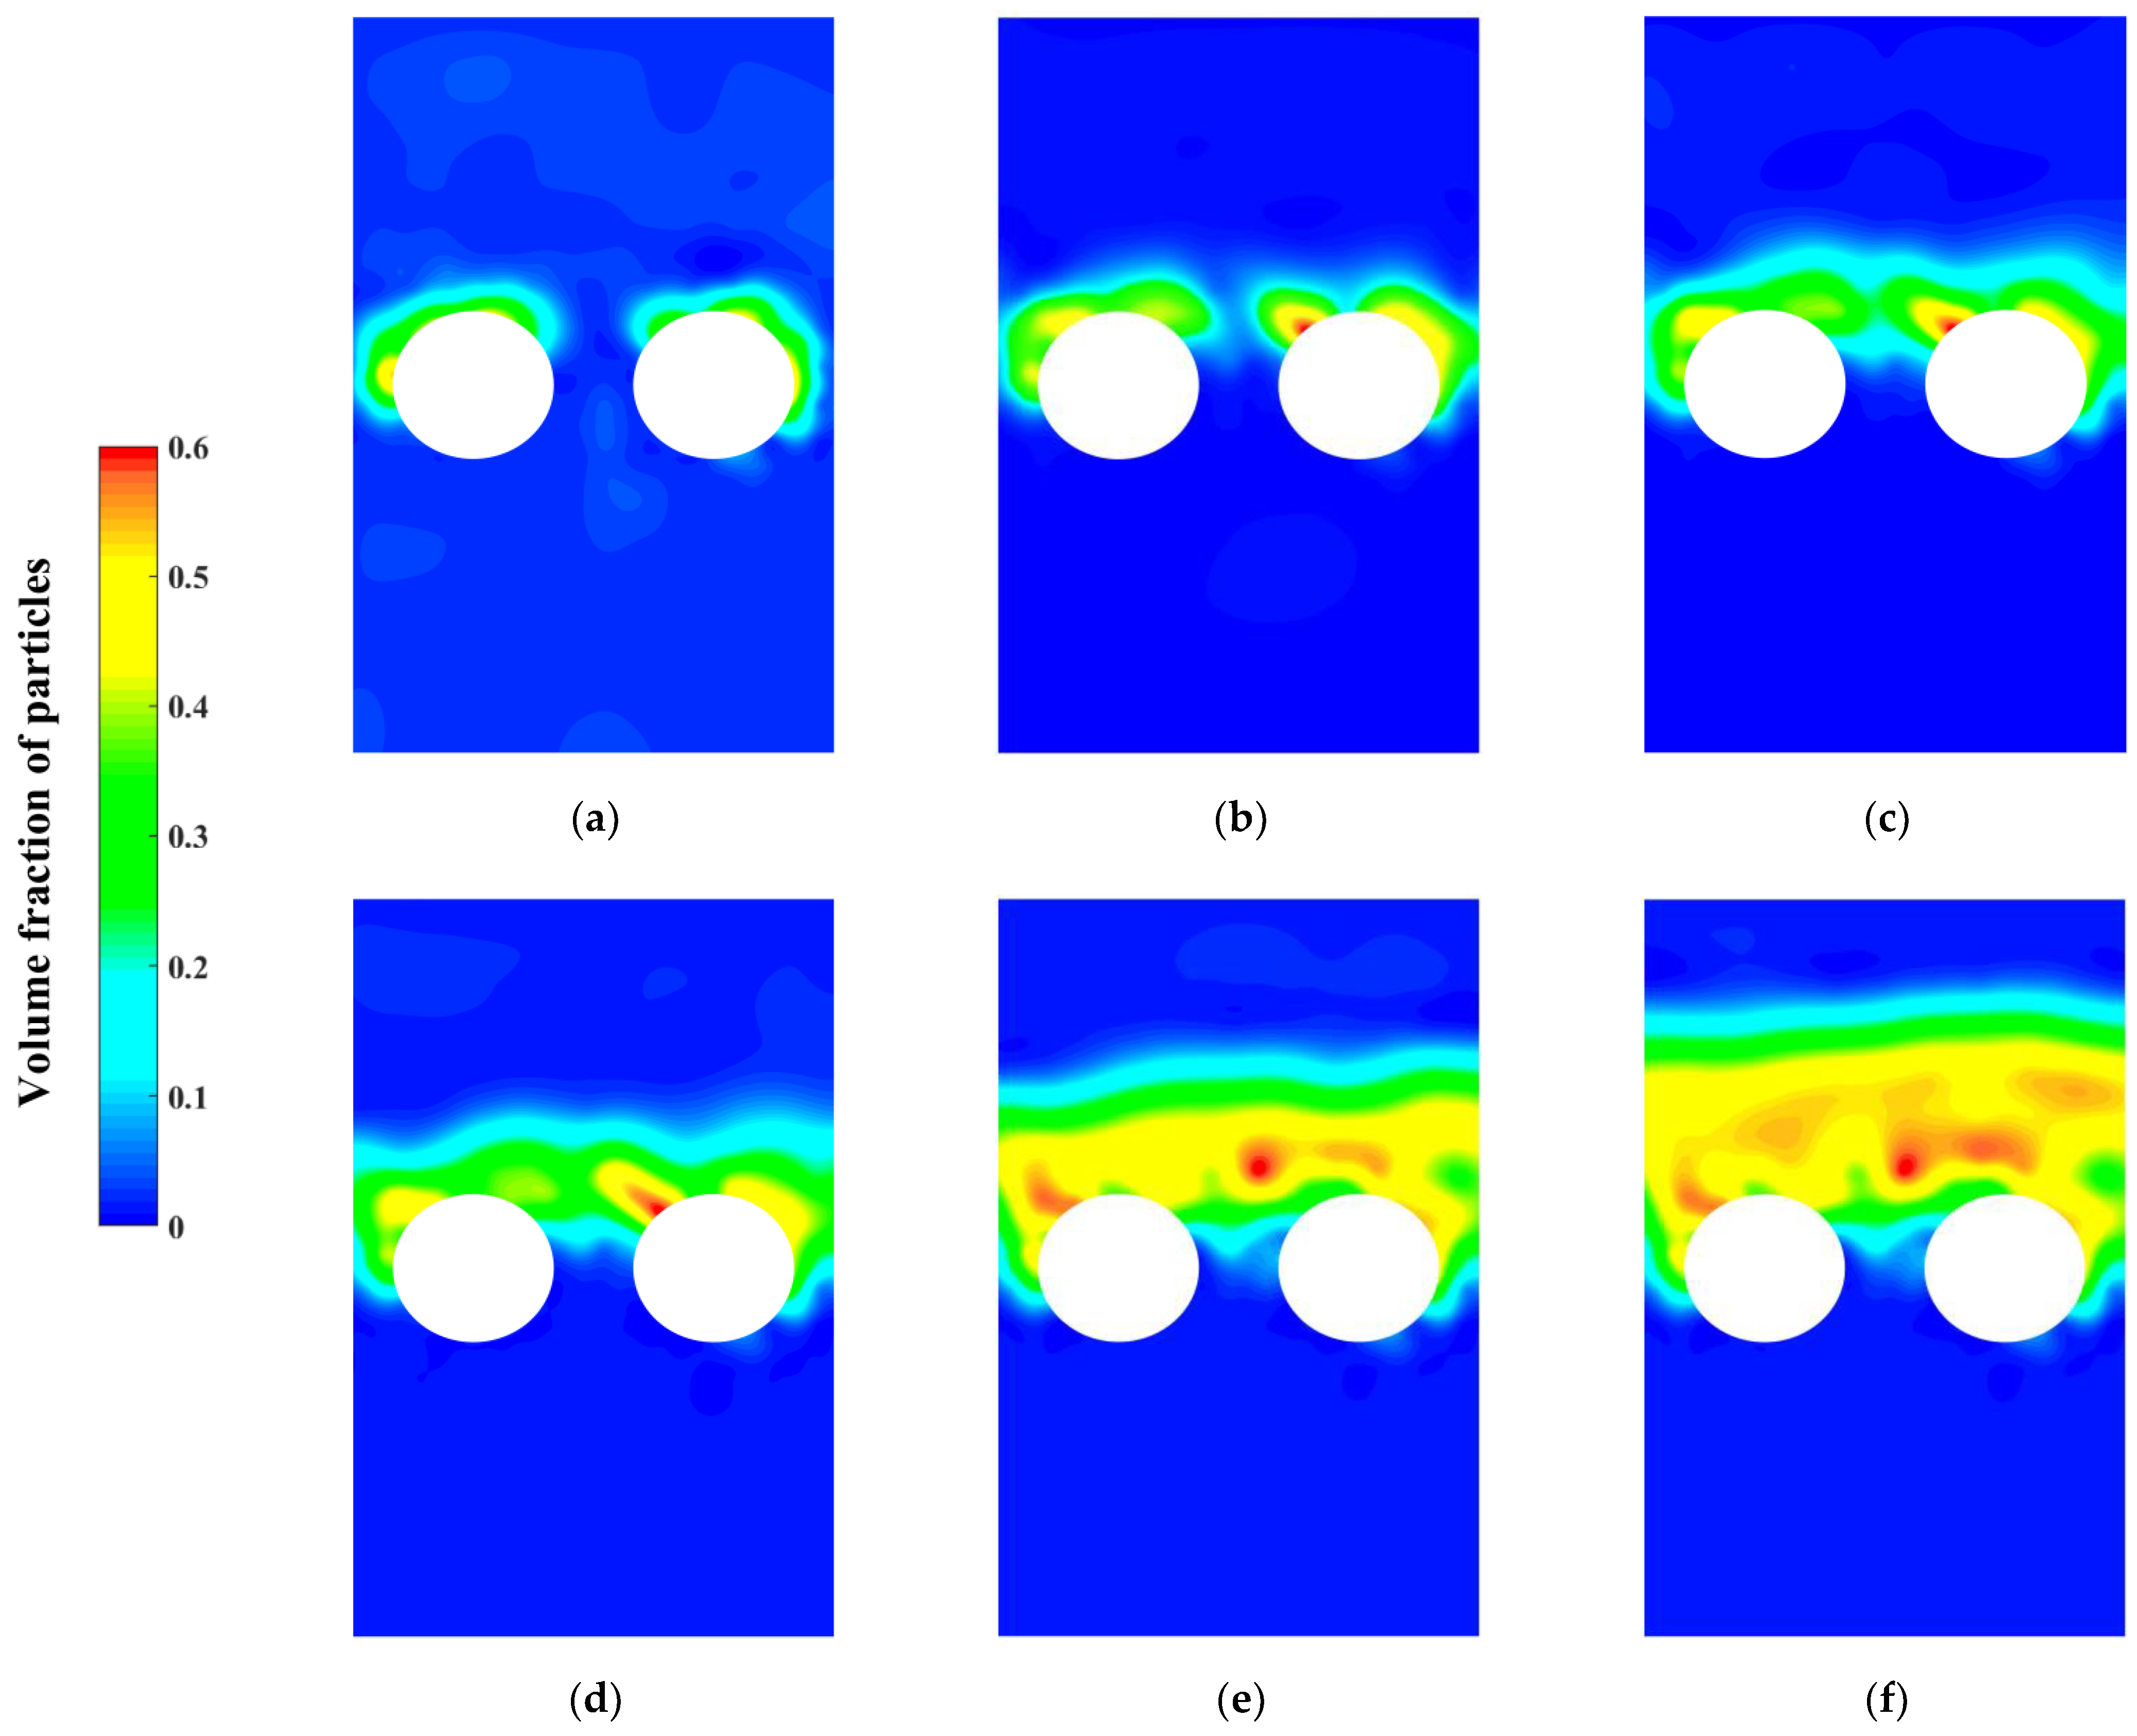
Figure 6 shows the curve of filter cake height with time. Particles reach the membrane surface at t = 0.7 ms and accumulate after t = 0.7 ms. In the cleaning filtrating stage, only one layer of particles is uniformly deposited on the membrane surface, so the filter cake height hardly changes. In the subsequent transition stage and filter cake filtration stage, since the generation rate of particles does not change with time, the volume of particles reaching the membrane surface in the unit time and the unit area is constant, so the filter cake height increases linearly with time. Figure 7 shows the dynamic change process of the volume fraction of deposited particles. Before t = 4.0 ms, the deposited particles were captured by particles on the membrane surface on the one hand, which led to the vertical growth and height increase of the filter cake, and on the other hand, they were captured by dendrites, which led to the lateral growth of the filter cake and connected into a whole. After t = 4.0 ms, the pores are entirely closed, and the filter cake no longer grows laterally but continues to grow vertically on the previous basis. That is, the growth of filter cake is a continuous process.
3.2. Effect of Suspension Concentration on Bridging Process
In order to study the influence of suspension concentration on the bridging process, the particle bridging process was simulated under the conditions of inlet flow velocity and particle concentration . Generally, the particle concentration is characterized by the particle generation rate in DEM, and the conversion formula between the two parameters is shown in Equation (22):
where is particle generation rate/s; is the cross-sectional area of the gas inlet, m2; is the particle concentration, %; and is the volume of a single particle, m3.
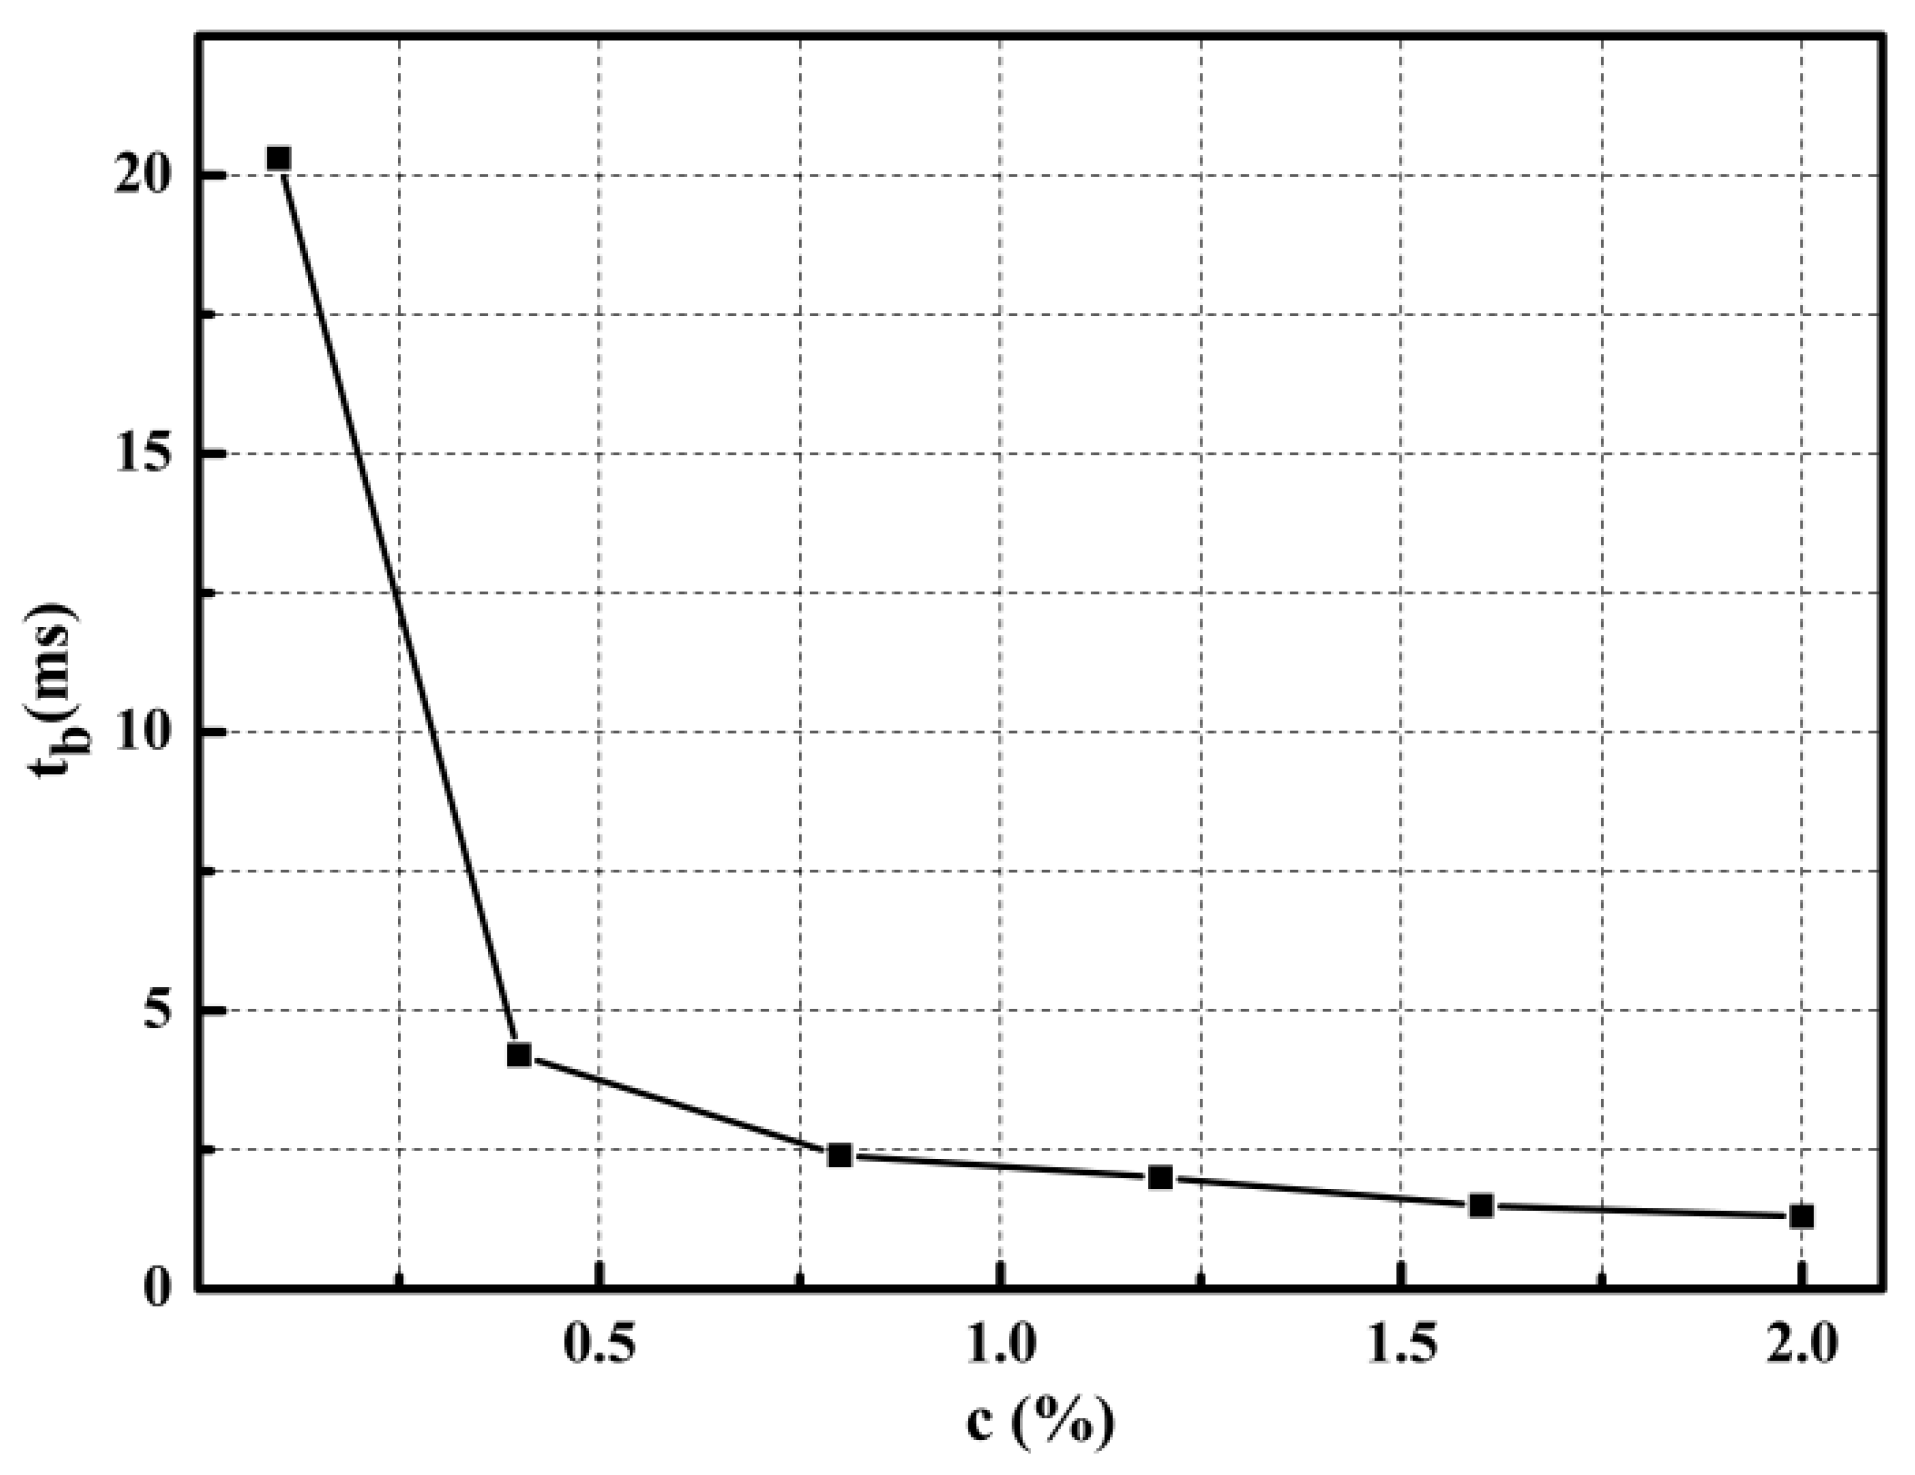
Figure 8 shows the curve of particle bridging completion time with particle concentration. It can be seen from the figure that the completion time of particle bridging decreases with the increases in particle concentration. When , it takes 20.3 ms to complete the bridging process, while when , it only takes 1.3 ms to complete the bridging process. With the particle generation rate increase, the volume of particles reaching the membrane surface in unit time and unit area increases continuously, which accelerates the bridging process. However, it should be noted that the reduction rate of bridging completion time decreases with the increase in particle generation rate. That is to say, when the particle concentration reaches a specific value, the particle concentration is no longer the main influencing factor of the bridging time. This is also consistent with the conclusions drawn by Hund et al. [25] that the studies of cylindrical pore bridging mechanism.
The resistance of the filter medium can be divided into the pure filter medium resistance and the interference resistance . The former describes the resistance of the filter medium when there is no particulate deposit. In contrast, the latter describes the resistance of the filter medium when the particle bridging is over and the pores are just closed. It is an important parameter in describing the properties of particle bridges. The following formula can calculate it:
where R is the total resistance of the filter medium, 1/m; is the resistance of the unloaded filter medium, 1/m; and is the resistance of the filter medium at the end of particle bridging and when the pores have just closed, 1/m. is the pure filter media pressure drop, Pa; is the pressure drop across the filter media when bridging is complete, Pa; is the fluid viscosity, ; and is the fluid velocity, m/s.
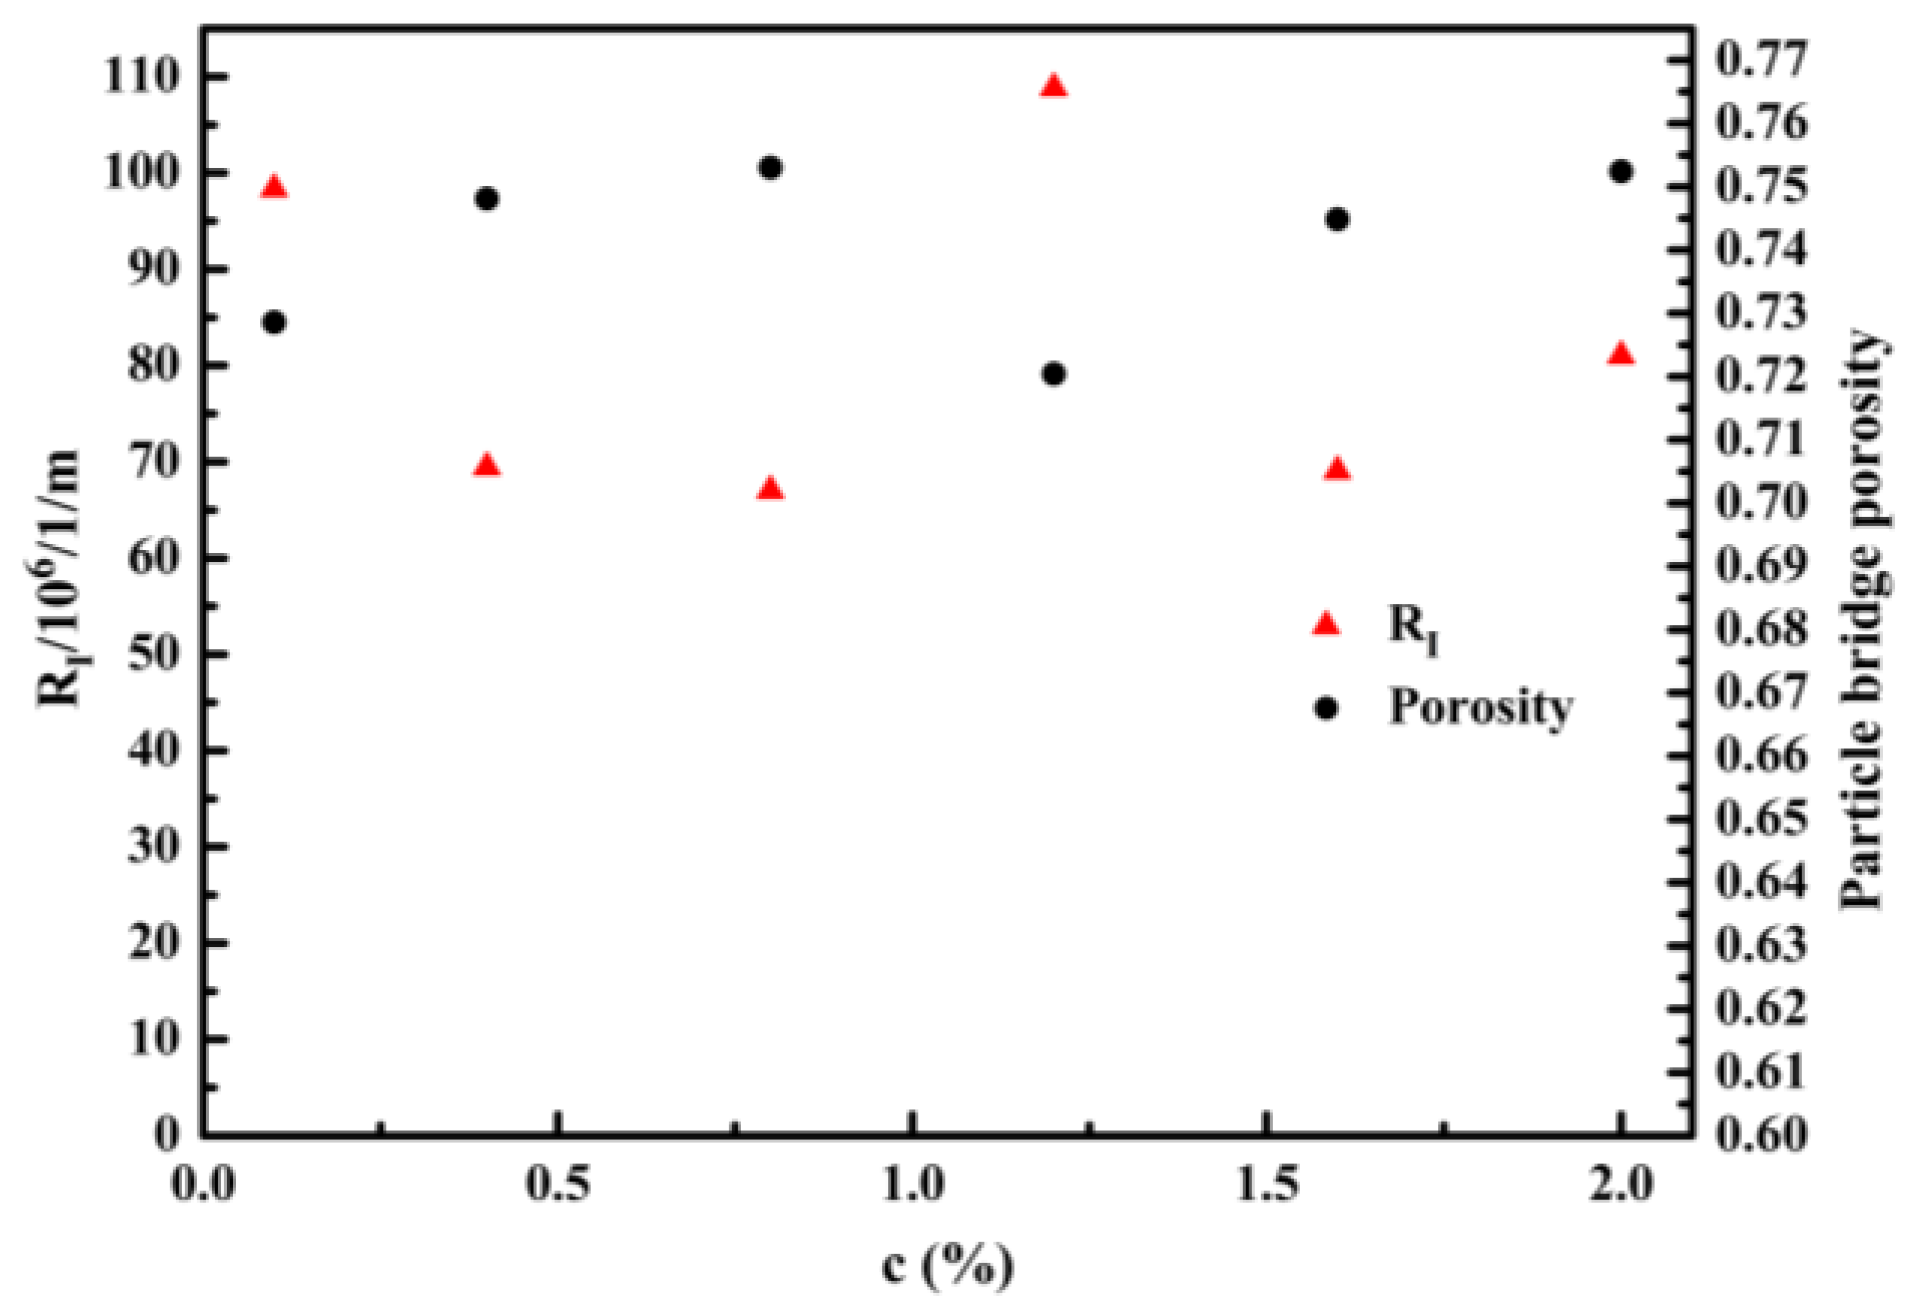
Figure 9 shows the interference resistance and particle bridge porosity as a function of particle concentration. The interference resistance and particle bridge porosity have no significant dependence on particle concentration. It indicates that particle bridges of similar shape, size, and porosity were formed at different concentrations. In addition, the resistance of the unloaded filter medium 1/m was obtained by calculation when the inlet velocity . We can find that the interference resistance is 80 times the resistance of the unloaded filter medium. That is to say, the formation of the particle bridge closes the pores, thus increasing the flow resistance.
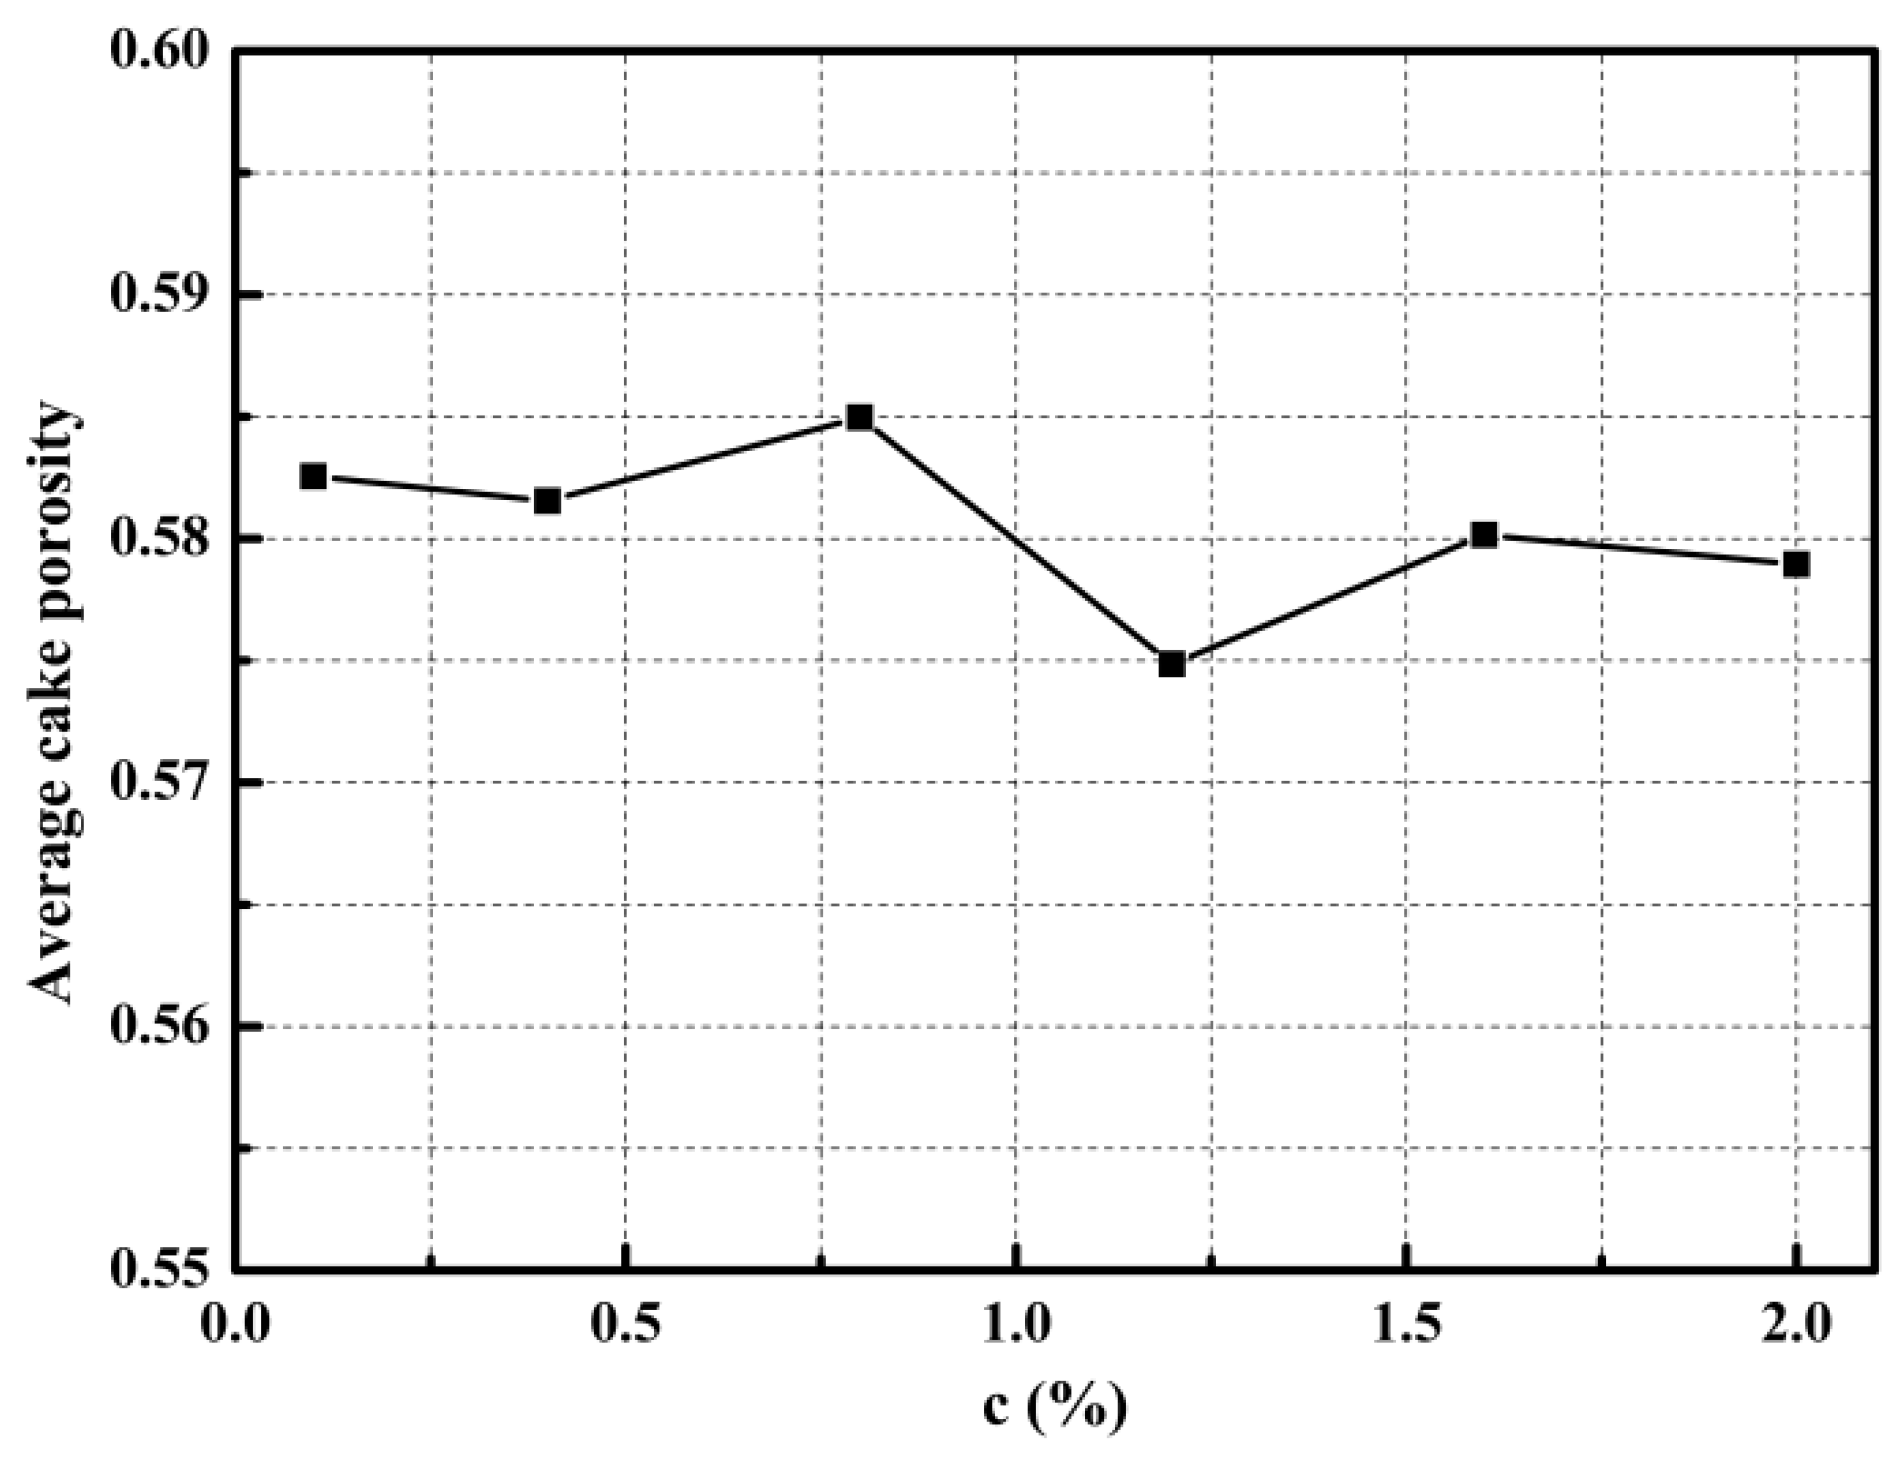
The average porosity of filter cake and filtration efficiency are two important parameters for evaluating filtration performance. The average porosity of filter cake reflects the compactness of filter cake, and the filtration efficiency determines the applicability of filter media and operating parameters. Figure 10 shows the effect of particle concentration on the average porosity of filter cake. It can be seen from the figure that there is no apparent relationship between the average porosity of the filter cake and the particle concentration. It shows that filter cakes with similar shapes, compressibility, and porosity are formed at different concentrations.
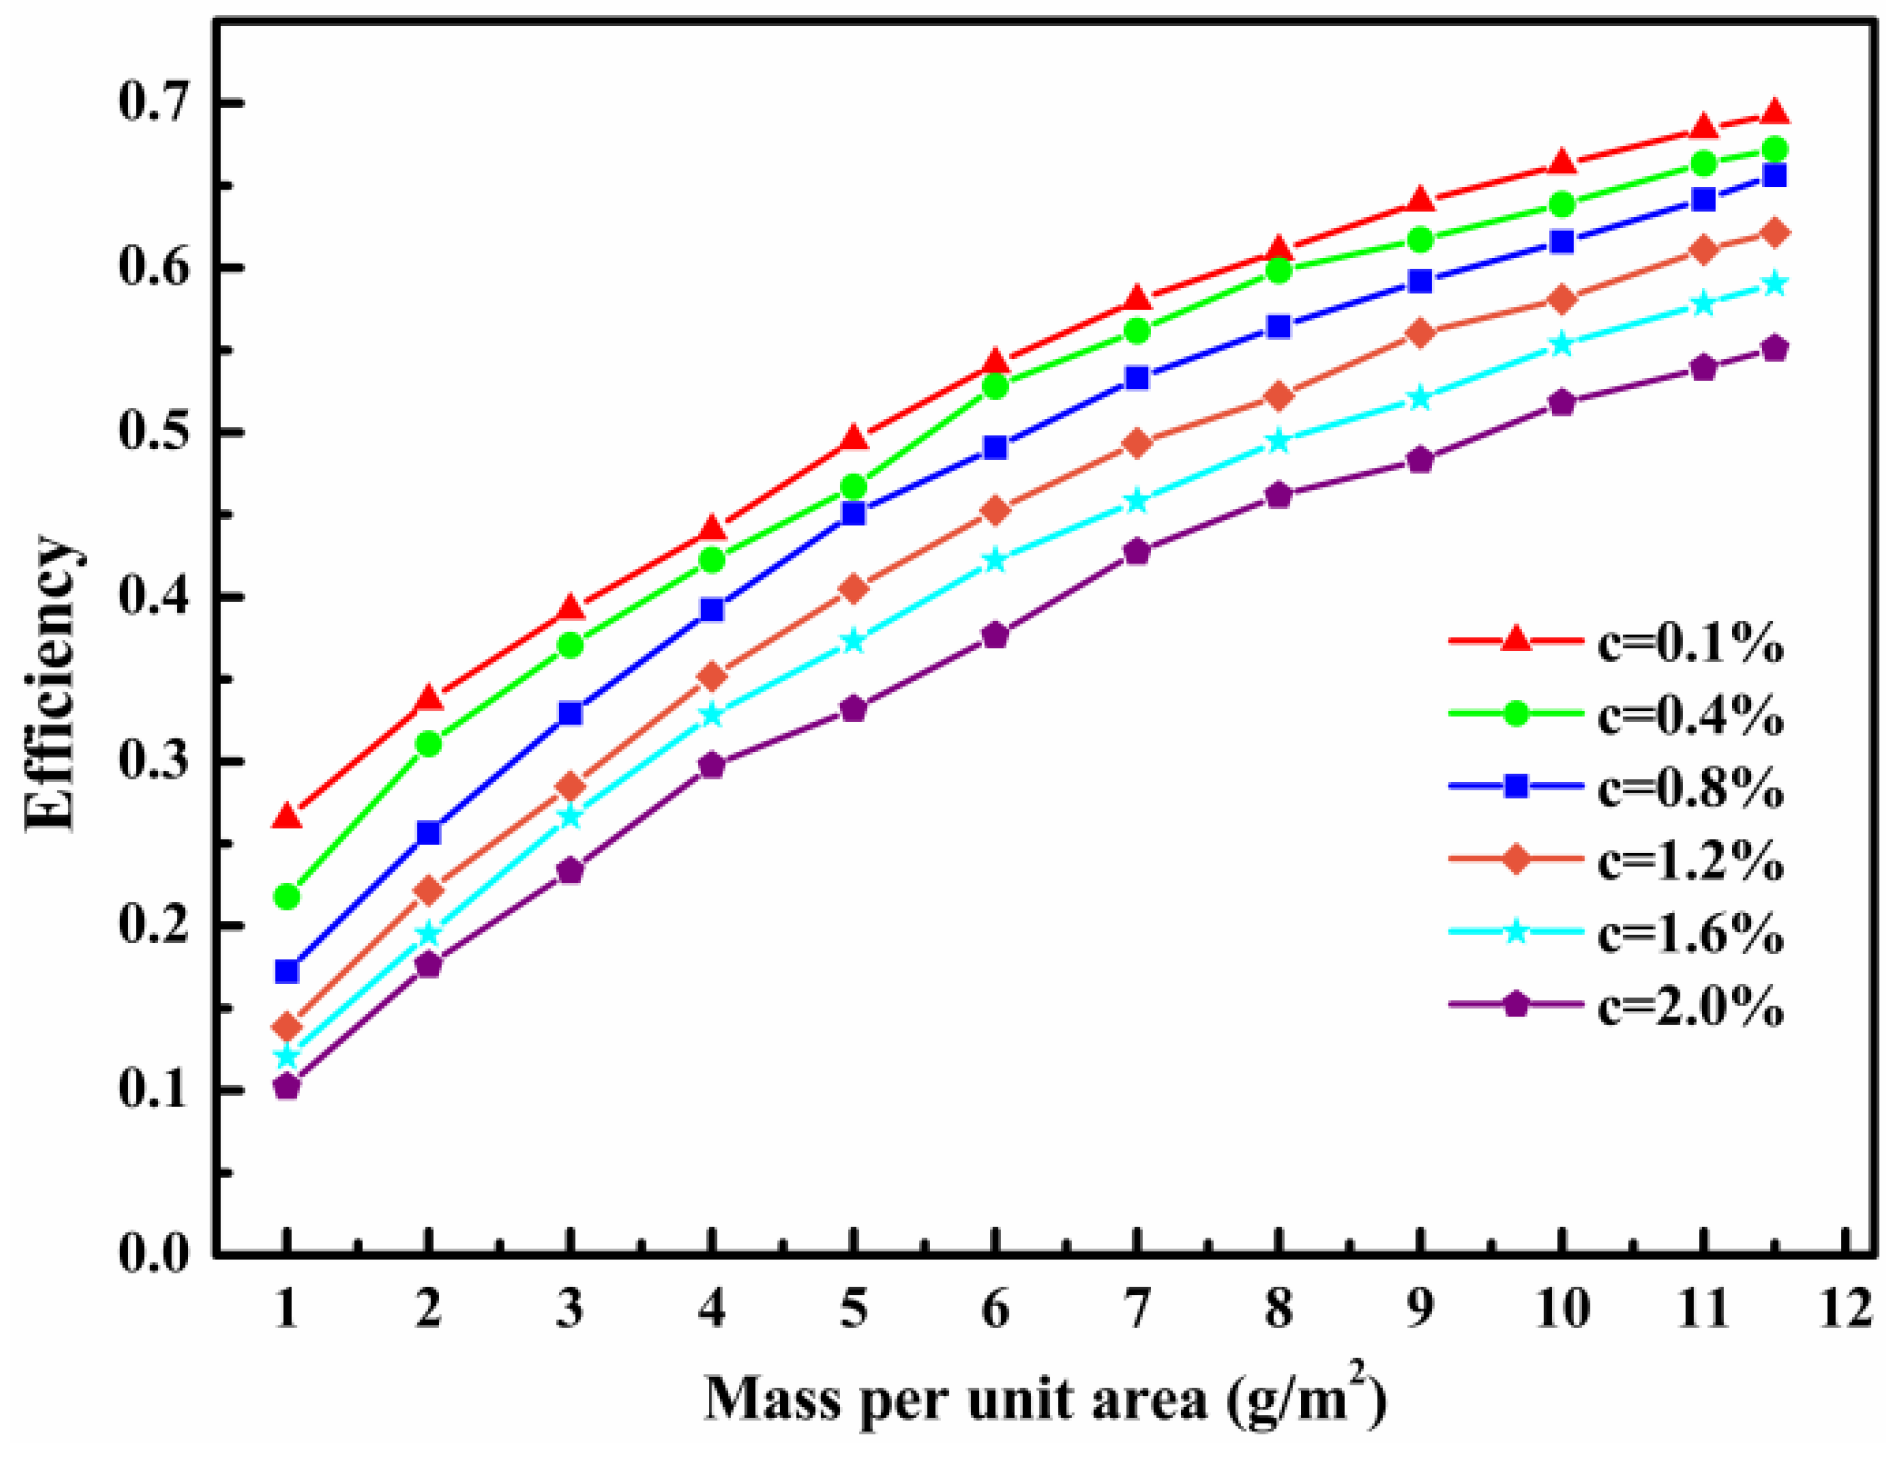
Figure 11 shows the variation law of filtration efficiency with particle deposition mass per unit area under different concentrations. In the process of filtration, particles are captured by ceramic membrane and the deposited particles, so the filtration efficiency is improved with the increase in the deposited quality of particles. It is known from Figure 5 that as the filtration process progresses, the change of filtration efficiency per unit time gradually decreases and tends to 100%, which leads to gradual decreases in the slope of the curve of filtration efficiency with particle deposition mass per unit area. In addition, the increase in particle concentration will also lead to a decrease in filtration efficiency. Although increasing the concentration can reduce the bridging time, at the same time, increasing the concentration will make more particles flow through the pores before bridging is complete, resulting in a decrease in filtration efficiency.
3.3. Influence of Inlet Velocity on Bridging Process
In order to study the influence of inlet velocity on the bridging process, the bridging process of a particle was simulated under the conditions of constant particle generation rate and inlet velocity . The product of the particle concentration and inlet flow rate remains constant. Therefore, in all simulations in this section, the volume of particles reaching the ceramic membrane surface per unit time and per unit area is the same.
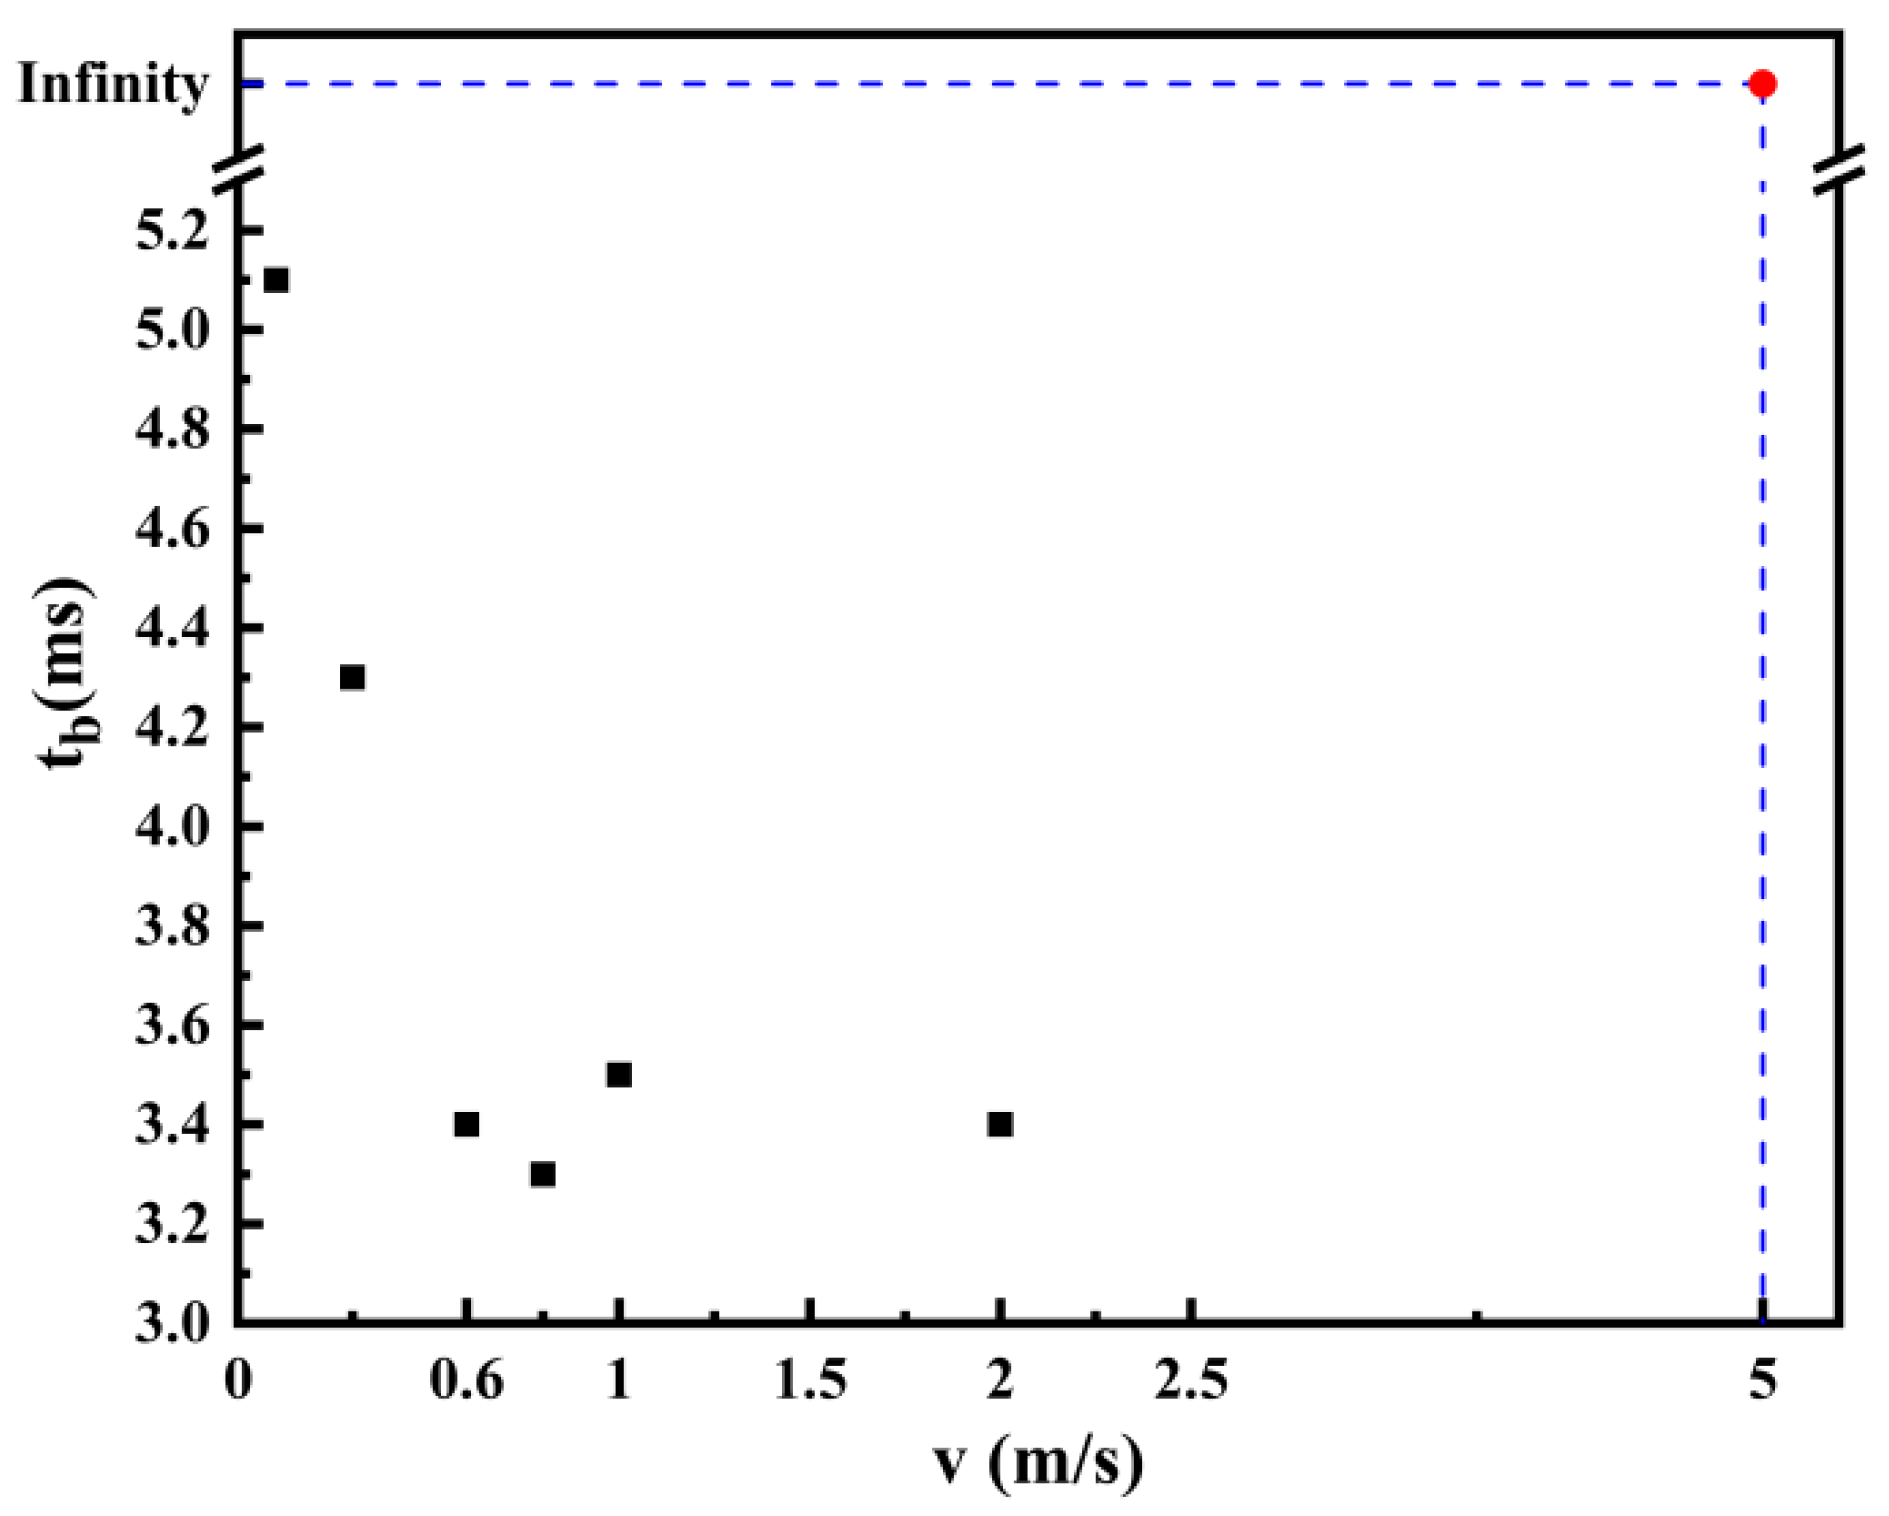
Figure 12 shows the influence of inlet flow rate on particle bridging time. It can be seen from the figure that the influence can be divided into three stages. It can be explained by the inertial collision of particles and the scouring action of fluid. The Stokes number is an essential parameter for evaluating the particle collision mechanism, and its calculation expression is shown in Equation (26):
When other parameters are constant, the Stokes number is proportional to the inlet velocity. Therefore, when the inlet velocity increases, the inertia of particles also increases, and the follow-up of particle movement is less noticeable, which leads to an increase in the collision probability between particles and films and between particles and deposited particles, thus accelerating the bridging process of particles to a certain extent.
At low velocity (u < 0.6 m/s), the scouring effect of fluid scouring is not enough to destroy the particle bridge, and the inertial collision effect of particles is more evident at this time; thus, the particle bridge time decreases with the increase in the inlet velocity. When the inlet velocity is , with increases in inertial collision of particles, the scouring effect of fluid also increases so that the bridging time of particles does not changing with the flow rate. However, at a high velocity (), the particle bridge is unable to form under the high-speed impact of fluid.
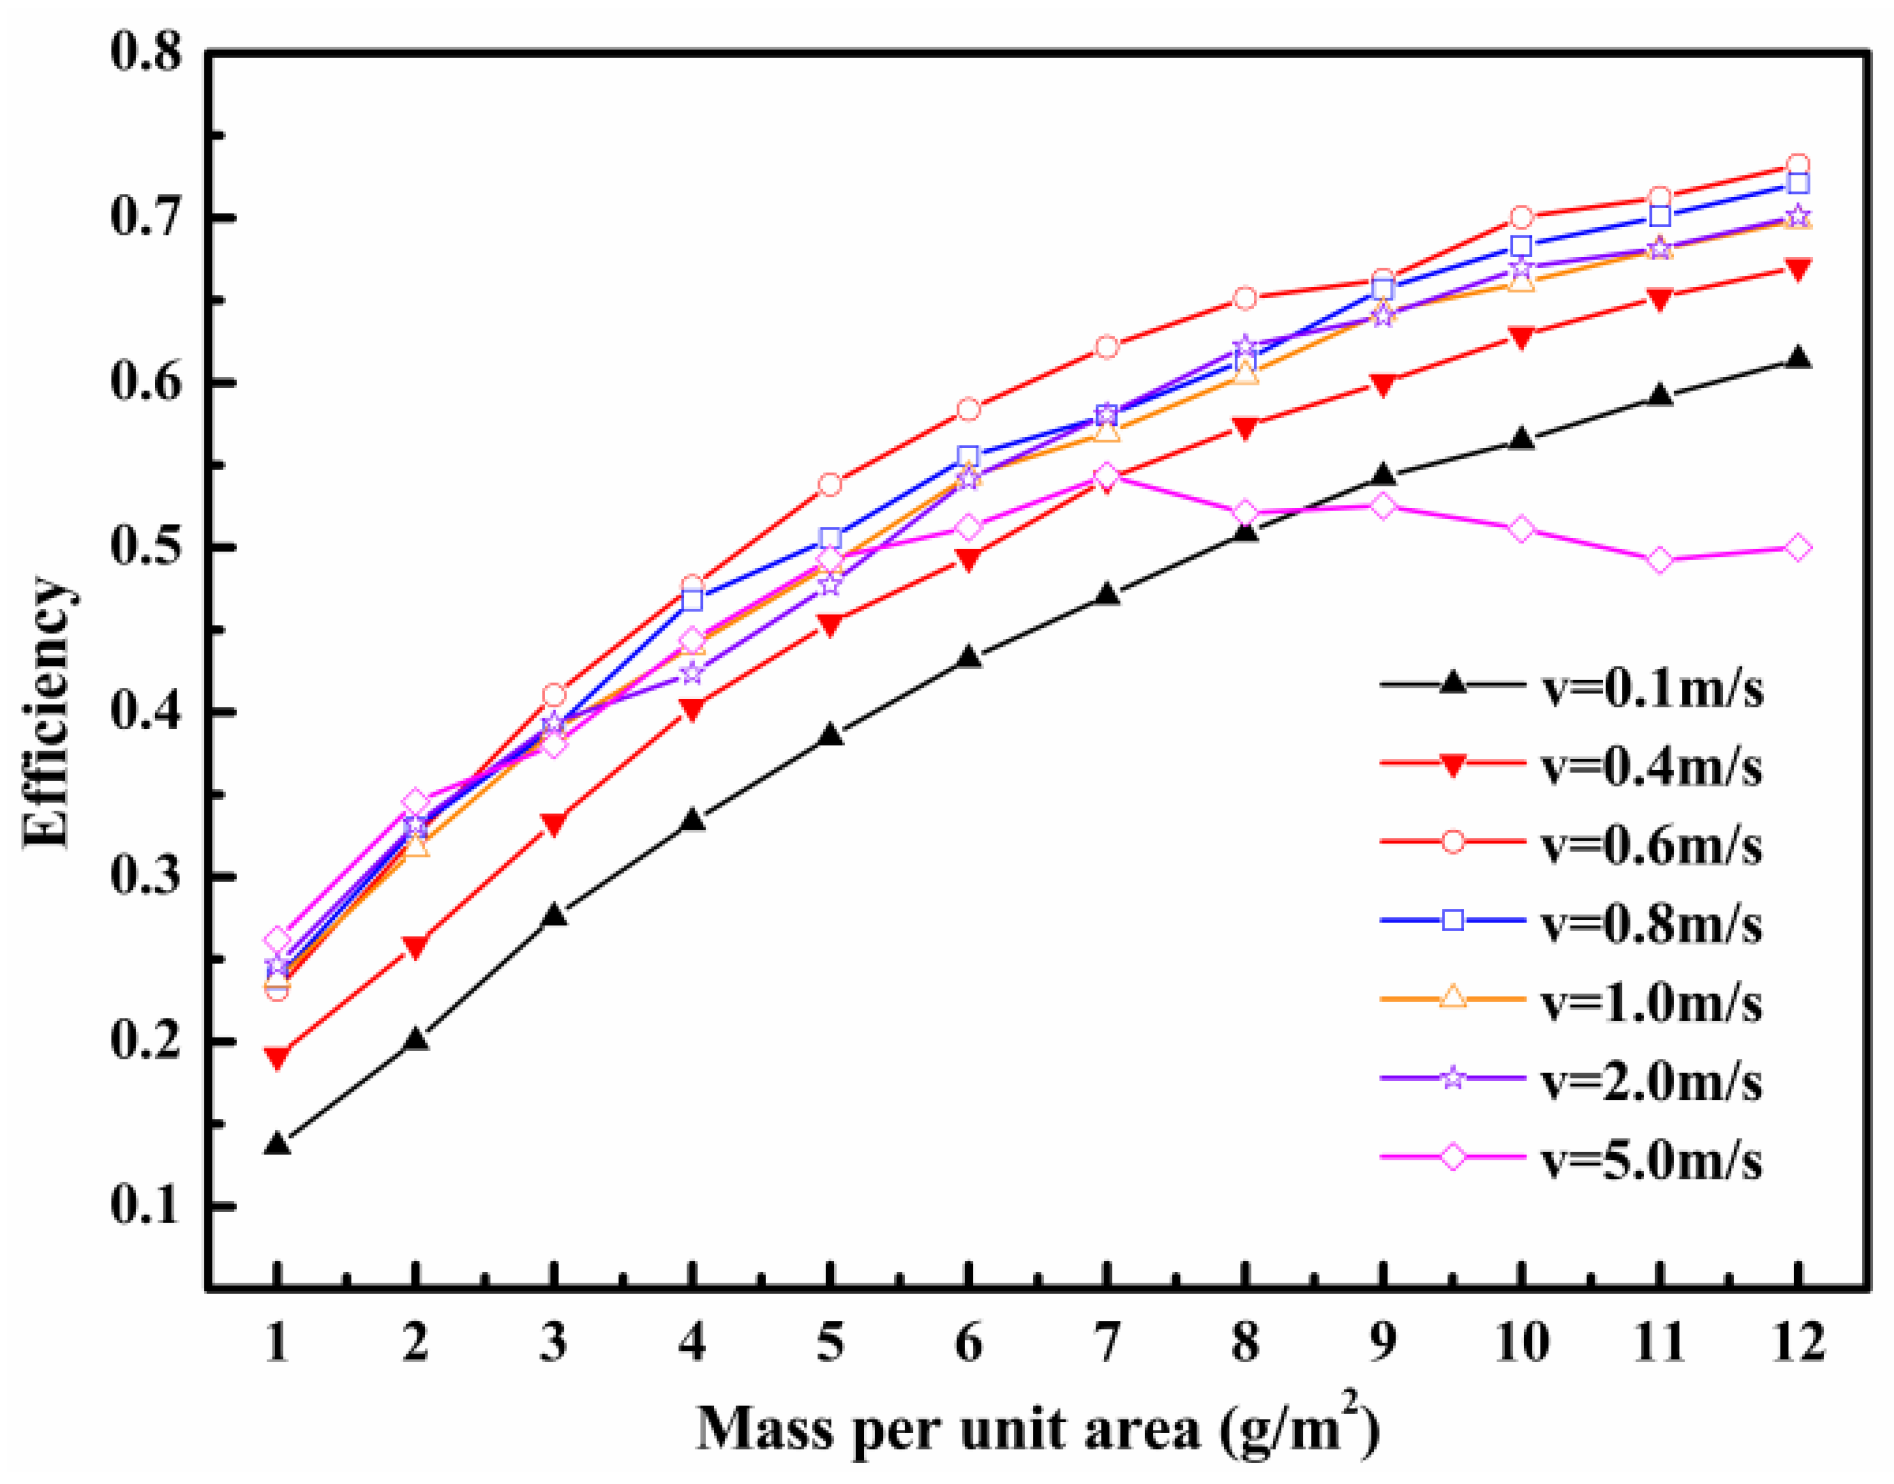
Similarly, this also illustrates the effect of inlet velocity on filtration efficiency. Figure 13 shows the variation law of filtration efficiency with particle deposition mass per unit area under different inlet velocity. When the inlet velocity is , under the inertial collision of particles, the filtration efficiency increases with the increase in inlet velocity. When the inlet velocity is , the inertial collision of particles and the scouring effect of the fluid are counteracted so that the filtration efficiency no longer changes with the inlet velocity. However, when the inlet velocity , the particle bridge collapses, which causes the filtration efficiency to increase first and then decrease.
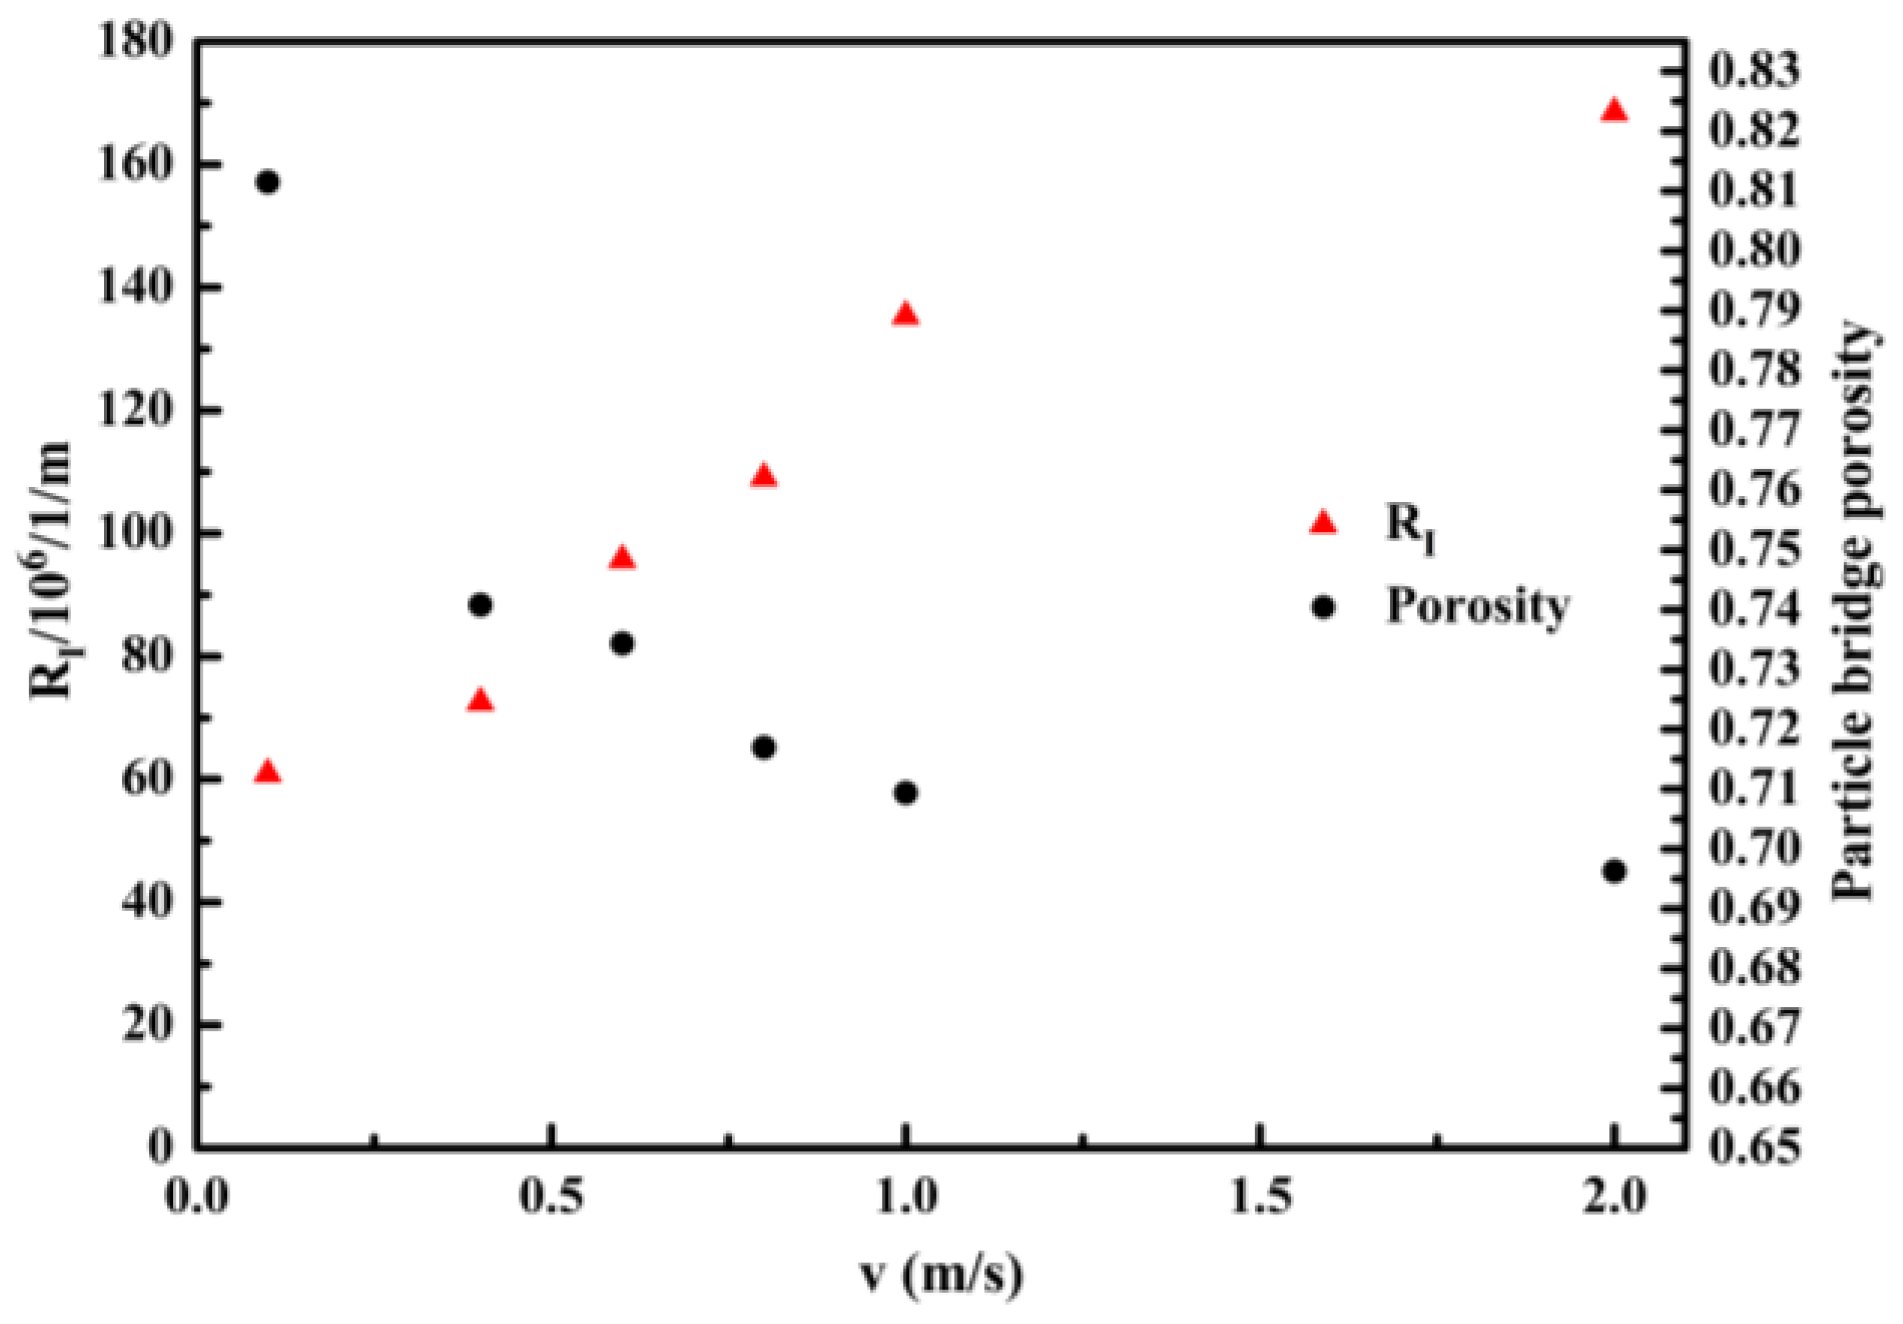
Figure 14 shows the effect of inlet velocity on interference resistance and particle bridge porosity. Since the resistance of the unloaded filter medium is the resistance of the filter medium itself, the resistance of the unloaded filter medium was constant in all simulations: 1/m. It can be seen from Figure 14 that the interference resistance increases with the inlet velocity and is much larger than the resistance of the unloaded filter medium. This is because, as the inlet velocity increases, the particles are packed more tightly on the ceramic membrane pores, thereby increasing the flow resistance. In addition, the tighter packing of the particles on the ceramic membrane pores can be confirmed by the particle bridge porosity.
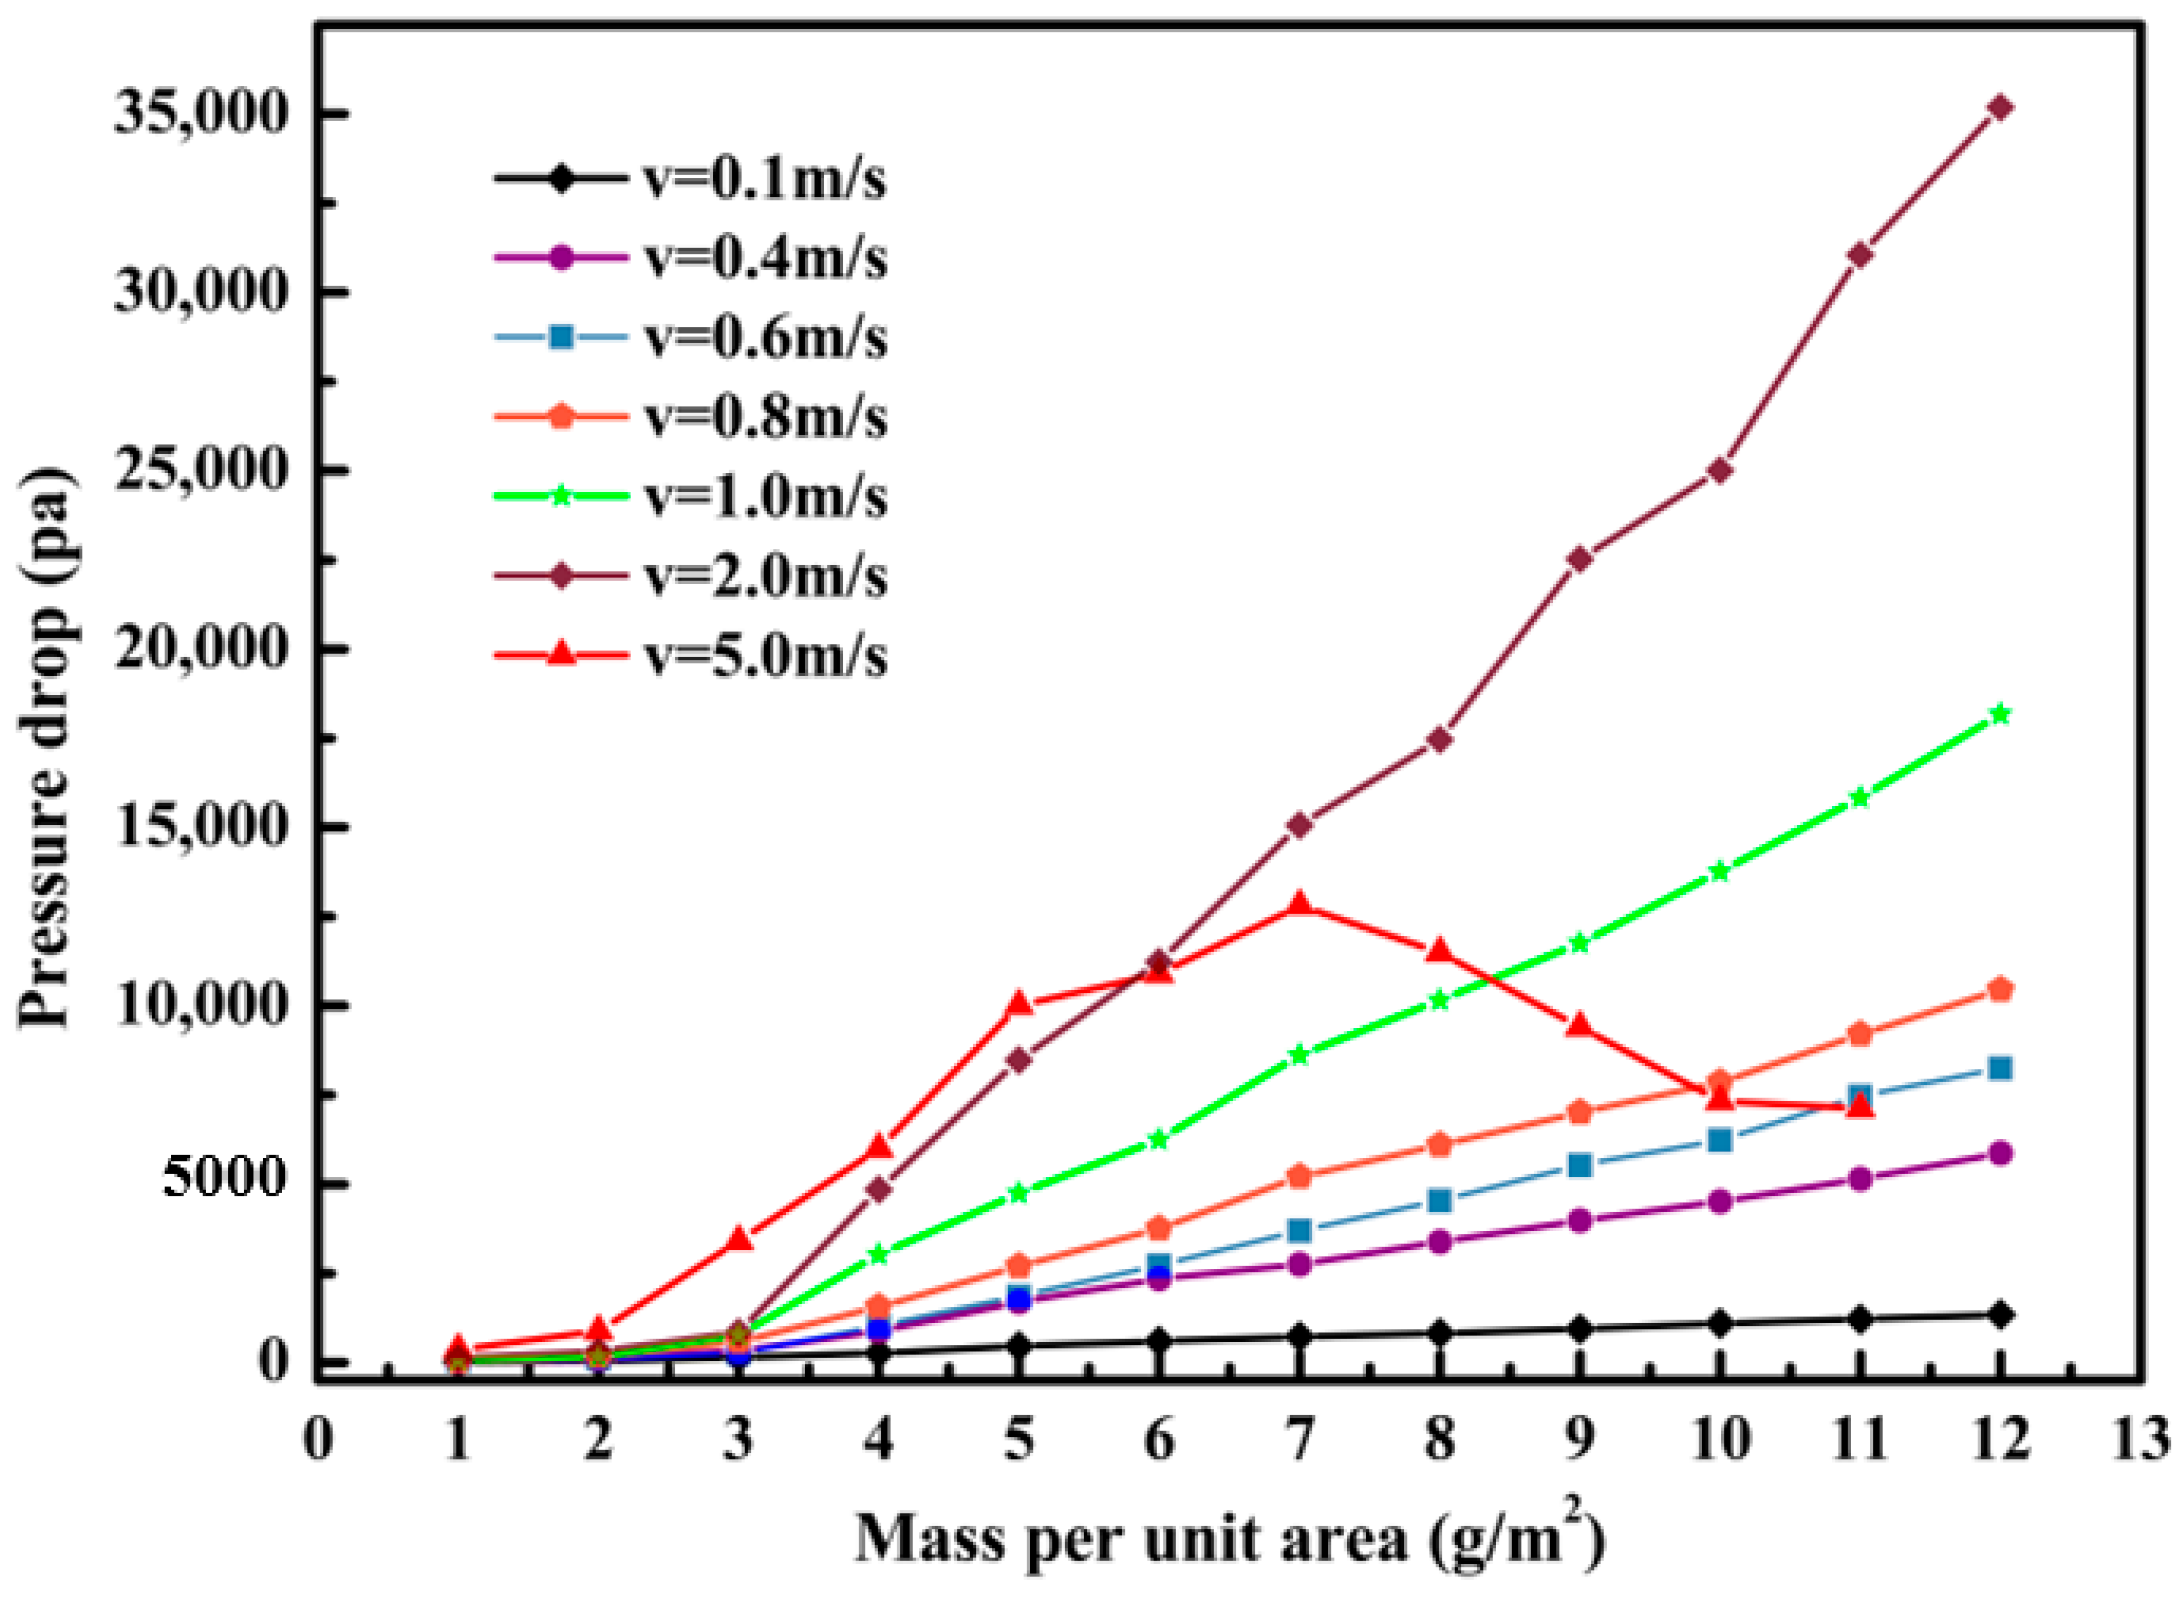
Figure 15 shows the relationship between pressure drop and particle deposition mass per unit area for different inlet velocity. It can be seen from the figure that when the inlet velocity is , the pressure drop increases with the increase in the inlet velocity. Moreover, when the inlet velocity is constant, the pressure drop increases linearly with the particle deposition mass per unit area. The reason may be that the pressure drop is proportional to the face velocity shown in Darcy’s law. In addition, when the inlet velocity , the pores cannot be closed, because particle bridges cannot be formed, which leads to the pressure drop increasing at first and then decreasing.
4. Conclusions
In this paper, the CFD-DEM coupling method was used to study the bridging mechanism of particles in the pores of ceramic membranes. To this end, a three-dimensional model of the ceramic membrane pores was established concerning the suspended particle method. The entire filtration process was simulated under the conditions of fully considering the gas–particle, particle–ceramic membrane, and particle–particle interactions. The following conclusions can be drawn:
- (1)
- Particle bridging is a continuous and dynamic process. In the early filtration stage, the deposited particles are uniformly deposited on the ceramic membrane surface. As the filtration process progresses, the deposits extend into the membrane pores to form a dendritic-like structure and continue to develop until they are connected to form bridges in the membrane pores.
- (2)
- At a constant inlet velocity, the bridging time of particles decreases with increasing particle concentration, and the decrease is smaller and smaller. However, decreasing particle bridging time does not result in an increased filtration efficiency. An increase in particle concentration will cause more particles to flow through the pores before bridging is complete, decreasing filtration efficiency. Therefore, the particle concentration should be reasonably selected to achieve high-efficiency filtration in the actual filtration process. Furthermore, there was no apparent relationship between the average porosity of the filter cake, particle bridge porosity, and interference resistance and the particle concentration.
- (3)
- At a constant particle generation rate, the particle bridging time and filtration efficiency are related to the inertial collision of particles and the scouring effect of the fluid. When the inlet velocity is , the inertial collision of particles dominates, so the bridging time and filtration efficiency increase with the increase in inlet velocity. When the inlet velocity is , the inertial collision of particles and the scouring effect of the fluid are counteracted, so that the bridging time and filtration efficiency no longer change with the inlet velocity. When the inlet velocity , the scouring effect of the fluid is more prominent, resulting in the failure to form the bridge and the filtration efficiency first increases and then decreases with the inlet velocity. In addition, when the inlet velocity is , the pressure drop increases with increasing inlet velocity. The inlet velocity also affects the interference resistance of the filter media. As the inlet velocity increases, the particles pack more tightly on the ceramic membrane, leading to an increase in the interference resistance.
Author Contributions
Conceptualization, H.W. and J.W.; data curation, J.W. and P.F.; methodology, Z.Q.; software, H.W. and Y.S.; writing—original draft preparation, H.W. and W.Z.; writing—review and editing, H.W. and Y.S. All authors have read and agreed to the published version of the manuscript.
Funding
This research received no external funding.
Institutional Review Board Statement
Not applicable.
Informed Consent Statement
Not applicable.
Data Availability Statement
Not applicable.
Acknowledgments
The authors give sincere gratitude to Wu Junfei from Qingdao University of Science and Technology for his continued support of research activities.
Conflicts of Interest
The authors declare that there are no conflict of interest.
References
- Qian, F.; Huang, N.; Lu, J.; Han, Y. CFD–DEM simulation of the filtration performance for fibrous media based on the mimic structure. Comput. Chem. Eng. 2014, 71, 478–488. [Google Scholar] [CrossRef]
- Xiong, R.; Zhang, J.; Yan, M.; Sun, G.; Liu, K. Numerical simulation of the fouling and cleaning of a ceramic membrane. Chinese J. Eng. 2021, 43, 1543–1551. [Google Scholar]
- Ma, Q.; Cai, S.; Wang, S.; Zhao, B.; Martin, R.V.; Brauer, M.; Cohen, A.; Jiang, J.; Zhou, W.; Hao, J.; et al. Impacts of coal burning on ambient PM2.5 pollution in China. Atmos. Chem. Phys. 2017, 17, 4477–4491. [Google Scholar] [CrossRef] [Green Version]
- Guo, Y.; Wang, W.; Qiao, W.; Wan, X.; Ye, T.; Lu, H. Characterization of heavy metals in fly ash from hazardous waste incinerators. Chin. J. Eng. 2006, 28, 17–21. [Google Scholar]
- Han, F.; Zhong, Z.; Yang, Y.; Wei, W.; Zhang, F.; Xing, W.; Fan, Y. High gas permeability of SiC porous ceramics reinforced by mullite fibers. J. Eur. Ceram. Soc. 2016, 36, 3909–3917. [Google Scholar] [CrossRef]
- Lupion, M.; Alonso-Fariñas, B.; Rodriguez-Galan, M.; Navarrete, B. Modelling pressure drop evolution on high temperature filters. Chem. Eng. Process. 2013, 66, 12–19. [Google Scholar] [CrossRef]
- Caro, J. Hierarchy in inorganic membranes. Chem. Soc. Rev. 2016, 45, 3468–3478. [Google Scholar] [CrossRef] [Green Version]
- Li, D.; Wang, H.; Wang, K.; Wang, G.; Chen, L. CFD-DEM simulating transport characteristic of gas-solid phases in ceramic filters. Membr. Sci. Technol. 2019, 39, 51–57. [Google Scholar]
- Ruiz, J.C.; Blanc, P.; Prouzet, E.; Coryn, P.; Laffont, P.; Larbot, A. Solid aerosol removal using ceramic filters. Sep. Purif. Technol. 2000, 19, 221–227. [Google Scholar] [CrossRef]
- Riefler, N.; Ulrich, M.; Morshauser, M.; Fritsching, U. Particle penetration in fiber filters. Particuology 2018, 40, 70–79. [Google Scholar] [CrossRef]
- Gao, J. Molecular Biology, 1st ed.; Chemical Industry Press: Beijing, China, 2011; pp. 121–153. [Google Scholar]
- Agbangla, G.C.; Climent, É.; Bacchin, P. Experimental investigation of pore clogging by microparticles: Evidence for a critical flux density of particle yielding arches and deposits. Sep. Purif. Technol. 2012, 101, 42–48. [Google Scholar] [CrossRef] [Green Version]
- Dressaire, E.; Sauret, A. Clogging of microfluidic systems. Soft Matter 2017, 13, 37–48. [Google Scholar] [CrossRef] [PubMed]
- Wyss, H.M.; Blair, D.L.; Morris, J.F.; Stone, H.A.; Weitz, D.A. Mechanism for clogging of microchannels. Phys. Rev. E 2006, 74, 61402. [Google Scholar] [CrossRef] [PubMed]
- Mustin, B.; Stoeber, B. Deposition of particles from polydisperse suspensions in microfluidic systems. Microfluid. Nanofluid. 2010, 9, 905–913. [Google Scholar] [CrossRef]
- Kuiper, S.; Rijn, C.; Nijdam, W.; Elwenspoek, M.C. Development and applications of very high flux microfiltration membranes. J. Membr. Sci. 1998, 150, 1–8. [Google Scholar] [CrossRef]
- Zhu, H.P.; Zhou, Z.Y.; Yang, R.Y.; Yu, A.B. Discrete particle simulation of particulate systems: Theoretical developments. Chem. Eng. Sci. 2007, 62, 3378–3396. [Google Scholar] [CrossRef]
- Zhu, H.P.; Zhou, Z.Y.; Yang, R.Y.; Yu, A.B. Discrete particle simulation of particulate systems: A review of major applications and findings. Chem. Eng. Sci. 2008, 63, 5728–5770. [Google Scholar] [CrossRef]
- Chu, K.W.; Wang, B.; Yu, A.B.; Vince, A. CFD-DEM modelling of multiphase flow in dense medium cyclones. Powder Technol. 2009, 193, 235–247. [Google Scholar] [CrossRef]
- Tao, R.; Yang, M.; Li, S. Effect of adhesion on clogging of microparticles in fiber filtration by DEM-CFD simulation. Powder Technol. 2020, 360, 289–300. [Google Scholar] [CrossRef]
- Hu, Z.; Zeng, H.; Ge, Y.; Wang, W.; Wang, J. Simulation and experiment of gas-solid flow in a safflower sorting device based on the CFD-DEM coupling method. Processes 2021, 9, 1239. [Google Scholar] [CrossRef]
- Deshpande, R.; Antonyuk, S.; Iliev, O. Study of the filter cake formed due to the sedimentation of monodispersed and bidispersed particles using discrete element method–computational fluid dynamics simulations. Aiche J. 2019, 65, 1294–1303. [Google Scholar] [CrossRef]
- Deshpande, R.; Antonyuk, S.; Iliev, O. DEM-CFD study of the filter cake formation process due to non-spherical particles. Particuology 2020, 53, 48–57. [Google Scholar] [CrossRef]
- Vanessa, P.; Kilian, S.; Sergiy, A. A Coupled CFD-DEM Model for Resolved Simulation of Filter Cake Formation during Solid-Liquid Separation. Processes 2021, 9, 826. [Google Scholar]
- Hund, D.; Lösch, P.; Kerner, M.; Ripperger, S.; Antonyuk, S. CFD-DEM study of bridging mechanisms at the static solid-liquid surface filtration. Powder Technol. 2020, 361, 600–609. [Google Scholar] [CrossRef]
- Zhou, Z.Y.; Kuang, S.B.; Chu, K.W.; Yu, A.B. Discrete particle simulation of particle–fluid flow: Model formulations and their applicability. J. Fluid Mech. 2010, 661, 482–510. [Google Scholar] [CrossRef]
- Xia, C.; Zhao, R.; Shi, W.; Zhang, D.; Gao, X. Numerical investigation of particle induced erosion in a mixed pump by CFD-DEM coupled method. J. Eng. Therm. 2021, 42, 357–369. [Google Scholar]
- Hu, G. Analysis and Simulation of Particle System by Discrete Element Method, 1st ed.; Wuhan University of Technology Press: Wuhan, China, 2010; pp. 144–146. [Google Scholar]
- Zhou, L.; Zhang, L.; Bai, L.; Shi, W.; Li, W.; Wang, C.; Agarwal, R. Experimental study and transient CFD/DEM simulation in a fluidized bed based on different drag models. RSC. Adv. 2017, 7, 12764–12774. [Google Scholar] [CrossRef] [Green Version]
- Odar, F.; Hamilton, W.S. Forces on a sphere accelerating in a viscous fluid. J. Fluid Mech. 1964, 18, 302–314. [Google Scholar] [CrossRef] [Green Version]
- Anderson, T.B.; Jackson, R. A fluid mechanical description of fluidized beds. Ind. Eng. Chem. Fundam. 1967, 6, 527–539. [Google Scholar] [CrossRef]
- Saffman, P.G. The lift on a small sphere in a slow shear. J. Fluid Mech. 1965, 22, 385–400. [Google Scholar] [CrossRef] [Green Version]
- Rubinow, S.I.; Keller, J.B. The transverse force on a spinning sphere moving in a viscous fluid. J. Fluid Mech. 1961, 11, 447–459. [Google Scholar] [CrossRef]
- Oesterlé, B.; Dinh, T.B. Experiments on the lift of a spinning sphere in a range of intermediate Reynolds numbers. Exp. Fluids 1998, 25, 16–22. [Google Scholar] [CrossRef]
- Johnson, K.L.; Kendall, K.; Roberts, A.D. Surface energy and the contact of elastic solids. Proc. R. Soc. Lond. A Math. Phys. Sci. 1971, 324, 301–313. [Google Scholar]
- Liu, G.; Li, S.; Yao, Q. A JKR-based dynamic model for the impact of micro-particle with a flat surface. Powder Technol. 2011, 207, 215–223. [Google Scholar] [CrossRef]
- Xu, N.; Xing, W.; Zhao, Y. Inorganic Membrane Separation Technology and Application, 1st ed.; Chemical Industry Press: Beijing, China, 2003; pp. 42–53. [Google Scholar]
- Yang, Y.; Cheng, Y.M.; Sun, Q.C. The effects of rolling resistance and non-convex particle on the mechanics of the undrained granular assembles in 2D. Powder Technol. 2017, 318, 528–542. [Google Scholar] [CrossRef]
- Xiong, G.L.; Gao, Z.S.; Hong, C.J.; Qiu, B.Q.; Li, S.Q. Effect of the rolling friction coefficient on particles’ deposition morphology on single fiber. Comput. Geotech. 2020, 121, 103450. [Google Scholar] [CrossRef]
Figure 1.
Flowchart of the CFD-DEM coupling.

Figure 2.
The structure of the pores of the ceramic membrane and the size of the computational domain. (a) Isometric view; (b) XZ plan view.
Figure 2.
The structure of the pores of the ceramic membrane and the size of the computational domain. (a) Isometric view; (b) XZ plan view.

Figure 3.
Differential pressure curve with time.

Figure 4.
Bridging process. (a) A(); (b) B(); (c) C(); (d) D().


Figure 5.
Curve of cumulative number of particles passing through with time.

Figure 6.
Variation curve of filter cake height with time.

Figure 7.
Cloud map of the volume fraction occupied by particles with time. (a) t = 1.5 ms; (b) t = 3.0 ms; (c) t = 3.5 ms; (d) t = 4.0 ms; (e) t = 5.5 ms; (f) t = 7.0 ms.
Figure 7.
Cloud map of the volume fraction occupied by particles with time. (a) t = 1.5 ms; (b) t = 3.0 ms; (c) t = 3.5 ms; (d) t = 4.0 ms; (e) t = 5.5 ms; (f) t = 7.0 ms.

Figure 8.
Effect of particle concentration on bridging time.

Figure 9.
Effect of particle concentration on interference resistance and particle bridge porosity.

Figure 10.
Effect of particle concentration on average porosity of filter cake.

Figure 11.
Effect of particle concentration on filtration efficiency.

Figure 12.
Influence of inlet velocity on bridging time.

Figure 13.
Influence of inlet velocity on filtration efficiency.

Figure 14.
Effect of inlet velocity on interference resistance and particle bridge porosity.

Figure 15.
Influence of inlet velocity on pressure drop.


Table 1.
Physical parameters.
| Physical Parameters | Value | Unit | |
|---|---|---|---|
| Fluid viscosity | 1.79 × 10⁻⁵ | Pa·s | |
| Gas phase | Fluid density | 1.23 | kg/m3 |
| Time step | 1 × 10⁻⁷ | s | |
| Particle radius | 1 | μm | |
| Particle mass density | 1451 | kg/m3 | |
| Particle phase | Shear modulus | 2 × 10⁷ | Pa |
| Poisson’s ratio | 0.25 | - | |
| Time step | 1 × 10⁻⁹ | s | |
| Membrane density | 3100 | kg/m3 | |
| Membrane | Shear modulus | 7 × 10¹⁰ | Pa |
| Poisson ratio | 0.2 | - |
Table 2.
Collision parameters.
| Collision Parameters | Coefficient of Restitution | Coefficient of Static Friction | Coefficient of Rolling Friction | Surface Energy (J/m2) |
|---|---|---|---|---|
| Particle–particle | 0.3 | 0.15 | 0.05 | 0.085 |
| Particle–membrane | 0.3 | 0.15 | 0.05 | 0.1 |
Publisher’s Note: MDPI stays neutral with regard to jurisdictional claims in published maps and institutional affiliations. |
© 2022 by the authors. Licensee MDPI, Basel, Switzerland. This article is an open access article distributed under the terms and conditions of the Creative Commons Attribution (CC BY) license (https://creativecommons.org/licenses/by/4.0/).
Share and Cite
MDPI and ACS Style
Wang, H.; Wu, J.; Fu, P.; Qu, Z.; Zhao, W.; Song, Y. CFD-DEM Study of Bridging Mechanism of Particles in Ceramic Membrane Pores under Surface Filtration Conditions. Processes 2022, 10, 475. https://doi.org/10.3390/pr10030475
AMA Style
Wang H, Wu J, Fu P, Qu Z, Zhao W, Song Y. CFD-DEM Study of Bridging Mechanism of Particles in Ceramic Membrane Pores under Surface Filtration Conditions. Processes. 2022; 10(3):475. https://doi.org/10.3390/pr10030475
Chicago/Turabian StyleWang, Hao, Junfei Wu, Ping Fu, Zhiping Qu, Wenjie Zhao, and Yixuan Song. 2022. "CFD-DEM Study of Bridging Mechanism of Particles in Ceramic Membrane Pores under Surface Filtration Conditions" Processes 10, no. 3: 475. https://doi.org/10.3390/pr10030475
Note that from the first issue of 2016, this journal uses article numbers instead of page numbers. See further details here.