
Treatment of Winery Wastewater with a Combination of Adsorption and Thermocatalytic Processes


1
Escuela Internacional de Doctorado (EIDO), Campus da Auga, Campus Universitário de Ourense, Universidade de Vigo, As Lagoas, 32004 Ourense, Spain
2
Centro de Química de Vila Real (CQVR), Departamento de Química, Universidade de Trás-os-Montes e Alto Douro (UTAD), Quinta de Prados, 5001-801 Vila Real, Portugal
*
Author to whom correspondence should be addressed.
Processes 2022, 10(1), 75; https://doi.org/10.3390/pr10010075
Submission received: 30 November 2021
/
Revised: 24 December 2021
/
Accepted: 28 December 2021
/
Published: 30 December 2021
(This article belongs to the Section Environmental and Green Processes)
Abstract
:The release of winery wastewater (WW) into the environment, without proper treatment, can cause severe problems to freshwater quality and natural fauna and flora. Therefore, in this work a treatment process was studied, combining adsorption and thermocatalytic oxidation processes. In a more specific way, it optimized the combination of activated sodium bentonite (Na-Mt) and potassium persulfate (KPS)/sodium percarbonate (SPC) as oxidant agents. With the combination of best operational conditions of adsorption ([Na-Mt] = 5.0 g/L, pH = 3.0, V = 500 mL, agitation 350 rpm, T = 298 K, t = 24 h) and thermocatalytic oxidation processes (/H2O2 ratio = 1:0.25, /H2O2 dosage = 0.1:0.025 (g/g), pH = 7.0, T = 343 K, agitation 350 rpm, t = 2 h), a total organic carbon, chemical oxygen demand and total polyphenols removal of 76.7, 81.4 and >99% was achieved, respectively. Finally, it was evaluated the effect of the treatment processes in the germination index (GI) of different plant seeds. A GI > 80% was achieved, showing a low phytotoxicity effect of the processes applied in the winery wastewater treatment.
1. Introduction
Portugal is a Mediterranean wine producer, with an approximated vineyard area of 194,000 ha and a wine production of 6.4 MhL in 2020. It is considered the 11th largest producer and exporter of wine worldwide [1]. To produce wine, wineries generate a significant load of residues. It is estimated that for each liter of wine produced, between 1.3 and 1.5 kg of wastes are produced. Among these, up to 75% are WW [2,3]. Most of these wastewaters result from a various number of activities which includes cleaning of tanks, washing of floors and equipment, rinsing of transfer lines, bottling facilities and filtration units [4,5]. The release of these winery wastewaters without proper treatment can cause pollution of water, degradation of soil and damage to the vegetation by odors and air emissions [6]. In addition, the discharge of the winery wastewater into the soil without treatment can alter the physicochemical properties of the ground and surface waters, by affecting color, pH and electrical conductivity from the leaching of organic and inorganic ions [7].
To avoid the negative impact of the winery wastewater in the environment, several treatments have been performed, such as coagulation–flocculation–decantation [8], microalgae [9,10], Fenton and photo-Fenton processes [2,11], sulfate radicals [12] and wet air oxidation [13]. In this work, the application of adsorption with clay was studied as a treatment for winery wastewater. A similar treatment was performed by Jorge et al. [11], who observed a high organic removal from winery wastewater by the bentonite clay. Clays and clay minerals such as montmorillonite, vermiculite, illite, kaolinite and bentonite are widely used in petroleum industries, engineering and constructions, environmental remediation, ceramics and refractories, pharmaceuticals and agricultural sectors [14,15].
Bentonite is a 2:1 expandable montmorillonite clay and its unit layer structure consists of one Al3+ octahedral sheets. The modification reactions alter the surface and structural characteristics of clay by replacing the interlayer cations (e.g., Na+, K+, Ca2+) with specific species or sites [14]. Currently, bentonite is used worldwide to prevent the formation of protein haze in wines before bottling, through a process of adsorption of proteins onto the bentonite clay [16]. However, to our knowledge, the effects of adsorption with bentonite in the phenolic composition and germination index of plants were never studied before in the treatment of winery wastewater, therefore its effects are still unknown.
Sulfate radical-based advanced oxidation processes (SR-AOPs) are another process type that can be applied for winery wastewater treatment. The SR-AOPs have attracted increasing attention due to their advantages, which include: (1) high redox potential (2.5–3.1 V), (2) working under a wide range of pH [17] and (3) a longer life time (30–40 µs vs. 20 ns) than hydroxyl radicals [18,19]. The sulfate radicals can be activated by several different techniques such as: (1) alkali activation [20,21], (2) a metal catalyzed process [22,23,24], (3) heat activation [25,26], (4) radiation activation [27,28], (5) activated carbon [29,30] and (6) H2O2-based persulfate activation [31]. In this work, the activation of sulfate radicals by addition of potassium persulfate (KPS), hydrogen peroxide (H2O2) and heat was used for the first time in the treatment of winery wastewater. In addition, the application of H2O2 in solid form as sodium percarbonate (SPC, Na2CO3•1.5H2O2) was tested for the first time in WW treatment. The SPC has several advantages regarding liquid H2O2, such as (1) exceptional storage capability, (2) safe to handle, (3) it is a sustained-release oxidizing agent and (4) SPC and its decomposition products, such as carbon dioxide, water and a small amount of sodium carbonate, are non-toxic to microorganisms in groundwater [32].
The aim of this work is (1) to evaluate the performance of activated sodium bentonite in the adsorption process for the treatment of WW, (2) to study and optimize the thermocatalytic oxidation for the treatment of WW, (3) to evaluate the effect of combined treatment adsorption–thermocatalytic oxidation processes in the germination index of plant seeds and removal of phenolic compounds.
2. Materials and Methods
2.1. Reagents and Winery Wastewater Sampling
Activated sodium Bentonite (Na-Mt) was purchased by Angelo Coimbra & Ca., Lda (Maia, Portugal), sodium percarbonate (SPC, Na2CO3•1.5H2O2) by Alfa Aesar (Massachusetts, EUA) and persulfate or potassium peroxydisulfate (KPS, K2S2O8), by Scharlau (Sentmenat, Barcelona, Spain). NaOH and H2SO4 (95%) were acquired by Analar Normapur (Vila Nova de Gaia, Portugal). Deionized water was used to prepare the respective solutions. The WW was collected from a private Portuguese cellar unity located in the Douro region (Northeast of Portugal). The WW samples were stored at −40 °C, and the work was performed at the University of Trás-os-Montes and Alto Douro, located in Vila Real, Portugal, latitude 41°17′9.18″ N and longitude 7°44′21.45″ W.
2.2. Analytical Technics
Different physical–chemical parameters were measured in order to characterize the WW, including the chemical oxygen demand (COD), the biological oxygen demand (BOD5), the total organic carbon (TOC) and the total polyphenols (mg gallic acid/L). The main chemical parameters measured are shown in Table 1. The COD and BOD5 were determined according to Standard Methods (5220D; 5210D, respectively) [33]. COD analysis was carried out in a COD reactor from HACH Co. (Loveland, CO, USA) and a HACH DR 2400 spectrophotometer (Loveland, CO, USA) was used for colorimetric measurement. Biochemical oxygen demand (BOD5) was determined using a respirometric OxiTop® IS 12 system (WTW, Yellow Springs, OH, USA). The pH was measured by a 3510 pH meter (Jenway, Cole-Parmer, UK). The TOC content (mg C/L) was measured by a Shimadzu TOC-L CSH analyzer (Shimadzu, Kyoto, Japan). Total polyphenols content was determined following the Folin–Ciocalteau method [34]. Hydrogen peroxide concentration was followed using titanium (IV) oxysulfate (DIN 38 402H15 method) at 410 nm, by a HACH DR 2400 spectrophotometer (Loveland, CO, USA).
Phytotoxicity tests were performed, by germination of onion, cucumber, lettuce and corn seeds (standard species recommended by the US Environmental Protection Agency, the US Food and Drug Administration and the Organization for Economic Cooperation and Development [35]) and determined by Equation (1) in accordance to Varnero et al. [36] and Tiquia and Tam [37], as follows:
where GI is the germination index, is the arithmetic mean of the number of germinated seeds in each extract (wastewater), is the arithmetic mean of the number of germinated seeds on standard solution (distilled water), is the mean root length in each extract (wastewater) and is the mean root length in control (distilled water).

Table 1.
Physical–chemical characterization of winery wastewater [38].
Table 1.
Physical–chemical characterization of winery wastewater [38].
| Parameter | Value |
|---|---|
| pH | 4.0 |
| Conductivity (µS/cm) | 385 |
| Turbidity (NTU) | 1205 |
| Total Suspended Solids (mg/L) | 3910 |
| Chemical Oxygen Demand (mg O2/L) | 9870 |
| Biochemical Oxygen Demand (mg O2/L) | 1250 |
| Total Organic Carbon (mg C/L) | 1497 |
| Total Polyphenols (mg gallic acid/L) | 87 |
| Ferrous Iron (mg Fe/L) | 0.05 |
| Biodegradability Index—BOD5/COD | 0.13 |
2.3. Phenolic and Chromatic (CIELab) Characterization
Color intensity (CI) and Hue were measured as described by the OIV method [39]; total polyphenol index (TPI) was measured using the Curvelo-Garcia method [40]; total phenols, non-flavonoids and flavonoids were determined according to Kramling and Singleton [41]. Total anthocyanins (C) were analyzed by SO2 bleaching method, as reported by Ribéreau-Gayon et al. [42]; colored anthocyanins (CA), total pigments (TP) and polymeric pigments (PP) were determined by the method described by Somers and Evans [43] and total tannins were determined by the leucoanthocyanin (LA) method [44]. All samples were analyzed by a GENESYSTM 10 Series Spectrophotometer (Thermo Fisher Scientific, Waltham, Massachusetts, USA). A Shimadzu UV-2101 spectrophotometer (Shimadzu, Kyoto, Japan) was used to record the absorption spectra of the WW samples, with a scan from a range between 380 and 770 nm, with 5 nm distance, using 1 cm path length quartz cells. Data were collected to determine a measure of L (lightness), a (redness) and b (yellowness) coordinates using the CIELab 1976 method. This allows reliable quantification of the overall color difference of a sample when compared to a reference sample (Blanc). Color differences can be distinguished by the human eye when the difference between values are greater than two units, in accordance to Spagna et al. [45]. All analyses were performed in duplicate. Table 2 resumes the formulas used in this work.
2.4. Characterization of Activated Sodium Bentonite
The structural composition of bentonite was studied by Fourier-transform infrared spectroscopy (FTIR) spectra, which was obtained by mixing 2 mg of Na-Mt powder with 200 mg potassium bromide (KBr). The powder was introduced into molds and pressed at 10 ton/cm−2 to obtain the transparent pellets, which were analyzed by a Bruker Tensor 27 spectrometer, and the infrared spectra in transmission mode were recorded in the 4000–400 cm−1 frequency region. The microstructural characterization of the Na-Mt was performed by scanning electron microscope (FEI QUANTA 400 SEM/ESEM, Fei Quanta, Hillsboro, WA, USA) and the chemical composition of the bentonite was estimated (Table 3) using the energy dispersive X-ray spectroscopy (EDS/EDAX, PAN’alytical X’Pert PRO, Davis, CA, USA).
The textural parameters of the bentonite were obtained from N2 adsorption–desorption isotherms at 77 K using a Micromeritics ASAP 2020 apparatus (TriStar II Plus, Micromeritics Instrument Corporation, Norcross, GA, USA). The bentonite sample was degassed at 150 °C up to 10−4 Torr before analysis. The specific surface area (SBET) was then measured by applying Gurevitsch’s rule at a relative pressure p/p0 = 0.30 and according to the Brunauer, Emmet, Teller (BET) method from the linear part of the nitrogen adsorption isotherms. Different pore volumes were determined by the Barrett, Joyner, Halenda model (BJH model).
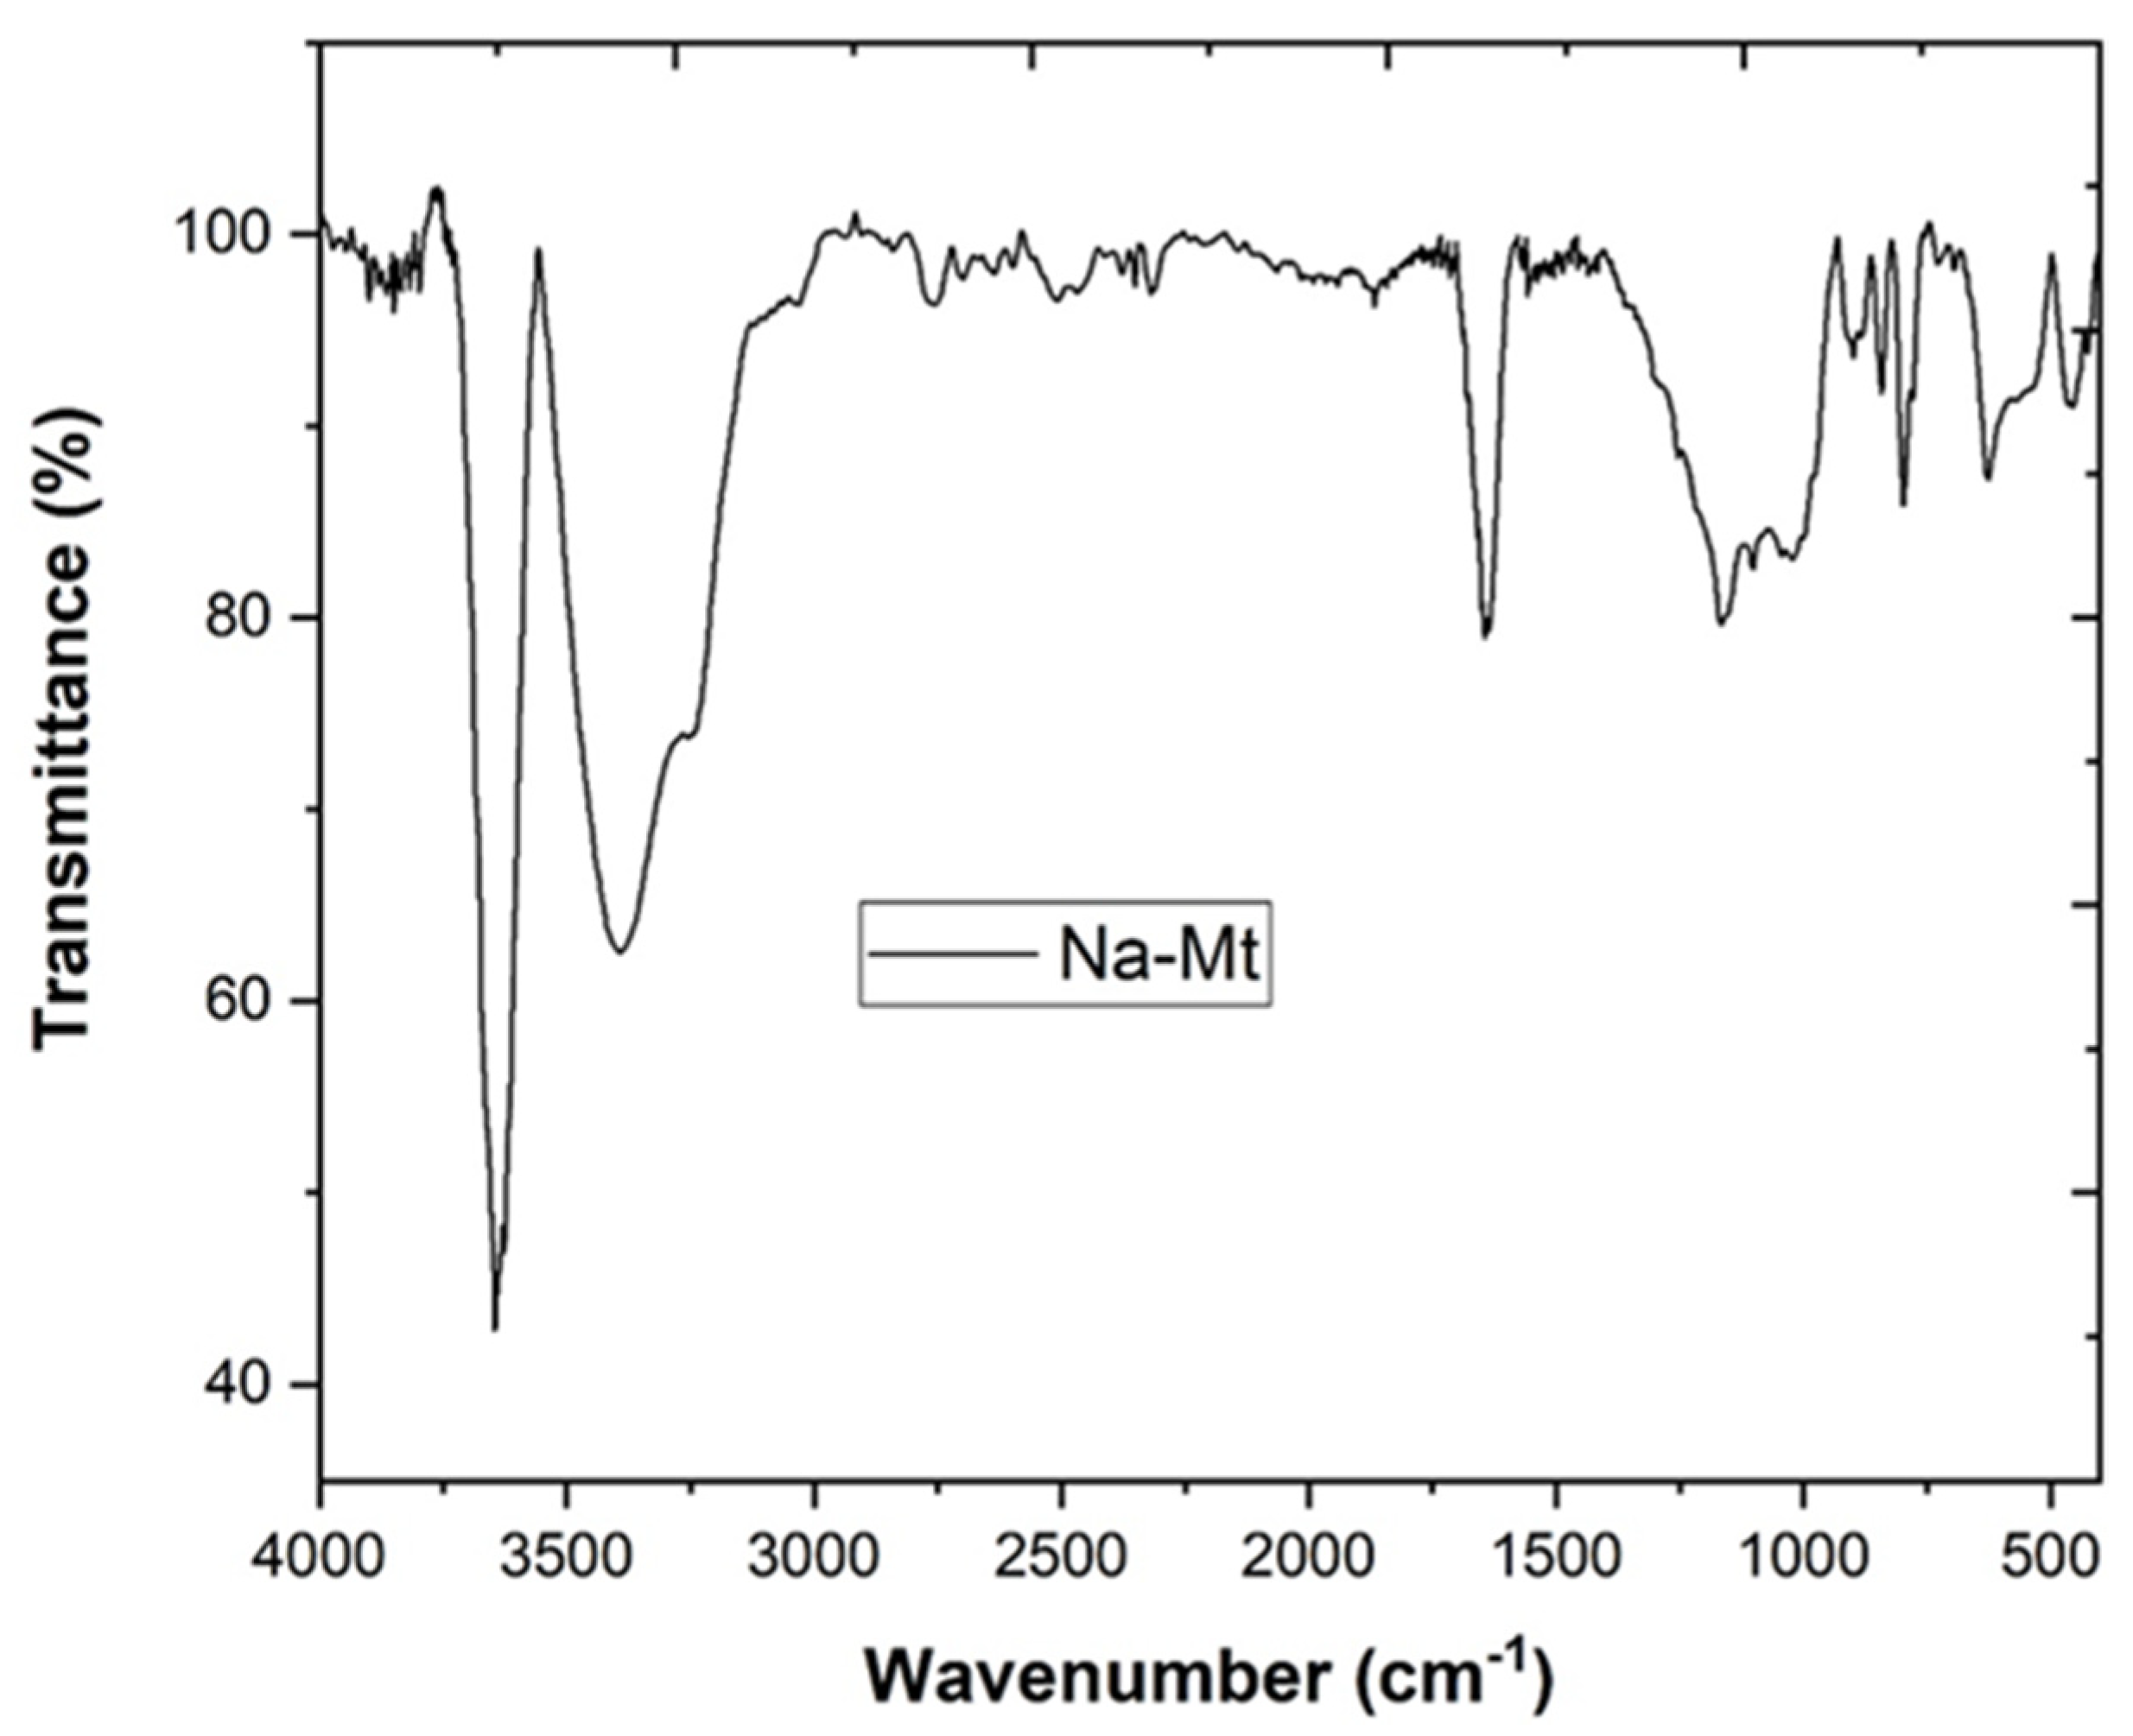
From FTIR analysis (Figure 1) [38], Na-Mt exhibits the stretching vibration of structural O–H groups at 3645 cm−1, structural Si–O groups at 1103, 999 and 789 cm−1, structural Al–O–Al–OH groups at 902 cm−1, structural Al–O–Fe–OH groups at 883 cm−1, the free and interlayer water in bond stretching vibration at 3396 cm−1 and adsorbed water yielded bending at 1643 cm−1 [47,48,49,50].
The results obtained by BET analysis showed that bentonite exhibited a mesoporous structure with a specific surface area of 8.8 m2/g, a total pore volume of 0.045 cm3/g and a particle size of 4.0 nm. The respective isotherms can be classified as type II, where unrestricted monolayer–multilayer adsorption occurs, and the behavior of the hysteresis loops can be associated with type H3, which usually corresponds to aggregates of plate-like particles forming slit-like pores [51], which is in agreement with these material structures.
2.5. Adsorption Experimental Setup
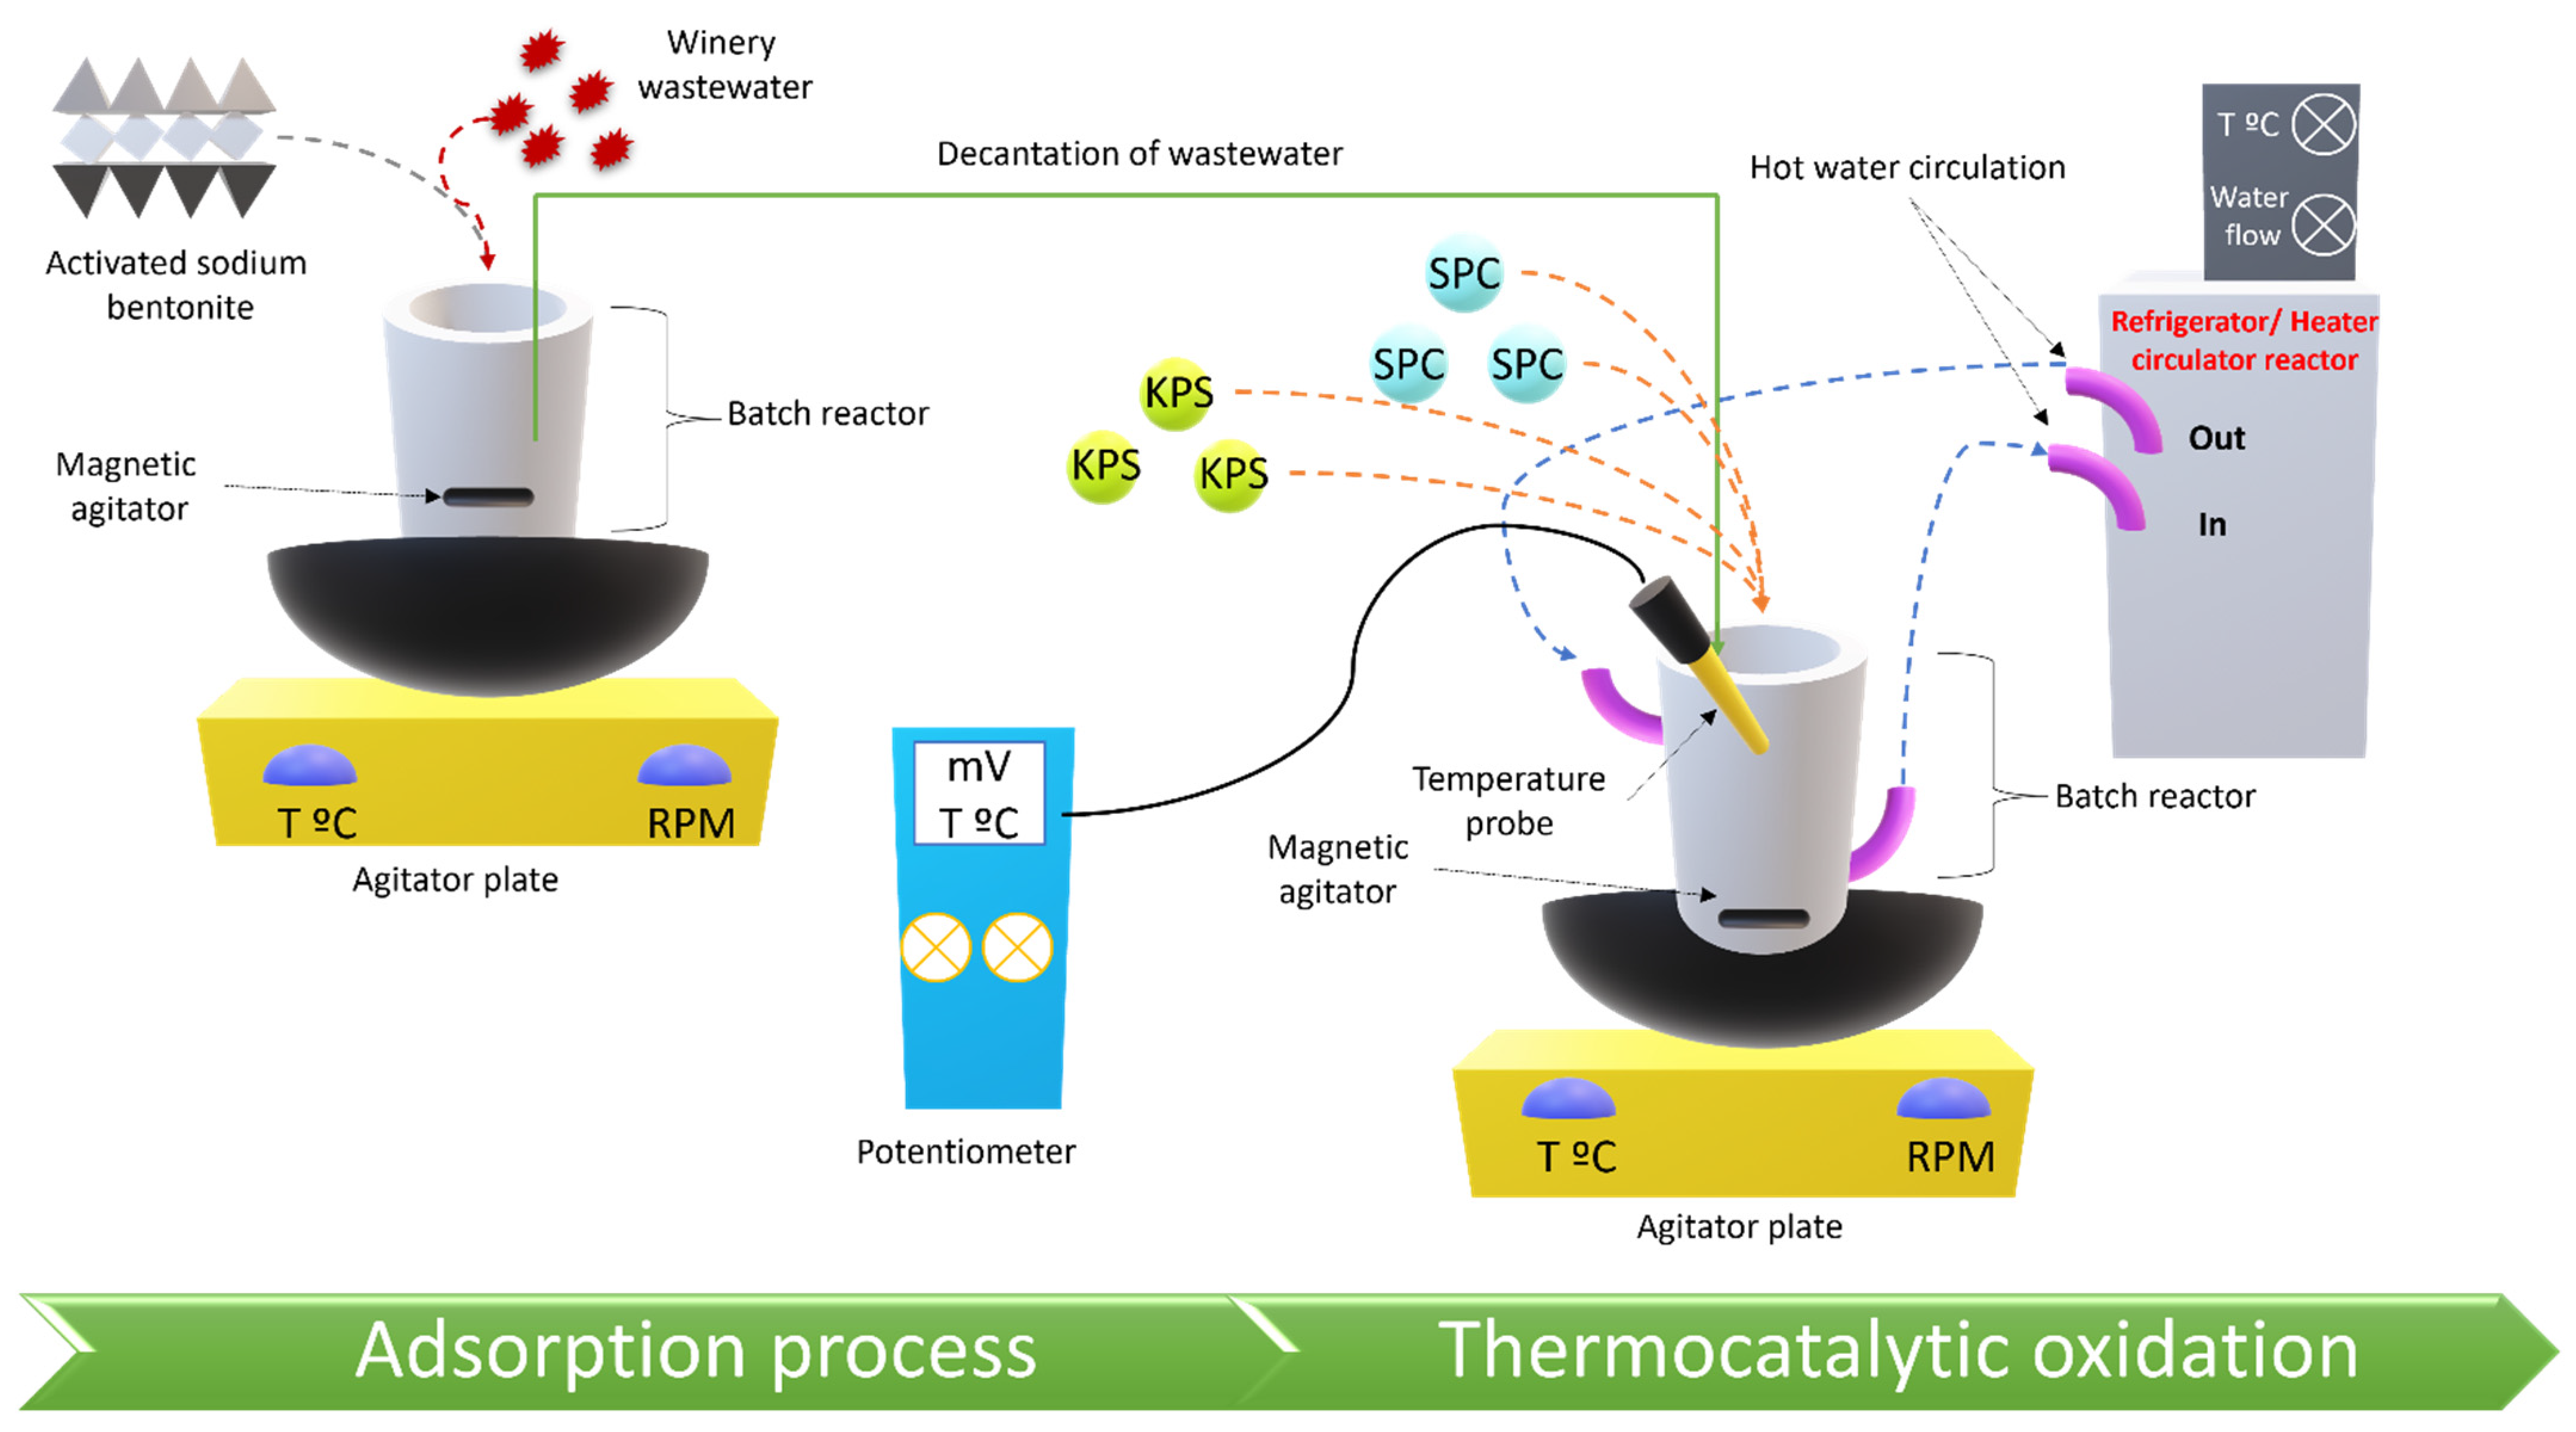
The adsorption of organic matter from WW on Na-Mt material was studied in detail (Figure 2), in order to predict the amount of organic carbon that was removed through adsorption. The adsorption process was optimized as follows:
- Variation of pH (2.0–11) under the following operational conditions: [Na-Mt] = 3.0 g/L, V = 500 mL, agitation 350 rpm, T = 298 K, t = 24 h;
- Variation of Na-Mt dosage (0.5–10 g/L) under the following operational conditions: pH = 3.0, V = 500 mL, agitation 350 rpm, T = 298 K, t = 24 h.
After 24 h, samples were centrifuged and filtrated for analysis.
2.6. Thermocatalytic Experimental Setup
The thermocatalytic oxidation process (Figure 2) was carried out by a refrigerator/heater circulator reactor (Julabo F25, Seelbach, Germany). The heater is equipped with a power of 2.2 kW and the refrigerator as a power of 0.170 kW. To achieve the maximum removal efficiency, thermocatalytic experiments were carried as follows:
- Variation of /H2O2 ratio (1:0; 1:0.25; 1:0.50; 1:0.75; 1:1; 1:1.5) under the following operational conditions: [] = 1.0 g/L, pH = 11.0, T = 333 K, agitation 350 rpm, t = 2 h;
- Variation of /H2O2 dosage (0.1:0.025; 0.5:0.125; 1:0.25; 1.5:0.375; 2:0.5) under the following operational conditions: /H2O2 ratio = 1:0.25, pH = 11.0, T = 333 K, agitation 350 rpm, t = 2 h;
- Variation of pH (3.0, 5.0, 7.0, 9.0, 11) under the following operational conditions: /H2O2 ratio = 1:0.25, /H2O2 dosage = 0.1:0.025 (g/g), T = 333 K, agitation 350 rpm, t = 2 h;
- Variation of temperature (303, 313, 323, 333 and 343 K) under the following operational conditions: /H2O2 ratio = 1:0.25, /H2O2 dosage = 0.1:0.025 (g/g), pH = 7.0, agitation 350 rpm, t = 2 h.
After 2 h, samples were centrifuged and filtrated for analysis. The percentage of contaminant removed through adsorption and thermocatalytic oxidation was calculated in accordance to Equation (2) [52], as follows:
where (Xi) of water contamination represents turbidity, TSS, COD and total polyphenol; C0 and Cf are the initial and final concentrations, respectively.
2.7. Statistical Analysis
All experiments were performed at least in duplicate and the observed standard deviation was always less than 5% of the reported value. Statistical analysis was performed using one-way analysis of variance (ANOVA) and differences were considered significant when p < 0.05. Average values were compared using Tukey’s test. The statistical analyses were performed using OriginLab 2019 software (Northampton, MA, USA). The data are presented as mean and standard error (mean ± SE).
3. Results and Discussion
3.1. Adsorption Experiments with Bentonite
3.1.1. Effect of pH
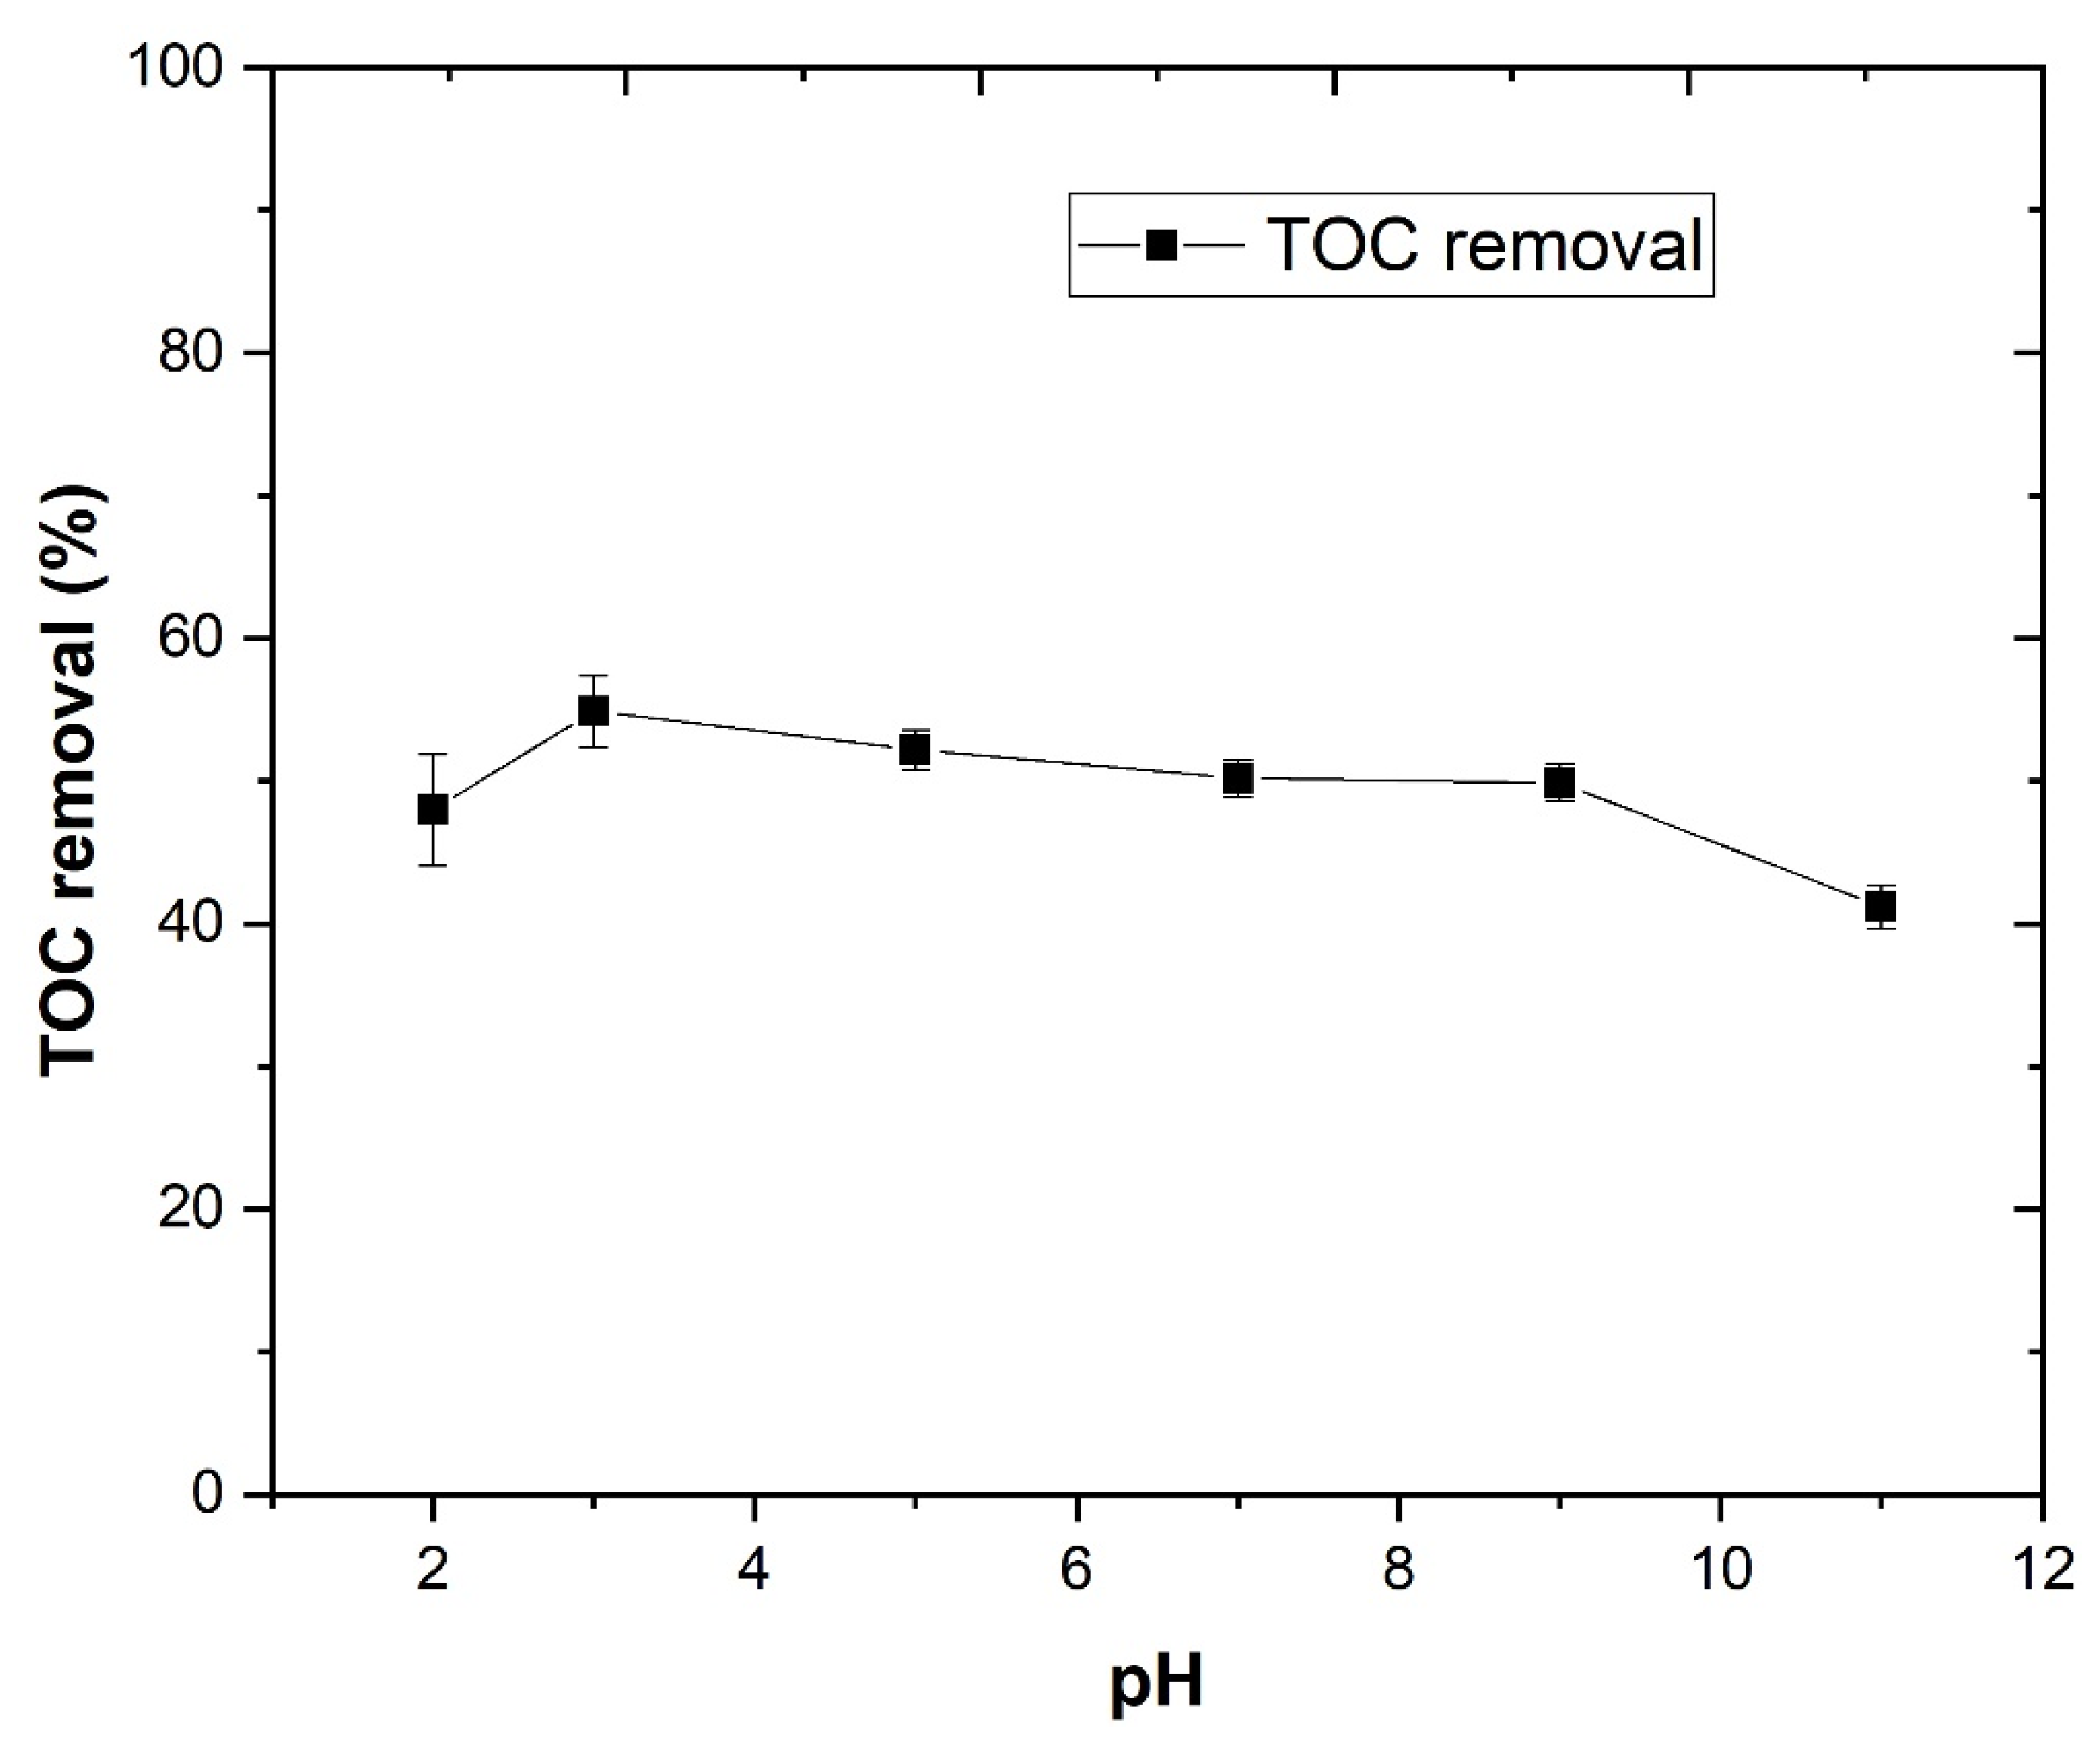
The ability of activated sodium Bentonite (Na-Mt) to adsorb and remove the organic content from the WW was accessed at different pH conditions (2.0–11.0), under the following operational conditions: [Na-Mt] = 3.0 g/L, V = 500 mL, agitation 350 rpm, T = 298 K, t = 24 h. It is known that the variable charge of montmorillonite is significantly affected by pH, due to the ionization of its external hydroxyl groups [53]. At pH lower than pHpzc (pH at the point of zero charge), the clay exhibits anionic exchange capacity, while at pH greater than pHpzc, the clay displays high cation-exchange capacity. In the case of bentonite, it renders negative charge on its surface due to its isomorphous substitution of Al3+ for Si4+ in tetrahedral layer and Mg2+ for Al3+ in octahedral sheet and therefore can attract positively charged pollutants [14,54]. However, as observed by several authors [55,56], the mechanism of adsorption on clays is mainly controlled by the adsorption on its interlayer region, since about 85–90% of the available sites for adsorption are located on its internal surface. In this way, the permanent negative charge of montmorillonite is compensated by the cation exchange process, where the initial Na+ ions may be replaced by positively charged species. Therefore, the contaminant uptake will significantly depend on its charge at given pH [53].
The results in Figure 3, showed a significant increase in TOC removal from pH 2.0 to 3.0 (48.0 and 54.9%, respectively), decreasing as the pH increased to 5.0, 7.0, 9.0 and 11.0 (52.2, 50.2, 49.9 and 41.2%, respectively). In this work, the higher adsorption capacity obtained at pH 3.0, was probably related with the concentration of amphoteric flavylium species present in the WW, making them potentially treated by adsorption. Thus, at pH 3.0 these species acquired positive charge and exchanged the Na+ ions initially adsorbed on the interlayer region [53]. Increasing the pH > 3.0, the isoelectric point of bentonite was reached (pH = 7) [57], decreasing the bentonite adsorption capacity. In a study performed by Sharma et al. [58] it was observed that the adsorption capacity of methyl blue, anionic dye, onto the clay was decreased with the increase in initial pH of the suspension to alkaline pH. Therefore, considering these results, pH 3.0 was selected as the best pH for the adsorption process.
3.1.2. Effect of Na-Mt Dosage
In the previous section, it was observed that the pH had a significant effect in the adsorption process of WW by Na-Mt. However, the effect of Na-Mt dosage in adsorption process is still unknown; therefore, in this section it was varied the Na-Mt dosage (0.5–10.0 g/L) under the following operational conditions: pH = 3.0, V = 500 mL, agitation 350 rpm, T = 298 K, t = 24 h.
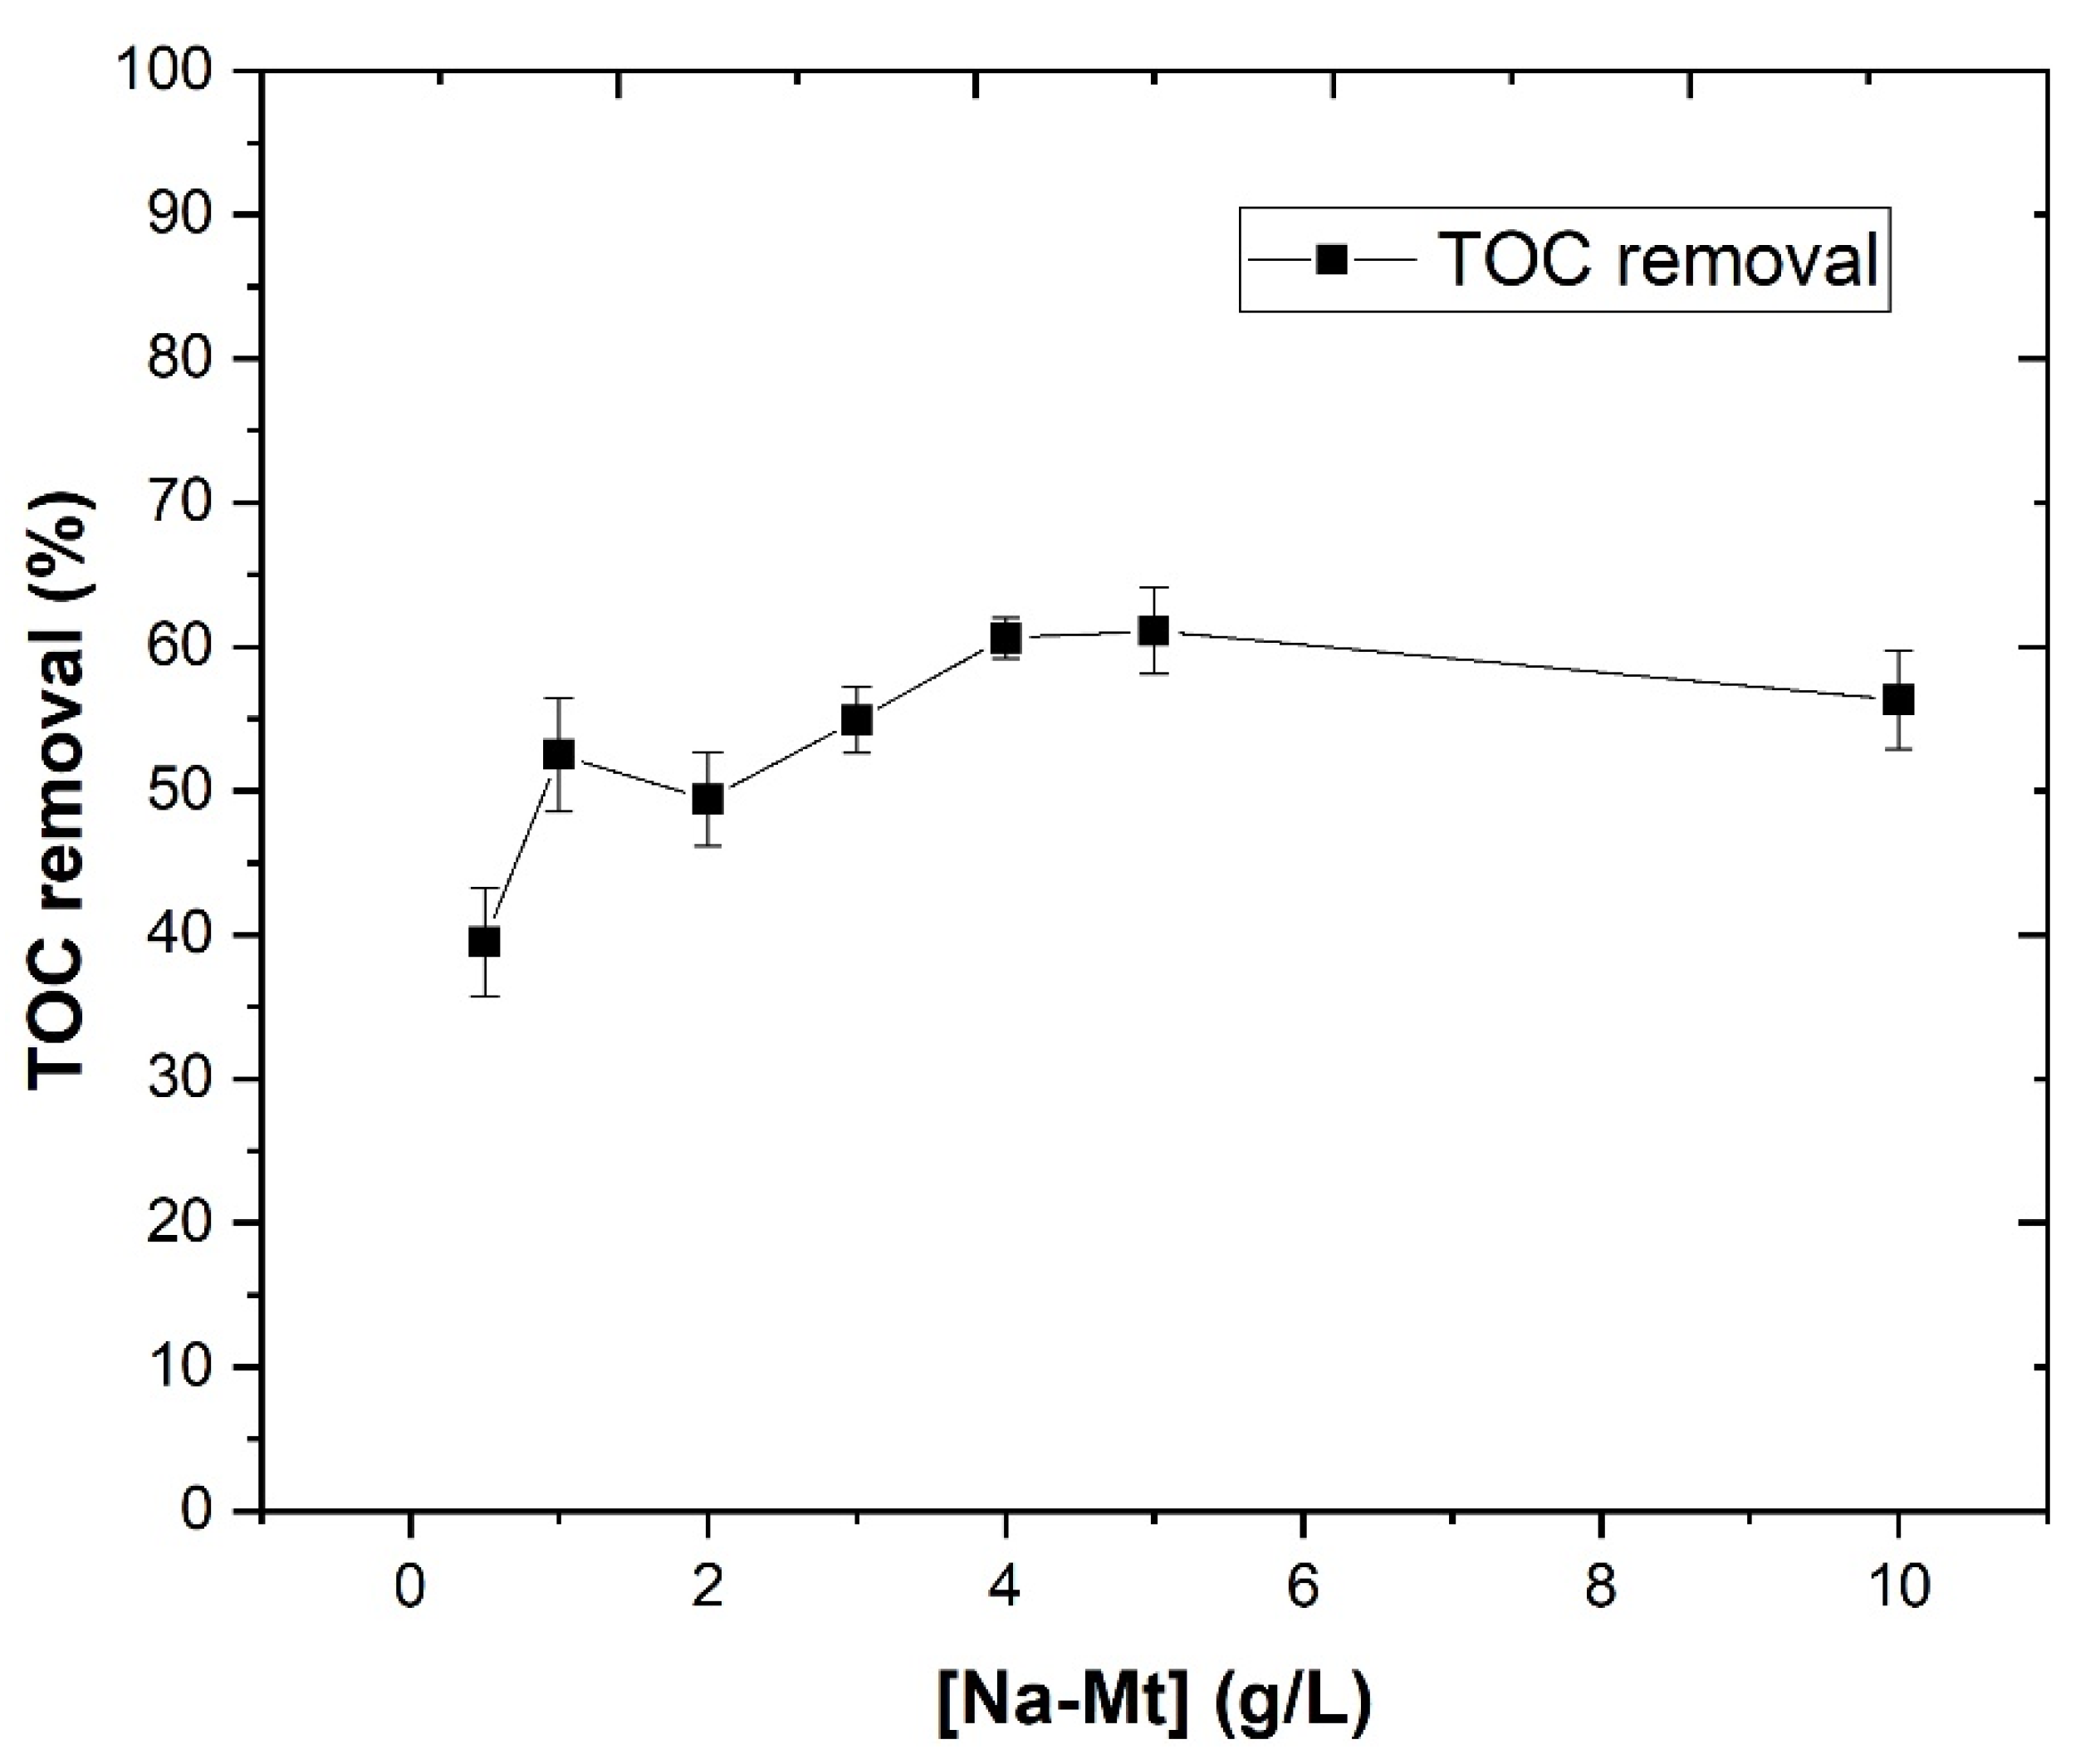
In Figure 4, it was observed an increase in TOC removal, with the increase in Na-Mt dosage from 0.5 to 5.0 g/L (39.5 to 61.1%, respectively). From 5.0 to 10.0 g/L Na-Mt, a small decrease in TOC removal was observed from 61.1 to 56.3%, respectively. Therefore, the application of Na-Mt dosages higher than 5.0 g/L were not considered viable, due to the low TOC removal results, as well as from an economic point of view, due to high Na-Mt application. In the work of Guimarães et al. [53] and Jorge et al. [11] it was also observed that application of clay concentrations higher than 3.0 g/L were not suitable for adsorption process of organic matter of WW.
Therefore, based on these results, the Na-Mt dosage of 5.0 g/L was selected as the most efficient dosage for the adsorption process.
3.2. Thermocatalytic Oxidation with KPS and SPC
3.2.1. SPC Releasing Mechanism
In the previous section, it was observed that the adsorption process was efficient for the removal of organic matter from WW. However, in order to achieve more substantial values an additional process is required. Therefore, a thermocatalytic oxidation process was performed in this work, in which potassium persulfate (KPS) was used in combination with sodium percarbonate (SPC) as oxidant agents. To decrease the use of iron, high temperatures were used for the activation of the oxidants. However, in order to perform this treatment, it was first necessary to understand the dissociation of SPC in water as observed in Equations (3) and (4) [59]. Table 4 shows an assay, in which SPC was applied under different concentrations (0.1–1.0 g/L) in water. The results showed that the theoretical H2O2 concentration was very similar to the measured H2O2 concentration, by titanium (IV) oxysulfate. TOC results showed a significant decrease from 1.226 to 1.039 to 0.0 mg C/L, respectively, for 0.1, 0.5 and 1.0 g/L of SPC. These results were in agreement to Cui et al. [32], who observed the decomposition of SPC into CO2, water and small amounts of sodium carbonate.
Na2CO3 + 1.5H2O2 → Na2CO3 + 1.5H2O2
1.5H2O2 → 1.5H2O + 0.75O2
3.2.2. Effect of S2O82−/H2O2 Ratio
In the works of Rodríguez-Chueca et al. [60,61], the WW was treated by SR-AOPs, in which sulfate radicals were activated by metallic catalysts, UV radiation and heat. Although persulfate reagent can act alone as an oxidant, its effectiveness is limited for oxidation of WW [62]. The generation of sulfate radicals during the persulfate oxidation process can be significantly investigated using different applications, such as UV radiation, heat and iron ions, as observed in Equations (5)–(7) [63], as follows:
The may initiate the production of other intermediate highly reactive oxygen species (ROS), such as hydroxyl radicals (), as observed in Equation (8) [64], as follows:
However, the use of metallic catalysts for the activation of sulfate radicals have the disadvantage of leaching, becoming toxic for the environment [65]; therefore, this work tested the activation of persulfate radicals by heat without addition of metallic catalyst. In addition, H2O2 reagent was used to activate persulfate and initiate sulfate radicals during the oxidation of the WW. To evaluate the performance of H2O2 in enhancing persulfate oxidation, the ratio /H2O2 (1:0; 1:0.25; 1:0.50; 1:0.75; 1:1; 1:1.5) was initially studied under the following operational conditions: [] = 1.0 g/L, pH = 11.0, T = 333 K, agitation 350 rpm, t = 2 h.
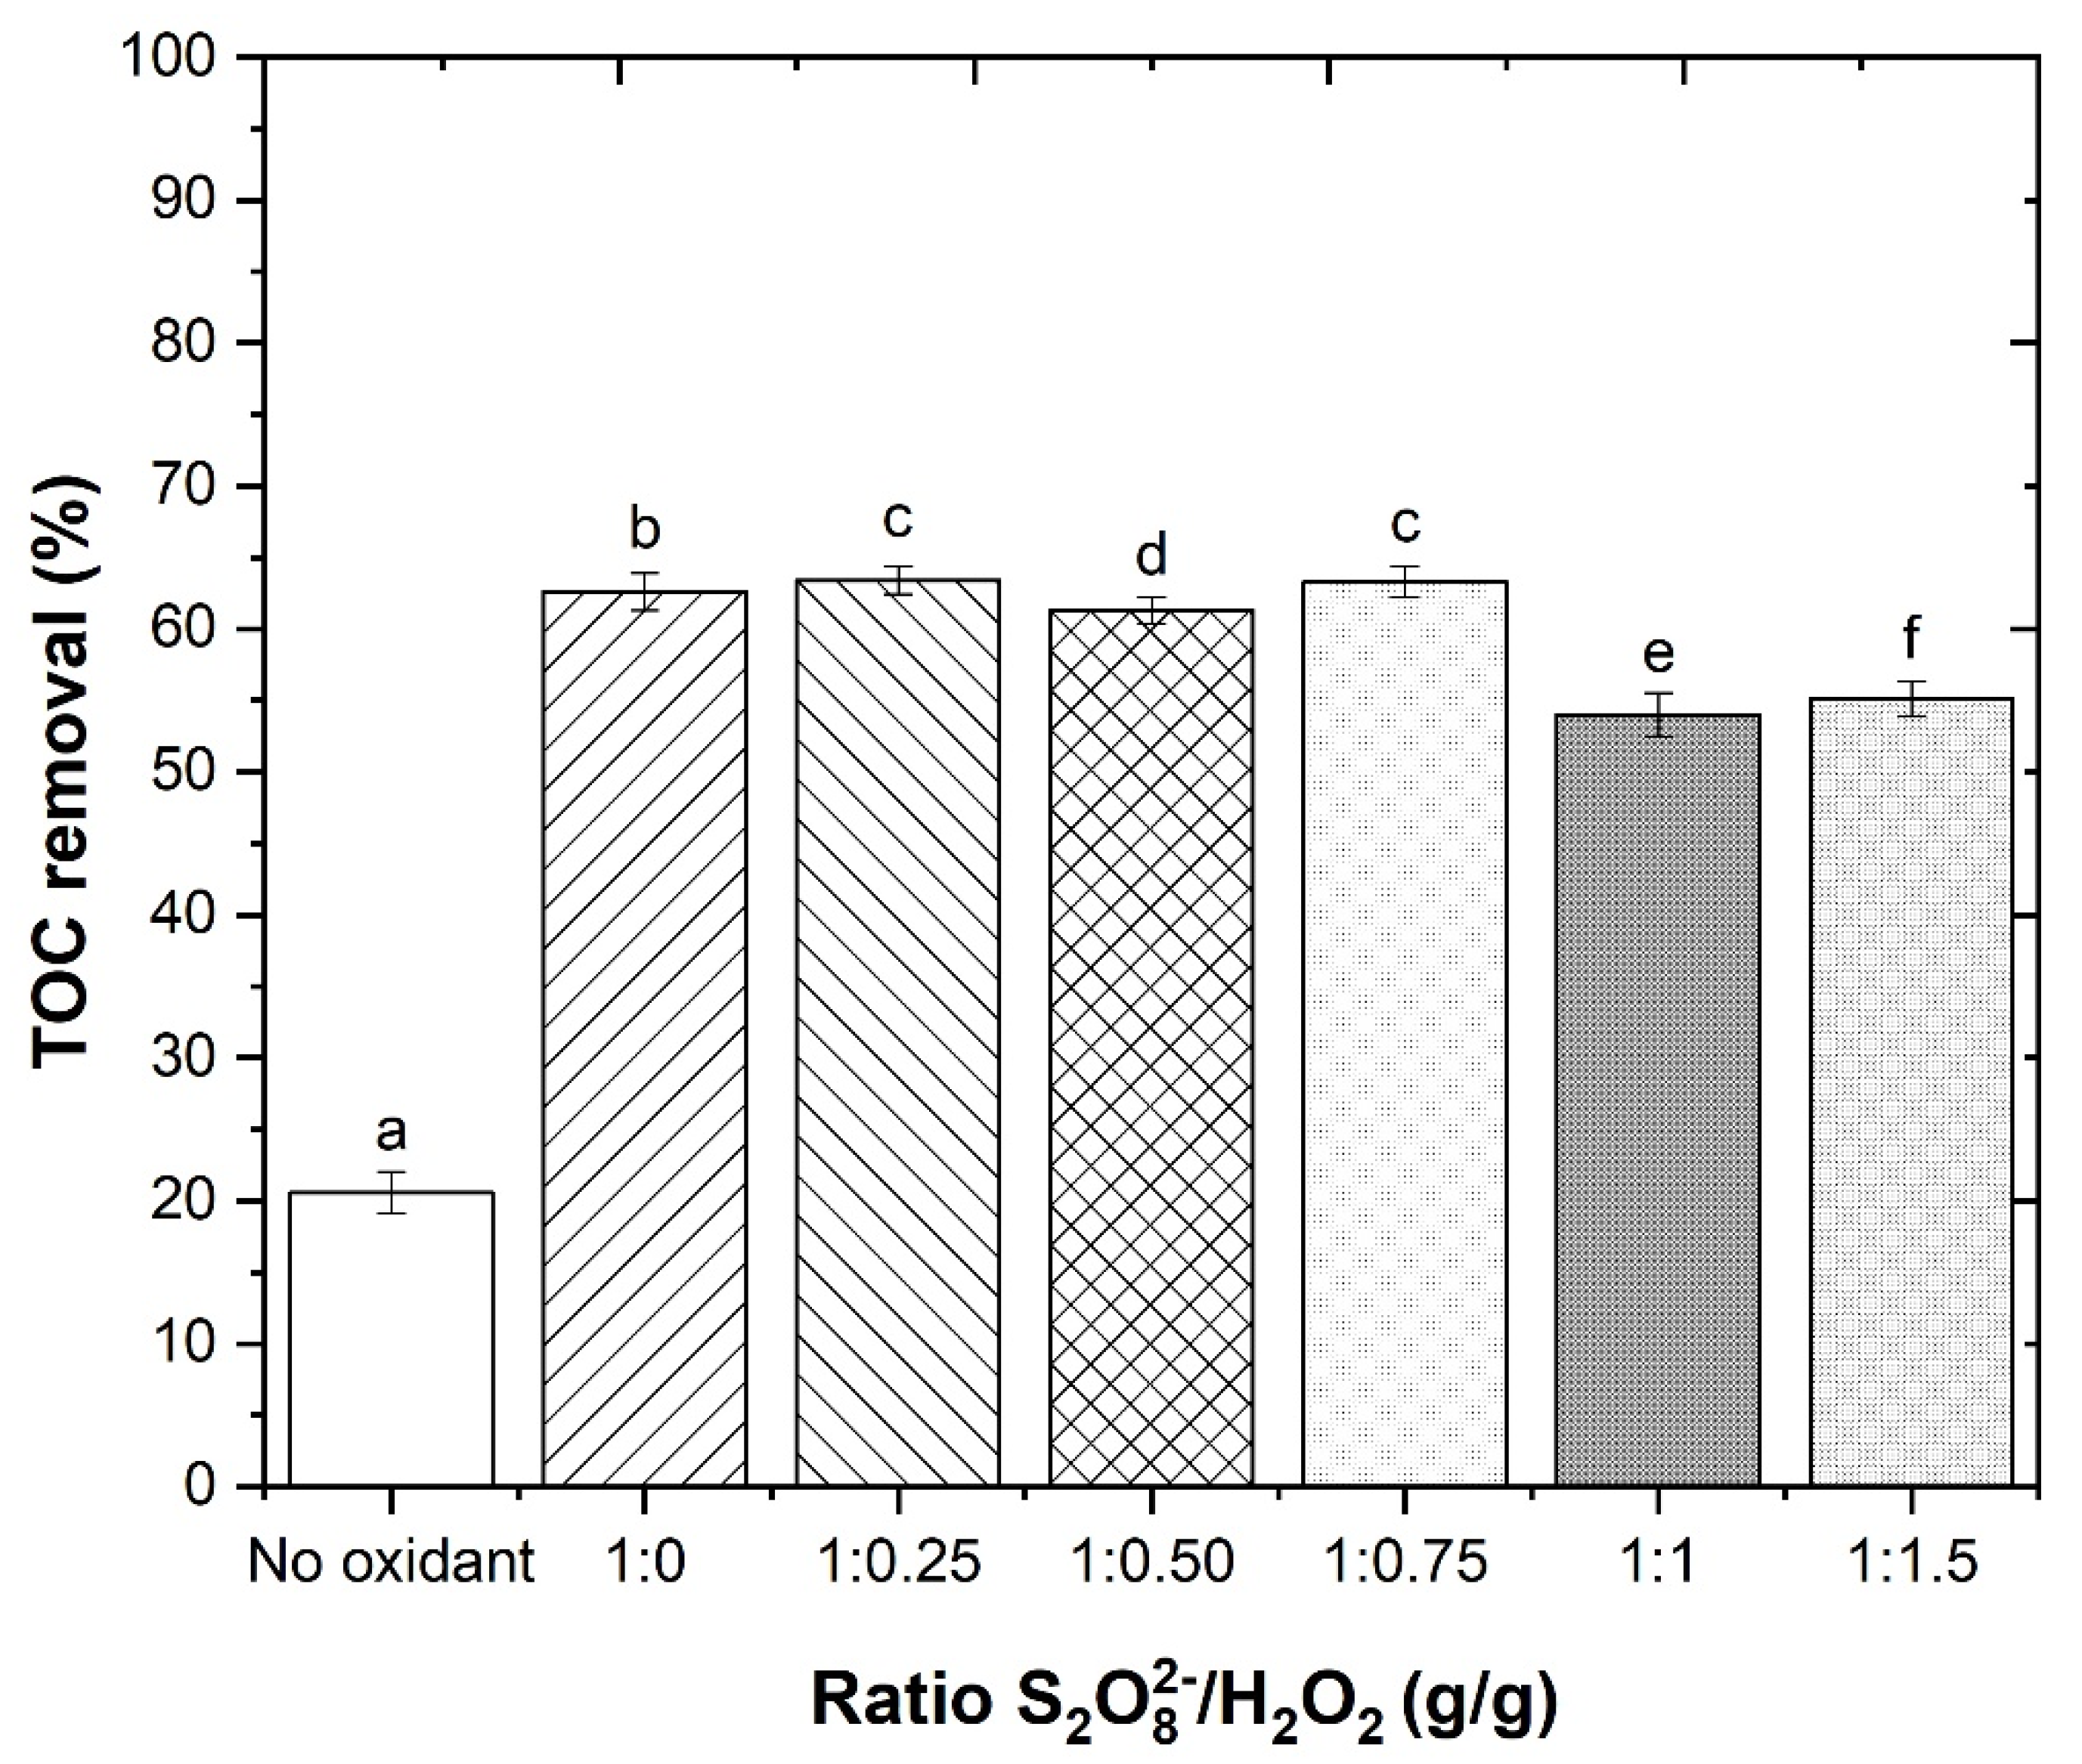
In observation of Figure 5, without oxidant addition, thermal oxidation achieved 20.6% TOC removal after 2 h of reaction, possibly, due to the evaporation of alcohol or the degradation of some phenolic compounds present in the WW. However, the WW has recalcitrant compounds in its composition, which were not degraded by heat. With application of the oxidant agents, it was observed a TOC removal of 62.6, 63.4, 61.3, 63.3, 54.0 and 55.1%, respectively. The highest TOC removal was observed with application of /H2O2 ratio of 1:0.25 (g/g). With the increase in this ratio, the sulfate radicals initiated scavenging reactions for radicals, thus decreasing the reactions efficiency, as observed by Equation (9) [62,66], as follows:
Therefore, based in these results, the ratio 1:0.25 (g/g) /H2O2 was selected as the best ratio.
3.2.3. Effect of S2O82−/H2O2 Dosage
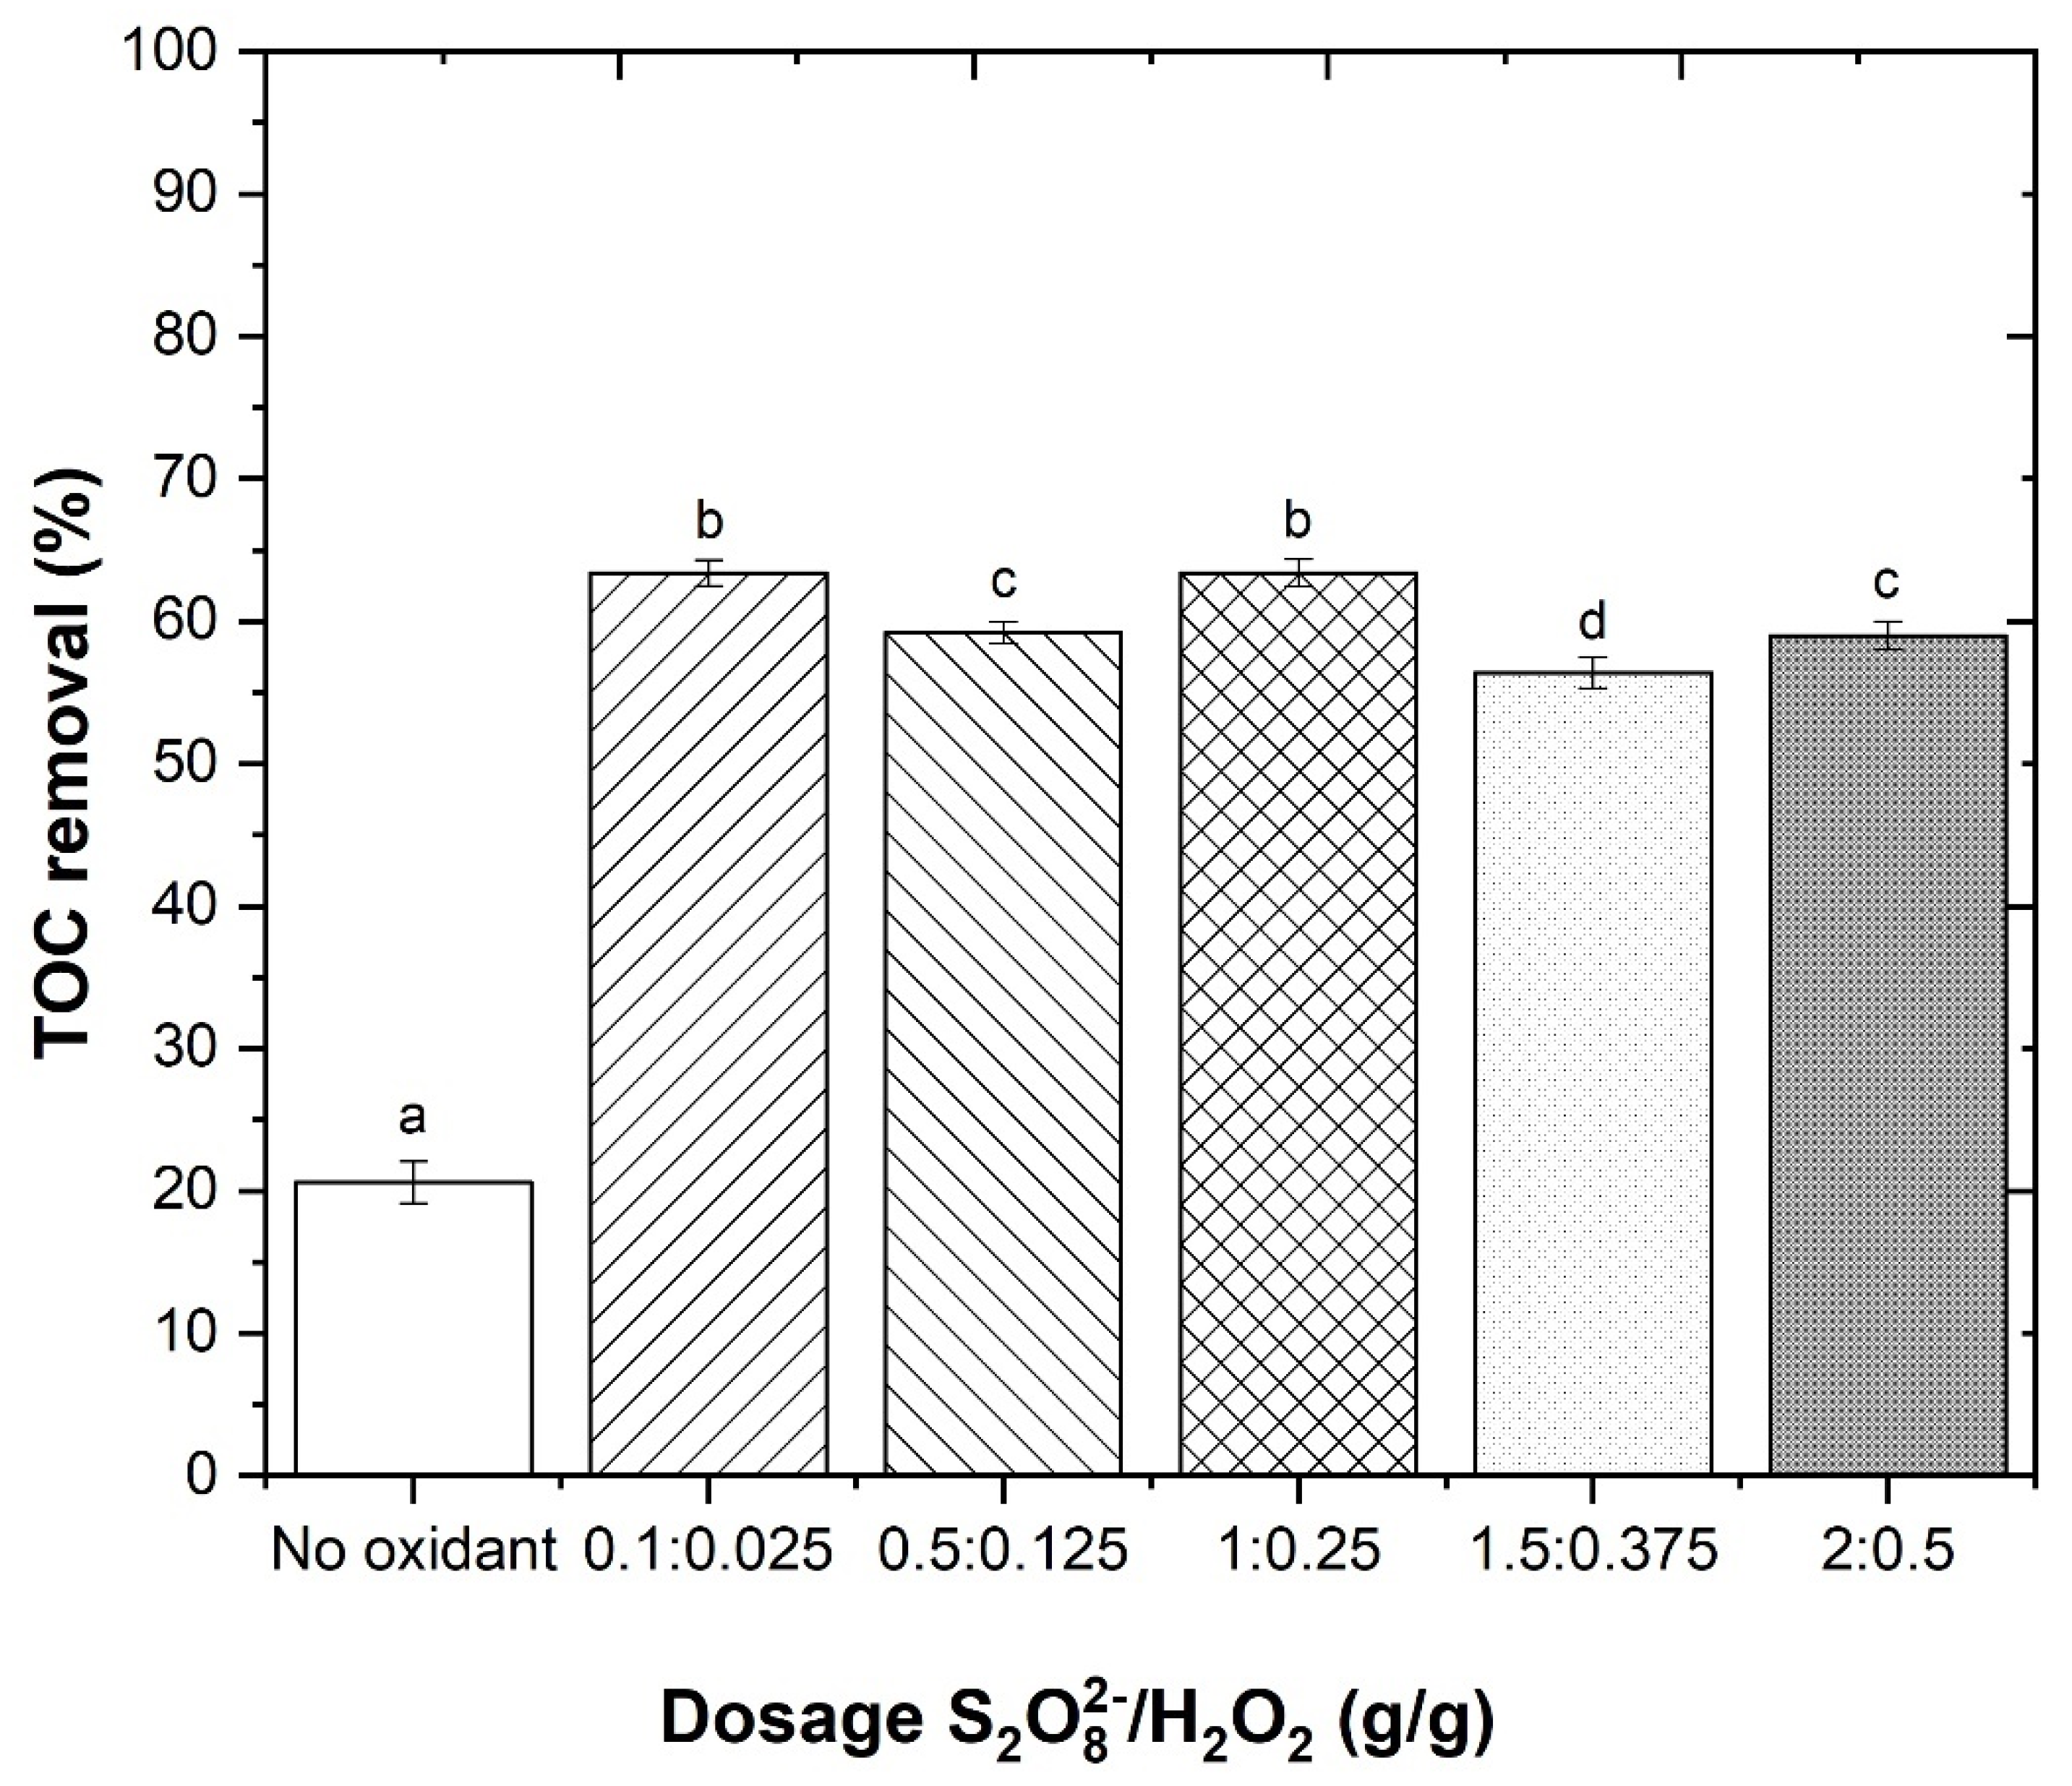
In the previous section it was observed that the ratio of /H2O2 had a high influence in the TOC removal of WW. In this section the dosage of /H2O2 was varied (0.1:0.025; 0.5:0.125; 1:0.25; 1.5:0.375; 2:0.5) under the following operational conditions: /H2O2 ratio = 1:0.25, pH = 11.0, T = 333 K, agitation 350 rpm, t = 2 h. By observation of Figure 6, there was a TOC removal of 63.4, 59.2, 63.4, 56.4 and 59.0%, respectively, for 0.1:0.025; 0.5:0.125; 1:0.25; 1.5:0.375; 2:0.5. These results showed that by decreasing the oxidant concentrations from 1:0.25 to 0.1:0.025 g/g, the TOC removal was similar. However, by increasing /H2O2 dosage to 2:0.5 g/g, the TOC removal had a higher decrease. These results were different than those observed in the work of Hilles et al. [63], who required an increase in /H2O2 dosage to achieve higher COD removal for landfill leachate treatment. One explanation for these results could be the reduction of scavenging reactions by sulfate and hydroxyl radicals, as previously observed Hilles et al. [66].
Therefore, based in these results, /H2O2 dosage 0.1:0.025 g/g was selected as the best dosage.
3.2.4. Effect of pH
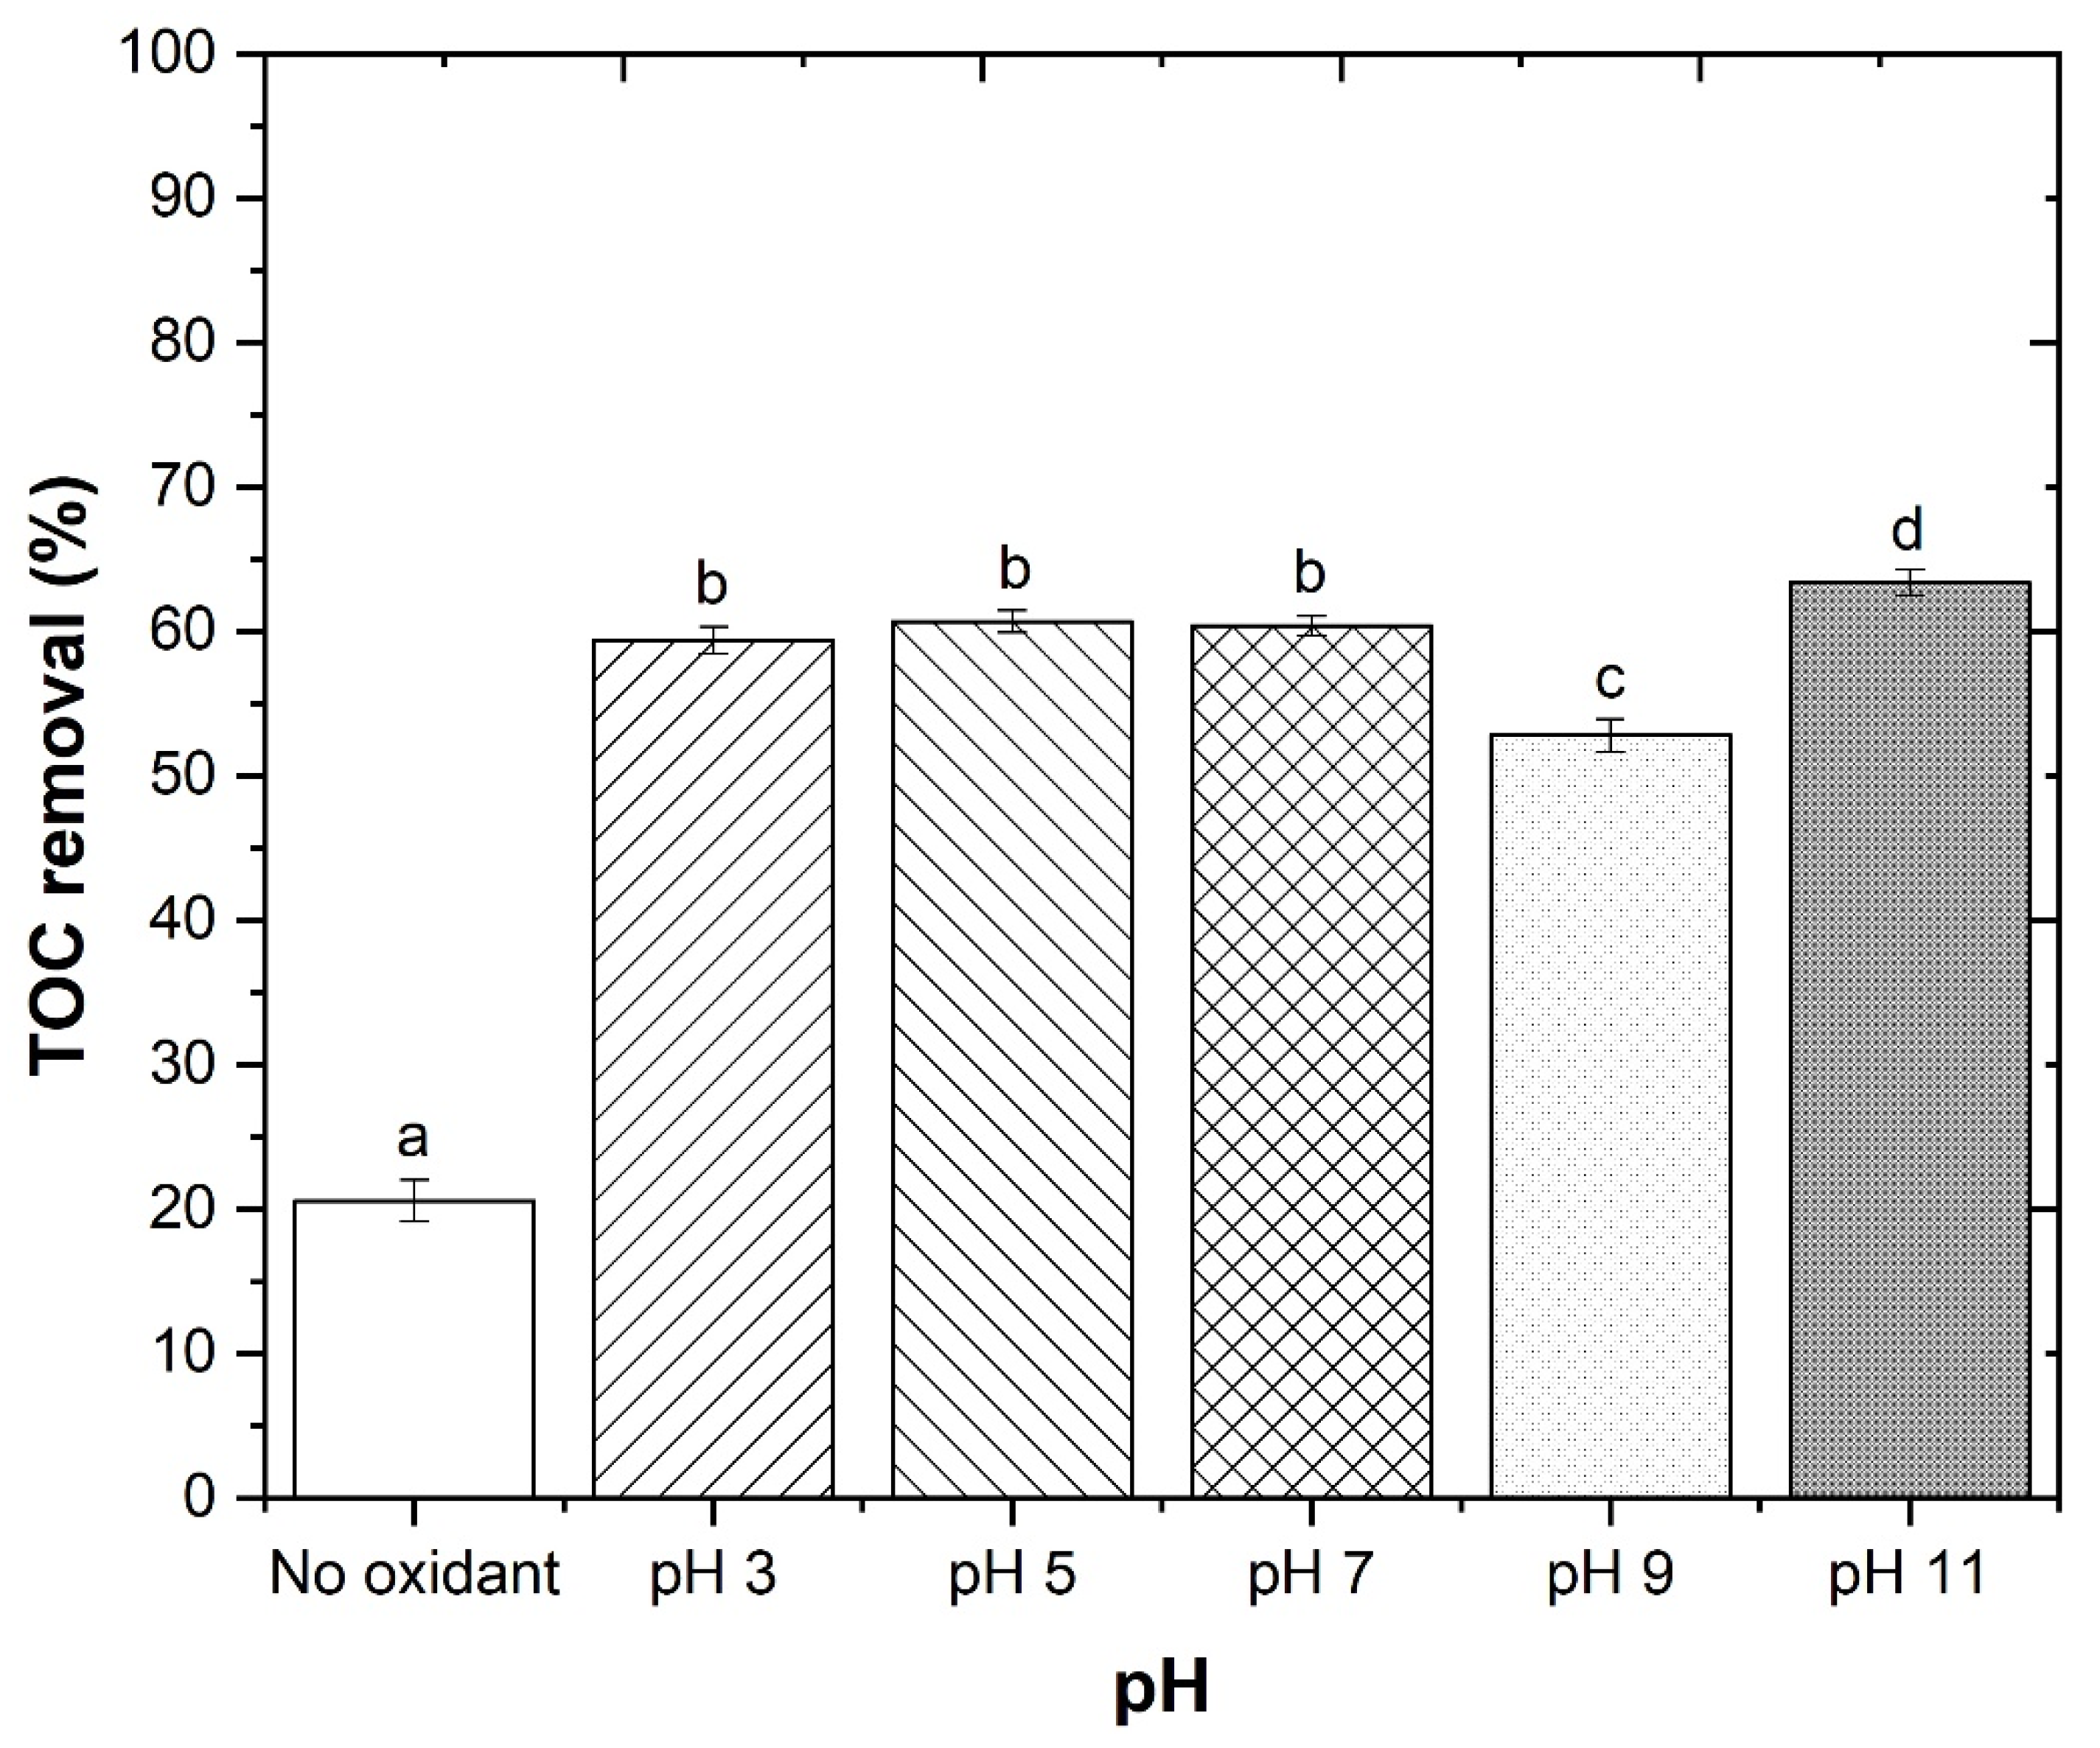
After the determination of the best dosage of /H2O2 for thermocatalytic oxidation treatment of WW, it was necessary to optimize the pH of the reaction. In the work of Candia-Onfray et al. [67], the SR-AOPs were performed at pH 5.6. However, in the work of Rodríguez-Chueca et al. [61], the SR-AOPs were performed at pH 6.5 for the treatment of winery wastewater. Due to the large pH spectrum of SR-AOP action, in this section different pH values (3.0, 5.0, 7.0, 9.0, 11.0) were tested under the following operational conditions: /H2O2 ratio = 1:0.25, /H2O2 dosage = 0.1:0.025 (g/g), T = 333 K, agitation 350 rpm, t = 2 h. Figure 7, shows a TOC removal of 59.4, 60.7, 60.4, 52.8 and 63.4%, respectively, after 2 h of reaction, for pH 3.0, 5.0, 7.0, 9.0 and 11.0. With the increase in pH from 3.0 to 11.0 an increase in TOC removal was observed, which was expected, because in the work of Hilles et al. [63], the increase in pH in the /H2O2 system lead to higher COD removal in the treatment of landfill leachate. At high pH conditions (pH 11.0), the alkaline activation was very productive in generating sulfate ions and hydroxyl radicals, which have high oxidation potential ( = 2.80 V and = 2.70 V) [19]. Furman et al. [68] also observed that persulfate’s efficiency in oxidation processes increased in alkaline conditions. For base activation of persulfate, a nucleophilic attack on the O–O bond is considered as the main mechanism as observed in Equations (10) and (11) [19]. The perhydroxyl radicals () plays a key role in the production of sulfate radicals. At acidic pH, the superoxide radicals tend to react with hydrogen ions to form perhydroxyl radicals, while at alkaline pH, perhydroxyl radicals tends to decompose into superoxide radicals. Due to alkaline conditions, the sulfate radicals are transformed into hydroxyl radicals as observed in Equation (12) [69], as follows:
Despite the high TOC removal at pH 11.0, there were several associated disadvantages, such as (1) the high cost in reagents to achieve pH 11.0 and (2) the Portuguese law No. 236/98 for residual water discharge for the pH of the treated wastewater is 6.0 to 9.0. Considering the similar TOC removal between pH 7.0 (60.4%) and pH 11 (63.4%), pH 7.0 was selected as the best pH.
3.2.5. Effect of Temperature
The bond energy of O–O of persulfate is estimated to be in the range of 140–213.3 kJ/mol. The essential mechanism of persulfate activation is the fission of O–O bond in the structure of persulfate. For heat activation, the energy input by the high temperature (>50 °C) can cause the fission of O–O bond to form the sulfate radicals, as observed by Equation (7) [19]. The hydroxyl radicals are the main radicals produced during the heat activation of persulfate, indicating that sulfate radicals are quickly transformed into hydroxyl radicals, as observed in Equation (13) [70], as follows:
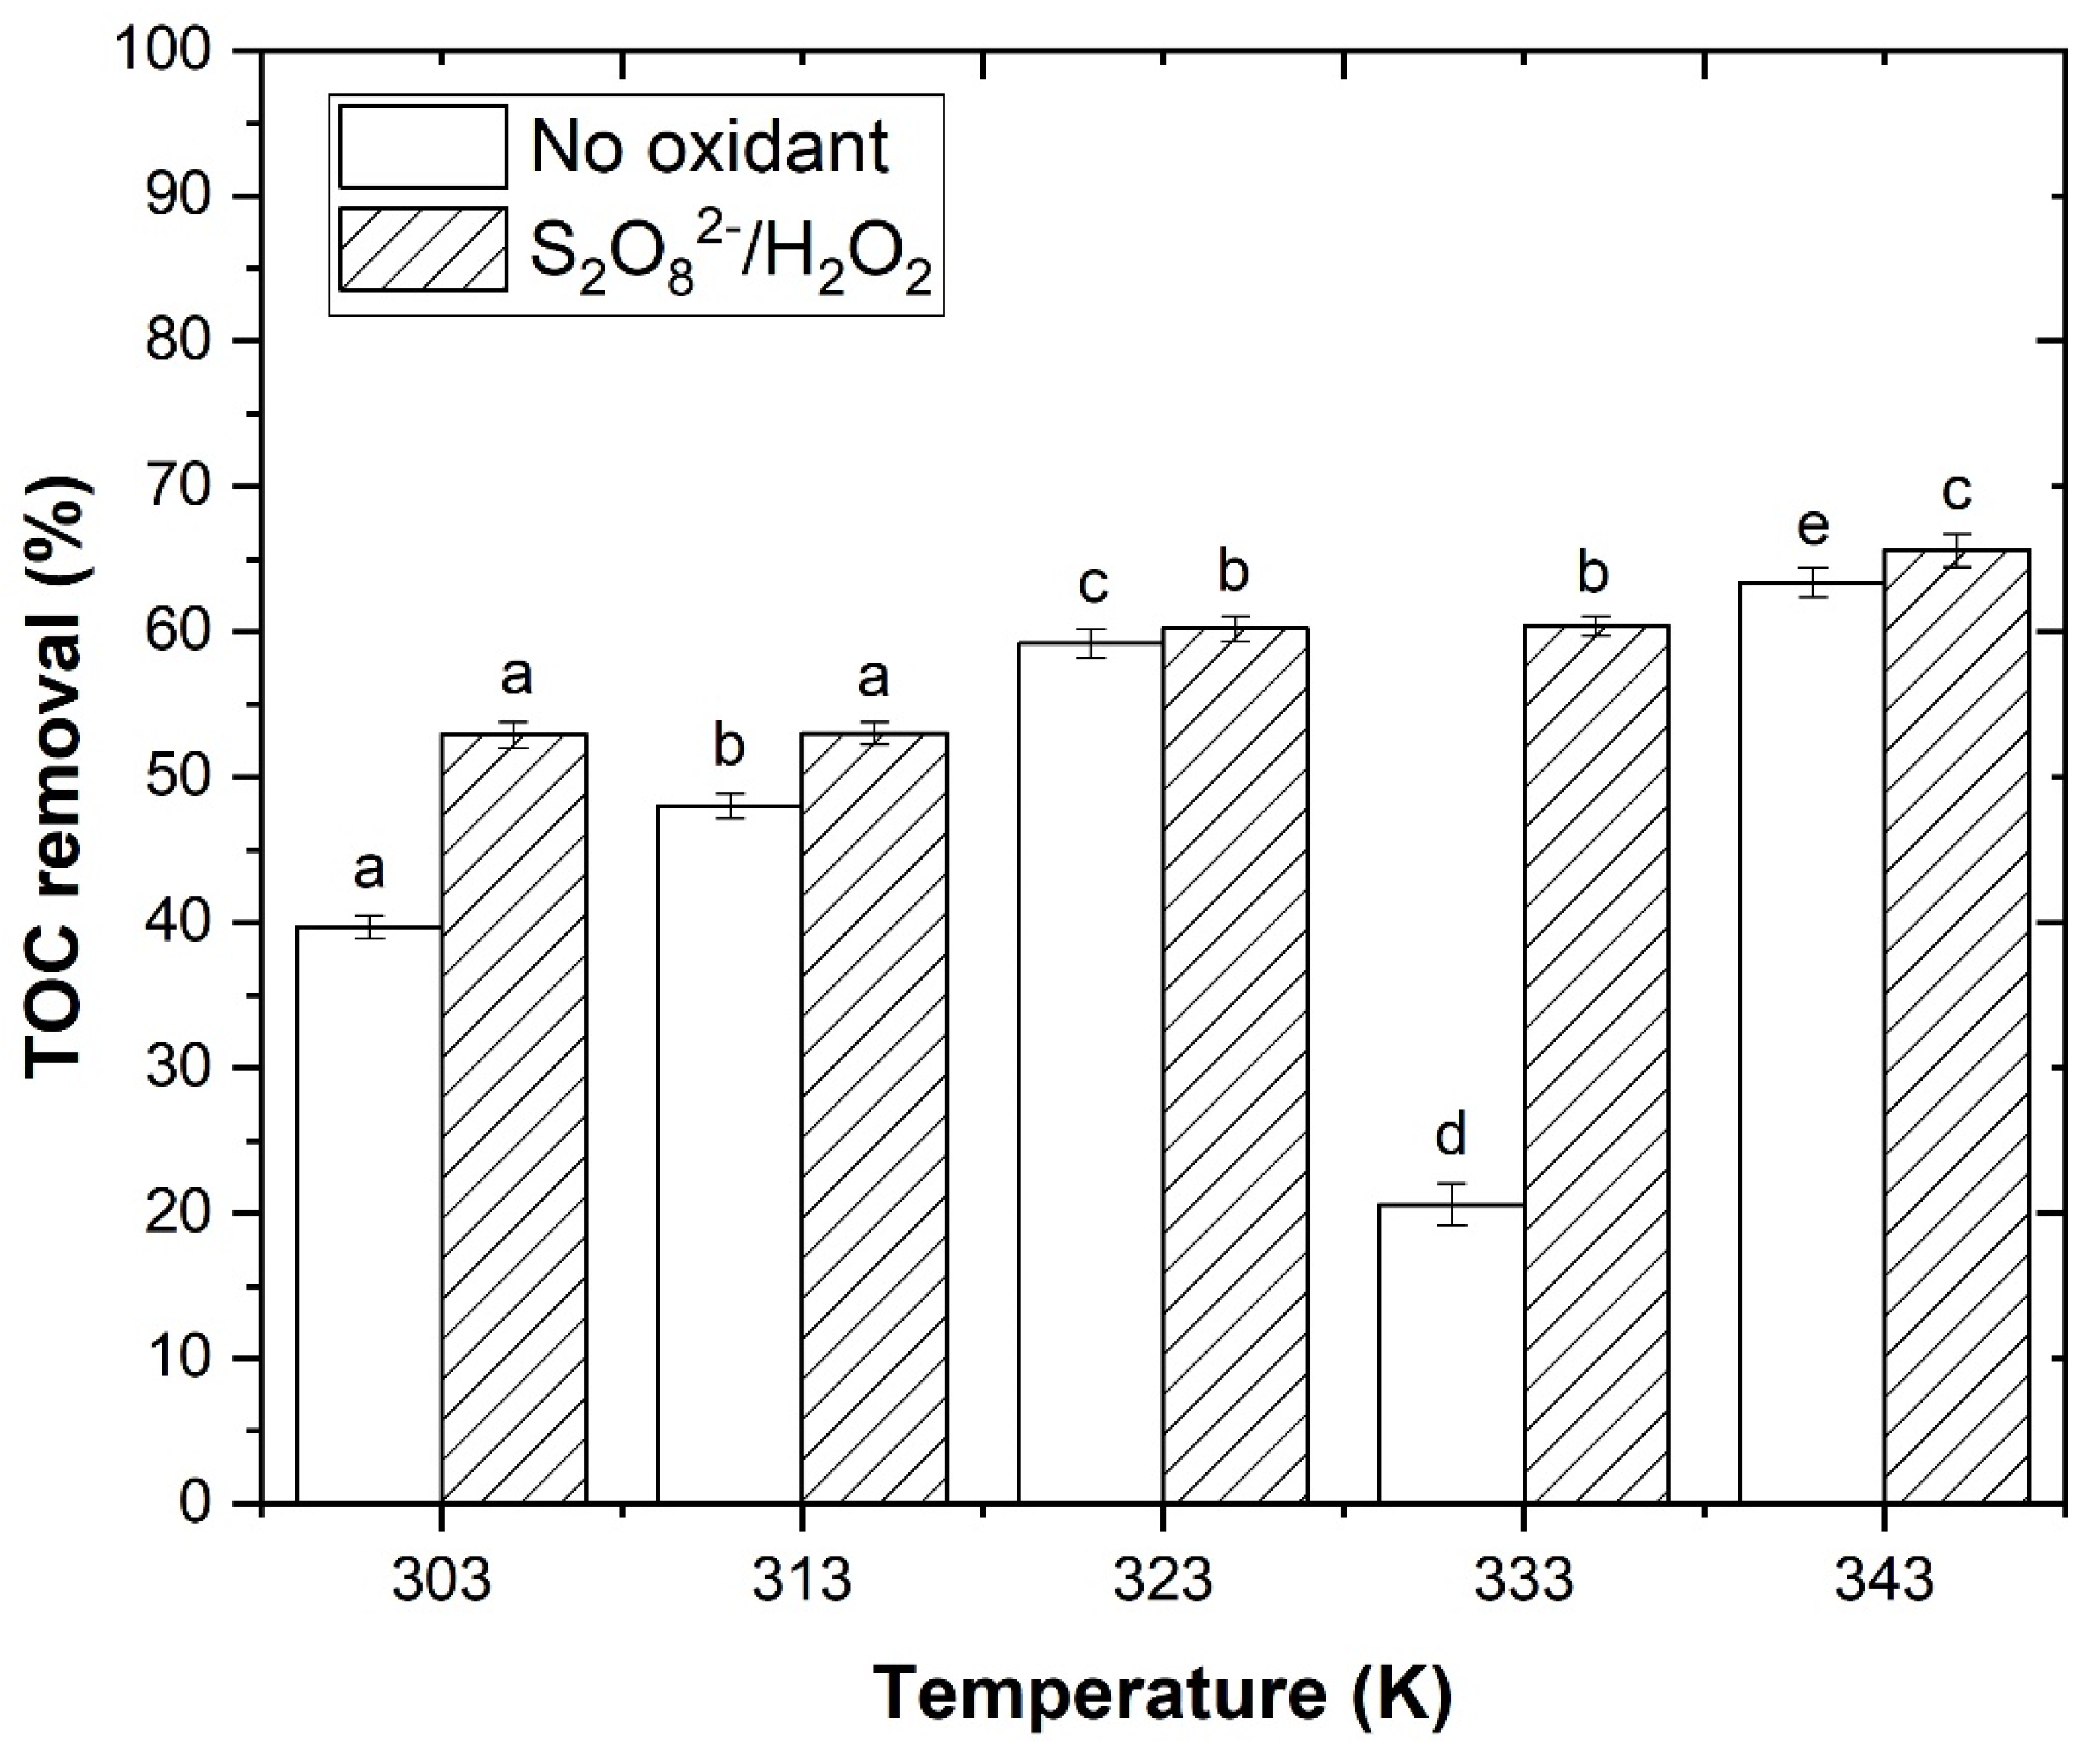
Therefore, in this section the effect of temperature variation (303, 313, 323, 333 and 343 K) was studied under the following operational conditions: /H2O2 ratio = 1:0.25, /H2O2 dosage = 0.1:0.025 (g/g), pH = 7.0, agitation 350 rpm, t = 2 h. Initial blank experiments were performed without addition of oxidant (Figure 8) and a TOC removal of 39.7, 48.0, 59.2, 20.6 and 63.4%, respectively, was observed. With the increase in temperature, an increase in TOC removal was observed, which indicated that there were organic compounds susceptible to heat. When oxidant agents (/H2O2) were added, an increase in TOC removal to 52.9, 53.0, 60.2, 60.4 and 65.6%, respectively, was observed. These results were similar to the work of Rodríguez-Chueca et al. [61], who observed that when increasing the temperature, the efficiency of oxidation reaction of sulfate radicals increased in COD removal of WW. In the work of Zrinyi and Pham [71], it was observed that phenol degradation by sulfate radicals was more efficient at 343 K, which is in agreement with this work.
Therefore, based in these results, 343 K was selected as the best temperature for sulfate radical activation.
3.3. Combination of Adsorption with Thermocatalytic Oxidation
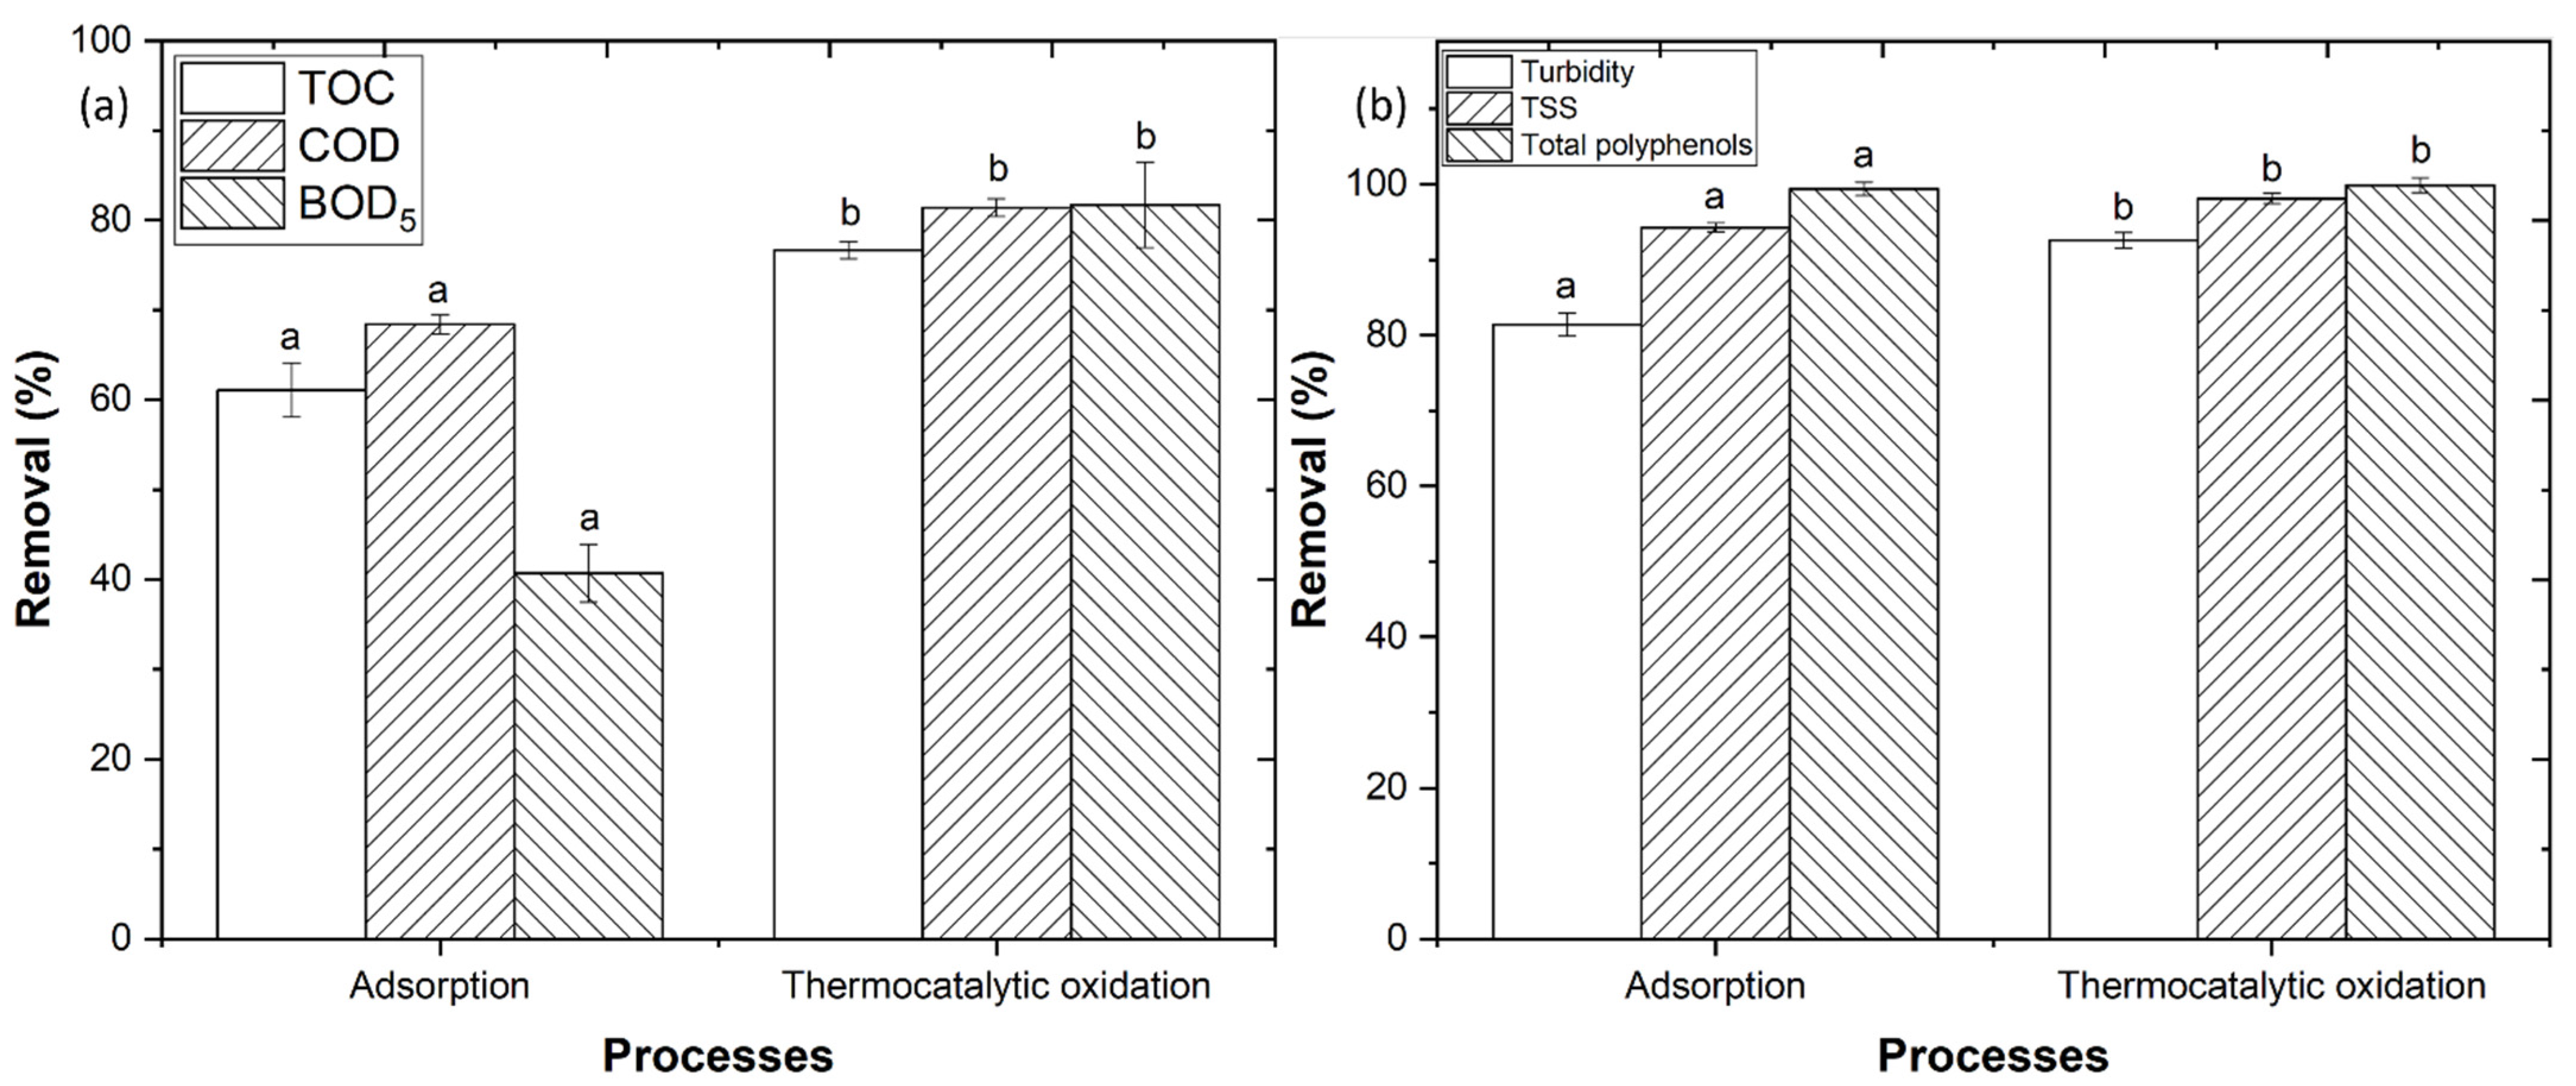
In previous sections, it was observed that application of Na-Mt in the adsorption process had high efficiency in the removal of organic carbon from WW. This work also tested the application of a thermocatalytic process, in which high temperatures and H2O2 in the form of SPC were used to activate persulfate radicals, to degrade organic carbon from the WW. The results also showed a high efficiency from this treatment; however, there were some limitations such as high levels of turbidity, TSS and total polyphenols (Table 1), which could have decreased the thermocatalytic oxidation efficiencies. Given the results obtained individually, it will be interesting to study the combination of the two previous processes. In this context, the combination of adsorption process with bentonite was tested in the optimal conditions obtained previously, as follows: [Na-Mt] = 5.0 g/L, pH = 3.0, V = 500 mL, agitation 350 rpm, T = 298 K, t = 24 h, with thermocatalytic oxidation best conditions, as follows: /H2O2 ratio = 1:0.25, /H2O2 dosage = 0.1:0.025 (g/g), pH = 7.0, T = 343 K, agitation 350 rpm, t = 2 h). In observation of Figure 9a, the adsorption process had a TOC, COD and a BOD5 removal of 61.1, 68.4 and 40.7%, respectively. With application of thermocatalytic process, the removals increased to 76.7, 81.4 and 81.7%, respectively. Clearly, the combination of adsorption and thermocatalytic oxidation achieved higher removals than both processes alone. One possible reason for the increased efficiency could be the reduction of interferents present in the WW, such as the turbidity, TSS and total polyphenols. In Figure 9b, turbidity, TSS and total polyphenols reduction of 81.4, 94.3 and 99.4% were observed, respectively. After the thermocatalytic oxidation the removals increased to 92.6, 98.1 and 99.9%, respectively. These results were in agreement with the work of Jaafarzadeh et al. [72], who observed an increase in sulfate radicals efficiency in COD removal of pulp and paper wastewater after reduction of TSS and color reduction. In accordance with Amor et al. [73], the high turbidity, TSS and total polyphenols are considered to be hydroxyl radical scavengers.
3.4. Phytotoxicity Tests
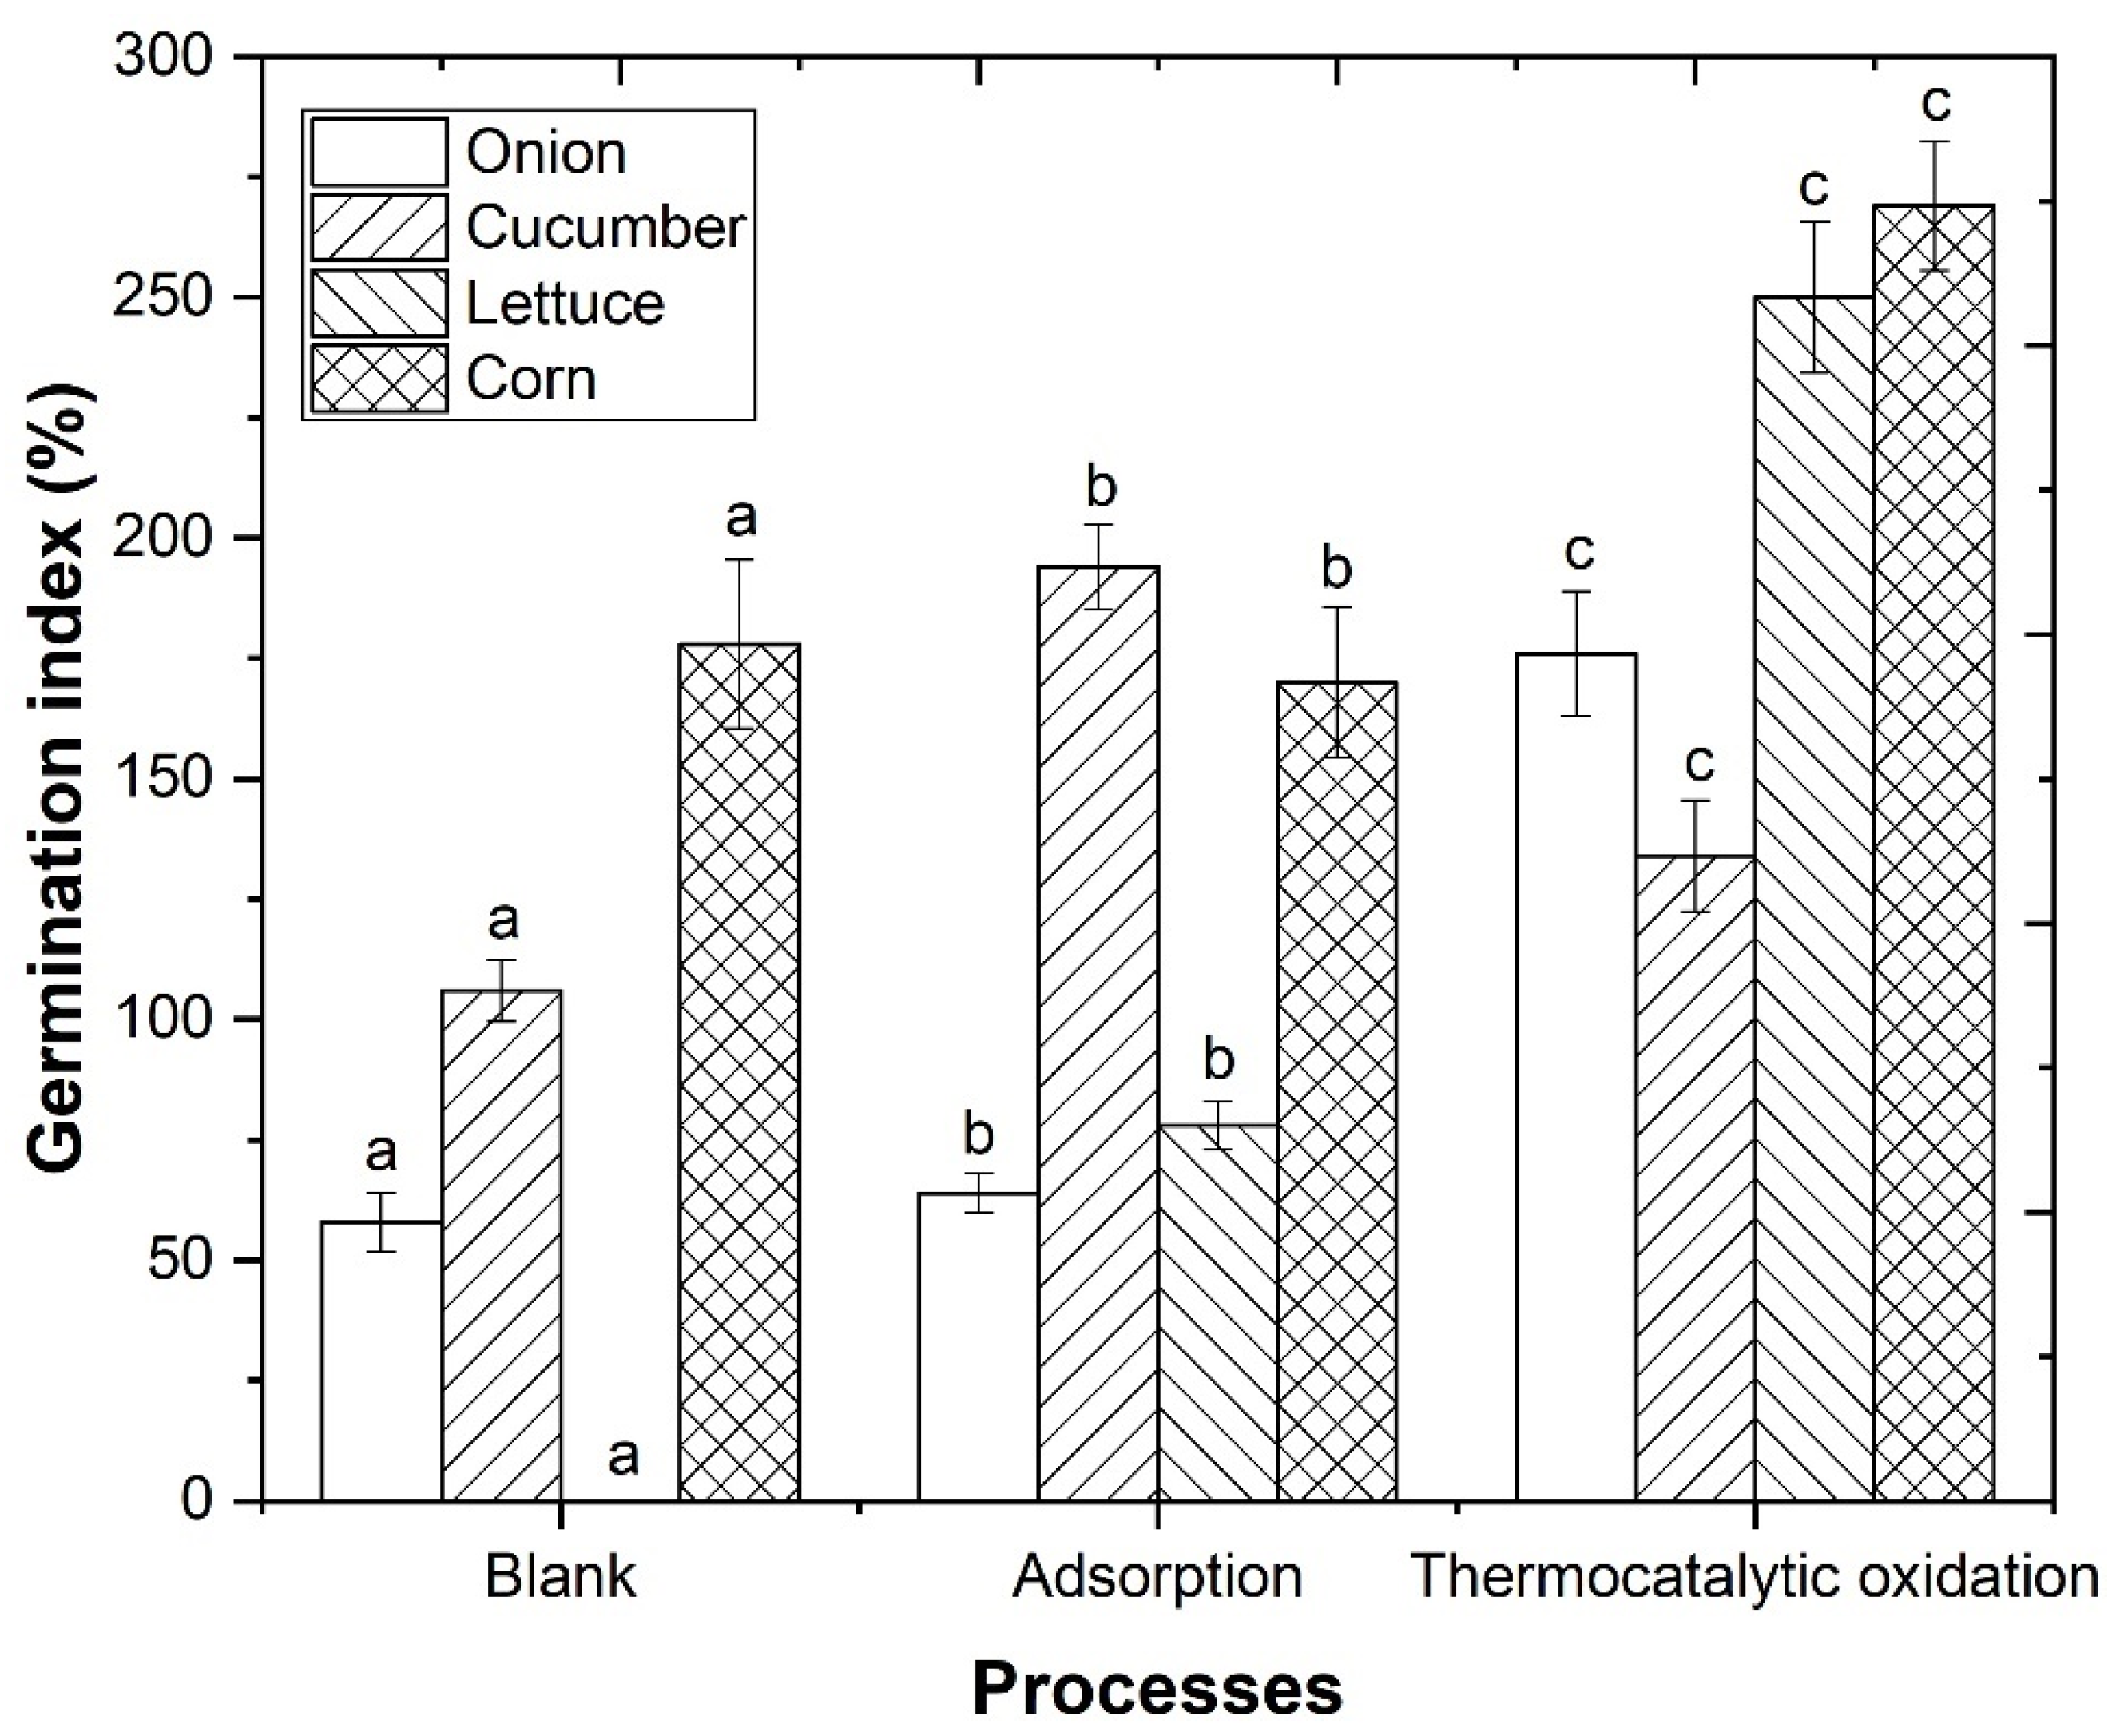
It was observed that the combination of adsorption process with Na-Mt and thermocatalytic oxidation with /H2O2 was beneficial for the reduction of organic carbon present in the WW. However, its effect in the germination of plants is still unknown. Therefore, the phytotoxic effect of raw WW, adsorption and combined adsorption–thermocatalytic oxidation on germination of seeds from two Dicotyledonae (lettuce and cucumber) and two Monocotyledonae (corn and onion) were evaluated, similar to the works of Casa et al. [74] and Mosse et al. [75]. For the determination of the germination index, the seed germination and root elongation (Equation (1)) were considered, which explains results above 100%.
In Figure 10, it was observed that raw WW posed a phytotoxicity effect to onion and lettuce seeds (GI = 58 and 0%), regarding cucumber and corn seeds (106 and 178%, respectively). With application of combined adsorption–thermocatalytic oxidation, an increase in the GI to 176, 134, 250 and 269 %, respectively, was observed for onion, cucumber, lettuce and corn seeds (GI > 80%), which showed that these treatments had a low phytotoxic effect for germination of plants. In the work of Rizzo et al. [76], it was observed that application of an adsorption process for the removal of contaminants increased the germination index of plant seeds, thus decreasing the phytotoxicity of the wastewater, similar to the results obtained in this work. These results evidence the suitability of the combination of adsorption and thermocatalytic oxidation for the reduction of phytotoxicity in seed germination.
As previously observed by Santos et al. [77], polyphenols are responsible for the toxicity of the WW, and their removal by both treatments could have potentiated the increase in the germination index; therefore, the phenolic content of the WW was evaluated (Figure 11), as well as the efficiency of both treatments in its removal. In Figure 11, a high content of total phenols, non-flavonoids and flavonoids (192, 112 and 80 mg gallic acid/L, respectively) was observed, which is in agreement to the work of Li and Sun [78], who observed the presence of these compounds in grapes and red wine.
In Figure 11, the presence of total anthocyanins (11 mg/L) was observed, which was responsible for the red color of the WW [42]. In accordance with Cheynier et al. [79] the red color is not only derived from anthocyanins, but also from the conversion of grape anthocyanins into other pigments in a process called copigmentation. This was also in agreement with the data from this work, since a certain amount of polymeric and total pigments was also detected (0.81 and 1.62 mg/L respectively).
Another factor which could have an influence on the red color of the WW was the presence of tannins in a large concentration (97 mg/L) which formed tannin–anthocyanin adducts with intense red color [79].
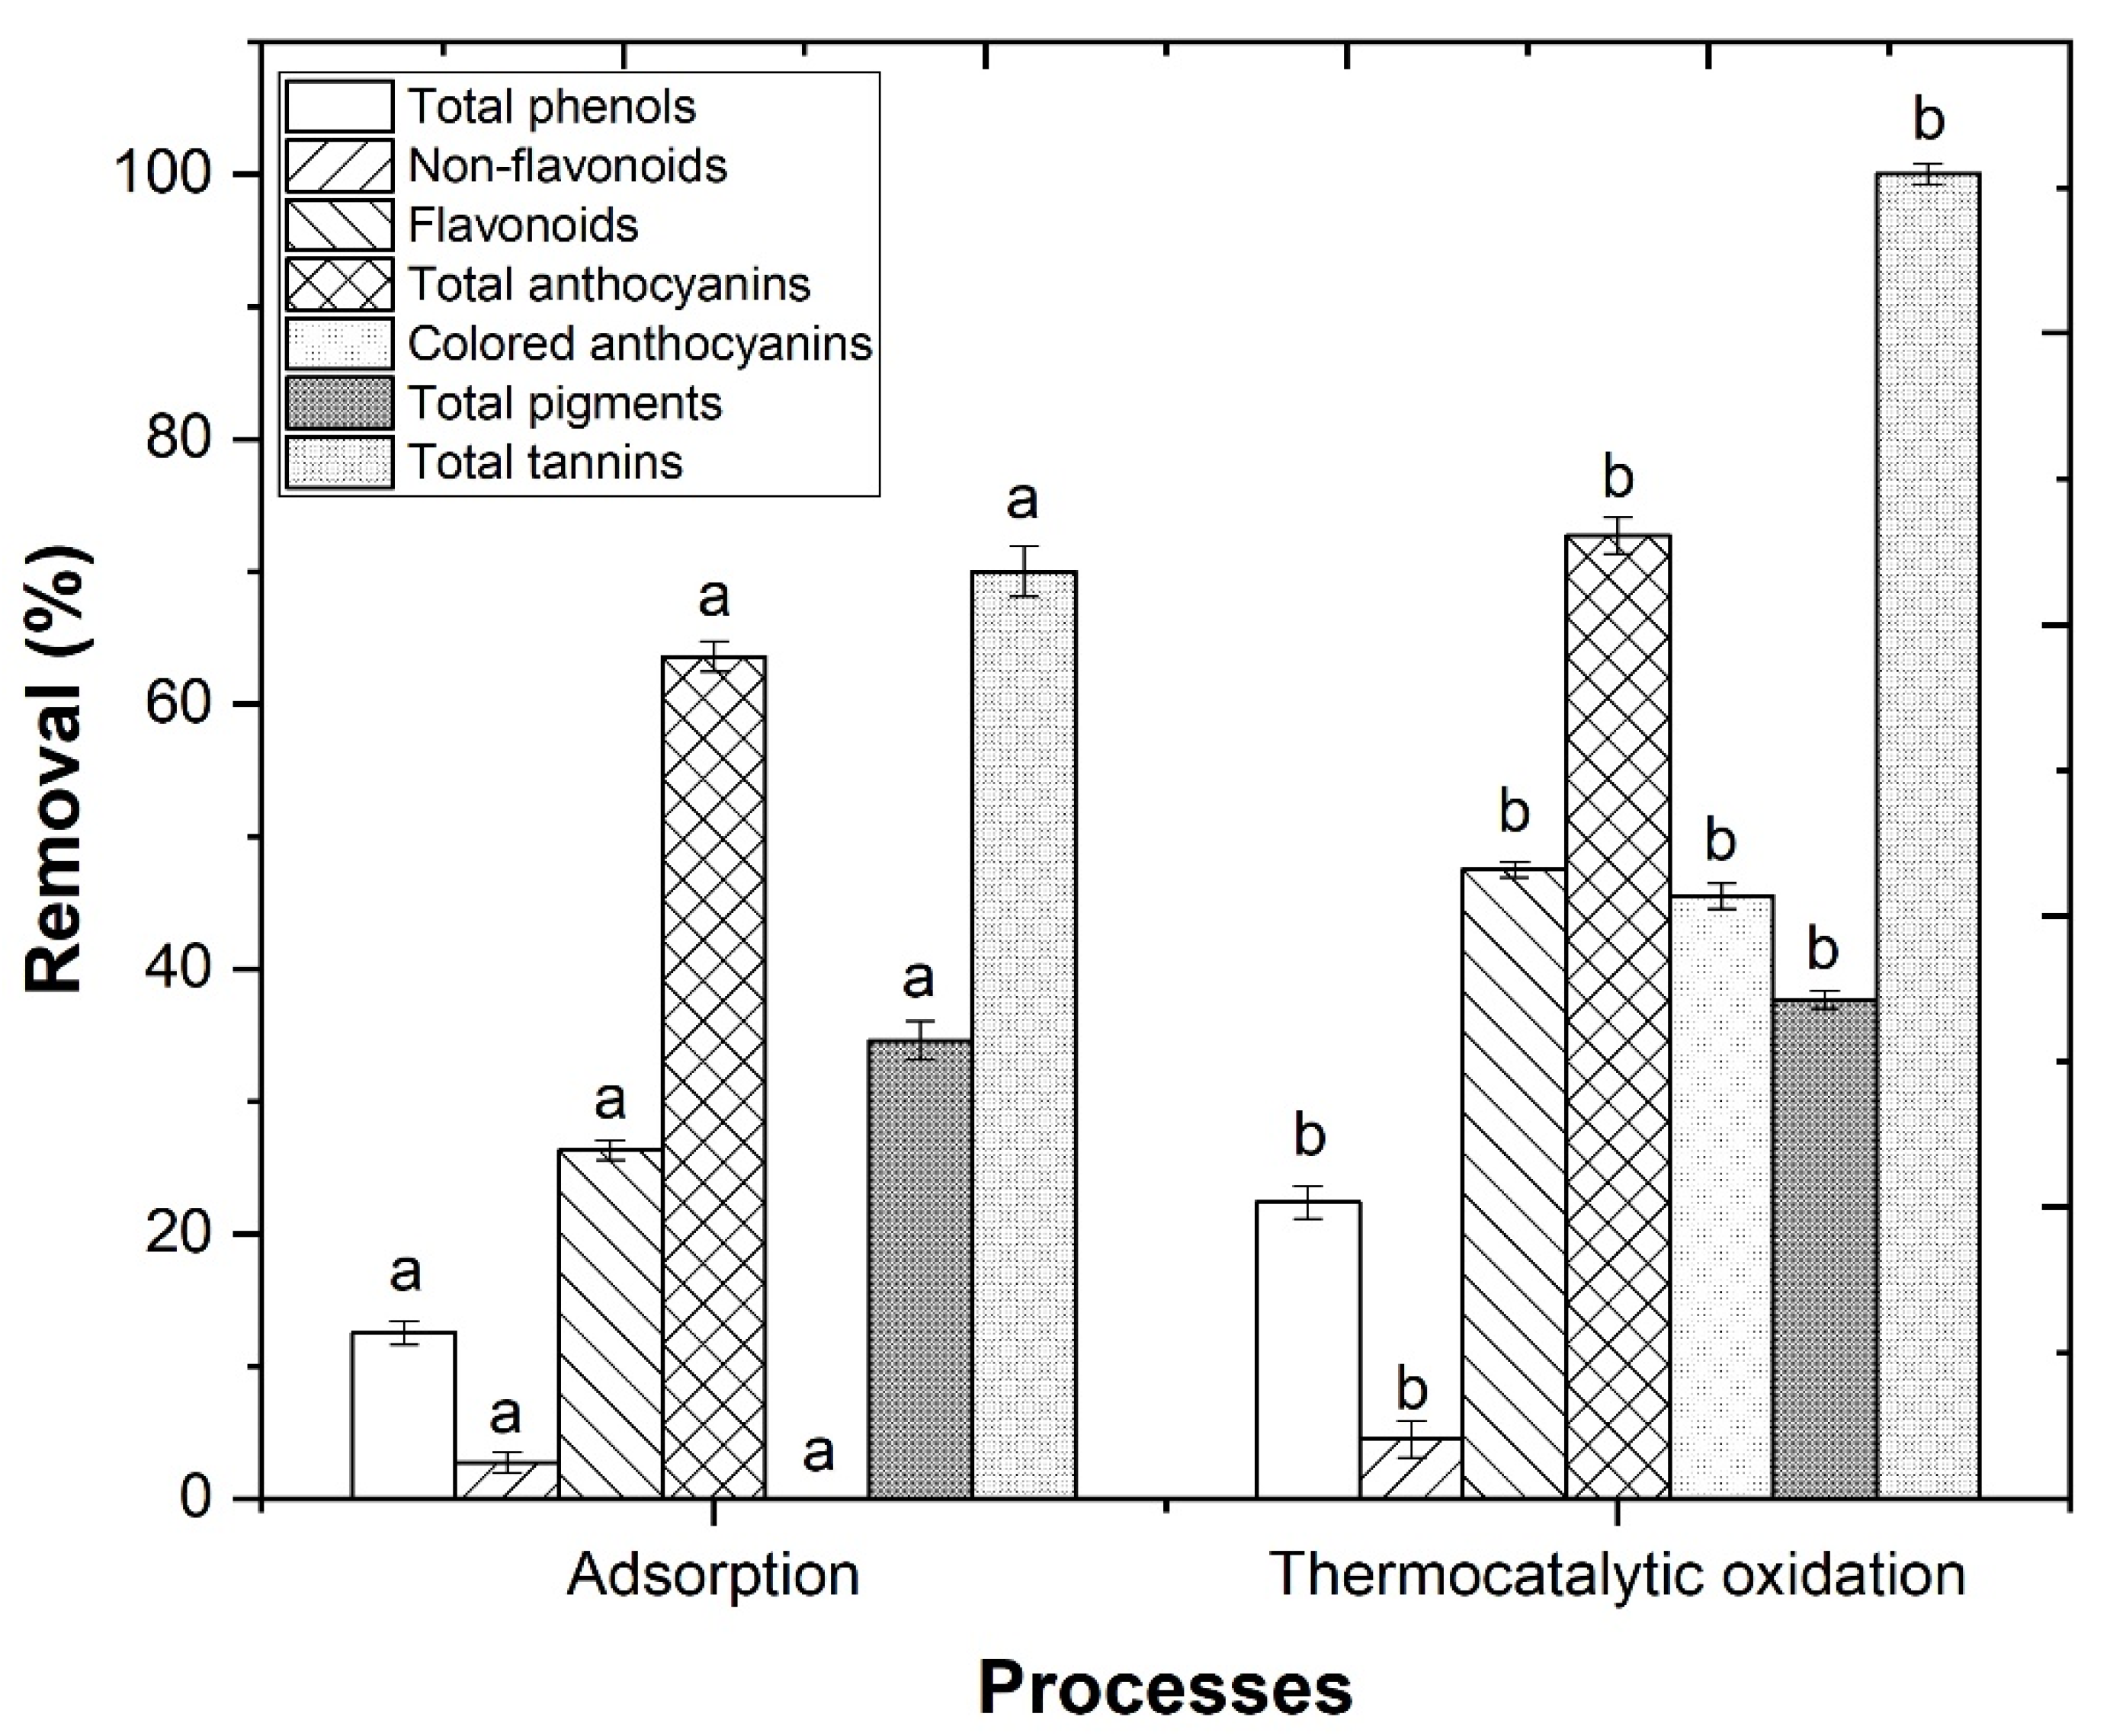
Considering that there are no studies regarding the effect of adsorption and combined adsorption–thermocatalytic oxidation processes in the removal of phenolic compounds of WW, it was evaluated the removal of total phenols, non-flavonoids, flavonoids, total anthocyanins, colored anthocyanins, total pigments and total tannins.
In Figure 11, a removal of 12.5, 2.7, 26.3, 63.6, 0.0, 34.6 and 70.0%, respectively, by adsorption process was observed. With application of combined adsorption–thermocatalytic oxidation process, it was observed a removal of 22.4, 4.5, 47.5, 72.7, 45.5, 37.7 and 100%, respectively. The reduction of these phenolic compounds had an effect on the removal of color from the WW, which was evaluated by a CIELab analysis (Table 5), similar to the work of Jorge et al. [38].
With application of adsorption and combined adsorption–thermocatalytic oxidation processes it were observed negative values for ∆a (−2.33 and −2.24, respectively), which indicated a reduction of the red color. An increase in the luminosity of the raw WW from 5.9% to 90.5 and 95.5%, respectively was also observed after adsorption and combined adsorption–thermocatalytic processes, which meant that the phenolic compounds were directly linked to the dark red color of the wastewater. The color removal, given by the Euclidean distance was 84.6 and 89.7 after adsorption and combined adsorption–thermocatalytic oxidation processes, meaning that color removal was perceptible to the human eye in accordance with Spagna et al. [45].
4. Conclusions
In this work, two processes were applied for the treatment of WW: adsorption and thermocatalytic oxidation processes. For the adsorption process activated sodium bentonite (Na-Mt) was used, which showed great swelling properties and a high capacity for COD removal from the WW. For the thermocatalytic oxidation process, the sulfate radicals were activated by high temperatures, without metal catalyst, to avoid the production of metal sludge. In addition, to increase the activation of sulfate radicals, H2O2 was applied in solid form, by addition of sodium percarbonate (SPC). Considering the objectives defined for this work, the main conclusions are:
- The adsorption process in bentonite is a very efficient process for organic carbon reduction. Under the best operational conditions: [Na-Mt] = 5.0 g/L, pH = 3.0, V = 500 mL, agitation 350 rpm, T = 298 K, t = 24 h, there is a TOC removal of 61.1%;
- The sodium percarbonate (SPC) is able to release H2O2 into water and the carbonate is evaporated as CO2;
- The sulfate radicals can be activated at high temperatures (T = 343 K). Under the best operational conditions: /H2O2 ratio = 1:0.25, /H2O2 dosage = 0.1:0.025 (g/g), pH = 7.0, T = 343 K, agitation 350 rpm, t = 2 h achieving 65.6% TOC removal;
- The combination of adsorption–thermocatalytic oxidation processes allows efficient WW treatment with a TOC, COD and BOD5 removal of 76.7, 81.4 and 81.7%, respectively; It is also concluded that the combination of these two processes poses no phytotoxic effect in the germination of seeds due to high germination index (GI > 80%) observed in germination of onion, cucumber, lettuce and corn seeds;
- The combination of adsorption–thermocatalytic oxidation processes proved to be very efficient in the removal of phenolic compounds present in the WW and the dark red color of the wastewater due to the negative value of ∆a (−2.24) and high luminosity (L = 95.5%).
These results showed that the combination of adsorption with bentonite and thermocatalytic processes are very promising to decrease the large content of organic carbon and phytotoxicity present in the WW.
Author Contributions
Conceptualization, N.J., A.R.T. and V.G.; methodology, N.J., A.R.T. and V.G.; validation, N.J. and A.R.T.; formal analysis, N.J. and A.R.T.; investigation, N.J. and A.R.T.; writing—original draft preparation, N.J. and A.R.T.; writing—review and editing, N.J., A.R.T., V.G., M.S.L. and J.A.P.; visualization, N.J., V.G., M.S.L. and J.A.P.; supervision, M.S.L. and J.A.P.; project administration, J.A.P. All authors have read and agreed to the published version of the manuscript.
Funding
The authors are grateful for the financial support by the Project AgriFood XXI, operation No. NORTE-01-0145-FEDER-000041, and to the Fundação para a Ciência e a Tecnologia (FCT, Portugal) for the financial support provided to CQVR through UIDB/00616/2020. Ana R. Teixeira also thanks the FCT for the financial support provided through the doctoral scholarship UI/BD/150847/2020.
Institutional Review Board Statement
Not applicable.
Informed Consent Statement
Not applicable.
Data Availability Statement
Not applicable.
Conflicts of Interest
The authors declare no conflict of interest.
References
- OIV. State of the World Vitiviniculture Sector in 2020–2021; OIV: Paris, France, 2020; pp. 1–19. [Google Scholar]
- Ferreira, R.; Gomes, J.; Martins, R.C.; Costa, R.; Quinta-Ferreira, R.M. Winery Wastewater Treatment by Integrating Fenton’s Process with Biofiltration by Corbicula Fluminea. J. Chem. Technol. Biotechnol. 2018, 93, 333–339. [Google Scholar] [CrossRef]
- Ioannou, L.A.; Fatta-Kassinos, D. Solar Photo-Fenton Oxidation against the Bioresistant Fractions of Winery Wastewater. J. Environ. Chem. Eng. 2013, 1, 703–712. [Google Scholar] [CrossRef]
- Ioannou, L.A.; Puma, G.L.; Fatta-Kassinos, D. Treatment of Winery Wastewater by Physicochemical, Biological and Advanced Processes: A Review. J. Hazard. Mater. 2015, 286, 343–368. [Google Scholar] [CrossRef] [PubMed]
- Mosteo, R.; Sarasa, J.; Ormad, M.P.; Ovelleiro, J.L. Sequential Solar Photo-Fenton-Biological System for the Treatment of Winery Wastewaters. J. Agric. Food Chem. 2008, 56, 7333–7338. [Google Scholar] [CrossRef] [PubMed]
- Chatzilazarou, A.; Katsoyannos, E.; Gortzi, O.; Lalas, S.; Paraskevopoulos, Y.; Dourtoglou, E.; Tsaknis, J. Removal of Polyphenols from Wine Sludge Using Cloud Point Extraction. J. Air Waste Manag. Assoc. 2010, 60, 454–459. [Google Scholar] [CrossRef] [PubMed] [Green Version]
- Mohana, S.; Acharya, B.K.; Madamwar, D. Distillery Spent Wash: Treatment Technologies and Potential Applications. J. Hazard. Mater. 2009, 163, 12–25. [Google Scholar] [CrossRef]
- Amaral-Silva, N.; Martins, R.C.; Paiva, C.; Castro-Silva, S.; Quinta-Ferreira, R.M. A New Winery Wastewater Treatment Approach during Vintage Periods Integrating Ferric Coagulation, Fenton Reaction and Activated Sludge. J. Environ. Chem. Eng. 2016, 4, 2207–2215. [Google Scholar] [CrossRef]
- Spennati, E.; Casazza, A.A.; Converti, A. Winery Wastewater Treatment by Microalgae to Production Purposes. Energies 2020, 13, 2490. [Google Scholar] [CrossRef]
- Marchão, L.; Fernandes, J.R.; Sampaio, A.; Peres, J.A.; Tavares, P.B.; Lucas, M.S. Microalgae and Immobilized TiO2/UV-A LEDs as a Sustainable Alternative for Winery Wastewater Treatment. Water Res. 2021, 203, 117464. [Google Scholar] [CrossRef]
- Jorge, N.; Teixeira, A.R.; Lucas, M.S.; Peres, J.A. Combination of adsorption in natural clays and photo-catalytic processes for winery wastewater treatment. In Advances in Geoethics and Groundwater Management: Theory and Practice for a Sustainable Development; Abrunhosa, M., Chambel, A., Peppoloni, S., Chaminé, H.I., Eds.; Springer: Cham, Switzerland, 2021; pp. 291–294. ISBN 978-3-030-59320-9. [Google Scholar]
- Amor, C.; Rodríguez-Chueca, J.; Fernandes, J.L.; Domínguez, J.R.; Lucas, M.S.; Peres, J.A. Winery Wastewater Treatment by Sulphate Radical Based-Advanced Oxidation Processes (SR-AOP): Thermally vs UV-Assisted Persulphate Activation. Process Saf. Environ. Prot. 2019, 122, 94–101. [Google Scholar] [CrossRef]
- Domínguez, C.M.; Quintanilla, A.; Casas, J.A.; Rodriguez, J.J. Treatment of Real Winery Wastewater by Wet Oxidation at Mild Temperature. Sep. Purif. Technol. 2014, 129, 121–128. [Google Scholar] [CrossRef]
- Alexander, J.A.; Abbas, M.; Zaini, A.; Aliyu, E.U.; Omeiza, A.U.; Asanja, J.; Abbas, M.; Zaini, A. Surface Modification of Low-Cost Bentonite Adsorbents-A Review. Part. Sci. Technol. 2019, 37, 534–545. [Google Scholar] [CrossRef]
- Vieira, M.G.A.; Neto, A.F.A.; Gimenes, M.L.; Silva, M.G.C. Sorption Kinetics and Equilibrium for the Removal of Nickel Ions from Aqueous Phase on Calcined Bofe Bentonite Clay. J. Hazard. Mater. 2010, 177, 362–371. [Google Scholar] [CrossRef] [PubMed]
- Salazar, F.N.; Marangon, M.; Labbé, M.; Lira, E.; Rodríguez-Bencomo, J.J.; López, F. Comparative Study of Sodium Bentonite and Sodium-Activated Bentonite Fining during White Wine Fermentation: Its Effect on Protein Content, Protein Stability, Lees Volume, and Volatile Compounds. Eur. Food Res. Technol. 2017, 243, 2043–2054. [Google Scholar] [CrossRef]
- Hu, P.; Long, M. Cobalt-Catalyzed Sulfate Radical-Based Advanced Oxidation: A Review on Heterogeneous Catalysts and Applications. Appl. Catal. B Environ. 2016, 181, 103–117. [Google Scholar] [CrossRef]
- Huang, J.; Zhang, H. Mn-Based Catalysts for Sulfate Radical-Based Advanced Oxidation Processes: A Review. Environ. Int. 2019, 133, 105141. [Google Scholar] [CrossRef]
- Wang, J.; Wang, S. Activation of Persulfate (PS) and Peroxymonosulfate (PMS) and Application for the Degradation of Emerging Contaminants. Chem. Eng. J. 2018, 334, 1502–1517. [Google Scholar] [CrossRef]
- Romero, A.; Santos, A.; Vicente, F.; González, C. Diuron Abatement Using Activated Persulphate: Effect of pH, Fe (II) and Oxidant Dosage. Chem. Eng. J. 2010, 162, 257–265. [Google Scholar] [CrossRef]
- Liu, H.; Bruton, T.A.; Li, W.; Van Buren, J.; Prasse, C.; Doyle, F.M.; Sedlak, D.L. Oxidation of Benzene by Persulfate in the Presence of Fe (III)-and Mn (IV)-Containing Oxides: Stoichiometric Efficiency and Transformation Products. Environ. Sci. Technol. 2016, 50, 890–898. [Google Scholar] [CrossRef]
- Bolobajev, J.; Trapido, M.; Goi, A. Improvement in Iron Activation Ability of Alachlor Fenton-like Oxidation by Ascorbic Acid. Chem. Eng. J. 2015, 281, 566–574. [Google Scholar] [CrossRef]
- Govindan, K.; Raja, M.; Noel, M.; James, E.J. Degradation of Pentachlorophenol by Hydroxyl Radicals and Sulfate Radicals Using Electrochemical Activation of Peroxomonosulfate, Peroxodisulfate and Hydrogen Peroxide. J. Hazard. Mater. 2014, 272, 42–51. [Google Scholar] [CrossRef] [PubMed]
- Giannakis, S.; Vives, F.A.G.; Grandjean, D.; Magnet, A.; De Alencastro, L.F.; Pulgarin, C. Effect of Advanced Oxidation Processes on the Micropollutants and the Effluent Organic Matter Contained in Municipal Wastewater Previously Treated by Three Different Secondary Methods. Water Res. 2015, 84, 295–306. [Google Scholar] [CrossRef]
- Monteagudo, J.M.; Durán, A.; Latorre, J.; Expósito, A.J. Application of Activated Persulfate for Removal of Intermediates from Antipyrine Wastewater Degradation Refractory towards Hydroxyl Radical. J. Hazard. Mater. 2016, 306, 77–86. [Google Scholar] [CrossRef] [PubMed]
- Gu, X.; Lu, S.; Li, L.; Qiu, Z.; Sui, Q.; Lin, K.; Luo, Q. Oxidation of 1, 1, 1-Trichloroethane Stimulated by Thermally Activated Persulfate. Ind. Eng. Chem. Res. 2011, 50, 11029–11036. [Google Scholar] [CrossRef]
- Tan, C.; Gao, N.; Zhou, S.; Xiao, Y.; Zhuang, Z. Kinetic Study of Acetaminophen Degradation by UV-Based Advanced Oxidation Processes. Chem. Eng. J. 2014, 253, 229–236. [Google Scholar] [CrossRef]
- Mahdi-ahmed, M.; Chiron, S. Ciprofloxacin Oxidation by UV-C Activated Peroxymonosulfate in Wastewater. J. Hazard. Mater. 2014, 265, 41–46. [Google Scholar] [CrossRef]
- Karthikeyan, S.; Boopathy, R.; Sekaran, G. In Situ Generation of Hydroxyl Radical by Cobalt Oxide Supported Porous Carbon Enhance Removal of Refractory Organics in Tannery Dyeing Wastewater. J. Colloid Interface Sci. 2015, 448, 163–174. [Google Scholar] [CrossRef] [PubMed]
- Ghanbari, F.; Moradi, M.; Gohari, F. Degradation of 2,4,6-Trichlorophenol in Aqueous Solutions Using Peroxymonosulfate/Activated Carbon/UV Process via Sulfate and Hydroxyl Radicals. J. Water Process Eng. 2016, 9, 22–28. [Google Scholar] [CrossRef]
- Devi, P.; Das, U.; Dalai, A.K. In-Situ Chemical Oxidation: Principle and Applications of Peroxide and Persulfate Treatments in Wastewater Systems. Sci. Total Environ. 2016, 571, 643–657. [Google Scholar] [CrossRef]
- Cui, H.; Gu, X.; Lu, S.; Fu, X.; Zhang, X.; Fu, G.Y.; Qiu, Z.; Sui, Q. Degradation of Ethylbenzene in Aqueous Solution by Sodium Percarbonate Activated with EDDS–Fe (III) Complex. Chem. Eng. J. 2017, 309, 80–88. [Google Scholar] [CrossRef]
- APHA; AWWA; WEF. Standard Methods for the Examination of Water and Wastewater, 20th ed.; American Public Health Association: Washington, DC, USA; American Water Works Association: Denver, CO, USA; Water Environment Federation: Alexandria, VR, USA, 1999. [Google Scholar]
- Singleton, V.L.; Rossi, J.A. Colorimetry of Total Phenolics with Phosphomolybdic-Phosphotungstic Acid Reagents. Am. J. Enol. Vitic. 1965, 16, 144–158. [Google Scholar]
- OECD. OECD Guidelines for the Testing of Chemicals: Terrestrial Plant Test; OECD: Paris, France, 2004; Volume 208. [Google Scholar]
- Varnero, M.T.; Rojas, C.; Orellana, R. Índices de Fitotoxicidad en Residuos Orgánicos Durante el Compostaje. Rev. Cienc. Suelo Nutr. Veg. 2007, 7, 28–37. [Google Scholar] [CrossRef]
- Tiquia, S.M.; Tam, N.F.Y. Elimination of Phytotoxicity during Co-Composting of Spent Pig-Manure Sawdust Litter and Pig Sludge. Bioresour. Technol. 1998, 65, 43–49. [Google Scholar] [CrossRef]
- OIV. Compendium of International Methods of Wine and Must Analysis-Volume I, 2017th ed.; OIV: Paris, France, 2017; ISBN 979-10-91799-64-5. [Google Scholar]
- Curvelo-Garcia, A. Controlo de qualidade dos vinhos. In Química Enológica e Métodos Analíticos. Avanços Recentes no Controlo da Qualidade de Vinhos e de Outros Produtos Vitivinícolas; Curvelo-Garcia, A.S., e Barros, P., Eds.; Engebook/Publindustria, Edições Técnicas, Lda: Lisboa, Portugal, 1988; ISBN 978-989-723-118-6. [Google Scholar]
- Kramling, T.E.; Singleton, V.L. An Estimate of the Nonflavonoid Phenols in Wines. Am. J. Enol. Vitic. 1969, 20, 86–92. [Google Scholar]
- Ribéreau-Gayon, P.; Glories, Y.; Maujean, A.; Dubourdieu, D. Handbook of Enology-Volume 2. The Chemistry of Wine Stabilization and Treatments, 2nd ed.; John Wiley & Sons, Inc: Hoboken, NJ, USA, 2021; Volume 2, ISBN 9780470010396. [Google Scholar]
- Somers, T.C.; Evans, M.E. Spectral Evaluation of Young Red Wines: Anthocyanin Equilibria, Total Phenolics, Free and Molecular SO2, “Chemical Age”. J. Sci. Food Agric. 1977, 28, 279–287. [Google Scholar] [CrossRef]
- Ribéreau-Gayon, P.; Stonestreet, E. Dosage des Tanins du Vin Rouge et Détermination de Leur Structure. Chim. Anal. 1966, 48, 188. [Google Scholar]
- Spagna, G.; Pifferi, G.; Rangoni, C.; Mattivi, F.; Nicolinib, G.; Palmonari, R. The Stabilization of White Wines by Adsorption of Phenolic Compounds on Chitin and Chitosan. Food Res. Int. 1996, 29, 241–248. [Google Scholar] [CrossRef]
- Schanda, J. Colorimetry: Understanding the CIE System; John Wiley & Sons, Inc: Hoboken, NJ, USA, 2007; ISBN 978-0-470-04904-4. [Google Scholar]
- Jorge, N.; Teixeira, A.R.; Matos, C.C.; Lucas, M.S.; Peres, J.A. Combination of Coagulation–Flocculation–Decantation and Ozonation Processes for Winery Wastewater Treatment. Int. J. Environ. Res. Public Health 2021, 18, 8882. [Google Scholar] [CrossRef]
- Hojiyev, R.; Ulcay, Y.; Çelik, M.S. Development of a Clay-Polymer Compatibility Approach for Nanocomposite Applications. Appl. Clay Sci. 2017, 146, 548–556. [Google Scholar] [CrossRef]
- Schuttlefield, J.D.; Cox, D.; Grassian, V.H. An Investigation of Water Uptake on Clays Minerals Using ATR-FTIR Spectroscopy Coupled with Quartz Crystal Microbalance Measurements. J. Geophys. Res. Atmos. 2007, 112, 1–14. [Google Scholar] [CrossRef] [Green Version]
- Sevim, A.M.; Hojiyev, R.; Gül, A.; Celik, M.S. Preparation of Novel Heterogeneous Catalysts by Adsorption of a Cationic Tetrapyrrole on to Bentonite: Equilibrium, Kinetics, and Thermodynamics. Mon. Für Chem.-Chem. Mon. 2012, 143, 385–400. [Google Scholar] [CrossRef]
- Żymankowska-kumon, S.; Holtzer, M.; Olejnik, E.; Bobrowski, A. Influence of the Changes of the Structure of Foundry Bentonites on Their Binding Properties. Mater. Sci. 2012, 18, 57–61. [Google Scholar] [CrossRef] [Green Version]
- Guimarães, V.; Teixeira, A.R.; Lucas, M.S.; Silva, A.M.T.; Peres, J.A. Pillared Interlayered Natural Clays as Heterogeneous Photocatalysts for H2O2-Assisted Treatment of a Winery Wastewater. Sep. Purif. Technol. 2019, 228, 115768. [Google Scholar] [CrossRef]
- Barros, W.R.P.; Steter, J.R.; Lanza, M.R.V.; Tavares, A.C. Catalytic Activity of Fe3−xCuxO4 (0 ≤ x ≤ 0.25) Nanoparticles for the Degradation of Amaranth Food Dye by Heterogeneous Electro-Fenton Process. Appl. Catal. B Environ. 2016, 180, 434–441. [Google Scholar] [CrossRef]
- Guimarães, V.; Lucas, M.S.; Peres, J.A. Combination of Adsorption and Heterogeneous Photo-Fenton Processes for the Treatment of Winery Wastewater. Environ. Sci. Pollut. Res. 2019, 26, 31000–31013. [Google Scholar] [CrossRef]
- Putra, E.K.; Pranowo, R.; Sunarsob, J.; Indraswati, N.; Ismadji, S. Performance of Activated Carbon and Bentonite for Adsorption of Amoxicillin from Wastewater: Mechanisms, Isotherms and Kinetics. Water Res. 2009, 43, 2419–2430. [Google Scholar] [CrossRef] [PubMed]
- Bergaya, F.; Theng, B.K.G.; Lagaly, G. Handbook of Clay Science, Volume 1; Elsevier: Amsterdam, The Netherlands, 2006; ISBN 9780080457635. [Google Scholar]
- Guimarães, V.; Rodríguez-Castellón, E.; Algarra, M.; Rocha, F.; Bobos, I. Influence of pH, Layer Charge Location and Crystal Thickness Distribution on U(VI) Sorption onto Heterogeneous Dioctahedral Smectite. J. Hazard. Mater. 2016, 317, 246–258. [Google Scholar] [CrossRef] [PubMed]
- Benna, M.; Magnin, A.; Bergaya, F. Effect of pH on Rheological Properties of Purified Sodium Bentonite Suspensions. J. Colloid Interface Sci. 1999, 218, 442–455. [Google Scholar] [CrossRef] [PubMed]
- Sharma, P.; Borah, D.J.; Das, P.; Das, M.R. Cationic and Anionic Dye Removal from Aqueous Solution Using Montmorillonite Clay: Evaluation of Adsorption Parameters and Mechanism. Desalin. Water Treat. 2016, 57, 8372–8388. [Google Scholar] [CrossRef]
- Zonfrilli, F.; Germanà, S.; Guida, V.; Italia, G. Thermal Stability of Dry Detergent Formulation Containing Sodium Percarbonate. Chem. Eng. Trans. 2009, 17, 705–710. [Google Scholar] [CrossRef]
- Rodríguez-Chueca, J.; Amor, C.; Mota, J.; Lucas, M.S.; Peres, J.A. Oxidation of Winery Wastewater by Sulphate Radicals: Catalytic and Solar Photocatalytic Activations. Environ. Sci. Pollut. Res. 2017, 24, 22414–22426. [Google Scholar] [CrossRef]
- Rodríguez-Chueca, J.; Amor, C.; Silva, T.; Dionysiou, D.D.; Li, G.; Lucas, M.S.; Peres, J.A. Treatment of Winery Wastewater by Sulphate Radicals: HSO5−/Transition Metal/UV-A LEDs. Chem. Eng. J. 2017, 310, 473–483. [Google Scholar] [CrossRef] [Green Version]
- Deng, Y.; Ezyske, C.M. Sulfate Radical-Advanced Oxidation Process (SR-AOP) for Simultaneous Removal of Refractory Organic Contaminants and Ammonia in Landfill Leachate. Water Res. 2011, 5, 6189–6194. [Google Scholar] [CrossRef]
- Hilles, A.H.; Abu, S.S.; Hussein, R.A.; El-Sebaie, O.D.; Arafa, A.I. Performance of Combined Sodium Persulfate/H2O2 Based Advanced Oxidation Process in Stabilized Land Fi Ll Leachate Treatment. J. Environ. Manag. 2016, 166, 493–498. [Google Scholar] [CrossRef] [PubMed]
- Huie, R.E.; Clifton, C.L.; Neta, P. Electron Transfer Reaction Rates and Equilibria of the Carbonate and Sulfate Radical Anions. Int. J. Radiat. Appl. Instrum. Part C Radiat. Phys. Chem. 1991, 38, 477–481. [Google Scholar] [CrossRef]
- Han, D.; Wan, J.; Ma, Y.; Wang, Y.; Huang, M.; Chen, Y.; Li, D.; Guan, Z.; Li, Y. Enhanced Decolorization of Orange G in a Fe (II)-EDDS Activated Persulfate Process by Accelerating the Regeneration of Ferrous Iron with Hydroxylamine. Chem. Eng. J. 2014, 256, 316–323. [Google Scholar] [CrossRef]
- Hilles, A.H.; Abu, S.S.; Hussein, R.A.; Arafa, A.I.; El-sebaie, O.D. Effect of Persulfate and Persulfate/H2O2 on Biodegradability of an Anaerobic Stabilized Landfill Leachate. Waste Manag. 2015, 44, 172–177. [Google Scholar] [CrossRef] [PubMed]
- Candia-Onfray, C.; Espinoza, N.; da Silva, E.B.S.; Toledo-Neira, C.; Espinoza, L.C.; Santander, R.; García, V.; Salazar, R. Treatment of Winery Wastewater by Anodic Oxidation Using BDD Electrode. Chemosphere 2018, 206, 709–717. [Google Scholar] [CrossRef] [PubMed]
- Furman, O.S.; Teel, A.L.; Ahmad, M.; Merker, M.C.; Watts, R.J. Effect of Basicity on Persulfate Reactivity. J. Environ. Eng. 2011, 137, 241–247. [Google Scholar] [CrossRef]
- Yang, Y.; Pignatello, J.J.; Ma, J.; Mitch, W.A. Comparison of Halide Impacts on the Efficiency of Contaminant Degradation by Sulfate and Hydroxyl Radical-Based Advanced Oxidation Processes (AOPs). Environ. Sci. Technol. 2014, 48, 2344–2351. [Google Scholar] [CrossRef] [PubMed]
- Zhao, D.; Liao, X.; Yan, X.; Huling, S.G.; Chai, T.; Tao, H. Effect and Mechanism of Persulfate Activated by Different Methods for PAHs Removal in Soil. J. Hazard. Mater. 2013, 254–255, 228–235. [Google Scholar] [CrossRef]
- Zrinyi, N.; Pham, A.L. Oxidation of Benzoic Acid by Heat-Activated Persulfate: Effect of Temperature on Transformation Pathway and Product Distribution. Water Res. 2017, 120, 43–51. [Google Scholar] [CrossRef] [PubMed]
- Jaafarzadeh, N.; Ghanbari, F.; Alvandi, M. Integration of Coagulation and Electro-Activated HSO5− to Treat Pulp and Paper Wastewater. Sustain. Environ. Res. 2017, 27, 223–229. [Google Scholar] [CrossRef]
- Amor, C.; De Torres-Socías, E.; Peres, J.A.; Maldonado, M.I.; Oller, I.; Malato, S.; Lucas, M.S. Mature Landfill Leachate Treatment by Coagulation/Flocculation Combined with Fenton and Solar Photo-Fenton Processes. J. Hazard. Mater. 2015, 286, 261–268. [Google Scholar] [CrossRef] [PubMed]
- Casa, R.; Annibale, A.D.Õ.; Pieruccetti, F.; Stazi, S.R.; Sermanni, G.G.; Cascio, B. Lo Reduction of the Phenolic Components in Olive-Mill Wastewater by an Enzymatic Treatment and Its Impact on Durum Wheat (Triticum Durum Desf.) Germinability. Chemosphere 2003, 50, 959–966. [Google Scholar] [CrossRef]
- Mosse, K.P.M.; Patti, A.F.; Christen, E.W.; Cavagnaro, T.R. Winery Wastewater Inhibits Seed Germination and Vegetative Growth of Common Crop Species. J. Hazard. Mater. 2010, 180, 63–70. [Google Scholar] [CrossRef] [PubMed]
- Rizzo, L.; Fiorentino, A.; Grassi, M.; Attanasio, D.; Guida, M. Advanced Treatment of Urban Wastewater by Sand Filtration and Graphene Adsorption for Wastewater Reuse: Effect on a Mixture of Pharmaceuticals and Toxicity. J. Environ. Chem. Eng. 2015, 3, 122–128. [Google Scholar] [CrossRef]
- Lucas, M.S.; Peres, J.A.; Li, G. Treatment of Winery Wastewater by Ozone-Based Advanced Oxidation Processes (O3, O3/UV and O3/UV/H2O2) in a Pilot-Scale Bubble Column Reactor and Process Economics. Sep. Purif. Technol. 2010, 72, 235–241. [Google Scholar] [CrossRef]
- Li, L.; Sun, B. Grape and Wine Polymeric Polyphenols: Their Importance in Enology. Crit. Rev. Food Sci. Nutr. 2019, 59, 563–579. [Google Scholar] [CrossRef] [PubMed]
- Cheynier, V.; Dueñas-Paton, M.; Salas, E.; Maury, C.; Souquet, J.; Sarni-manchado, P.; Fulcrand, H. Structure and Properties of Wine Pigments and Tannins. Am. J. Enol. Vitic. 2006, 57, 298–305. [Google Scholar] [CrossRef]
Figure 1.
Fourier-transform infrared spectroscopy (FTIR) spectra of Na-Mt.

Figure 2.
Illustration of the adsorption and thermocatalytic oxidation processes.

Figure 3.
Effect of pH (2.0–11.0) in WW organic matter adsorption onto Na-Mt, under the following operational conditions: [Na-Mt] = 3.0 g/L, V = 500 mL, agitation 350 rpm, T = 298 K, t = 24 h.
Figure 3.
Effect of pH (2.0–11.0) in WW organic matter adsorption onto Na-Mt, under the following operational conditions: [Na-Mt] = 3.0 g/L, V = 500 mL, agitation 350 rpm, T = 298 K, t = 24 h.

Figure 4.
Effect of Na-Mt dosage variation (0.5–10.0 g/L) in adsorption of organic matter from WW onto Na-Mt, under the following operational conditions: pH = 3.0, V = 500 mL, agitation 350 rpm, T = 298 K, t = 24 h.
Figure 4.
Effect of Na-Mt dosage variation (0.5–10.0 g/L) in adsorption of organic matter from WW onto Na-Mt, under the following operational conditions: pH = 3.0, V = 500 mL, agitation 350 rpm, T = 298 K, t = 24 h.

Figure 5.
Evolution of TOC removal throughout different /H2O2 ratio (1:0–1:1.5) in thermocatalytic oxidation, under the following operational conditions: [] = 1.0 g/L, pH = 11.0, T = 333 K, agitation 350 rpm, t = 2 h. A blank experiment under the following operational conditions is also shown as reference: pH = 11.0, T = 333 K, agitation 350 rpm, t = 2 h. Means in bars with different letters represent significant differences (p < 0.05) between each ratio.

Figure 6.
Evolution of TOC removal throughout different /H2O2 dosage (0.1:0.025–2:0.5 g/g) in thermocatalytic oxidation, under the following operational conditions: /H2O2 ratio = 1:0.25, pH = 11.0, T = 333 K, agitation 350 rpm, t = 2 h. A blank experiment under the following operational conditions is also shown as reference: pH = 11.0, T = 333 K, agitation 350 rpm, t = 2 h. Means in bars with different letters represent significant differences (p < 0.05) between each dosage.

Figure 7.
Evolution of TOC removal at different pH (3.0–11.0) in thermocatalytic oxidation, under the following operational conditions: /H2O2 ratio = 1:0.25, /H2O2 dosage = 0.1:0.025 (g/g), T = 333 K, agitation 350 rpm, t = 2 h. A blank experiment under the following operational conditions is also shown as reference: pH = 11.0, T = 333 K, agitation 350 rpm, t = 2 h. Means in bars with different letters represent significant differences (p < 0.05) between each pH.

Figure 8.
Evolution of TOC removal at different temperatures (303–343 K) in thermocatalytic oxidation, under the following operational conditions: /H2O2 ratio = 1:0.25, /H2O2 dosage = 0.1:0.025 (g/g), pH = 7.0, agitation 350 rpm, t = 2 h. Blank experiments at different temperatures (303–343 K) are also shown as reference, under the following operational conditions: pH = 7.0, agitation 350 rpm, t = 2 h. Means in bars with different letters represent significant differences (p < 0.05) between each process (Blank and thermocatalytic oxidation) by comparing temperatures.

Figure 9.
Overall results after adsorption process and thermocatalytic oxidation processes in (a) TOC, COD and BOD5 removal and (b) turbidity, TSS and total polyphenols. Adsorption operational conditions, as follows: [Na-Mt] = 5.0 g/L, pH = 3.0, V = 500 mL, agitation 350 rpm, T = 298 K, t = 24 h. Thermocatalytic oxidation conditions, as follows: /H2O2 ratio = 1:0.25, /H2O2 dosage = 0.1:0.025 (g/g), pH = 7.0, T = 343 K, agitation 350 rpm, t = 2 h. Means in bars with different letters represent significant differences (p < 0.05) between each parameter (TOC, COD, BOD5, turbidity, TSS and total polyphenols) by comparing wastewaters.

Figure 10.
Analysis of seed phytotoxicity after wastewater treatment, by evaluation of germination index (GI). Adsorption operational conditions, as follows: [Na-Mt] = 5.0 g/L, pH = 3.0, V = 500 mL, agitation 350 rpm, T = 298 K, t = 24 h. Thermocatalytic oxidation conditions, as follows: /H2O2 ratio = 1:0.25, /H2O2 dosage = 0.1:0.025 (g/g), pH = 7.0, T = 343 K, agitation 350 rpm, t = 2 h. GI ≤ 50% (high concentration of phytotoxic substances), 80% < GI > 50% (moderated presence of phytotoxic substances), GI ≥ 80% (there are no phytotoxic substances, or they exist in very small dosages). Means in bars with different letters represent significant differences (p < 0.05) between each process (blank, adsorption and thermocatalytic oxidation) by comparing different plant seeds.

Figure 11.
Analysis of phenolic composition after adsorption process and combined adsorption-thermocatalytic oxidation processes. Adsorption operational conditions, as follows: [Na-Mt] = 5.0 g/L, pH = 3.0, V = 500 mL, agitation 350 rpm, T = 298 K, t = 24 h. Thermocatalytic oxidation conditions, as follows: /H2O2 ratio = 1:0.25, /H2O2 dosage = 0.1:0.025 (g/g), pH = 7.0, T = 343 K, agitation 350 rpm, t = 2 h. Means in bars with different letters represent significant differences (p < 0.05) between each parameter (total phenols, non-flavonoids, flavonoids, total anthocyanins, colored anthocyanins, total pigments and total tannins) by comparing wastewaters.

Table 2.
Equations for phenolic composition and chromatic (CIELab) determination [38].
Table 2.
Equations for phenolic composition and chromatic (CIELab) determination [38].
| Equations | Parameters | References |
|---|---|---|
| Color intensity (CI) | A420—absorbance at 420 nm | OIV, [39] |
| CI = A420 + A520 + A620 | A520—absorbance at 520 nm | |
| Hue | A620—absorbance at 620 nm | OIV, [39] |
| A280—absorbance at 280 nm | ||
| Total polyphenol index (TPI) | DF-dilution factor | Curvelo-Garcia, [40] |
| TPI = A280 × DF | ||
| Total phenols | Kramling and Singleton, [41] | |
| Total phenols (mg gallic acid/L) = × DF | ||
| Non-flavonoids | Kramling and Singleton, [41] | |
| Non-flavonoids (mg gallic acid/L) = × DF | ||
| Flavonoids | Kramling and Singleton, [41] | |
| Flavonoids (mg gallic acid/L) = Total phenols—Non-flavonoids | ||
| Total anthocyanins (C) | A1—absorbance at 520 nm | Ribéreau-Gayon et al. [42] |
| C (mg/L) = 875 × (A1 − A2) | A2—absorbance at 520 nm | |
| Colored anthocyanins (CA) | Somers and Evans [43] | |
| CA (mg/L) = ( × 10) − ( × 10) | ||
| Total pigments (TP) | Somers and Evans [43] | |
| TP (mg/L) = × 10 | ||
| Polymeric pigments (PP) | Somers and Evans [43] | |
| PP (mg/L) = × 10 | ||
| Total tannins (L.A.) | Ribéreau-Gayon and Stonestreet [44] | |
| L.A. (g/L) = 19.33 × (D2 − D1) | D1/D2 absorbance at 550 nm | |
| CIELab | L—lightness | Schanda [46] |
| A—redness | ||
| B—yellowness | ||
Table 3.
Chemical composition of activated sodium bentonite (Na-Mt), by EDS/EDAX [38].
Table 3.
Chemical composition of activated sodium bentonite (Na-Mt), by EDS/EDAX [38].
| Element | Mass Concentration (wt (%)) |
|---|---|
| %Si | 69.49 |
| %Al | 17.67 |
| %Fe | 2.95 |
| %Mg | 2.73 |
| %Ca | 2.00 |
| %Na | 2.76 |
| %K | 1.37 |
| %S | 1.03 |
Table 4.
Sodium percarbonate release mechanism.
| [SPC] | [H2O2] Theoretical | [H2O2] Measured | TOC |
|---|---|---|---|
| g/L | mg/L | mg/L | mg C/L |
| 0.1 | 32.5 | 22.7 | 0.000 |
| 0.5 | 162.4 | 140.3 | 0.000 |
| 1.0 | 324.8 | 354.5 | 0.000 |
Table 5.
Analysis of chromatic characteristics (CIELab) after adsorption process and combined adsorption–thermocatalytic oxidation processes. Adsorption operational conditions, as follows: [Na-Mt] = 5.0 g/L, pH = 3.0, V = 500 mL, agitation 350 rpm, T = 298 K, t = 24 h. Thermocatalytic oxidation conditions, as follows: /H2O2 ratio = 1:0.25, /H2O2 dosage = 0.1:0.025 (g/g), pH = 7.0, T = 343 K, agitation 350 rpm, t = 2 h. Means in the same column with different letters represent significant differences (p < 0.05) within each parameter by comparing the different processes.
| Processes | Time | L | a | b | ∆L | ∆a | ∆b | ∆Eab |
|---|---|---|---|---|---|---|---|---|
| (hours) | (%) | |||||||
| Blank | 0 | 5.9 ± 1.7 a | 3.26 ± 1.3 a | 3.60 ± 1.5 a | ||||
| Adsorption | 24 | 90.5 ± 0.4 b | 0.93 ± 0.5 b | 2.86 ± 1.9 b | 84.5 ± 0.8 a | −2.33 ± 1.0 a | −0.74 ± 1.2 a | 84.58 ± 0.3 a |
| Thermocatalytic oxidation | 26 | 95.5 ± 0.2 c | 1.02 ± 1.4 b | 8.34 ± 1.5 c | 89.6 ± 0.4 b | −2.24 ± 1.6 b | 4.74 ± 3.5 b | 89.71 ± 0.9 b |
Publisher’s Note: MDPI stays neutral with regard to jurisdictional claims in published maps and institutional affiliations. |
© 2021 by the authors. Licensee MDPI, Basel, Switzerland. This article is an open access article distributed under the terms and conditions of the Creative Commons Attribution (CC BY) license (https://creativecommons.org/licenses/by/4.0/).
Share and Cite
MDPI and ACS Style
Jorge, N.; Teixeira, A.R.; Guimarães, V.; Lucas, M.S.; Peres, J.A. Treatment of Winery Wastewater with a Combination of Adsorption and Thermocatalytic Processes. Processes 2022, 10, 75. https://doi.org/10.3390/pr10010075
AMA Style
Jorge N, Teixeira AR, Guimarães V, Lucas MS, Peres JA. Treatment of Winery Wastewater with a Combination of Adsorption and Thermocatalytic Processes. Processes. 2022; 10(1):75. https://doi.org/10.3390/pr10010075
Chicago/Turabian StyleJorge, Nuno, Ana R. Teixeira, Vanessa Guimarães, Marco S. Lucas, and José A. Peres. 2022. "Treatment of Winery Wastewater with a Combination of Adsorption and Thermocatalytic Processes" Processes 10, no. 1: 75. https://doi.org/10.3390/pr10010075
Note that from the first issue of 2016, this journal uses article numbers instead of page numbers. See further details here.