
Dried Brown Seaweed’s Phytoremediation Potential for Methylene Blue Dye Removal from Aquatic Environments

 ,
, 
 ,
,  and
and 
Abstract
:1. Introduction
2. Materials and Methods
2.1. Brown Seaweeds (Sargassum latifolium)
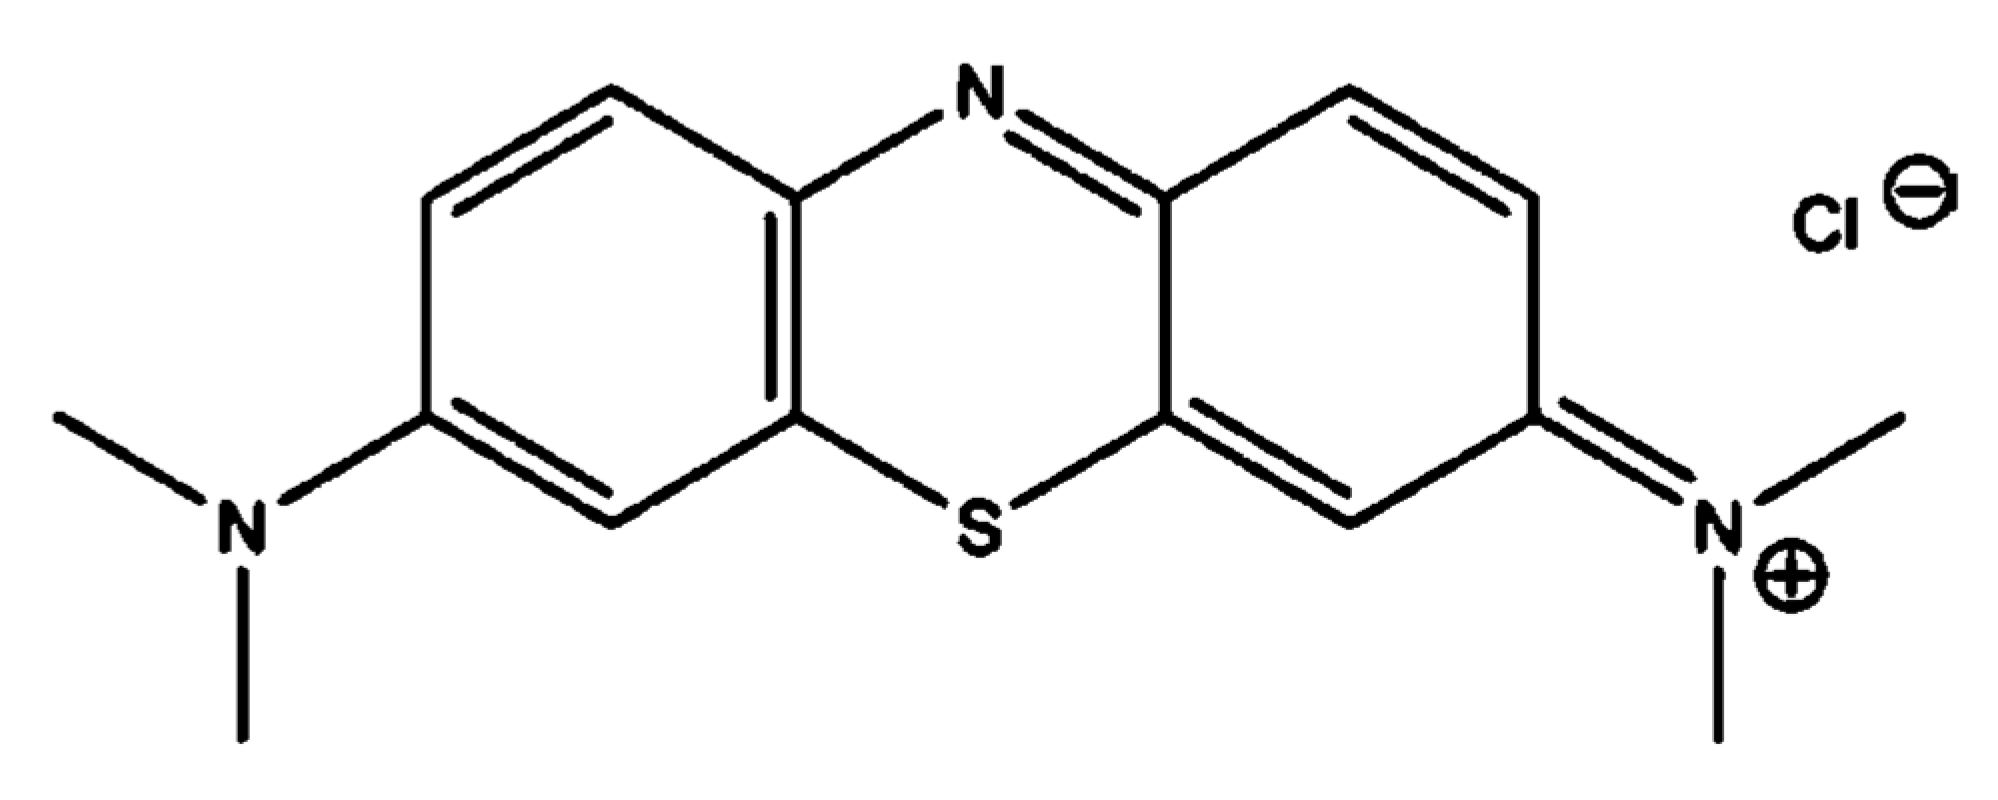
2.2. Methylene Blue Dye (MBD)
2.3. Adsorption Experimentation
2.4. Adsorption Isotherm Studies
2.4.1. The Freundlich Model
2.4.2. The Langmuir Model
2.4.3. The Henderson and Halsey Isotherm Models
2.4.4. The Harkins–Jura Model
2.4.5. The Smith Model
2.4.6. The Tempkin Model
2.5. Error Functions Tests
2.5.1. Fractional Error Hybrid (HYBRID)
2.5.2. Average Percentage Error (APE)
2.5.3. Nonlinear Chi-Square Analysis (χ2)
2.5.4. Sum Squares of the Errors (ERRSQ)
2.5.5. Sum of Absolute Errors (EABS)
2.6. Adsorption Kinetics Studies
2.6.1. Pseudo-First-Order (PFO)
2.6.2. Pseudo-Second-Order (PSO)
2.6.3. The Intraparticle Diffusion Model
2.7. Characterization of Adsorbents
3. Results and Discussion
3.1. Characterizations
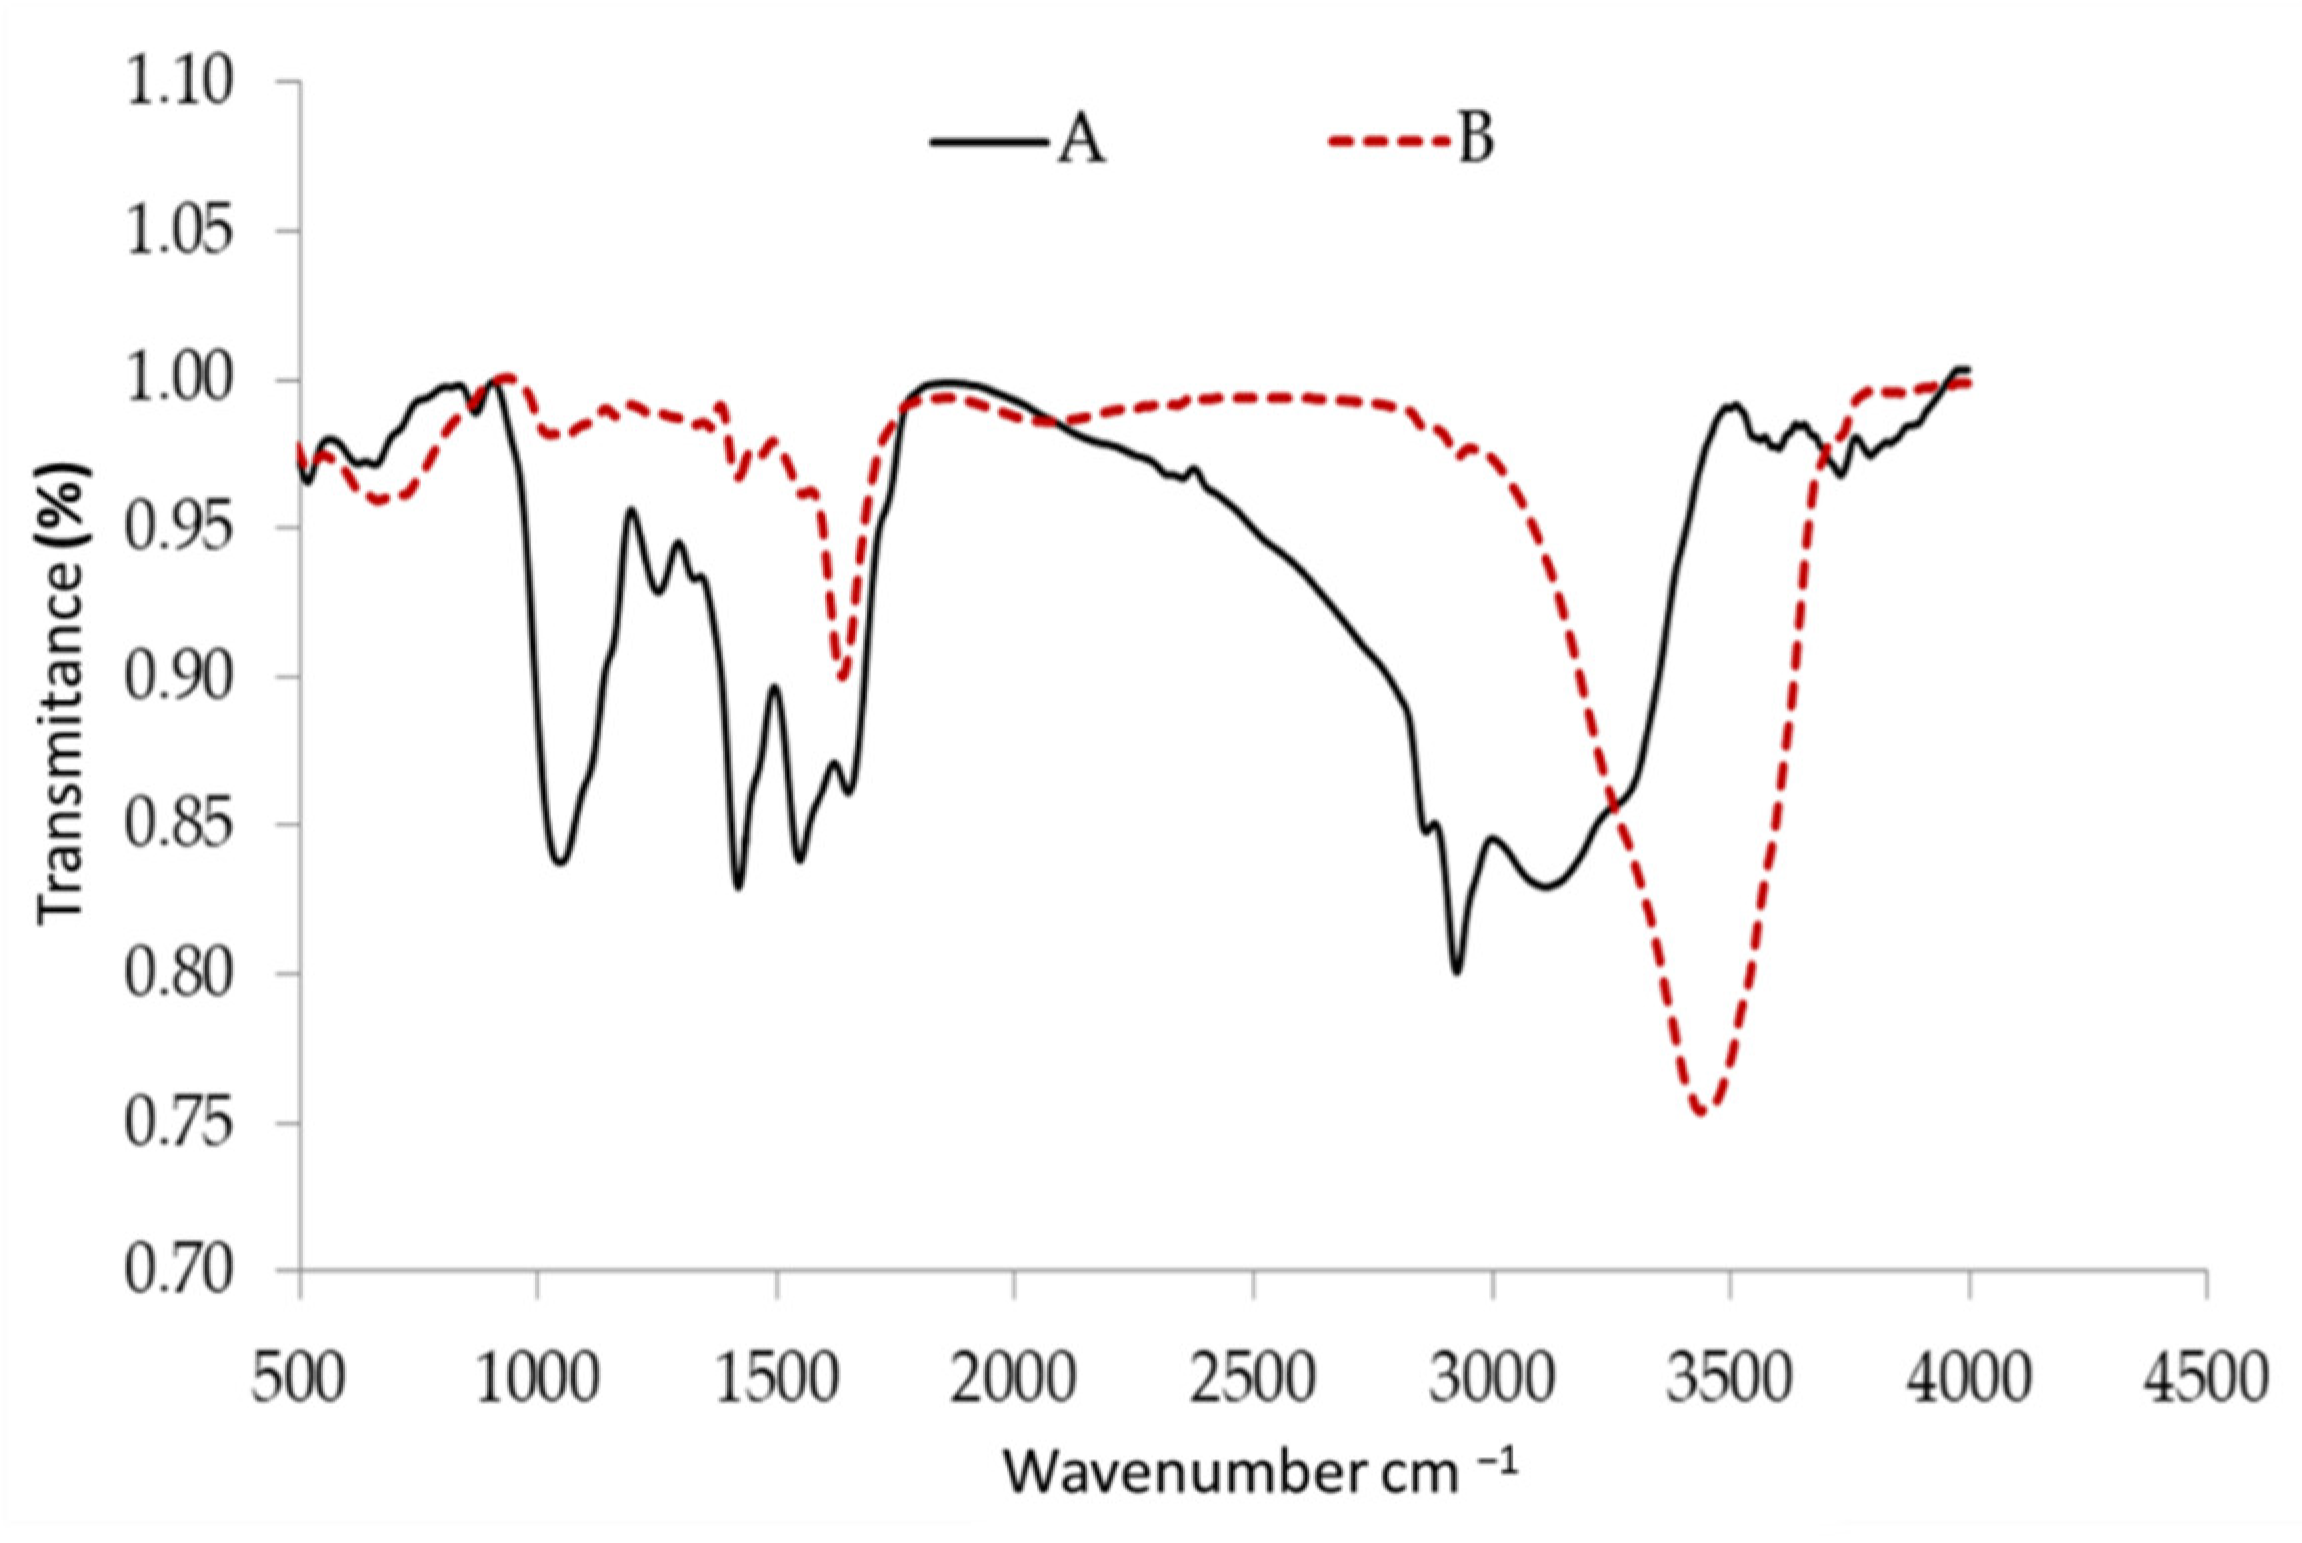
3.1.1. Functional Groups
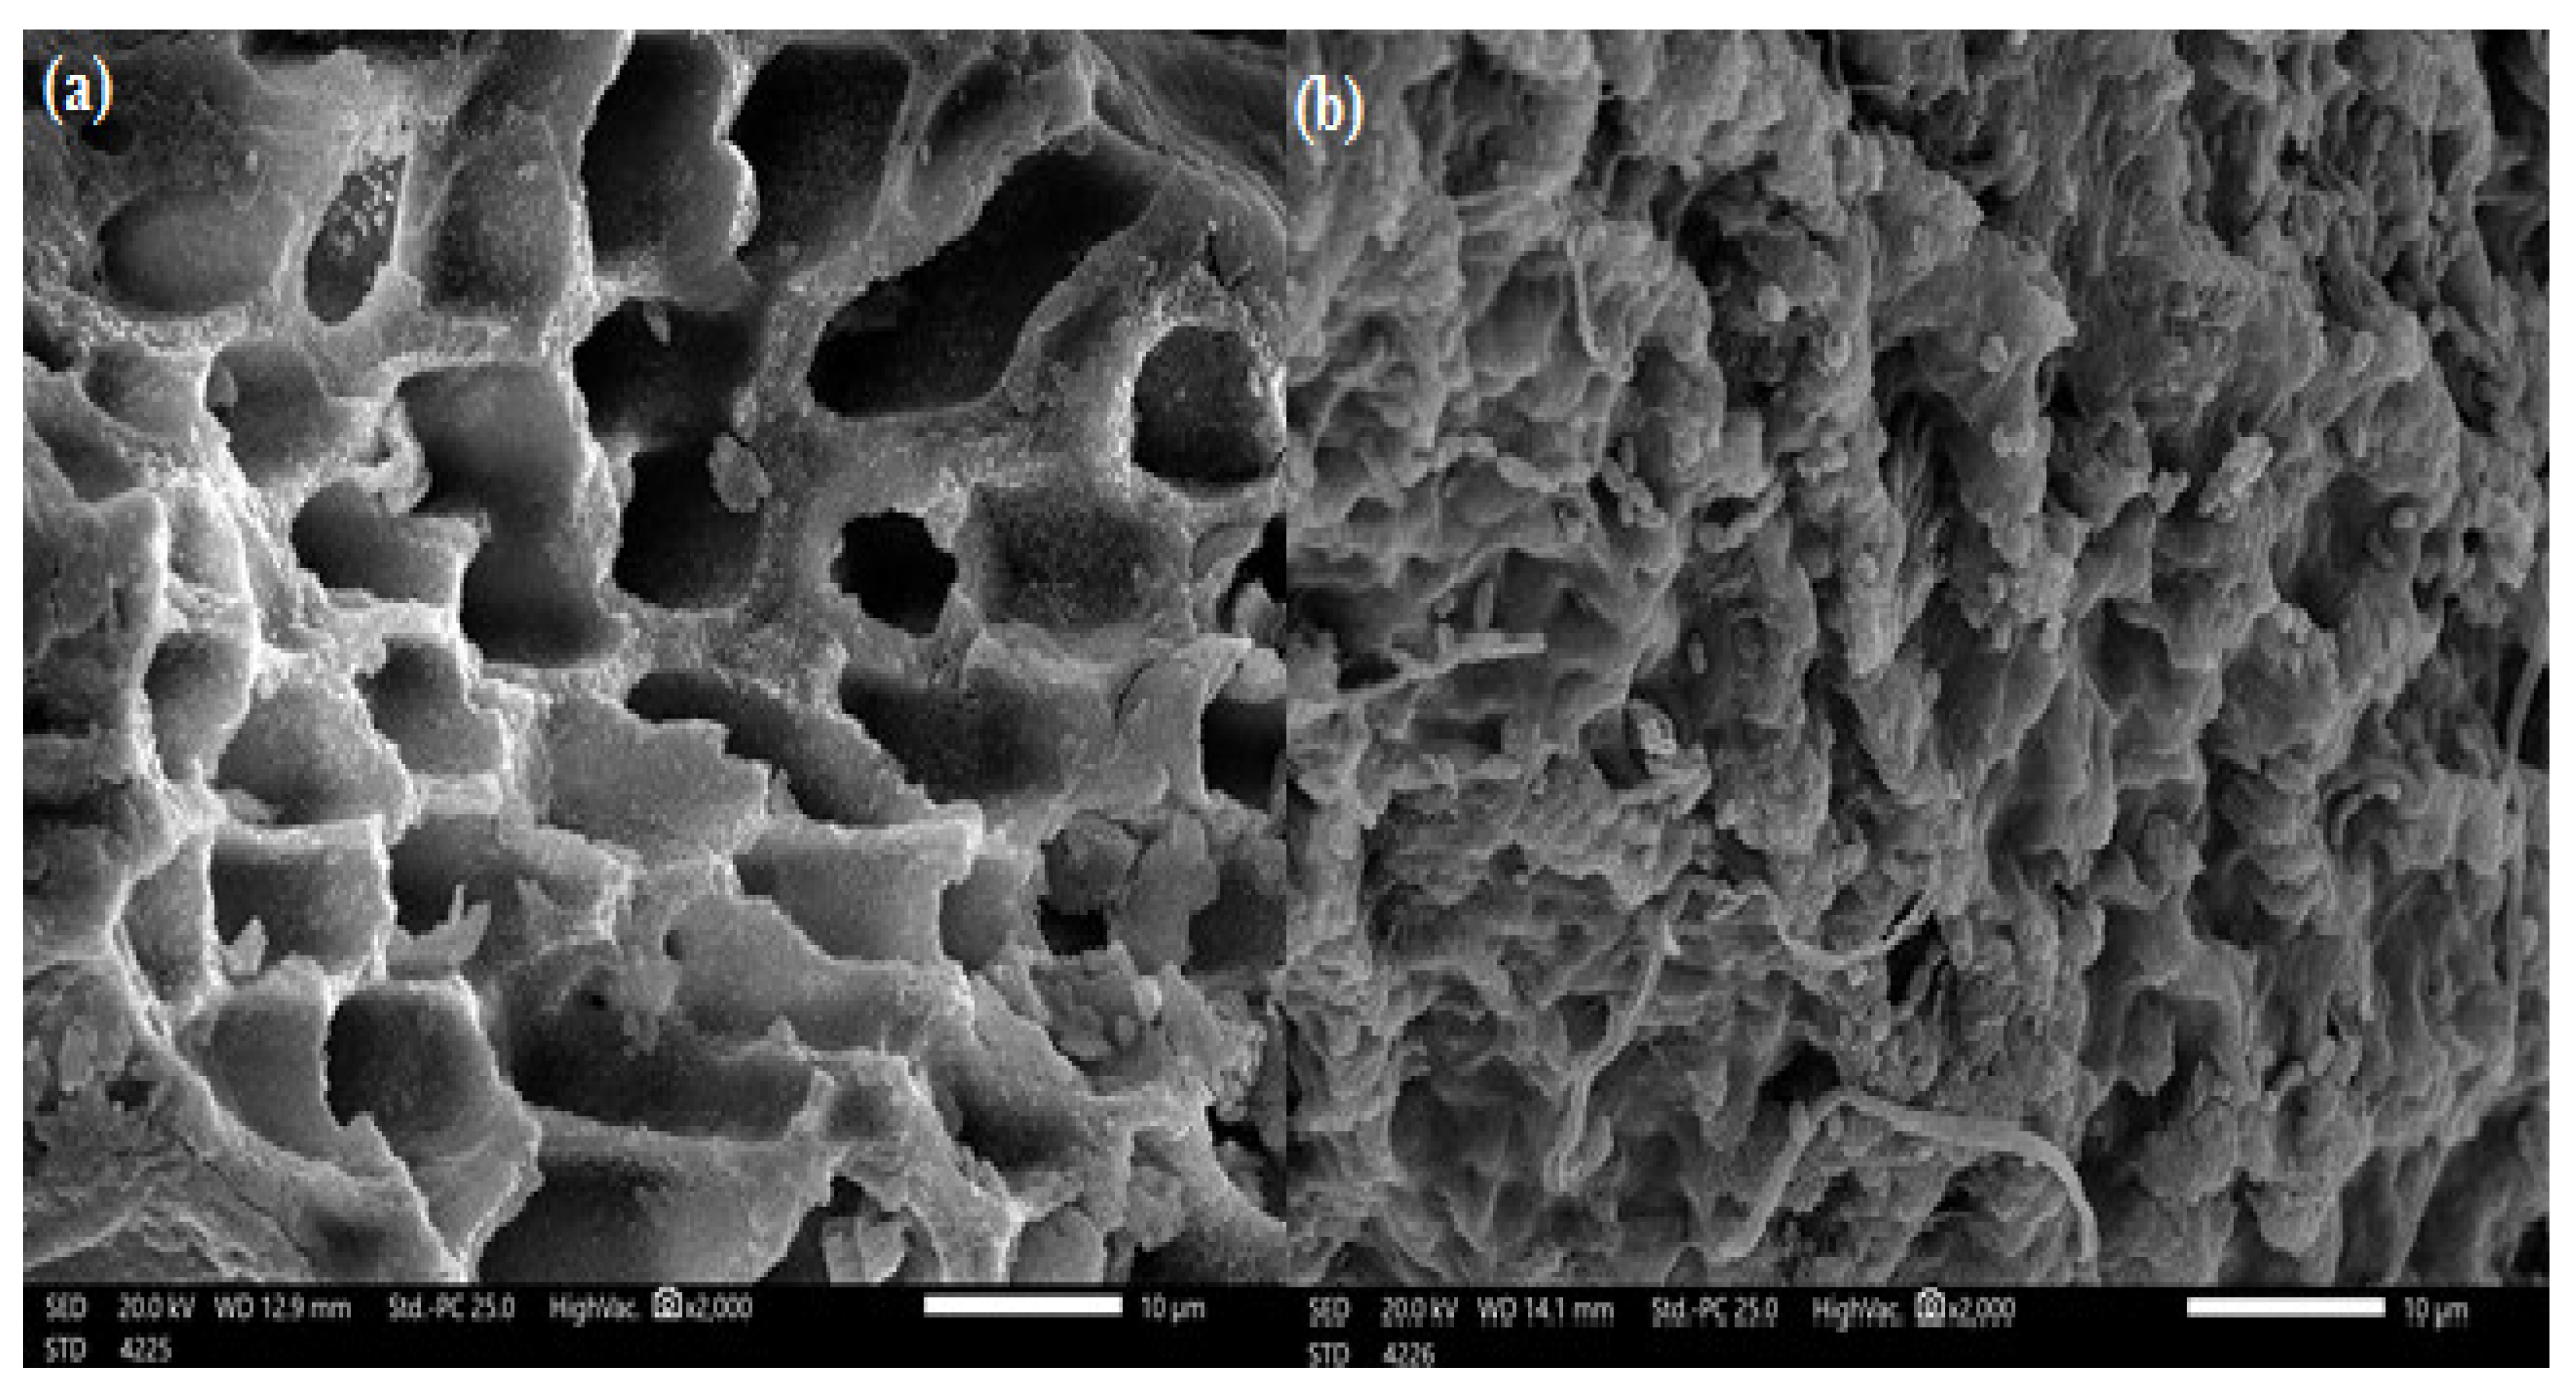
3.1.2. Surface Morphology
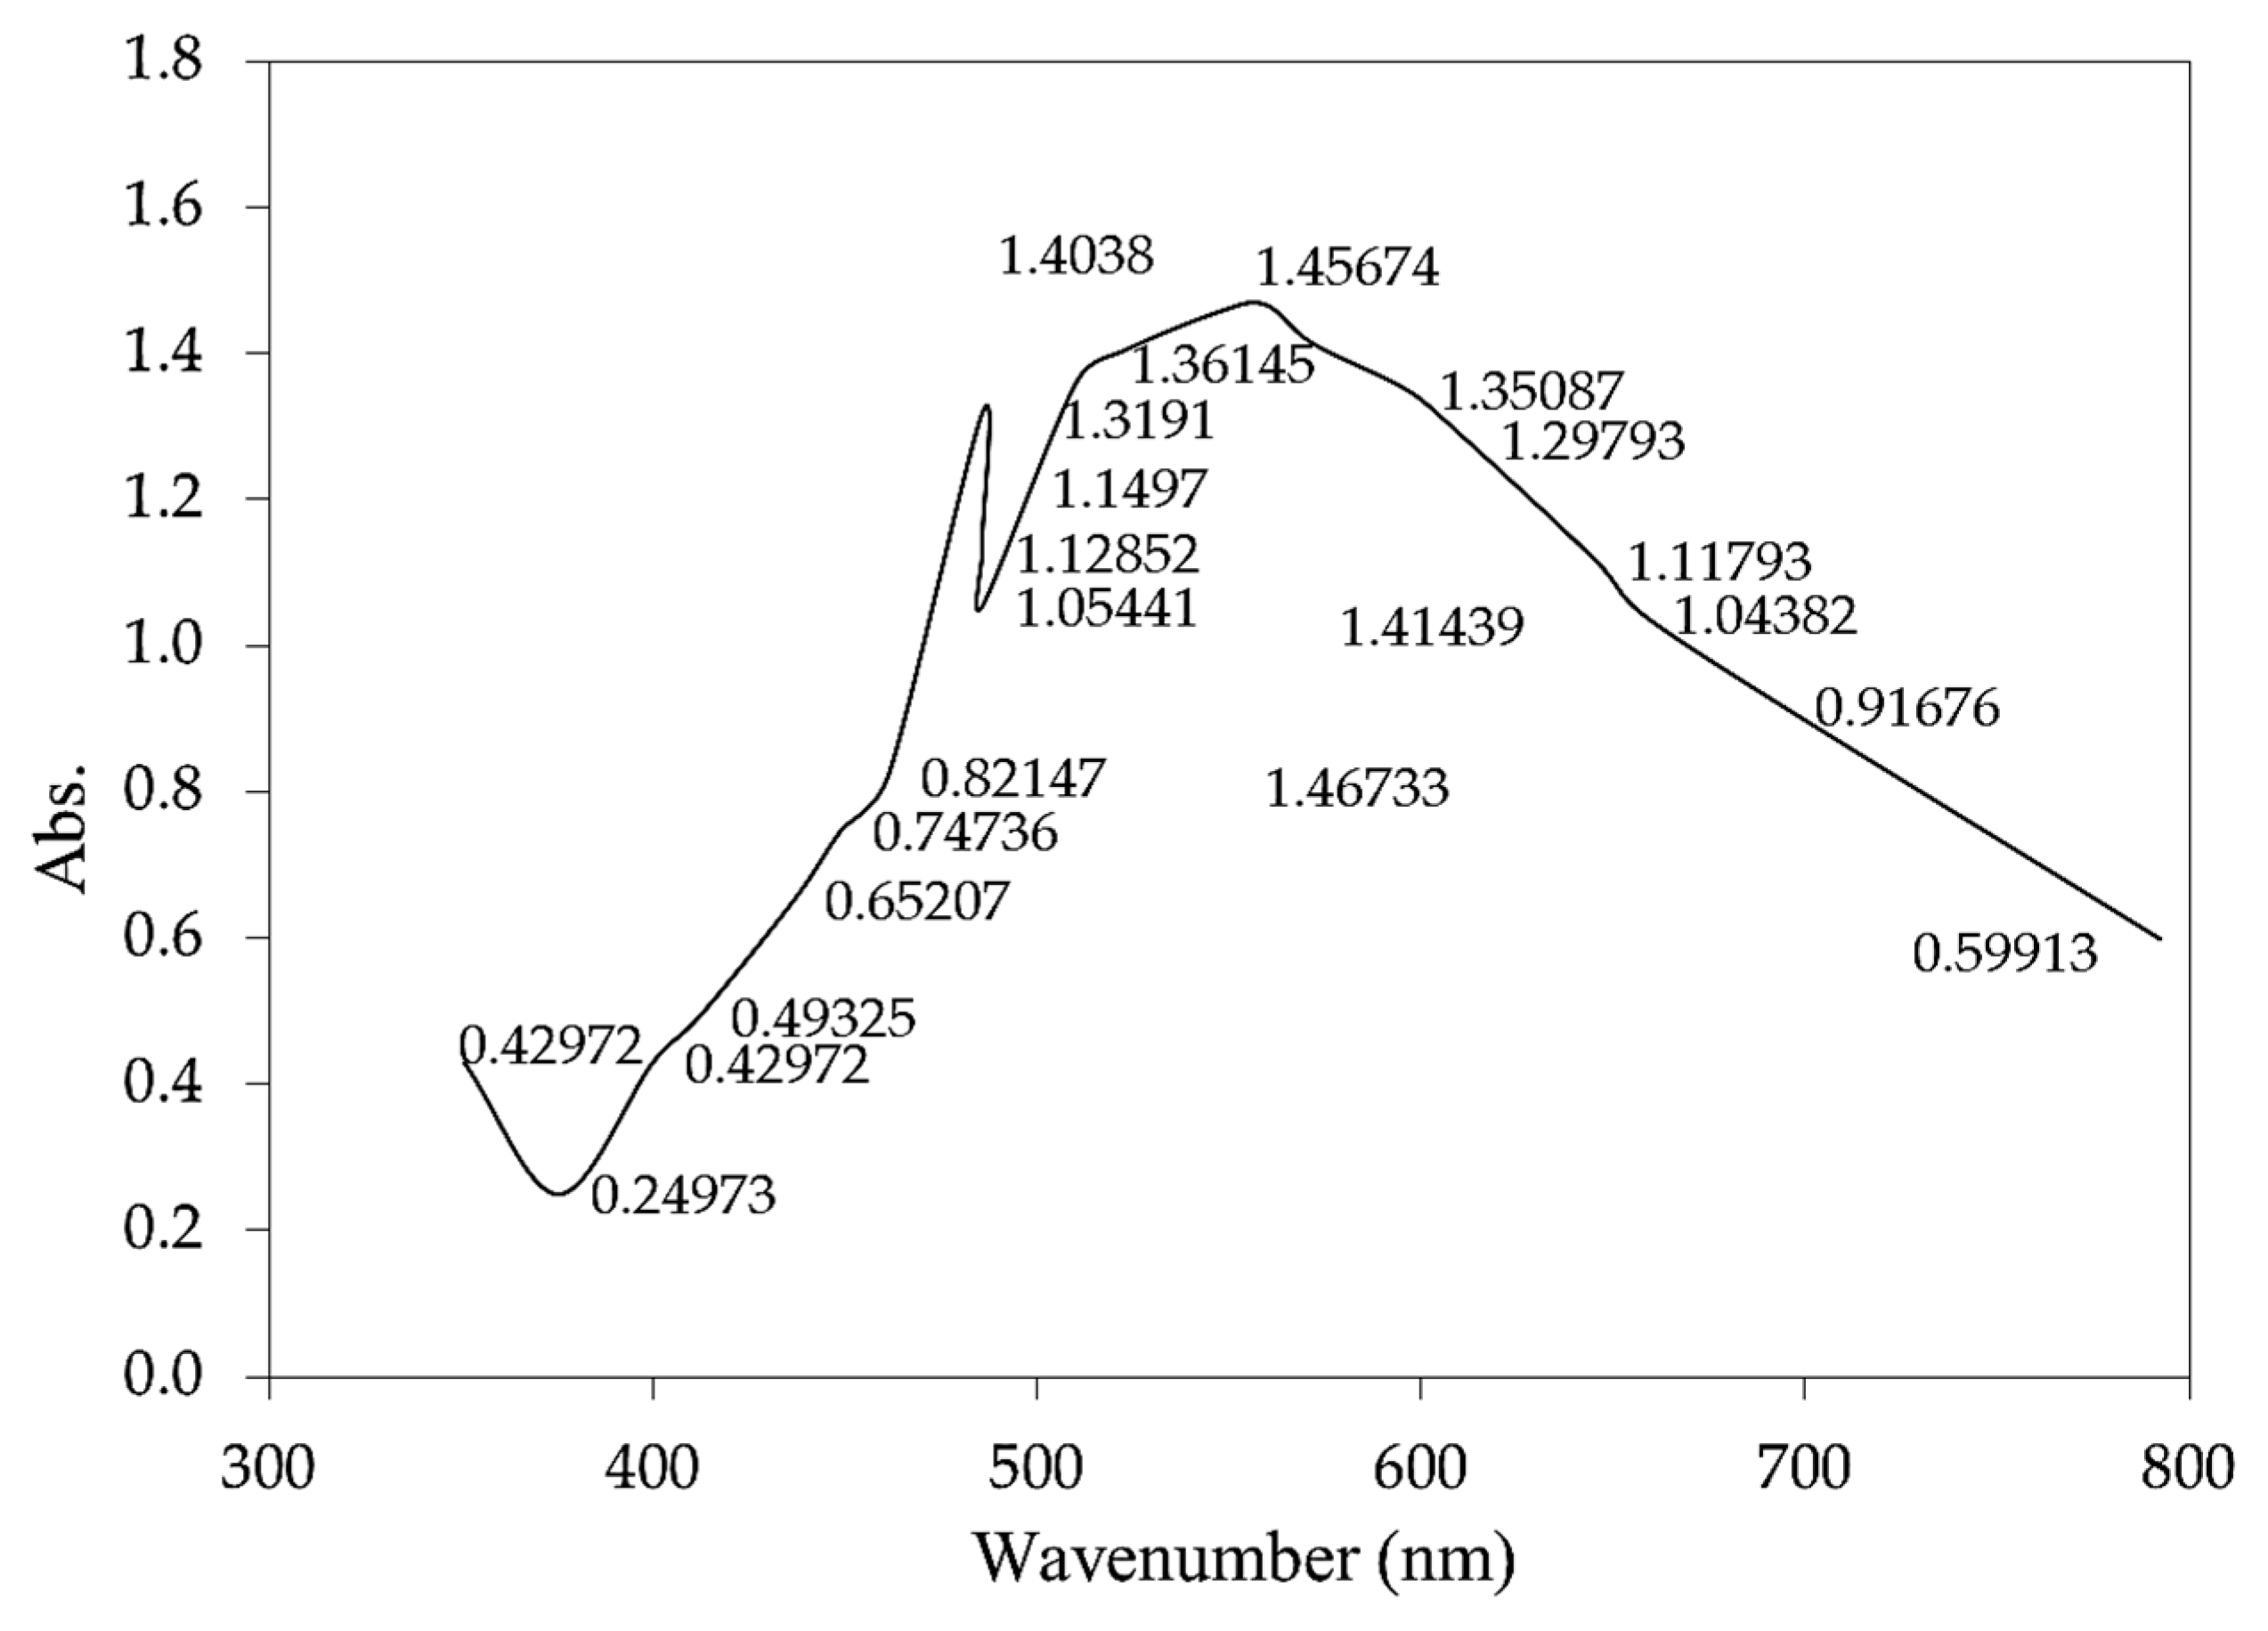
3.1.3. UV—Visible Spectral Examination
3.1.4. BET Characterization
3.2. Study of Batch Adsorption Process
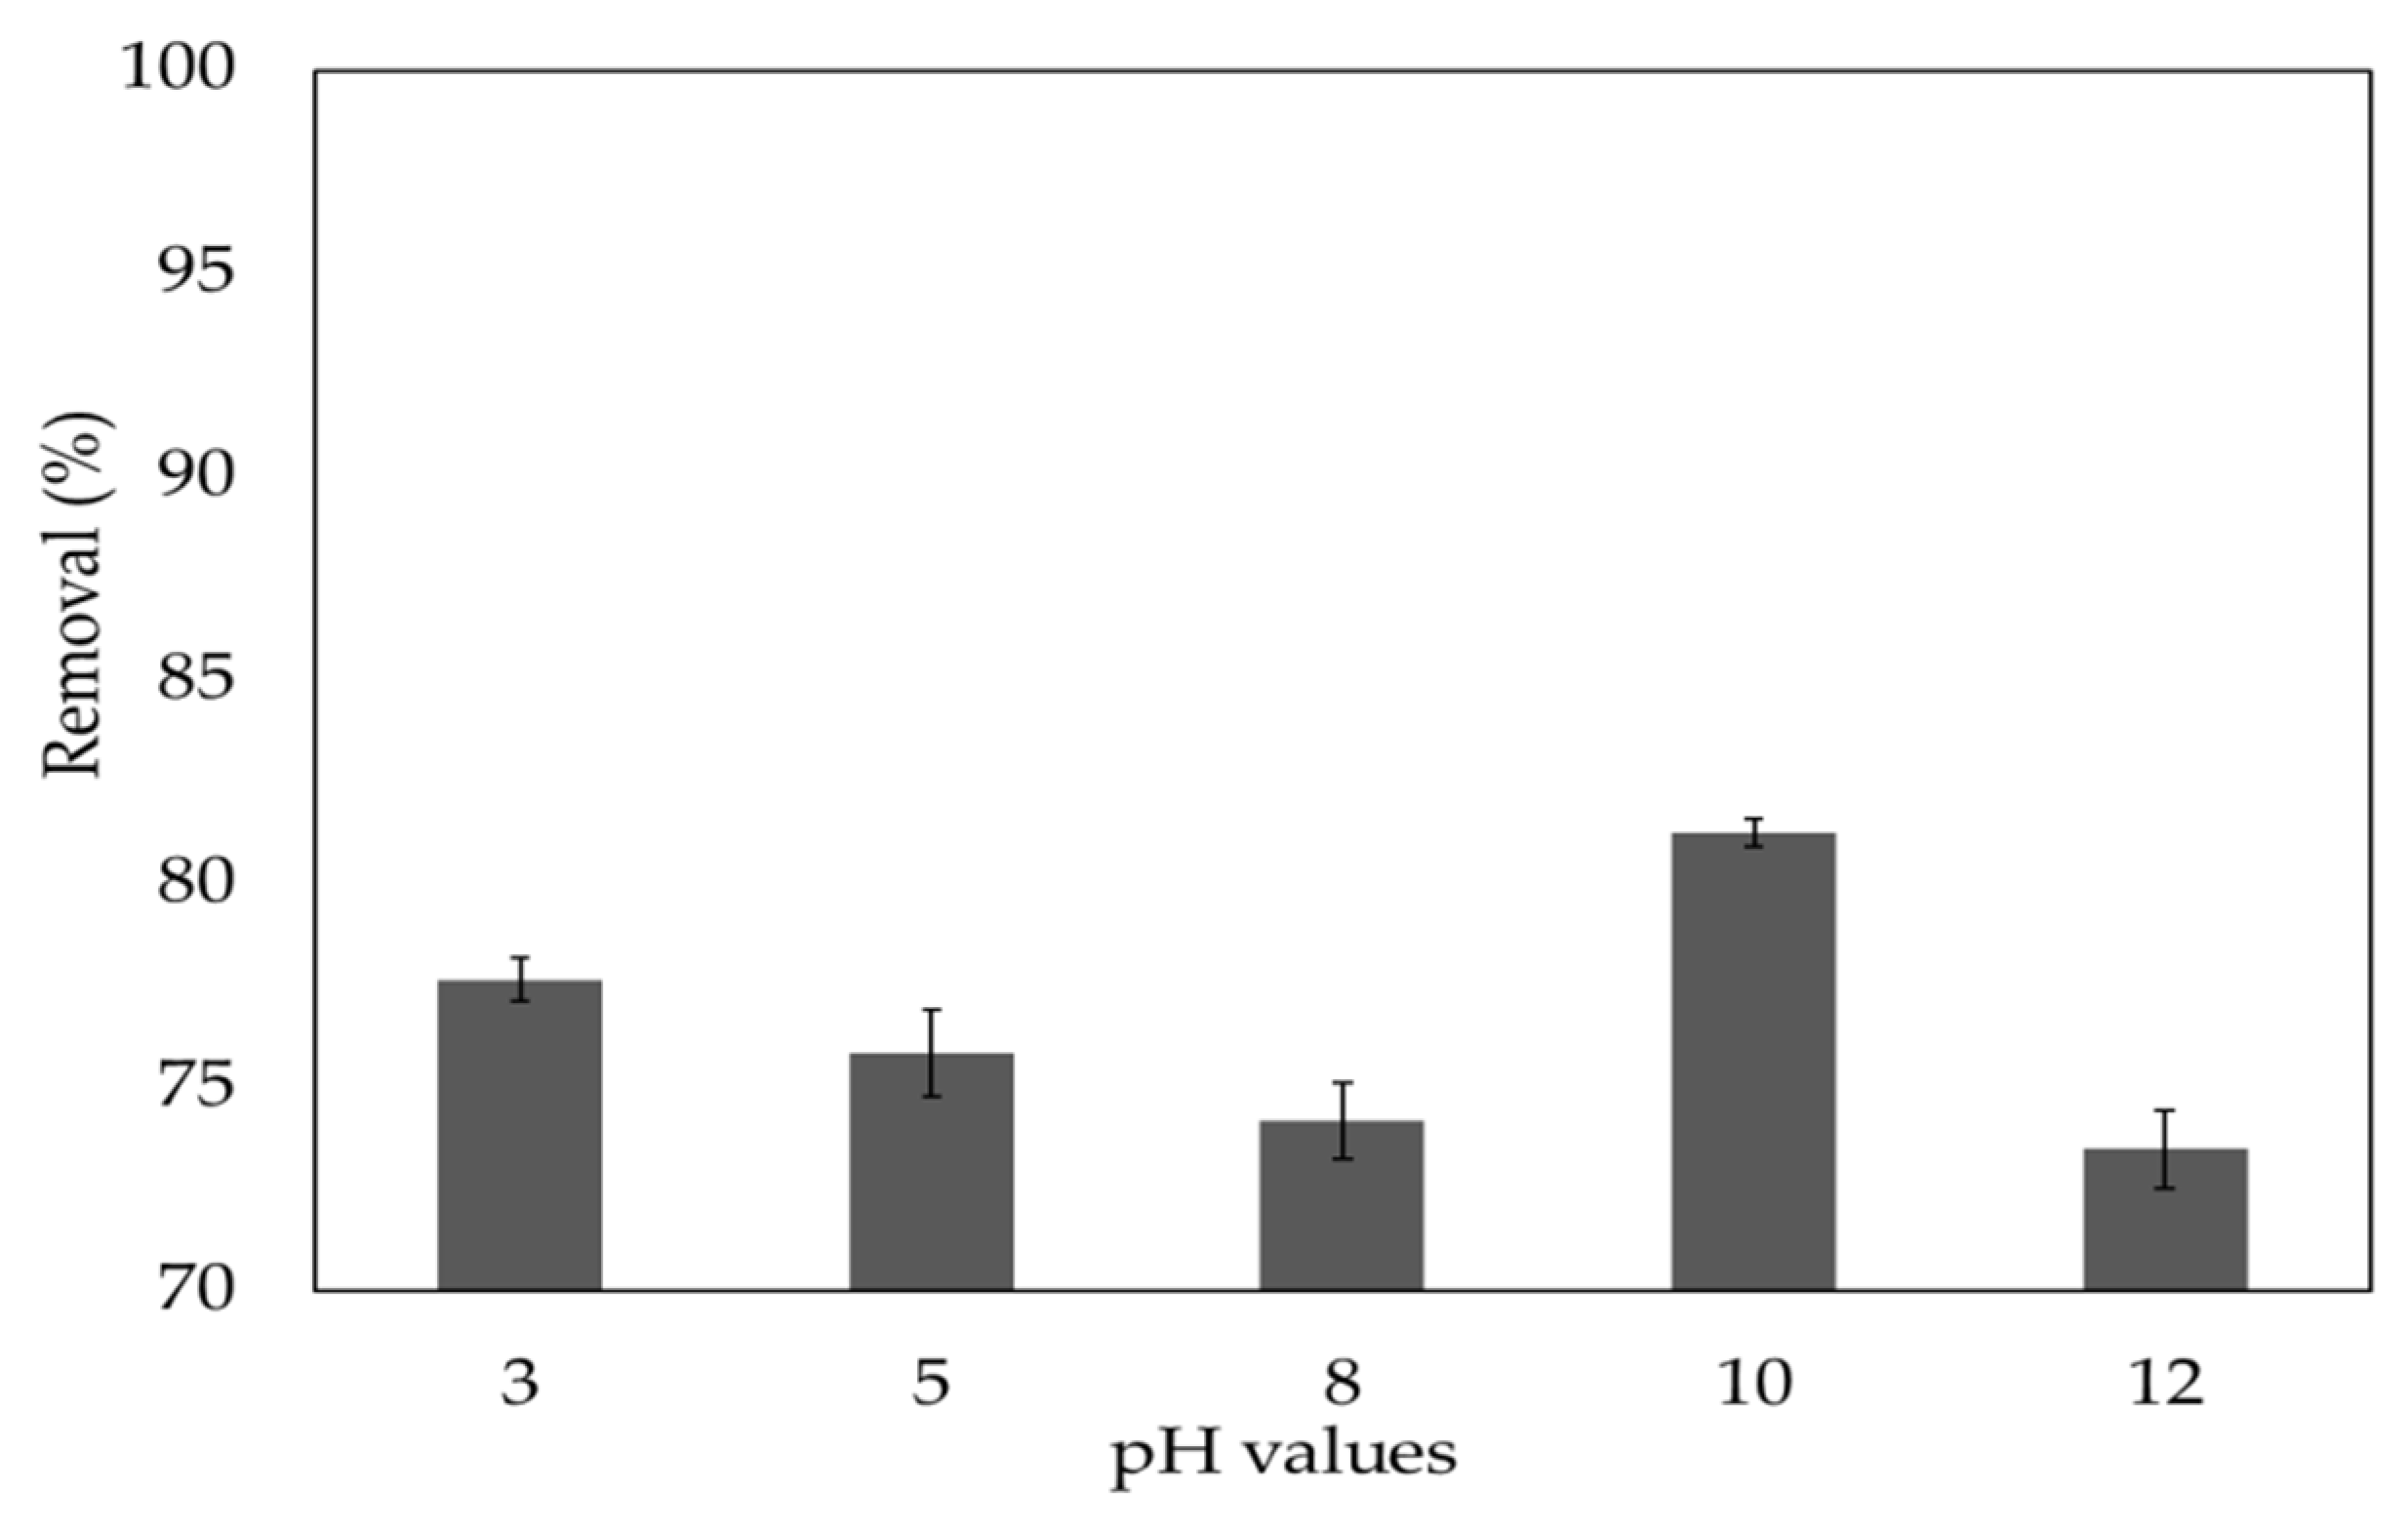
3.2.1. pH
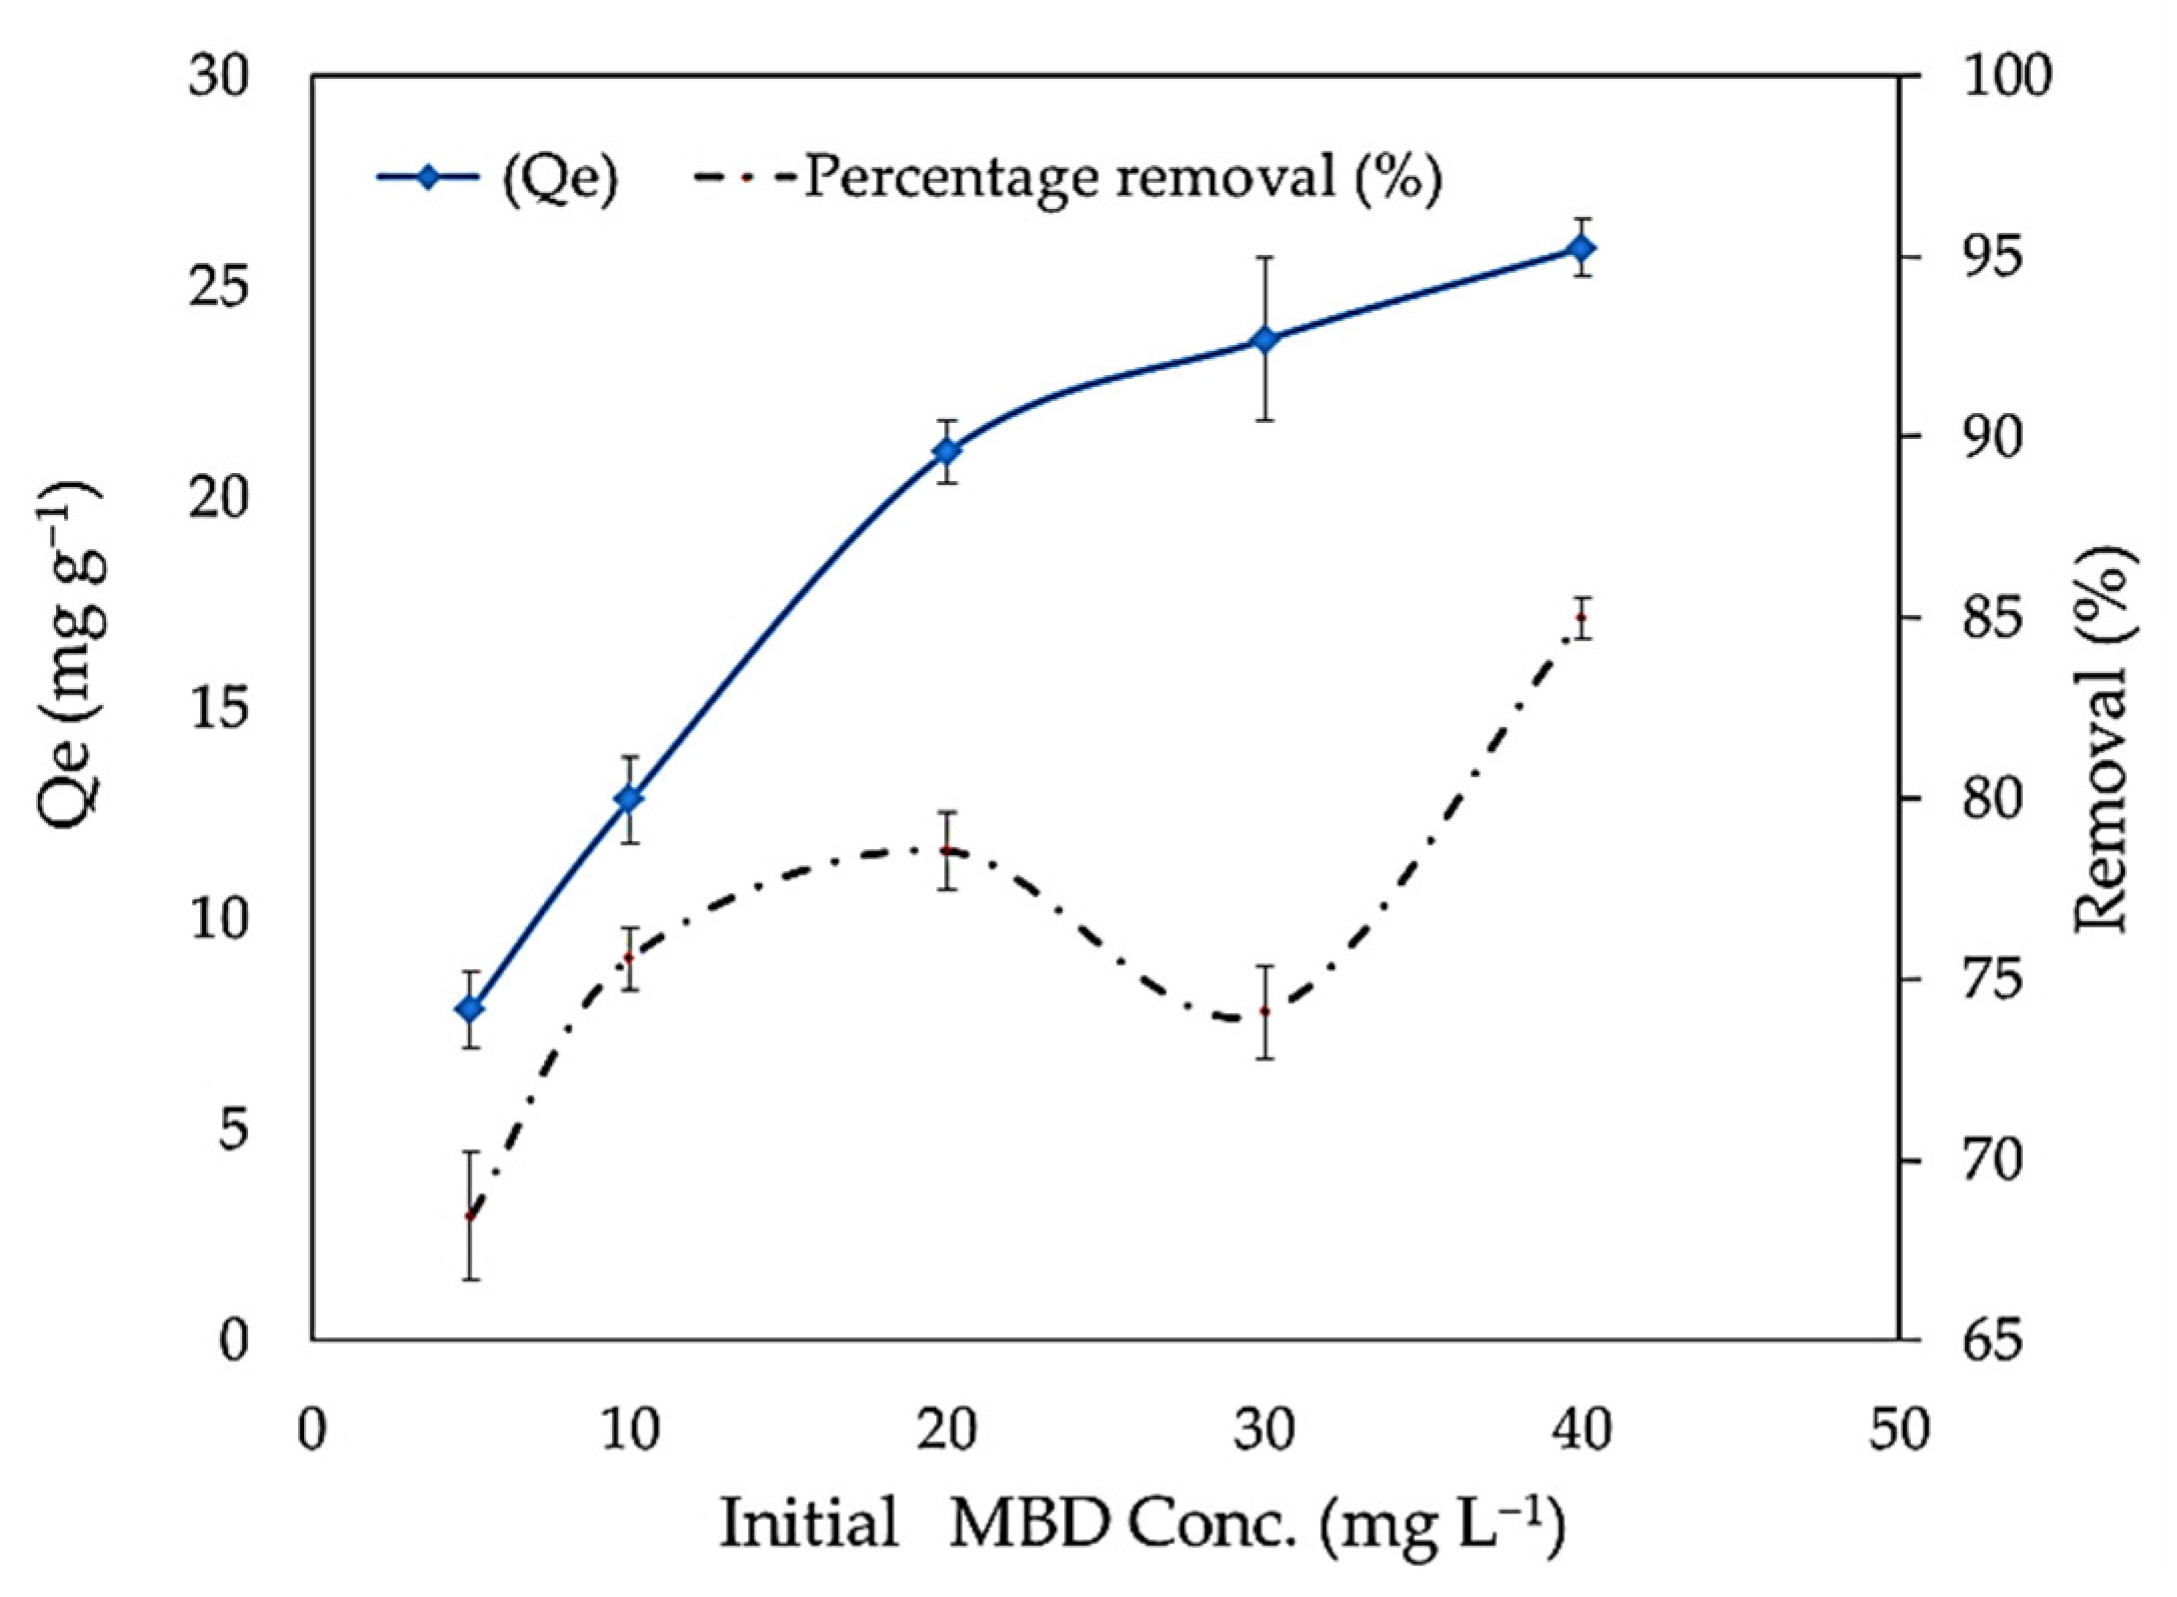
3.2.2. MDB Concentration
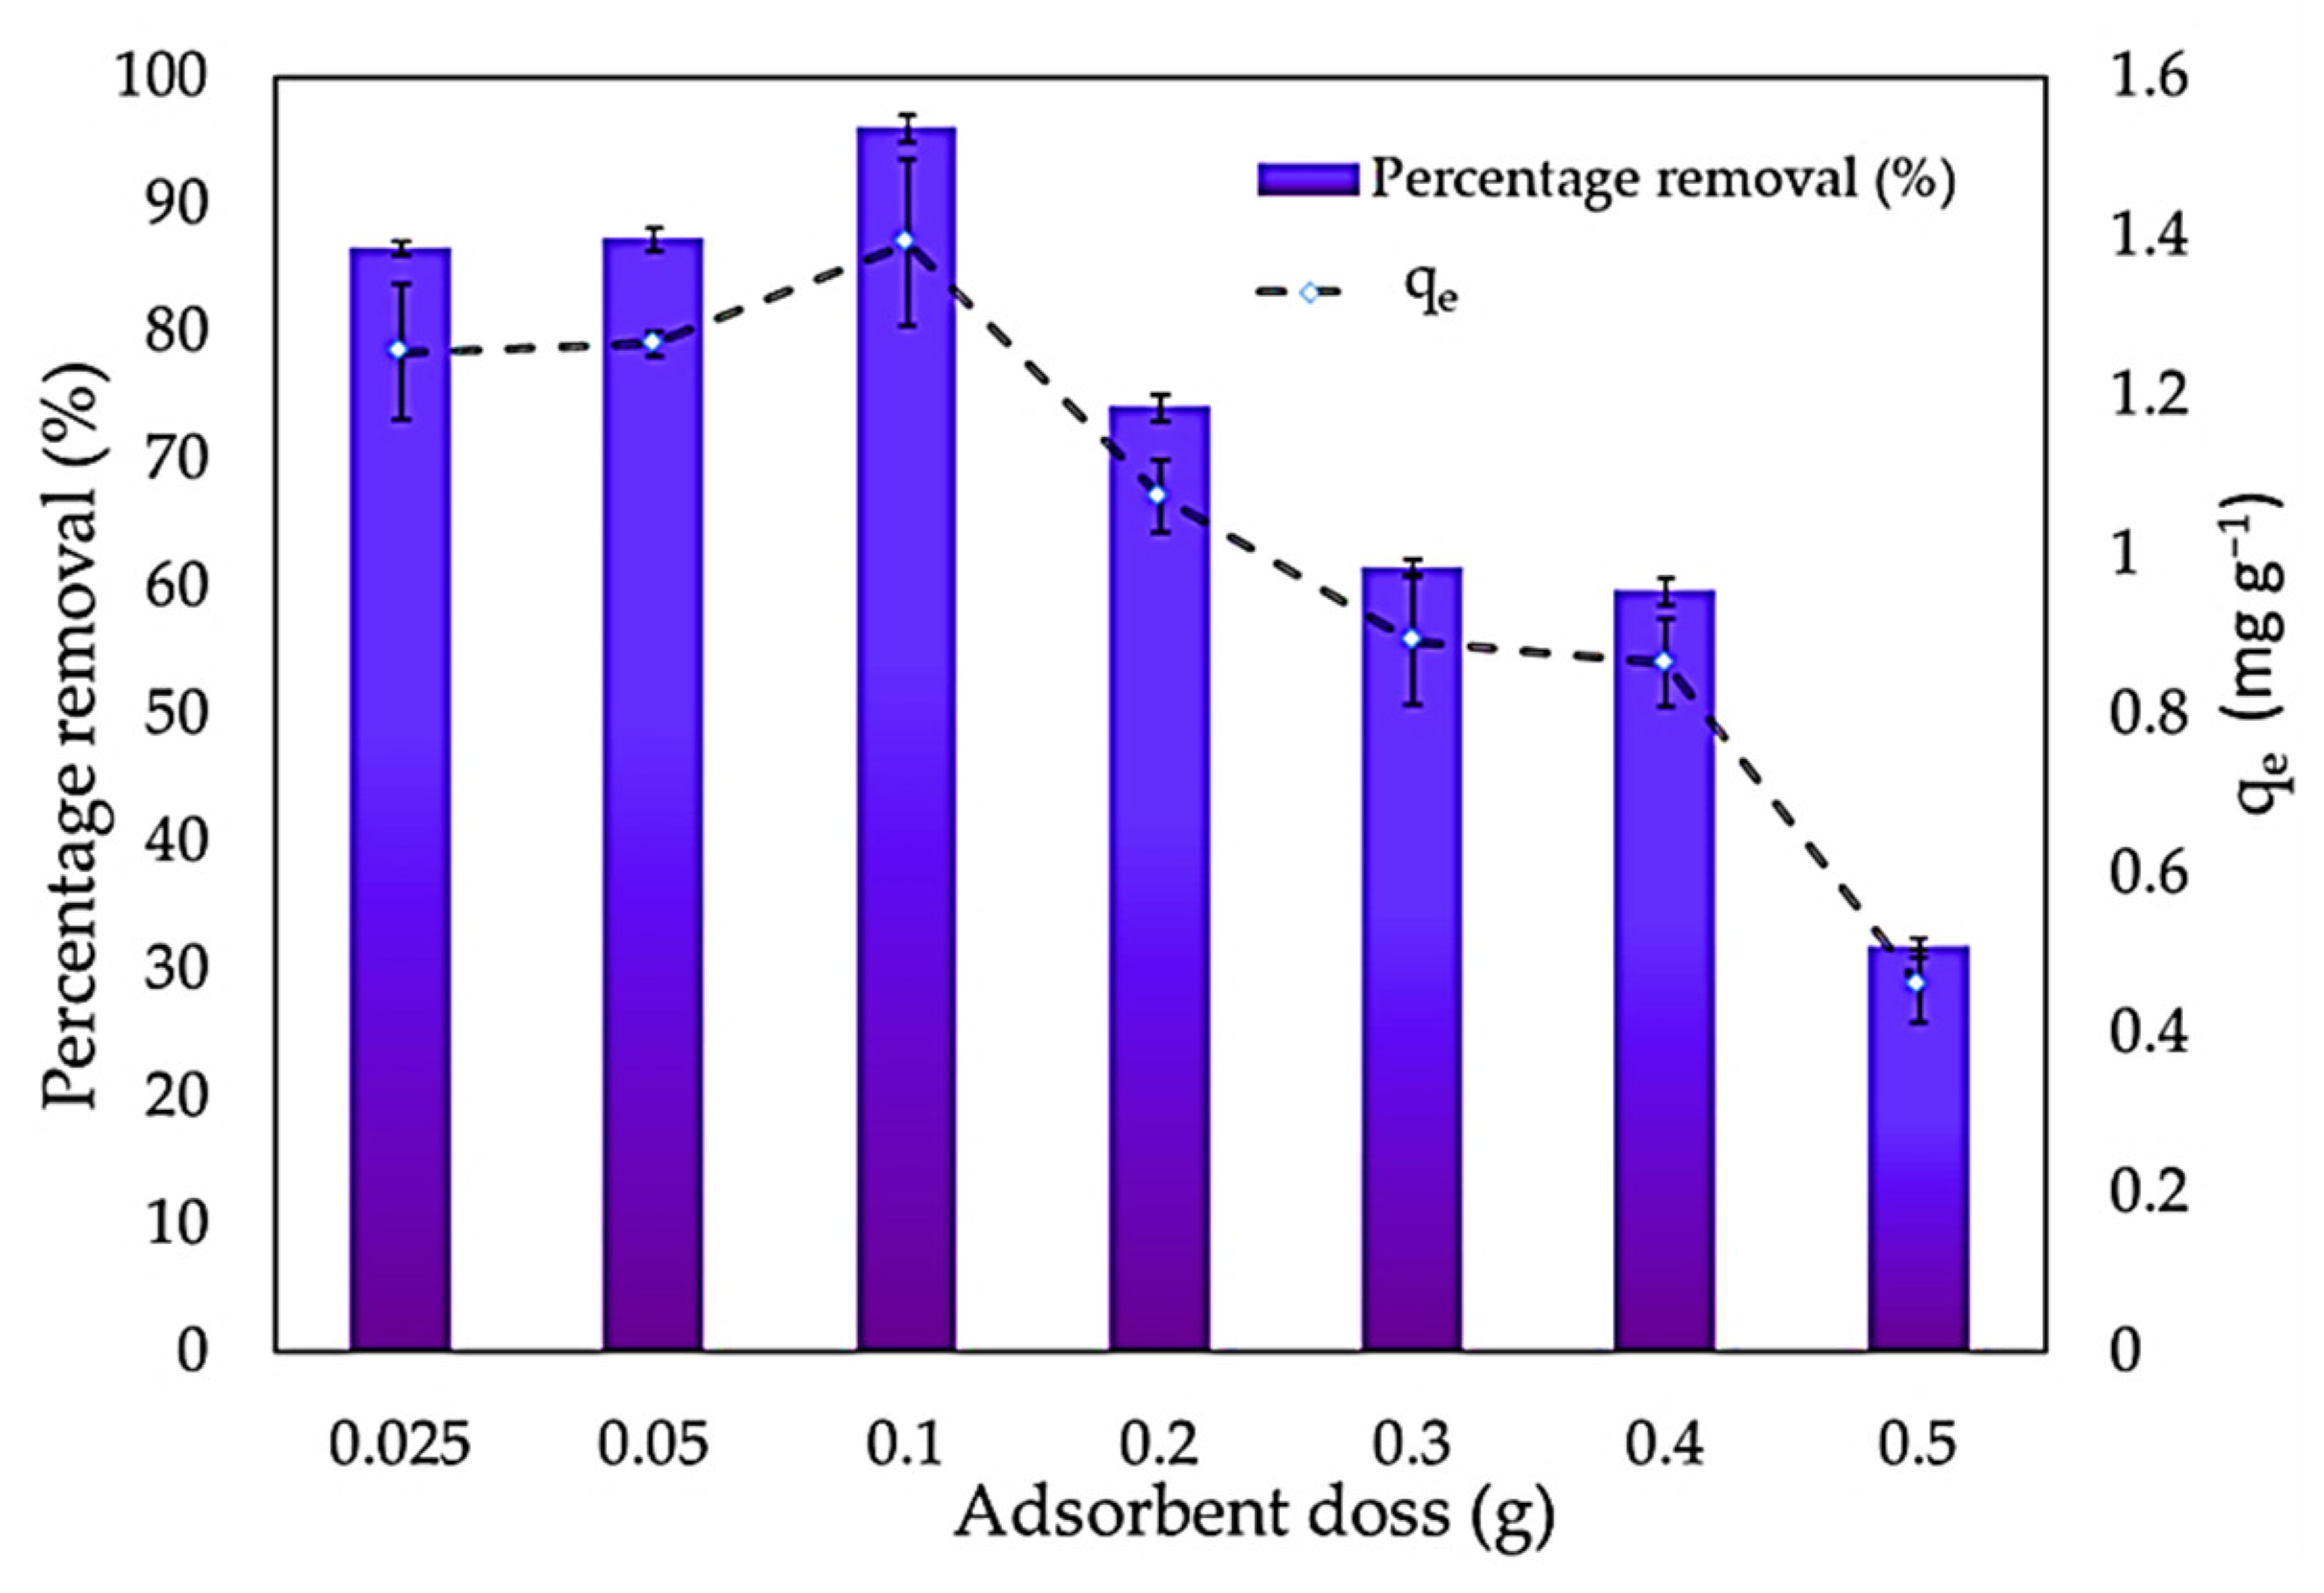
3.2.3. Sorbent Loading
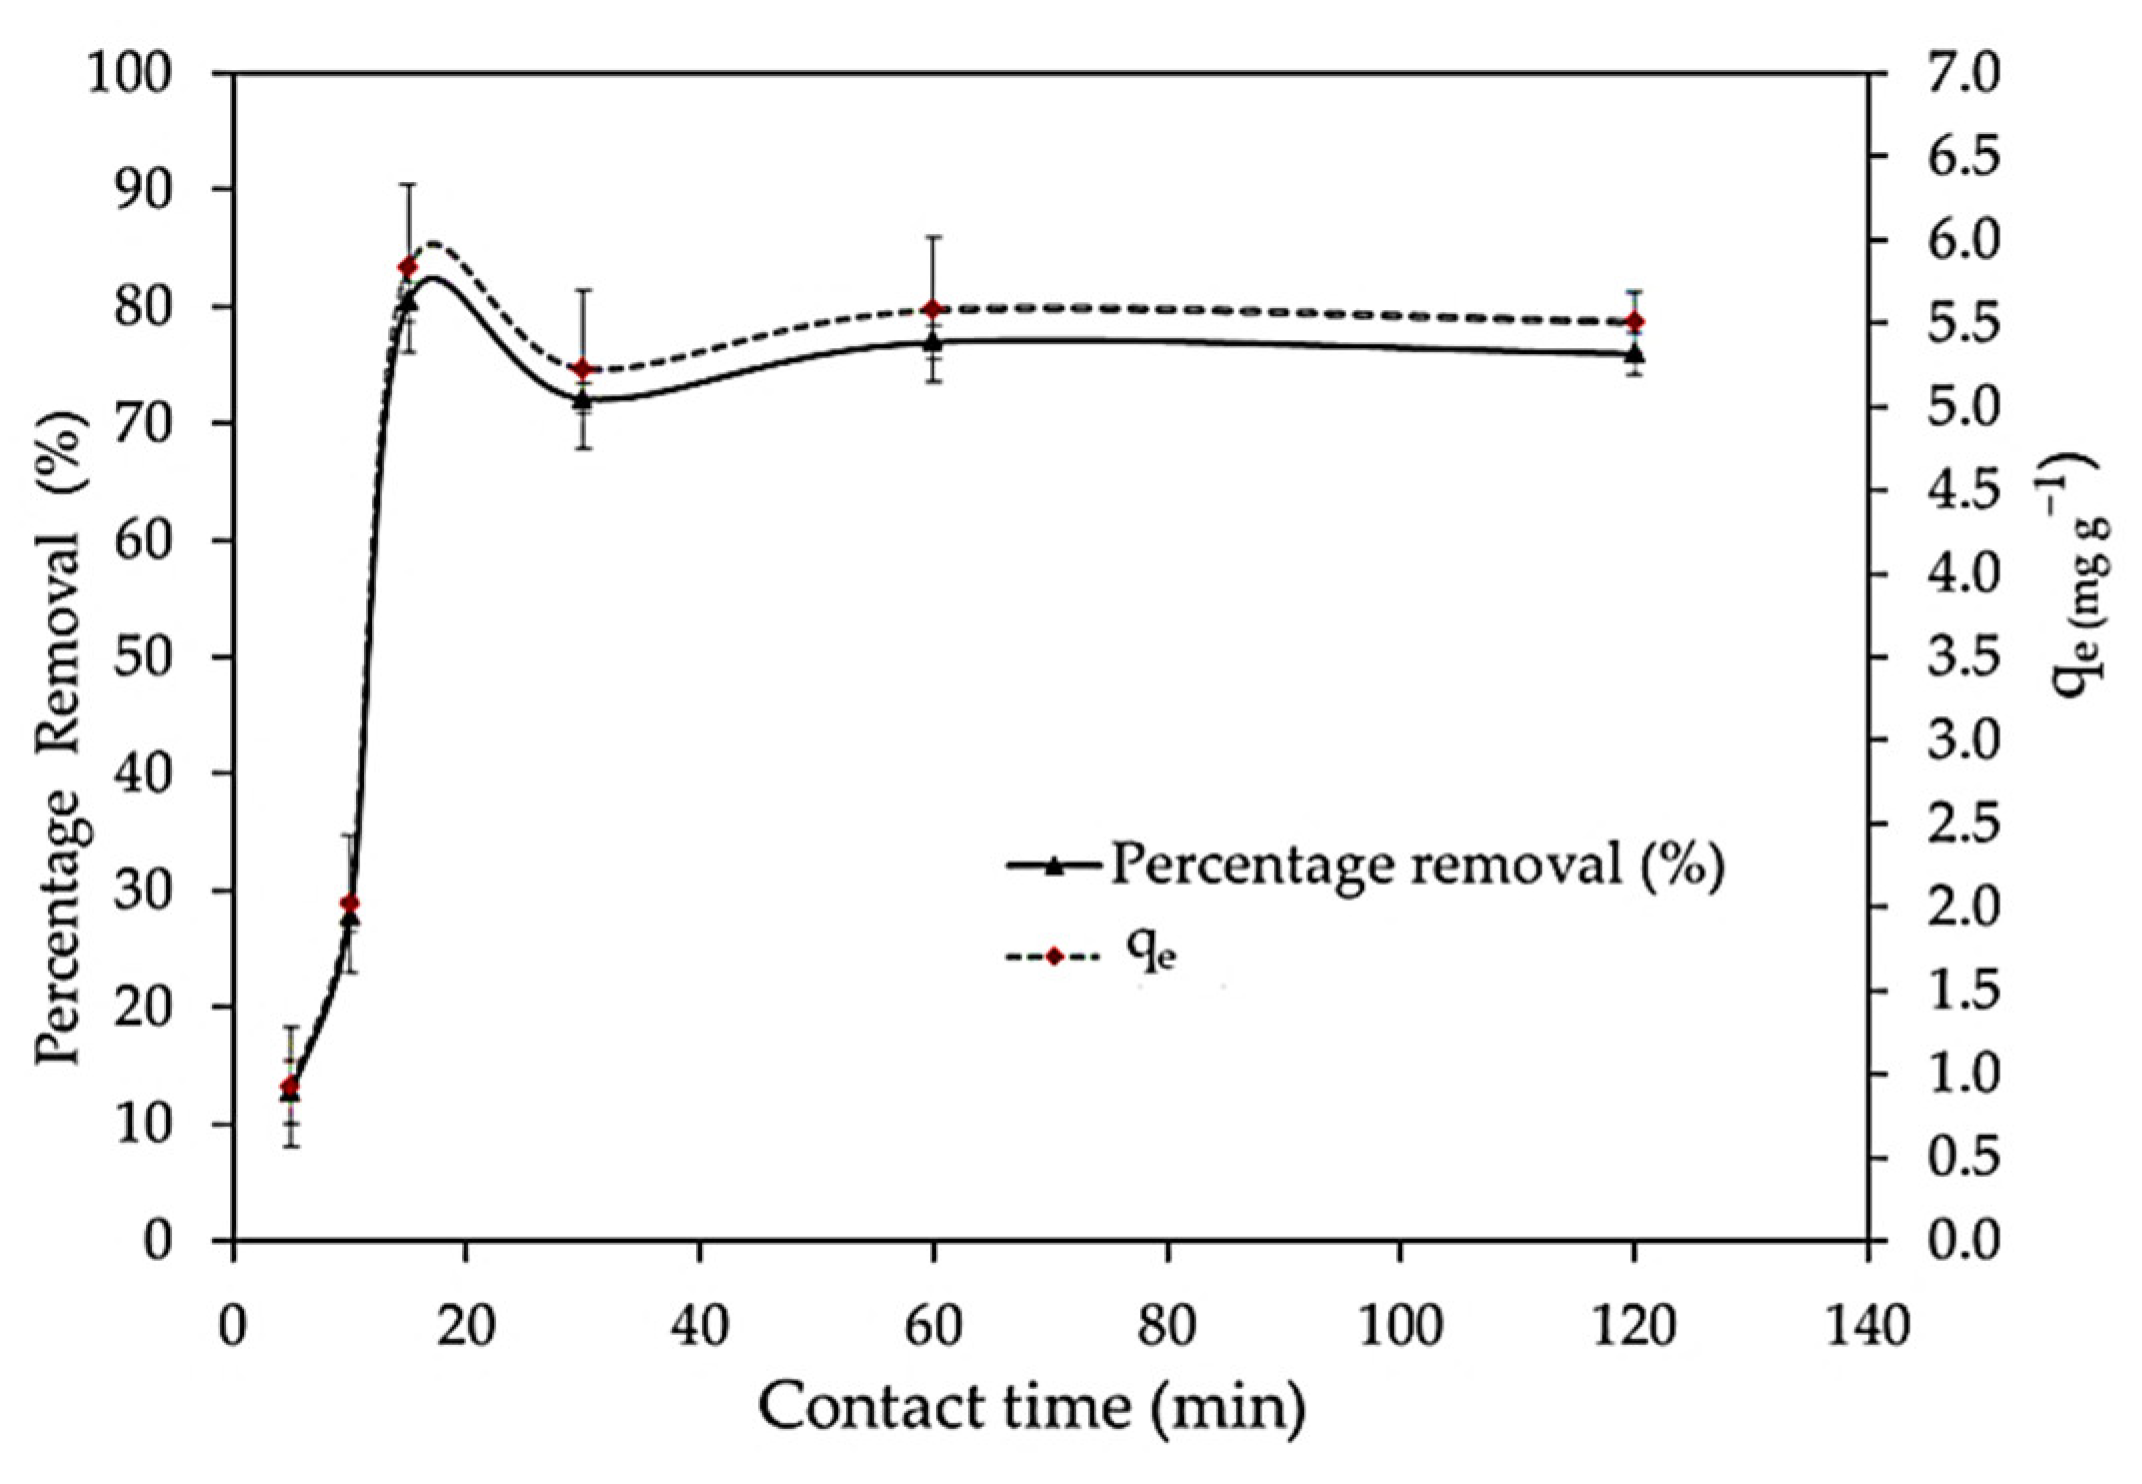
3.2.4. Contact Time
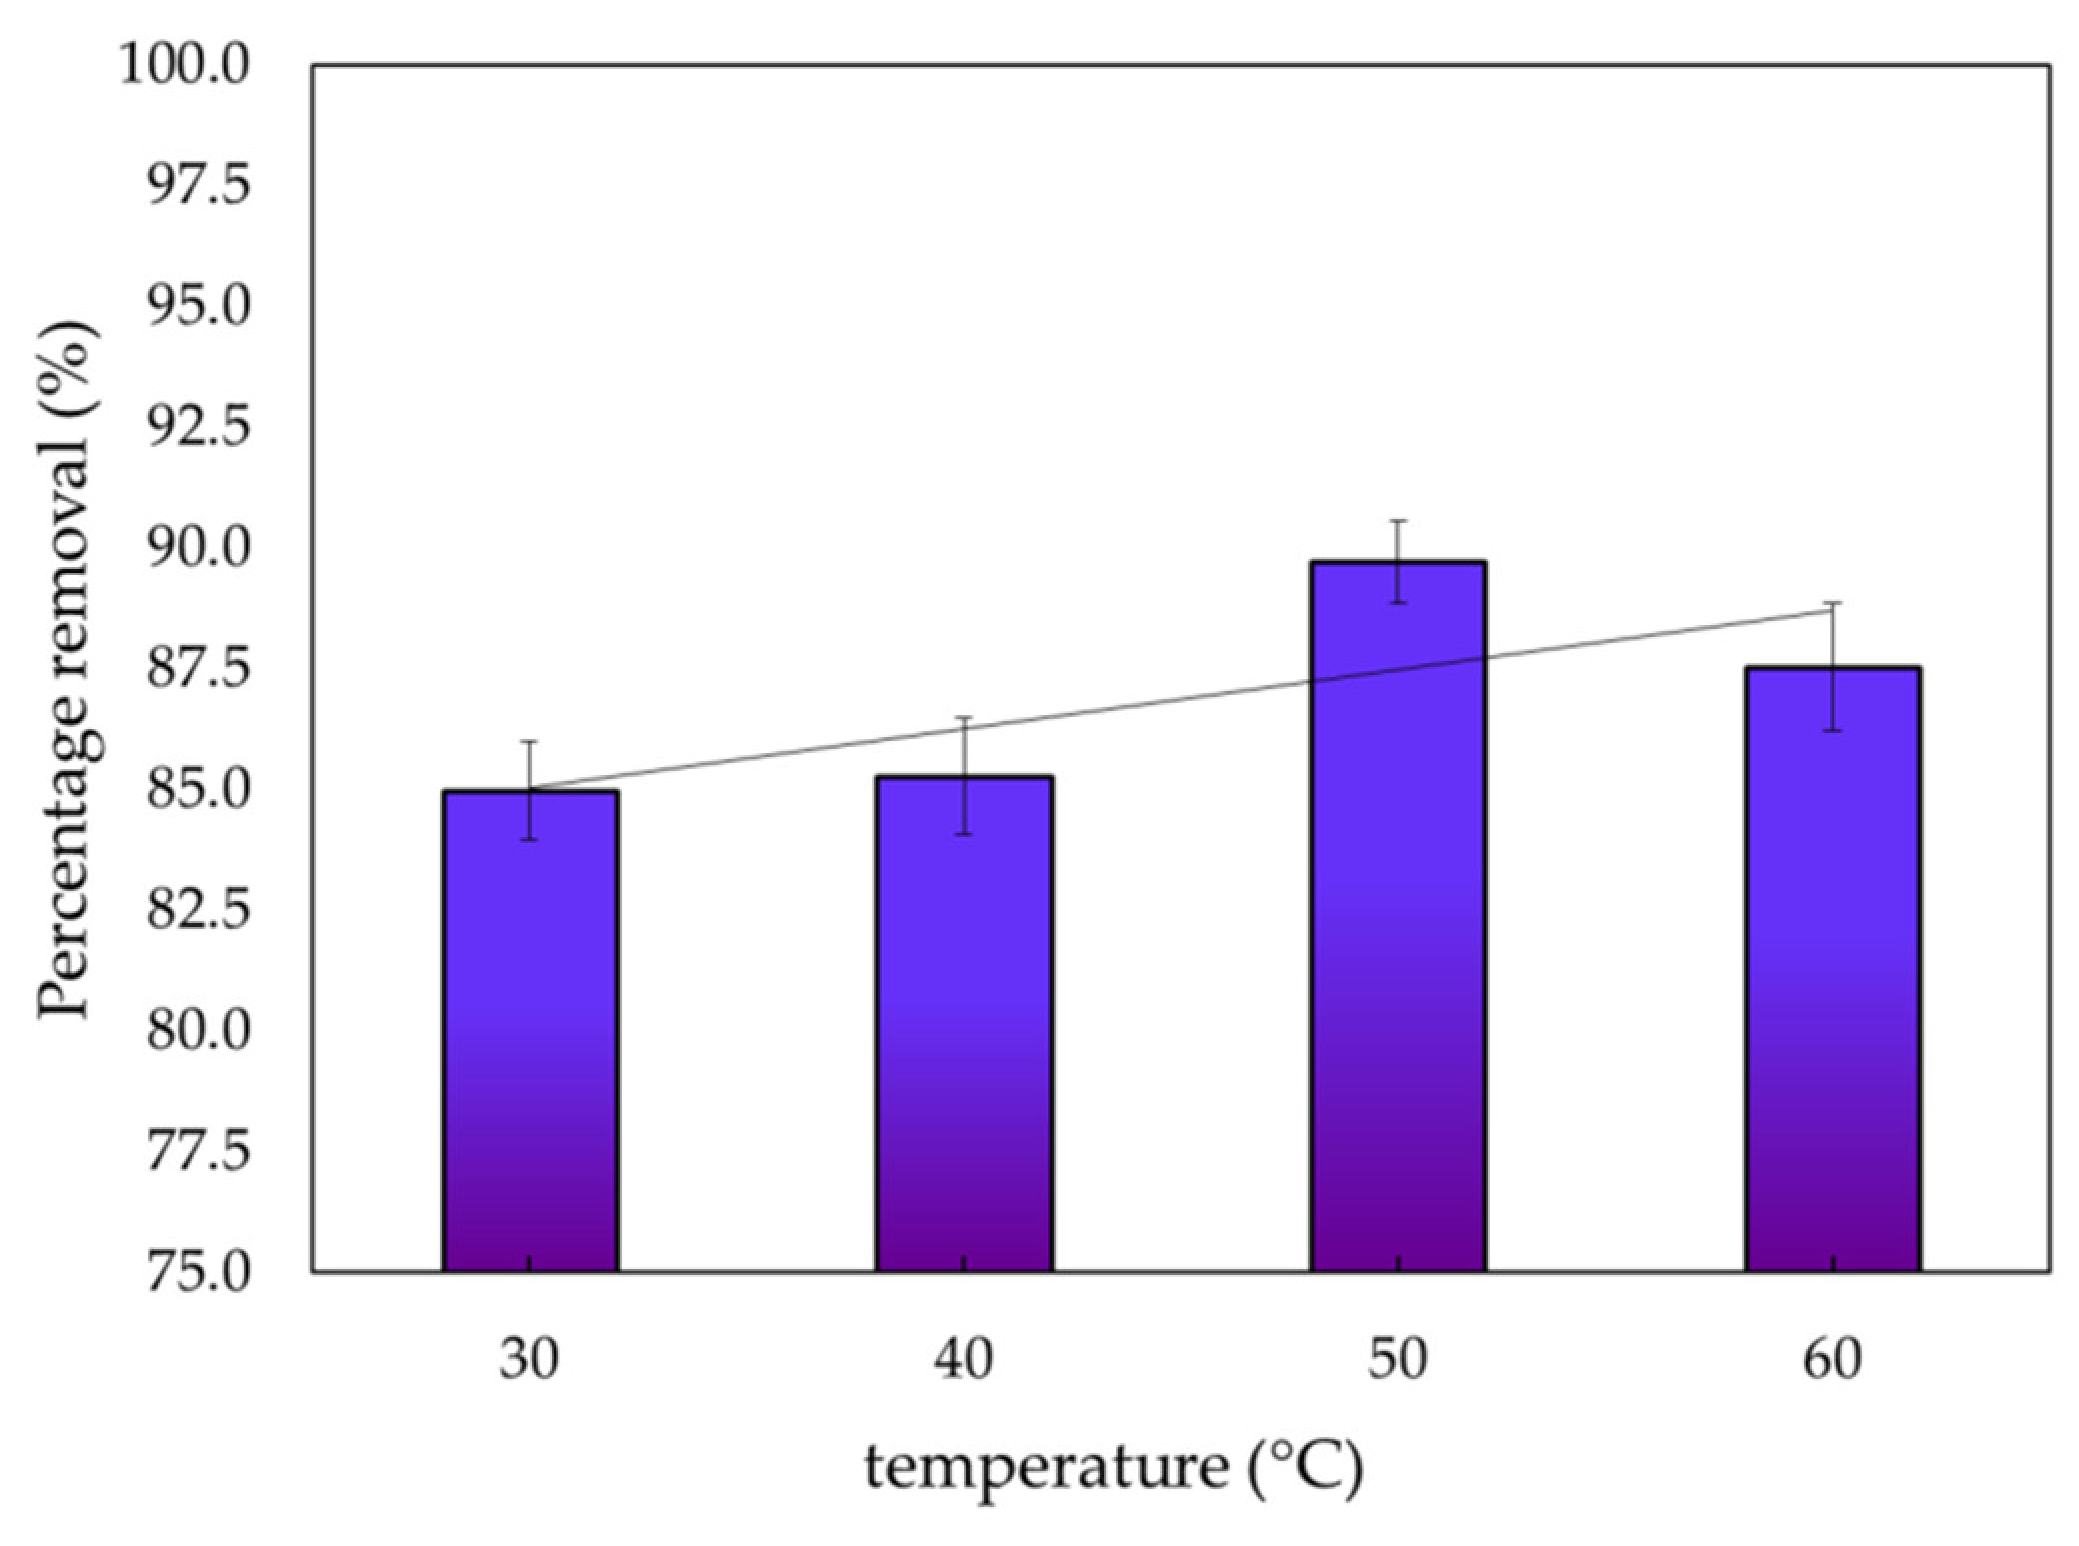
3.2.5. Temperature
3.3. Equilibrium Adsorption
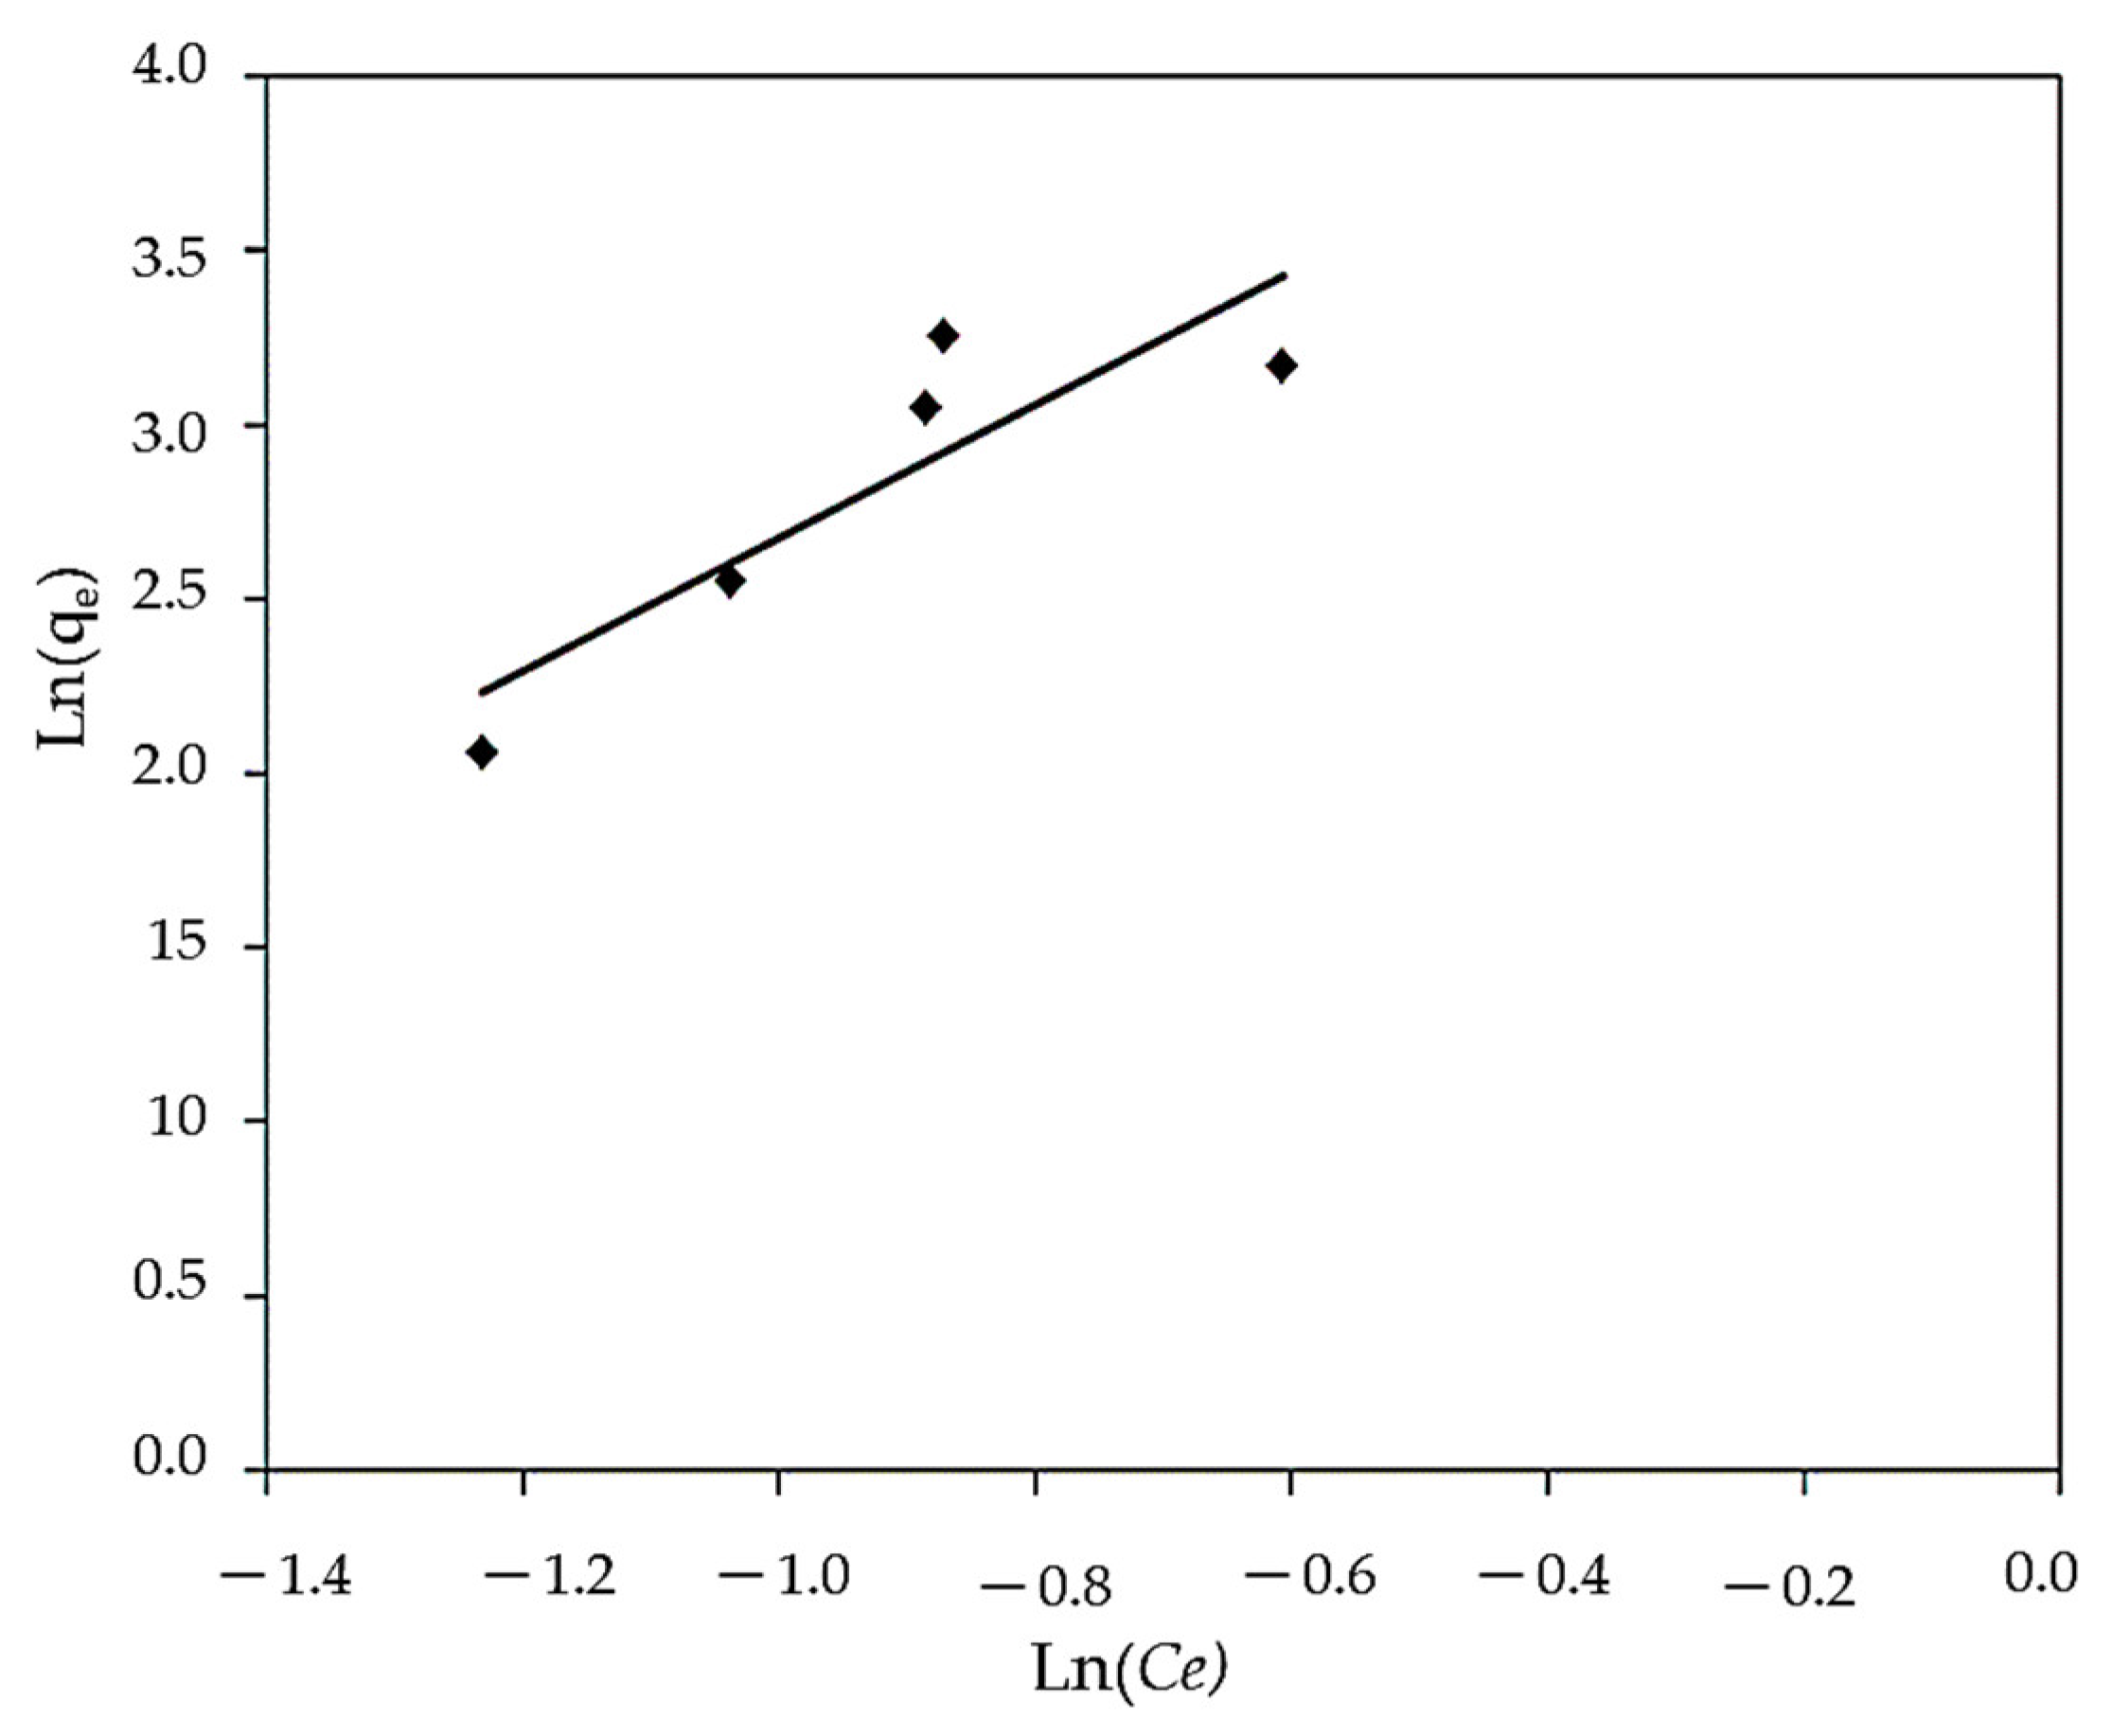
3.3.1. Freundlich Isotherm
3.3.2. Langmuir Isotherm
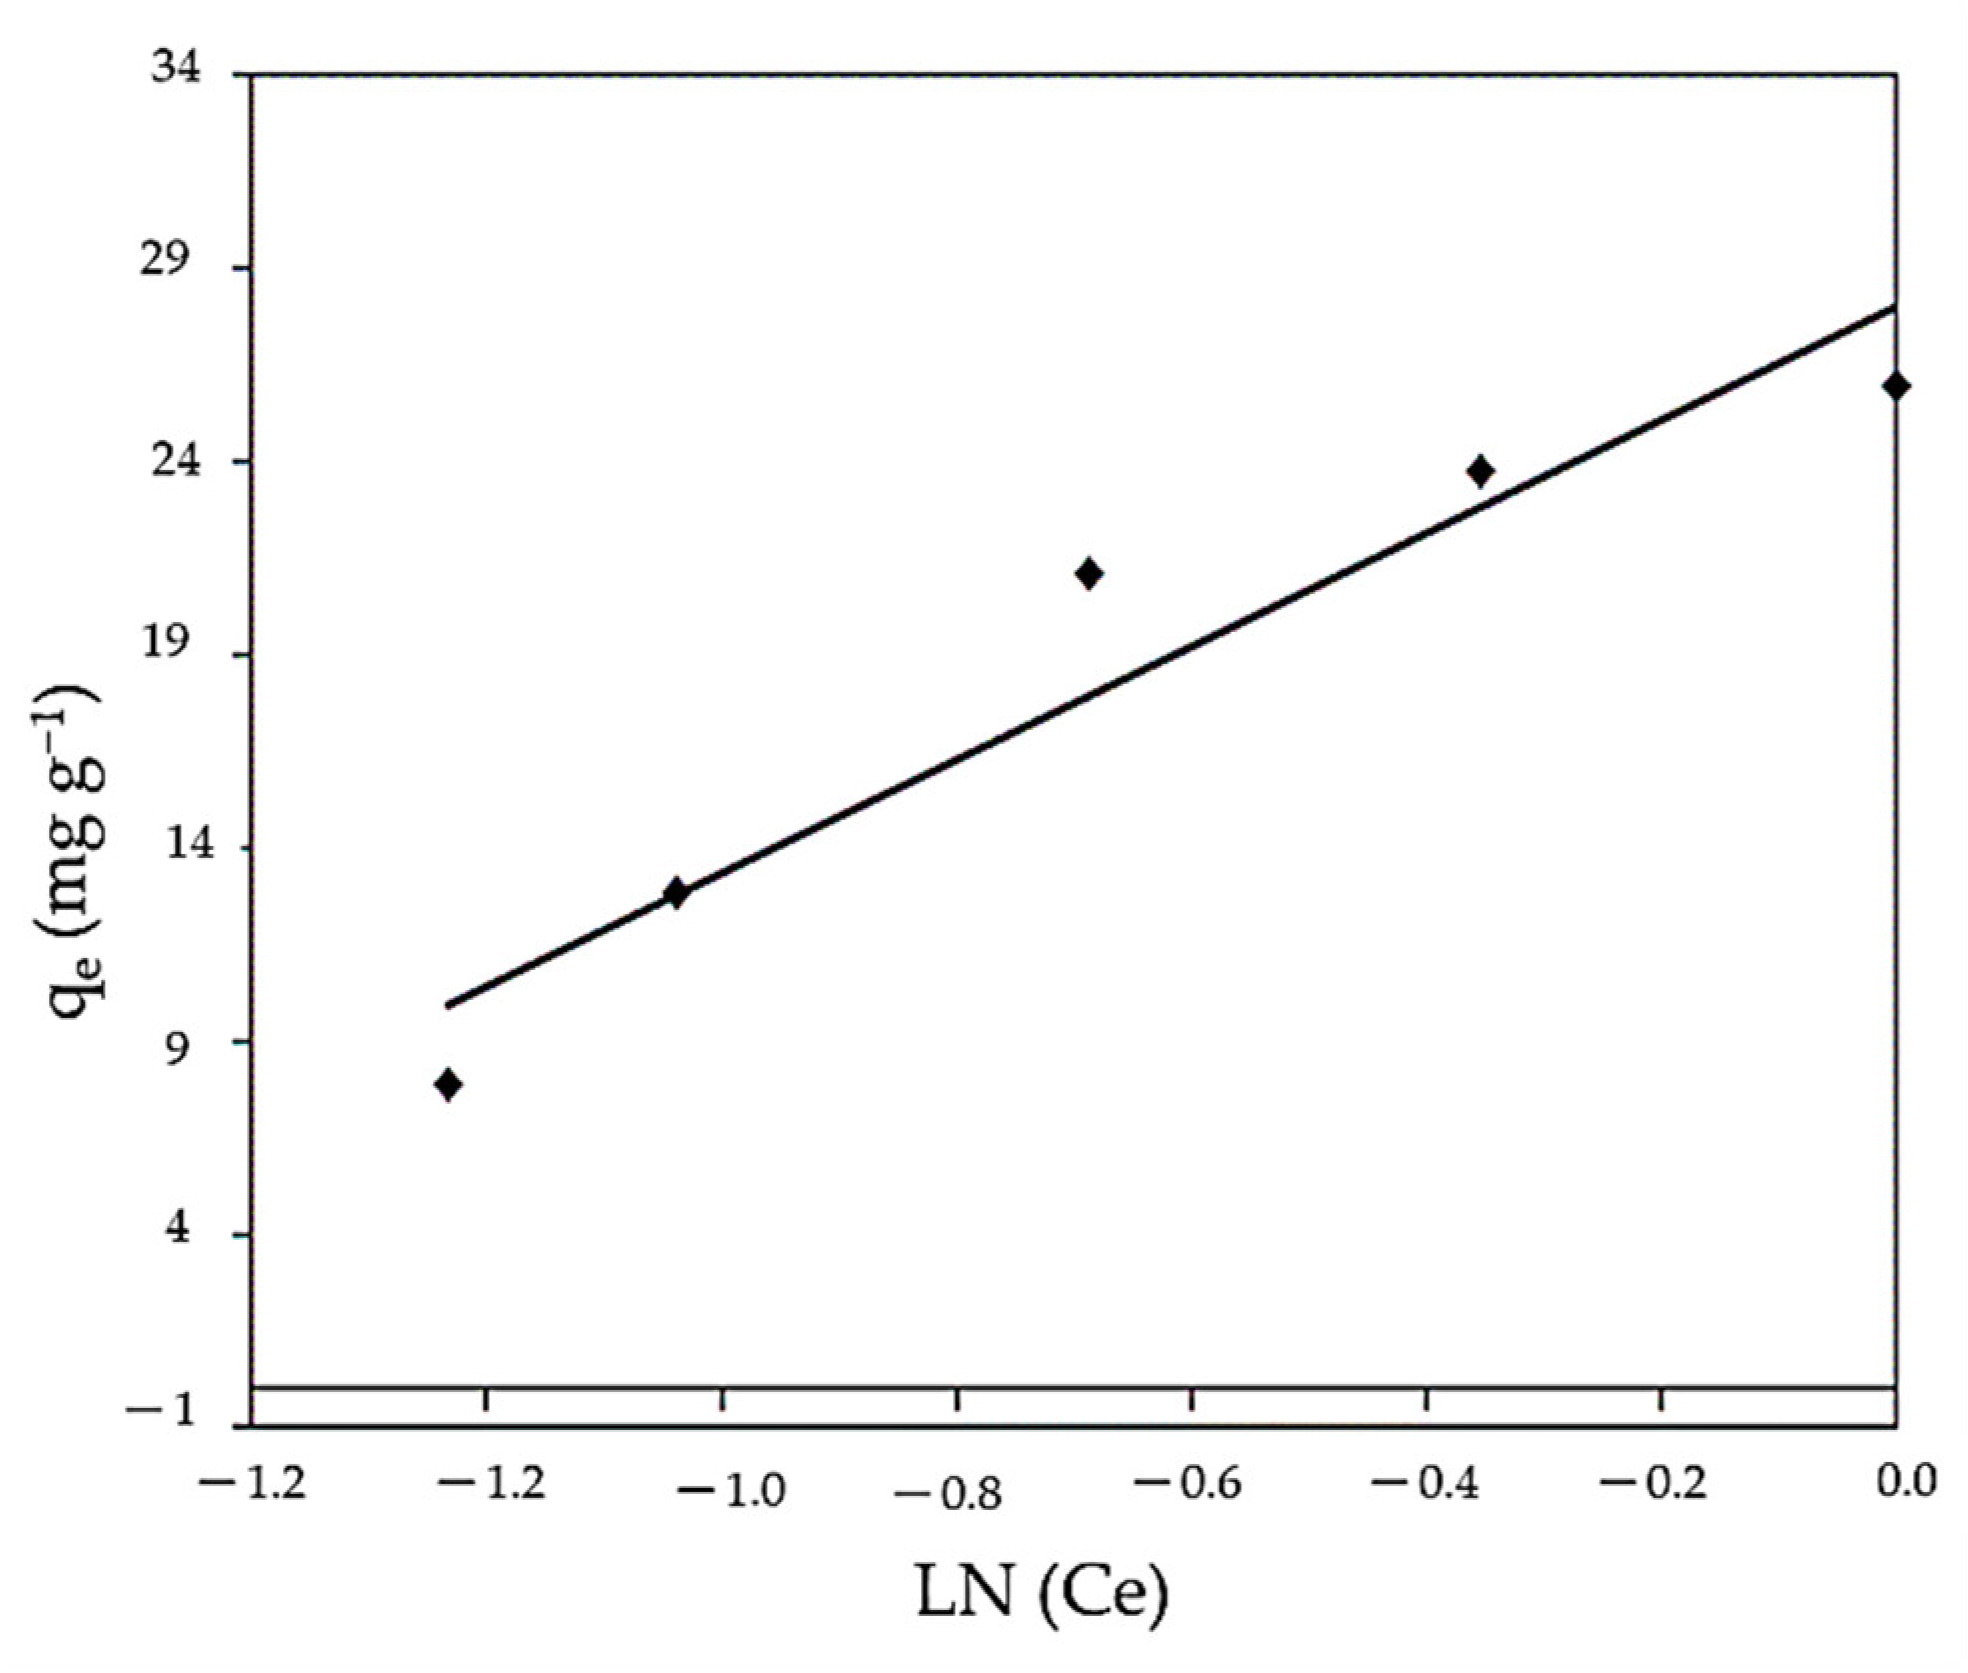
3.3.3. Tempkin Isotherm
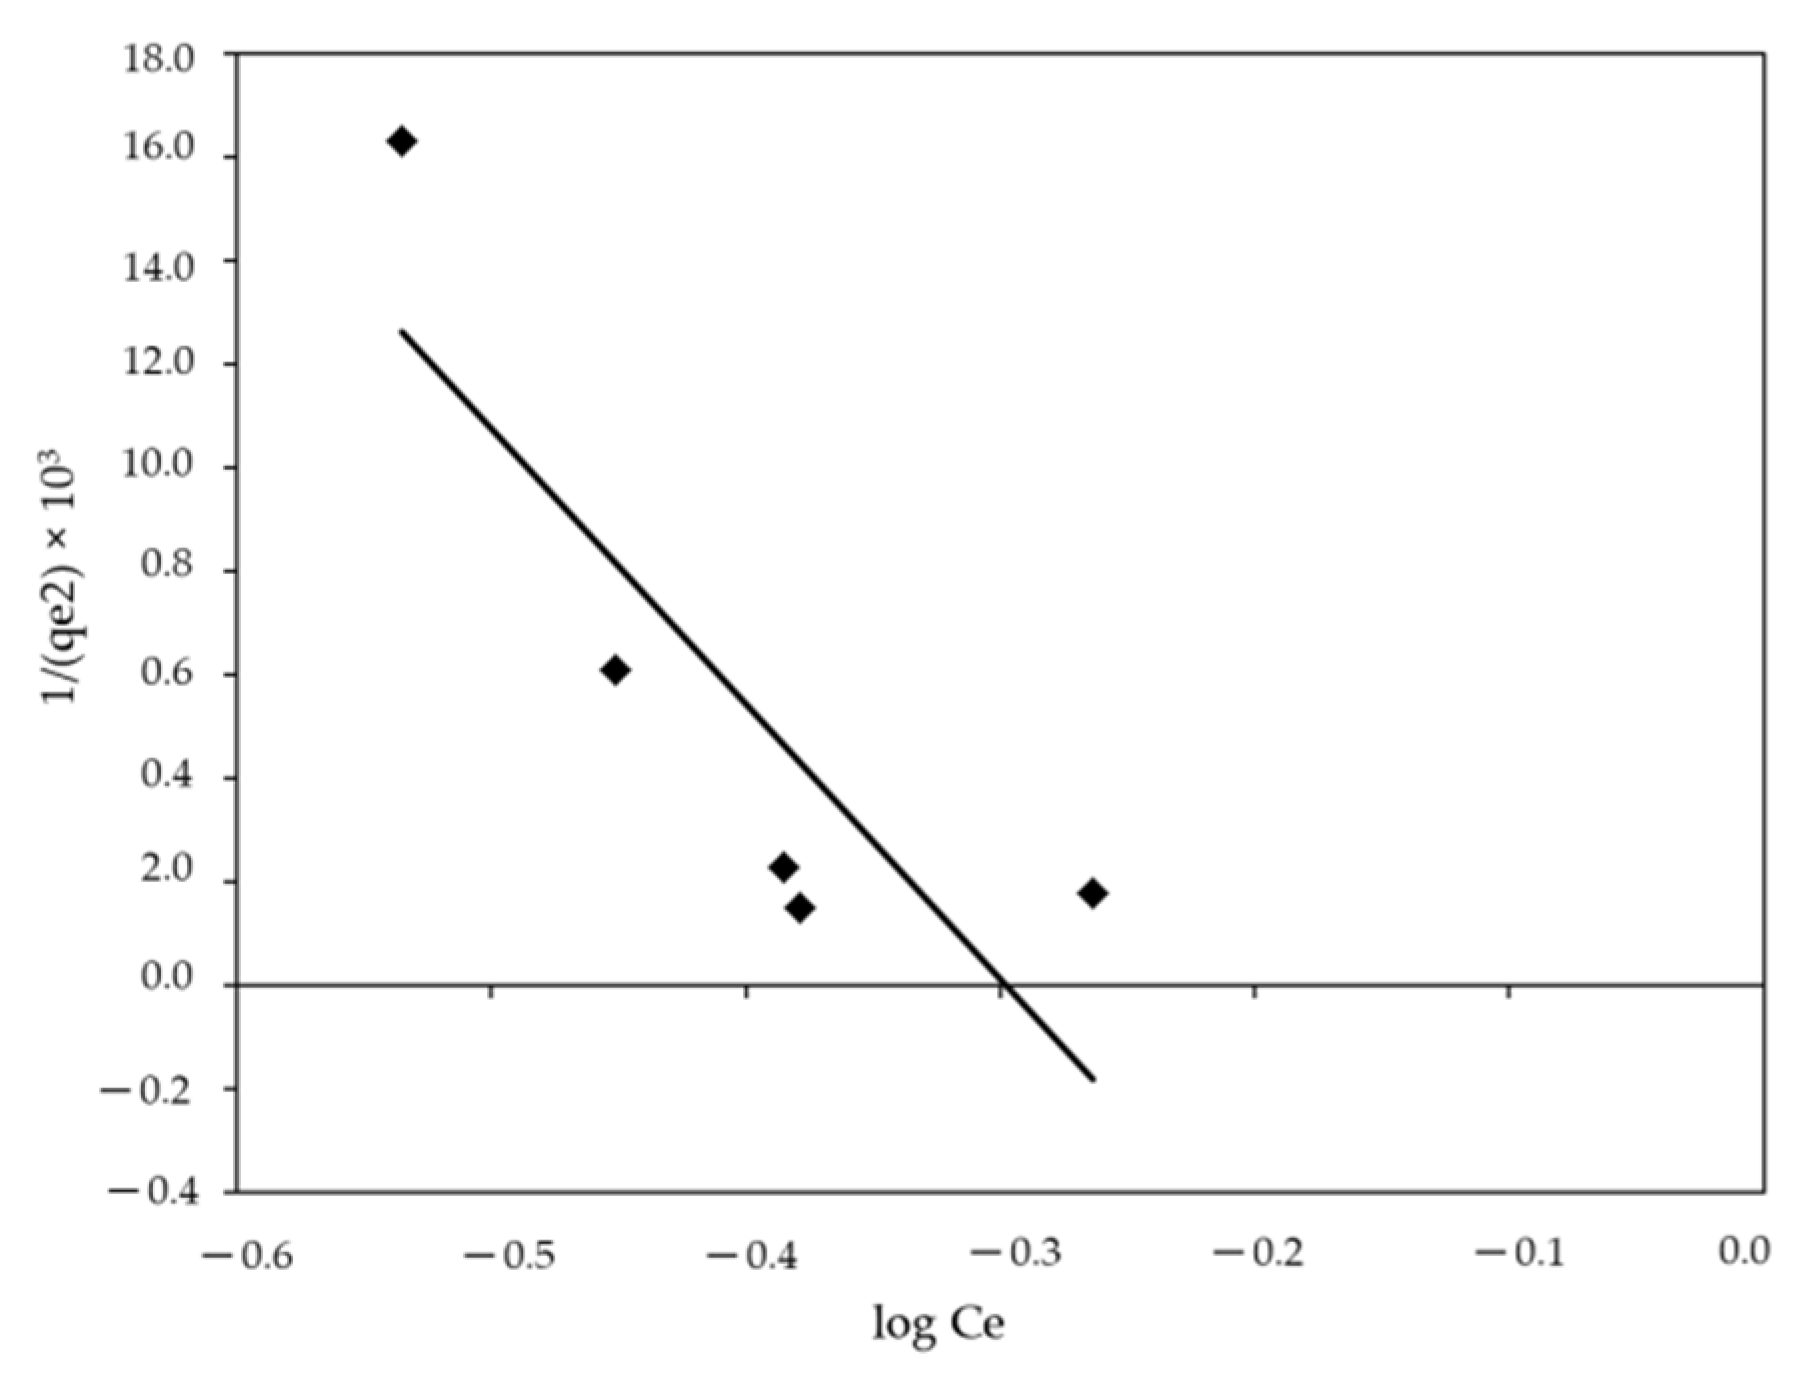
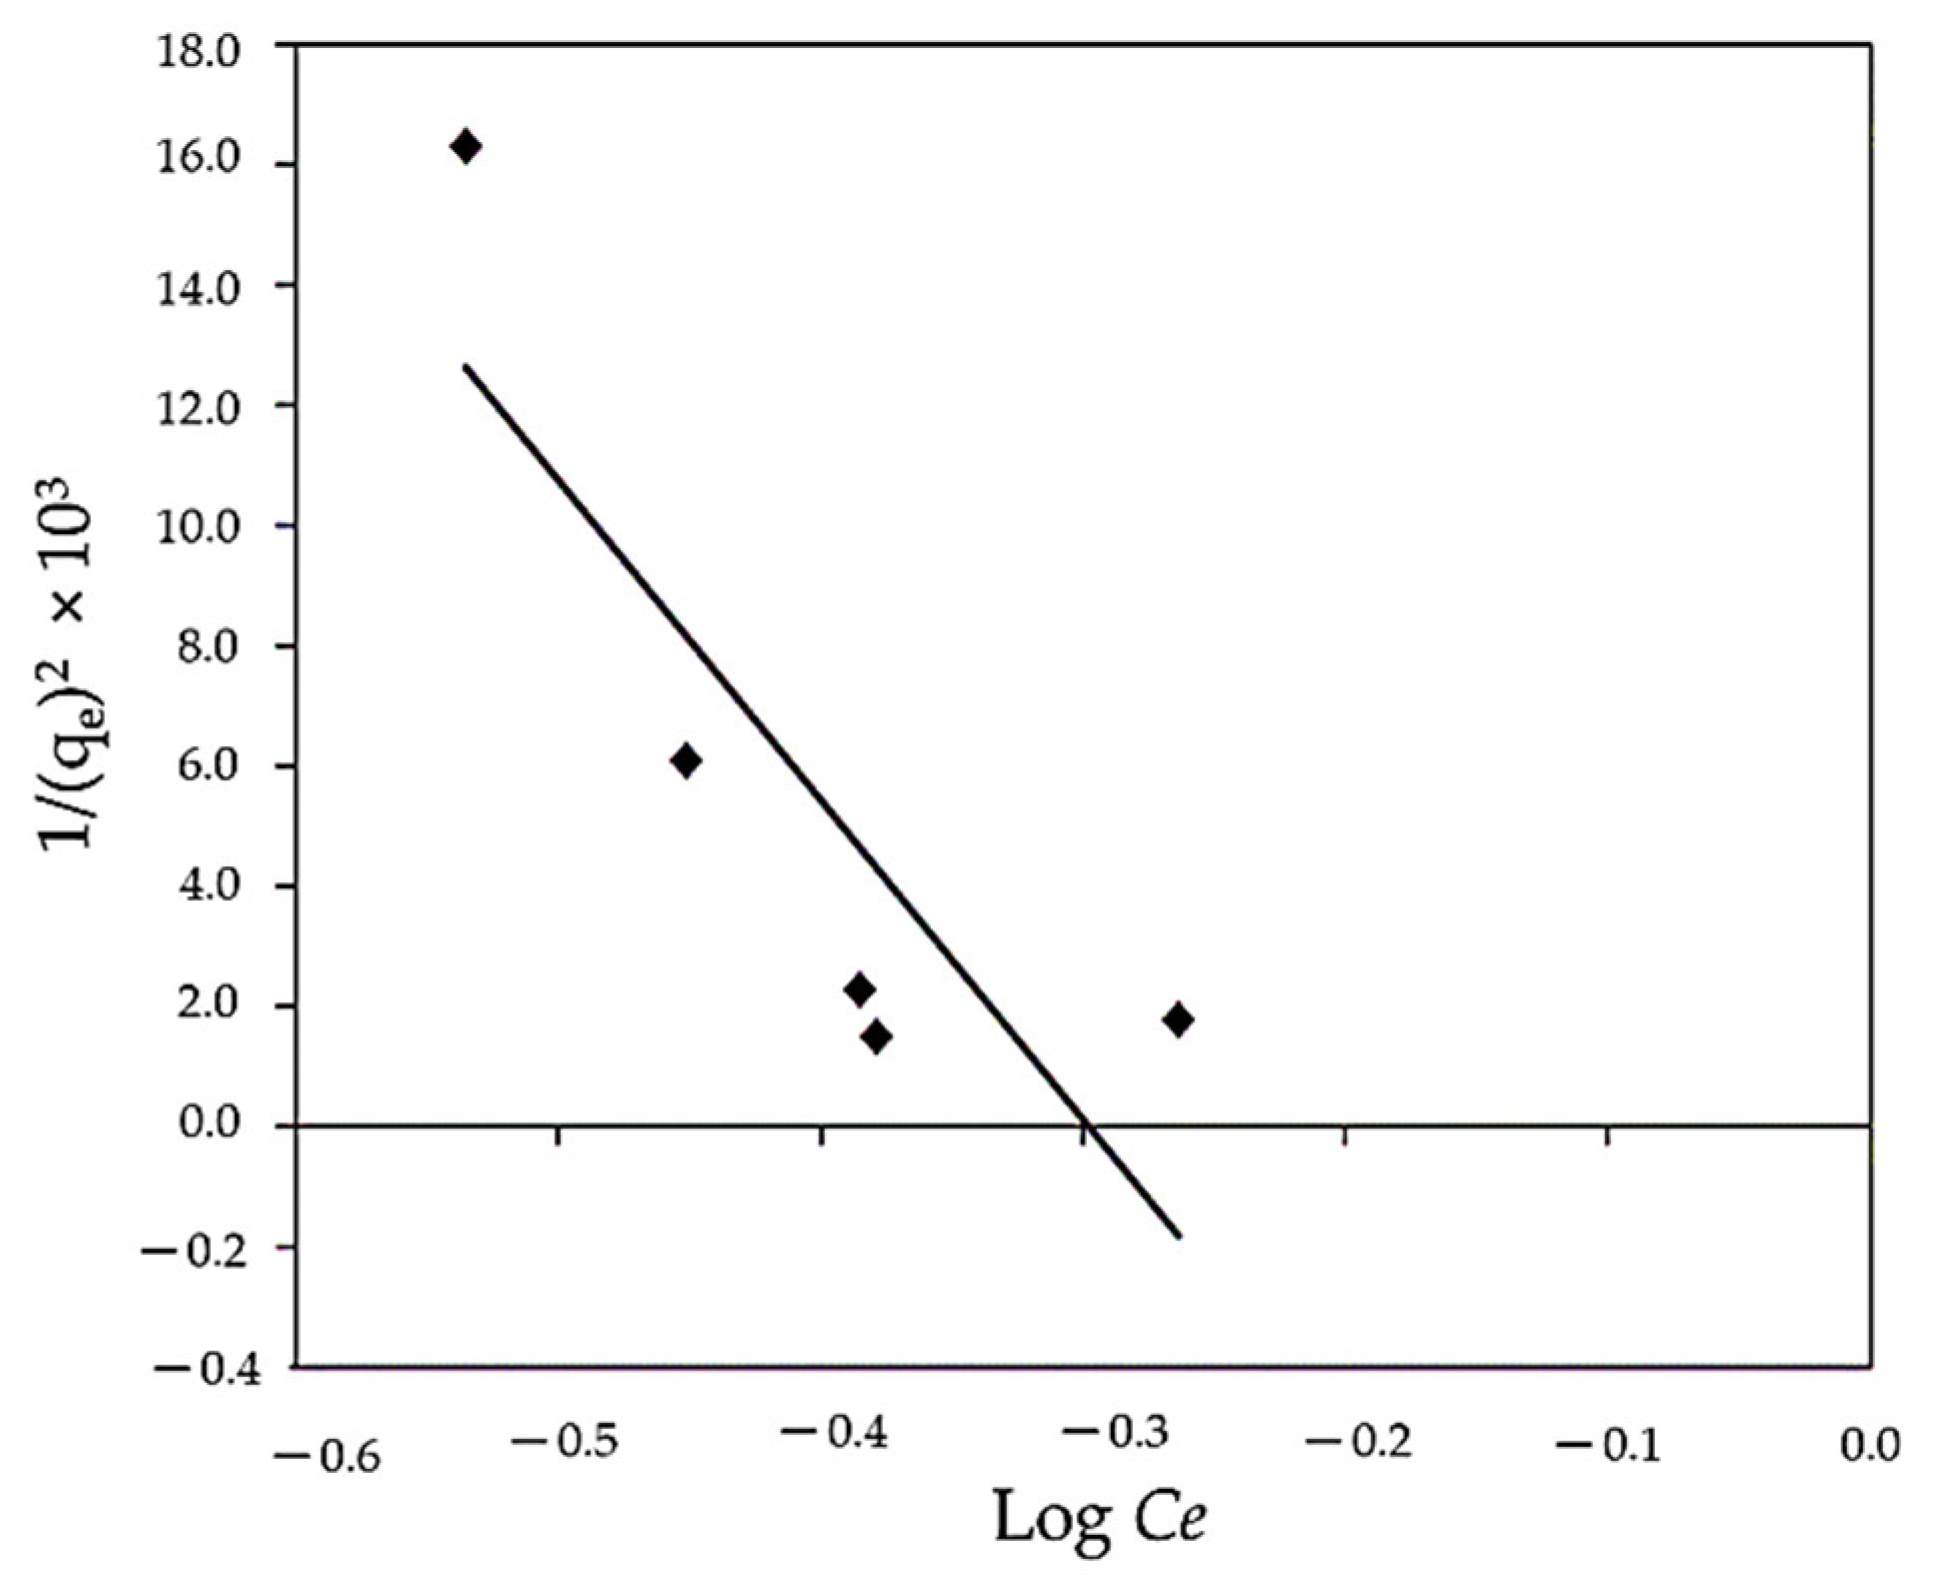
3.3.4. Harkins–Jura Isotherm
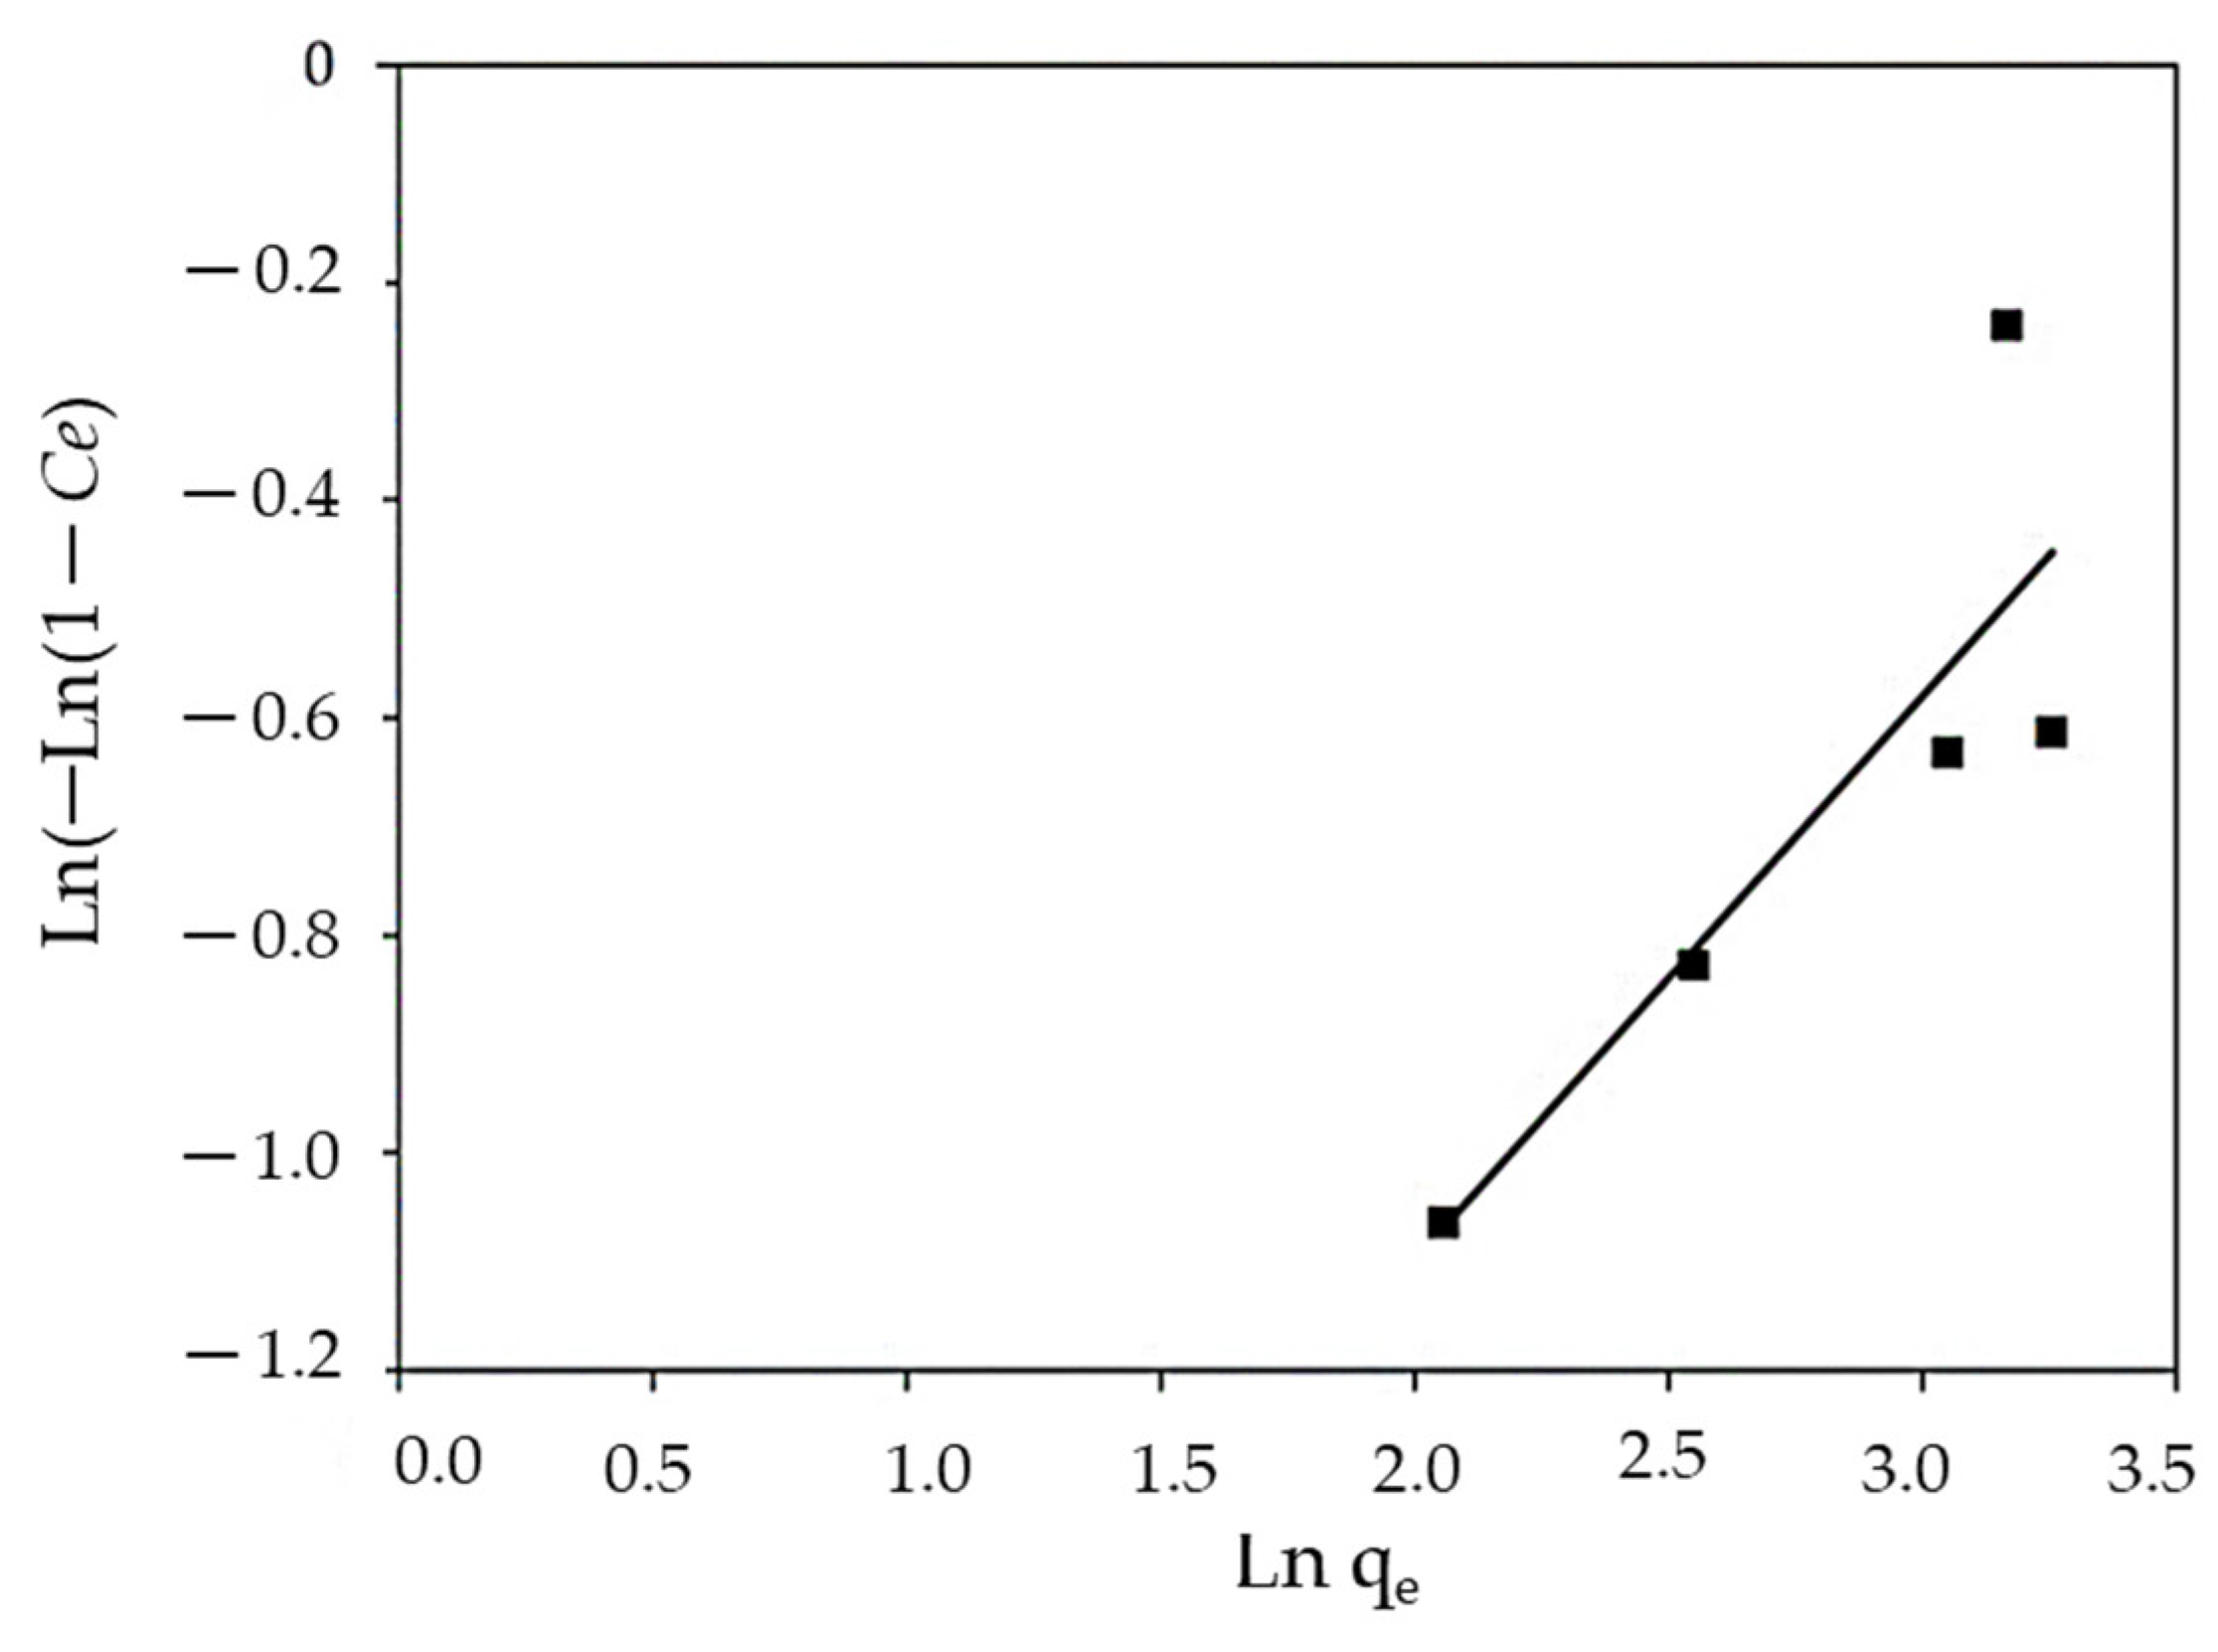
3.3.5. Halsey and Henderson Isotherm
3.3.6. Smith Isotherm
3.3.7. Error Functions Examination for Best-Appropriate Isotherm Model
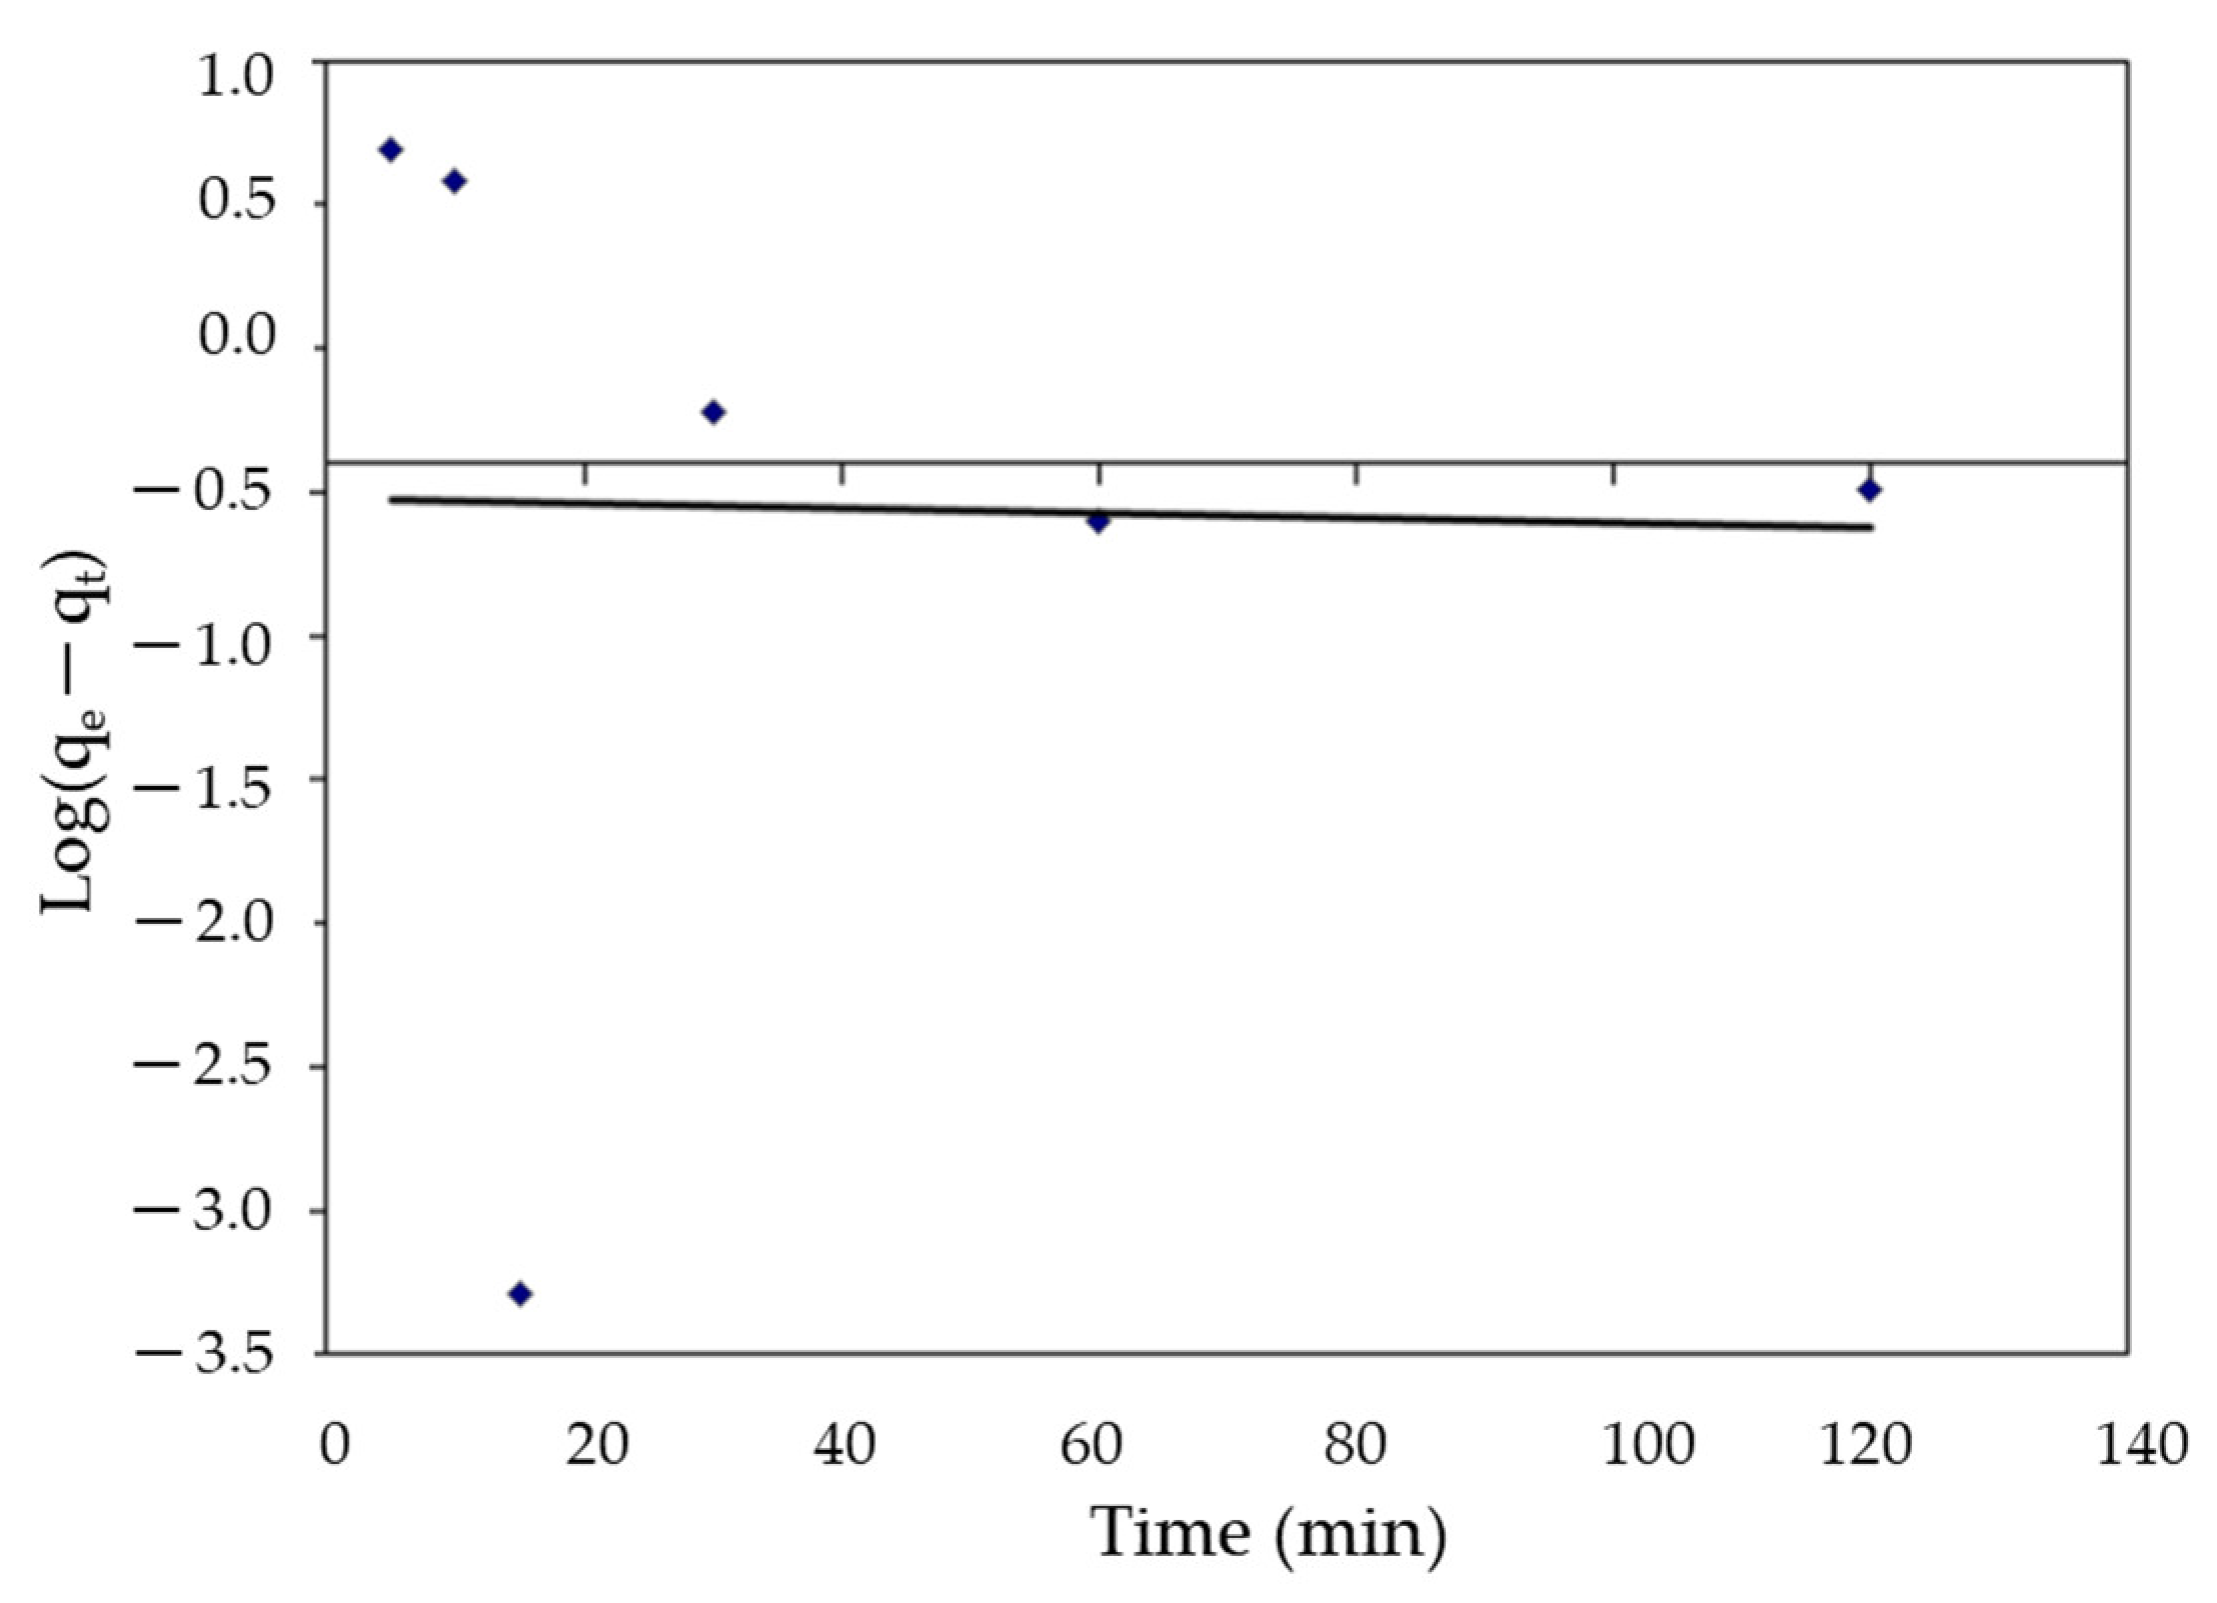
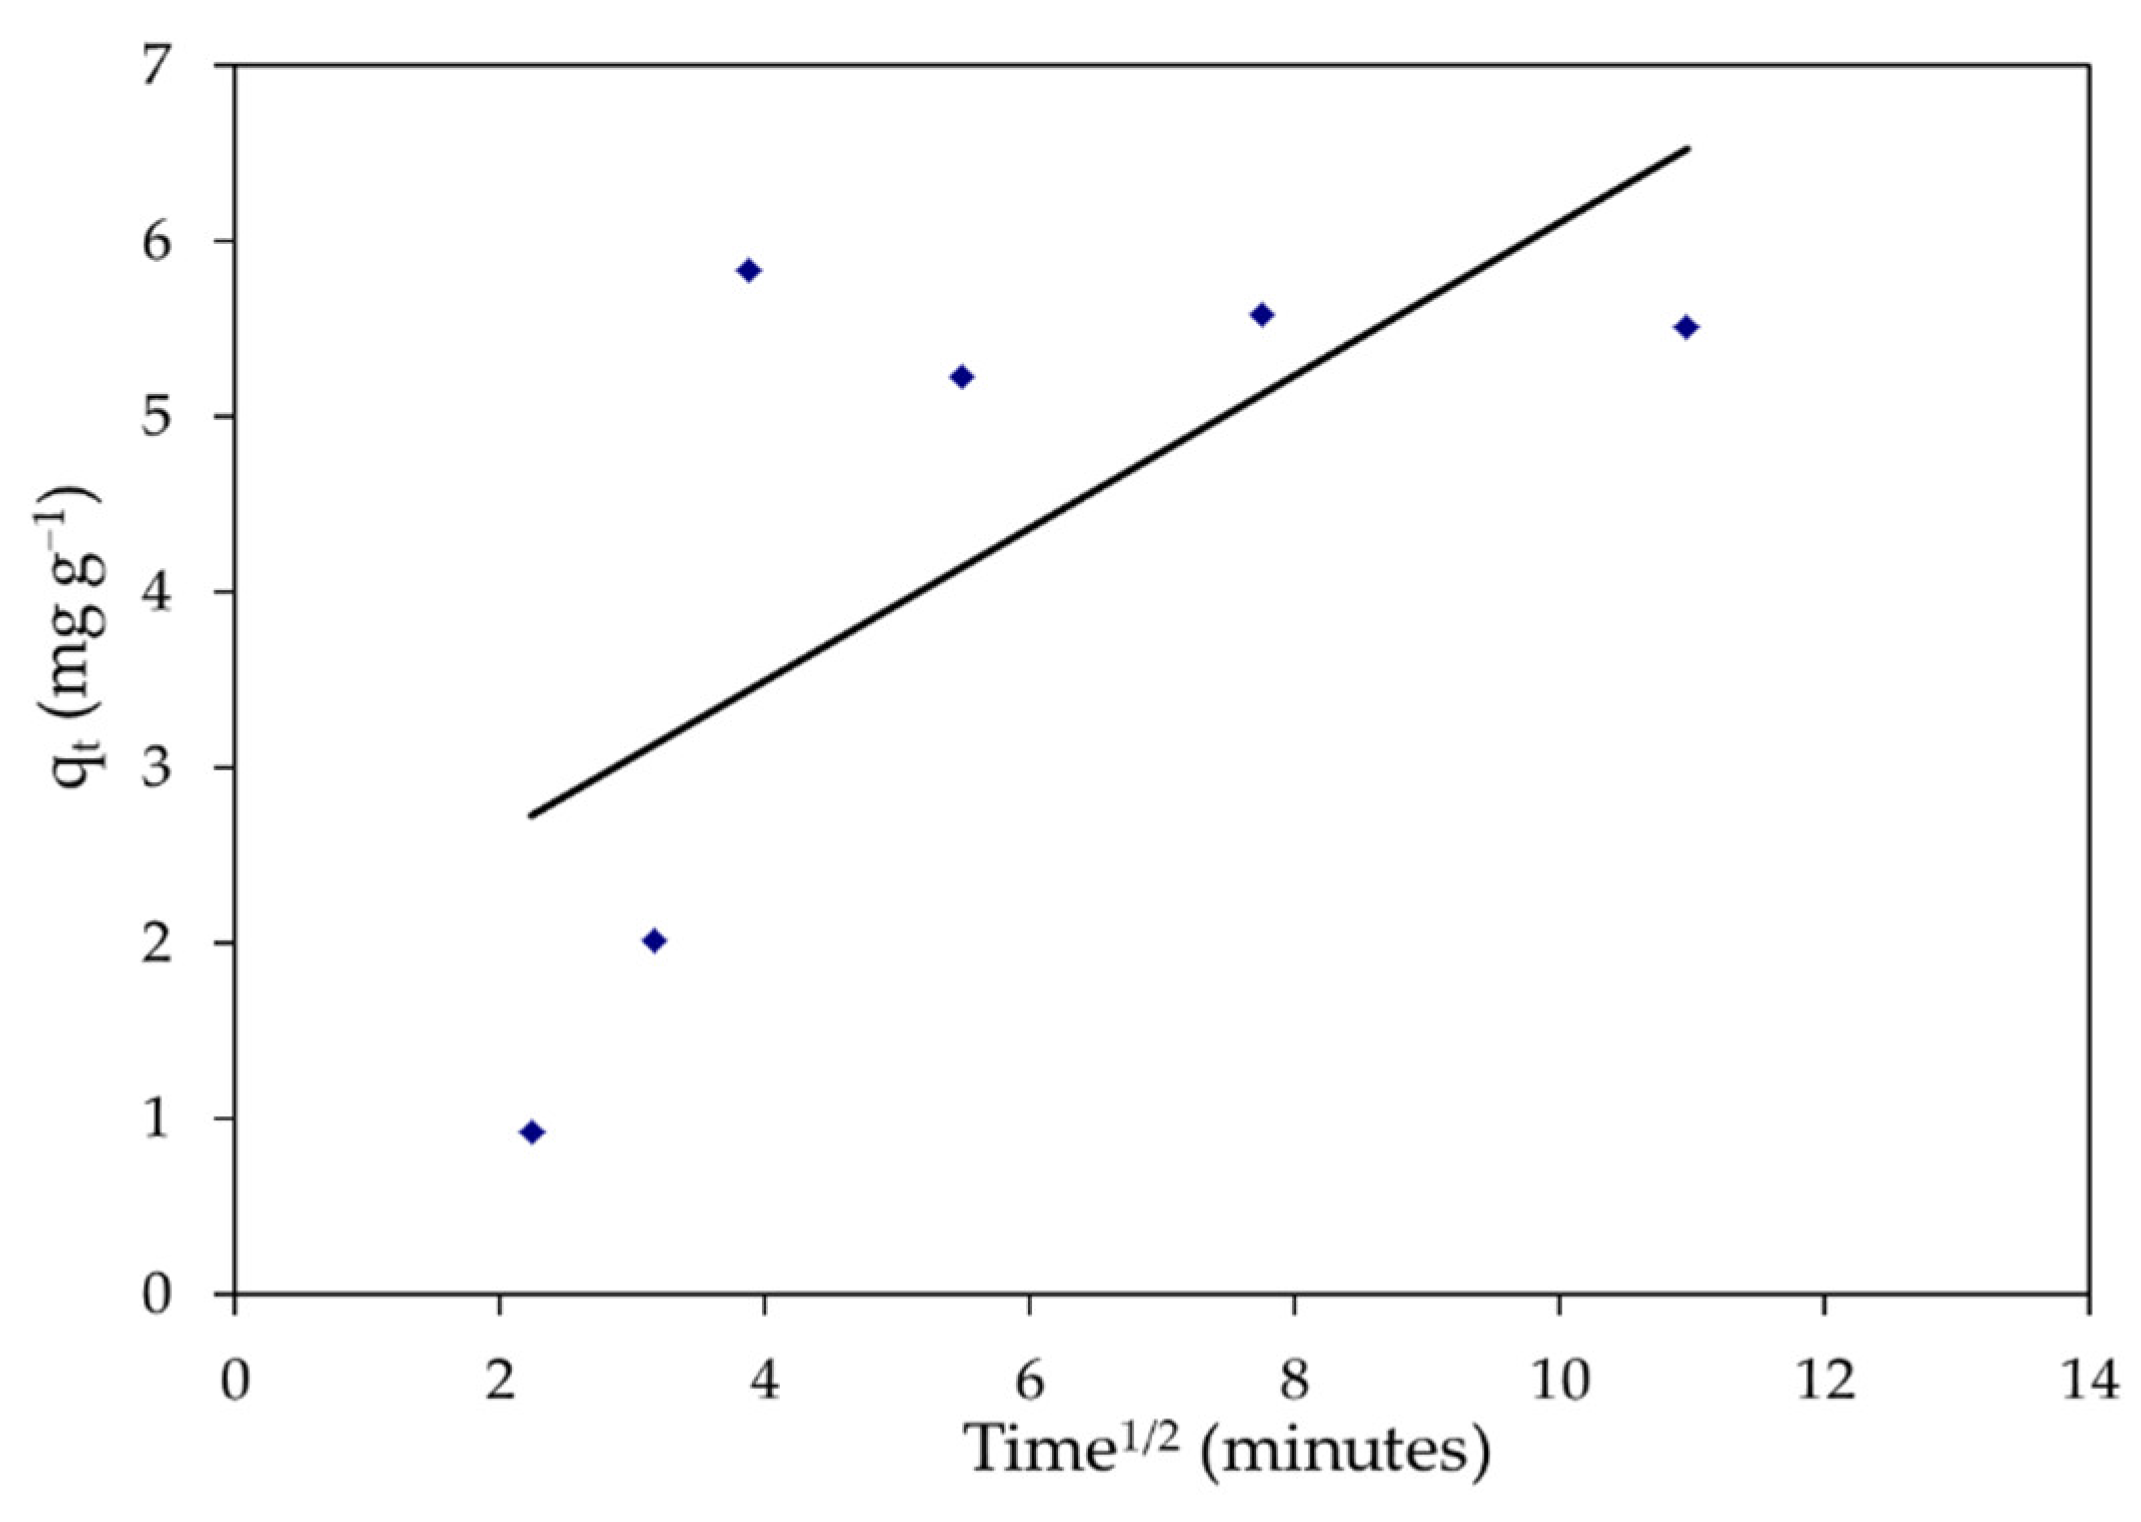
3.4. Kinetic Models
3.5. Thermodynamic Studies
3.6. Treatment of Real Dye Effluent
4. Conclusions
Author Contributions
Funding
Institutional Review Board Statement
Informed Consent Statement
Data Availability Statement
Acknowledgments
Conflicts of Interest
References
- Badawi, A.K.; Ismail, B.; Baaloudj, O.; Abdalla, K.Z. Advanced wastewater treatment process using algal photo-bioreactor associated with dissolved-air flotation system: A pilot-scale demonstration. J. Water Process Eng 2022, 46, 102565. [Google Scholar] [CrossRef]
- Abualnaja, K.M.; Alprol, A.E.; Abu-Saied, M.A.; Mansour, A.T.; Ashour, M. Studying the Adsorptive Behavior of Poly(Acrylonitrile-co-Styrene) and Carbon Nanotubes (Nanocomposites) Impregnated with Adsorbent Materials towards Methyl Orange Dye. Nanomaterials 2021, 11, 1144. [Google Scholar] [CrossRef] [PubMed]
- Al-Ghouti, M.A.; Al-Degs, Y.S.; Khraisheh, M.A.; Ahmad, M.N.; Allen, S.J. Mechanisms and chemistry of dye adsorption on manganese oxides-modified diatomite. J. Environ. Manag. 2009, 90, 3520–3527. [Google Scholar] [CrossRef] [PubMed]
- Sakkayawong, N.; Thiravetyan, P.; Nakbanpote, W. Adsorption mechanism of synthetic reactive dye wastewater by chitosan. J. Colloid Interface Sci 2005, 286, 36–42. [Google Scholar] [CrossRef]
- Manzoor, J.; Sharma, M. Impact of Textile Dyes on Human Health and Environment. In Impact of Textile Dyes on Public Health and the Environment; IGI Global: Hershey, PA, USA, 2020; pp. 162–169. [Google Scholar] [CrossRef]
- Chung, K.-T. Azo dyes and human health: A review. J. Environ. Sci. Health 2016, 34, 233–261. [Google Scholar] [CrossRef]
- Abbas, E.M.; Ali, F.S.; Desouky, M.G.; Ashour, M.; El-Shafei, A.; Maaty, M.M.; Sharawy, Z.Z. Novel Comprehensive Molecular and Ecological Study Introducing Coastal Mud Shrimp (Solenocera Crassicornis) Recorded at the Gulf of Suez, Egypt. J. Mar. Sci. Eng. 2020, 9, 9. [Google Scholar] [CrossRef]
- Alprol, A.E.; Heneash, A.M.M.; Soliman, A.M.; Ashour, M.; Alsanie, W.F.; Gaber, A.; Mansour, A.T. Assessment of Water Quality, Eutrophication, and Zooplankton Community in Lake Burullus, Egypt. Diversity 2021, 13, 268. [Google Scholar] [CrossRef]
- Ashour, M.; Alprol, A.E.; Heneash, A.M.M.; Saleh, H.; Abualnaja, K.M.; Alhashmialameer, D.; Mansour, A.T. Ammonia Bioremediation from Aquaculture Wastewater Effluents Using Arthrospira platensis NIOF17/003: Impact of Biodiesel Residue and Potential of Ammonia-Loaded Biomass as Rotifer Feed. Materials 2021, 14, 5460. [Google Scholar] [CrossRef]
- Ashour, M.; Mabrouk, M.M.; Abo-Taleb, H.A.; Sharawy, Z.Z.; Ayoub, H.F.; Van Doan, H.; Davies, S.J.; El-Haroun, E.; Goda, A.M.S.A. A liquid seaweed extract (TAM®) improves aqueous rearing environment, diversity of zooplankton community, whilst enhancing growth and immune response of Nile tilapia, Oreochromis niloticus, challenged by Aeromonas hydrophila. Aquaculture 2021, 543, 736915. [Google Scholar] [CrossRef]
- Alprol, A.E.; Ashour, M.; Mansour, A.T.; Alzahrani, O.M.; Mahmoud, S.F.; Gharib, S.M. Assessment of Water Quality and Phytoplankton Structure of Eight Alexandria Beaches, Southeastern Mediterranean Sea, Egypt. J. Mar. Sci Eng. 2021, 9, 1328. [Google Scholar] [CrossRef]
- da Silva, G.L.; Silva, V.L.; Vieira, M.G.; da Silva, M.G. Solophenyl navy blue dye removal by smectite clay in a porous bed column. Adsorpt. Sci. Technol. 2009, 27, 861–875. [Google Scholar] [CrossRef]
- Sardar, M.; Manna, M.; Maharana, M.; Sen, S. Remediation of dyes from industrial wastewater using low-cost adsorbents. In Green Adsorbents to Remove Metals, Dyes and Boron from Polluted Water; Springer: New York, NY, USA, 2021; pp. 377–403. [Google Scholar] [CrossRef]
- Raza, W.; Lee, J.; Raza, N.; Luo, Y.; Kim, K.-H.; Yang, J. Removal of phenolic compounds from industrial waste water based on membrane-based technologies. J. Ind. Eng. Chem. 2019, 71, 1–18. [Google Scholar] [CrossRef]
- Dawood, S.; Sen, T. Review on dye removal from its aqueous solution into alternative cost effective and non-conventional adsorbents. J. Chem. Process Eng. 2014, 1, 1–11. [Google Scholar]
- Kumar, P.S.; Joshiba, G.J.; Femina, C.C.; Varshini, P.; Priyadharshini, S.; Karthick, M.A.; Jothirani, R. A critical review on recent developments in the low-cost adsorption of dyes from wastewater. Desalin. Water Treat 2019, 172, 395–416. [Google Scholar] [CrossRef]
- Mehrotra, T.; Dev, S.; Banerjee, A.; Chatterjee, A.; Singh, R.; Aggarwal, S. Use of immobilized bacteria for environmental bioremediation: A review. J. Environ. Chem. Eng. 2021, 9, 105920. [Google Scholar] [CrossRef]
- Sarma, G.; Gupta, S.S.; Bhattacharyya, K. Removal of hazardous basic dyes from aqueous solution by adsorption onto kaolinite and acid-treated kaolinite: Kinetics, isotherm and mechanistic study. SN Appl. Sci. 2019, 1, 211. [Google Scholar] [CrossRef] [Green Version]
- Souza, M.; Lenzi, G.; Colpini, L.; Jorge, L.; Santos, O. Photocatalytic discoloration of reactive blue 5G dye in the presence of mixed oxides and with the addition of iron and silver. Braz. J. Chem. Eng. 2011, 28, 393–402. [Google Scholar] [CrossRef] [Green Version]
- Katheresan, V.; Kansedo, J.; Lau, S.Y. Efficiency of various recent wastewater dye removal methods: A review. J. Environ. Chem. Eng. 2018, 6, 4676–4697. [Google Scholar] [CrossRef]
- Rahimian, R.; Zarinabadi, S. A review of studies on the removal of methylene blue dye from industrial wastewater using activated carbon adsorbents made from almond bark. Prog Chem. Biochem. Res. 2020, 3, 251–268. [Google Scholar]
- El Haggar, S. Sustainable Industrial Design and Waste Management: Cradle-to-Cradle for Sustainable Development; Academic Press: Cambridge, MA, USA, 2010. [Google Scholar]
- Forgacs, E.; Cserhati, T.; Oros, G. Removal of synthetic dyes from wastewaters: A review. Environ. Int. 2004, 30, 953–971. [Google Scholar] [CrossRef]
- Ncibi, M.; Hamissa, A.B.; Fathallah, A.; Kortas, M.; Baklouti, T.; Mahjoub, B.; Seffen, M. Biosorptive uptake of methylene blue using Mediterranean green alga Enteromorpha spp. J. Hazard. Mater. 2009, 170, 1050–1055. [Google Scholar] [CrossRef] [PubMed]
- Ali, I.; Gupta, V. Advances in water treatment by adsorption technology. Nat. Protoc. 2006, 1, 2661–2667. [Google Scholar] [CrossRef] [PubMed]
- Bonilla-Petriciolet, A.; Mendoza-Castillo, D.I.; Reynel-Ávila, H.E. Adsorption Processes for Water Treatment and Purification; Springer: NewYork, NY, USA, 2017. [Google Scholar] [CrossRef]
- Lakherwal, D. Adsorption of heavy metals: A review. Int. J. Environ. Res. Dev. 2014, 4, 41–48. [Google Scholar]
- Mashkoor, F.; Nasar, A. Magsorbents: Potential candidates in wastewater treatment technology–A review on the removal of methylene blue dye. J. Magn. Magn. Mater. 2020, 500, 166408. [Google Scholar] [CrossRef]
- Oz, M.; Lorke, D.E.; Hasan, M.; Petroianu, G.A. Cellular and molecular actions of methylene blue in the nervous system. Med. Res. Rev. 2011, 31, 93–117. [Google Scholar] [CrossRef] [Green Version]
- Brooks, M.M. Methylene blue as antidote for cyanide and carbon monoxide poisoning. J. Am. Med. Assoc. 1933, 100, 59. [Google Scholar] [CrossRef]
- Buthelezi, S.P.; Olaniran, A.O.; Pillay, B. Textile dye removal from wastewater effluents using bioflocculants produced by indigenous bacterial isolates. Molecules 2012, 17, 14260–14274. [Google Scholar] [CrossRef] [Green Version]
- Zahrim, A.; Hilal, N. Treatment of highly concentrated dye solution by coagulation/flocculation–sand filtration and nanofiltration. Water Res. Ind. 2013, 3, 23–34. [Google Scholar] [CrossRef] [Green Version]
- Baaloudj, O.; Nasrallah, N.; Bouallouche, R.; Kenfoud, H.; Khezami, L.; Assadi, A.A. High efficient Cefixime removal from water by the sillenite Bi12TiO20: Photocatalytic mechanism and degradation pathway. J. Clean. Prod. 2022, 330, 129934. [Google Scholar] [CrossRef]
- Abul, A.; Samad, S.; Huq, D.; Moniruzzaman, M.; Masum, M. Textile dye removal from wastewater effluents using chitosan-ZnO nanocomposite. J. Text. Sci. Eng. 2015, 5, e1000200. [Google Scholar] [CrossRef]
- El-Hamid, A.; Al-Prol, A.; El-Alfy, M.A. Remediation of extracted water from El-Burullus drains sediments using chemical oxidation. J. Environ. Sci. Mansoura Univ. 2021, 50, 20–26. [Google Scholar]
- Mansour, A.T.; Ashour, M.; Alprol, A.E.; Alsaqufi, A.S. Aquatic Plants and Aquatic Animals in the Context of Sustainability: Cultivation Techniques, Integration, and Blue Revolution. Sustainability 2022, 14, 3257. [Google Scholar] [CrossRef]
- Babel, S.; Opiso, E.M. Removal of Cr from synthetic wastewater by sorption into volcanic ash soil. Int. J. Environ. Sci. Technol. 2007, 4, 99–107. [Google Scholar] [CrossRef] [Green Version]
- Badawi, A.K.; Abd Elkodous, M.; Ali, G.A. Recent advances in dye and metal ion removal using efficient adsorbents and novel nano-based materials: An overview. RSC Adv. 2021, 11, 36528–36553. [Google Scholar] [CrossRef]
- Abdelwahab, O.; Amin, N. Adsorption of phenol from aqueous solutions by Luffa cylindrica fibers: Kinetics, isotherm and thermodynamic studies. Egypt. J. Aquat. Res. 2013, 39, 215–223. [Google Scholar] [CrossRef] [Green Version]
- Amrhar, O.; Nassali, H.; Elyoubi, M. Modeling of adsorption isotherms of methylene blue onto natural illitic clay: Nonlinear regression analysis. Moroc. J. Chem. 2015, 3, 582–593. [Google Scholar]
- Yagub, M.T.; Sen, T.K.; Afroze, S.; Ang, H.M. Dye and its removal from aqueous solution by adsorption: A review. Adv. Colloid Interface Sci. 2014, 209, 172–184. [Google Scholar] [CrossRef]
- Khan, R.; Bhawana, P.; Fulekar, M. Microbial decolorization and degradation of synthetic dyes: A review. Rev. Environ. Sci. Bio/Technol. 2013, 12, 75–97. [Google Scholar] [CrossRef]
- Mishra, S.; Cheng, L.; Maiti, A. The utilization of agro-biomass/byproducts for effective bio-removal of dyes from dyeing wastewater: A comprehensive review. J. Environ. Chem. Eng. 2021, 9, 104901. [Google Scholar] [CrossRef]
- Kapoor, R.T.; Danish, M.; Singh, R.S.; Rafatullah, M.; HPS, A.K. Exploiting microbial biomass in treating azo dyes contaminated wastewater: Mechanism of degradation and factors affecting microbial efficiency. J. Water Process Eng. 2021, 43, 102255. [Google Scholar] [CrossRef]
- Blaga, A.C.; Zaharia, C.; Suteu, D. Polysaccharides as Support for Microbial Biomass-Based Adsorbents with Applications in Removal of Heavy Metals and Dyes. Polymers 2021, 13, 2893. [Google Scholar] [CrossRef] [PubMed]
- El-Sheekh, M.M.; Gharieb, M.; Abou-El-Souod, G. Biodegradation of dyes by some green algae and cyanobacteria. Int. Biodeterior. Biodegrad. 2009, 63, 699–704. [Google Scholar] [CrossRef]
- Alprol, A.E.; Heneash, A.M.M.; Ashour, M.; Abualnaja, K.M.; Alhashmialameer, D.; Mansour, A.T.; Sharawy, Z.Z.; Abu-Saied, M.A.; Abomohra, A.E. Potential Applications of Arthrospira platensis Lipid-Free Biomass in Bioremediation of Organic Dye from Industrial Textile Effluents and Its Influence on Marine Rotifer (Brachionus plicatilis). Materials 2021, 14, 4446. [Google Scholar] [CrossRef] [PubMed]
- Abo-Taleb, H.A.; FZeina, A.; Ashour, M.; MMabrouk, M.; ESallam, A.; MMEl-feky, M. Isolation and cultivation of the freshwater amphipod Gammarus pulex (Linnaeus, 1758), with an evaluation of its chemical and nutritional content. Egypt. J. Aquat. Biol Fish. 2020, 24, 69–82. [Google Scholar] [CrossRef] [Green Version]
- Metwally, A.S.; El-Naggar, H.A.; El-Damhougy, K.A.; Bashar, M.A.E.; Ashour, M.; Abo-Taleb, H.A.H. GC-MS analysis of bioactive components in six different crude extracts from the Soft Coral (Sinularia maxim) collected from Ras Mohamed, Aqaba Gulf, Red Sea, Egypt. Egypt. J. Aquat. Biol. Fish. 2020, 24, 425–434. [Google Scholar] [CrossRef]
- Magouz, F.I.; Essa, M.A.; Matter, M.; Tageldein Mansour, A.; Alkafafy, M.; Ashour, M. Population Dynamics, Fecundity and Fatty Acid Composition of Oithona nana (Cyclopoida, Copepoda), Fed on Different Diets. Animals 2021, 11, 1188. [Google Scholar] [CrossRef] [PubMed]
- Abomohra, A.E.-F.; Almutairi, A.W. A close-loop integrated approach for microalgae cultivation and efficient utilization of agar-free seaweed residues for enhanced biofuel recovery. Bioresour. Technol. 2020, 317, 124027. [Google Scholar] [CrossRef]
- Ashour, M.; El-Shafei, A.A.; Khairy, H.M.; Abd-Elkader, D.Y.; Mattar, M.A.; Alataway, A.; Hassan, S.M. Effect of Pterocladia capillacea Seaweed Extracts on Growth Parameters and Biochemical Constituents of Jew’s Mallow. Agronomy 2020, 10, 420. [Google Scholar] [CrossRef] [Green Version]
- Ashour, M.; Hassan, S.M.; Elshobary, M.E.; Ammar, G.A.G.; Gaber, A.; Alsanie, W.F.; Mansour, A.T.; El-Shenody, R. Impact of Commercial Seaweed Liquid Extract (TAM®) Biostimulant and Its Bioactive Molecules on Growth and Antioxidant Activities of Hot Pepper (Capsicum annuum). Plants 2021, 10, 1045. [Google Scholar] [CrossRef]
- Hassan, S.M.; Ashour, M.; Sakai, N.; Zhang, L.; Hassanien, H.A.; Gaber, A.; Ammar, G. Impact of Seaweed Liquid Extract Biostimulant on Growth, Yield, and Chemical Composition of Cucumber (Cucumis sativus). Agriculture 2021, 11, 320. [Google Scholar] [CrossRef]
- Hassan, S.M.; Ashour, M.; Soliman, A.A.F.; Hassanien, H.A.; Alsanie, W.F.; Gaber, A.; Elshobary, M.E. The Potential of a New Commercial Seaweed Extract in Stimulating Morpho-Agronomic and Bioactive Properties of Eruca vesicaria (L.) Cav. Sustainability 2021, 13, 4485. [Google Scholar] [CrossRef]
- Shao, W.; Ebaid, R.; El-Sheekh, M.; Abomohra, A.; Eladel, H. Pharmaceutical applications and consequent environmental impacts of Spirulina (Arthrospira): An overview. Grasasy Aceites 2019, 70, 292. [Google Scholar] [CrossRef] [Green Version]
- Raja, R.; Coelho, A.; Hemaiswarya, S.; Kumar, P.; Carvalho, I.S.; Alagarsamy, A. Applications of microalgal paste and powder as food and feed: An update using text mining tool. Beni-Suef Univ. J. Basic Appl. Sci. 2018, 7, 740–747. [Google Scholar] [CrossRef]
- Al Prol, A.E.; EAEl-Metwally, M.; Amer, A. Sargassum latifolium as eco-friendly materials for treatment of toxic nickel (II) and lead (II) ions from aqueous solution. Egypt. J. Aquat. Biol. Fish. 2019, 23, 285–299. [Google Scholar] [CrossRef] [Green Version]
- Ashour, M.; Mabrouk, M.M.; Ayoub, H.F.; El-Feky, M.M.M.M.; Zaki, S.Z.; Hoseinifar, S.H.; Rossi, W.; Van Doan, H.; El-Haroun, E.; Goda, A.M.A.S. Effect of dietary seaweed extract supplementation on growth, feed utilization, hematological indices, and non-specific immunity of Nile Tilapia, Oreochromis niloticus challenged with Aeromonas hydrophila. J. Appl. Phycol. 2020, 32, 3467–3479. [Google Scholar] [CrossRef]
- Maurya, R.; Ghosh, T.; Paliwal, C.; Shrivastav, A.; Chokshi, K.; Pancha, I.; Ghosh, A.; Mishra, S. Biosorption of methylene blue by de-oiled algal biomass: Equilibrium, kinetics and artificial neural network modelling. PLoS ONE 2014, 9, e109545. [Google Scholar] [CrossRef] [Green Version]
- Ghoneim, M.M.; El-Desoky, H.S.; El-Moselhy, K.M.; Amer, A.; Abou El-Naga, E.H.; Mohamedein, L.I.; Al-Prol, A.E. Removal of cadmium from aqueous solution using marine green algae, Ulva lactuca. Egypt. J. Aquat. Res. 2014, 40, 235–242. [Google Scholar] [CrossRef] [Green Version]
- Dada, A.; Olalekan, A.; Olatunya, A.; Dada, O. Langmuir, Freundlich, Temkin and Dubinin–Radushkevich isotherms studies of equilibrium sorption of Zn2+ unto phosphoric acid modified rice husk. IOSR J. Appl. Chem. 2012, 3, 38–45. [Google Scholar]
- Freundlich, H. Over the adsorption in solution. J. Phys. Chem. 1906, 57, 1100–1107. [Google Scholar]
- Langmuir, I. The constitution and fundamental properties of solids and liquids. Part, I. Solids. J. Am. Chem. Soc. 1916, 38, 2221–2295. [Google Scholar] [CrossRef] [Green Version]
- Langmuir, I. The constitution and fundamental properties of solids and liquids. II. Liquids. J. Am. Chem. Soc. 1917, 39, 1848–1906. [Google Scholar] [CrossRef] [Green Version]
- Halsey, G. Physical adsorption on non-uniform surfaces. J. Chem. Phys. 1948, 16, 931–937. [Google Scholar] [CrossRef]
- Harkins, W.D.; Jura, G. An adsorption method for the determination of the area of a solid without the assumption of a molecular area, and the area occupied by nitrogen molecules on the surfaces of solids. J.Chem.Phys. 1943, 11, 431–432. [Google Scholar] [CrossRef]
- Harkins, W.D.; Jura, G. Surfaces of solids. XIII. A vapor adsorption method for the determination of the area of a solid without the assumption of a molecular area, and the areas occupied by nitrogen and other molecules on the surface of a solid. J. Am. Chem. Soc. 1944, 66, 1366–1373. [Google Scholar] [CrossRef]
- Mall, I.D.; Srivastava, V.C.; Agarwal, N.K. Removal of Orange-G and Methyl Violet dyes by adsorption onto bagasse fly ash—kinetic study and equilibrium isotherm analyses. Dyes Pigment. 2006, 69, 210–223. [Google Scholar] [CrossRef]
- Temkin, M.; Pyzhev, V. Recent modifications to Langmuir isotherms. Chemosphere 1940, 12, 217–222. [Google Scholar]
- Foo, K.Y.; Hameed, B.H. Insights into the modeling of adsorption isotherm systems. Chem. Eng. J. 2010, 156, 2–10. [Google Scholar] [CrossRef]
- Ng, J.; Cheung, W.; McKay, G. Equilibrium studies of the sorption of Cu (II) ions onto chitosan. J. Colloid Interface Sci. 2002, 255, 64–74. [Google Scholar] [CrossRef]
- Kumar, Y.P.; King, P.; Prasad, V. Removal of copper from aqueous solution using Ulva fasciata sp.—A marine green algae. J. Hazard. Mater. 2006, 137, 367–373. [Google Scholar] [CrossRef]
- Levankumar, L.; Muthukumaran, V.; Gobinath, M. Batch adsorption and kinetics of chromium (VI) removal from aqueous solutions by Ocimum americanum L. seed pods. J. Hazard. Mater. 2009, 161, 709–713. [Google Scholar] [CrossRef]
- Lagergren, S. Zur theorie der sogenannten adsorption geloster stoffe. Kungliga Svenska Vetenskapsakademiens Handlingar 1898, 24, 1–39. [Google Scholar]
- Ho, Y.; McKay, G.; Wase, D.; Forster, C. Study of the sorption of divalent metal ions on to peat. Adsorpt. Sci. Technol. 2000, 18, 639–650. [Google Scholar] [CrossRef]
- Abualnaja, K.M.; Alprol, A.E.; Abu-Saied, M.A.; Ashour, M.; Mansour, A.T. Removing of Anionic Dye from Aqueous Solutions by Adsorption Using of Multiwalled Carbon Nanotubes and Poly (Acrylonitrile-styrene) Impregnated with Activated Carbon. Sustainability 2021, 13, 7077. [Google Scholar] [CrossRef]
- Inyinbor, A.; Adekola, F.; Olatunji, G.A. Kinetics, isotherms and thermodynamic modeling of liquid phase adsorption of Rhodamine B dye onto Raphia hookerie fruit epicarp. Water Res. Ind. 2016, 15, 14–27. [Google Scholar] [CrossRef] [Green Version]
- Dönmez, G.; Aksu, Z. Removal of chromium (VI) from saline wastewaters by Dunaliella species. Process Biochem. 2002, 38, 751–762. [Google Scholar] [CrossRef]
- Rajeswari, R.; Jeyaprakash, K. Bioactive potential analysis of brown seaweed Sargassum wightii using UV-VIS and FT-IR. J. Drug Deliv. Ther 2019, 9, 150–153. [Google Scholar] [CrossRef] [Green Version]
- Santos-Buelga, C.; González-Paramás, A.M.; González-Manzano, S.; Dueñas, M. Analysis and occurrence of flavonoids in foods and biological samples. In Recent Advances in Medicinal Chemistry; Atta-ur-Rahman, M., Iqbal, C., Perry, G., Eds.; Bentham Science Publisher: Shajah, United Arab Emirates, 2015; pp. 10–58. [Google Scholar]
- Vihakas, M. Flavonoids and Other Phenolic Compounds: Characterization and Interactions with Lepidopteran and Sawfly Larvae. Ph.D. Thesis, University of Turku, Turku, Finland, 2014. [Google Scholar]
- Sahu, N.; Saxena, J. Phytochemical analysis of Bougainvillea glabra Choisy by FTIR and UV-VIS spectroscopic analysis. Int. J. Pharm. Sci. Rev. Res 2013, 21, 196–198. [Google Scholar]
- Sofowora, A. Medicinal Plants and Traditional Medicine in Africa; Karthala: Paris, France, 1996. [Google Scholar]
- Jasper, C.; Maruzzella, J.; Henry, P. The antimicrobial activity of perfume oils. J. Am. Pharm. Assoc. 1958, 47, 471–476. [Google Scholar]
- Anand, M.; Suresh, S. Marine seaweed Sargassum wightii extract as a low-cost sensitizer for ZnO photoanode based dye-sensitized solar cell. Adv. Nat. Sci. Nanosci. Nanotechnol. 2015, 6, 035008. [Google Scholar] [CrossRef]
- Lai, W.H.; Su, Y.H.; Teoh, L.G.; Hon, M.H. Commercial and natural dyes as photosensitizers for a water-based dye-sensitized solar cell loaded with gold nanoparticles. J. Photochem. Photobiol. A Chemistry 2008, 195, 307–313. [Google Scholar] [CrossRef]
- Ali, H. Biodegradation of synthetic dyes—A review. Water Air Soil Pollut. 2010, 213, 251–273. [Google Scholar] [CrossRef]
- Sivaprakasha, S.; Kumarb, P.S.; Krishnac, S. Adsorption study of various dyes on Activated Carbon Fe3O4 Magnetic Nano Composite. Int. J. Appl. Chem. 2017, 13, 255–266. [Google Scholar]
- Doğar, Ç.; Gürses, A.; Açıkyıldız, M.; Özkan, E. Thermodynamics and kinetic studies of biosorption of a basic dye from aqueous solution using green algae Ulothrix sp. Colloids. Surf. B Biointerfaces 2010, 76, 279–285. [Google Scholar] [CrossRef] [PubMed]
- Maleki, A.; Mahvi, A.H.; Ebrahimi, R.; Zandsalimi, Y. Study of photochemical and sonochemical processes efficiency for degradation of dyes in aqueous solution. Korean J. Chem. Eng. 2010, 27, 1805–1810. [Google Scholar] [CrossRef]
- Yao, Y.; Xu, F.; Chen, M.; Xu, Z.; Zhu, Z. Adsorption behavior of methylene blue on carbon nanotubes. Bioresour. Technol. 2010, 101, 3040–3046. [Google Scholar] [CrossRef]
- Konicki, W.; Pełech, I.; Mijowska, E.; Jasińska, I. Adsorption of anionic dye Direct Red 23 onto magnetic multi-walled carbon nanotubes-Fe3C nanocomposite: Kinetics, equilibrium and thermodynamics. Chem. Eng. J. 2012, 210, 87–95. [Google Scholar] [CrossRef]
- Aravindhan, R.; Rao, J.R.; Nair, B.U. Removal of basic yellow dye from aqueous solution by sorption on green alga Caulerpa scalpelliformis. J. Hazard Mater. 2007, 142, 68–76. [Google Scholar] [CrossRef]
- Gupta, S.; Kumar, D.; Gaur, J. Kinetic and isotherm modeling of lead (II) sorption onto some waste plant materials. Chem. Eng. J. 2009, 148, 226–233. [Google Scholar] [CrossRef]
- Xue, X.; Wang, J.; Mei, L.; Wang, Z.; Qi, K.; Yang, B. Recognition and enrichment specificity of Fe3O4 magnetic nanoparticles surface modified by chitosan and Staphylococcus aureus enterotoxins A antiserum. Colloids Surf. B Biointerfaces 2013, 103, 107–113. [Google Scholar] [CrossRef]
- Tolba, A.A. Evaluation of uranium adsorption using magnetic-polyamine chitosan from sulfate leach liquor of sela ore material, South Eastern Desert, Egypt. Egypt. J. Chem. 2020, 63, 5219–5238. [Google Scholar] [CrossRef]
- Khan, M.M.R.; Ray, M.; Guha, A.K. Mechanistic studies on the binding of Acid Yellow 99 on coir pith. Bioresour. Technol. 2011, 102, 2394–2399. [Google Scholar] [CrossRef]
- Ong, P.S.; Ong, S.T.; Hung, Y.T. Utilization of mango leaf as low-cost adsorbent for the removal of Cu (II) ion from aqueous solution. Asian J. Chem. 2011, 25, 6141–6145. [Google Scholar] [CrossRef]
- Khalaf, M.A. Biosorption of reactive dye from textile wastewater by non-viable biomass of Aspergillus niger and Spirogyra sp. Biores. Technol. 2008, 99, 6631–6634. [Google Scholar] [CrossRef]
- Al Prol, A.E. Study of environmental concerns of dyes and recent textile effluents treatment technology: A Review. Asian J. Fish. Aquat. Res. 2019, 3, 1–18. [Google Scholar] [CrossRef]
- Sampranpiboon, P.; Charnkeitkong, P.; Feng, X. Equilibrium isotherm models for adsorption of zinc (II) ion from aqueous solution on pulp waste. WSEAS Transac. Environ. Dev. 2014, 10, 35–47. [Google Scholar]
- Gautam, S.; Khan, S.H. Removal of methylene blue from waste water using banana peel as adsorbent. Int. J. Sci. Environ. Technol. 2016, 5, 3230–3236. [Google Scholar]
- Tahir, K.; Nazir, S.; Li, B.; Khan, A.U.; Khan, Z.U.H.; Ahmad, A.; Khan, F.U. An efficient photo catalytic activity of green synthesized silver nanoparticles using Salvadora persica stem extract. Sep. Purif. Technol. 2015, 150, 316–324. [Google Scholar] [CrossRef]
- Bulut, Y.; Aydın, H. A kinetics and thermodynamics study of methylene blue adsorption on wheat shells. Desalination 2006, 194, 259–267. [Google Scholar] [CrossRef]
- Kavitha, D.; Namasivayam, C. Experimental and kinetic studies on methylene blue adsorption by coir pith carbon. Bioresour. Technol. 2007, 98, 14–21. [Google Scholar] [CrossRef]
- Banat, F.; Al-Asheh, S.; Al-Makhadmeh, L. Evaluation of the use of raw and activated date pits as potential adsorbents for dye containing waters. Process. Biochem. 2003, 39, 193–202. [Google Scholar] [CrossRef]
- Han, R.; Wang, Y.; Han, P.; Shi, J.; Yang, J.; Lu, Y. Removal of methylene blue from aqueous solution by chaff in batch mode. J. Hazard. Mater. 2006, 137, 550–557. [Google Scholar] [CrossRef] [PubMed]
- Hall, K.R.; Eagleton, L.C.; Acrivos, A.; Vermeulen, T. Pore-and solid-diffusion kinetics in fixed-bed adsorption under constant-pattern conditions. Ind. Eng Chem. Fundam. 1966, 5, 212–223. [Google Scholar] [CrossRef]
- Abdelwahab, O.; El Nemr, A.; El Sikaily, A.; Khaled, A. Use of rice husk for adsorption of direct dyes from aqueous solution: A case study of Direct, F. Scarlet. Egypt. J. Aquat. Res. 2005, 31, 1–11. [Google Scholar]
- El Nemr, A.; Khaled, A.; Abdelwahab, O.; El-Sikaily, A. Treatment of wastewater containing toxic chromium using new activated carbon developed from date palm seed. J. Hazard. Mat. 2008, 152, 263–275. [Google Scholar] [CrossRef]
- Abualnaja, K.M.; Alprol, A.E.; Ashour, M.; Mansour, A.T. Influencing Multi-Walled Carbon Nanotubes for the Removal of Ismate Violet 2R Dye from Wastewater: Isotherm, Kinetics, and Thermodynamic Studies. Appl. Sci. 2021, 11, 4786. [Google Scholar] [CrossRef]
- Potgieter, J.; Pearson, S.; Pardesi, C. Kinetic and thermodynamic parameters for the adsorption of methylene blue using fly ash under batch, column, and heap leaching configurations. Coal Combust. Gasif. Prod. 2018, 10, 23–33. [Google Scholar]
- Baaloudj, O.; Assadi, I.; Nasrallah, N.; El Jery, A.; Khezami, L.; Assadi, A.A. Simultaneous removal of antibiotics and inactivation of antibiotic-resistant bacteria by photocatalysis: A review. J. Water Process Eng. 2021, 42, 102089. [Google Scholar] [CrossRef]
- Vimonses, V.; Lei, S.; Jin, B.; Chow, C.W.; Saint, C. Kinetic study and equilibrium isotherm analysis of Congo Red adsorption by clay materials. Chem. Eng. J. 2009, 148, 354–364. [Google Scholar] [CrossRef]


| Surface Area Results (m2/g) | Total Pore Volume | Average Pore Size | Average Particle Radius | ||||
|---|---|---|---|---|---|---|---|
| Single Point BET | Multipoint BET | Langmuir Method | BJH Adsorption | BJH Desorption | |||
| 100.78 | 111.65 | 178.40 | 67.87 | 58.486 | 0.12 cc/g | 2.19 nm | 1.22 + 001 nm |
| Isotherm Model | Isotherm Parameter | Value |
|---|---|---|
| Freundlich | 1/n | 1.115 |
| KF (mg1–1/nL1/ng−1) | 31.6 | |
| R2 | 0.906 | |
| Langmuir | Qmax (mg g−1) | 0.819 |
| b (L mg−1) | 0.068 | |
| RL | 0.969 | |
| R2 | 0.751 | |
| Tempkin | AT | 2.47 |
| BT | 14.67 | |
| bT | 168.88 | |
| R2 | 0.916 | |
| Harkins–Jura | A | 0.02 |
| B | 0.3 | |
| R2 | 0.719 | |
| Halsey | 1/nH | 1.912 |
| KH | 11 | |
| R2 | 0.768 | |
| Henderson | 1/nh | 0.519 |
| Kh | 0.119 | |
| R2 | 0.735 | |
| Smith | Wbs | 0.768 |
| Ws | 36.01 | |
| R2 | 0.605 |
| Adsorbent | Capacities (mg g−1) | Reference |
|---|---|---|
| Banana peel | 0.124 | [102] |
| Cotton stalk | 11.6 | [103] |
| Wheat shells | 16.6 | [104] |
| Coir pith carbon | 5.9 | [105] |
| Wheat shells | 16.6 | [104] |
| Activated date pits | 12.9 | [106] |
| Cereal chaff | 20.3 | [107] |
| Fly Ash | 0.0727 | [108] |
| S. latifolium | 0.819 | This study |
| Isotherm Model | Hybrid | APE% | X2 | ERRSQ | EABS |
|---|---|---|---|---|---|
| Freundlich | 5.453 | 2.035 | 1.854 | 4.707 | 13.017 |
| Langmuir | 363.42 | 13.66 | 83.58 | 305.55 | 87.40 |
| Harkins–Jura | 202.700 | 10.203 | 46.621 | 170.425 | 65.273 |
| Halsey | 0.151 | 0.278 | 0.035 | 0.127 | 1.781 |
| Henderson | 0.605 | 0.557 | 0.139 | 0.508 | 3.565 |
| Smith | 391.312 | 14.177 | 90.002 | 329.004 | 90.692 |
| Tempkin | 359.232 | 13.583 | 82.623 | 302.033 | 86.895 |
| Model | Parameter | Value |
|---|---|---|
| First-order Kinetic | qe (calc.) | 3.30 |
| K1 | 2.07 | |
| R2 | 0.001 | |
| Second-order Kinetic | qe (calc) | 6.44 |
| K2 | 0.01 | |
| R2 | 0.936 | |
| qe (exp.) | 4.18 | |
| Interparticle Diffusion | Kdif | 1.747 |
| C | 0.44 | |
| R2 | 0.45 |
| Temperature (°C) | ΔG° (kJ mol−1) | ΔH° (kJ mol−1) | ΔS° (J mol−1) |
|---|---|---|---|
| 30 | −6.35 | 35.205 | −0.131 |
| 40 | −6.62 | ||
| 50 | −7.86 | ||
| 60 | −7.54 |
Publisher’s Note: MDPI stays neutral with regard to jurisdictional claims in published maps and institutional affiliations. |
© 2022 by the authors. Licensee MDPI, Basel, Switzerland. This article is an open access article distributed under the terms and conditions of the Creative Commons Attribution (CC BY) license (https://creativecommons.org/licenses/by/4.0/).
Share and Cite
Mansour, A.T.; Alprol, A.E.; Abualnaja, K.M.; El-Beltagi, H.S.; Ramadan, K.M.A.; Ashour, M. Dried Brown Seaweed’s Phytoremediation Potential for Methylene Blue Dye Removal from Aquatic Environments. Polymers 2022, 14, 1375. https://doi.org/10.3390/polym14071375
Mansour AT, Alprol AE, Abualnaja KM, El-Beltagi HS, Ramadan KMA, Ashour M. Dried Brown Seaweed’s Phytoremediation Potential for Methylene Blue Dye Removal from Aquatic Environments. Polymers. 2022; 14(7):1375. https://doi.org/10.3390/polym14071375
Chicago/Turabian StyleMansour, Abdallah Tageldein, Ahmed E. Alprol, Khamael M. Abualnaja, Hossam S. El-Beltagi, Khaled M. A. Ramadan, and Mohamed Ashour. 2022. "Dried Brown Seaweed’s Phytoremediation Potential for Methylene Blue Dye Removal from Aquatic Environments" Polymers 14, no. 7: 1375. https://doi.org/10.3390/polym14071375