
Effect of Elevated Temperature on Mechanical Properties of High-Volume Fly Ash-Based Geopolymer Concrete, Mortar and Paste Cured at Room Temperature

 , and
, and
Abstract
:1. Introduction
2. Experimental Program
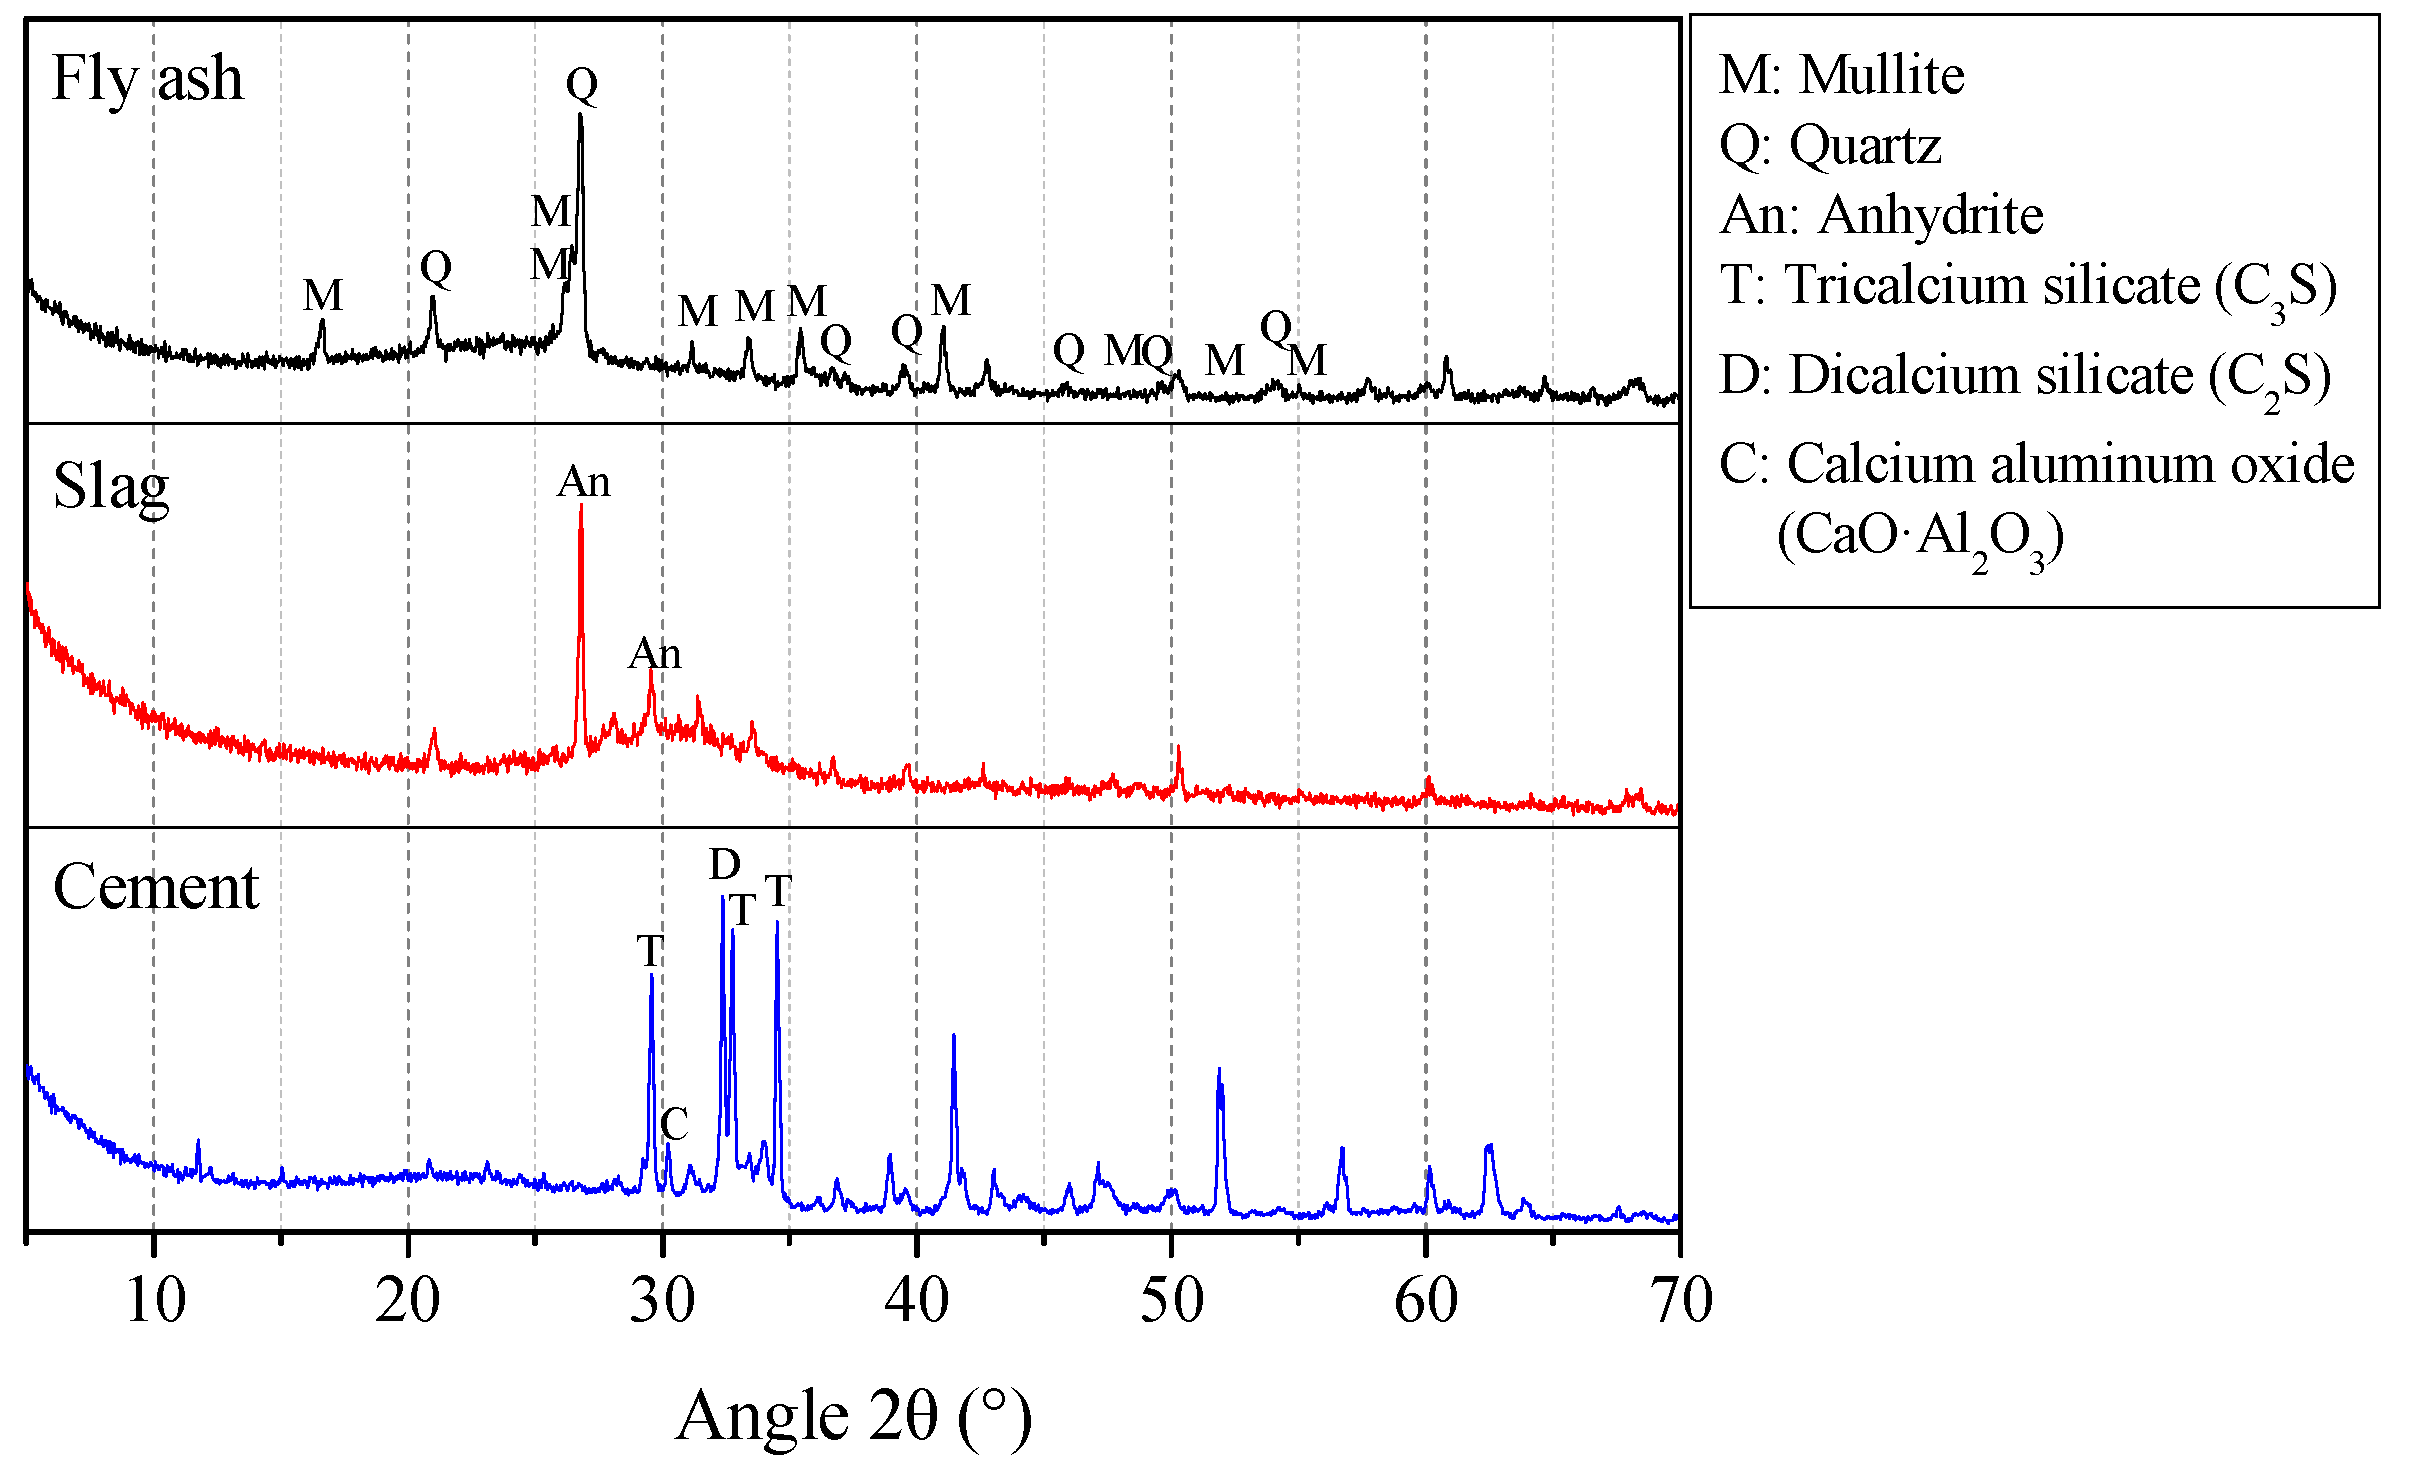
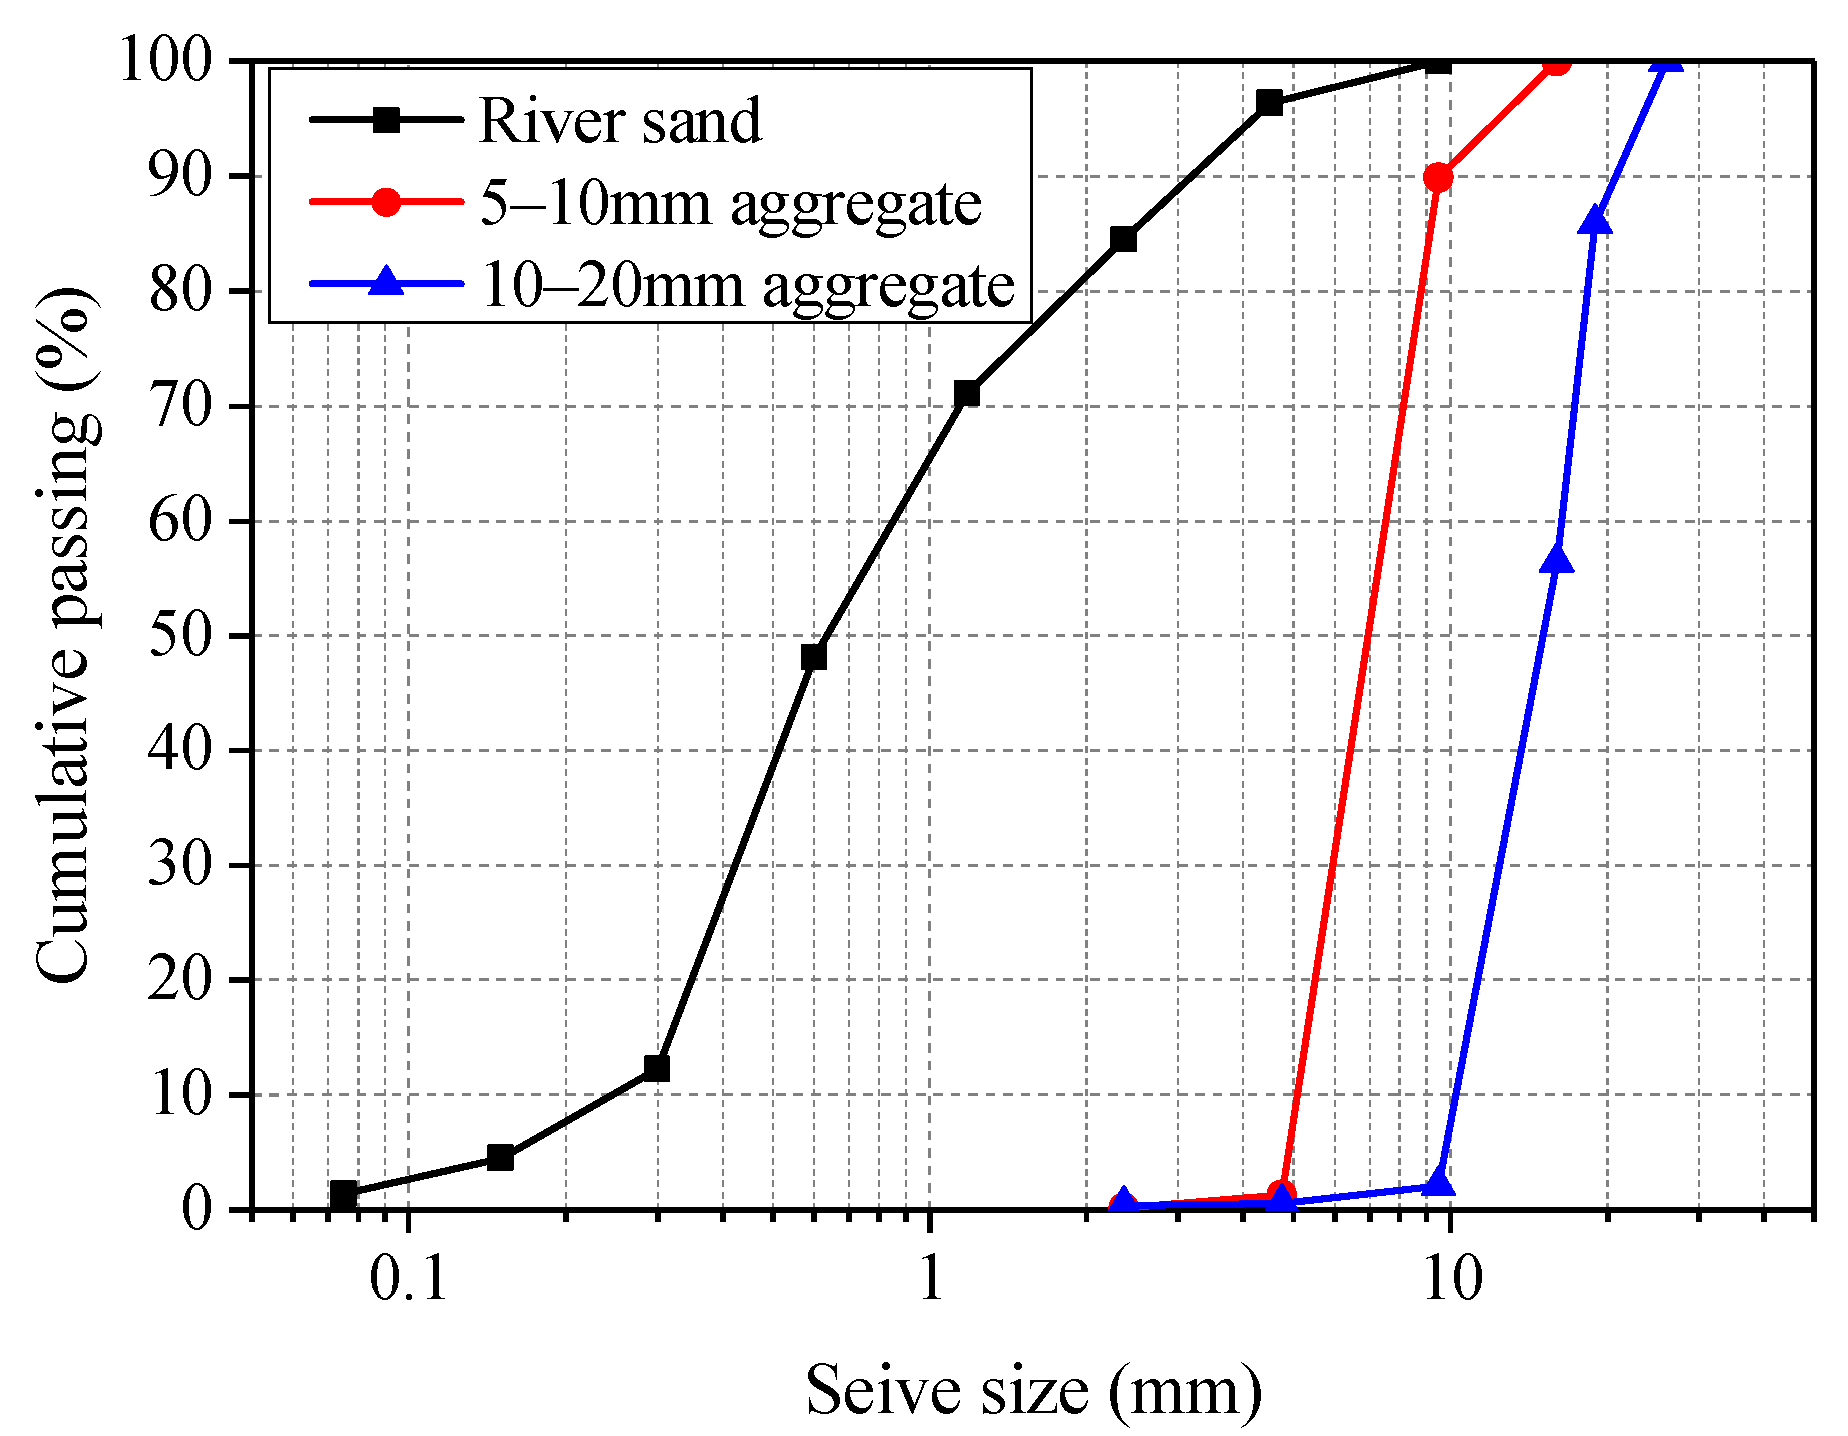
2.1. Materials
2.2. Specimen Preparation
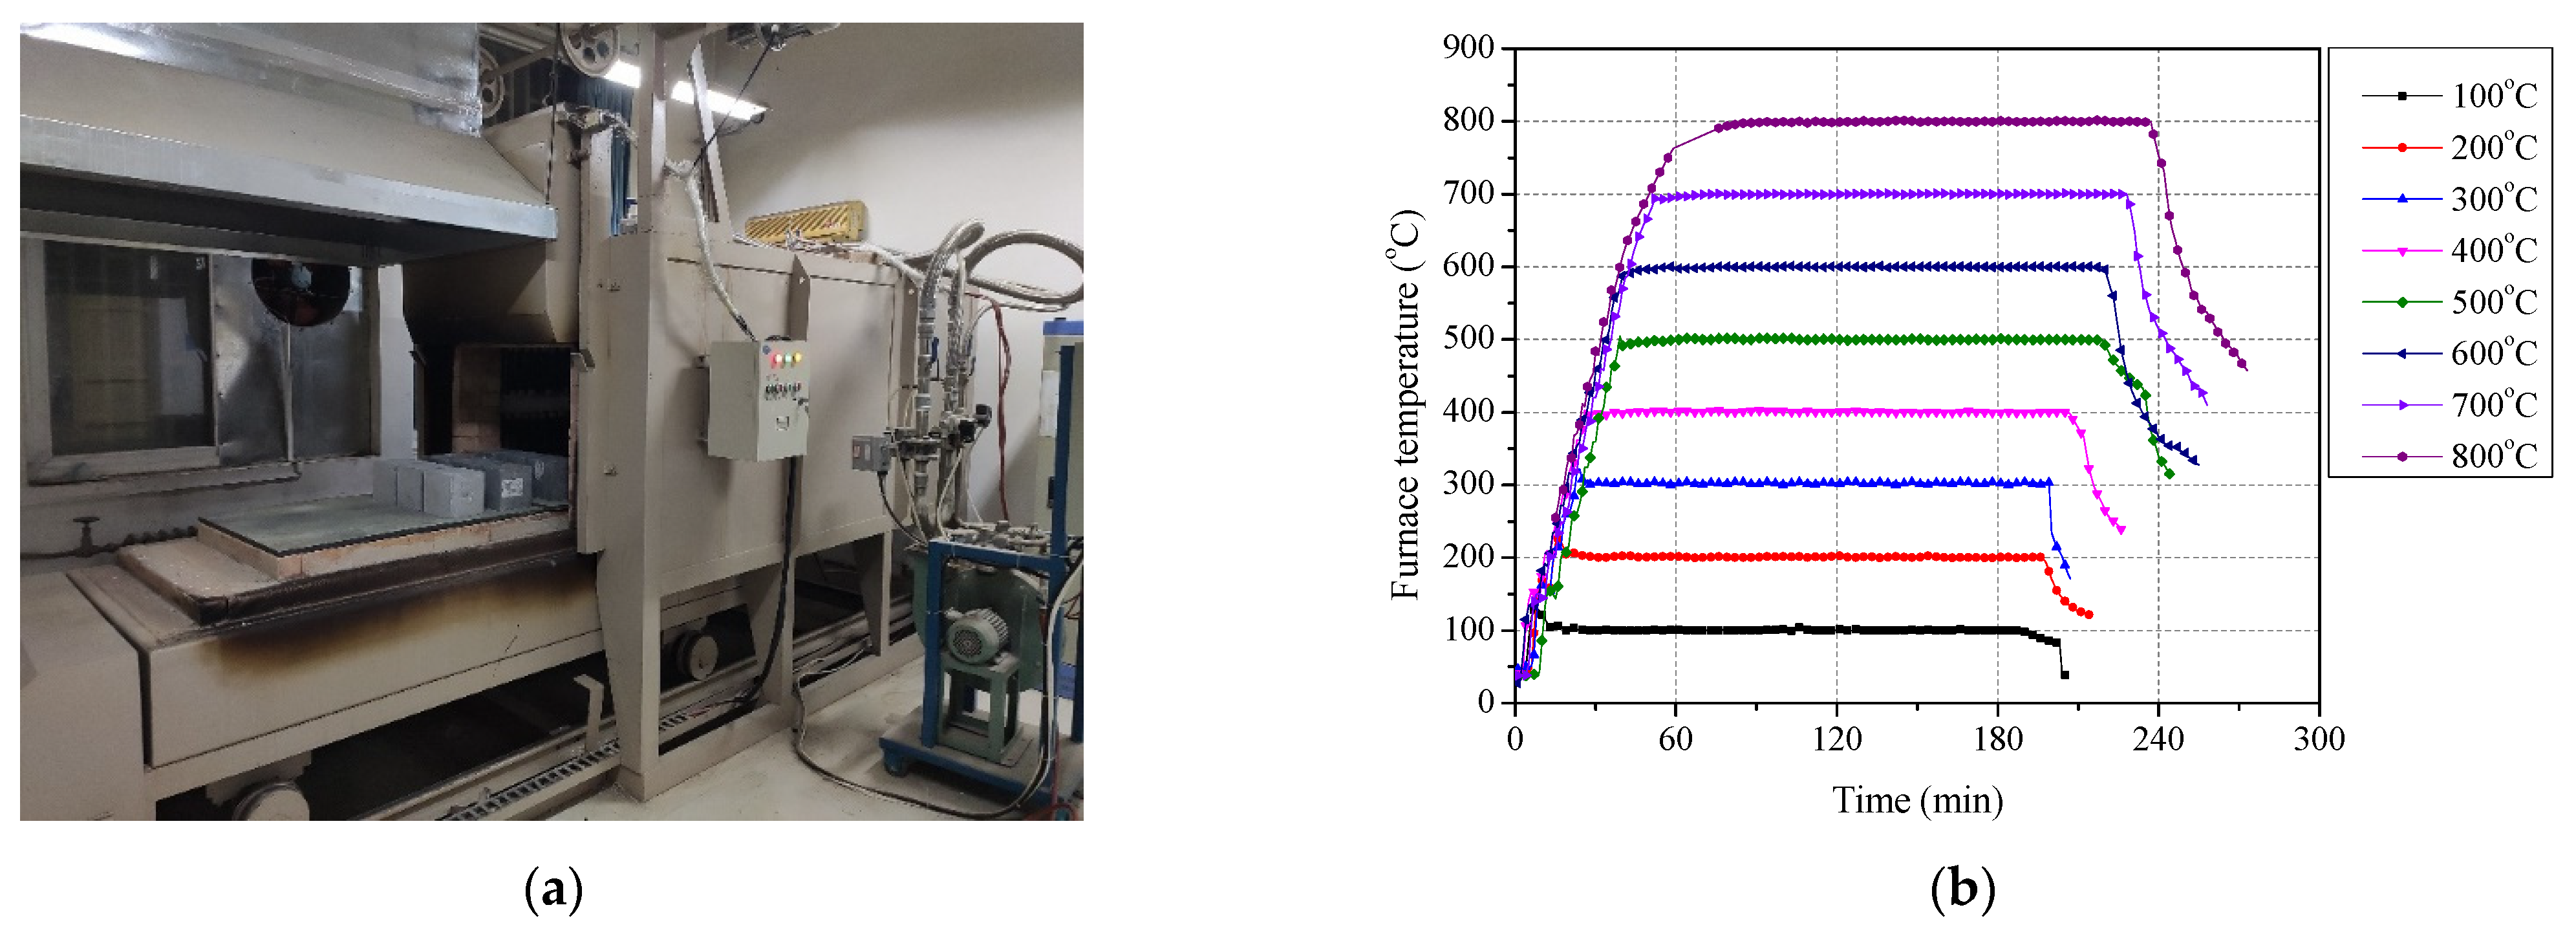
2.3. Heating System
2.4. Mass Loss Test
2.5. Mechanical Property Test
2.6. Thermogravimetric Analysis/Differential Scanning Calorimetry (TGA/DSC)
2.7. X-ray Diffraction (XRD)
2.8. Scanning Electron Microscope (SEM)
2.9. Definition of Specimen Label
3. Results and Discussion
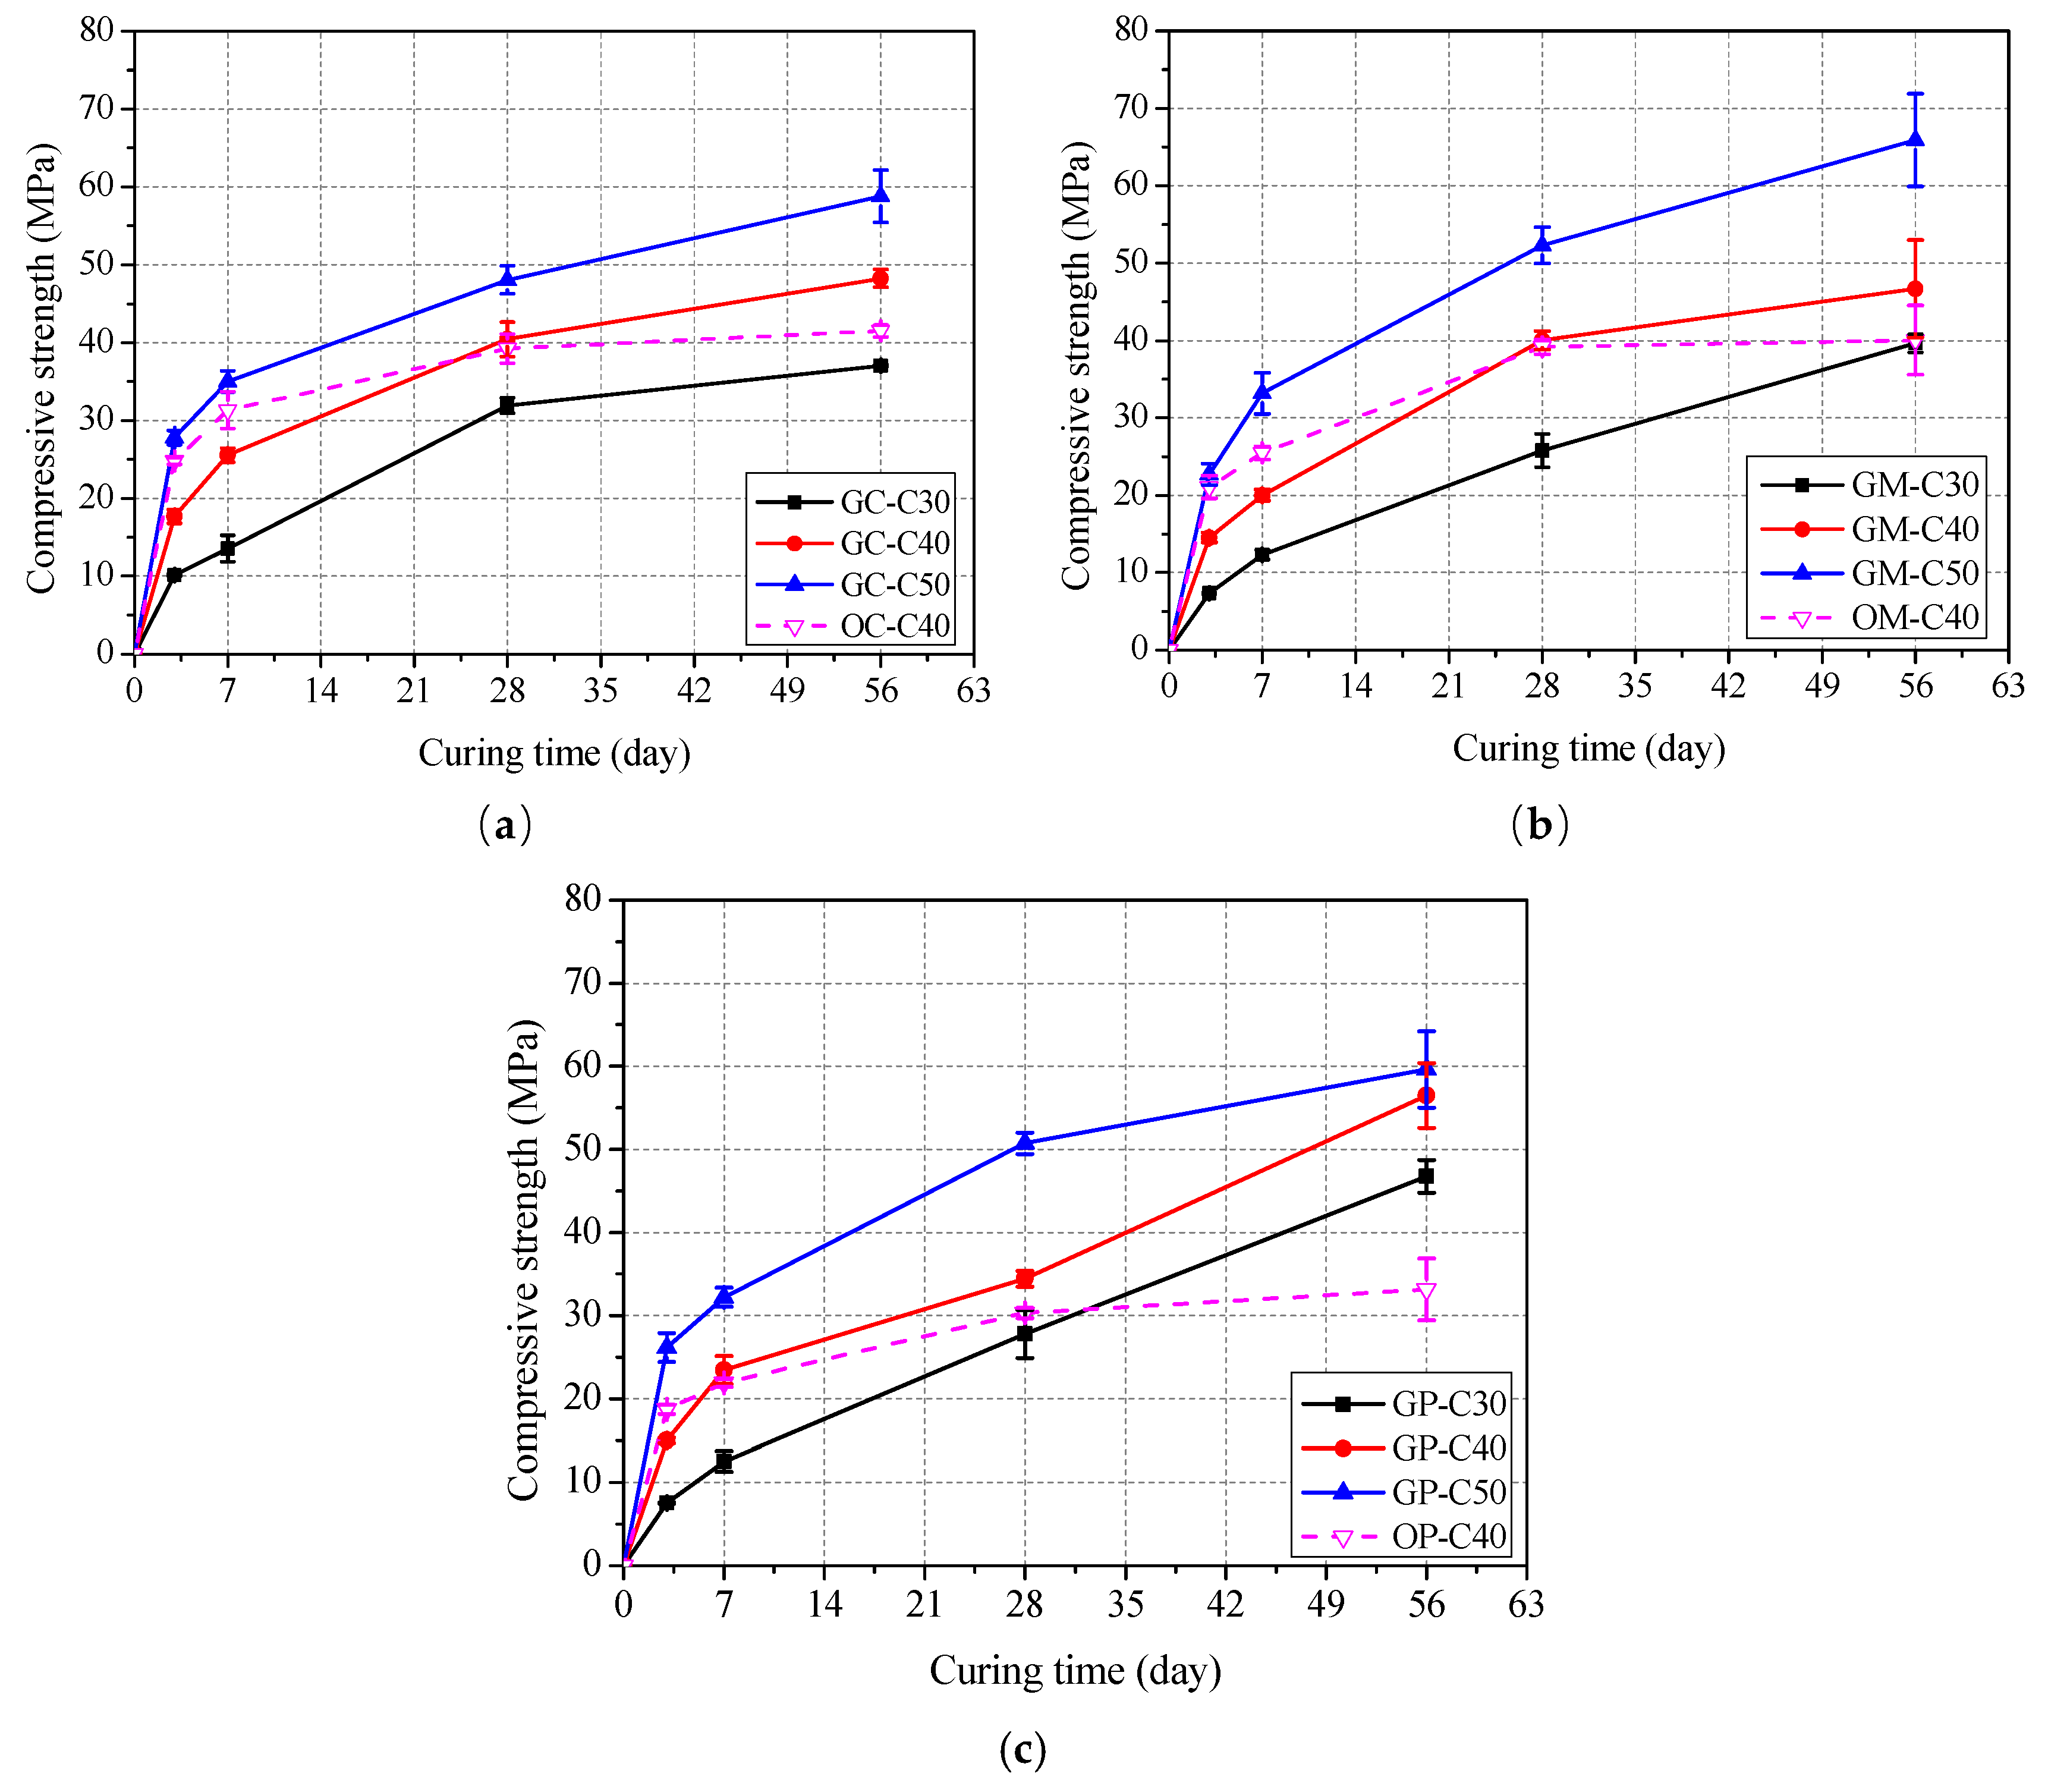
3.1. Basic Mechanical Properties of Unexposed Specimens
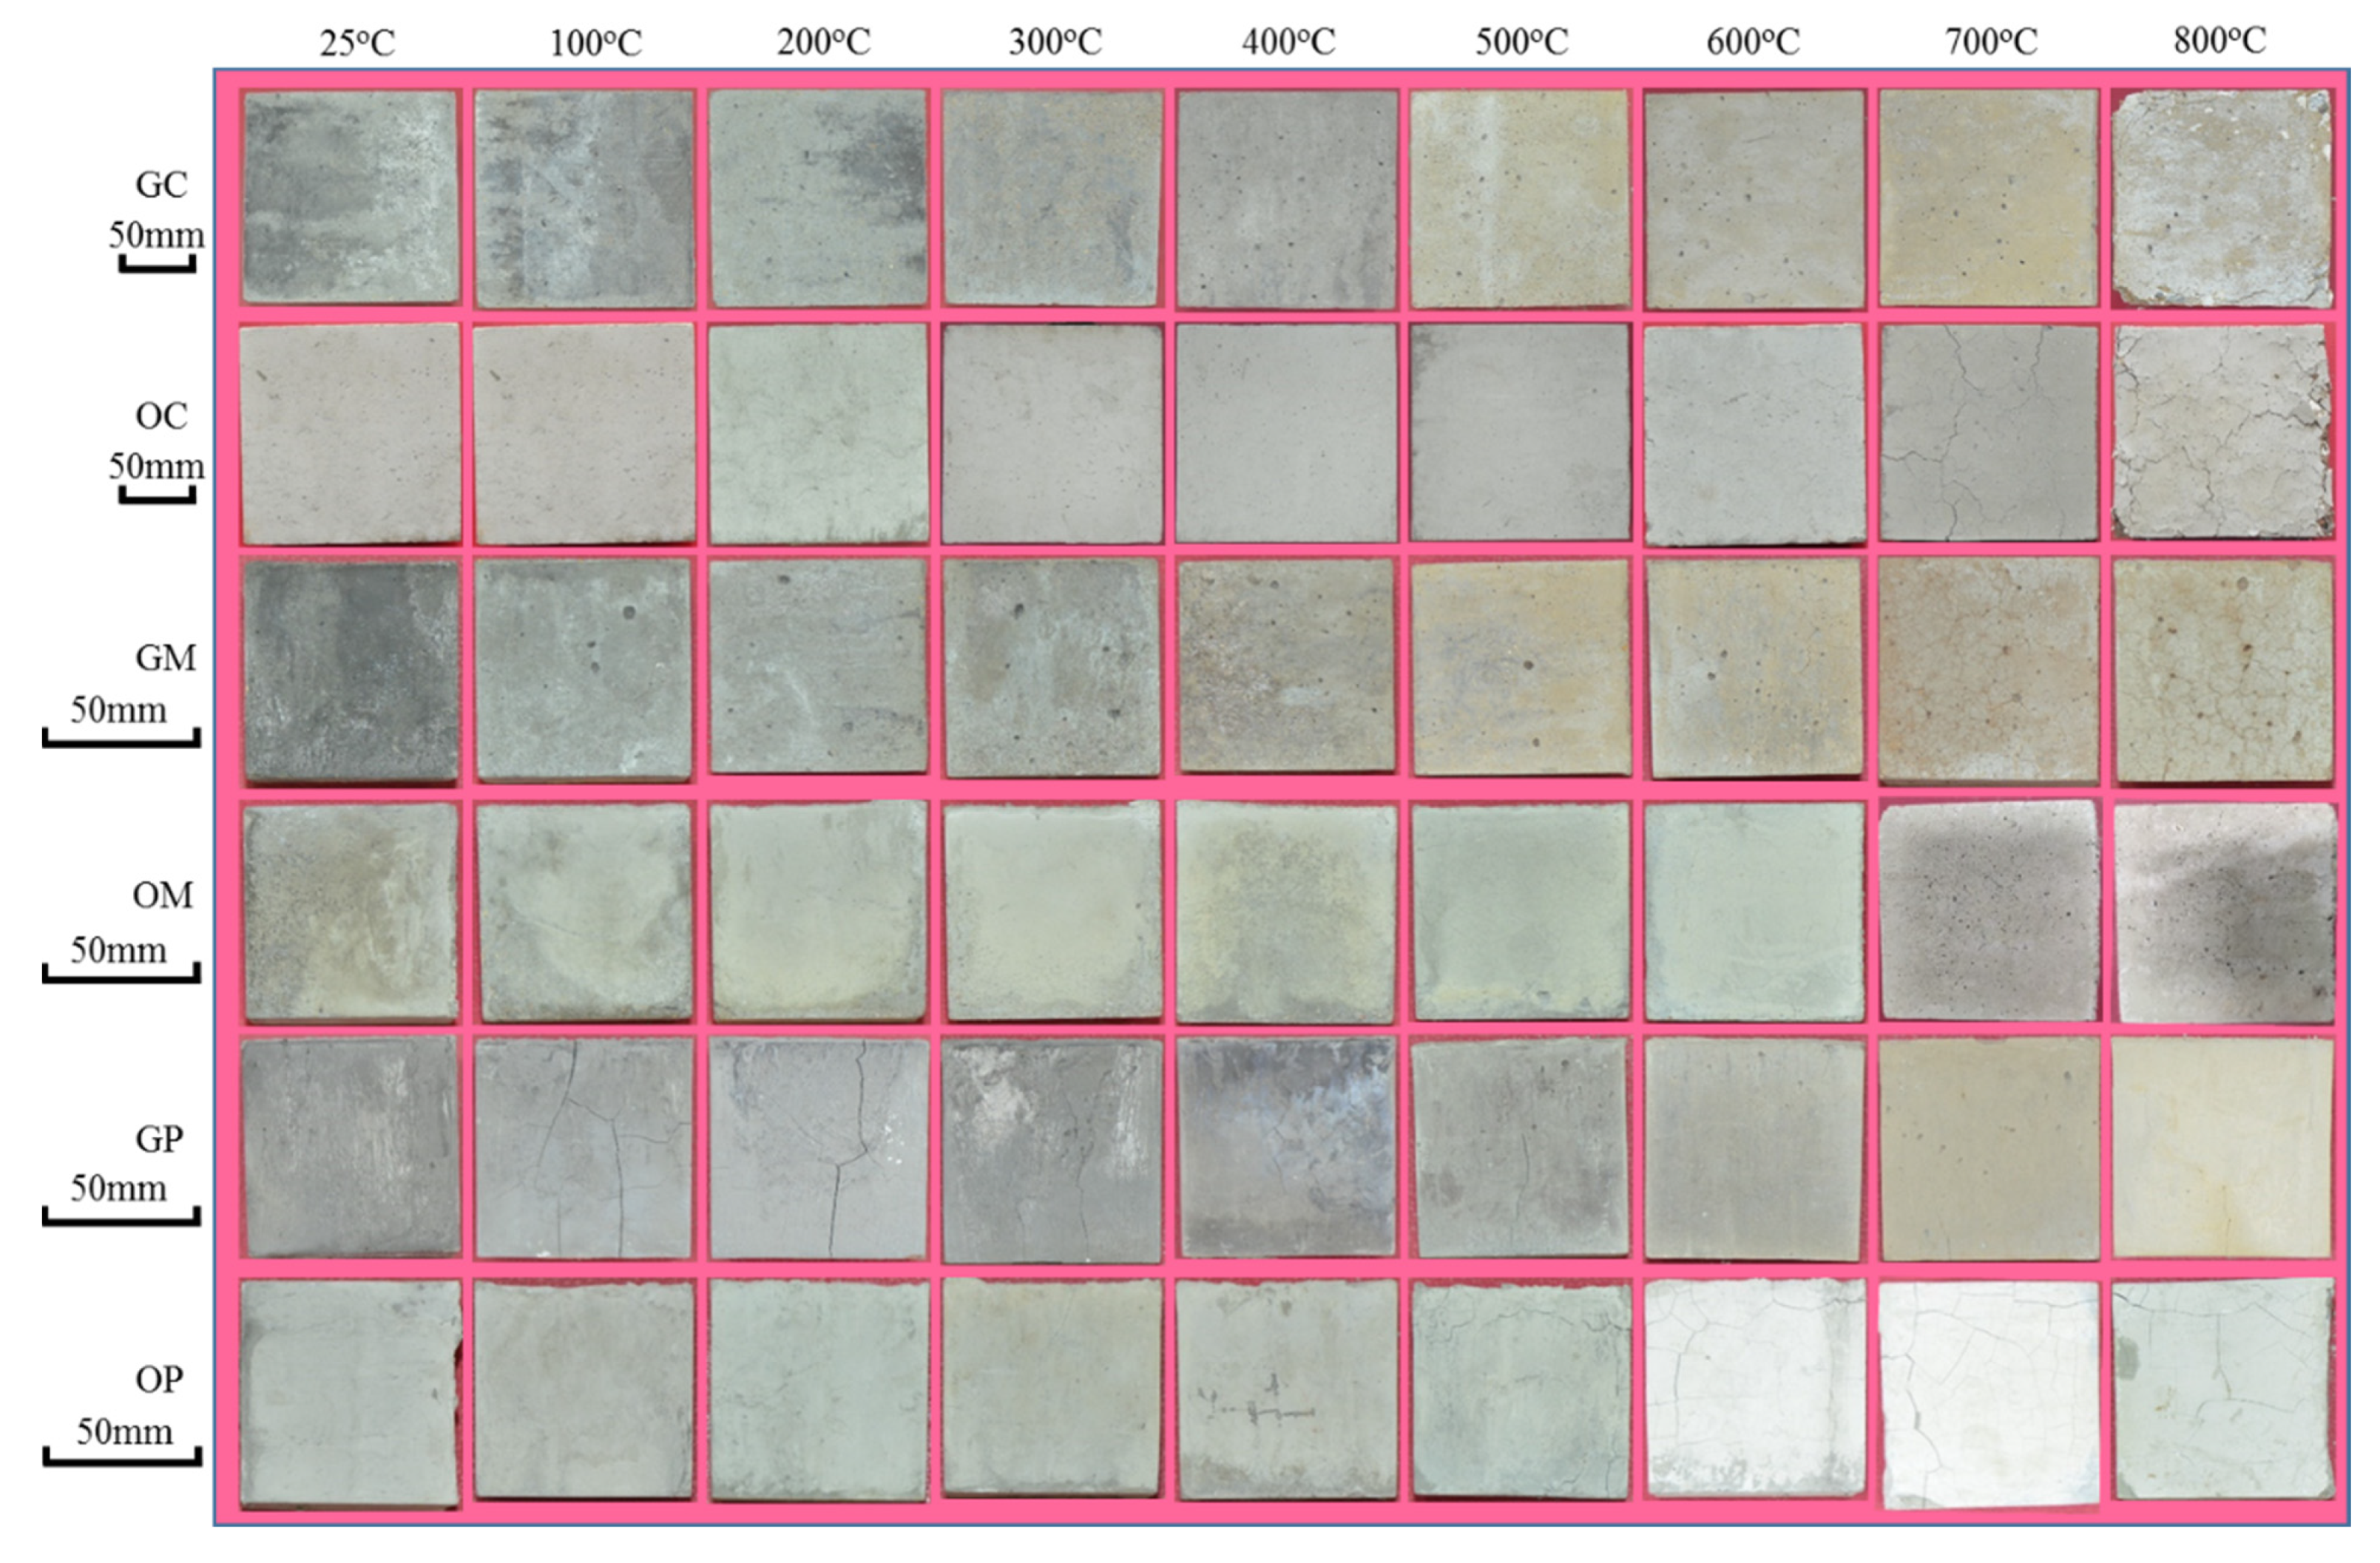
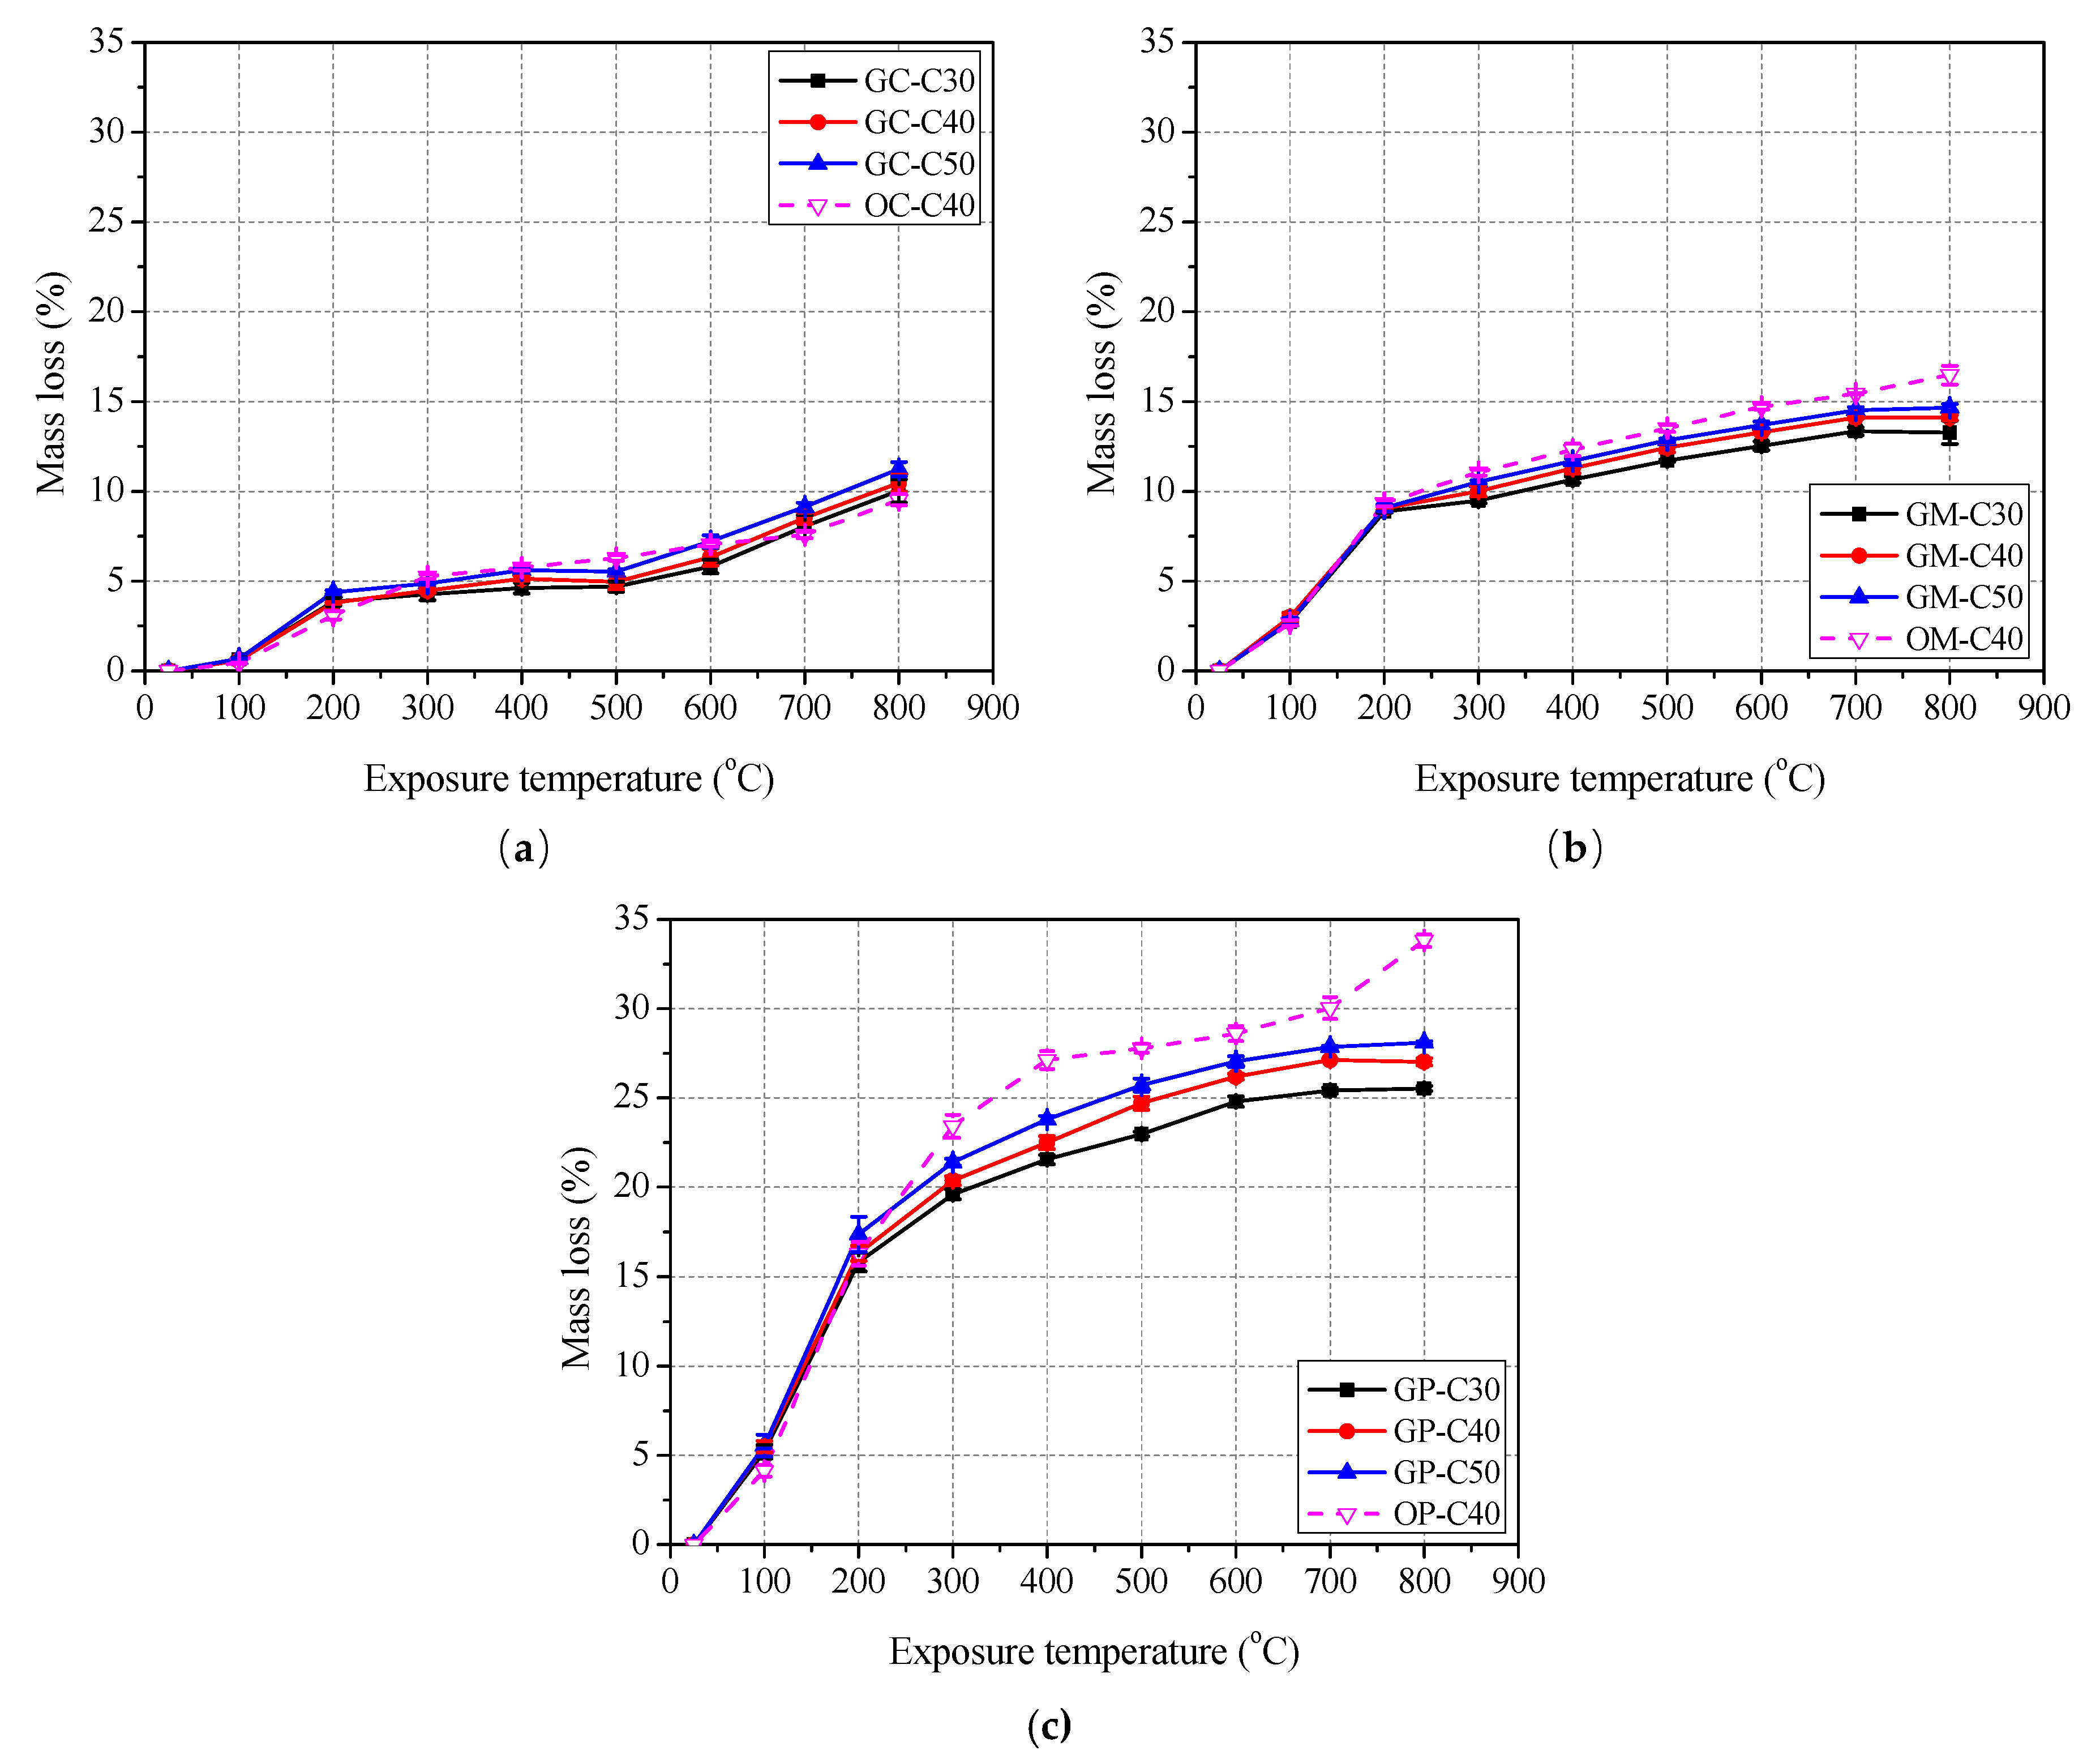
3.2. Surface Morphology and Mass Loss
3.3. Residual Mechanical Properties of Exposed Specimens
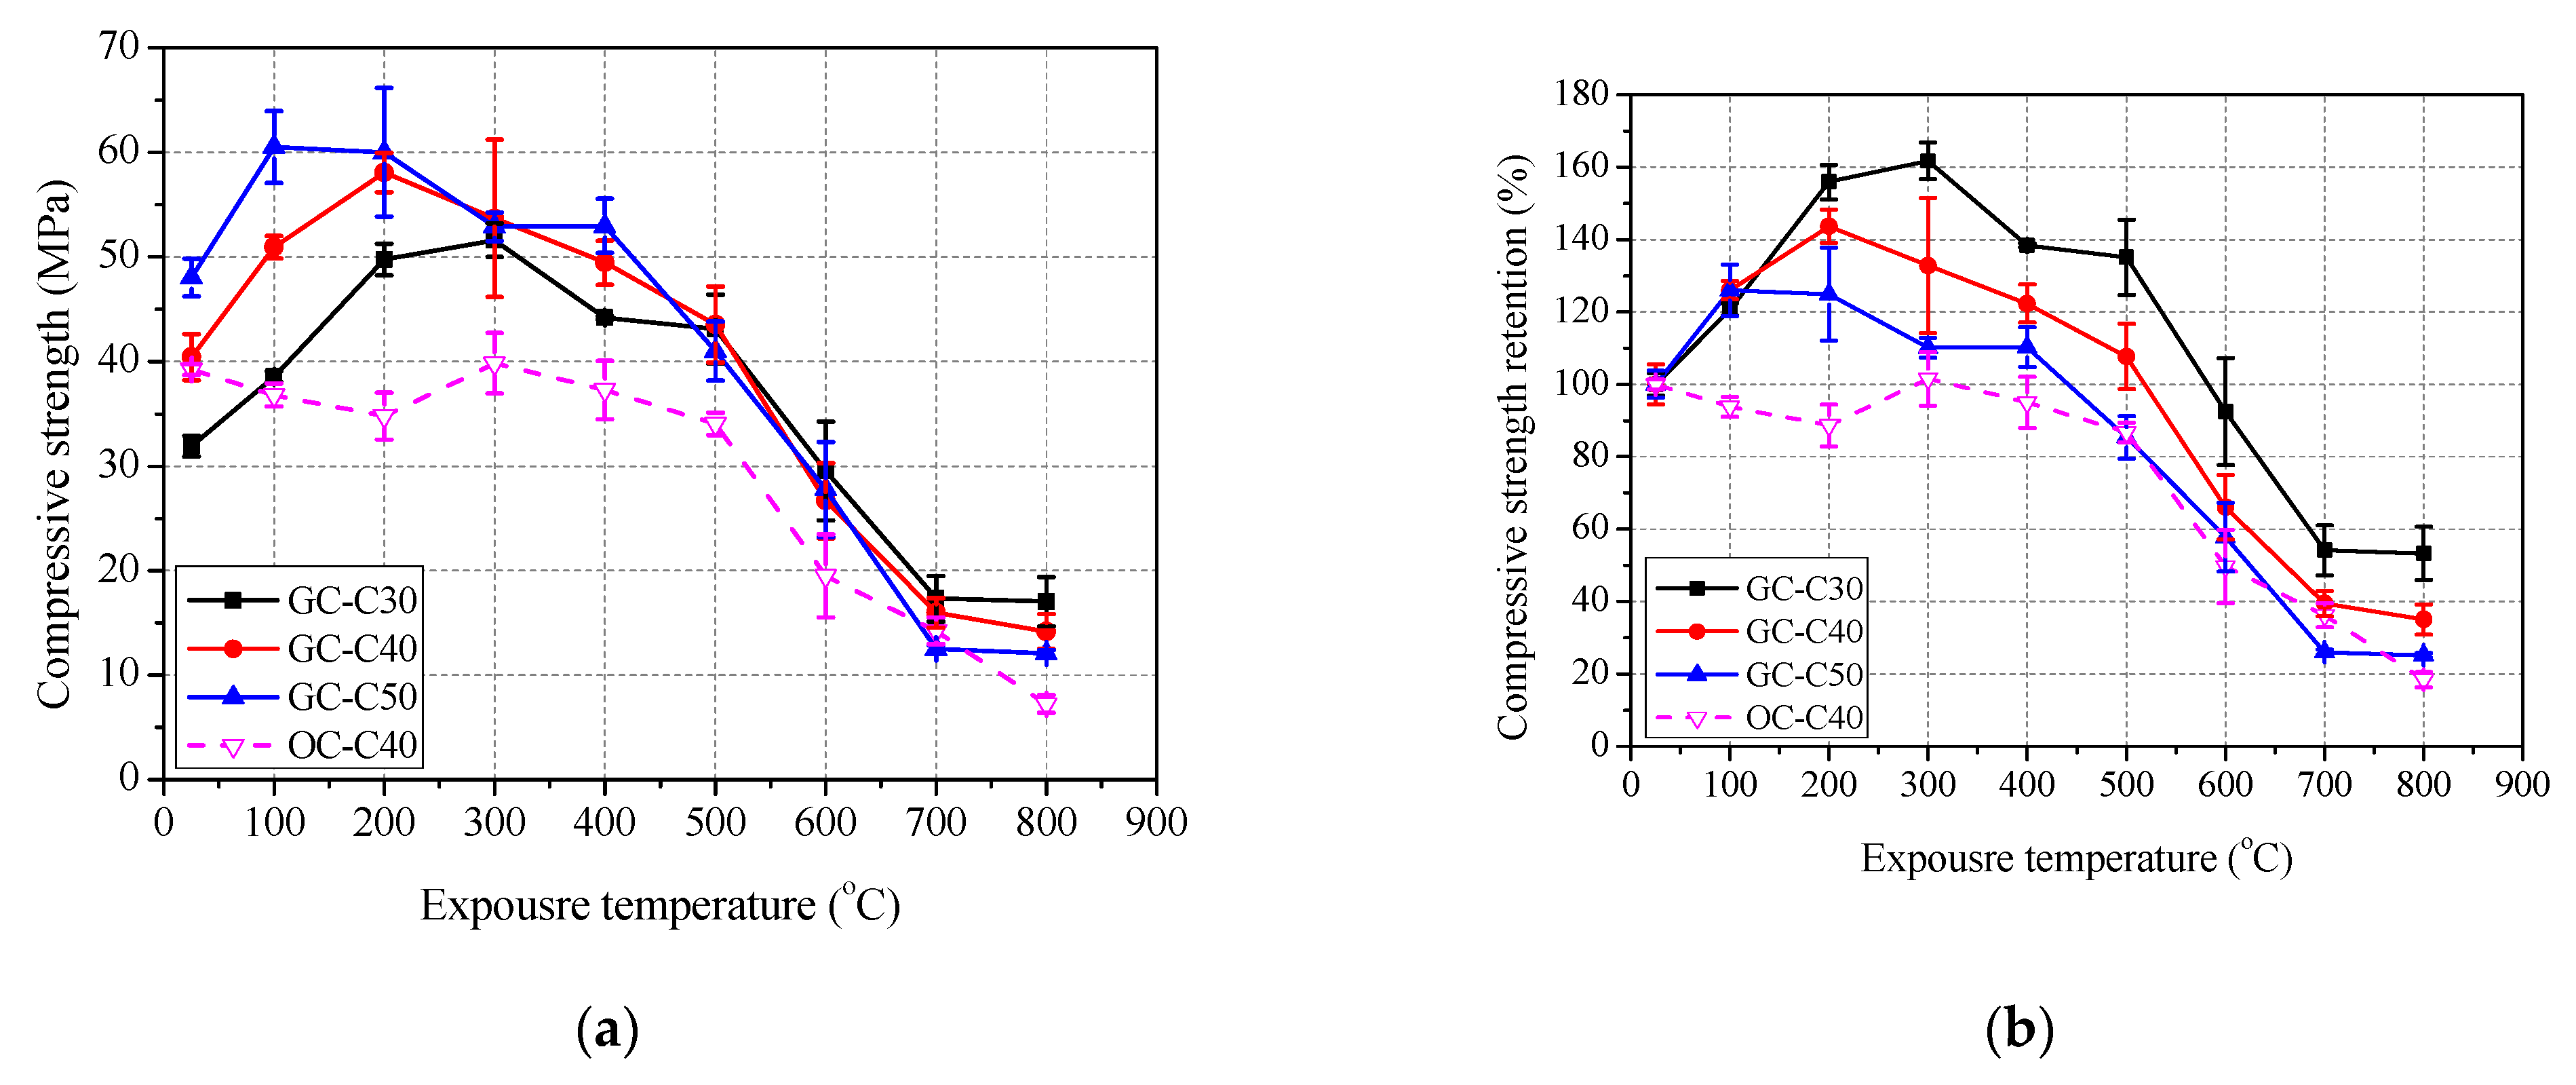
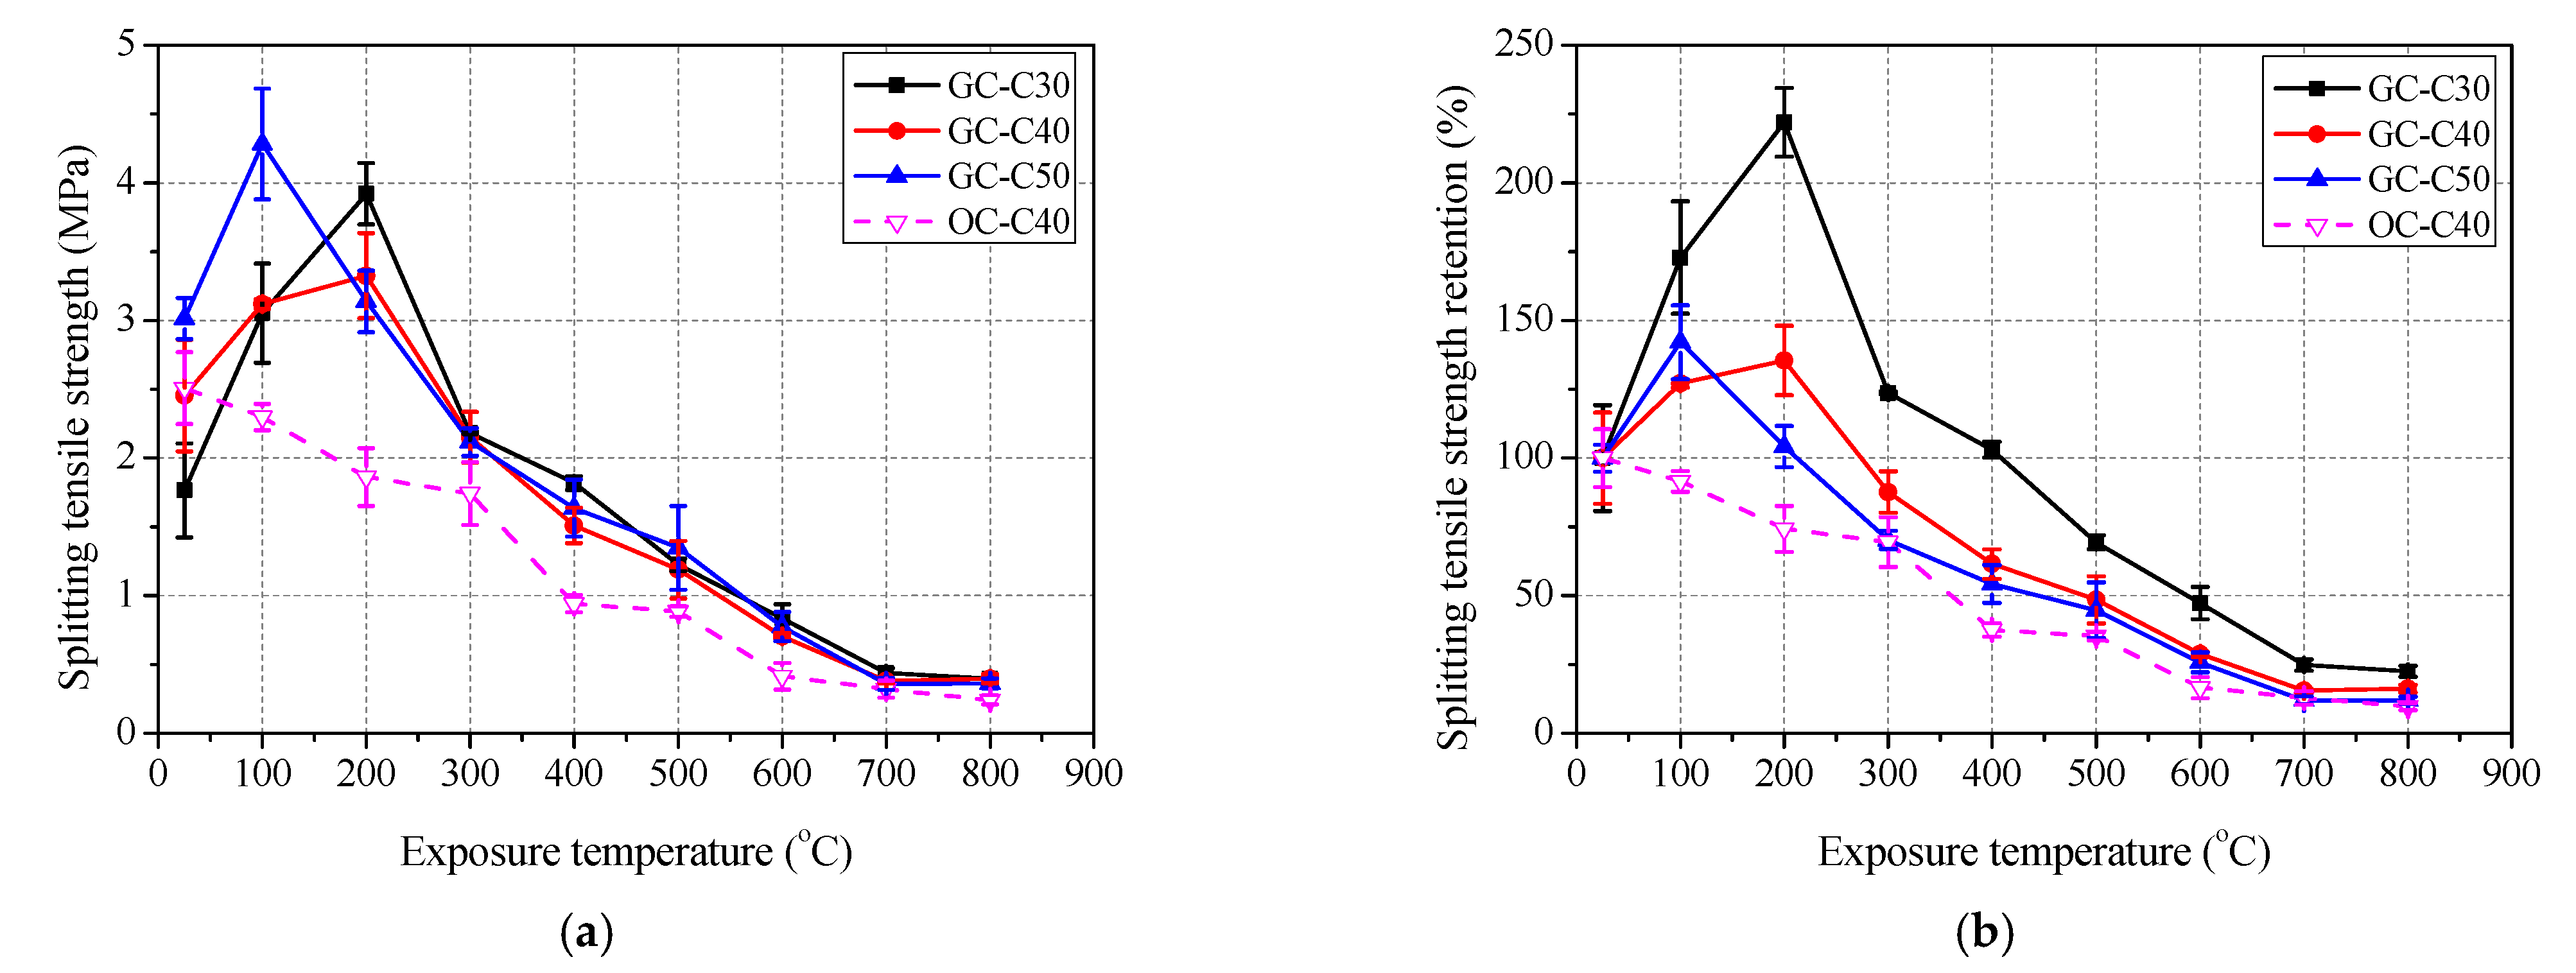
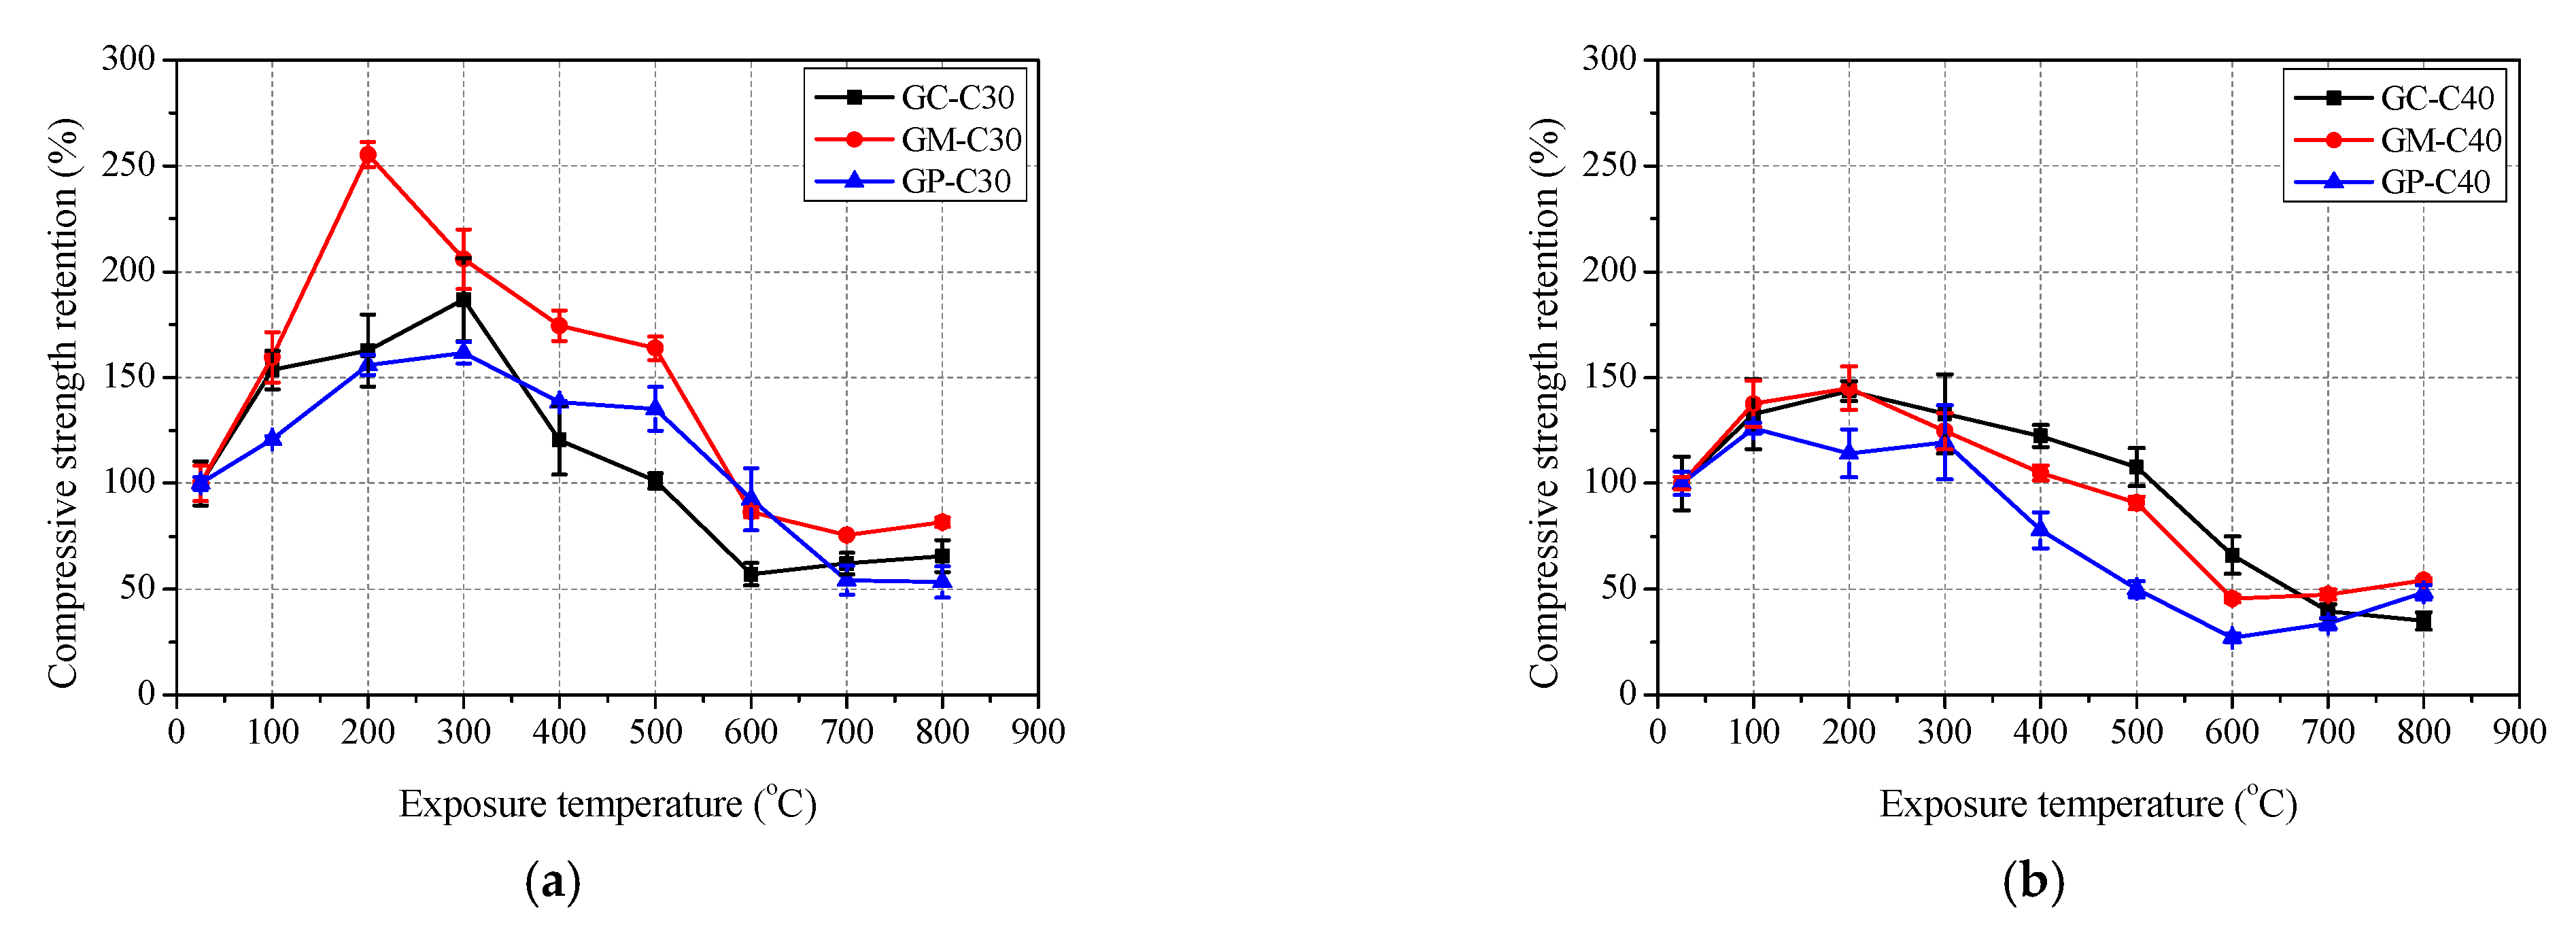
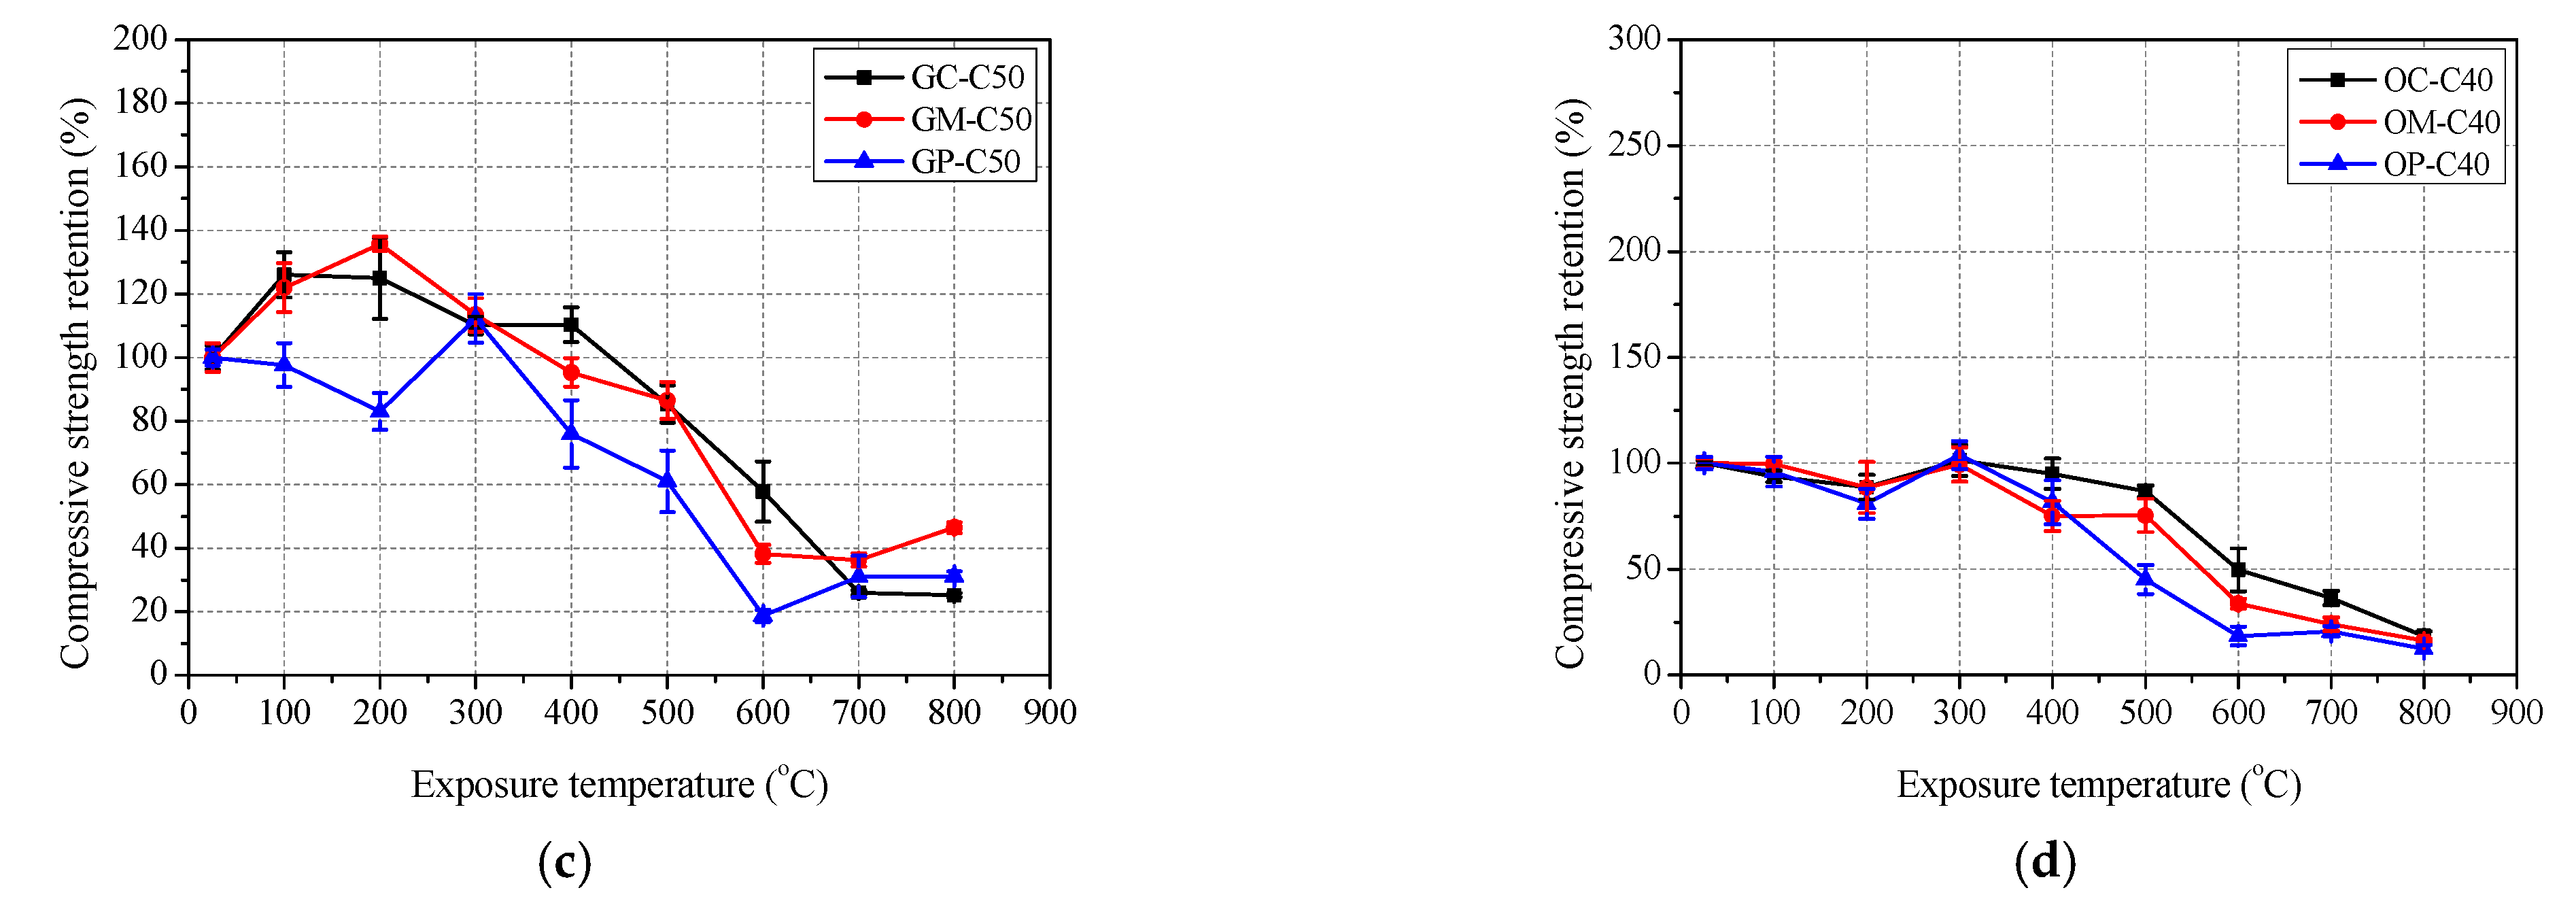
3.3.1. Concrete
3.3.2. Mortar
3.3.3. Paste
3.3.4. Comparison of Concrete, Mortar and Paste
3.4. Mineralogical and Micro-Structural Prosperities
3.4.1. TGA/DSC Results
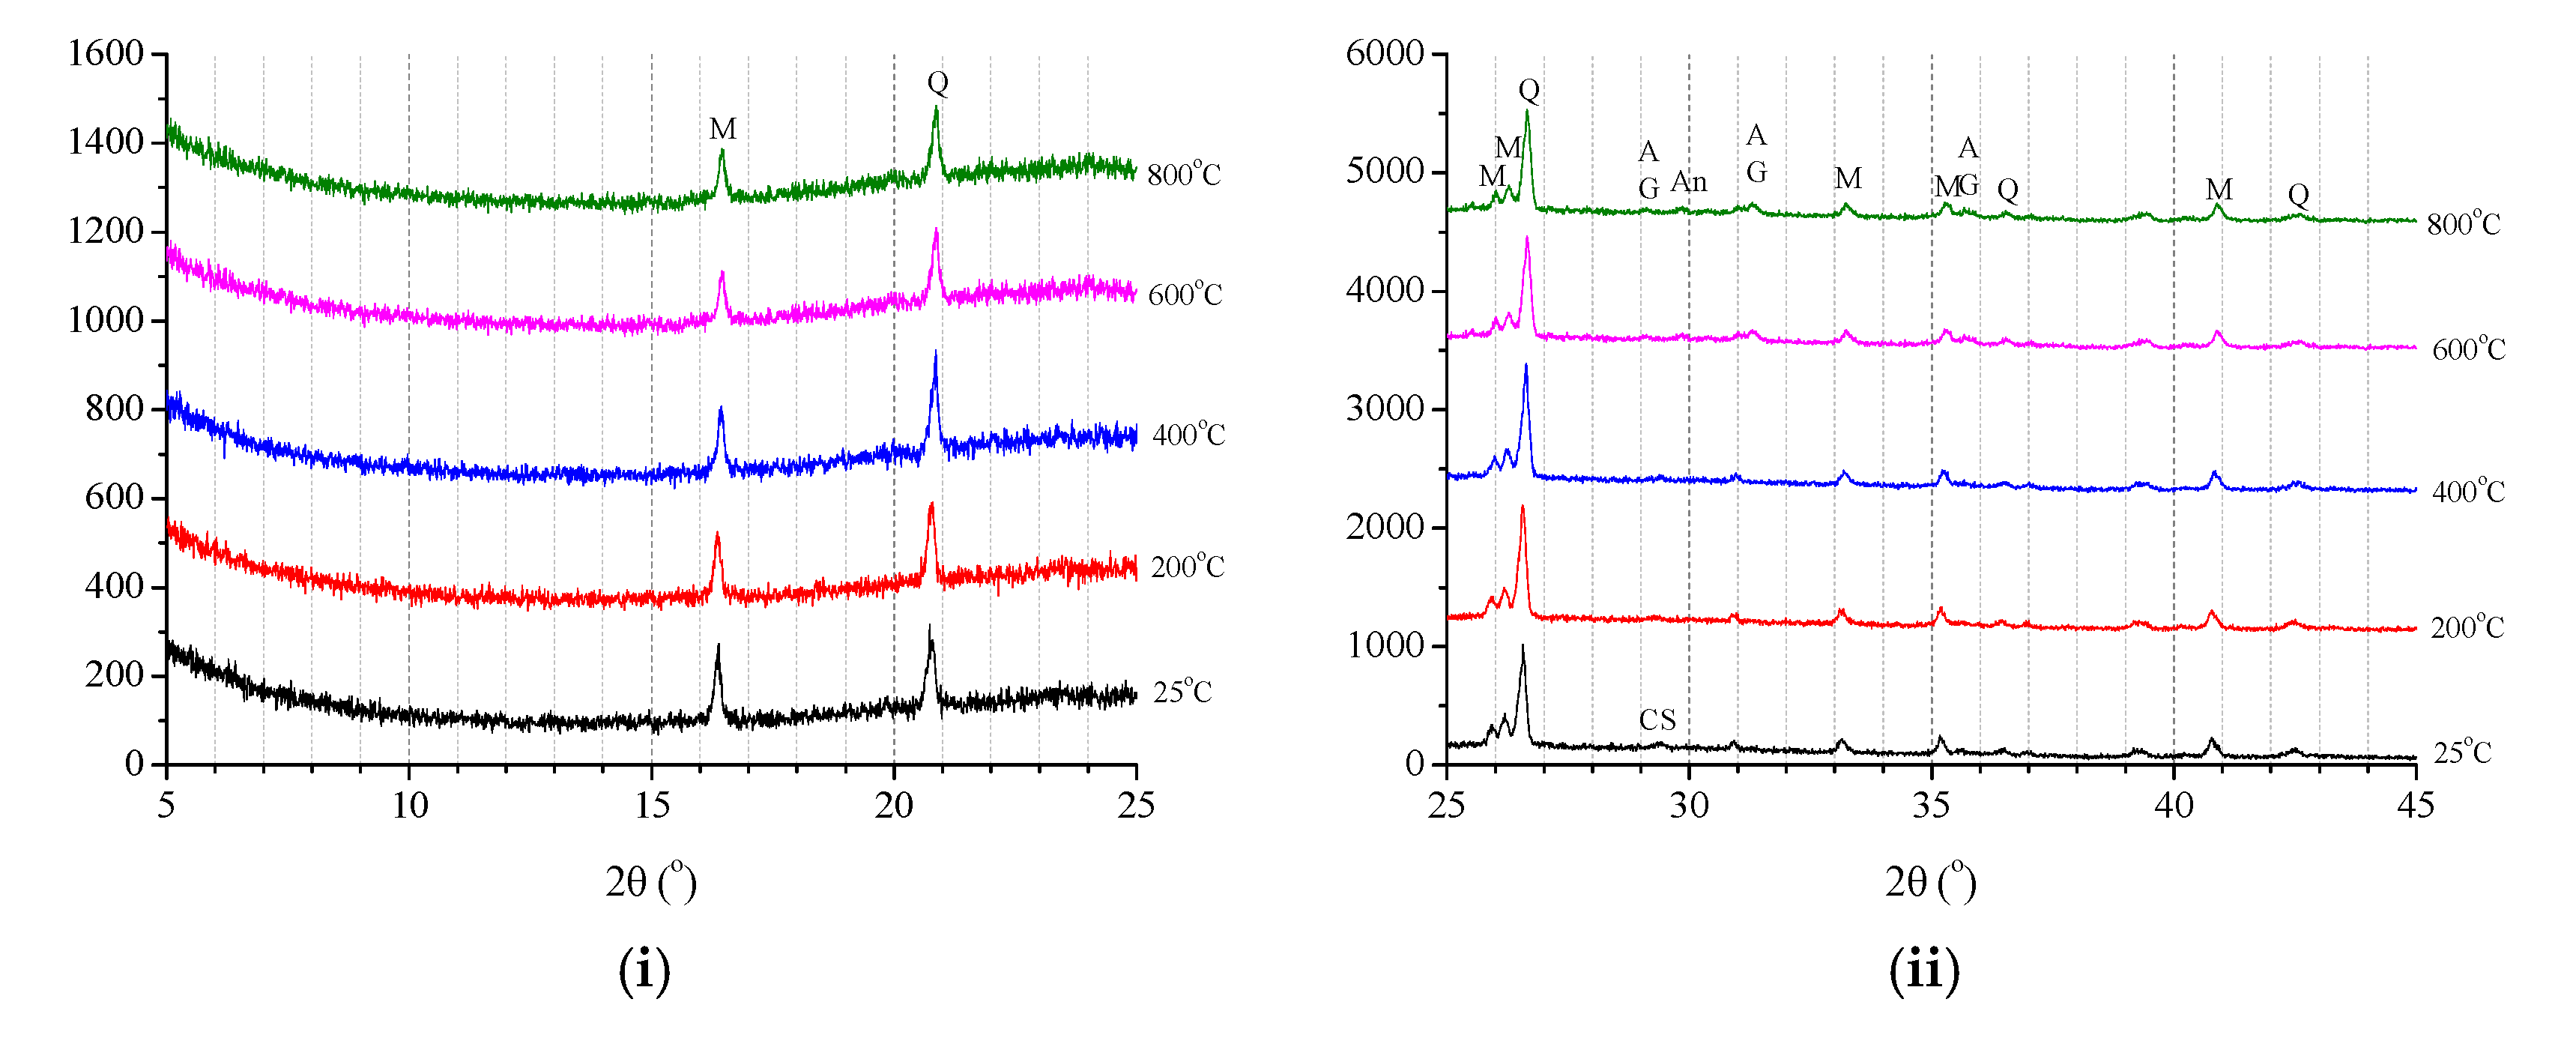
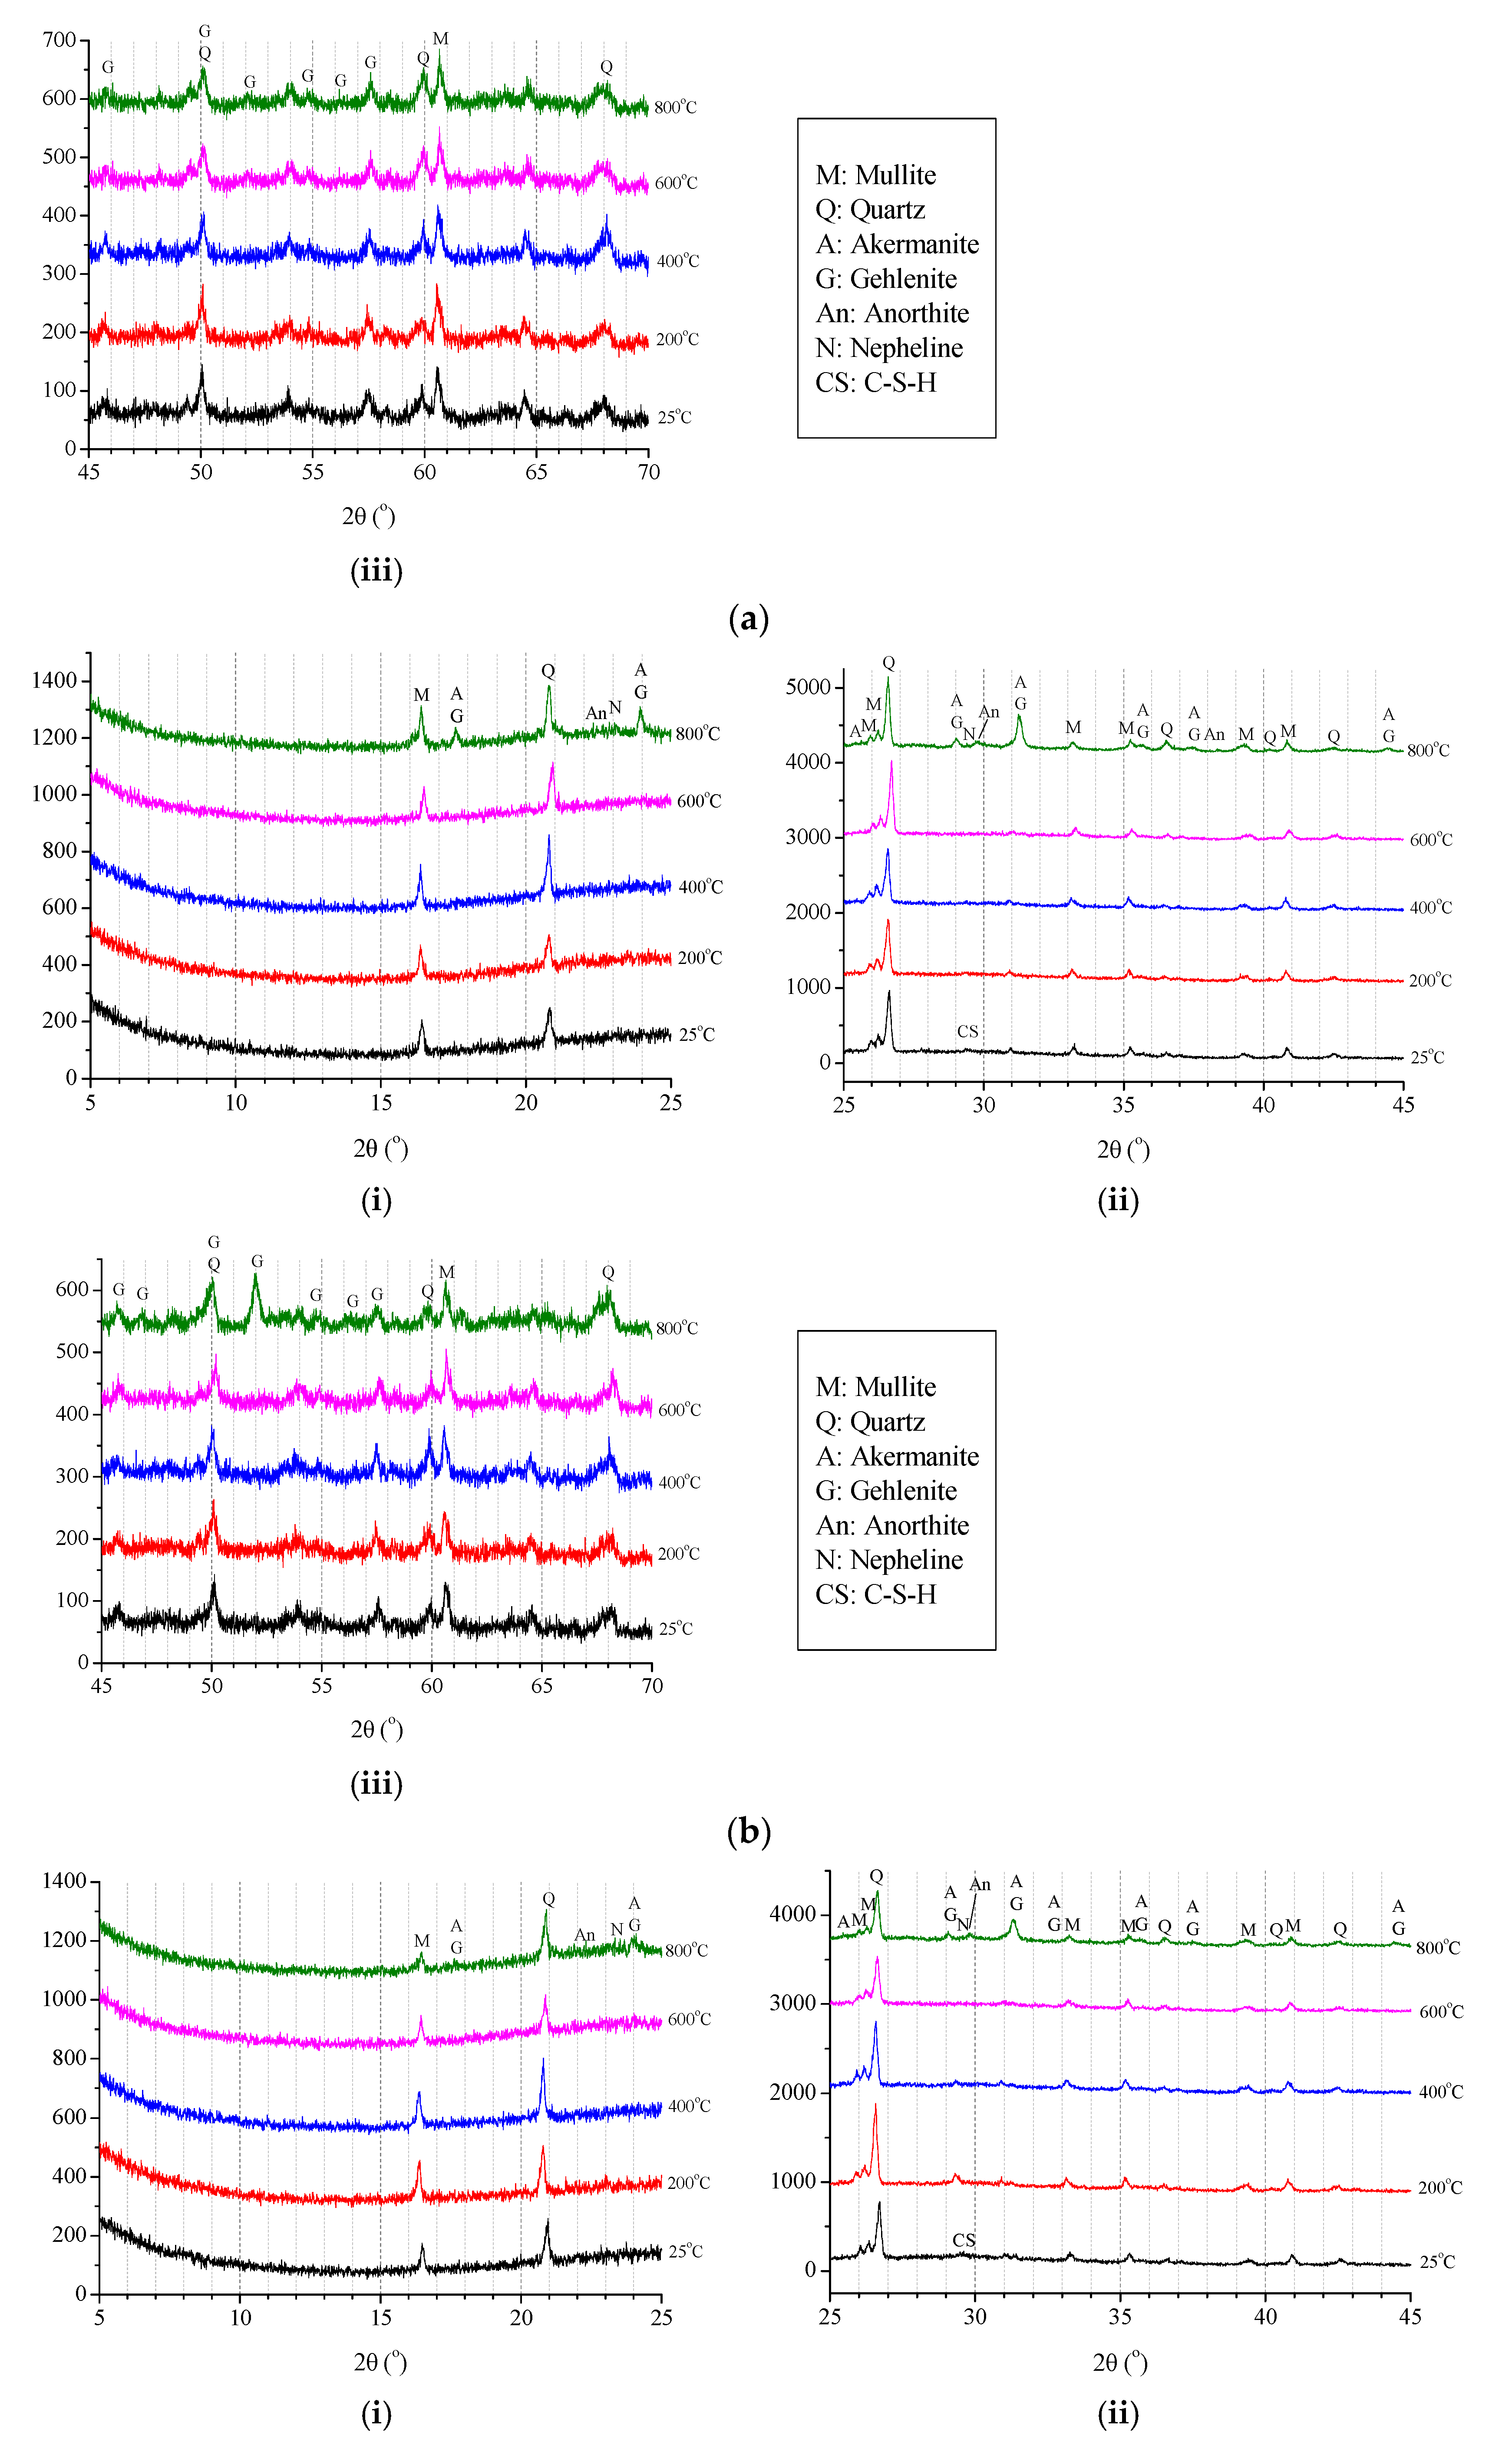
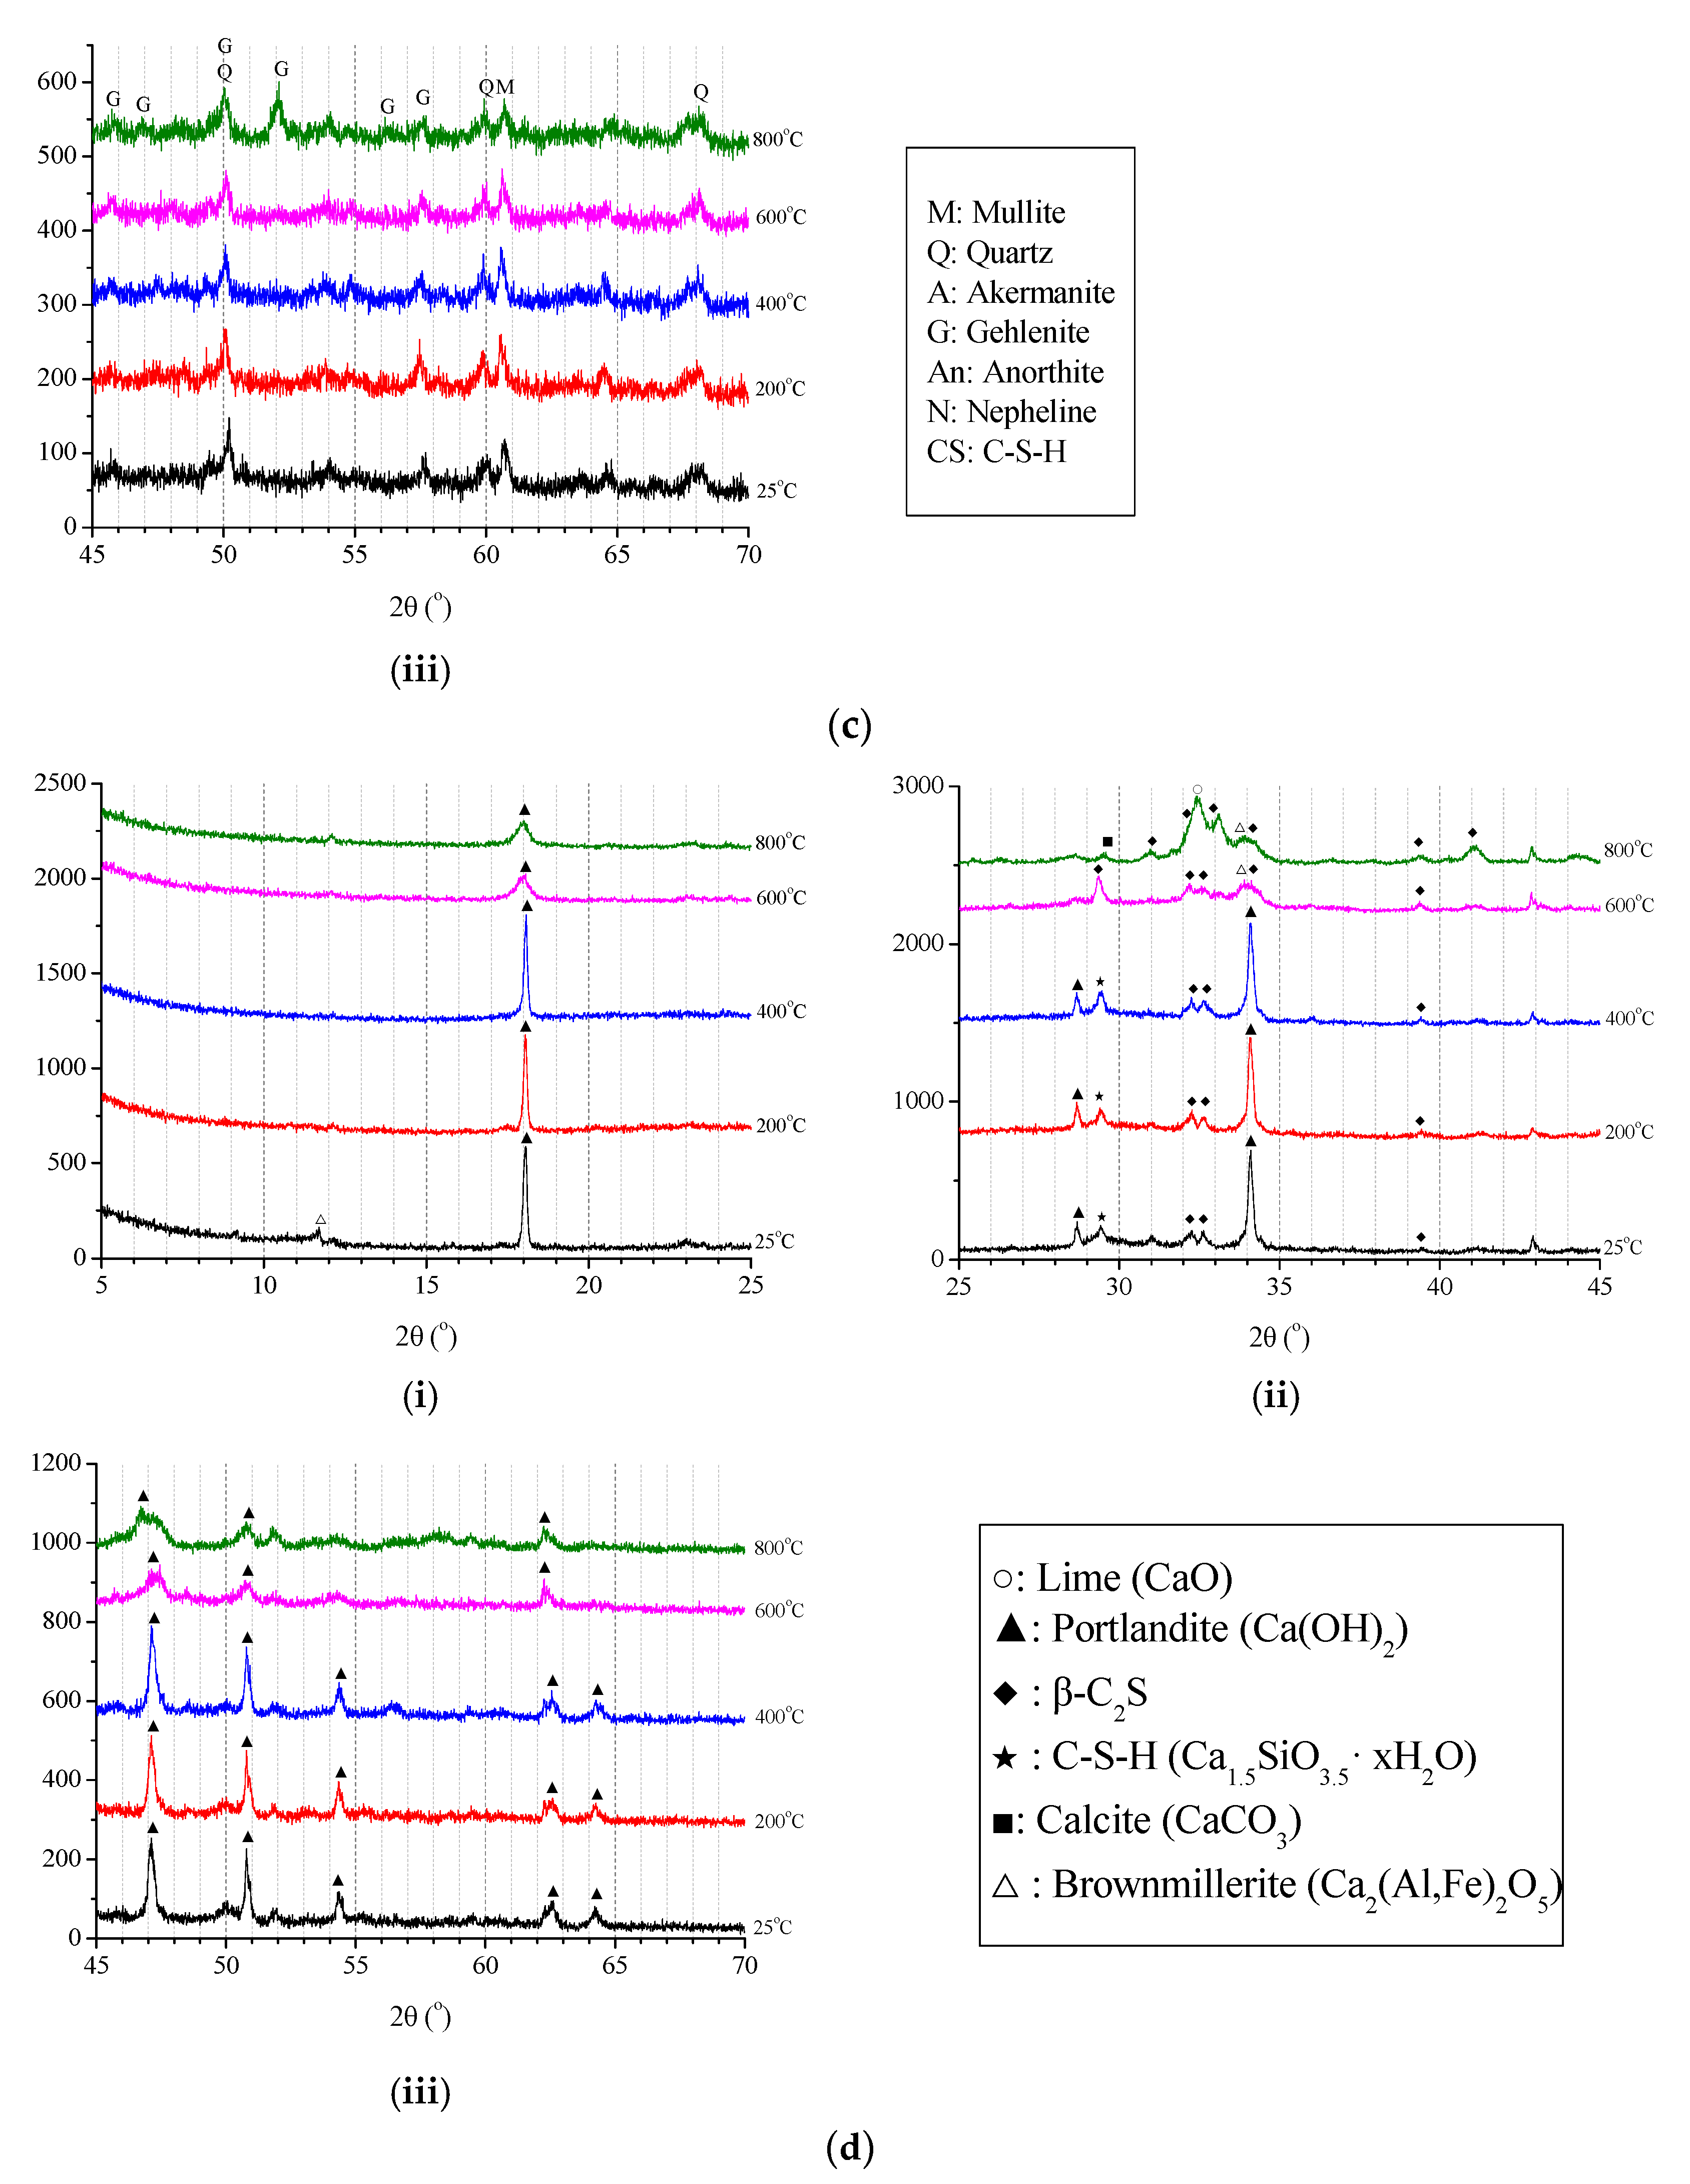
3.4.2. XRD Results
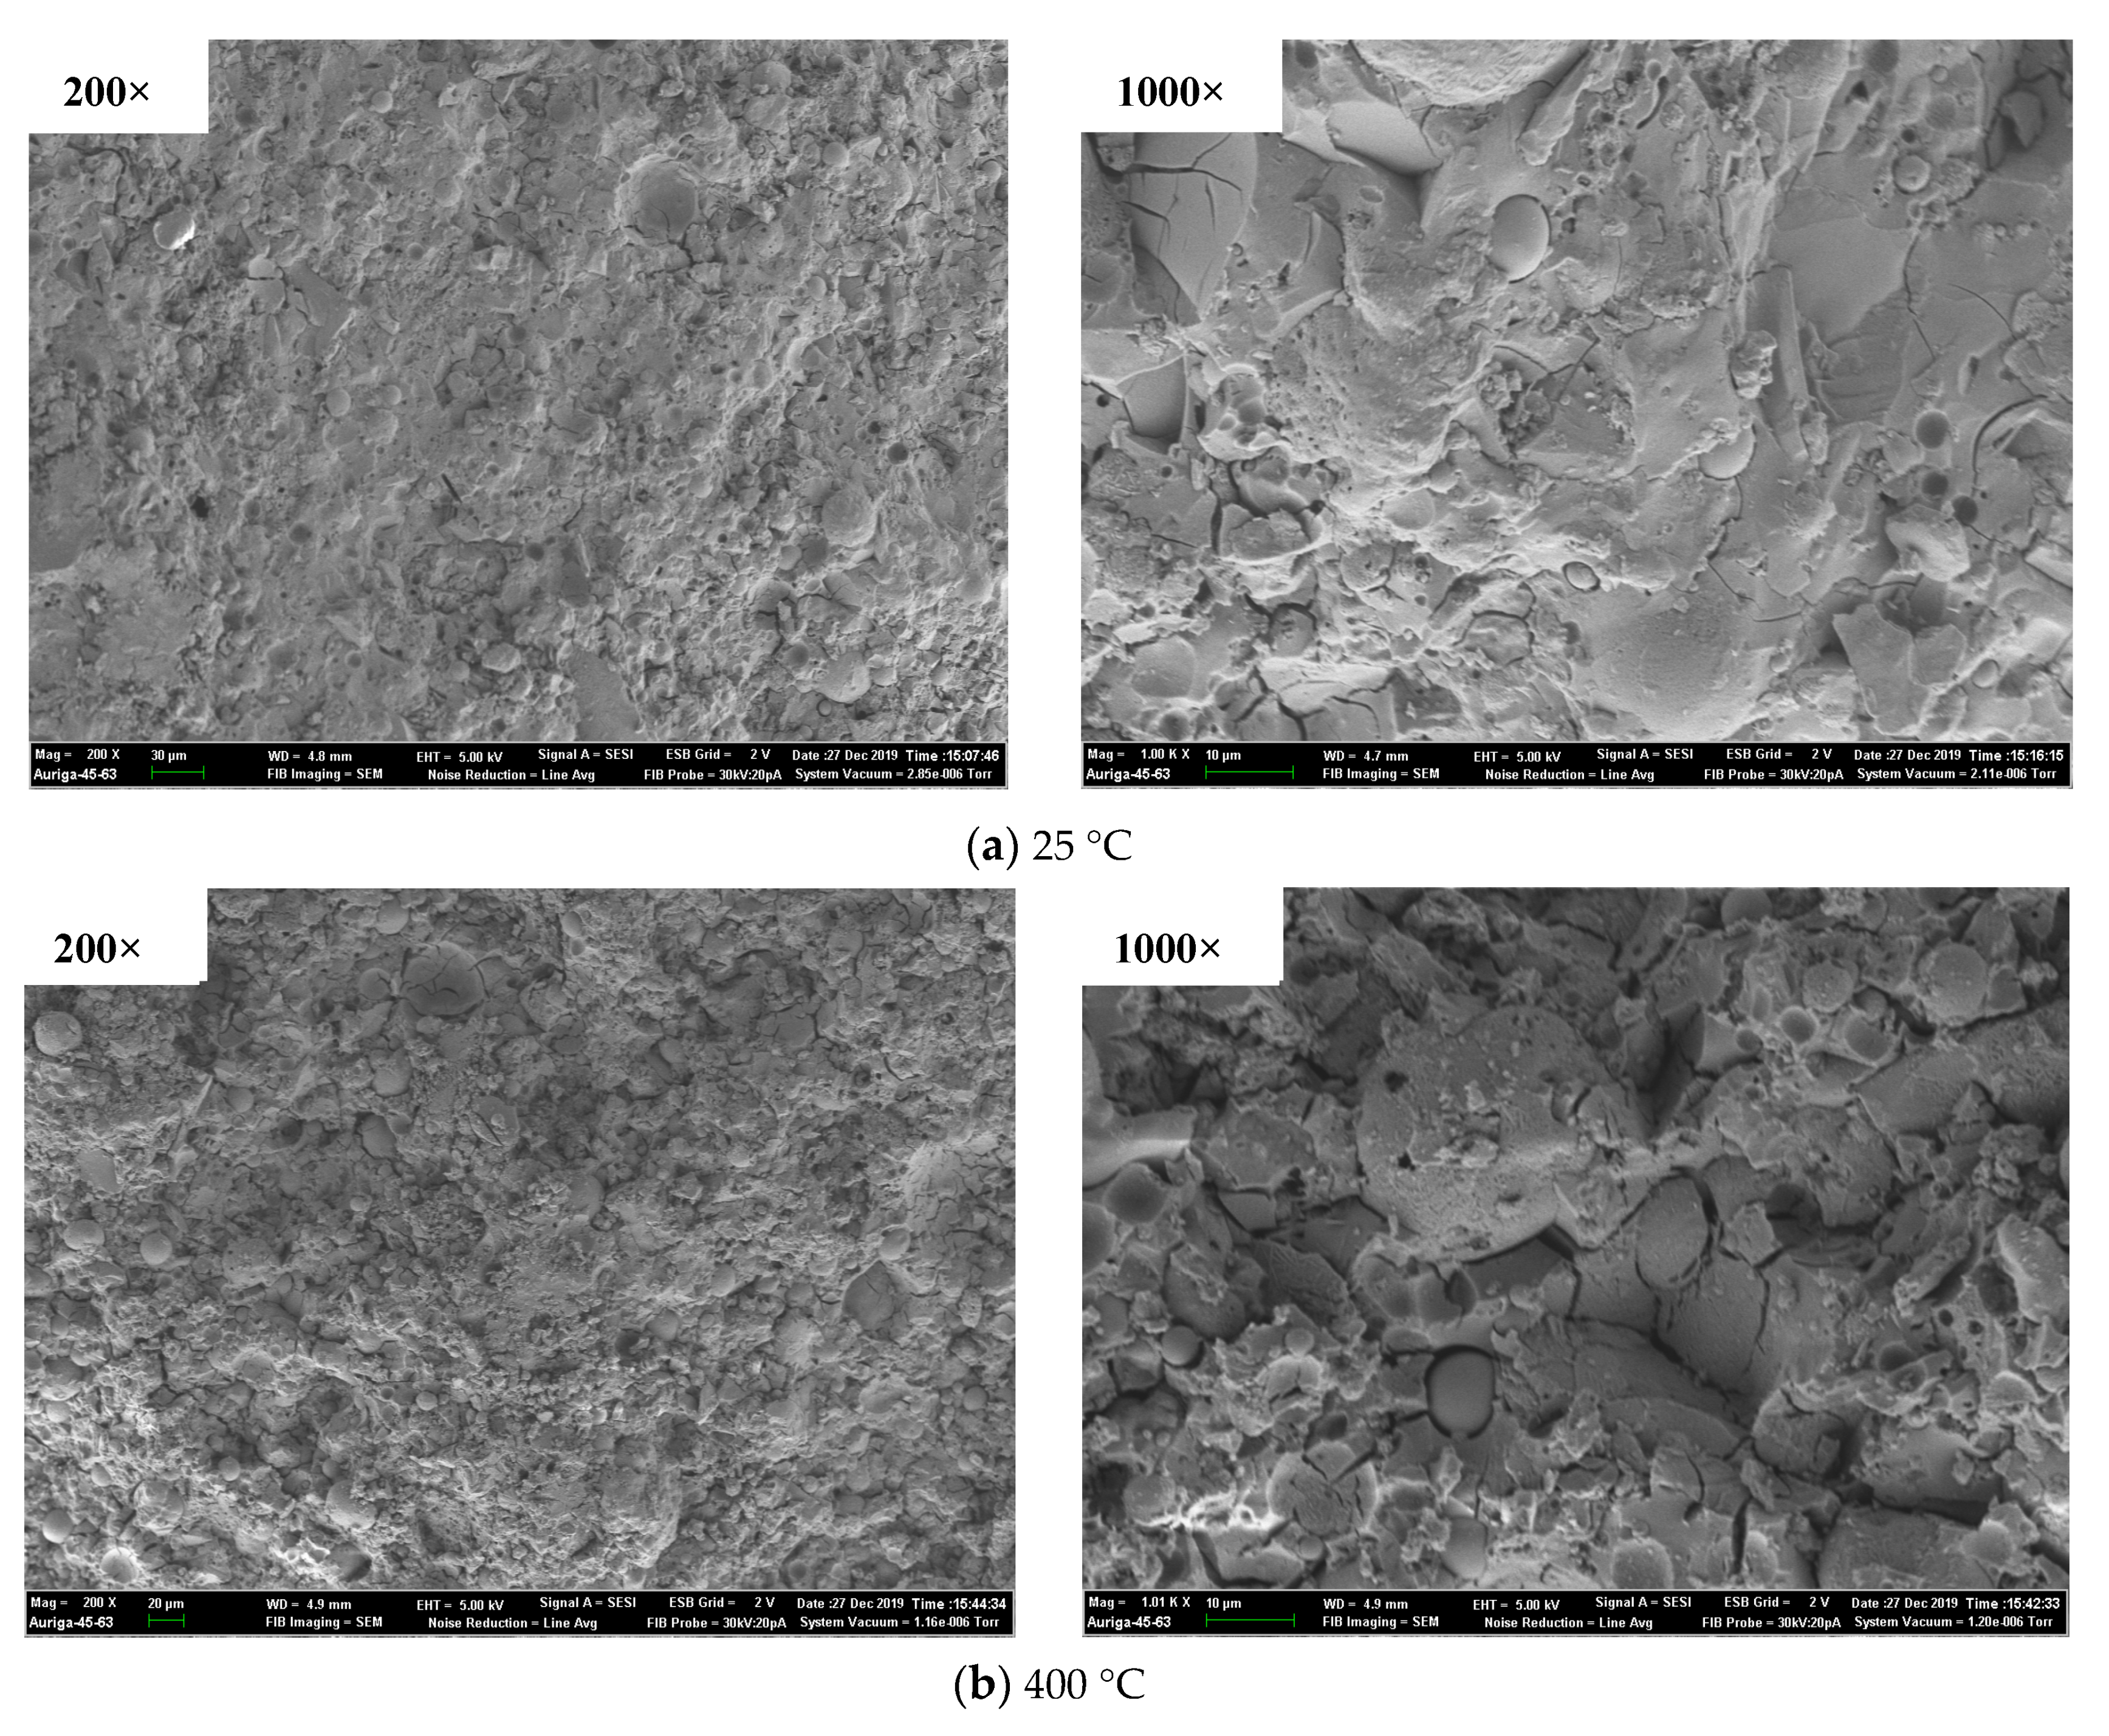
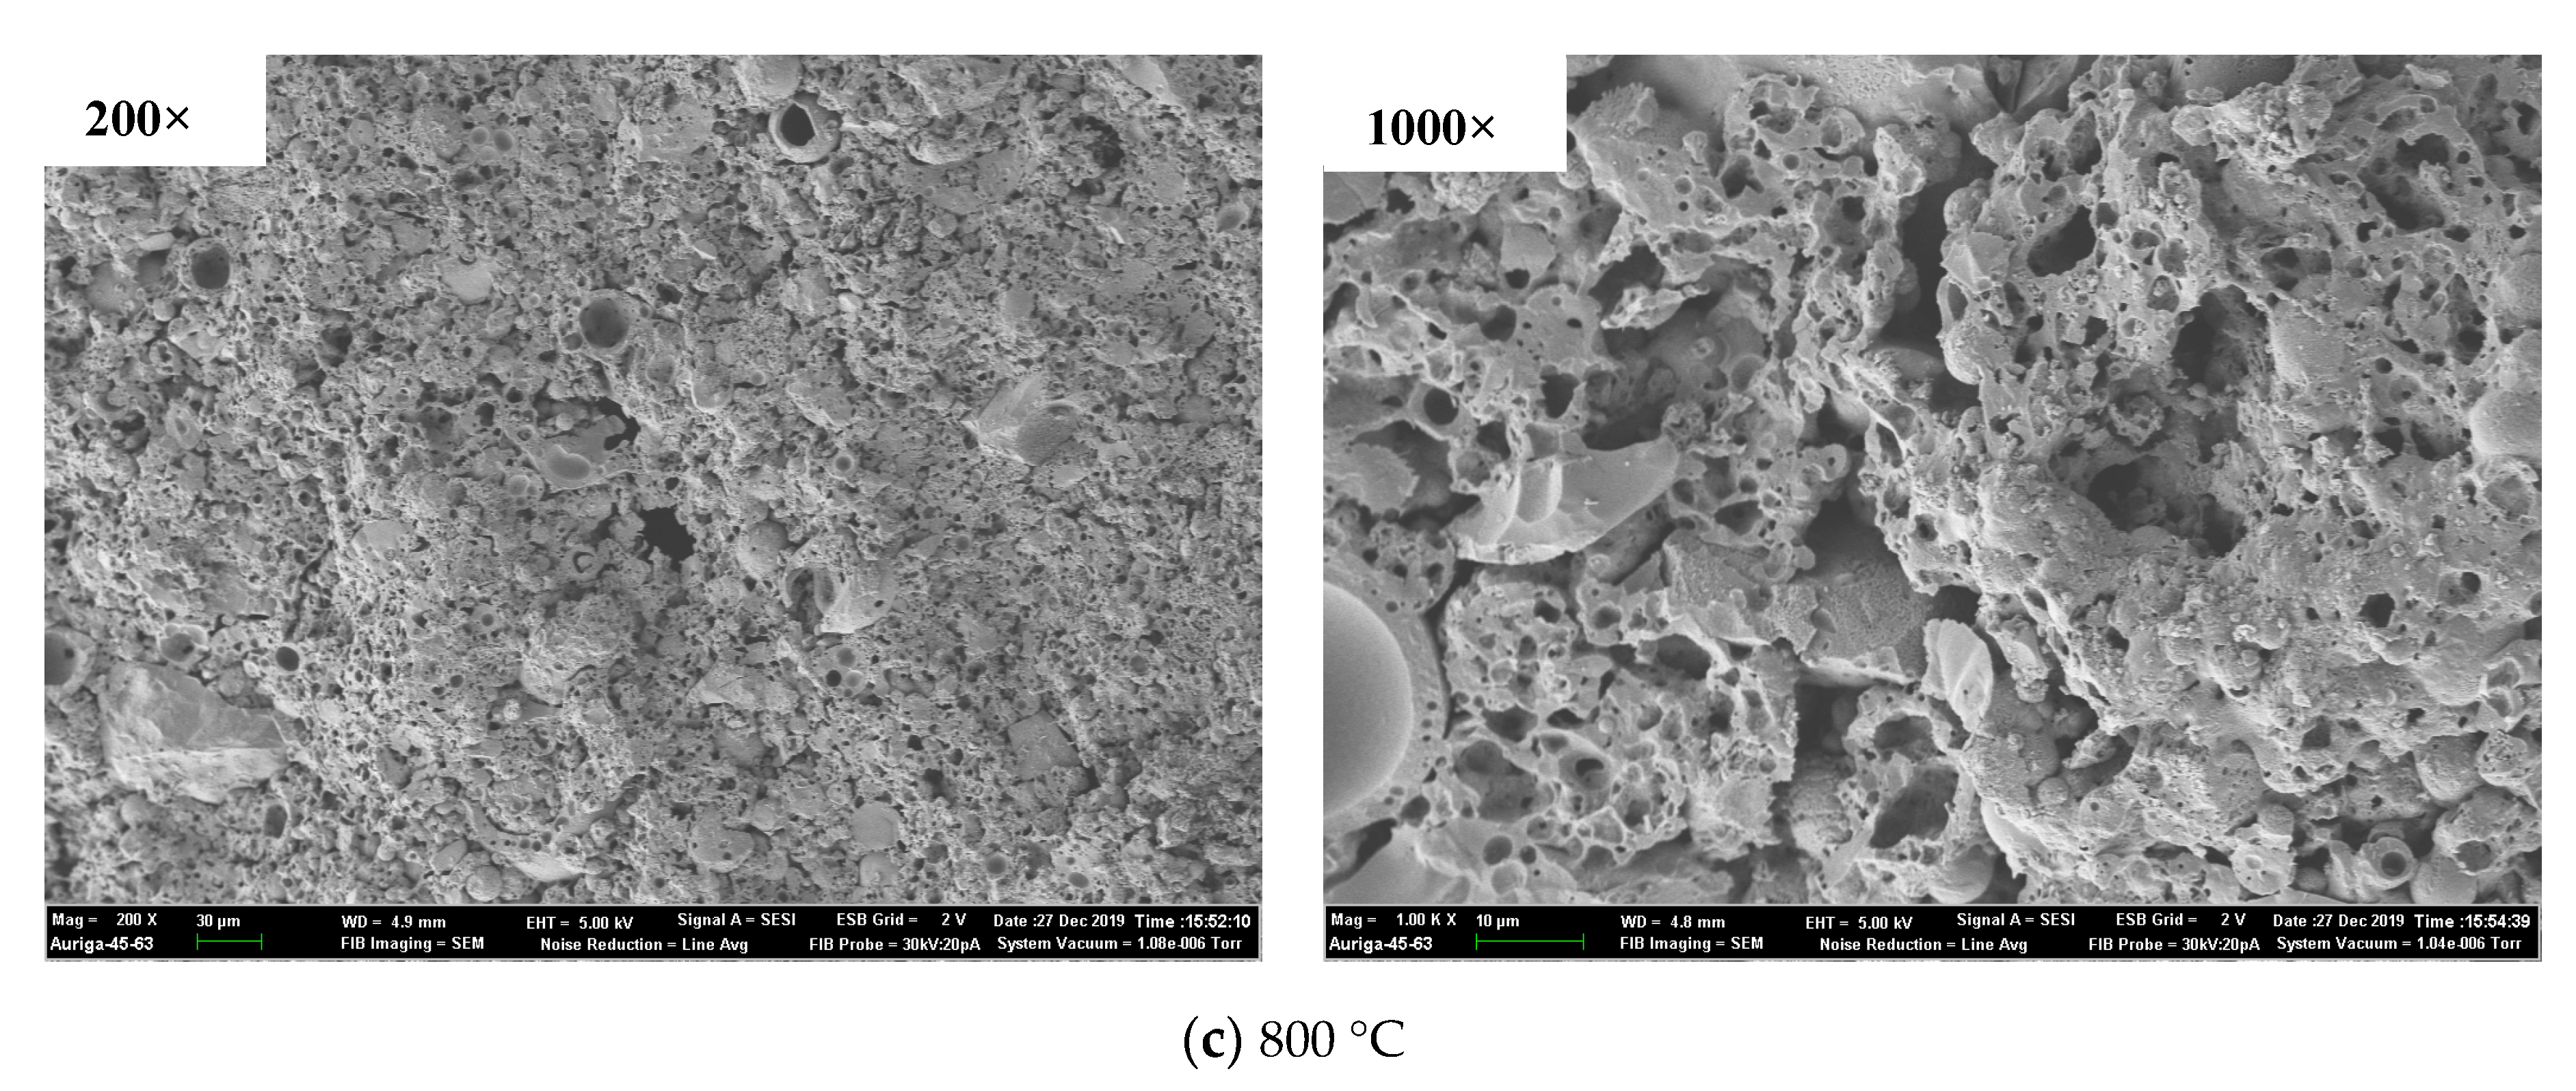
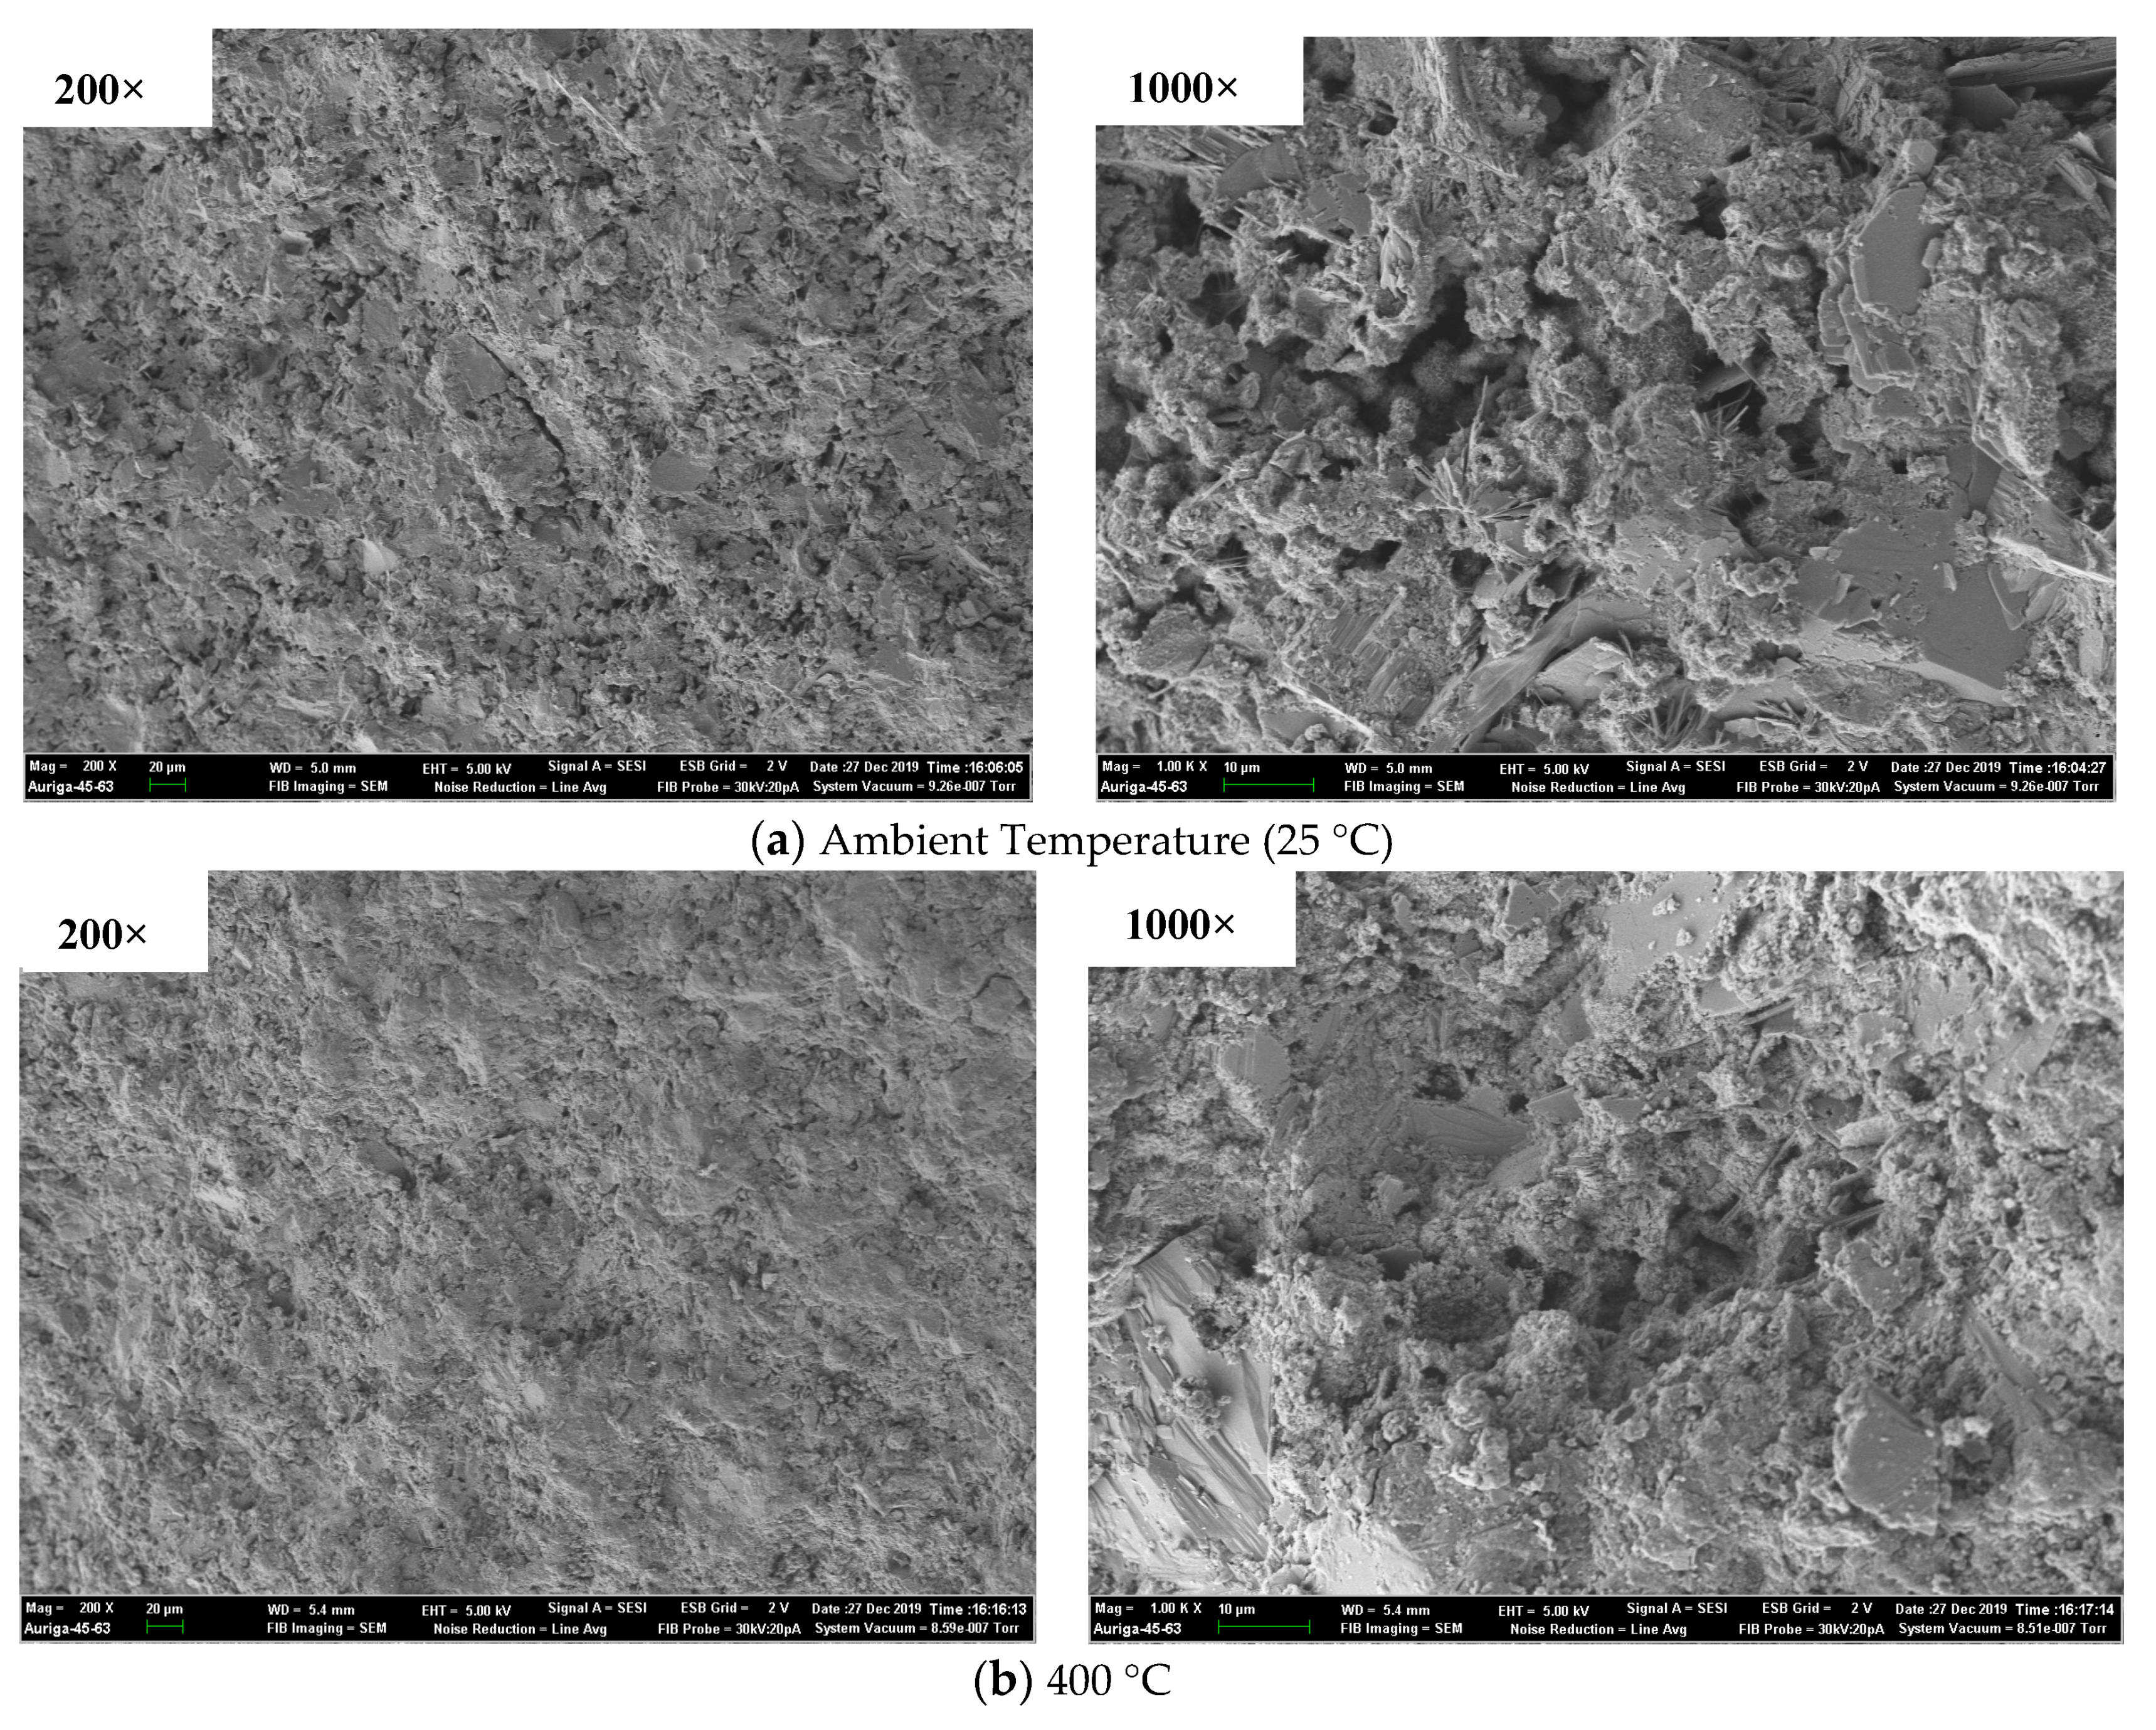
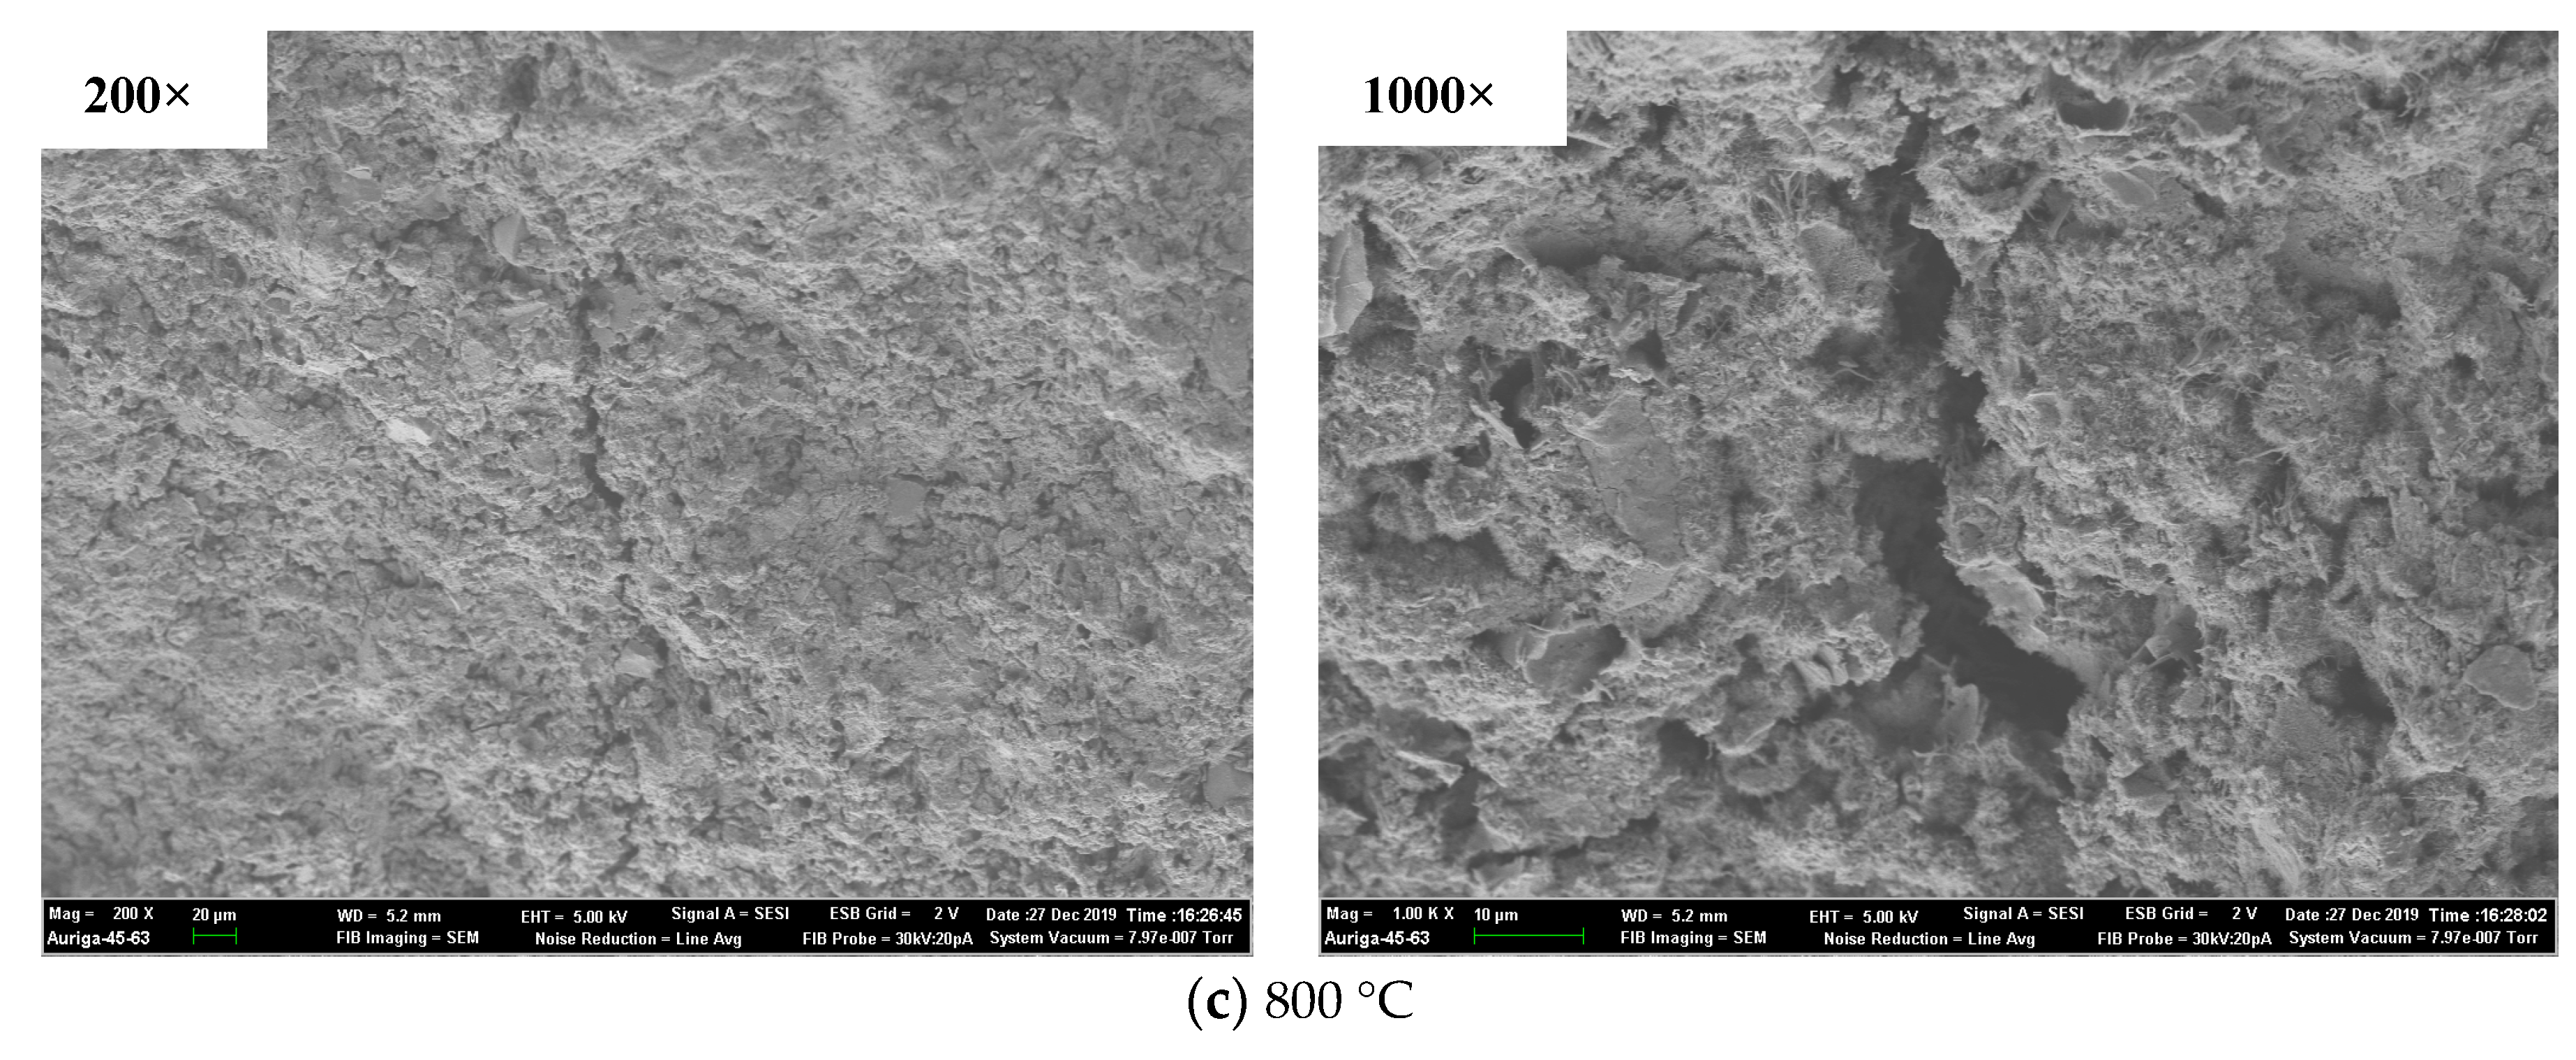
3.4.3. SEM results
4. Conclusions
- (1)
- Different from ordinary concrete, mortar and paste, after 28 days, the compressive strength of geopolymer concrete, mortar and paste still increases significantly and the strengths of C40 geopolymer concrete, mortar and paste are significantly higher than that of C40 ordinary geopolymer concrete, mortar and paste.
- (2)
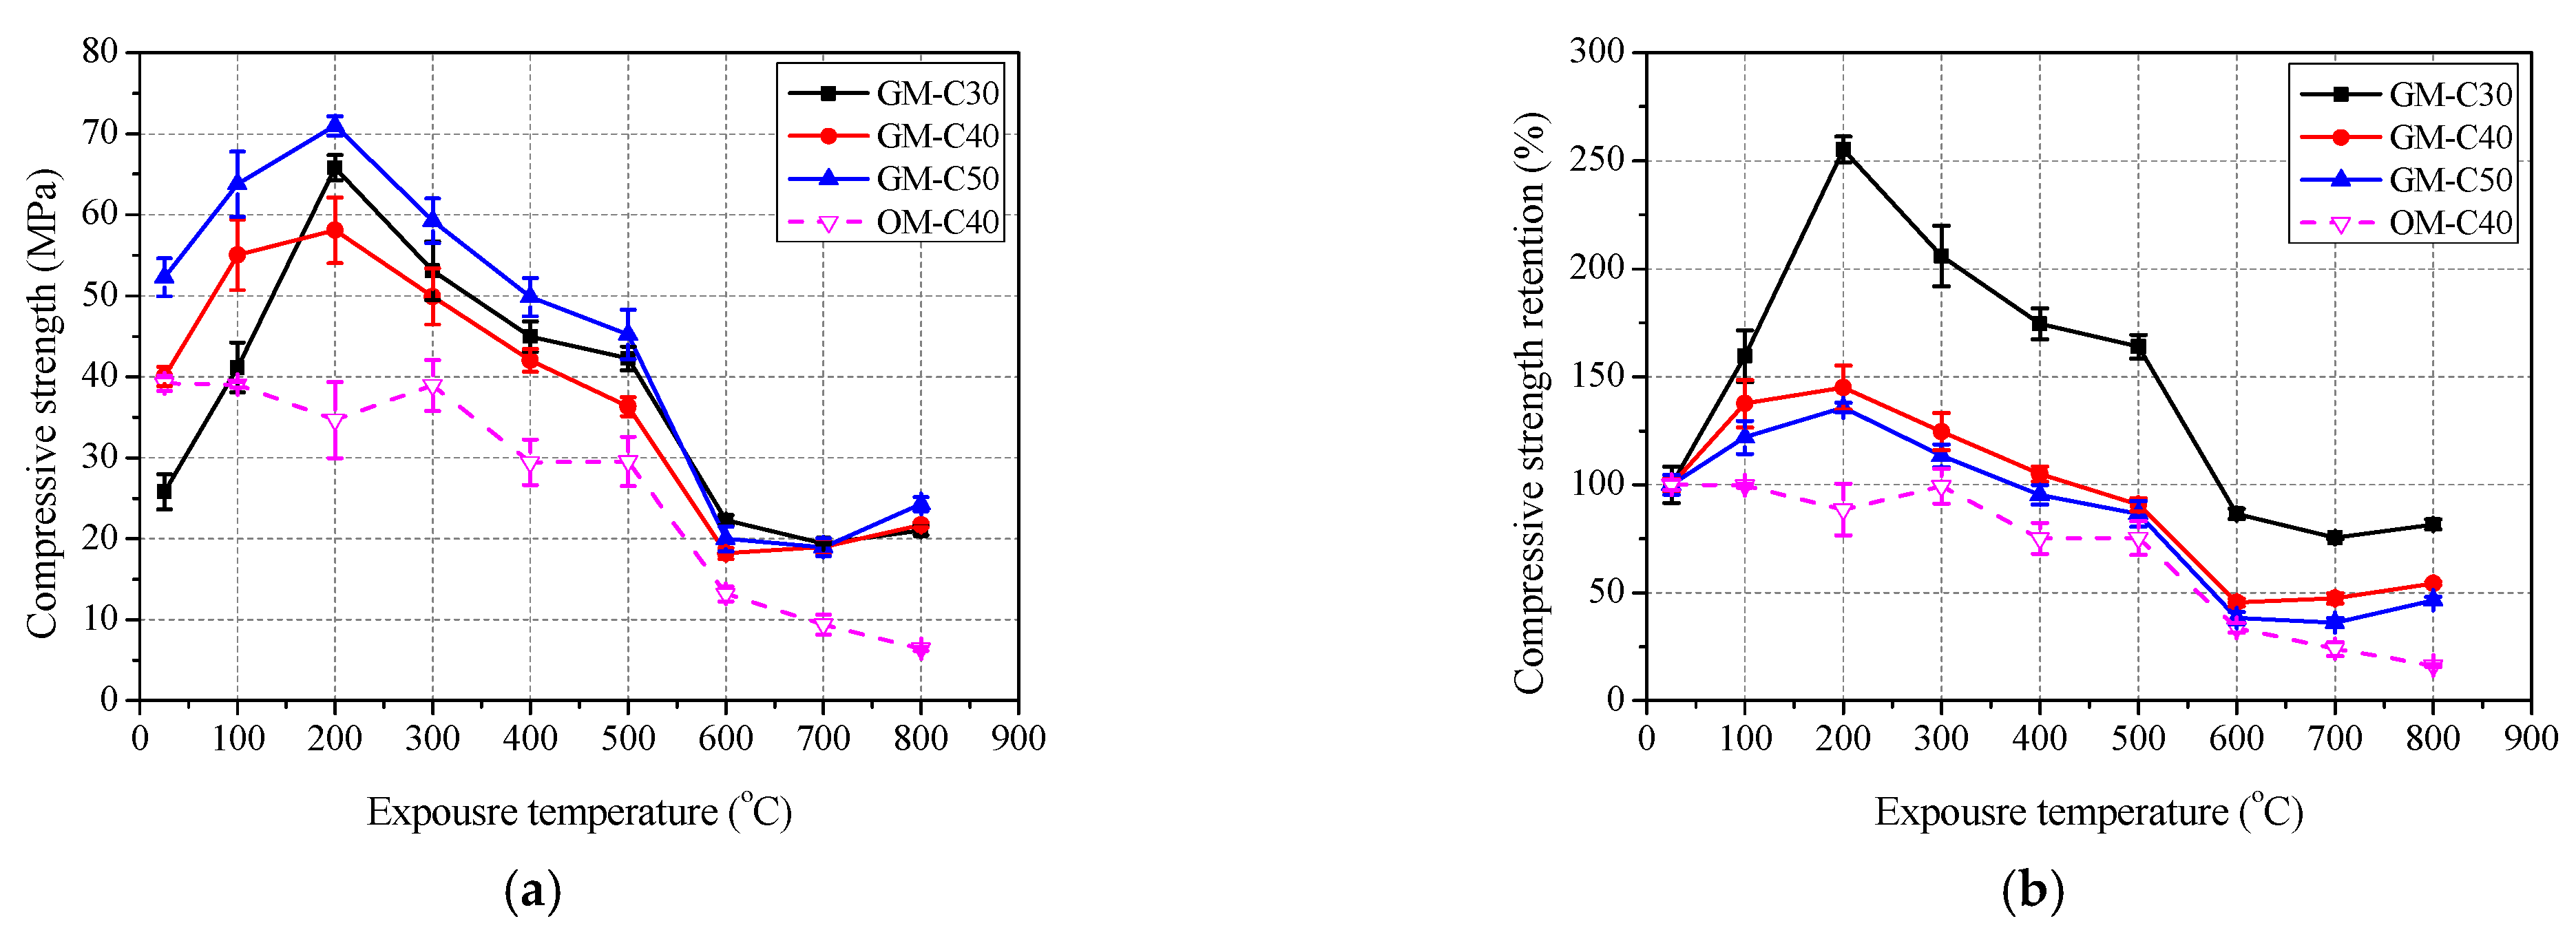
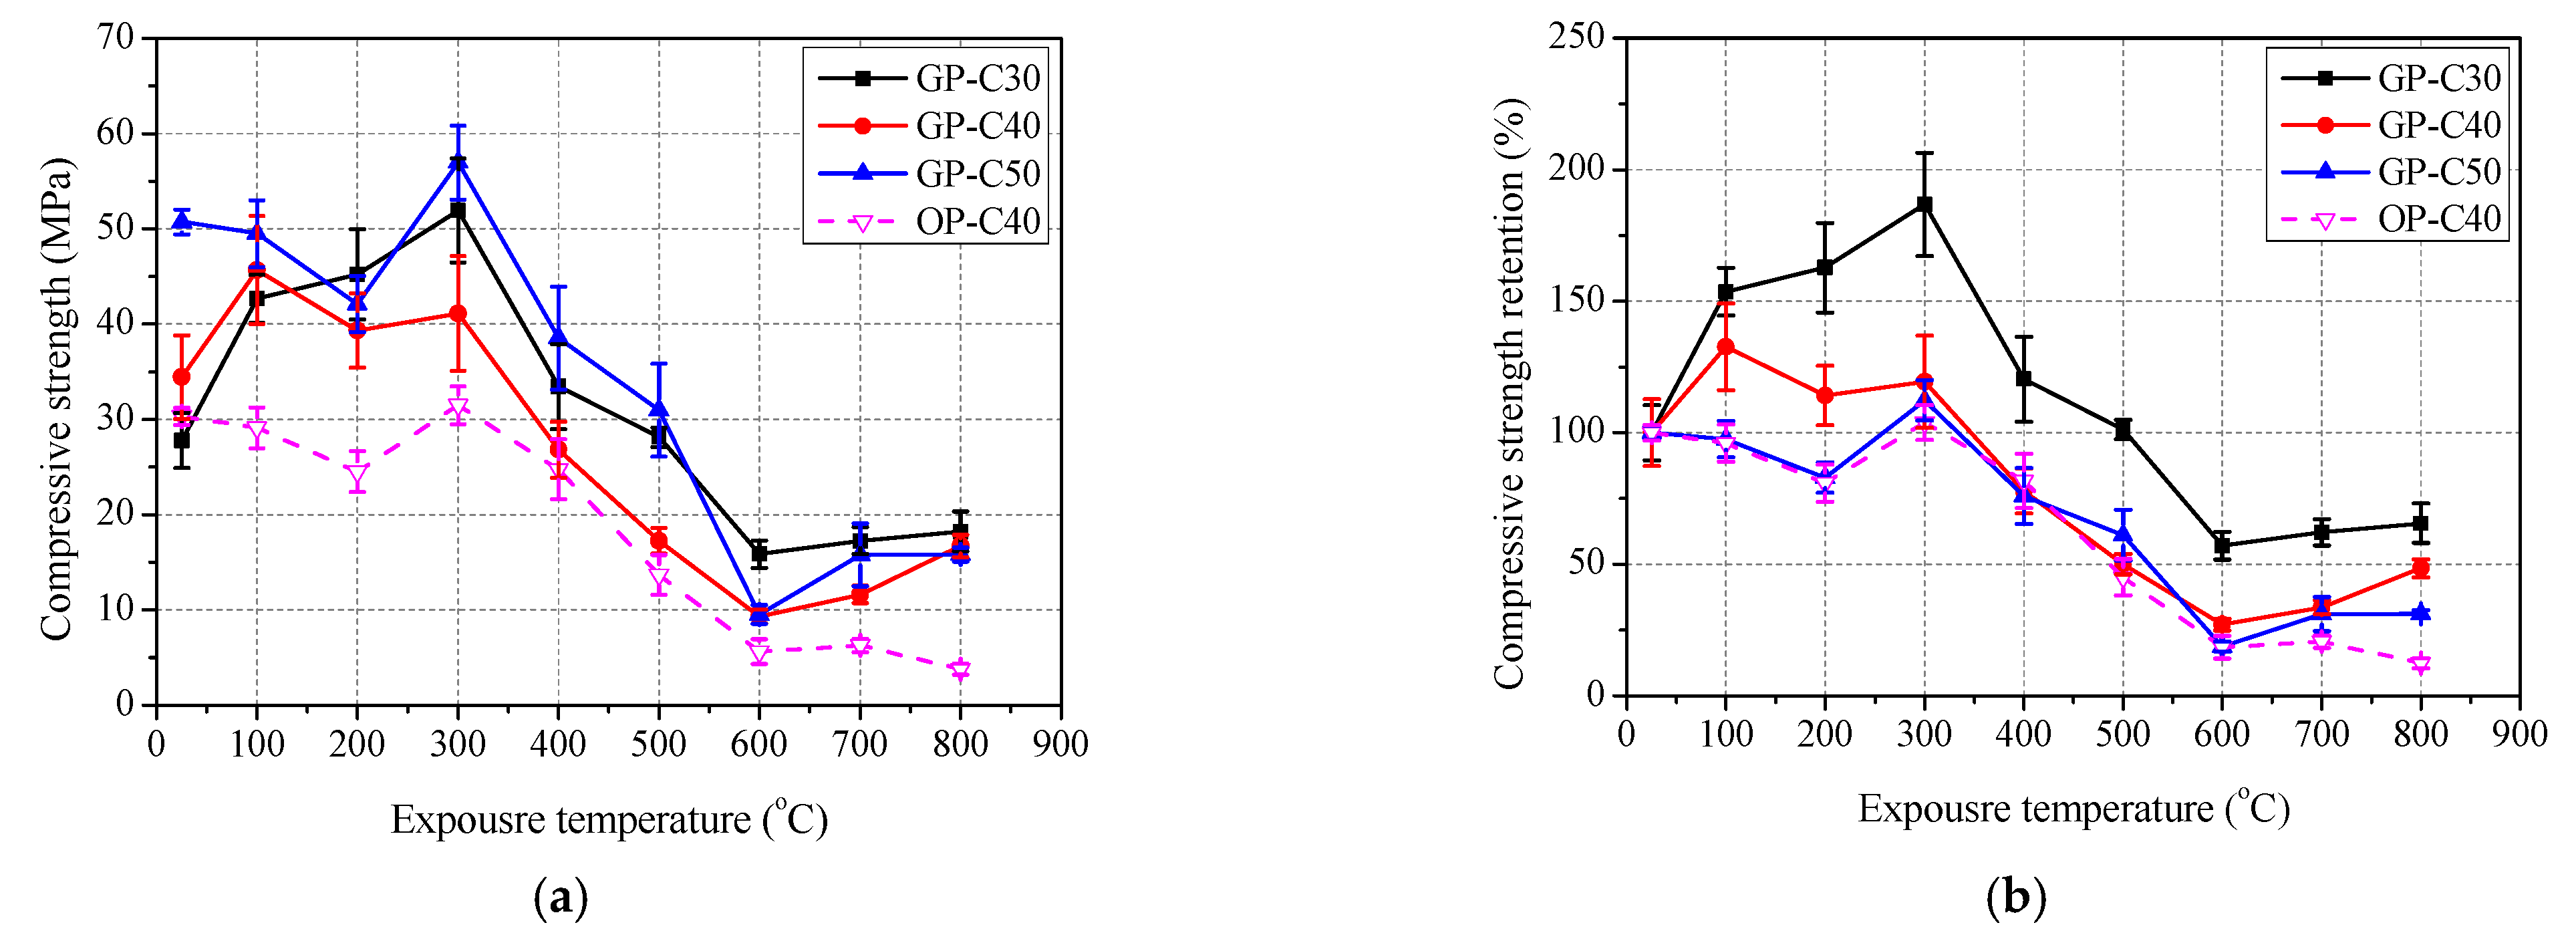
- The compressive strength of C30, C40 and C50 geopolymer concrete, mortar and paste displays increment initially followed by a gradual reduction, and finally reached a relatively consistent value with the increase of exposure temperature, while the compressive strength of C40 ordinary concrete, mortar and paste remained approximately invariant before 400 °C, and then decreased rapidly. With the increase of concrete strength grade (i.e., the increase of slag content), the elevated temperature resistance of geopolymer concrete, mortar and paste gradually decreases. In addition, the elevated temperature resistance of C40 geopolymer concrete, mortar and paste is better than that of ordinary concrete, mortar and paste of the same grade.
- (3)
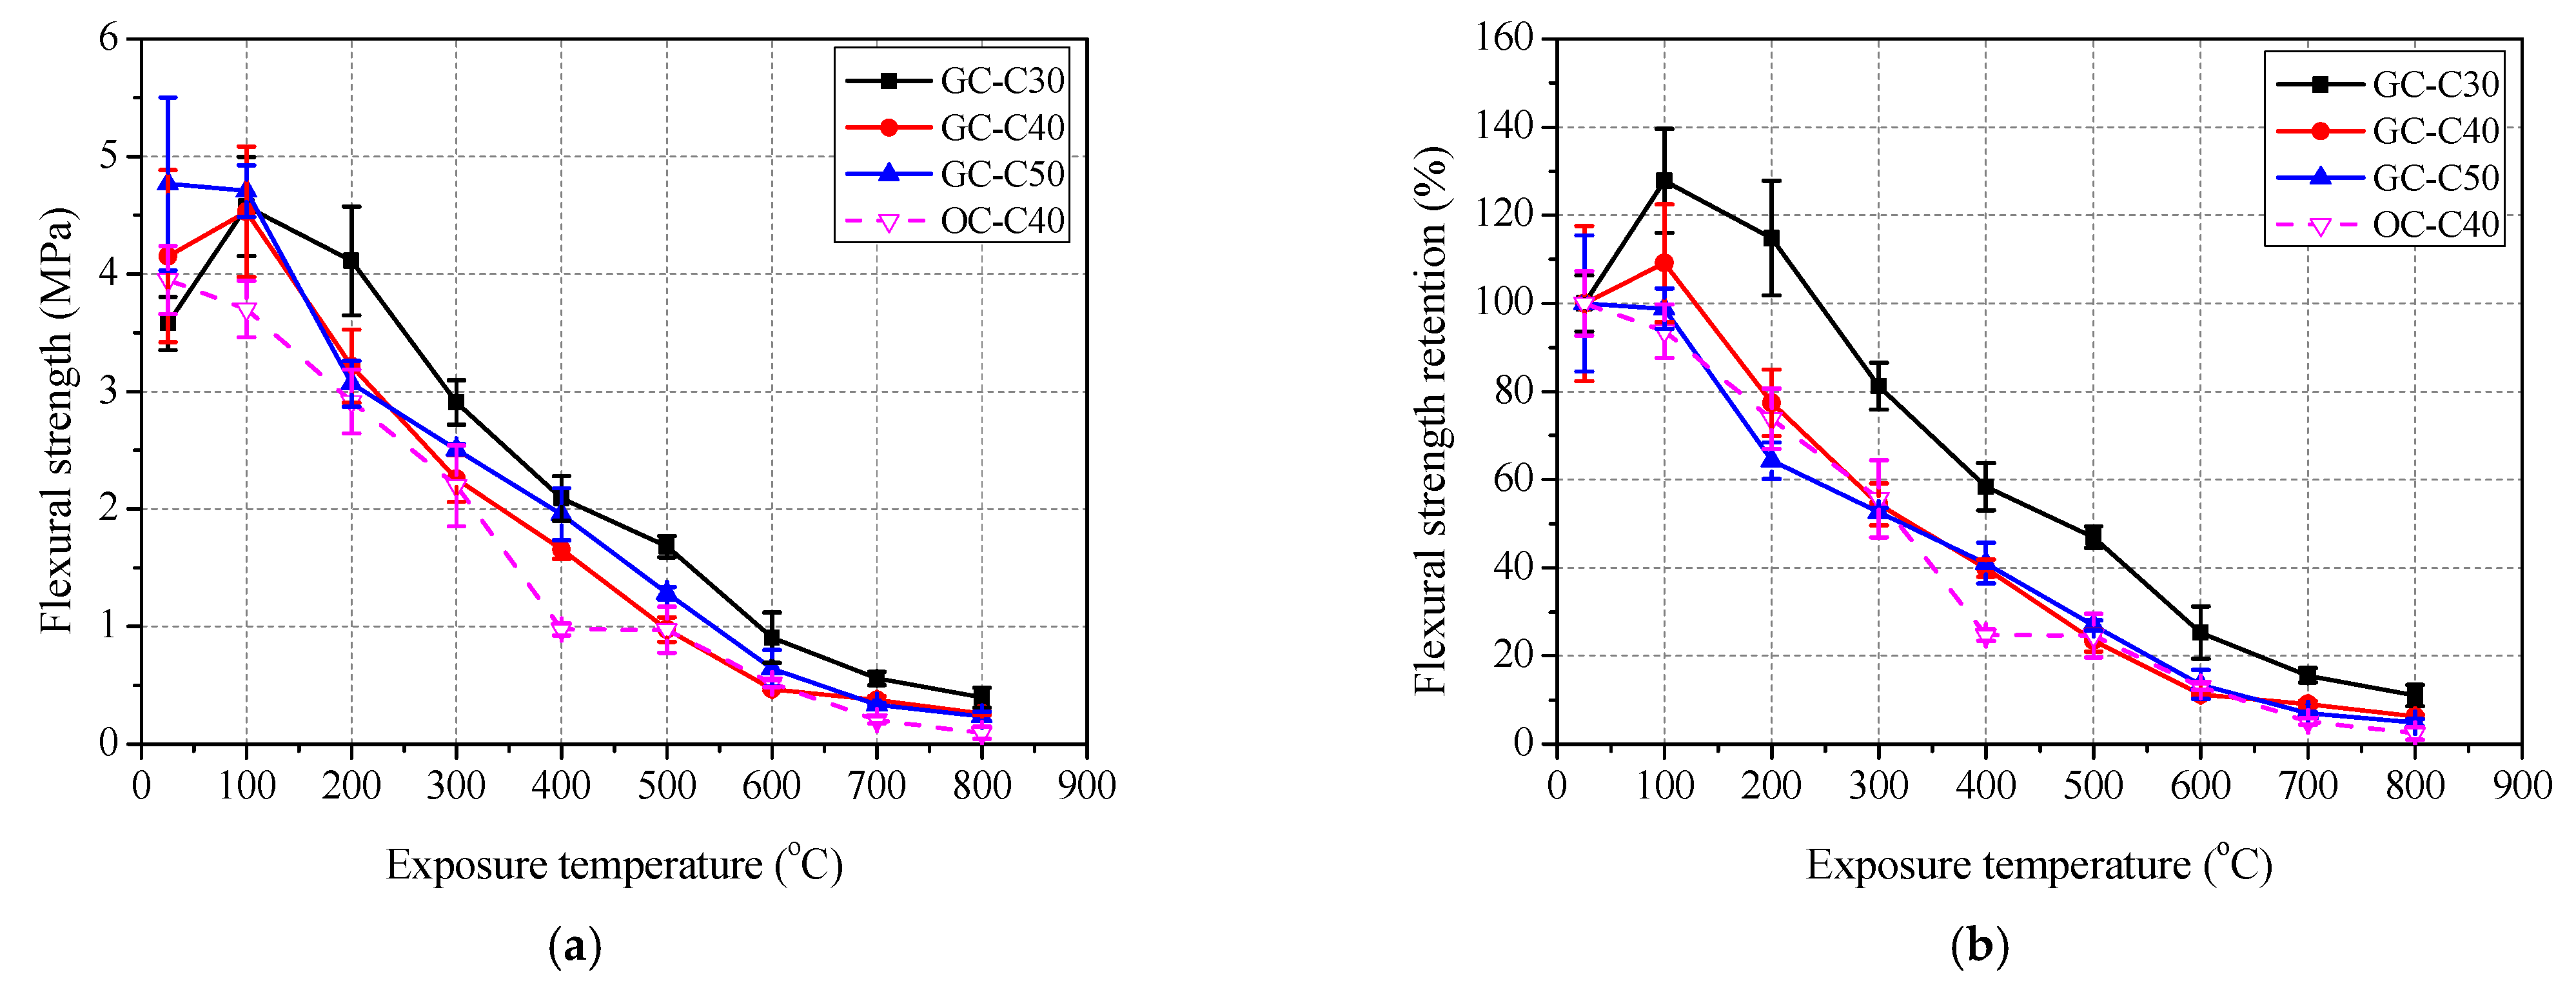
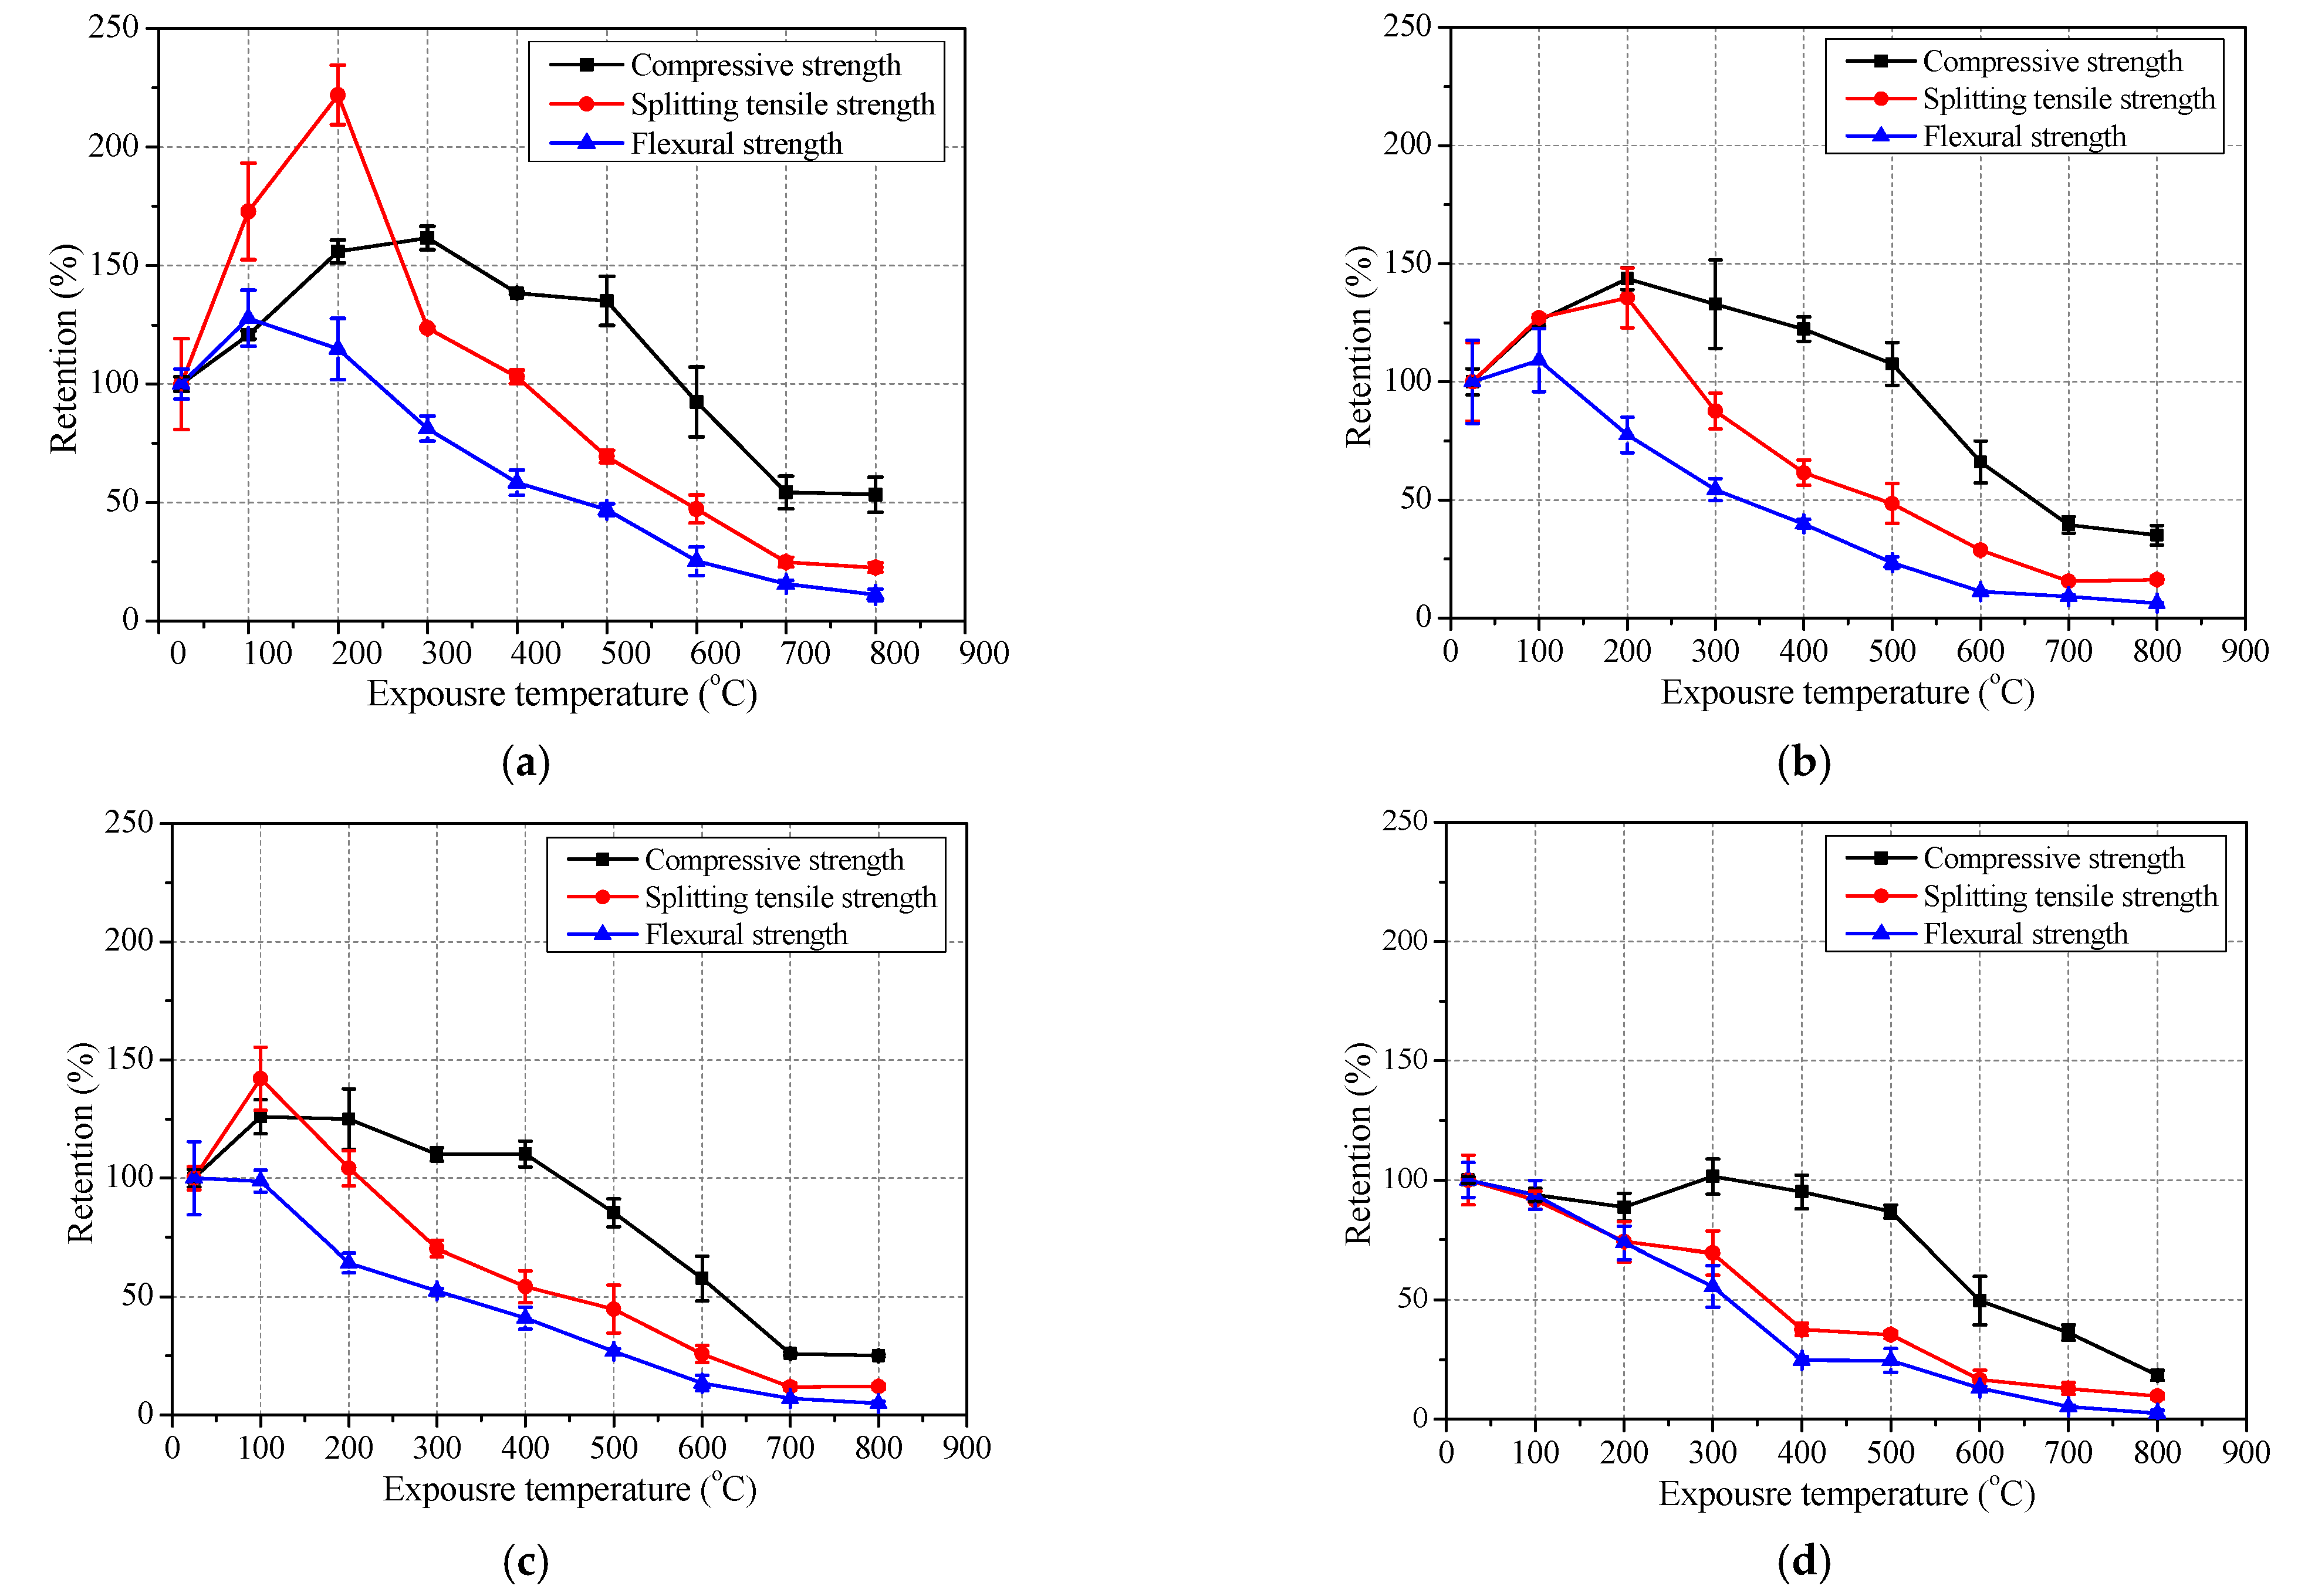
- At the same heating temperature, GC-C30, GC-C40, GC-C50 and OC-C40 basically demonstrated the phenomenon that compressive strength retention has the best performance, which is followed by the splitting tensile strength, and flexural strength proved to be the lowest. The results indicated that the susceptibility of flexural strength, splitting tensile strength and compressive strength to elevated temperature decreased in turn for both geopolymer and ordinary concrete.
- (4)
- XRD, TGA and SEM results showed that with the increase of concrete strength grade, the content of C–S–H formation in geopolymer increases, while the content of aluminosilicate gel, quartz and mullite decreases. Moreover, the heat resistance of C–S–H produced by slag is weaker than that of sulphoaluminate gel (quartz and mullite, etc.) produced by fly ash, which is the main reason for the decrease of C30, C40 and C50 geopolymer in turn after exposure to elevated temperatures.
Author Contributions
Funding
Institutional Review Board Statement
Informed Consent Statement
Data Availability Statement
Conflicts of Interest
References
- Kong, D.L.; Sanjayan, J.G. Damage behavior of geopolymer composites exposed to elevated temperatures. Cem. Concr. Compos. 2008, 30, 986–991. [Google Scholar] [CrossRef]
- I.E. Agency. Global Cement Production, 2010–2019. 2020. Available online: https://www.iea.org/data-and-statistics/charts/global-cement-production-2010-2019 (accessed on 29 May 2020).
- Van Deventer, J.S.; Provis, J.L.; Duxson, P. Technical and commercial progress in the adoption of geopolymer cement. Miner. Eng. 2012, 29, 89–104. [Google Scholar] [CrossRef]
- Assi, L.N.; Deaver, E.; ElBatanouny, M.K.; Ziehl, P. Investigation of early compressive strength of fly ash-based geopolymer concrete. Constr. Build. Mater. 2016, 112, 807–815. [Google Scholar] [CrossRef] [Green Version]
- Visintin, P.; Ali, M.M.; Albitar, M.; Lucas, W. Shear behaviour of geopolymer concrete beams without stirrups. Constr. Build. Mater. 2017, 148, 10–21. [Google Scholar] [CrossRef]
- Chen, C.; Habert, G.; Bouzidi, Y.; Jullien, A. Environmental impact of cement production: Detail of the different processes and cement plant variability evaluation. J. Clean. Prod. 2010, 18, 478–485. [Google Scholar] [CrossRef]
- Davidovits, J. Geopolymers. J. Therm. Anal. Calorim. 1991, 37, 1633–1656. [Google Scholar] [CrossRef]
- Hardjito, D.; Wallah, S.E.; Sumajouw, D.M.J.; Rangan, B.V. On the development of fly ash-based geopolymer concrete. ACI Mater. J. 2004, 101, 467–472. [Google Scholar] [CrossRef]
- Kong, D.L.; Sanjayan, J.G.; Sagoe-Crentsil, K. Comparative performance of geopolymers made with metakaolin and fly ash after exposure to elevated temperatures. Cem. Concr. Res. 2007, 37, 1583–1589. [Google Scholar] [CrossRef]
- Zhang, H.Y.; Kodur, V.; Wu, B.; Cao, L.; Wang, F. Thermal behavior and mechanical properties of geopolymer mortar after exposure to elevated temperatures. Constr. Build. Mater. 2016, 109, 17–24. [Google Scholar] [CrossRef]
- Bakharev, T.; Sanjayan, J.G.; Cheng, Y.-B. Alkali activation of Australian slag cements. Cem. Concr. Res. 1999, 29, 113–120. [Google Scholar] [CrossRef]
- Sarker, P.K.; Mcbeath, S. Fire endurance of steel reinforced fly ash geopolymer concrete elements. Constr. Build. Mater. 2015, 90, 91–98. [Google Scholar] [CrossRef]
- Duxson, P.; Fernández-Jiménez, A.; Provis, J.L.; Lukey, G.C.; Palomo, Á.; Van Deventer, J.S.J. Geopolymer technology: The current state of the art. J. Mater. Sci. 2007, 42, 2917–2933. [Google Scholar] [CrossRef]
- Kong, D.L.; Sanjayan, J.G. Effect of elevated temperatures on geopolymer paste, mortar and concrete. Cem. Concr. Res. 2010, 40, 334–339. [Google Scholar] [CrossRef]
- Ali, A.M.; Sanjayan, J.; Guerrieri, M. Performance of geopolymer high strength concrete wall panels and cylinders when exposed to a hydrocarbon fire. Constr. Build. Mater. 2017, 137, 195–207. [Google Scholar] [CrossRef]
- Zhang, H.Y.; Kodur, V.; Wu, B.; Cao, L.; Qi, S.L. Comparative Thermal and Mechanical Performance of Geopolymers derived from Metakaolin and Fly Ash. J. Mater. Civ. Eng. 2016, 28, 04015092. [Google Scholar] [CrossRef]
- Chowdhury, S.; Mohapatra, S.; Gaur, A.; Dwivedi, G.; Soni, A. Study of various properties of geopolymer concrete—A review. Mater. Today Proc. 2020. [Google Scholar] [CrossRef]
- Colangelo, F.; Cioffi, R.; Roviello, G.; Capasso, I.; Caputo, D.; Aprea, P.; Liguori, B.; Ferone, C. Thermal cycling stability of fly ash based geopolymer mortars. Compos. Part B Eng. 2017, 129, 11–17. [Google Scholar] [CrossRef]
- Li, C.; Xian, G.; Li, H. Influence of immersion in water under hydraulic pressure on the interfacial shear strength of a unidirectional carbon/glass hybrid rod. Polym. Test. 2018, 72, 164–171. [Google Scholar] [CrossRef]
- Pan, Z.; Tao, Z.; Cao, Y.; Wuhrer, R.; Murphy, T. Compressive strength and microstructure of alkali-activated fly ash/slag binders at high temperature. Cem. Concr. Compos. 2018, 86, 9–18. [Google Scholar] [CrossRef]
- Sarker, P.K.; Kelly, S.; Yao, Z. Effect of fire exposure on cracking, spalling and residual strength of fly ash geopolymer concrete. Mater. Des. 2014, 63, 584–592. [Google Scholar] [CrossRef]
- Ranjbar, N.; Mehrali, M.; Alengaram, U.J.; Simon, H.; Jumaat, Z. Compressive strength and microstructural analysis of fly ash/palm oil fuel ash based geopolymer mortar under elevated temperatures. Mater. Des. 2014, 59, 532–539. [Google Scholar] [CrossRef]
- Abdulkareem, O.A.; Al Bakri, A.M.; Kamarudin, H.; Nizar, I.K.; Saif, A.A. Effects of elevated temperatures on the thermal behavior and mechanical performance of fly ash geopolymer paste, mortar and lightweight concrete. Constr. Build. Mater. 2014, 50, 377–387. [Google Scholar] [CrossRef]
- Fernández-Jiménez, A.M.; Palomo, A.; López-Hombrados, C. Engineering properties of alkali-activated fly ash. ACI Mater. J. 2006, 103, 106–112. [Google Scholar] [CrossRef]
- Nath, P.; Sarker, P.K. Use of OPC to improve setting and early strength properties of low calcium fly ash geopolymer concrete cured at room temperature. Cem. Concr. Compos. 2015, 55, 205–214. [Google Scholar] [CrossRef]
- Lee, N.; Lee, H. Setting and mechanical properties of alkali-activated fly ash/slag concrete manufactured at room temperature. Constr. Build. Mater. 2013, 47, 1201–1209. [Google Scholar] [CrossRef]
- Nath, P.; Sarker, P.K. Effect of GGBFS on setting, workability and early strength properties of fly ash geopolymer concrete cured in ambient condition. Constr. Build. Mater. 2014, 66, 163–171. [Google Scholar] [CrossRef] [Green Version]
- Al-Majidi, M.H.; Lampropoulos, A.; Cundy, A.; Meikle, S. Development of geopolymer mortar under ambient temperature for in situ applications. Constr. Build. Mater. 2016, 120, 198–211. [Google Scholar] [CrossRef] [Green Version]
- Nath, P.; Sarker, P.K. Fracture properties of GGBFS-blended fly ash geopolymer concrete cured in ambient temperature. Mater. Struct. 2016, 50, 32. [Google Scholar] [CrossRef]
- Fang, G.; Ho, W.K.; Tu, W.; Zhang, M. Workability and mechanical properties of alkali-activated fly ash-slag concrete cured at ambient temperature. Constr. Build. Mater. 2018, 172, 476–487. [Google Scholar] [CrossRef]
- Lee, N.; Koh, K.; An, G.; Ryu, G. Influence of binder composition on the gel structure in alkali activated fly ash/slag pastes exposed to elevated temperatures. Ceram. Int. 2017, 43, 2471–2480. [Google Scholar] [CrossRef]
- Park, S.; Jang, J.; Lee, N.; Lee, H. Physicochemical properties of binder gel in alkali-activated fly ash/slag exposed to high temperatures. Cem. Concr. Res. 2016, 89, 72–79. [Google Scholar] [CrossRef]
- Qu, F.; Li, W.; Tao, Z.; Castel, A.; Wang, K. High temperature resistance of fly ash/GGBFS-based geopolymer mortar with load-induced damage. Mater. Struct. 2020, 53, 1–21. [Google Scholar] [CrossRef]
- Wang, Y.C.; Wong, P.M.H.; Kodur, V. An experimental study of the mechanical properties of fibre reinforced polymer (FRP) and steel reinforcing bars at elevated temperatures. Compos. Struct. 2007, 80, 131–140. [Google Scholar] [CrossRef]
- Wang, S.; Vipulanandan, C. Solidification/stabilization of Cr(VI) with cement leachability and XRD analyses. Cem. Concr. Res. 2000, 30, 385–389. [Google Scholar] [CrossRef]
- Deb, P.S.; Nath, P.; Sarker, P.K. The effects of ground granulated blast-furnace slag blending with fly ash and activator content on the workability and strength properties of geopolymer concrete cured at ambient temperature. Mater. Des. 2014, 62, 32–39. [Google Scholar] [CrossRef] [Green Version]
- G.T. 50081-2019. In Standard for Test Methods of Concrete Physical Physical and Mechanical Properties; Chinese National Standard: Beijing, China, 2019. (In Chinese)
- JGJ/T70-2009. In Standard for Test Method of Performance on Building Mortar; Chinese Industryl Standard: Beijing, China, 2009. (In Chinese)
- Pan, Z.; Tao, Z.; Cao, Y.-F.; Wuhrer, R. Measurement and prediction of thermal properties of alkali-activated fly ash/slag binders at elevated temperatures. Mater. Struct. 2018, 51, 108. [Google Scholar] [CrossRef]
- Kumar, S.; Kumar, R.; Mehrotra, S.P. Influence of granulated blast furnace slag on the reaction, structure and properties of fly ash based geopolymer. J. Mater. Sci. 2010, 45, 607–615. [Google Scholar] [CrossRef]
- Lim, S.; Mondal, P. Micro- and nano-scale characterization to study the thermal degradation of cement-based materials. Mater. Charact. 2014, 92, 15–25. [Google Scholar] [CrossRef]
- Alonso, C.; Fernandez, L. Dehydration and rehydration processes of cement paste exposed to high temperature environments. J. Mater. Sci. 2004, 39, 3015–3024. [Google Scholar] [CrossRef]
- Komonen, J.; Penttala, V. Effects of High Temperature on the Pore Structure and Strength of Plain and Polypropylene Fiber Reinforced Cement Pastes. Fire Technol. 2003, 39, 23–34. [Google Scholar] [CrossRef]
- Škvára, F.; Kopecký, L.; Šmilauer, V.; Bittnar, Z. Material and structural characterization of alkali activated low-calcium brown coal fly ash. J. Hazard. Mater. 2009, 168, 711–720. [Google Scholar] [CrossRef] [PubMed]
- Peng, G.-F.; Huang, Z.-S. Change in microstructure of hardened cement paste subjected to elevated temperatures. Constr. Build. Mater. 2008, 22, 593–599. [Google Scholar] [CrossRef]
- Xiao, J.; König, G. Study on concrete at high temperature in China—an overview. Fire Saf. J. 2004, 39, 89–103. [Google Scholar] [CrossRef]
- Zhao, Z.; Qu, X.; Li, J. Microstructure and properties of fly ash/cement-based pastes activated with MgO and CaO under hydrothermal conditions. Cem. Concr. Compos. 2020, 114, 103739. [Google Scholar] [CrossRef]
- Zhao, X.; Liu, C.; Wang, L.; Zuo, L.; Zhu, Q.; Ma, W. Physical and mechanical properties and micro characteristics of fly ash-based geopolymers incorporating soda residue. Cem. Concr. Compos. 2019, 98, 125–136. [Google Scholar] [CrossRef]
- Li, C. Mechanical and transport properties of recycled aggregate concrete modified with limestone powder. Compos. Part B Eng. 2020, 197, 108189. [Google Scholar] [CrossRef]
- Bernal, S.A.; Provis, J.L.; Walkley, B.; Nicolas, R.S.; Gehman, J.D.; Brice, D.G.; Kilcullen, A.R.; Duxson, P.; Van Deventer, J.S. Gel nanostructure in alkali-activated binders based on slag and fly ash, and effects of accelerated carbonation. Cem. Concr. Res. 2013, 53, 127–144. [Google Scholar] [CrossRef]
- Kürklü, G. The effect of high temperature on the design of blast furnace slag and coarse fly ash-based geopolymer mortar. Compos. Part B Eng. 2016, 92, 9–18. [Google Scholar] [CrossRef]
- Lee, N.K.; Koh, K.T.; Kim, M.O.; An, G.H.; Ryu, G.S. Physicochemical changes caused by reactive MgO in alkali-activated fly ash/slag blends under accelerated carbonation. Ceram. Int. 2017, 43, 12490–12496. [Google Scholar] [CrossRef]
- Castellote, M.; Alonso, C.; Andrade, C.; Turrillas, X.; Campo, J. Composition and microstructural changes of cement pastes upon heating, as studied by neutron diffraction. Cem. Concr. Res. 2004, 34, 1633–1644. [Google Scholar] [CrossRef]
- Saridemir, M.; Severcan, M.; Ciflikli, M.; Celikten, S.; Ozcan, F.; Atis, C. The influence of elevated temperature on strength and microstructure of high strength concrete containing ground pumice and metakaolin. Constr. Build. Mater. 2016, 124, 244–257. [Google Scholar] [CrossRef]
- Hussin, M.W.; Bhutta, M.A.R.; Azreen, M.; Ramadhansyah, P.J.; Mirza, J. Performance of blended ash geopolymer concrete at elevated temperatures. Mater. Struct. 2014, 48, 709–720. [Google Scholar] [CrossRef]
- Demirel, B.; Keleştemur, O. Effect of elevated temperature on the mechanical properties of concrete produced with finely ground pumice and silica fume. Fire Saf. J. 2010, 45, 385–391. [Google Scholar] [CrossRef] [Green Version]
- Akca, A.H.; Zihnioğlu, N. Özyurt High performance concrete under elevated temperatures. Constr. Build. Mater. 2013, 44, 317–328. [Google Scholar] [CrossRef]


| Oxide | SiO2 | Al2O3 | Fe2O3 | CaO | K2O | SO3 | TiO2 | MgO | Na2O | P2O5 | BaO | MnO | L.O.I a |
|---|---|---|---|---|---|---|---|---|---|---|---|---|---|
| Fly ash | 51.09 | 28.67 | 7.36 | 5.06 | 2.77 | 1.11 | 1.49 | 0.87 | 0.52 | 0.38 | 0.14 | 0.09 | 5.57 |
| Slag | 32.12 | 13.20 | 0.78 | 42.15 | 0.74 | 2.21 | 0.81 | 6.47 | 0.59 | 0.02 | 0.11 | 0.54 | 1.30 |
| Cement | 17.29 | 4.82 | 3.91 | 65.34 | 1.16 | 3.19 | 0.35 | 3.26 | 0.17 | 0.05 | 0.04 | 0.08 | 3.41 |
| Type | Binders | Sand | Coarse Aggregate | Alkaline Solutions | Water | ||||
|---|---|---|---|---|---|---|---|---|---|
| Fly Ash | Slag | Cement | 5–10 mm | 10–20 mm | SS a | SH b | |||
| GC-C30 | 360 | 40 | - | 651 | 362.7 | 846.3 | 114.3 | 45.7 | 56.5 |
| GC-C40 | 320 | 80 | - | 651 | 362.7 | 846.3 | 114.3 | 45.7 | 56.5 |
| GC-C50 | 280 | 120 | - | 651 | 362.7 | 846.3 | 114.3 | 45.7 | 56.5 |
| OC-C40 | - | - | 387 | 633 | 352.8 | 823.2 | - | - | 205 |
| GM-C30 | 360 | 40 | - | 651 | - | 114.3 | 45.7 | 56.5 | |
| GM-C40 | 320 | 80 | - | 651 | - | 114.3 | 45.7 | 56.5 | |
| GM-C50 | 280 | 120 | - | 651 | - | 114.3 | 45.7 | 56.5 | |
| OM-C40 | - | - | 387 | 633 | - | - | - | 205 | |
| GP-C30 | 360 | 40 | - | - | - | 114.3 | 45.7 | 56.5 | |
| GP-C40 | 320 | 80 | - | - | - | 114.3 | 45.7 | 56.5 | |
| CP-C50 | 280 | 120 | - | - | - | 114.3 | 45.7 | 56.5 | |
| OP-C40 | - | - | 387 | 633 | - | - | - | 205 | |
| Type | Compressive Strength (MPa) | |||
|---|---|---|---|---|
| 3 Days | 7 Days | 28 Days | 56 Days | |
| GC-C30 | 10.1 (0.14) | 13.5 (1.70) | 31.9 (0.99) | 37.0 (0.09) |
| GC-C40 | 17.7 (0.90) | 25.6 (0.89) | 40.4 (2.22) | 48.2 (1.14) |
| GC-C50 | 27.8 (0.92) | 35.0 (1.36) | 48.0 (1.81) | 58.8 (3.36) |
| OC-C40 | 24.8 (0.46) | 31.3 (2.37) | 39.2 (1.88) | 41.5 (0.76) |
| GM-C30 | 7.3 (0.10) | 12.3 (0.61) | 25.8 (2.14) | 39.7 (1.2) |
| GM-C40 | 14.5 (0.63) | 20.0 (0.74) | 40.0 (1.20) | 46.7 (6.30) |
| GM-C50 | 22.7 (1.38) | 33.2 (2.6) | 52.3 (2.36) | 65.9 (6.00) |
| OM-C40 | 21.1 (1.48) | 25.5 (0.84) | 39.2 (0.93) | 40.0 (4.49) |
| GP-C30 | 7.5 (0.07) | 12.5 (1.25) | 27.8 (2.90) | 46.8 (1.97) |
| GP-C40 | 15.0 (0.34) | 23.4 (1.68) | 34.4 (0.96) | 56.5 (3.9) |
| CP-C50 | 26.2 (1.73) | 32.2 (1.15) | 50.7 (1.29) | 59.6 (4.60) |
| OP-C40 | 18.7 (0.56) | 21.9 (0.47) | 30.3 (0.63) | 33.2 (3.72) |
| Table. | Temperature ( °C) | Compressive Strength | Splitting Strength | Flexural Strength | ||||||
|---|---|---|---|---|---|---|---|---|---|---|
| Mean (MPa) | Retention (%) | COV a (%) | Mean (MPa) | Retention (%) | COV (%) | Mean (MPa) | Retention (%) | COV (%) | ||
| GC-C30 | 25 | 31.9 | 100 | 3.1 | 1.77 | 100 | 19.3 | 3.58 | 100 | 6.4 |
| 100 | 38.5 | 120.8 | 1.7 | 3.05 | 172.8 | 20.5 | 4.57 | 127.8 | 11.8 | |
| 200 | 49.8 | 155.9 | 4.8 | 3.92 | 222.0 | 12.5 | 4.11 | 114.8 | 12.9 | |
| 300 | 51.6 | 161.7 | 5.0 | 2.18 | 123.6 | 0.5 | 2.91 | 81.2 | 5.3 | |
| 400 | 44.2 | 138.4 | 0.6 | 1.82 | 103.1 | 2.8 | 2.09 | 58.4 | 5.3 | |
| 500 | 43.1 | 135.1 | 10.3 | 1.23 | 69.4 | 2.6 | 1.68 | 46.9 | 2.5 | |
| 600 | 29.5 | 92.5 | 14.8 | 0.84 | 47.3 | 5.9 | 0.91 | 25.3 | 6.0 | |
| 700 | 17.3 | 54.2 | 6.9 | 0.44 | 24.8 | 2.0 | 0.56 | 15.6 | 1.6 | |
| 800 | 17.0 | 53.3 | 7.4 | 0.40 | 22.6 | 2.0 | 0.40 | 11.1 | 2.4 | |
| GC-C40 | 25 | 40.4 | 100 | 5.5 | 2.45 | 100 | 16.6 | 4.15 | 100 | 17.6 |
| 100 | 51.0 | 126.0 | 2.6 | 3.12 | 127.1 | 1.4 | 4.53 | 109.1 | 13.4 | |
| 200 | 58.1 | 143.6 | 4.7 | 3.32 | 135.5 | 12.6 | 3.22 | 77.5 | 7.5 | |
| 300 | 53.7 | 132.8 | 18.7 | 2.15 | 87.6 | 7.5 | 2.26 | 54.4 | 4.8 | |
| 400 | 49.5 | 122.3 | 5.2 | 1.51 | 61.6 | 5.3 | 1.66 | 39.9 | 1.9 | |
| 500 | 43.5 | 107.7 | 9.0 | 1.19 | 48.5 | 8.5 | 0.98 | 23.5 | 2.5 | |
| 600 | 26.7 | 66.1 | 8.9 | 0.71 | 28.8 | 1.0 | 0.47 | 11.2 | 0.3 | |
| 700 | 16.0 | 39.5 | 3.5 | 0.38 | 15.5 | 0.6 | 0.38 | 9.1 | 0.7 | |
| 800 | 14.1 | 35.1 | 4.2 | 0.40 | 16.3 | 1.4 | 0.26 | 6.3 | 0.4 | |
| GC-C50 | 25 | 48.0 | 100 | 3.8 | 3.01 | 100 | 4.9 | 4.77 | 100 | 15.4 |
| 100 | 60.5 | 126.0 | 7.2 | 4.28 | 142.1 | 13.3 | 4.71 | 98.8 | 4.6 | |
| 200 | 60.0 | 124.9 | 12.8 | 3.14 | 104.2 | 7.4 | 3.07 | 64.3 | 4.1 | |
| 300 | 52.9 | 110.1 | 2.8 | 2.12 | 70.3 | 3.3 | 2.51 | 52.6 | 1.0 | |
| 400 | 53.0 | 110.3 | 5.4 | 1.64 | 54.3 | 6.8 | 1.96 | 41.0 | 4.7 | |
| 500 | 41.0 | 85.4 | 5.9 | 1.35 | 44.8 | 10.1 | 1.28 | 26.9 | 1.2 | |
| 600 | 27.8 | 57.8 | 9.5 | 0.78 | 25.8 | 3.6 | 0.64 | 13.5 | 3.3 | |
| 700 | 12.5 | 26.0 | 0.8 | 0.36 | 12.0 | 1.8 | 0.33 | 7.0 | 0.3 | |
| 800 | 12.1 | 25.2 | 0.6 | 0.36 | 12.1 | 1.3 | 0.23 | 4.9 | 0.8 | |
| OC-C40 | 25 | 39.2 | 100 | 1.4 | 2.51 | 100 | 10.4 | 3.95 | 100 | 7.3 |
| 100 | 36.8 | 93.8 | 2.8 | 2.30 | 91.6 | 3.8 | 3.70 | 93.7 | 6.1 | |
| 200 | 34.8 | 88.7 | 5.7 | 1.86 | 74.3 | 8.3 | 2.91 | 73.8 | 6.9 | |
| 300 | 39.8 | 101.5 | 7.4 | 1.74 | 69.5 | 9.1 | 2.20 | 55.7 | 8.7 | |
| 400 | 37.3 | 95.0 | 7.1 | 0.94 | 37.6 | 2.5 | 0.98 | 24.7 | 1.3 | |
| 500 | 34.1 | 86.8 | 2.7 | 0.89 | 35.4 | 1.5 | 0.97 | 24.6 | 5.0 | |
| 600 | 19.5 | 49.7 | 10.1 | 0.42 | 16.6 | 3.8 | 0.52 | 13.0 | 0.8 | |
| 700 | 14.2 | 36.3 | 3.3 | 0.32 | 12.8 | 2.5 | 0.20 | 5.2 | 0.8 | |
| 800 | 7.2 | 18.4 | 2.1 | 0.24 | 9.7 | 1.3 | 0.10 | 2.4 | 1.4 | |
| Type | Temperature (°C) | Mortar | Paste | ||||
|---|---|---|---|---|---|---|---|
| Mean (MPa) | Retention (%) | COV a (%) | Mean (MPa) | Retention (%) | COV (%) | ||
| GM-C30 or GP-C30 | 25 | 25.8 | 100 | 8.3 | 27.8 | 100 | 10.4 |
| 100 | 41.1 | 159.6 | 12.0 | 42.7 | 153.5 | 9.1 | |
| 200 | 65.8 | 255.2 | 6.0 | 45.2 | 162.7 | 17.0 | |
| 300 | 53.1 | 206.0 | 14.0 | 51.9 | 186.9 | 19.6 | |
| 400 | 45.0 | 174.4 | 7.2 | 33.4 | 120.4 | 16.2 | |
| 500 | 42.3 | 163.9 | 5.6 | 28.1 | 101.2 | 3.6 | |
| 600 | 22.3 | 86.5 | 2.4 | 15.8 | 57.0 | 5.2 | |
| 700 | 19.4 | 75.4 | 0.6 | 17.3 | 62.1 | 5.0 | |
| 800 | 21.0 | 81.6 | 2.3 | 18.2 | 65.6 | 7.5 | |
| GM-C40 or GP-C40 | 25 | 40.0 | 100 | 3.0 | 34.4 | 100 | 12.7 |
| 100 | 55.1 | 137.5 | 10.9 | 45.7 | 132.6 | 16.5 | |
| 200 | 58.1 | 145.1 | 10.2 | 39.3 | 114.2 | 11.3 | |
| 300 | 49.9 | 124.6 | 8.6 | 41.1 | 119.4 | 17.5 | |
| 400 | 42.1 | 105.1 | 3.5 | 26.8 | 77.9 | 8.5 | |
| 500 | 36.3 | 90.7 | 2.9 | 17.2 | 50.1 | 3.9 | |
| 600 | 18.2 | 45.5 | 1.7 | 9.3 | 27.0 | 2.1 | |
| 700 | 19.0 | 47.5 | 2.4 | 11.6 | 33.7 | 2.6 | |
| 800 | 21.7 | 54.3 | 0.8 | 16.7 | 48.5 | 3.4 | |
| GM-C50 or GP-C50 | 25 | 52.3 | 100 | 4.5 | 50.7 | 100 | 2.5 |
| 100 | 63.8 | 122.0 | 7.6 | 49.5 | 97.6 | 6.9 | |
| 200 | 71.0 | 135.8 | 2.3 | 42.1 | 83.0 | 5.8 | |
| 300 | 59.3 | 113.4 | 5.3 | 57.0 | 112.3 | 7.7 | |
| 400 | 49.8 | 95.3 | 4.5 | 38.5 | 76.0 | 10.6 | |
| 500 | 45.2 | 86.5 | 5.8 | 31.0 | 61.0 | 9.6 | |
| 600 | 20.0 | 38.2 | 2.9 | 9.5 | 18.7 | 1.9 | |
| 700 | 18.9 | 36.2 | 2.1 | 15.8 | 31.2 | 6.5 | |
| 800 | 24.3 | 46.4 | 1.7 | 15.8 | 31.2 | 1.5 | |
| OM-C40 or OP-C40 | 25 | 39.2 | 100 | 2.4 | 30.3 | 100 | 3.0 |
| 100 | 39.0 | 99.7 | 1.0 | 29.1 | 96.0 | 7.1 | |
| 200 | 34.7 | 88.5 | 12.0 | 24.5 | 80.9 | 7.1 | |
| 300 | 38.9 | 99.4 | 8.1 | 31.5 | 103.9 | 6.6 | |
| 400 | 29.4 | 75.1 | 7.2 | 24.8 | 81.7 | 10.3 | |
| 500 | 29.5 | 75.4 | 7.8 | 13.7 | 45.1 | 6.9 | |
| 600 | 13.2 | 33.7 | 2.3 | 5.6 | 18.5 | 4.4 | |
| 700 | 9.4 | 24.0 | 3.2 | 6.3 | 20.6 | 2.3 | |
| 800 | 6.4 | 16.3 | 0.6 | 3.8 | 12.4 | 1.9 | |
Publisher’s Note: MDPI stays neutral with regard to jurisdictional claims in published maps and institutional affiliations. |
© 2021 by the authors. Licensee MDPI, Basel, Switzerland. This article is an open access article distributed under the terms and conditions of the Creative Commons Attribution (CC BY) license (https://creativecommons.org/licenses/by/4.0/).
Share and Cite
Zhao, J.; Wang, K.; Wang, S.; Wang, Z.; Yang, Z.; Shumuye, E.D.; Gong, X. Effect of Elevated Temperature on Mechanical Properties of High-Volume Fly Ash-Based Geopolymer Concrete, Mortar and Paste Cured at Room Temperature. Polymers 2021, 13, 1473. https://doi.org/10.3390/polym13091473
Zhao J, Wang K, Wang S, Wang Z, Yang Z, Shumuye ED, Gong X. Effect of Elevated Temperature on Mechanical Properties of High-Volume Fly Ash-Based Geopolymer Concrete, Mortar and Paste Cured at Room Temperature. Polymers. 2021; 13(9):1473. https://doi.org/10.3390/polym13091473
Chicago/Turabian StyleZhao, Jun, Kang Wang, Shuaibin Wang, Zike Wang, Zhaohui Yang, Eskinder Desta Shumuye, and Xinglong Gong. 2021. "Effect of Elevated Temperature on Mechanical Properties of High-Volume Fly Ash-Based Geopolymer Concrete, Mortar and Paste Cured at Room Temperature" Polymers 13, no. 9: 1473. https://doi.org/10.3390/polym13091473