In Vitro Degradation of Plasticized PLA Electrospun Fiber Mats: Morphological, Thermal and Crystalline Evolution

 , ,
, ,
Abstract
:
1. Introduction
2. Materials and Methods
2.1. Materials
2.2. Characterization Techniques
3. Results and Discussion
4. Conclusions
Author Contributions
Funding
Acknowledgments
Conflicts of Interest
References
- Leonés, A.; Lieblich, M.; Benavente, R.; Gonzalez, J.L.; Peponi, L. Potential applications of magnesium-based polymeric nanocomposites obtained by electrospinning technique. Nanomaterials 2020, 10, 1524. [Google Scholar] [CrossRef] [PubMed]
- Arrieta, M.P.; López, J.; López, D.; Kenny, J.M.; Peponi, L. Development of flexible materials based on plasticized electrospun PLA-PHB blends: Structural, thermal, mechanical and disintegration properties. Eur. Polym. J. 2015, 73, 433–446. [Google Scholar] [CrossRef]
- Leonés, A.; Mujica-Garcia, A.; Arrieta, M.P.; Salaris, V.; Lopez, D.; Kenny, J.M.; Peponi, L. Organic and Inorganic PCL-Based Electrospun Fibers. Polymers 2020, 12, 1325. [Google Scholar] [CrossRef] [PubMed]
- Jiang, S.; Chen, Y.; Duan, G.; Mei, C.; Greiner, A.; Agarwal, S. Electrospun nanofiber reinforced composites: A review. Polym. Chem. 2018, 9, 2685–2720. [Google Scholar] [CrossRef]
- Peponi, L.; Mújica-García, A.; Kenny, J.M. Electrospinning of PLA. Hyperbranched Polym. Macromol. Determ. Linear Chain. Dendrimer Struct. 2015, 12, 171–194. [Google Scholar]
- Arrieta, M.; Díez García, A.; López, D.; Fiori, S.; Peponi, L. Antioxidant Bilayers Based on PHBV and Plasticized Electrospun PLA-PHB Fibers Encapsulating Catechin. Nanomaterials 2019, 9, 346. [Google Scholar] [CrossRef] [Green Version]
- Torres-Giner, S.; Echegoyen, Y.; Teruel-Juanes, R.; Badia, J.D.; Ribes-Greus, A.; Lagaron, J.M. Electrospun Poly(ethylene-co-vinyl alcohol)/Graphene Nanoplatelets Composites of Interest in Intelligent Food Packaging Applications. Nanomaterials 2018, 8, 745. [Google Scholar] [CrossRef] [Green Version]
- Huang, Z.-M.; Zhang, Y.-Z.; Kotaki, M.; Ramakrishna, S. A review on polymer nanofibers by electrospinning and their applications in nanocomposites. Compos. Sci. Technol. 2003, 63, 2223–2253. [Google Scholar] [CrossRef]
- Sonseca, A.; Peponi, L.; Sahuquillo, O.; Kenny, J.M.; Giménez, E. Electrospinning of biodegradable polylactide/hydroxyapatite nanofibers: Study on the morphology, crystallinity structure and thermal stability. Polym. Degrad. Stab. 2012, 97, 2052–2059. [Google Scholar] [CrossRef] [Green Version]
- Varesano, A.; Rombaldoni, F.; Mazzuchetti, G.; Tonin, C.; Comotto, R. Multi-jet nozzle electrospinning on textile substrates: Observations on process and nanofibre mat deposition. Polym. Int. 2010, 59, 1606–1615. [Google Scholar] [CrossRef]
- Sun, G.; Sun, L.; Xie, H.; Liu, J. Electrospinning of nanofibers for energy applications. Nanomaterials 2016, 6, 129. [Google Scholar] [CrossRef] [PubMed] [Green Version]
- Lv, D.; Wang, R.; Tang, G.; Mou, Z.; Lei, J.; Han, J.; De Smedt, S.; Xiong, R.; Huang, C. Ecofriendly Electrospun Membranes Loaded with Visible-Light-Responding Nanoparticles for Multifunctional Usages: Highly Efficient Air Filtration, Dye Scavenging, and Bactericidal Activity. ACS Appl. Mater. Interfaces 2019, 11, 12880–12889. [Google Scholar] [CrossRef] [PubMed] [Green Version]
- Jiang, S.; Uch, B.; Agarwal, S.; Greiner, A. Ultralight, Thermally Insulating, Compressible Polyimide Fiber Assembled Sponges. ACS Appl. Mater. Interfaces 2017, 9, 32308–32315. [Google Scholar] [CrossRef] [PubMed]
- Arrieta, M.P.; Gil, A.L.; Yusef, M.; Kenny, J.M.; Peponi, L. Electrospinning of PCL-based blends: Processing optimization for their scalable production. Materials 2020, 13, 3853. [Google Scholar] [CrossRef]
- Rowe, M.J.; Kamocki, K.; Pankajakshan, D.; Li, D.; Bruzzaniti, A.; Thomas, V.; Blanchard, S.B.; Bottino, M.C. Dimensionally stable and bioactive membrane for guided bone regeneration: An in vitro study. J. Biomed. Mater. Res. Part. B Appl. Biomater. 2016, 104, 594–605. [Google Scholar] [CrossRef] [Green Version]
- Araque-Monrós, M.C.; Vidaurre, A.; Gil-Santos, L.; Gironés Bernabé, S.; Monleón-Pradas, M.; Más-Estellés, J. Study of the degradation of a new PLA braided biomaterial in buffer phosphate saline, basic and acid media, intended for the regeneration of tendons and ligaments. Polym. Degrad. Stab. 2013, 98, 1563–1570. [Google Scholar] [CrossRef]
- Arrieta, M.P.; Peponi, L. Polyurethane based on PLA and PCL incorporated with catechin: Structural, thermal and mechanical characterization. Eur. Polym. J. 2017, 89, 174–184. [Google Scholar] [CrossRef]
- Arrieta, M.P.; López, J.; López, D.; Kenny, J.M.; Peponi, L. Biodegradable electrospun bionanocomposite fibers based on plasticized PLA–PHB blends reinforced with cellulose nanocrystals. Ind. Crops Prod. 2016, 93, 290–301. [Google Scholar] [CrossRef]
- Navarro-Baena, I.; Marcos-Fernandez, A.; Kenny, J.M.; Peponi, L. Crystallization behavior of diblock copolymers based on PCL and PLLA biopolymers. J. Appl. Crystallogr. 2014, 47, 1948–1957. [Google Scholar] [CrossRef] [Green Version]
- Burgos, N.; Tolaguera, D.; Fiori, S.; Jiménez, A. Synthesis and Characterization of Lactic Acid Oligomers: Evaluation of Performance as Poly(Lactic Acid) Plasticizers. J. Polym. Environ. 2014, 22, 227–235. [Google Scholar] [CrossRef] [Green Version]
- da Silva, D.; Kaduri, M.; Poley, M.; Adir, O.; Krinsky, N.; Shainsky-Roitman, J.; Schroeder, A. Biocompatibility, biodegradation and excretion of polylactic acid (PLA) in medical implants and theranostic systems. Chem. Eng. J. 2018, 340, 9–14. [Google Scholar] [CrossRef] [PubMed]
- Ribeiro, C.; Sencadas, V.; Costa, C.M.; Gómez Ribelles, J.L.; Lanceros-Méndez, S. Tailoring the morphology and crystallinity of poly(L-lactide acid) electrospun membranes. Sci. Technol. Adv. Mater. 2011, 12, 015001. [Google Scholar] [CrossRef] [PubMed]
- Baraúna, G.; Coraça-Huber, D.C.; Duek, E.A. de R. In vitro degradation of Poly-L-co-D, L-lactic acid membranes. Mater. Res. 2012, 16, 221–226. [Google Scholar] [CrossRef] [Green Version]
- Nim, B.; Sreearunothai, P.; Petchsuk, A.; Opaprakasit, P. Preparation of TiO2-loaded electrospun fibers of polylactide/poly(vinylpyrrolidone) blends for use as catalysts in epoxidation of unsaturated oils. J. Nanoparticle Res. 2018, 20, 100. [Google Scholar] [CrossRef]
- Mujica-Garcia, A.; Navarro-Baena, I.; Kenny, J.M.; Peponi, L. Influence of the Processing Parameters on the Electrospinning of Biopolymeric Fibers. J. Renew. Mater. 2014, 2, 23–34. [Google Scholar] [CrossRef]
- Carrasco-Hernandez, S.; Gutierrez, J.; Peponi, L.; Tercjak, A. Optimization of the electrospinning processing-window to fabricate nanostructured PE-b-PEO and hybrid PE-b-PEO/EBBA fibers. Polym. Eng. Sci. 2017, 57, 1157–1167. [Google Scholar] [CrossRef]
- Leonés, A.; Sonseca, A.; López, D.; Fiori, S.; Peponi, L. Shape memory effect on electrospun PLA-based fibers tailoring their thermal response. Eur. Polym. J. 2019, 117, 217–226. [Google Scholar] [CrossRef]
- Peponi, L.; Navarro-Baena, I.; Báez, J.E.; Kenny, J.M.; Marcos-Fernández, A. Effect of the molecular weight on the crystallinity of PCL-b-PLLA di-block copolymers. Polymer 2012, 53, 4561–4568. [Google Scholar] [CrossRef] [Green Version]
- Navarro-Baena, I.; Kenny, J.M.; Peponi, L. Crystallization and thermal characterization of biodegradable tri-block copolymers and poly(ester-urethane)s based on PCL and PLLA. Polym. Degrad. Stab. 2014, 108, 140–150. [Google Scholar] [CrossRef]
- Arrieta, M.P.; Perdiguero, M.; Fiori, S.; Kenny, J.M.; Peponi, L. Biodegradable electrospun PLA-PHB fibers plasticized with oligomeric lactic acid. Polym. Degrad. Stab. 2020, 179, 109226. [Google Scholar] [CrossRef]
- Rodriguez-Navarro, C.; Linares-Fernandez, L.; Doehne, E.; Sebastian, E. Effects of ferrocyanide ions on NaCl crystallization in porous stone. J. Cryst. Growth 2002, 243, 503–516. [Google Scholar] [CrossRef] [Green Version]
- Martin, O.; Avérous, L. Poly(lactic acid): Plasticization and properties of biodegradable multiphase systems. Polymer 2001, 42, 6209–6219. [Google Scholar] [CrossRef]
- Arrieta, M.P.; López, J.; López, D.; Kenny, J.M.; Peponi, L. Effect of chitosan and catechin addition on the structural, thermal, mechanical and disintegration properties of plasticized electrospun PLA-PHB biocomposites. Polym. Degrad. Stab. 2016, 132, 145–156. [Google Scholar] [CrossRef]
- Dias, J.C.; Ribeiro, C.; Sencadas, V.; Botelho, G.; Ribelles, J.L.G.; Lanceros-Mendez, S. Influence of fiber diameter and crystallinity on the stability of electrospun poly(l-lactic acid) membranes to hydrolytic degradation. Polym. Test. 2012, 31, 770–776. [Google Scholar] [CrossRef]
- Zhang, J.; Tsuji, H.; Noda, I.; Ozaki, Y. Weak Intermolecular Interactions during the Melt Crystallization of Poly(L -lactide) Investigated by Two-Dimensional Infrared Correlation Spectroscopy. J. Phys. Chem. B 2004, 108, 11514–11520. [Google Scholar] [CrossRef]
- Zhang, J.; Duan, Y.; Sato, H.; Tsuji, H.; Noda, I.; Yan, S.; Ozaki, Y. Crystal Modifications and Thermal Behavior of Poly(L -lactic acid) Revealed by Infrared Spectroscopy. Macromolecules 2005, 38, 8012–8021. [Google Scholar] [CrossRef]
- Vasanthan, N.; Ly, O. Effect of microstructure on hydrolytic degradation studies of poly (l-lactic acid) by FTIR spectroscopy and differential scanning calorimetry. Polym. Degrad. Stab. 2009, 94, 1364–1372. [Google Scholar] [CrossRef]
- Tsuji, H.; Del Carpio, C.A. In Vitro Hydrolysis of Blends from Enantiomeric Poly(lactide)s. 3. Homocrystallized and Amorphous Blend Films. Biomacromolecules 2003, 4, 7–11. [Google Scholar] [CrossRef]
- Tsuji, H.; Mizuno, A.; Ikada, Y. Properties and morphology of poly(L-lactide). III. Effects of initial crystallinity on long-termin vitro hydrolysis of high molecular weight poly(L-lactide) film in phosphate-buffered solution. J. Appl. Polym. Sci. 2000, 77, 1452–1464. [Google Scholar] [CrossRef]
- Gorrasi, G.; Pantani, R. Hydrolysis and Biodegradation of Poly(lactic acid). In Synthesis, Structure and Properties of Poly(Lactic Acid); Di Lorenzo, M., Androsch, R., Eds.; Springer: Cham, Switzerland, 2017; Volume 279, pp. 119–151. [Google Scholar]
- Cifuentes, S.C.; Lieblich, M.; Saldaña, L.; González-Carrasco, J.L.; Benavente, R. In vitro degradation of biodegradable polylactic acid/Mg composites: Influence of nature and crystalline degree of the polymeric matrix. Materialia 2019, 6, 100270. [Google Scholar] [CrossRef]


| Sample | PLA (%) | OLA (%) | Diameter (nm) at T0 |
|---|---|---|---|
| PLA | 100 | 0 | 904 ± 33 |
| PLA90 | 90 | 10 | 875 ± 63 |
| PLA80 | 80 | 20 | 689 ± 34 |
| PLA70 | 70 | 30 | 486 ± 59 |
| T0 | T28 | T84 | ||
|---|---|---|---|---|
| Element | At (%) | At (%) | At (%) | |
| PLA | C | 58.98 | 61.33 | 60.79 |
| O | 40.97 | 33.67 | 36.05 | |
| Na | 0.00 | 3.09 | 1.86 | |
| Cl | 0.00 | 1.76 | 1.21 | |
| PLA90 | C | 58.02 | 60.62 | 59.88 |
| O | 41.98 | 35.42 | 38.13 | |
| Na | 0.00 | 2.18 | 1.22 | |
| Cl | 0.00 | 1.44 | 0.72 | |
| PLA80 | C | 59.77 | 61.74 | 60.95 |
| O | 40.23 | 33.74 | 36.05 | |
| Na | 0.00 | 2.28 | 1.54 | |
| Cl | 0.00 | 2.07 | 1.34 | |
| PLA70 | C | 58.05 | 62.47 | 62.57 |
| O | 41.95 | 33.92 | 30.52 | |
| Na | 0.00 | 1.76 | 3.38 | |
| Cl | 0.00 | 1.76 | 3.26 |
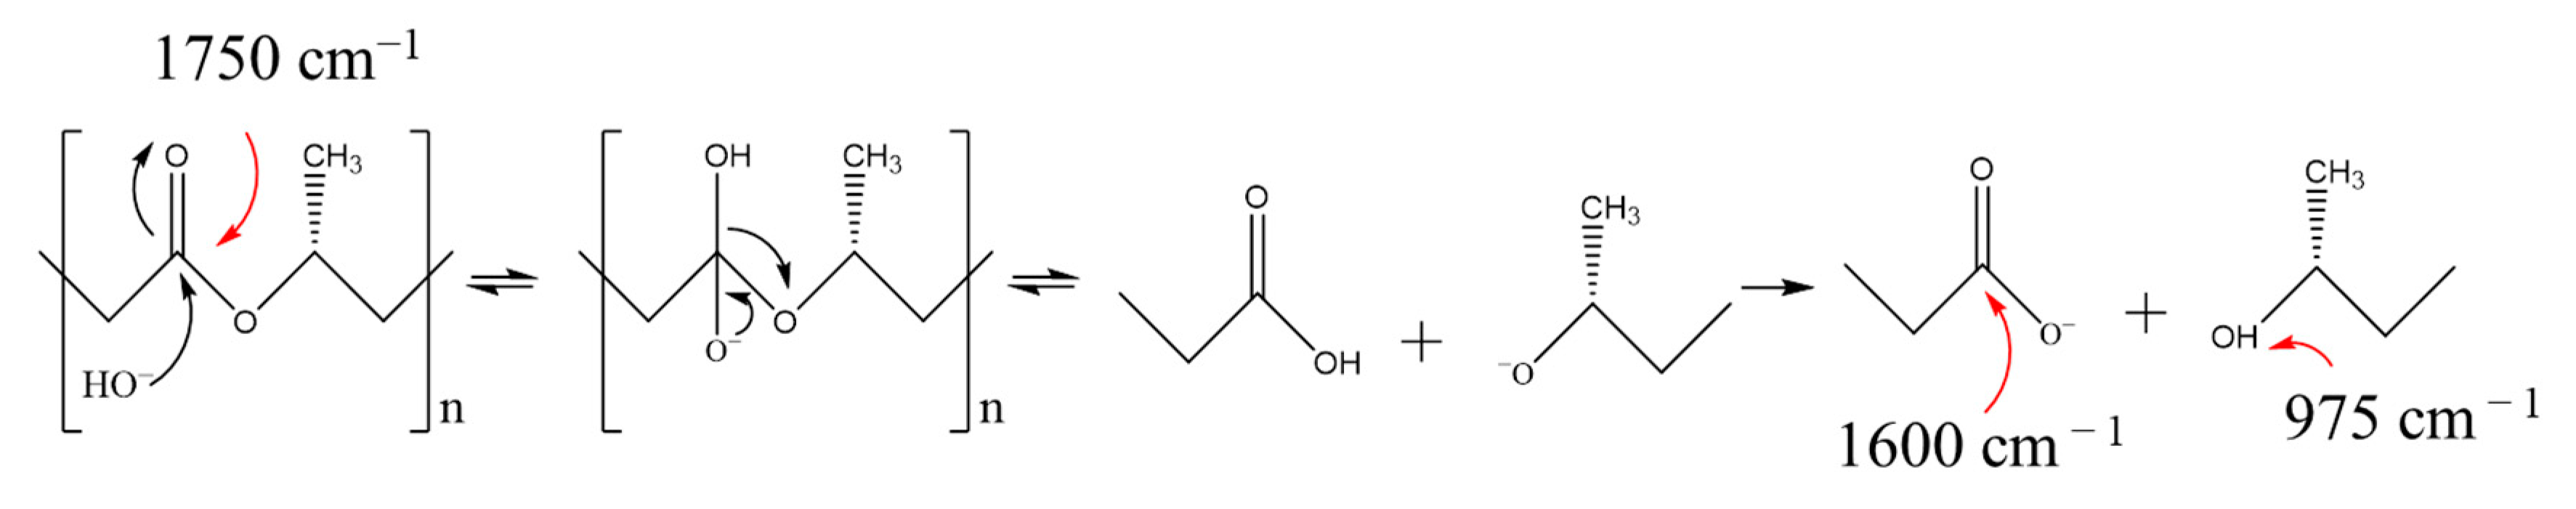
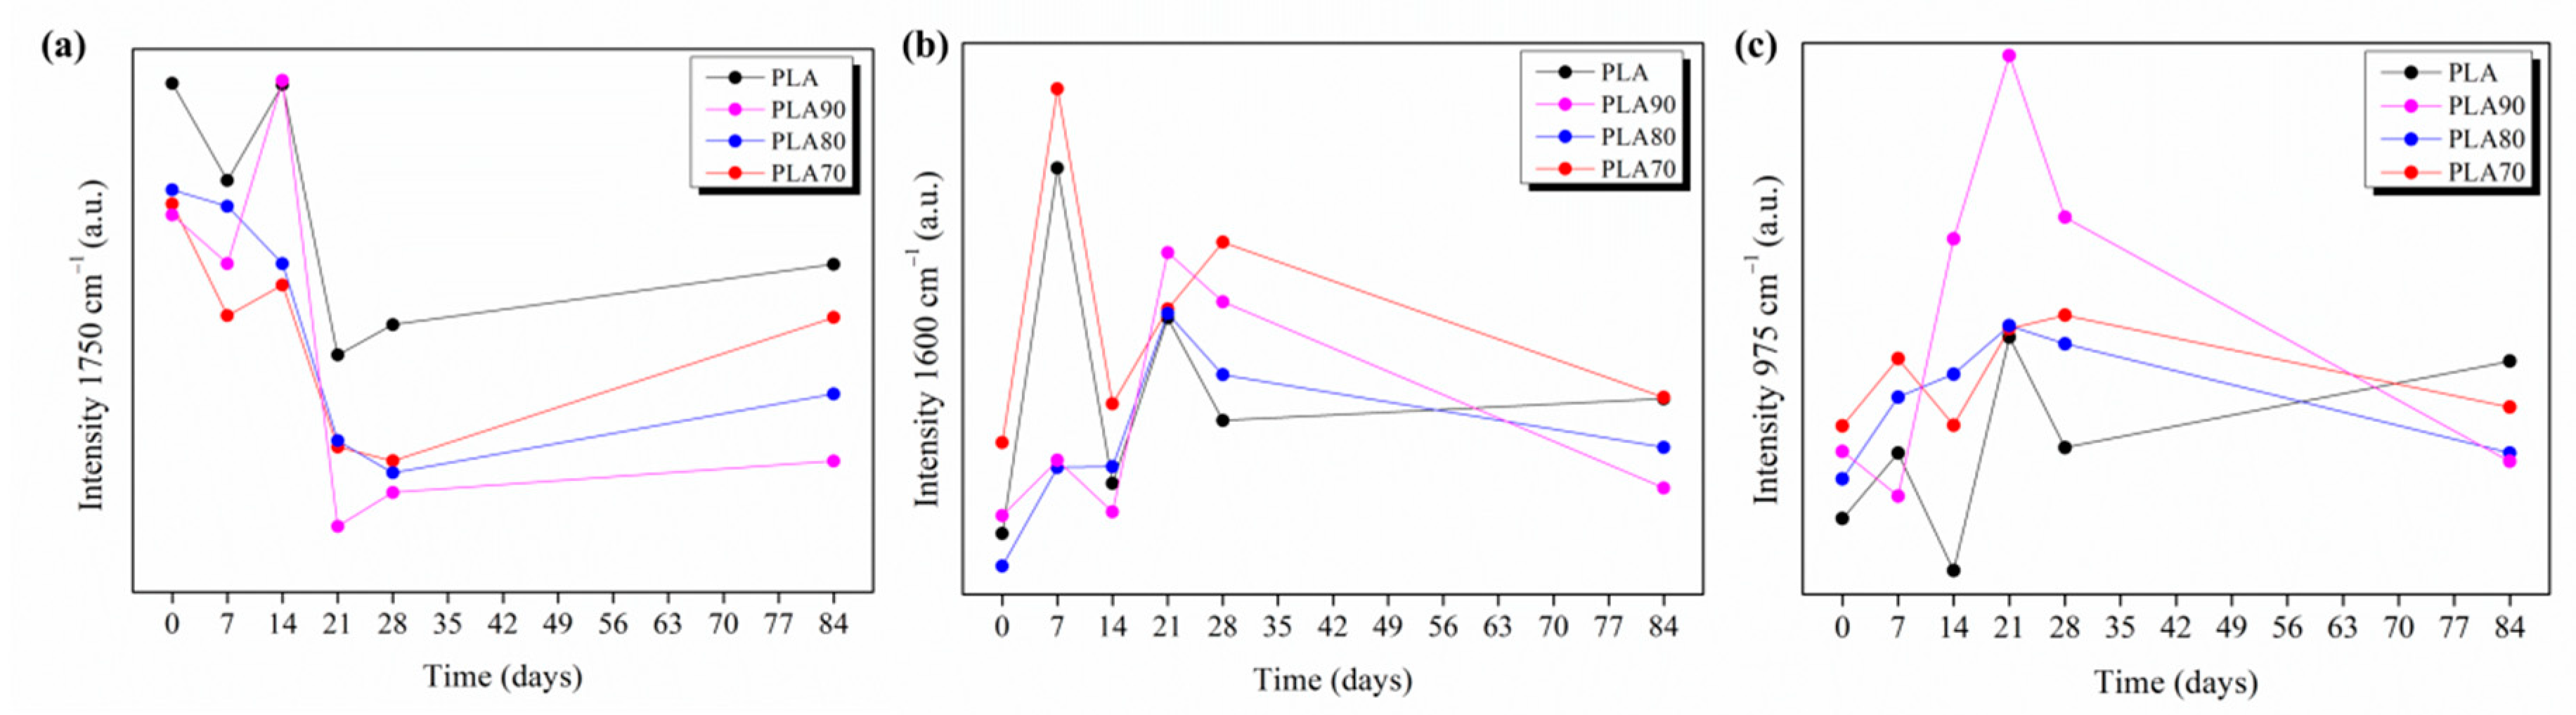
| IR Frequency (cm−1) | Phase Form | Assignment | Ref. No. |
|---|---|---|---|
| 1750 | Stretching of amorphous carbonyl (–C=O) group. | [22,33] | |
| 1600 | Stretching of carbonyl (–C=O) in carboxylate group. | [22,33] | |
| 975 | Bending of O–H group. | [22,33] | |
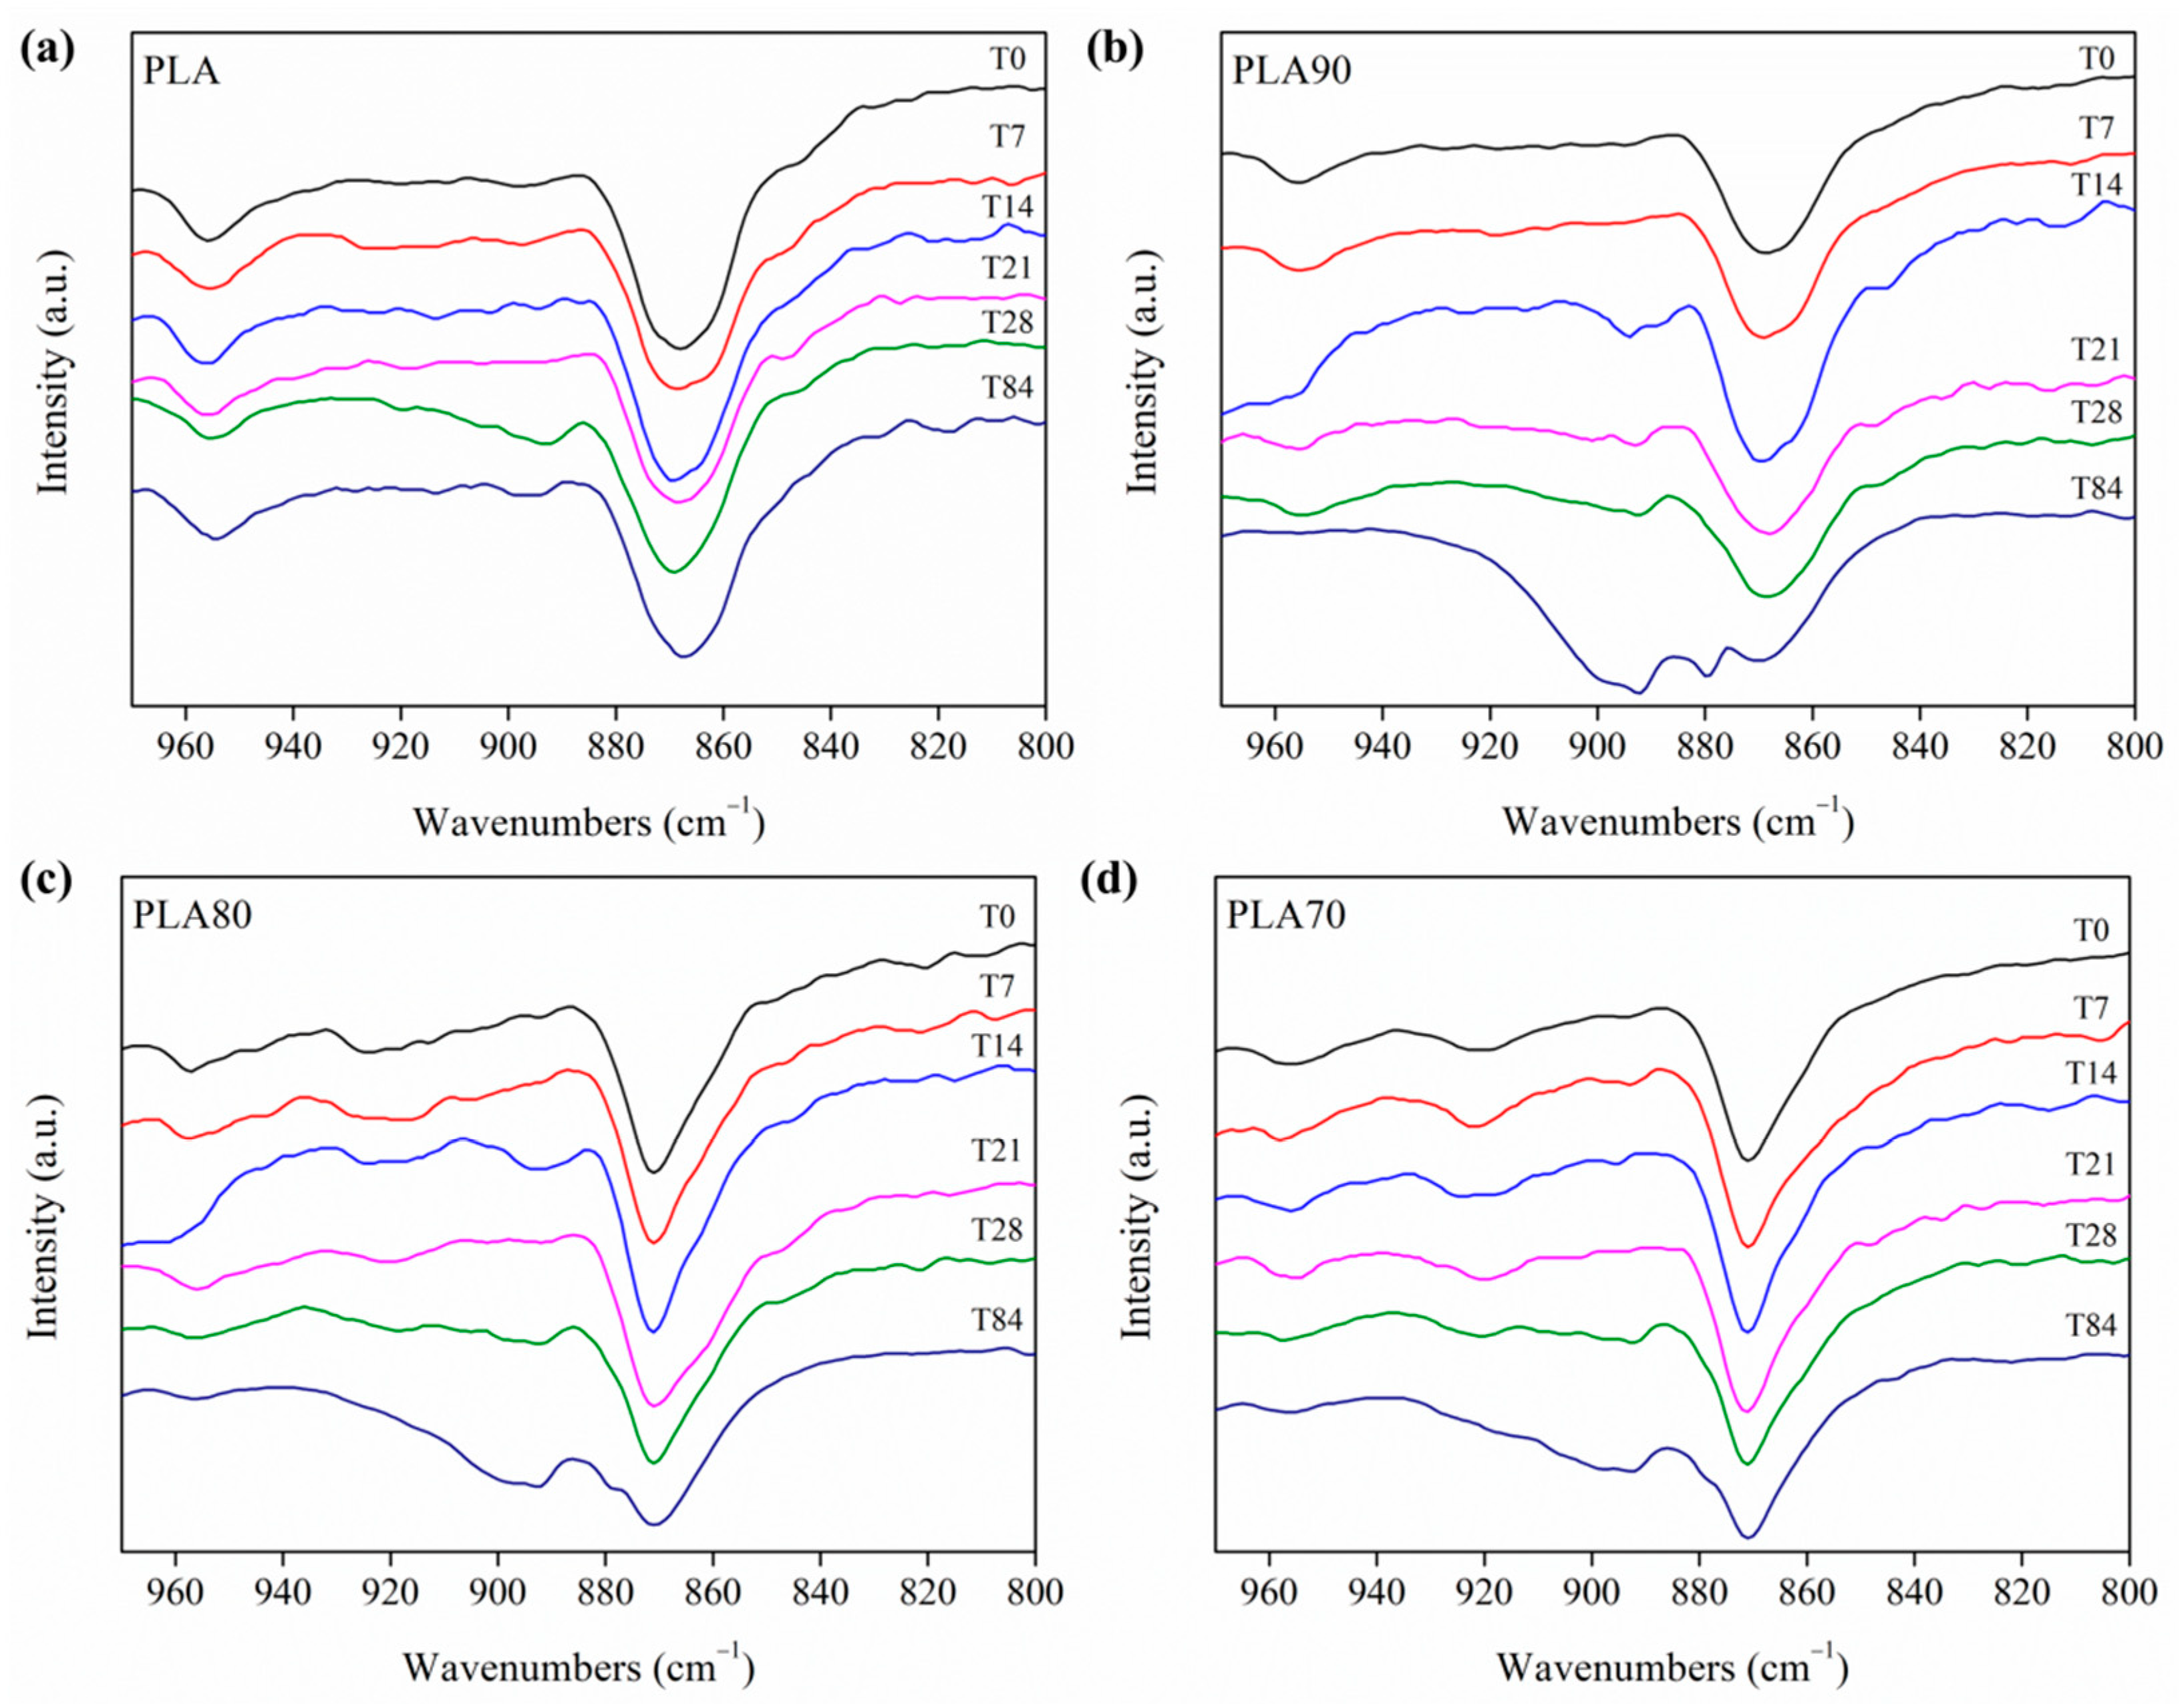
| 955 | Amorphous | [35,36,37] | |
| 908 | β | [22,36] | |
| 871 | α | [22,37] | |
| 860 | Amorphous | [22,35] |
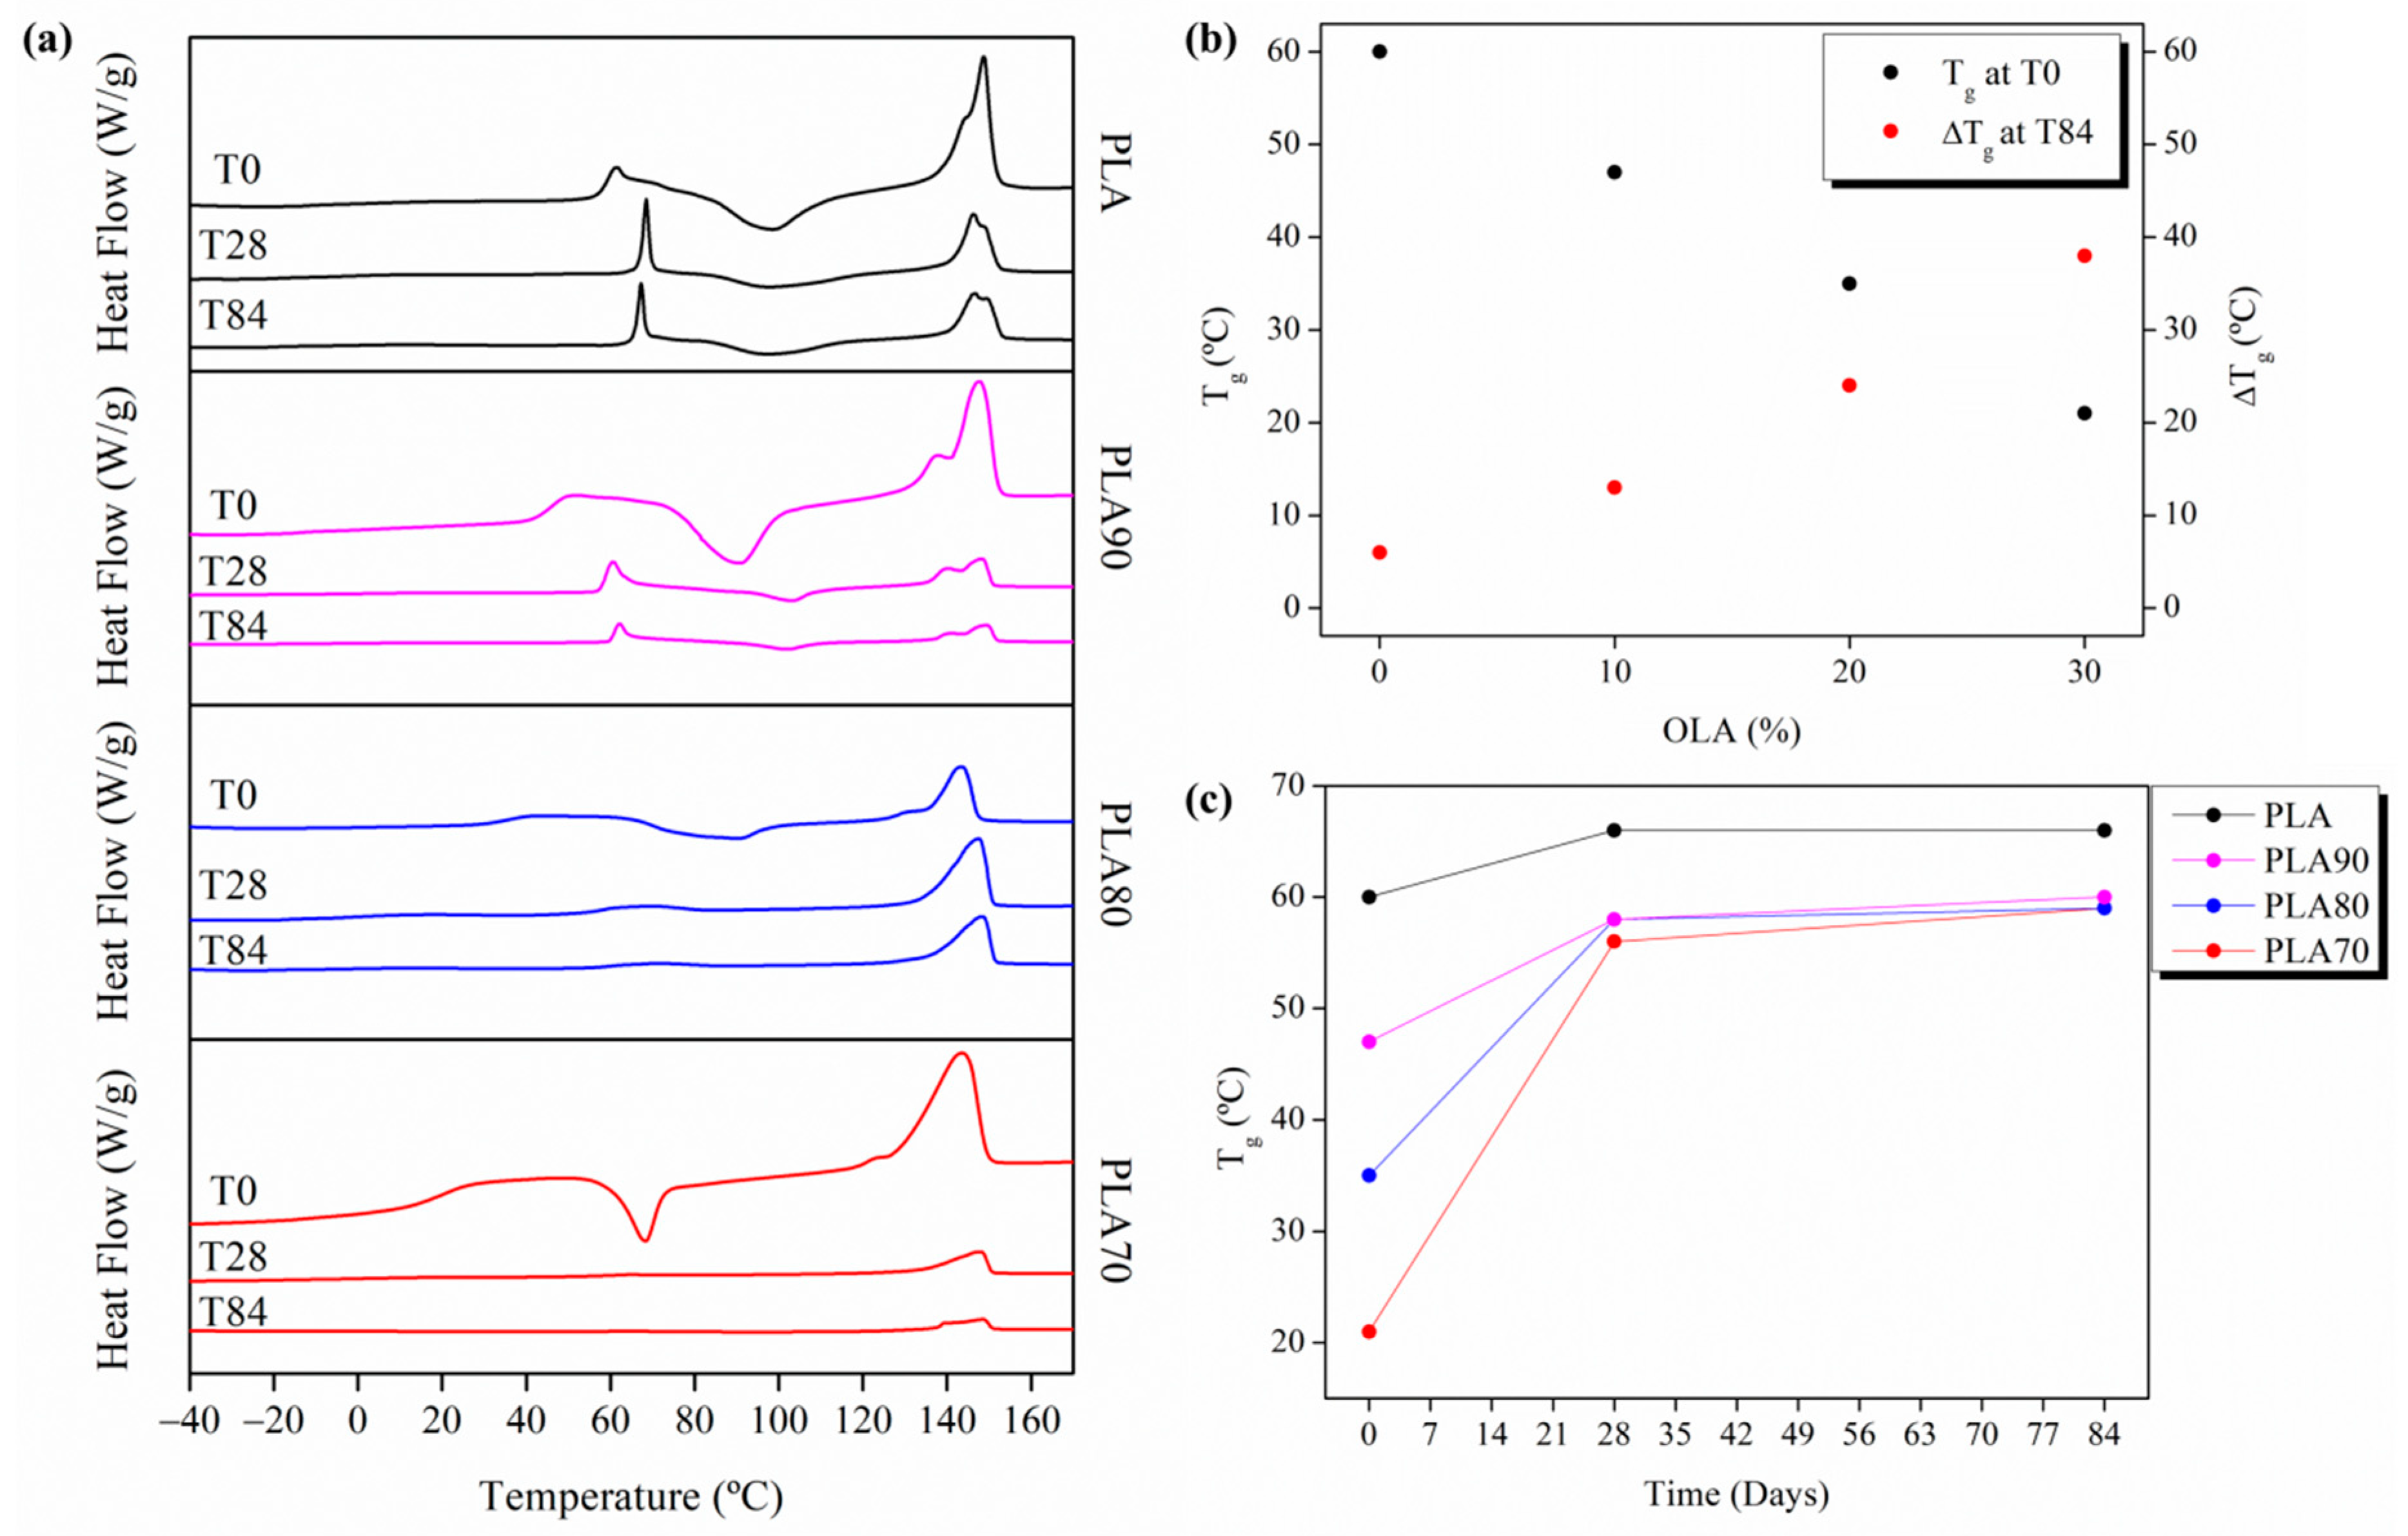
| Sample | hkl | 2θ (°) | D (nm) | Xc (%) XRD | Xc (%) DSC | |
|---|---|---|---|---|---|---|
| T0 | PLA | - | - | - | - | 0.8 |
| PLA90 | - | - | - | - | 1 | |
| PLA80 | - | - | - | - | 1 | |
| PLA70 | 010 | 15.1 | 3.2 | 45.1 | 27.4 | |
| 200/110 | 16.6 | 19.8 | ||||
| 203 | 18.7 | 3.9 | ||||
| 015 | 22.1 | 17.7 | ||||
| 207 | 27.5 | 64.4 | ||||
| 216 | 29.0 | 20.1 | ||||
| T84 | PLA | - | - | - | - | 7 |
| PLA90 | 010 | - | - | 10.4 | 10 | |
| 200/110 | 16.6 | 18.4 | ||||
| 203 | - | - | ||||
| 015 | - | - | ||||
| 207 | - | - | ||||
| 216 | 27.5 | 77.5 | ||||
| PLA80 | 010 | 15.1 | 4.4 | 47.5 | 38 | |
| 200/110 | 16.8 | 17.5 | ||||
| 203 | 19.1 | 9.8 | ||||
| 015 | 22.4 | 19.1 | ||||
| 207 | 27.5 | 55.7 | ||||
| 216 | 29.2 | 10.5 | ||||
| PLA70 | 010 | 15.2 | 4.0 | 52.1 | 47 | |
| 200/110 | 16.8 | 18.9 | ||||
| 203 | 19.1 | 12.2 | ||||
| 015 | 22.4 | 21.1 | ||||
| 207 | 27.5 | 64.4 | ||||
| 216 | 29.2 | 23.4 |
Publisher’s Note: MDPI stays neutral with regard to jurisdictional claims in published maps and institutional affiliations. |
© 2020 by the authors. Licensee MDPI, Basel, Switzerland. This article is an open access article distributed under the terms and conditions of the Creative Commons Attribution (CC BY) license (http://creativecommons.org/licenses/by/4.0/).
Share and Cite
Leonés, A.; Peponi, L.; Lieblich, M.; Benavente, R.; Fiori, S. In Vitro Degradation of Plasticized PLA Electrospun Fiber Mats: Morphological, Thermal and Crystalline Evolution. Polymers 2020, 12, 2975. https://doi.org/10.3390/polym12122975
Leonés A, Peponi L, Lieblich M, Benavente R, Fiori S. In Vitro Degradation of Plasticized PLA Electrospun Fiber Mats: Morphological, Thermal and Crystalline Evolution. Polymers. 2020; 12(12):2975. https://doi.org/10.3390/polym12122975
Chicago/Turabian StyleLeonés, Adrián, Laura Peponi, Marcela Lieblich, Rosario Benavente, and Stefano Fiori. 2020. "In Vitro Degradation of Plasticized PLA Electrospun Fiber Mats: Morphological, Thermal and Crystalline Evolution" Polymers 12, no. 12: 2975. https://doi.org/10.3390/polym12122975