Morphological, Electrical, and Chemical Characteristics of Poly(sodium 4-styrenesulfonate) Coated PVDF Ultrafiltration Membranes after Plasma Treatment

 , , , , , ,
Abstract
:
1. Introduction
2. Material and Methods
2.1. Materials and Chemicals
2.2. Membrane Modification
2.3. Membrane Characterization.
2.3.1. Atomic Force Microscopy
2.3.2. Liquid-liquid Displacement Porometry
2.3.3. Electrical Impedance Spectroscopy
2.3.4. X-Ray Photoelectron Spectroscopy
2.3.5. Raman Spectroscopy
3. Results and Discussion
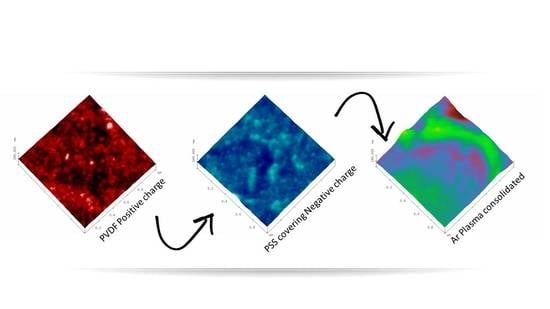
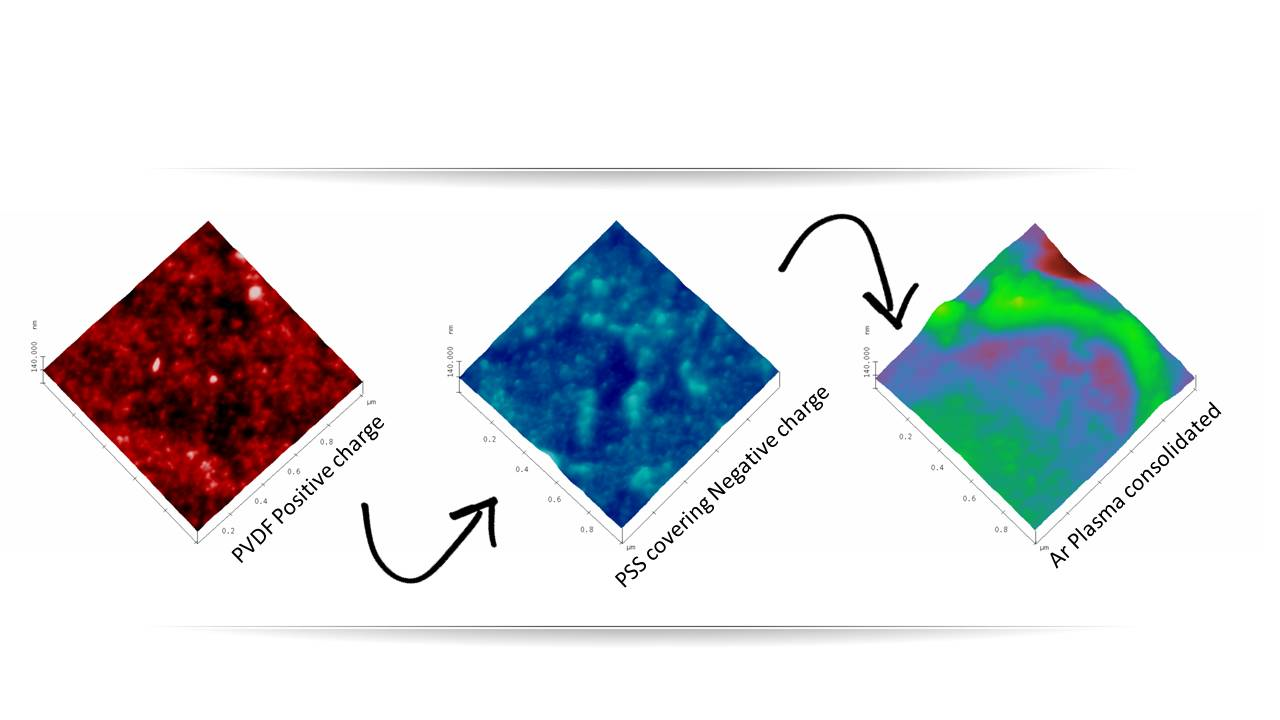
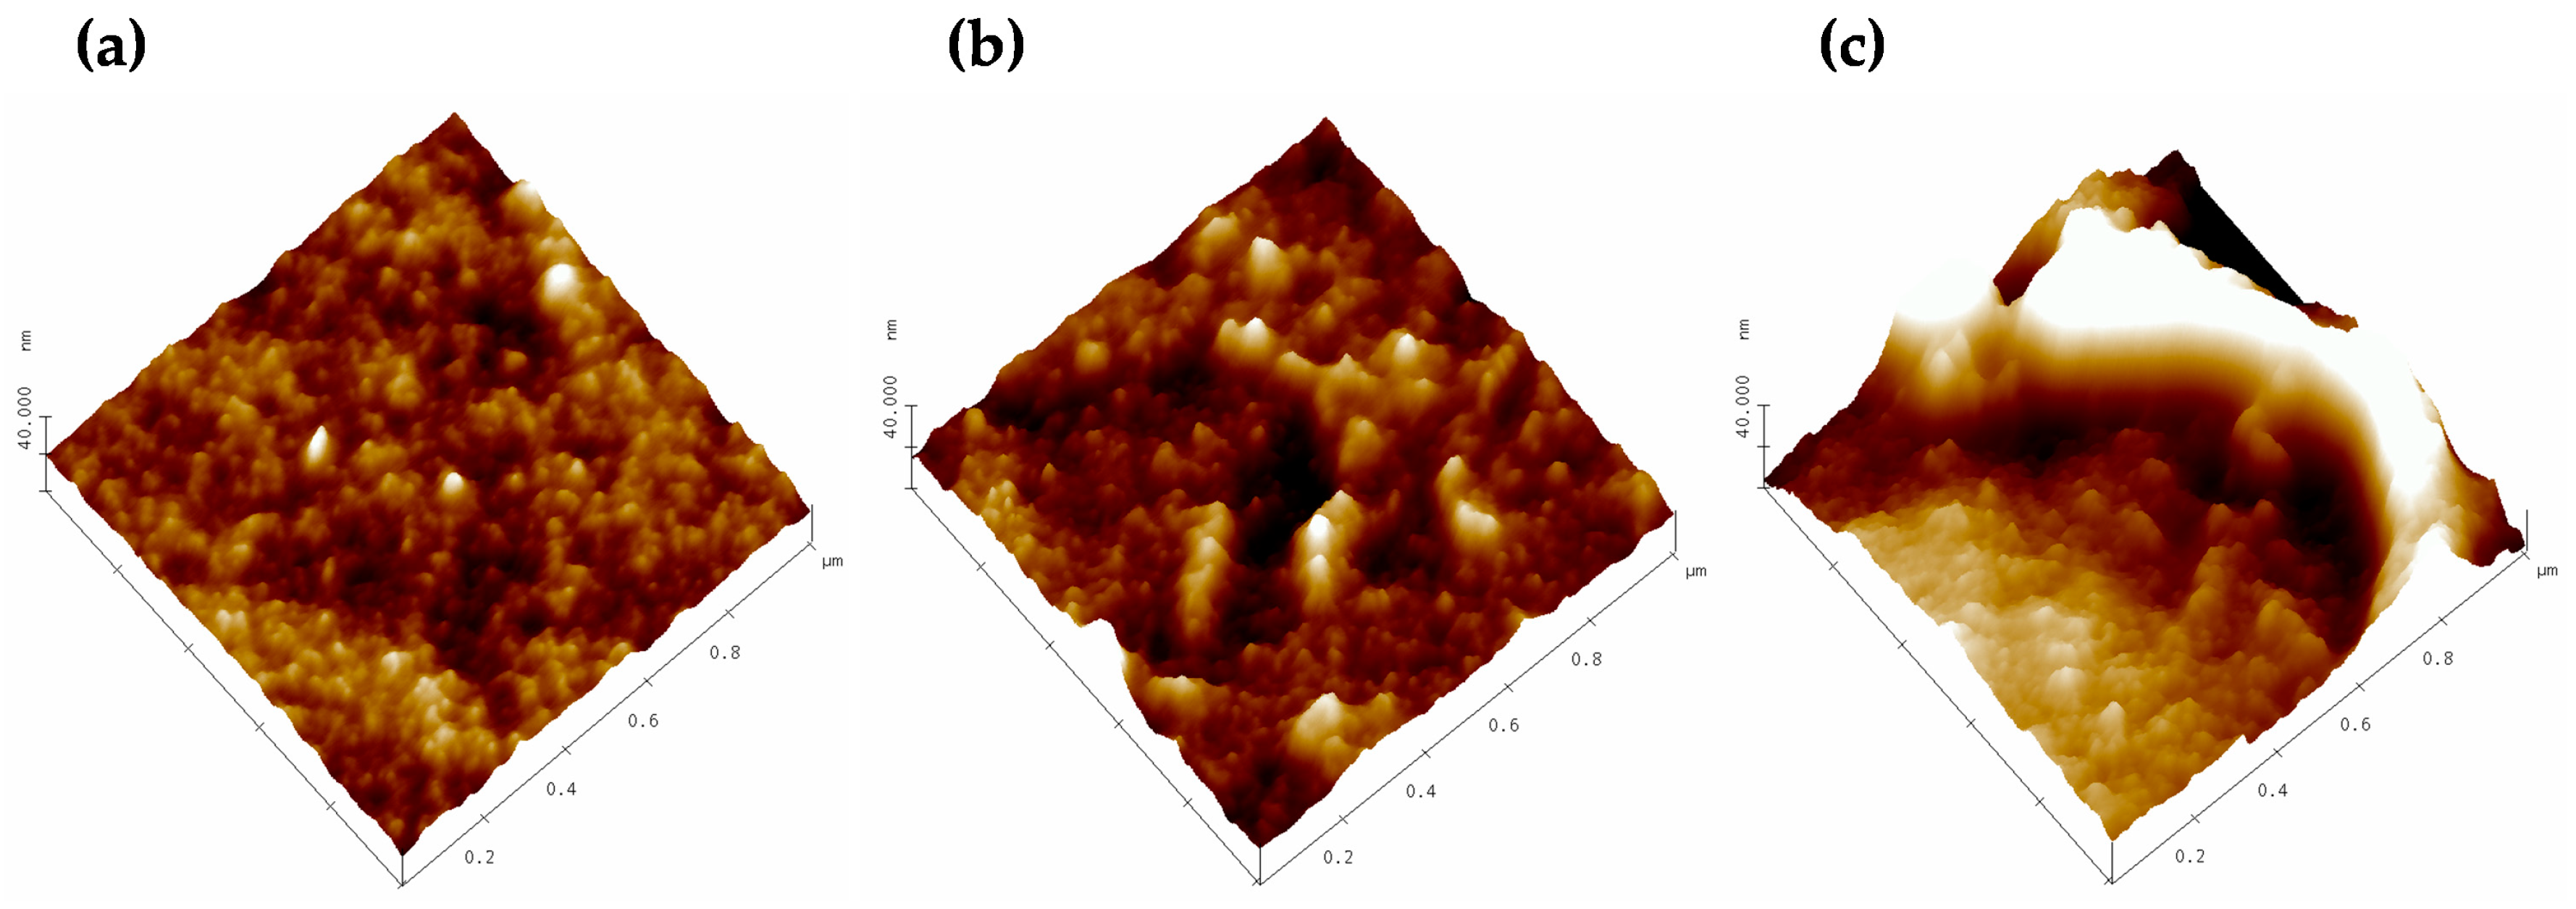
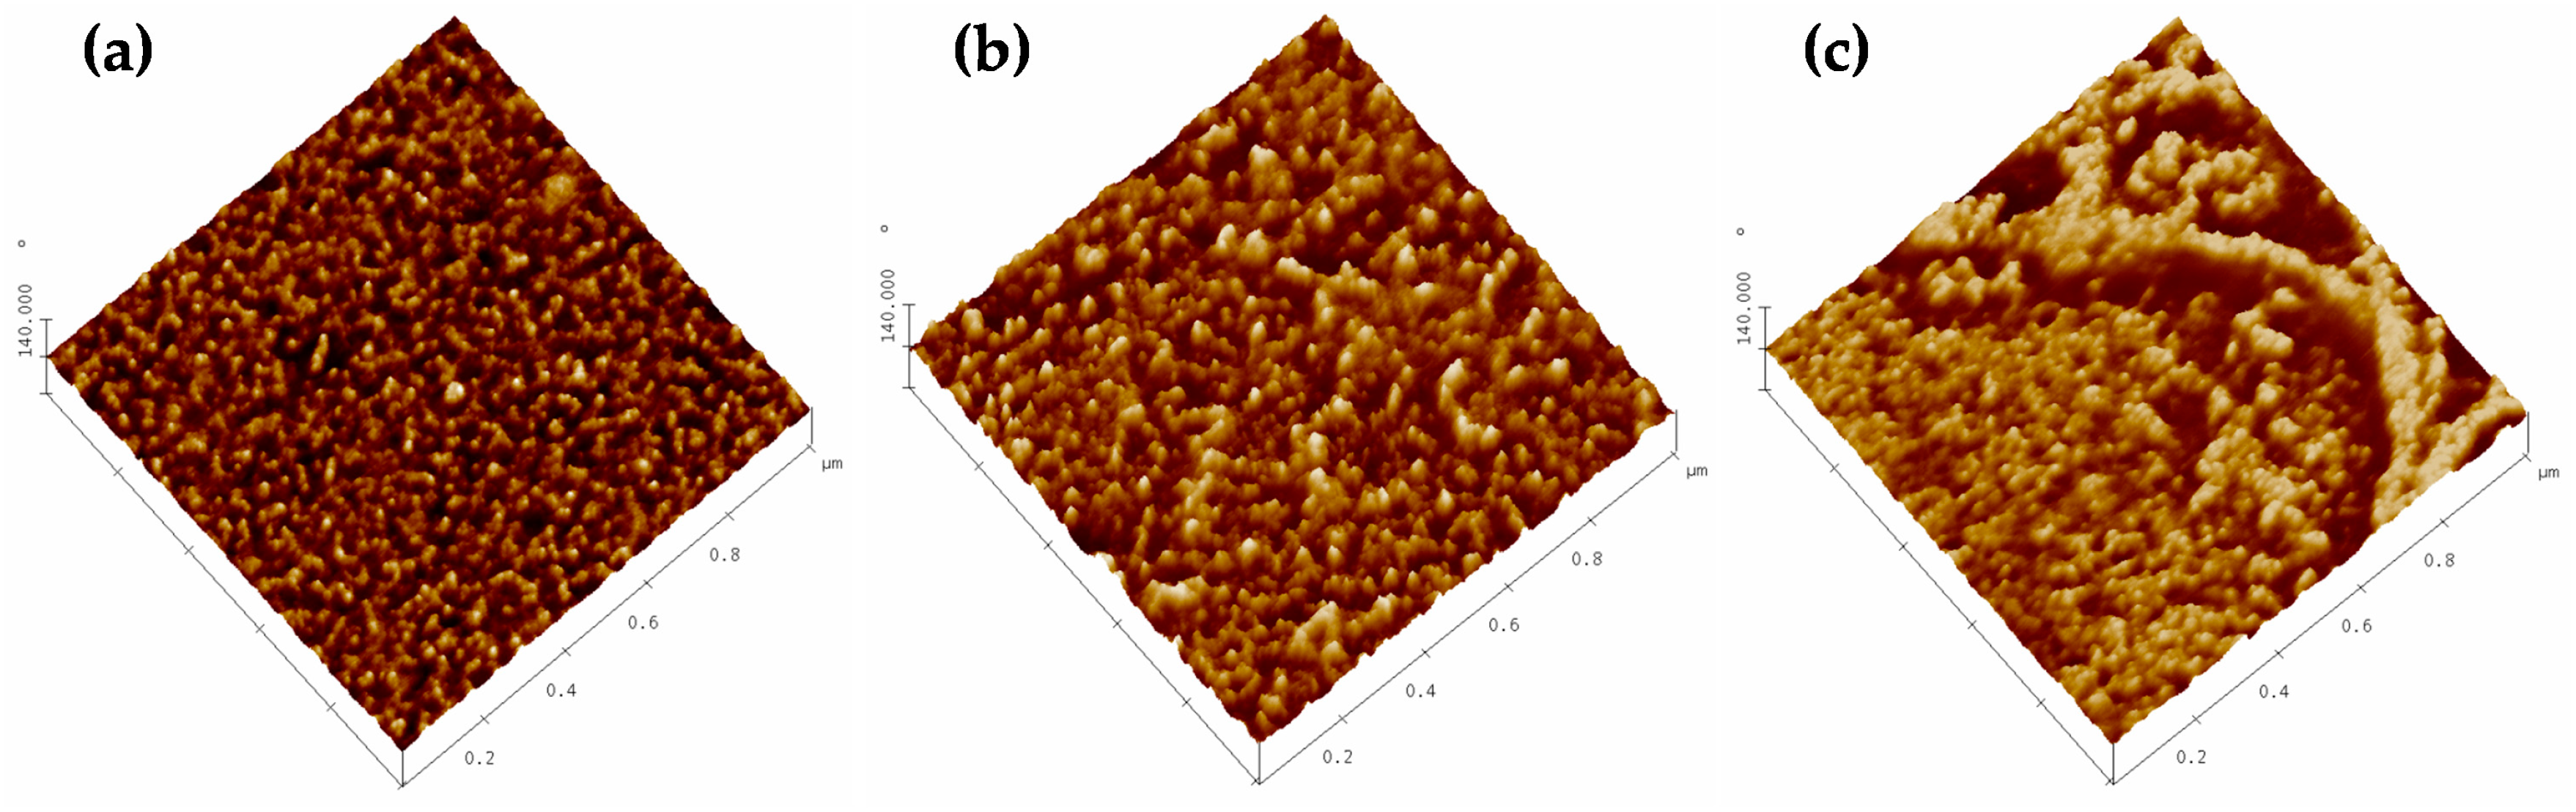
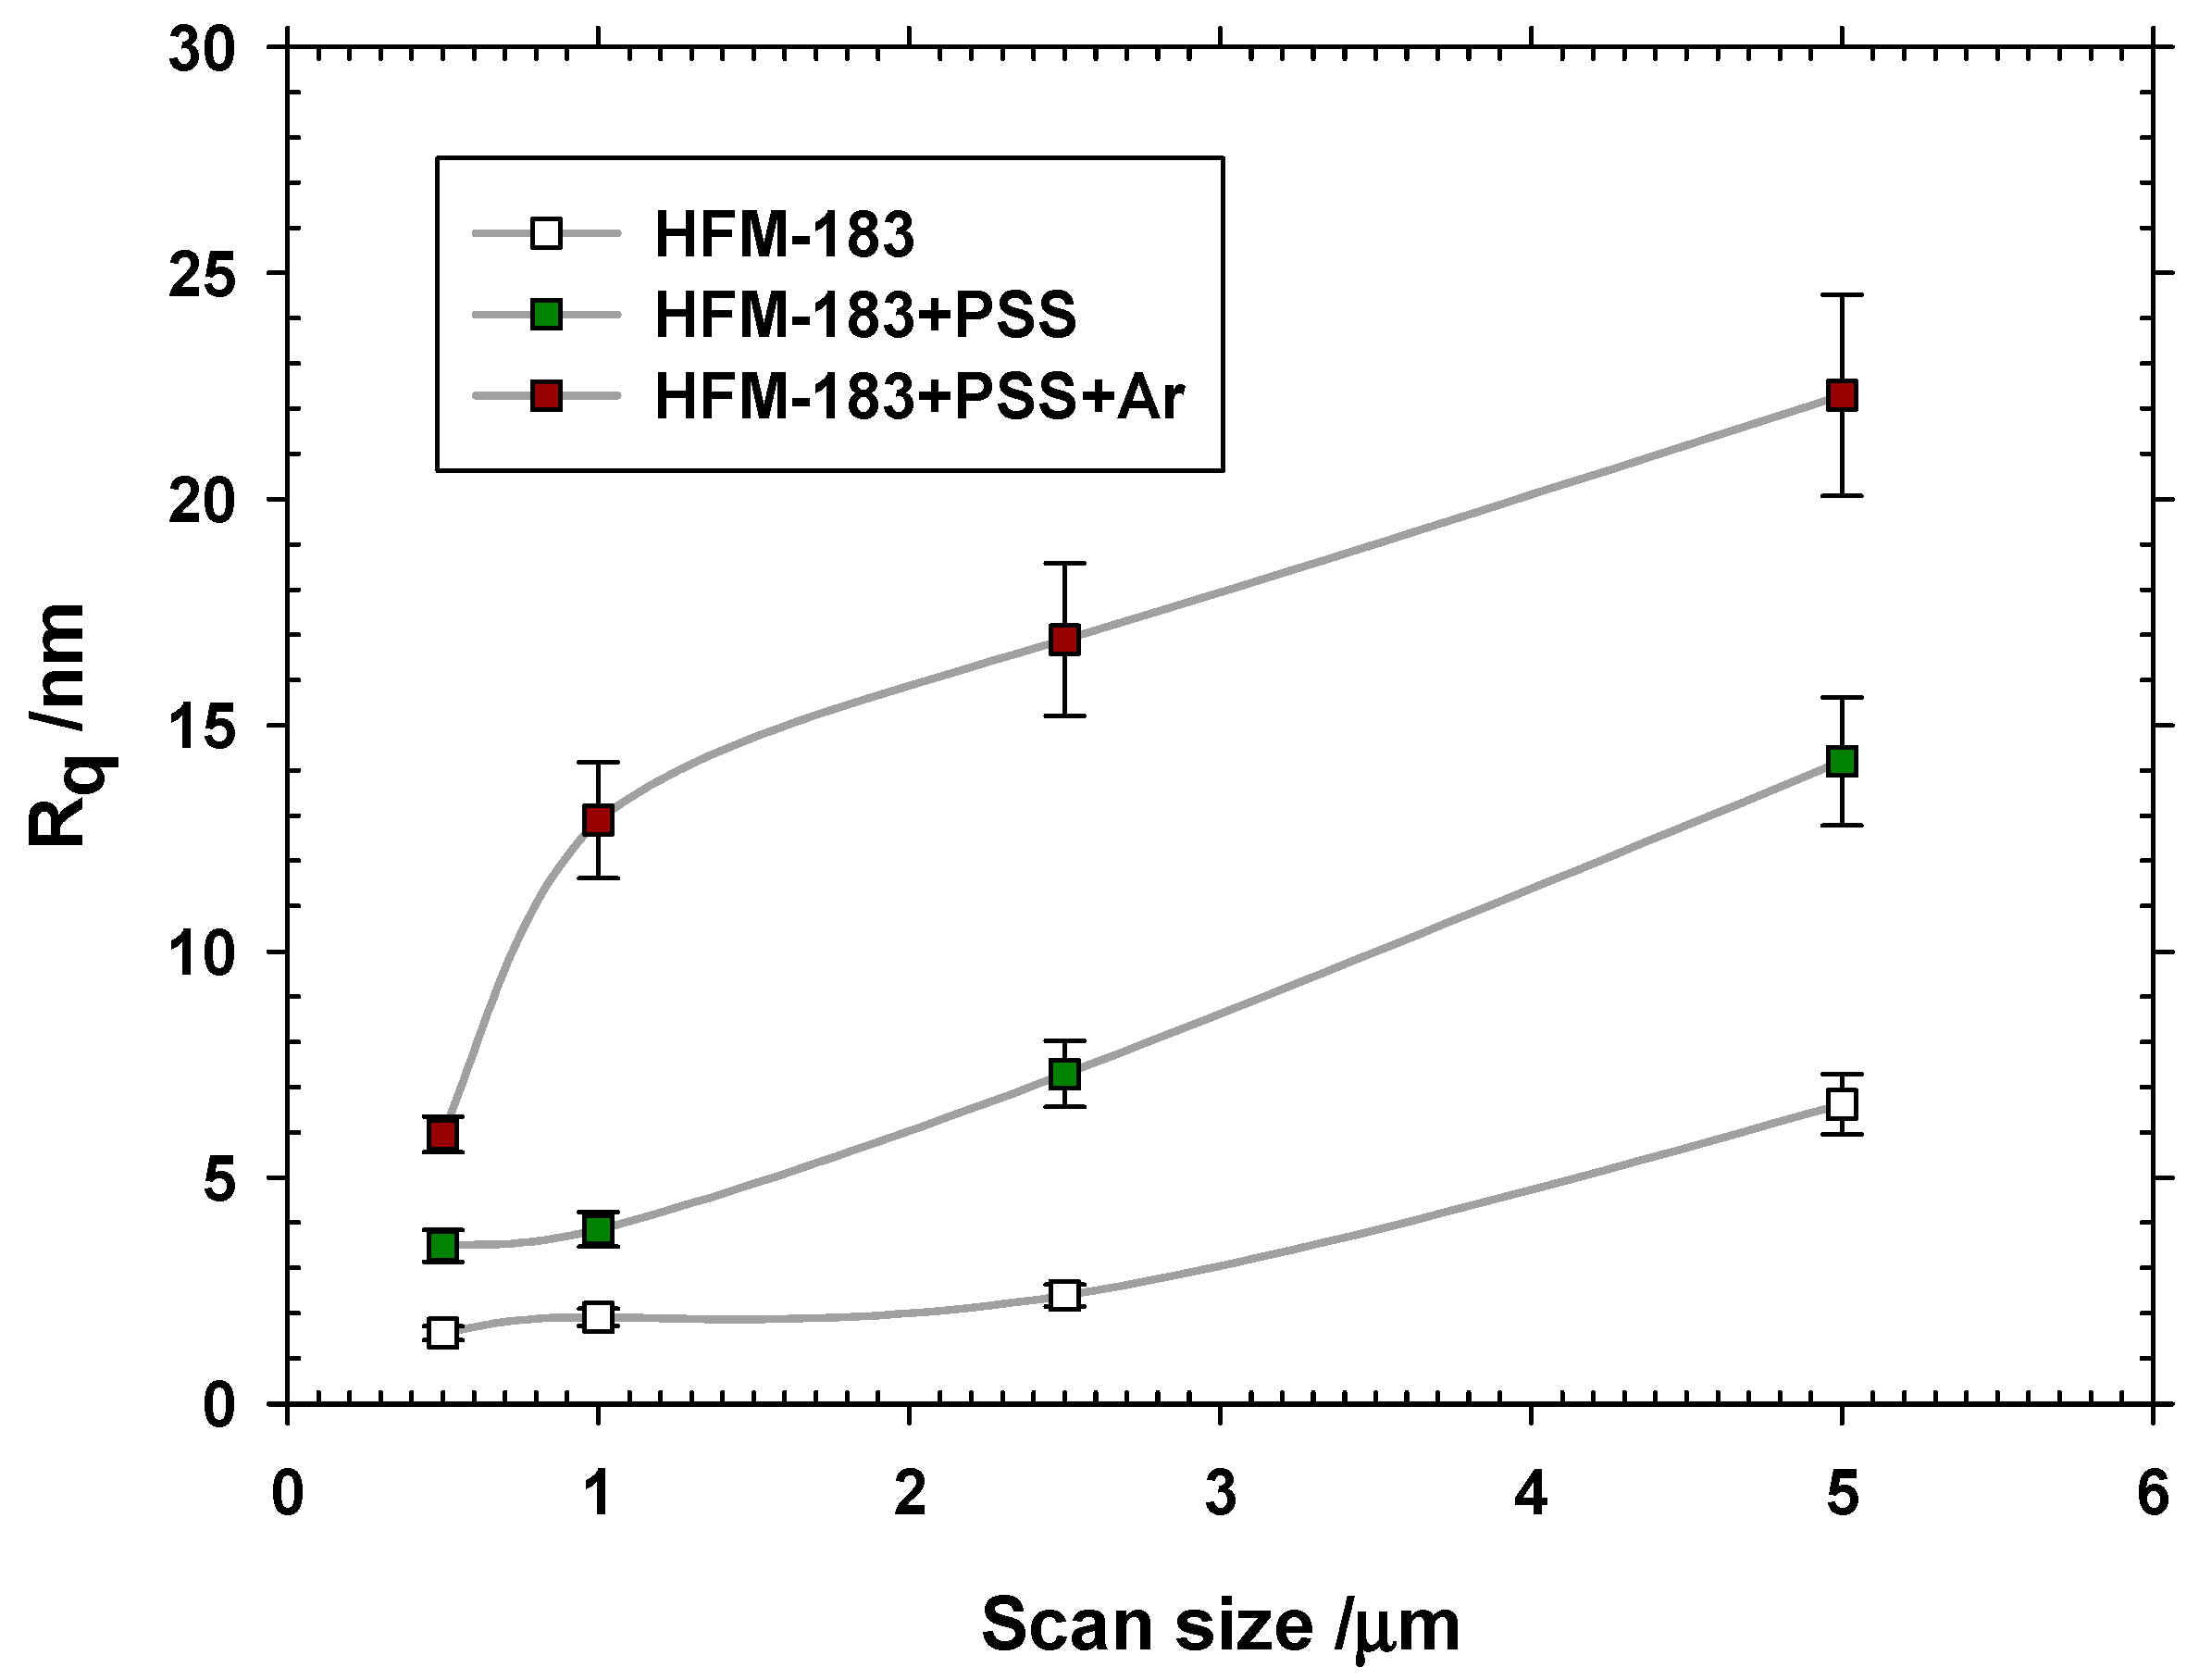
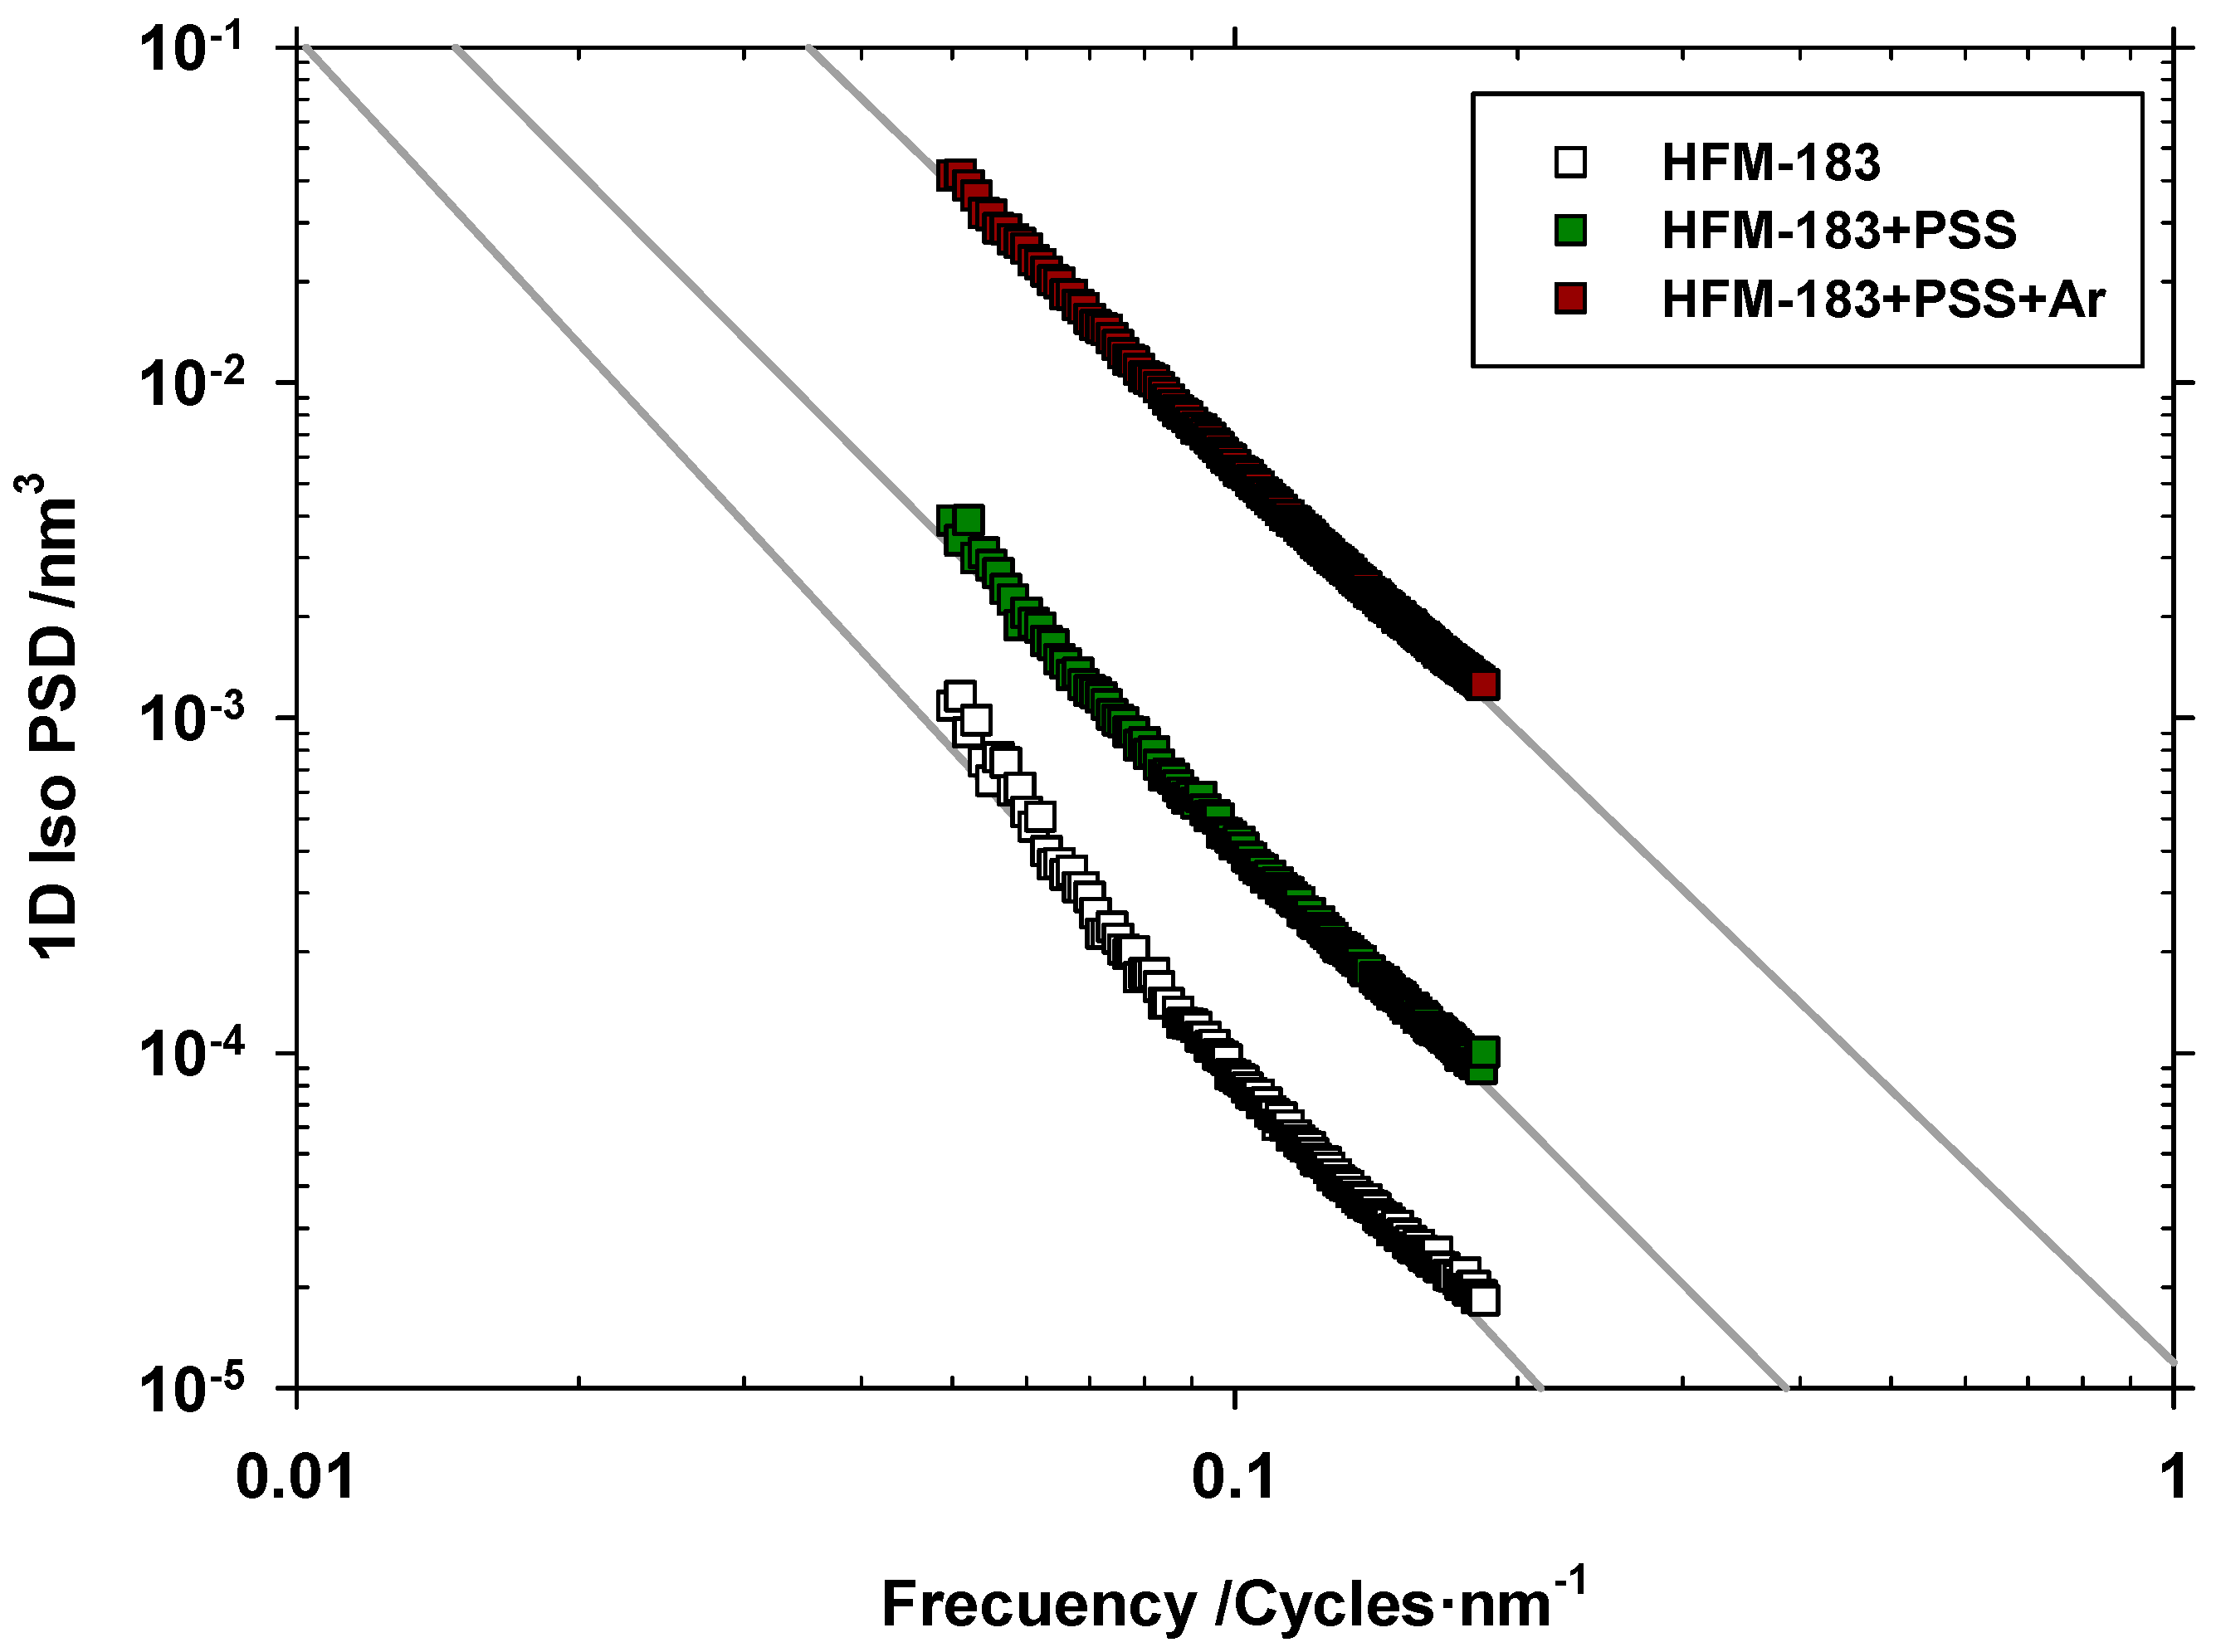
3.1. Atomic Force Microscopy.
3.2. Liquid-liquid Displacement Porometry
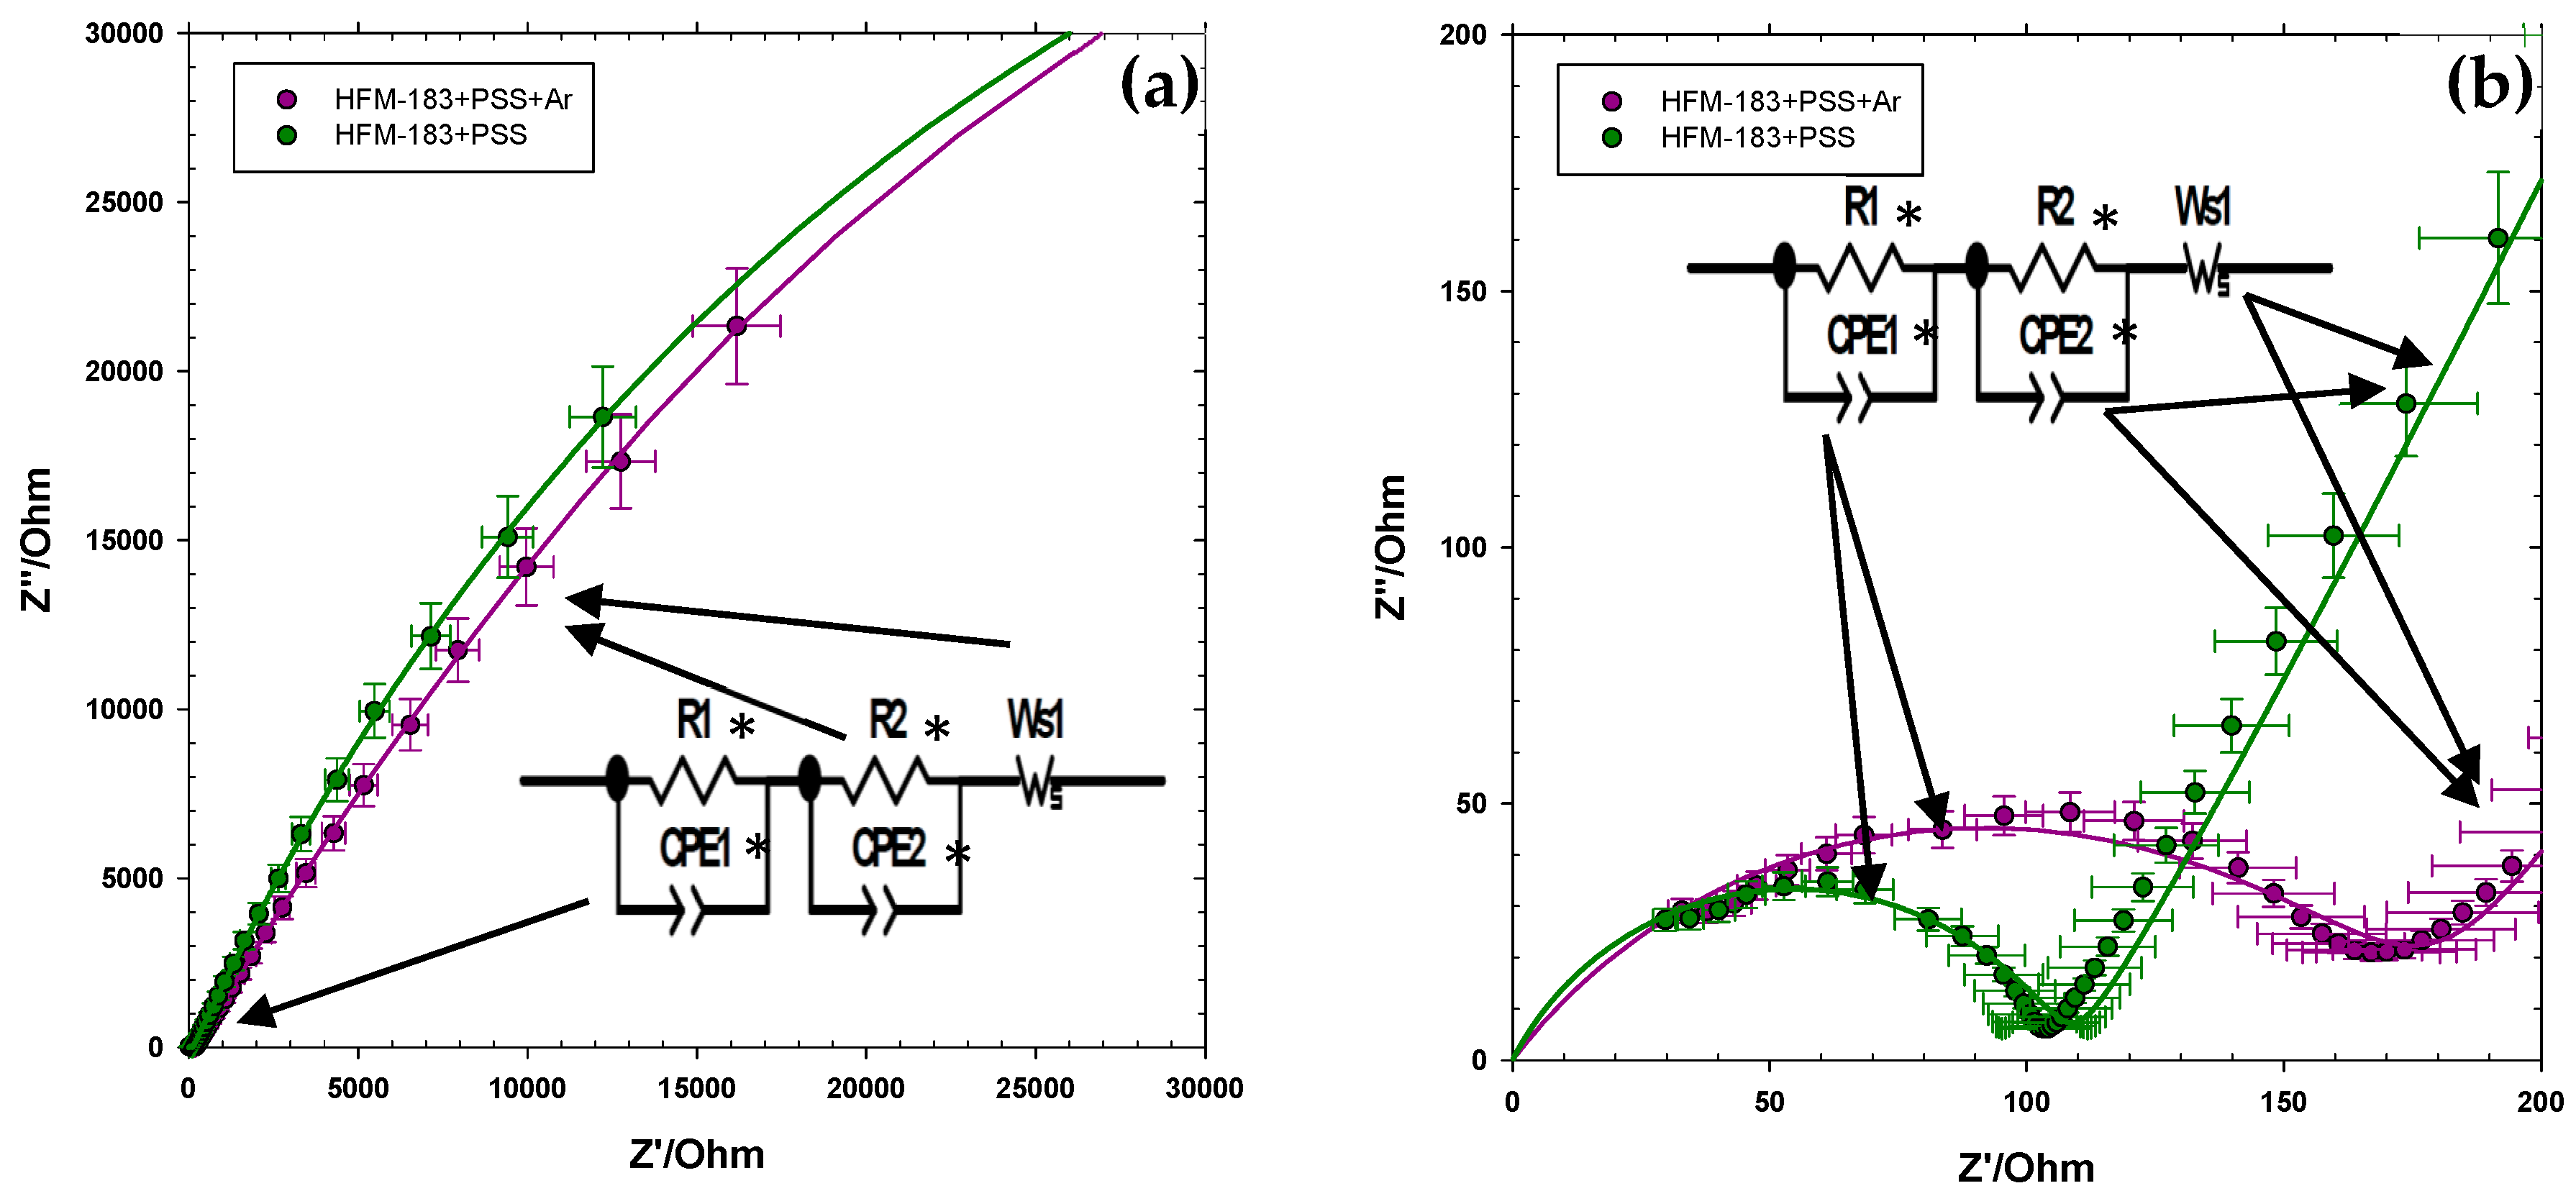
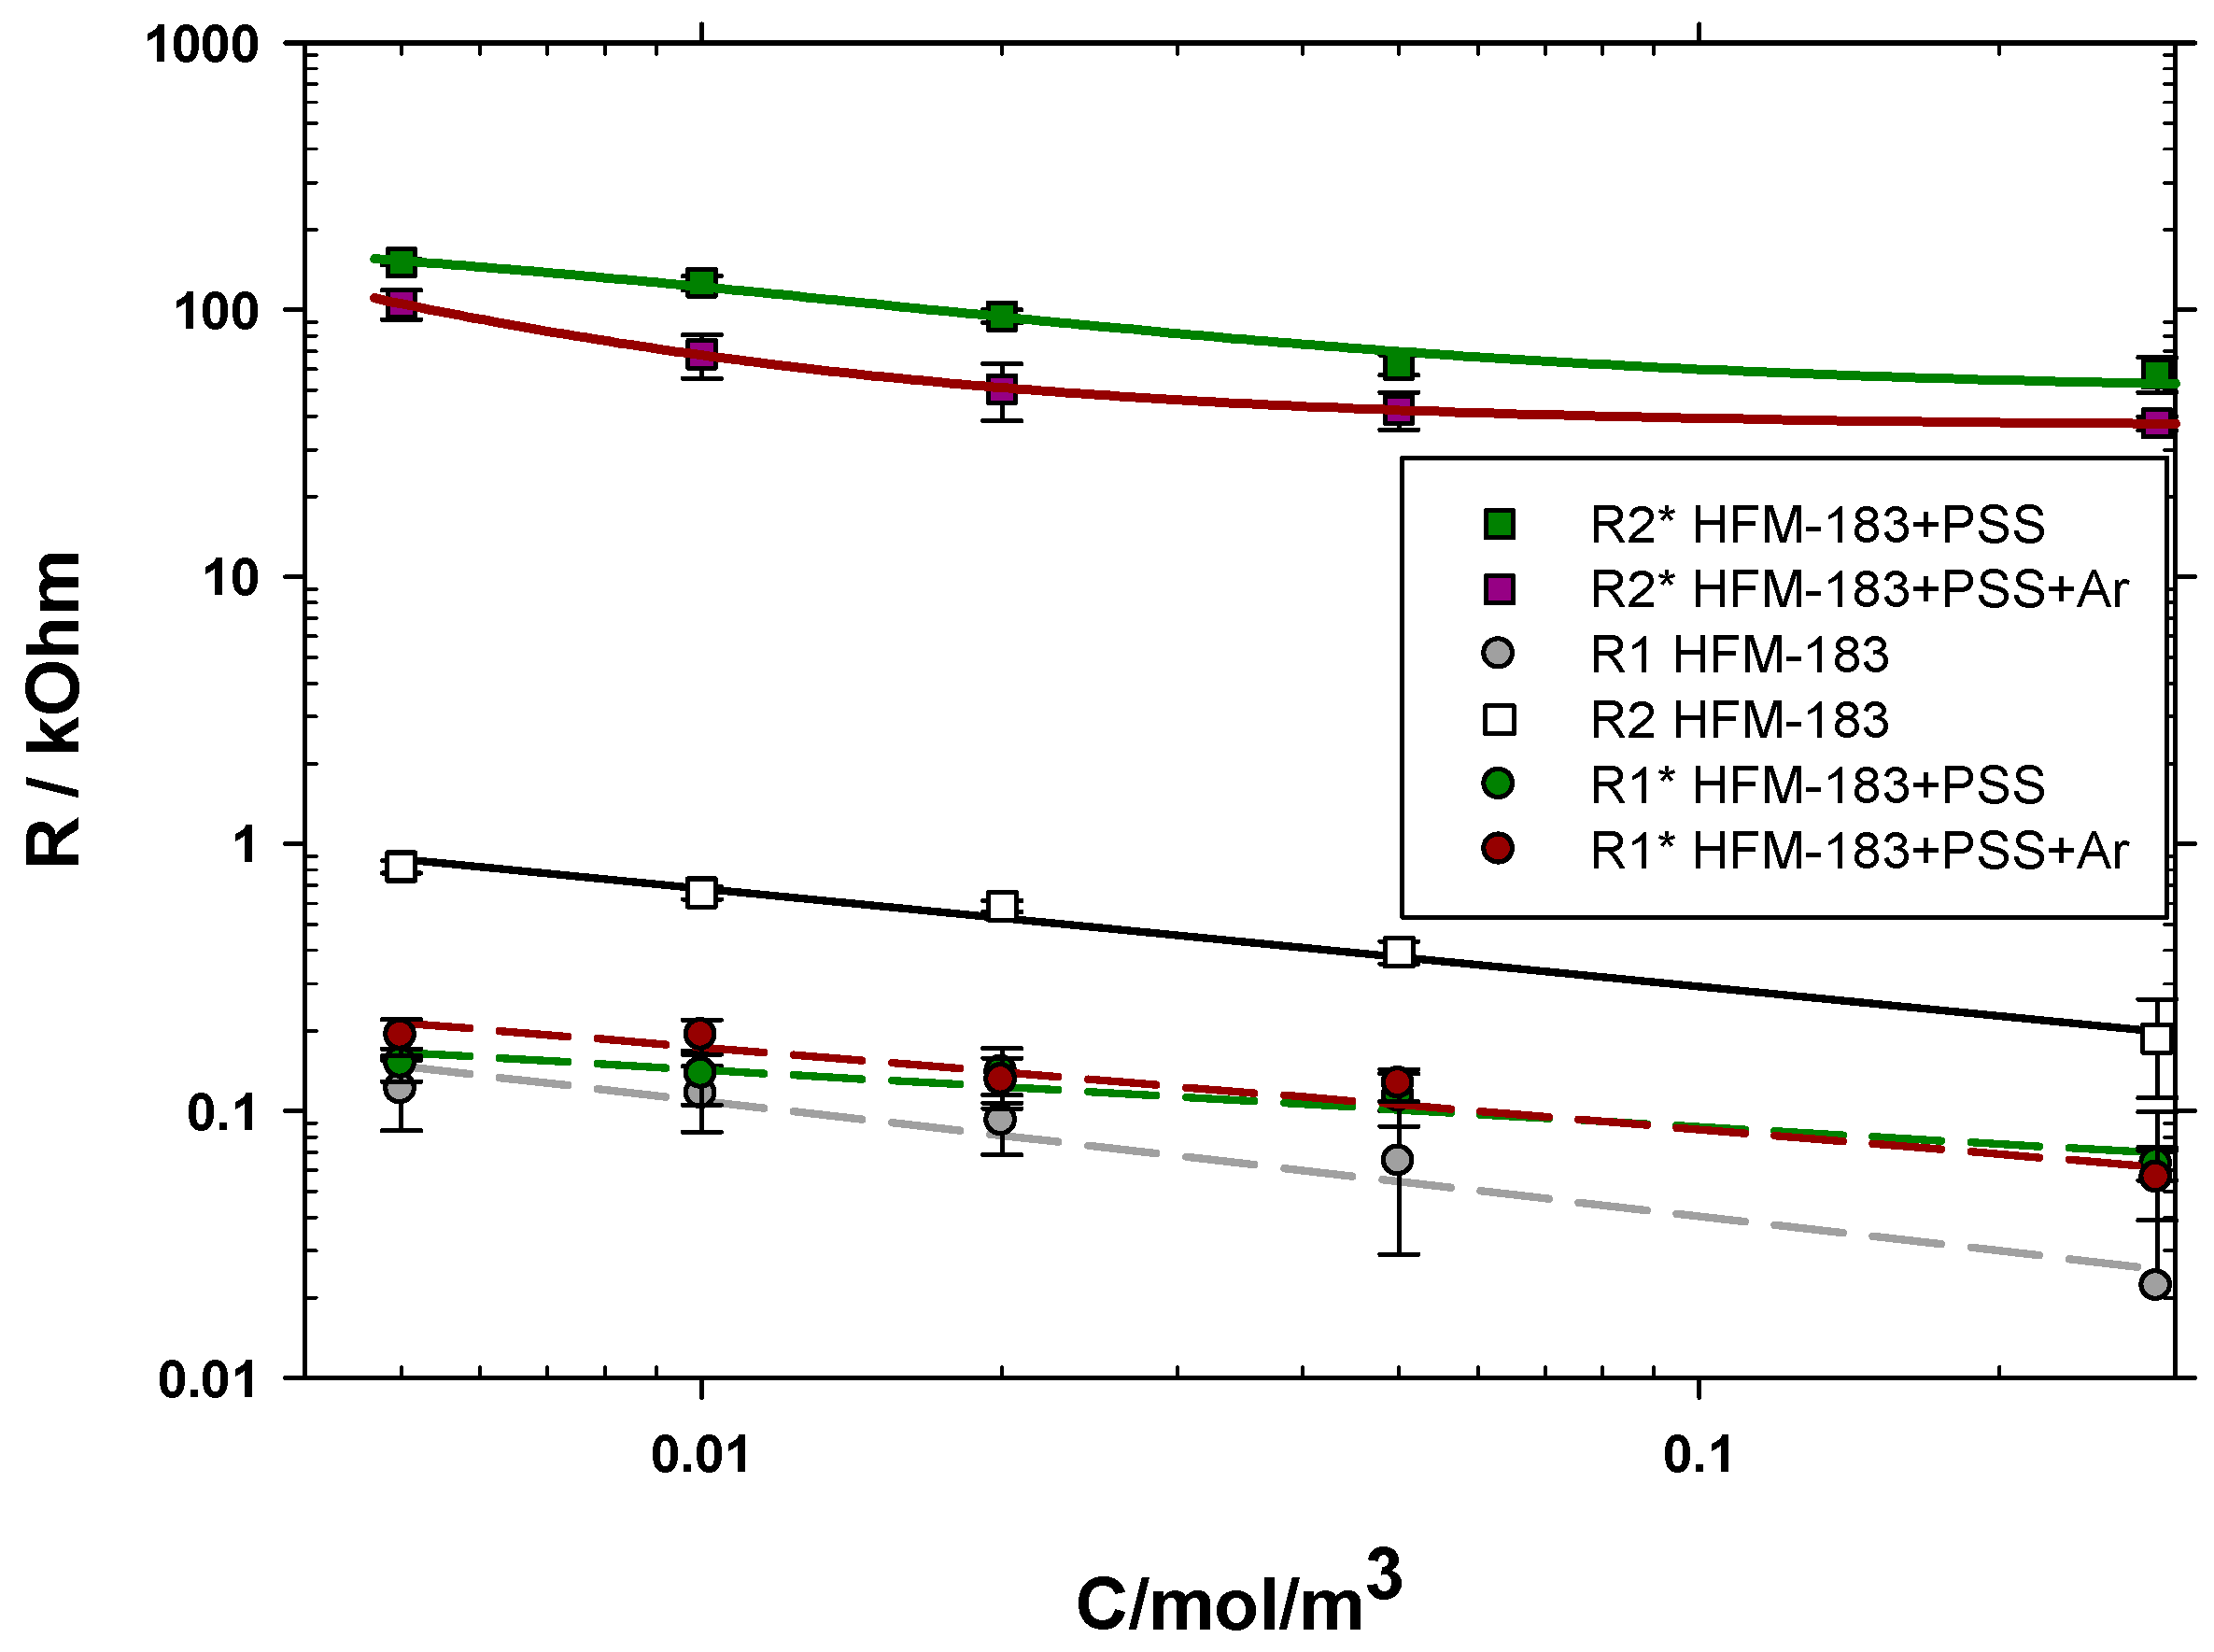
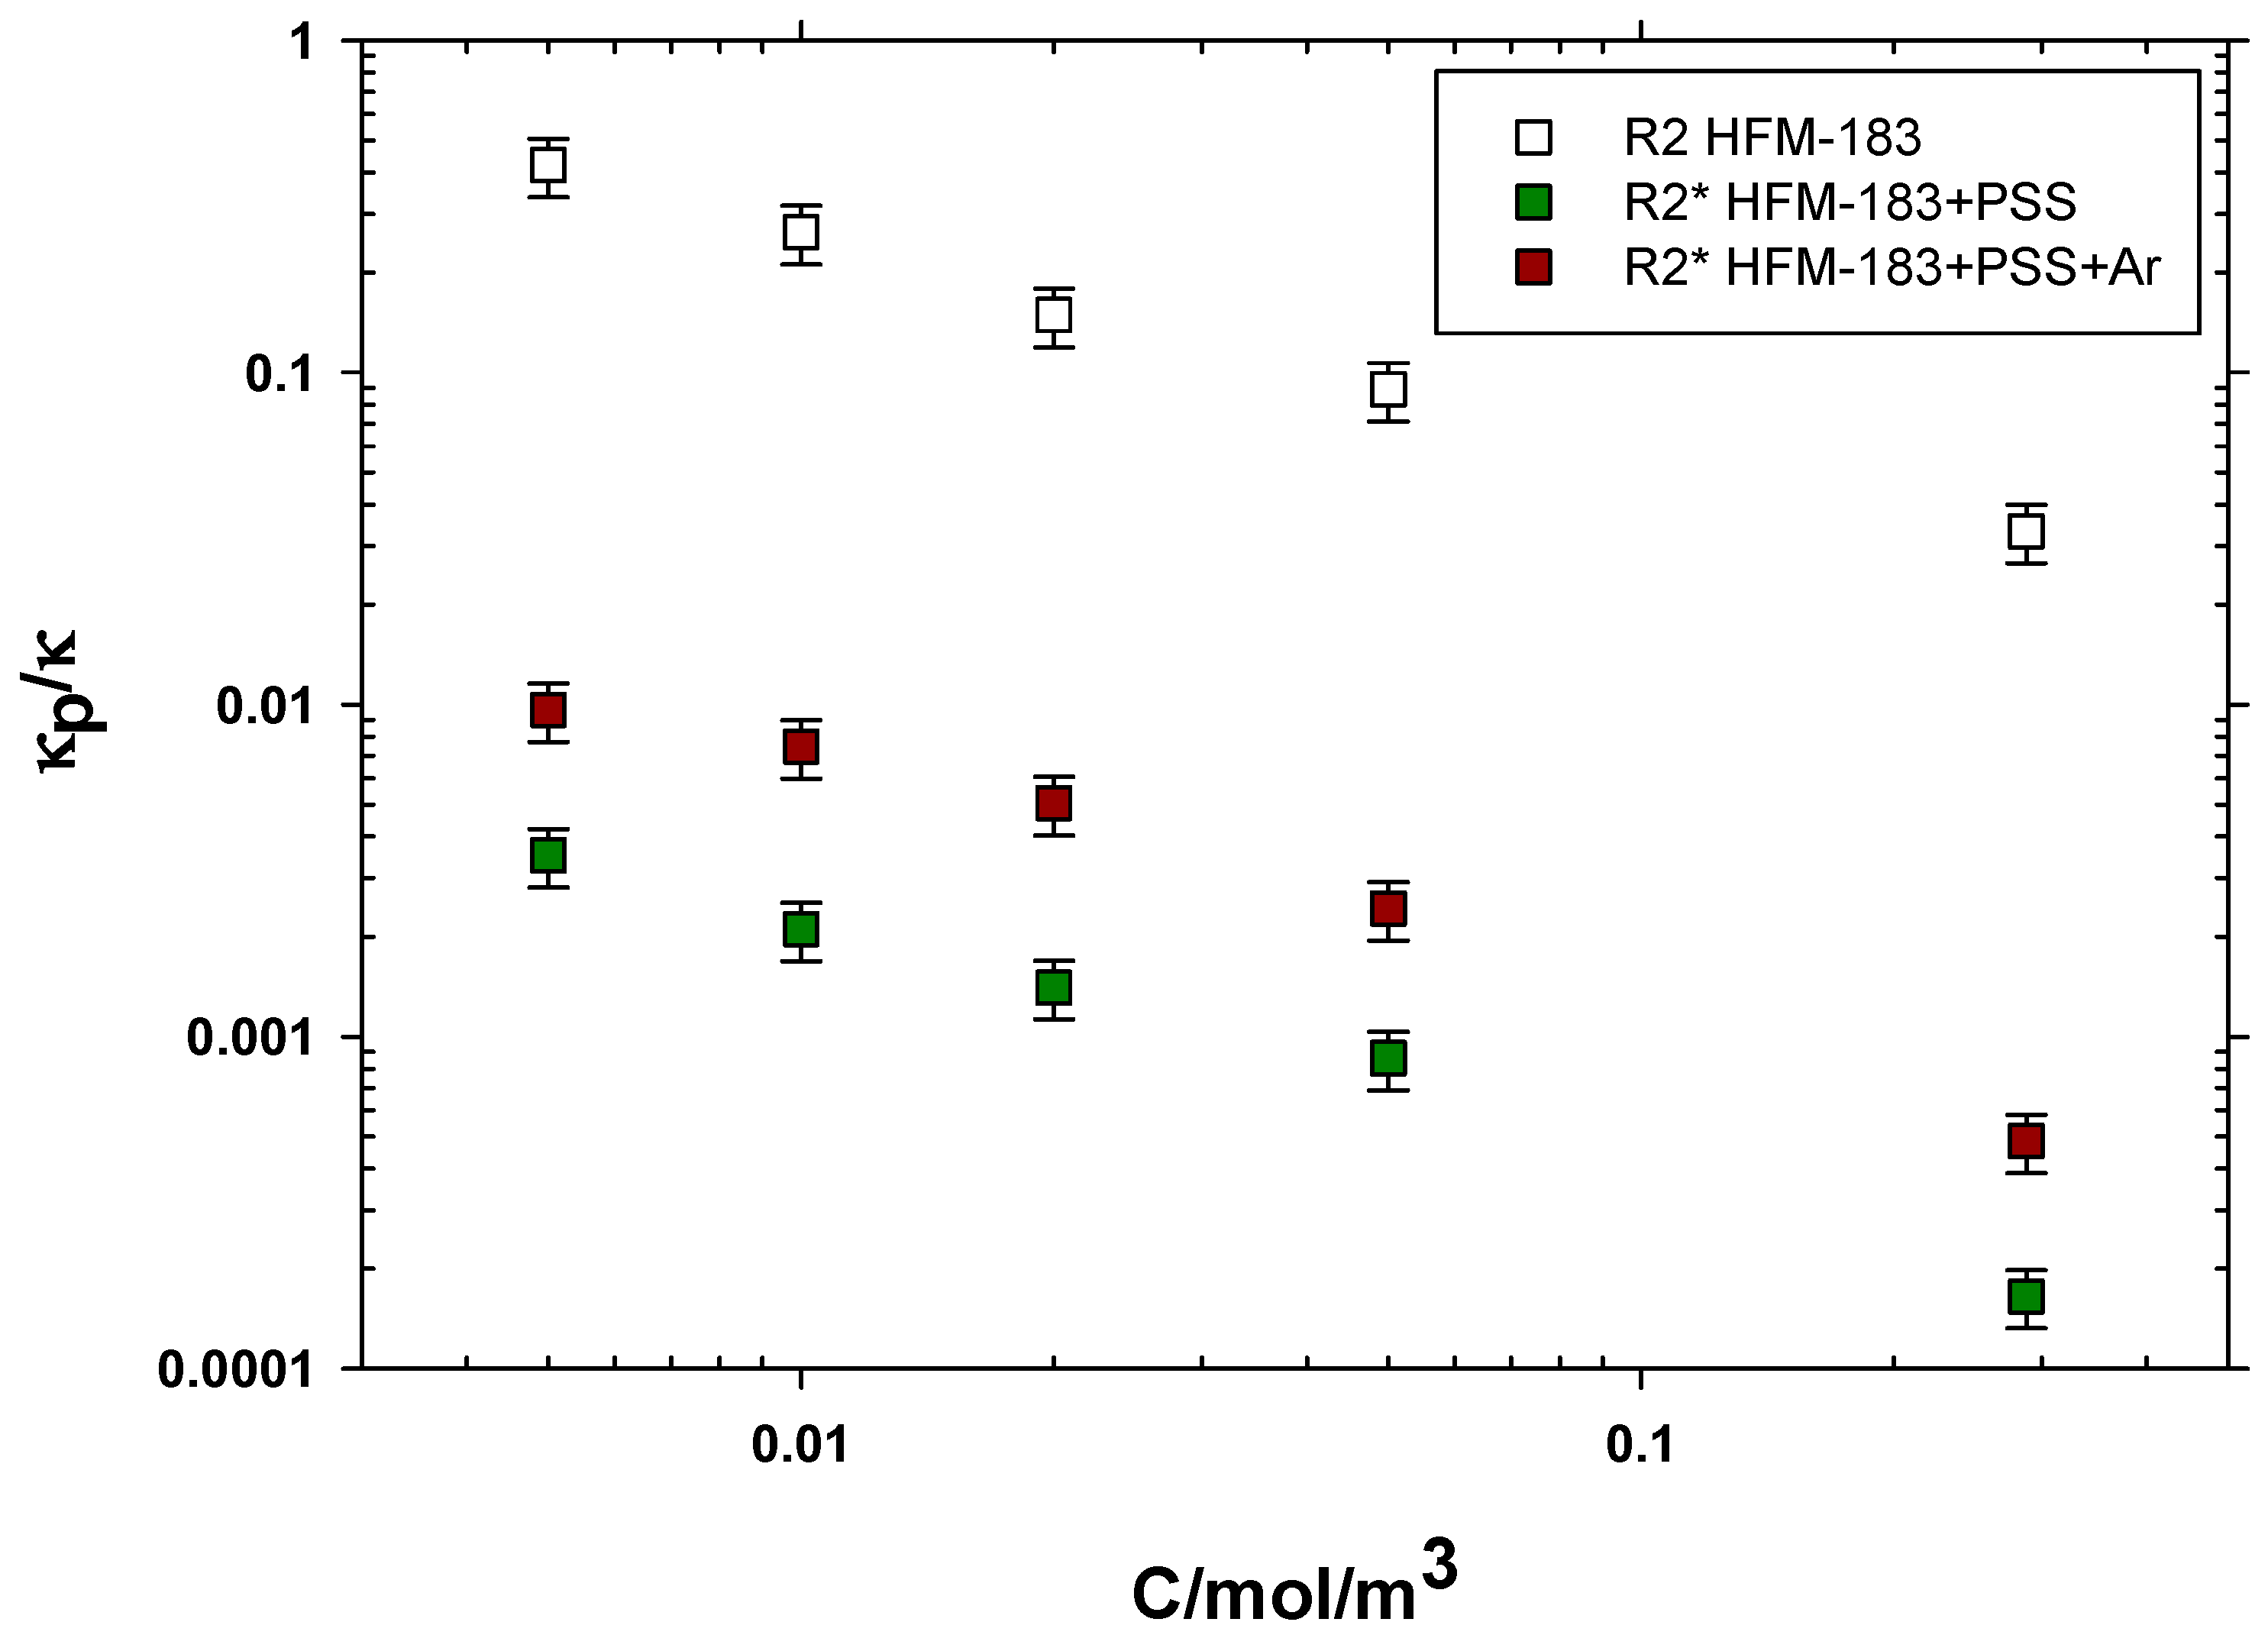
3.3. Electrical Impedance Spectroscopy
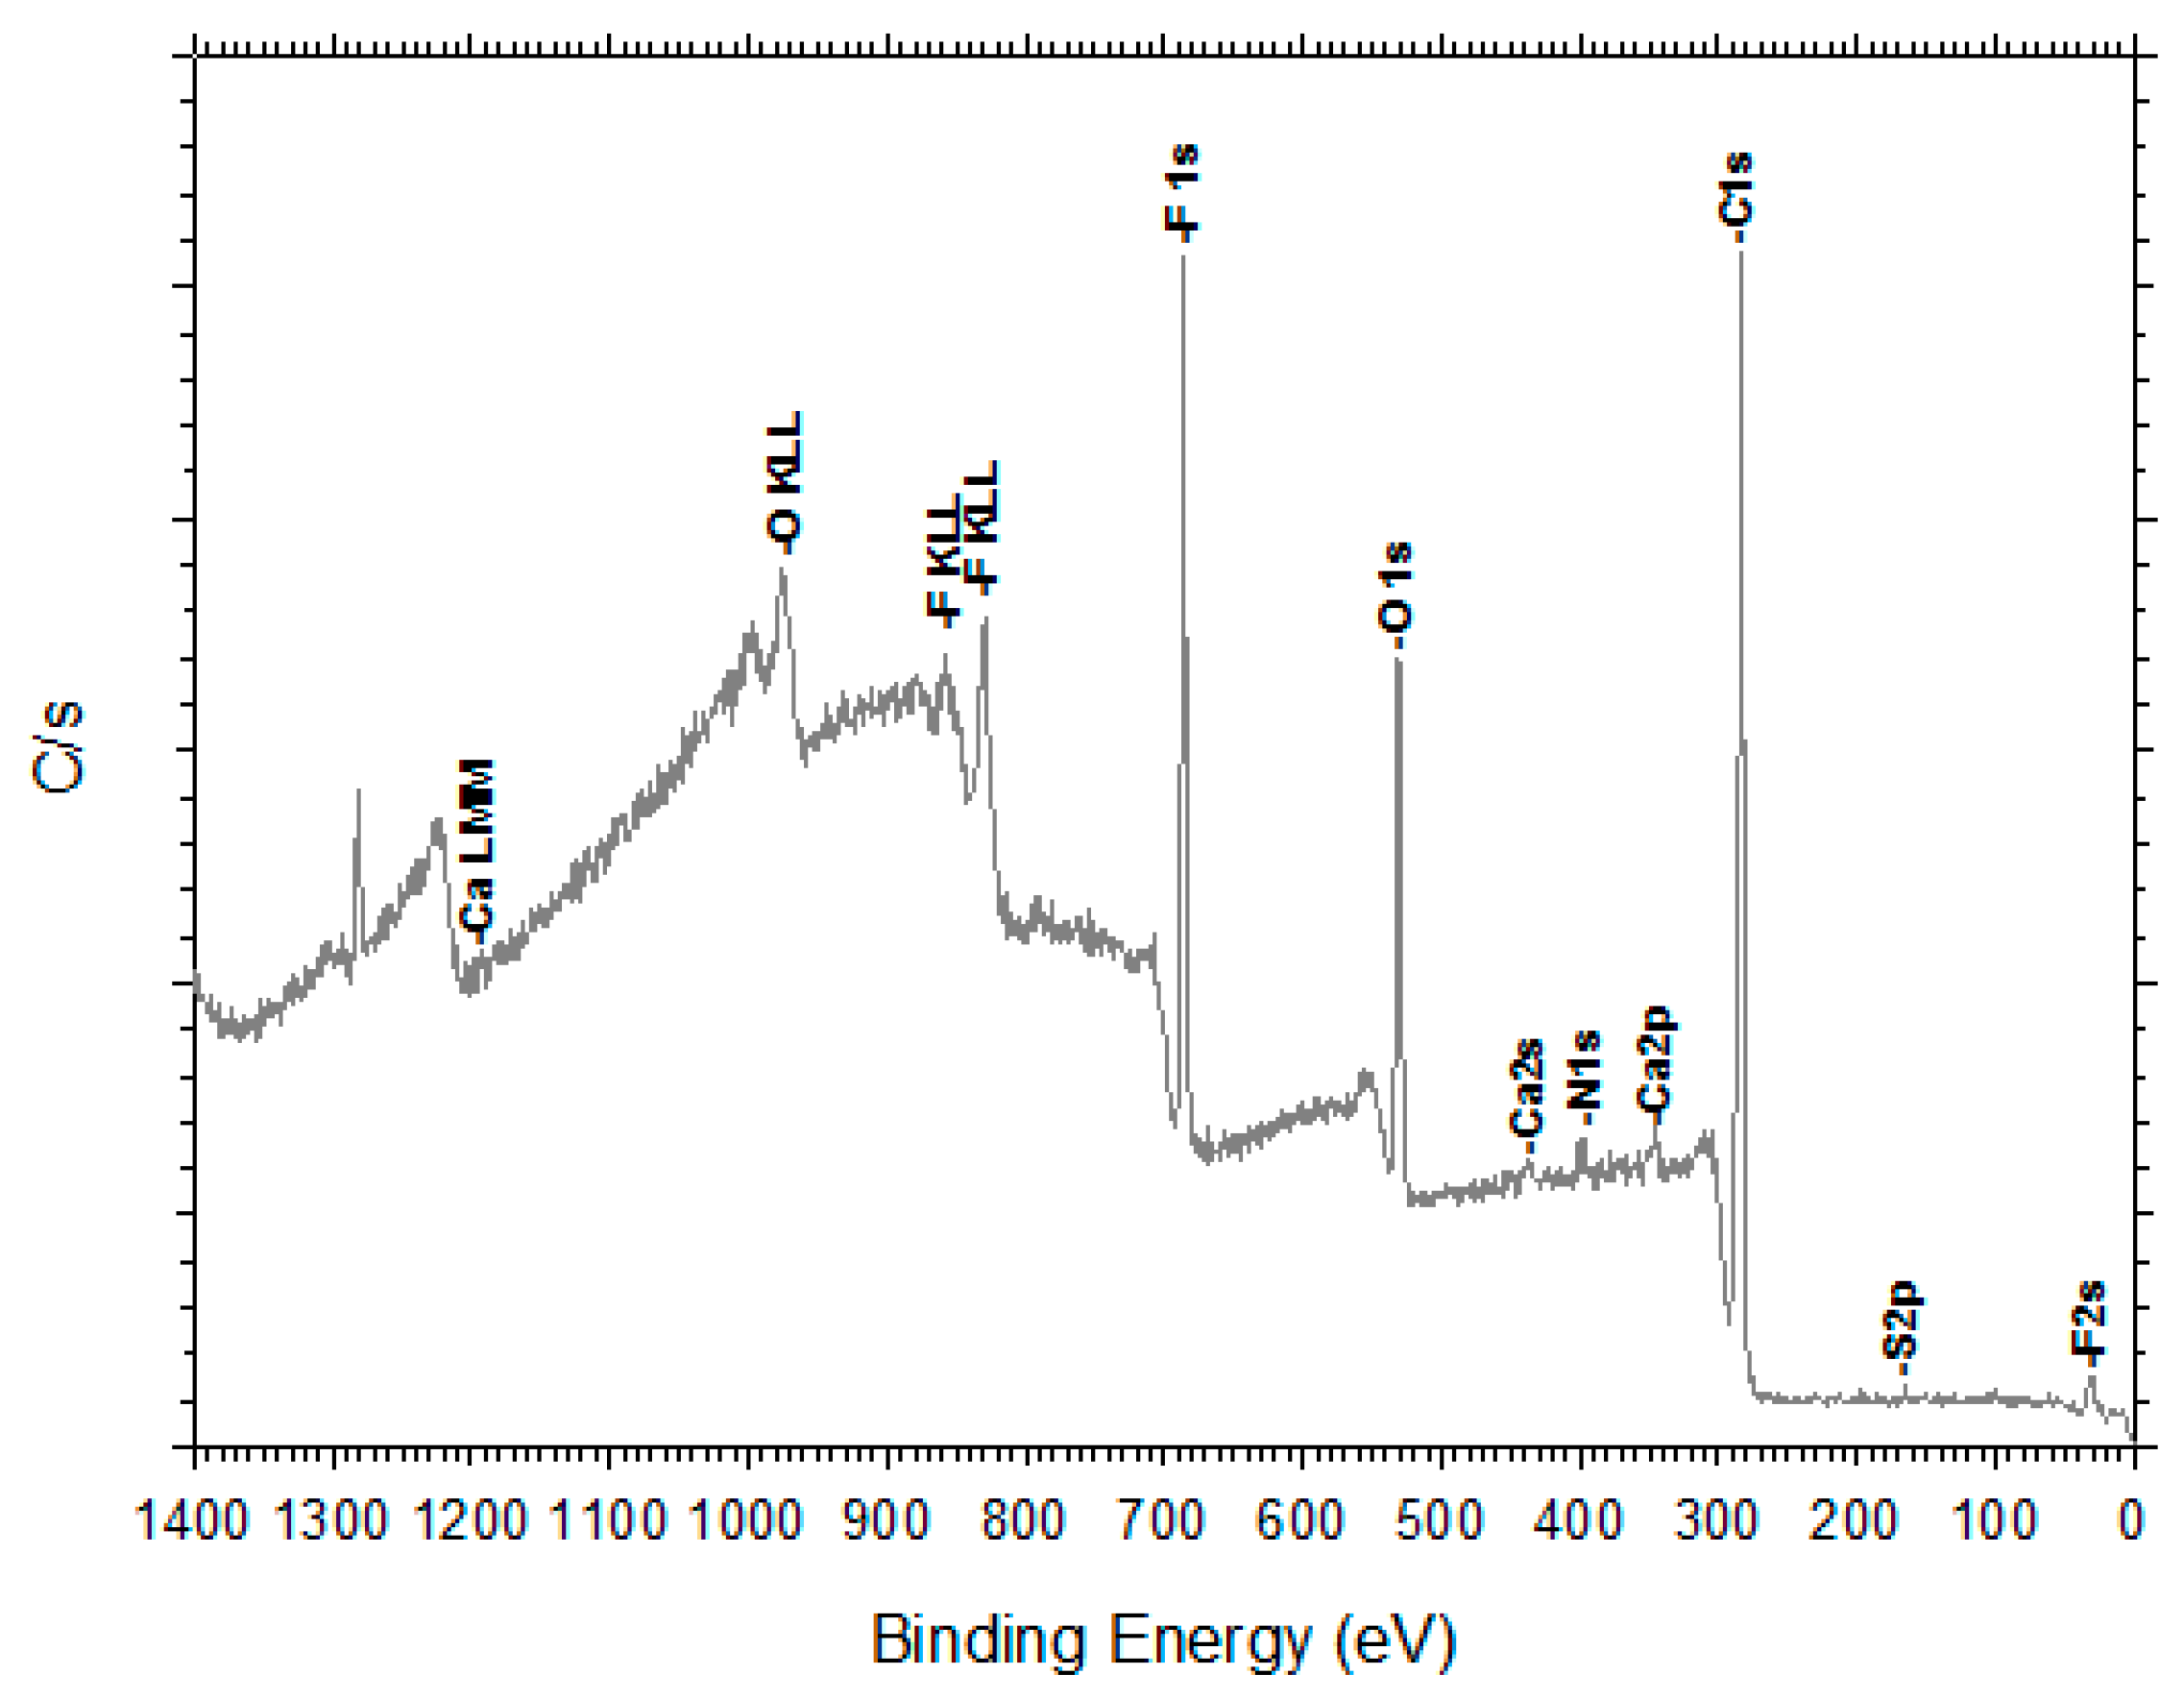
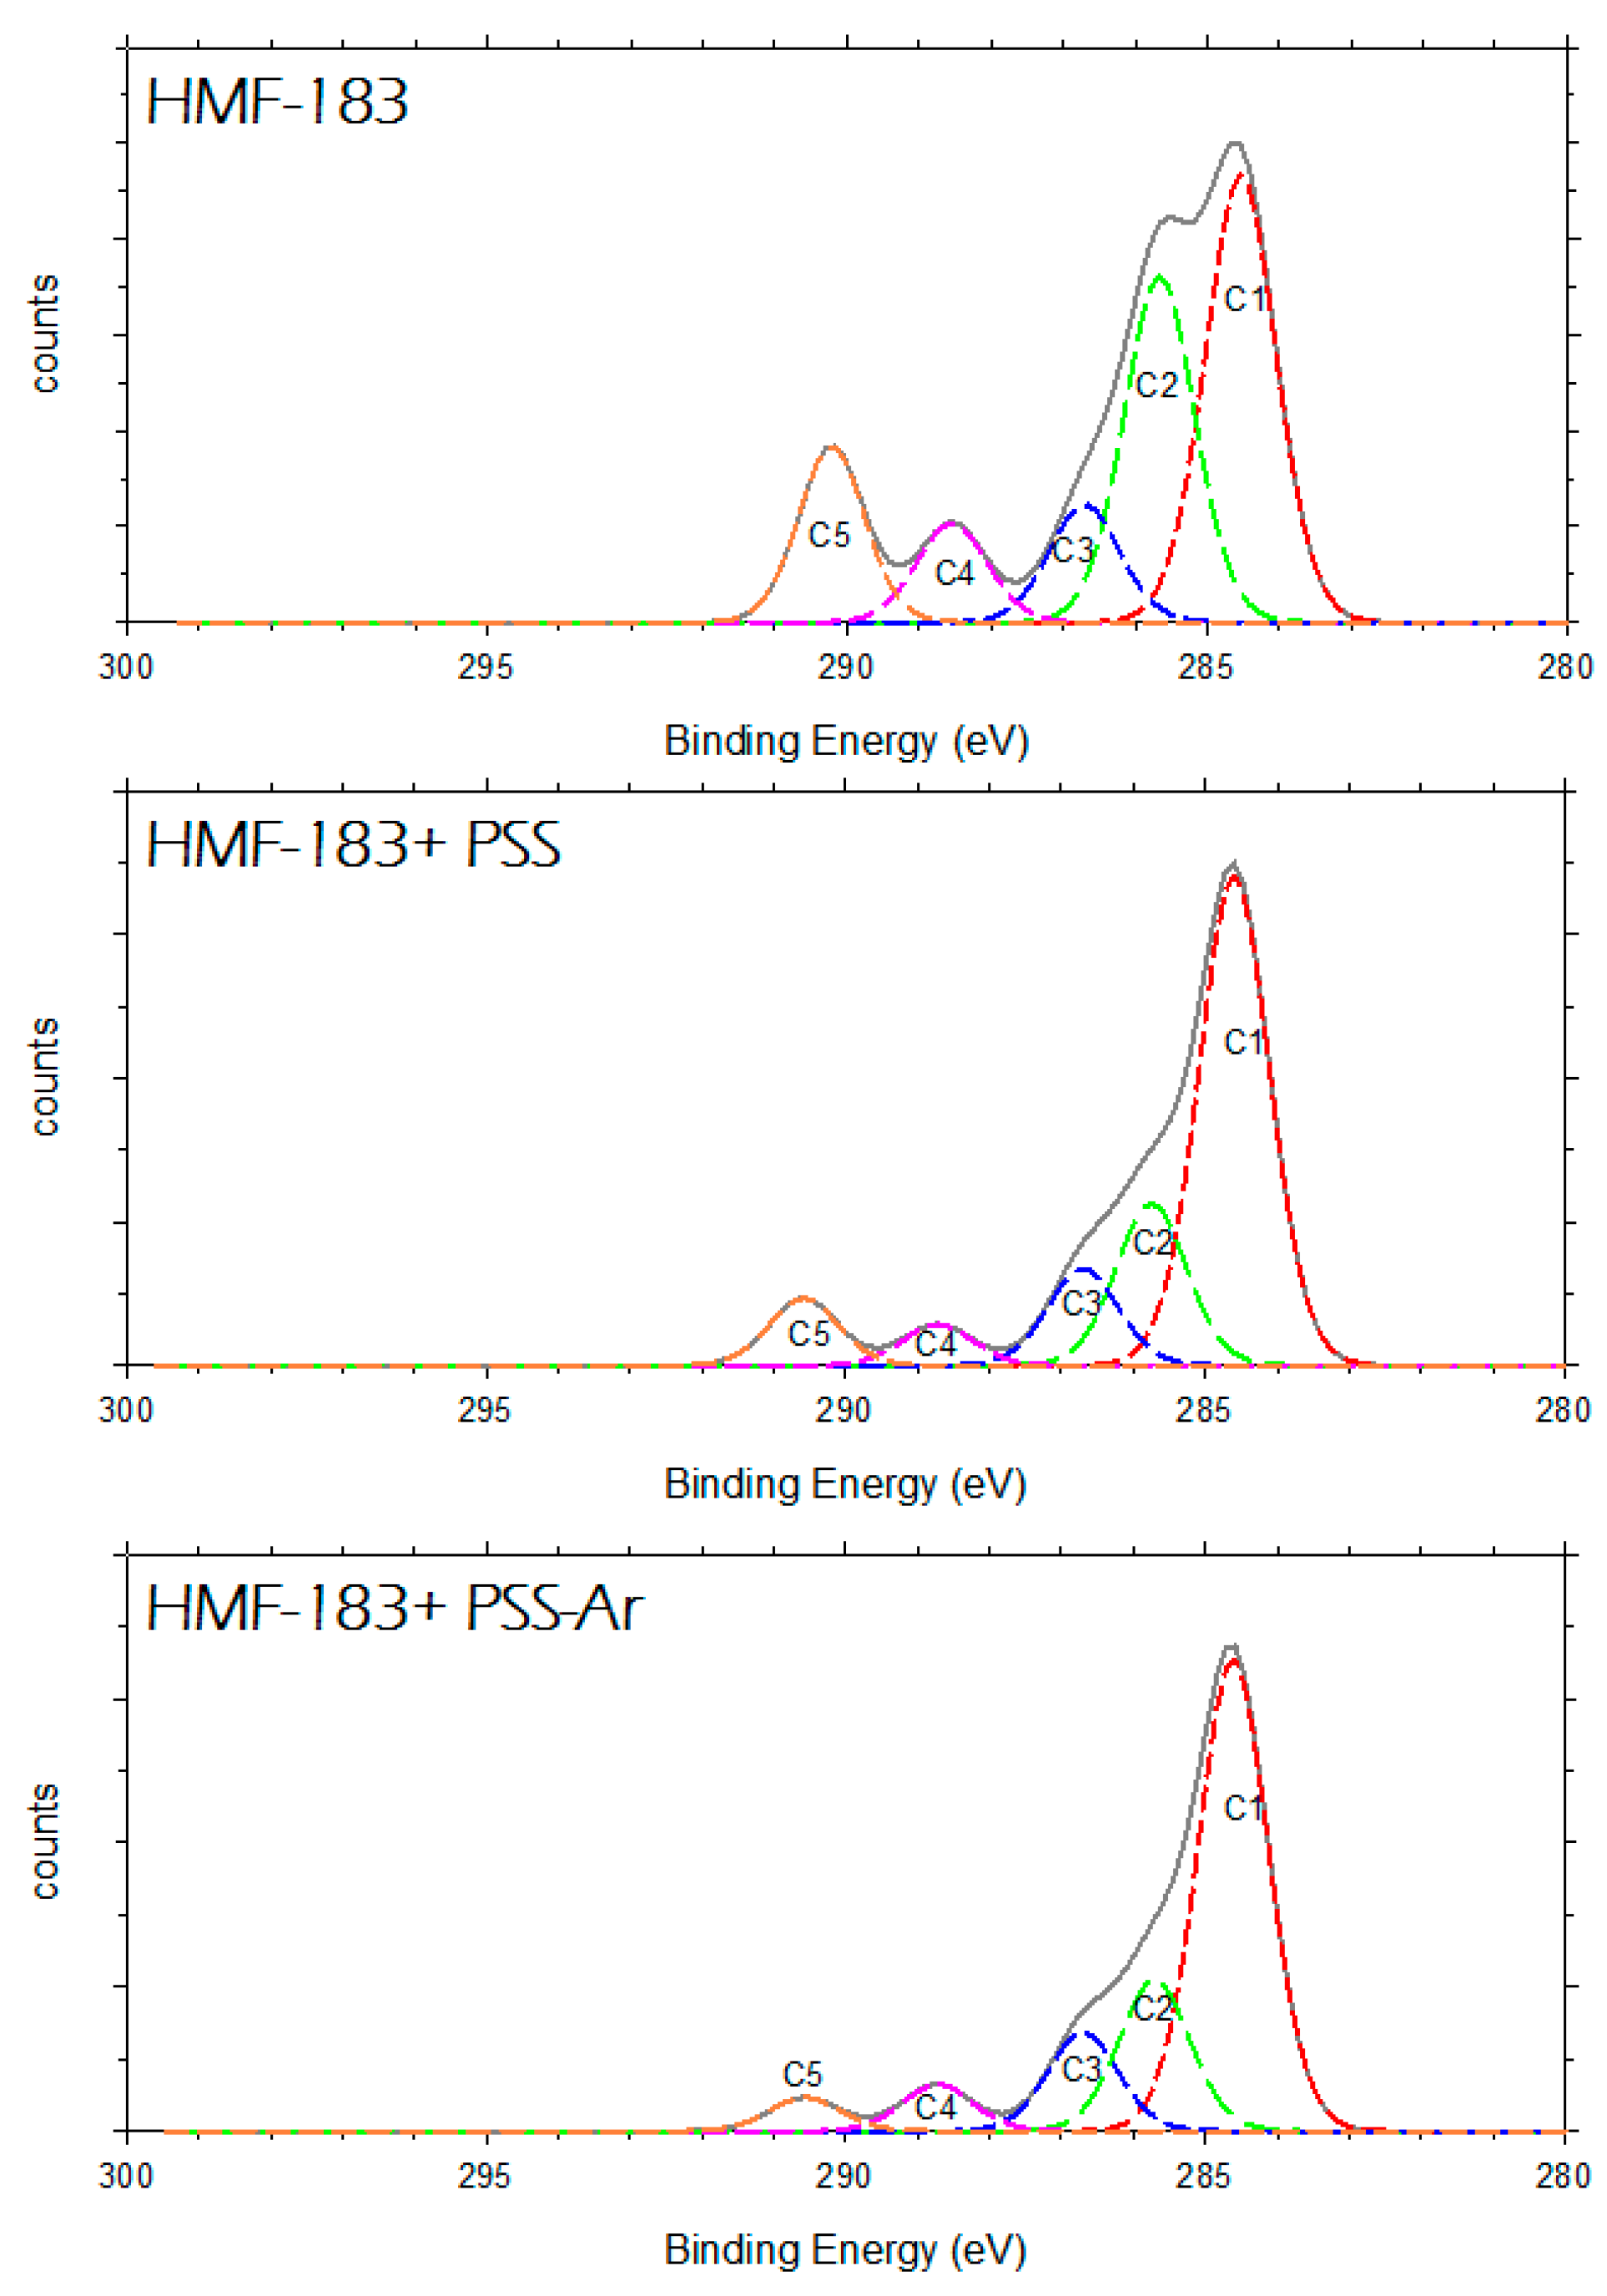
3.4. X-Ray Photoelectron Spectroscopy, XPS.
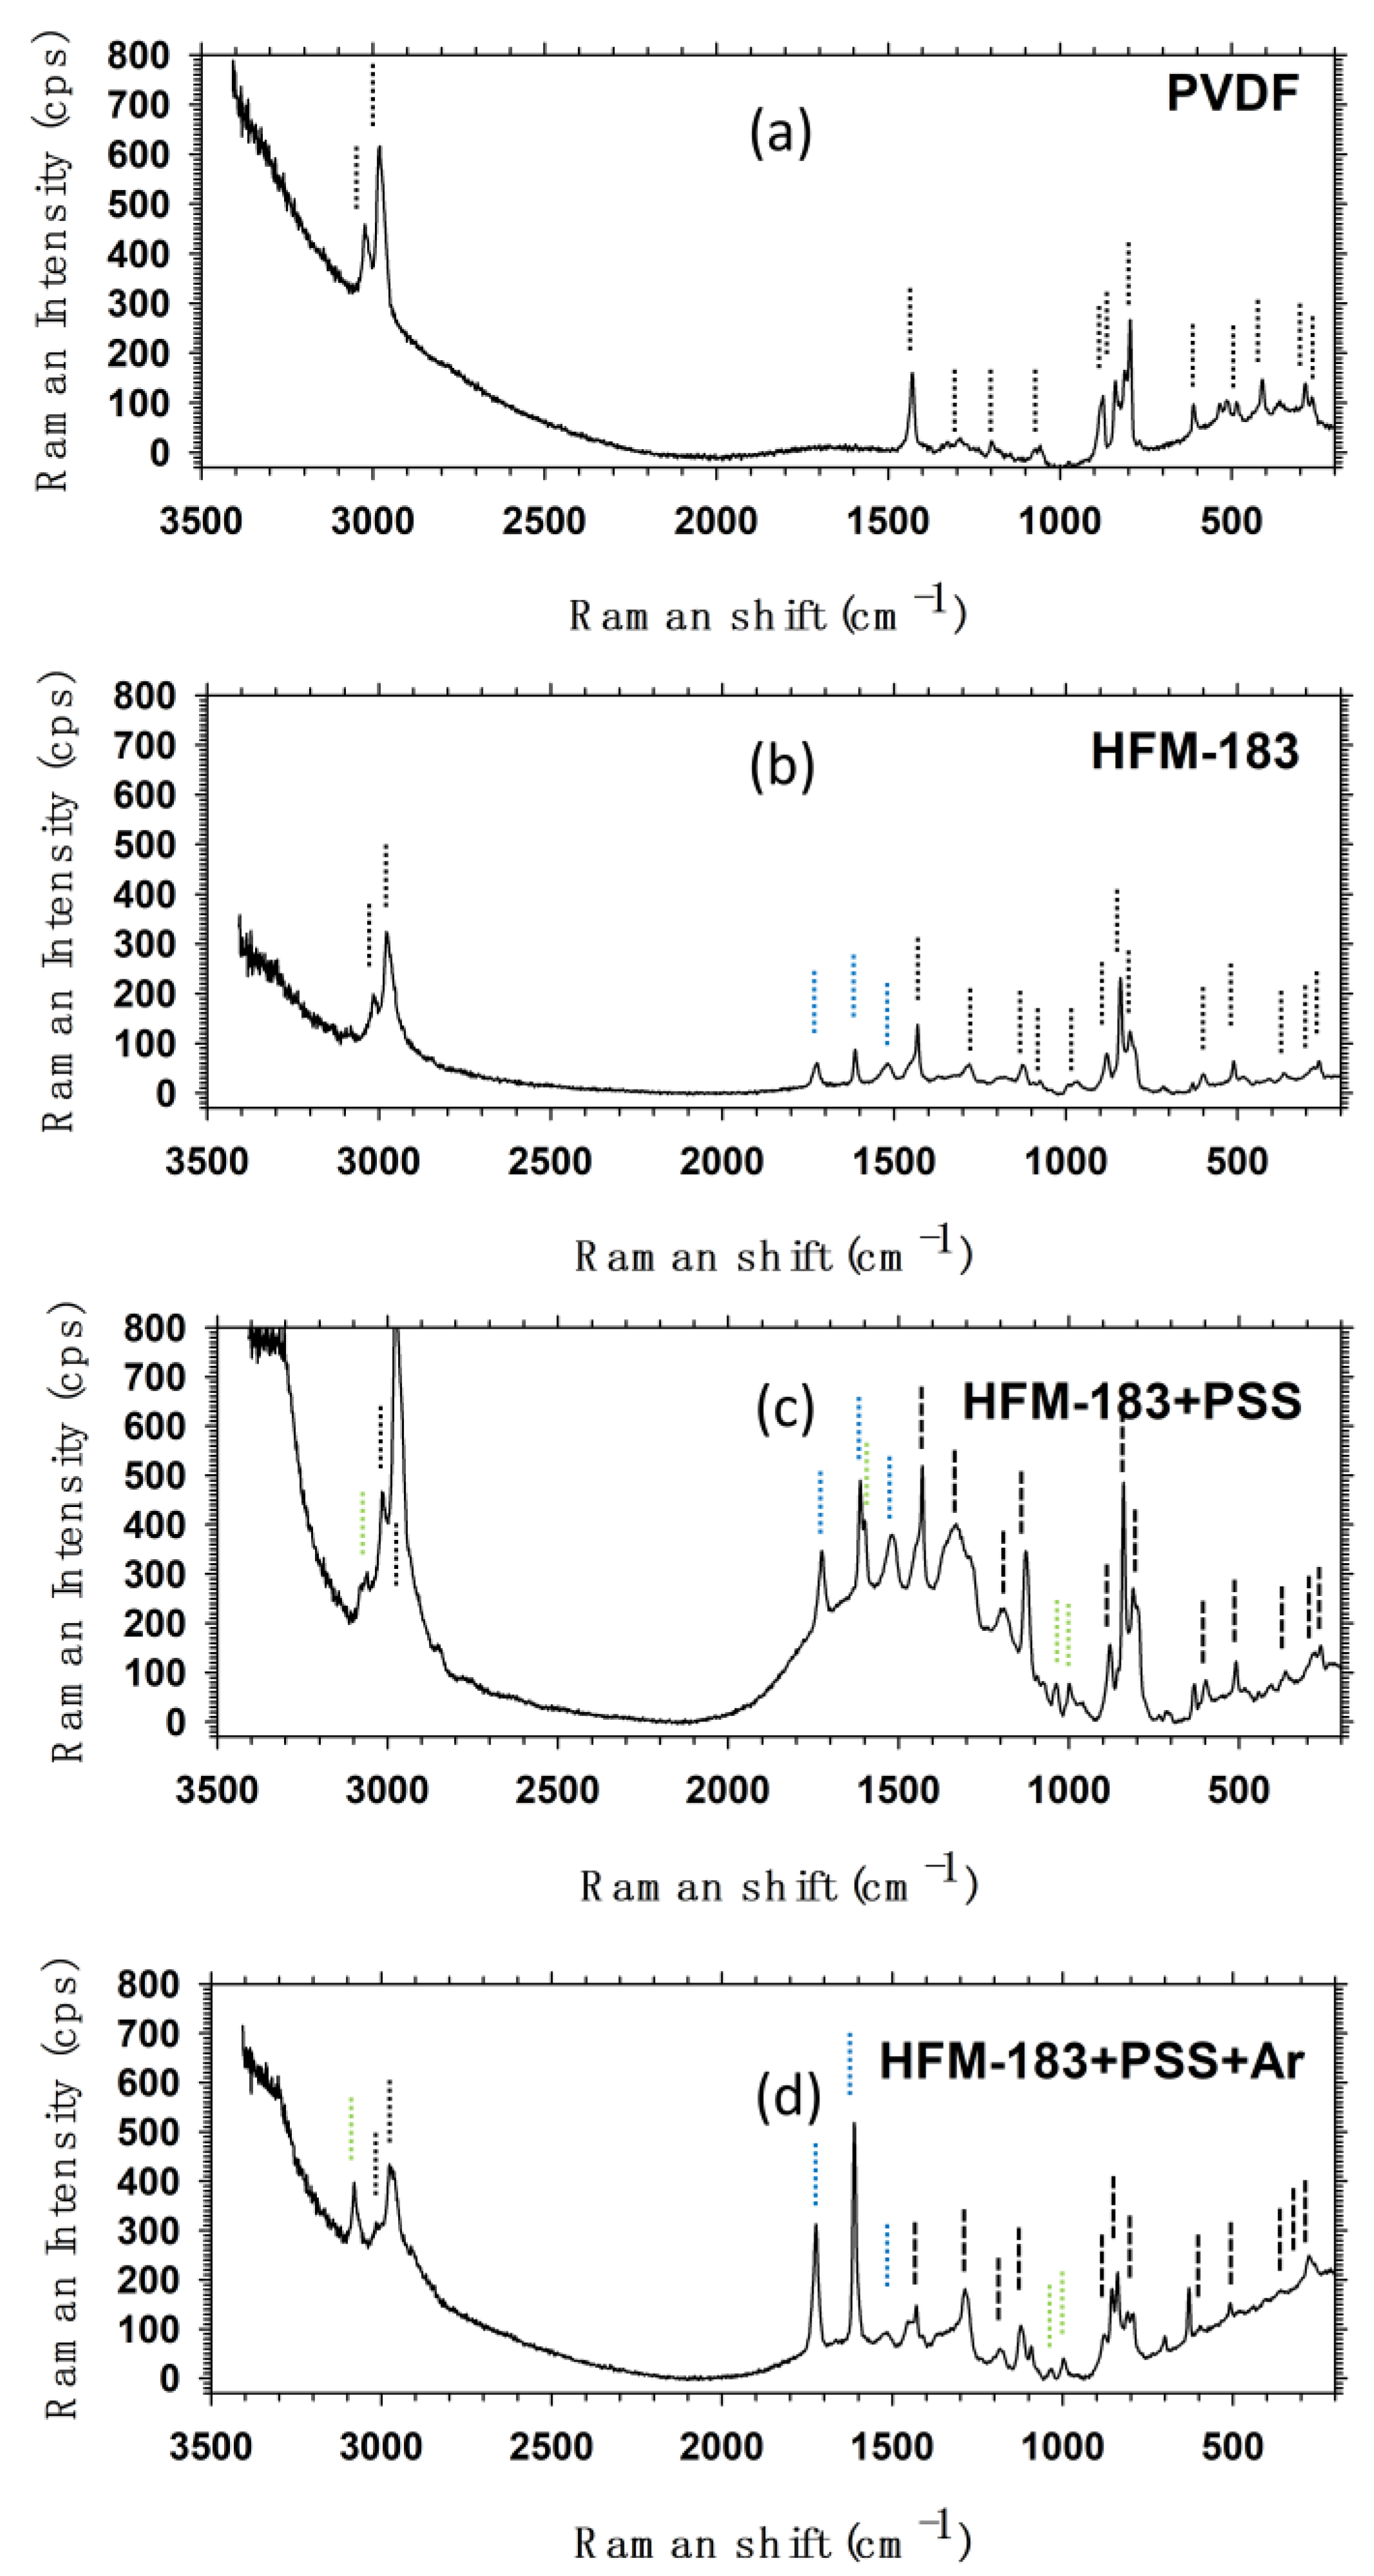
3.5. Raman Spectroscopy.
4. Conclusions
Supplementary Materials
Author Contributions
Funding
Acknowledgments
Conflicts of Interest
References
- Behera, K.; Yadav, M.; Chiu, F.-C.; Rhee, Y.K. Graphene nanoplatelet-reinforced poly(vinylidene fluoride)/high density polyethylene blend-based nanocomposites with enhanced thermal and electrical properties. Nanomaterials 2019, 9, 361. [Google Scholar] [CrossRef] [PubMed]
- Pi, J.-K.; Yang, H.-C.; Wan, L.-S.; Wu, J.; Xu, Z.-K. Polypropylene microfiltration membranes modified with TiO2 nanoparticles for surface wettability and antifouling property. J. Membr. Sci. 2016, 500, 8–15. [Google Scholar] [CrossRef]
- Kirschner, A.Y.; Chang, C.-C.; Kasemset, S.; Emrick, T.; Freeman, B.D. Fouling-resistant ultrafiltration membranes prepared via co-deposition of dopamine/zwitterion composite coatings. J. Membr. Sci. 2017, 541, 300–311. [Google Scholar] [CrossRef]
- Mi, Y.-F.; Zhao, F.-Y.; Guo, Y.-S.; Weng, X.-D.; Ye, C.-C.; An, Q.-F. Constructing zwitterionic surface of nanofiltration membrane for high flux and antifouling performance. J. Membr. Sci. 2017, 541, 29–38. [Google Scholar] [CrossRef]
- Shafi, H.Z.; Khan, Z.; Yang, R.; Gleason, K.K. Surface modification of reverse osmosis membranes with zwitterionic coating for improved resistance to fouling. Desalination 2015, 362, 93–103. [Google Scholar] [CrossRef]
- Wang, J.; Chen, X.; Reis, R.; Chen, Z.; Milne, N.; Winther-Jensen, B.; Kong, L.; Dumée, F.L. Plasma modification and synthesis of membrane materials–a mechanistic review. Membranes 2018, 8, 56. [Google Scholar] [CrossRef]
- Baumann, L.; Hegemann, D.; de Courten, D.; Wolf, M.; Rossi, R.M.; Meier, W.P.; Scherer, L.J. Tuning the resistance of polycarbonate membranes by plasma-induced graft surface modification. Appl. Surf. Sci. 2013, 268, 450–457. [Google Scholar] [CrossRef]
- Chittrakarn, T.; Tirawanichakul, Y.; Sirijarukul, S.; Yuenyao, C. Plasma induced graft polymerization of hydrophilic monomers on polysulfone gas separation membrane surfaces. Surf. Coat. Technol. 2016, 296, 157–163. [Google Scholar] [CrossRef]
- Zhao, Z.-P.; Li, M.-S.; Li, N.; Wang, M.-X.; Zhang, Y. Controllable modification of polymer membranes by long-distance and dynamic low-temperature plasma flow: AA grafting penetrated through electrospun PP fibrous membranes. J. Membr. Sci. 2013, 440, 9–19. [Google Scholar] [CrossRef]
- Sandoval-Olvera, I.G.; Gonzalez-Munoz, P.; Palacio, L.; Hernandez, A.; Avila-Rodriguez, M.; Pradanos, P. Ultrafiltration membranes modified by PSS deposition and plasma treatment for Cr(VI) removal. Sep. Purif. Technol. 2019, 210, 371–381. [Google Scholar] [CrossRef]
- Roghmans, F.; Martí-Calatayud, M.C.; Abdu, S.; Femmer, R.; Tiwari, R.; Walther, A.; Wessling, M. Electrochemical impedance spectroscopy fingerprints the ion selectivity of microgel functionalized ion-exchange membranes. Electrochem. Commun. 2016, 72, 113–117. [Google Scholar] [CrossRef]
- Calvo, J.I.; Bottino, A.; Capannelli, G.; Hernández, A. Comparison of liquid-liquid displacement porosimetry and scanning electron microscopy image analysis to characterise ultrafiltration track-etched membranes. J. Membr. Sci. 2004, 239, 189–197. [Google Scholar] [CrossRef]
- Calvo, J.I.; Peinador, R.I.; Prádanos, P.; Bottino, A.; Comite, A.; Firpo, R.; Hernández, A. Porosimetric characterization of polysulfone ultrafiltration membranes by image analysis and liquid–liquid displacement technique. Desalination 2015, 357, 84–92. [Google Scholar] [CrossRef]
- Calvo, J.I.; Peinador, R.I.; Thom, V.; Schleuss, T.; ToVinh, K.; Prádanos, P.; Hernández, A. Comparison of pore size distributions from dextran retention tests and liquid-liquid displacement porosimetry. Microporous Mesoporous Mater. 2017, 250, 170–176. [Google Scholar] [CrossRef]
- Xie, A.; Cui, J.; Yang, J.; Chen, Y.; Lang, J.; Li, C.; Yan, Y.; Dai, J. Photo-Fenton self-cleaning PVDF/NH2-MIL-88B(Fe) membranes towards highly-efficient oil/water emulsion separation. J. Membr. Sci. 2020, 595, 117499. [Google Scholar] [CrossRef]
- Al-Rashdi, B.A.M.; Johnson, D.J.; Hilal, N. Removal of heavy metal ions by nanofiltration. Desalination 2013, 315, 2–17. [Google Scholar] [CrossRef]
- Kulikov, O.V.; Siriwardane, D.A.; McCandless, G.T.; Mahmood, S.F.; Novak, B.M. Self-assembly studies on triazolepolycarbodiimide-g-polystyrene copolymers. Polymer 2016, 92, 94–101. [Google Scholar] [CrossRef]
- Park, E.J.; Lee, S.Y.; Canlier, A.; Hwang, T.S. Controlled dehydrochlorination of poly(vinyl chloride) for fabrication of membranes with polyacetylene-like structure: XPS analysis and ion exchange membrane discussion. Macromol. Res. 2019, 27, 33–47. [Google Scholar] [CrossRef]
- Wei, X.; Zhao, B.; Li, X.-M.; Wang, Z.; He, B.-Q.; He, T.; Jiang, B. CF4 plasma surface modification of asymmetric hydrophilic polyethersulfone membranes for direct contact membrane distillation. J. Membr. Sci. 2012, 407, 164–175. [Google Scholar] [CrossRef]
- Baroña, G.N.B.; Choi, M.; Jung, B. High permeate flux of PVA/PSf thin film composite nanofiltration membrane with aluminosilicate single-walled nanotubes. J. Colloid Interface Sci. 2012, 386, 189–197. [Google Scholar] [CrossRef]
- Khulbe, K.C.; Matsuura, T. Characterization of synthetic membranes by Raman spectroscopy, electron spin resonance, and atomic force microscopy; a review. Polymer 2000, 41, 1917–1935. [Google Scholar] [CrossRef]
- Virtanen, T.; Reinikainen, S.-P.; Kögler, M.; Mänttäri, M.; Viitala, T.; Kallioinen, M. Real-time fouling monitoring with Raman spectroscopy. J. Membr. Sci. 2017, 525, 312–319. [Google Scholar] [CrossRef]
- Keen, I.; Rintoul, L.; Fredericks, P.M. Raman and infrared microspectroscopic mapping of plasma-treated and grafted polymer surfaces. Appl. Spectrosc. 2001, 55, 984–991. [Google Scholar] [CrossRef]
- Dufour, E.; Gassara, S.; Petit, E.; Pochat-Bohatier, C.; Deratani, A. Quantitative PVP mapping in PVDF hollow fiber membranes by using Raman spectroscopy coupled with spectral chemiometrics analysis. The Eur. Phys. J. Spec. Topics 2015, 224, 1911–1919. [Google Scholar] [CrossRef]
- Silva, V.; Montalvillo, M.; Carmona, F.J.; Palacio, L.; Hernández, A.; Prádanos, P. Prediction of single salt rejection in nanofiltration membranes by independent measurements. Desalination 2016, 382, 1–12. [Google Scholar] [CrossRef]
- Calvo, J.I.; Peinador, R.I.; Prádanos, P.; Palacio, L.; Bottino, A.; Capannelli, G.; Hernández, A. Liquid-liquid displacement porometry to estimate the molecular weight cut-off of ultrafiltration membranes. Desalination 2011, 268, 174–181. [Google Scholar] [CrossRef]
- Díaz, D.R.; Carmona, F.J.; Palacio, L.; Ochoa, N.A.; Hernández, A.; Prádanos, P. Impedance spectroscopy and membrane potential analysis of microfiltration membranes. The influence of surface fractality. Chem. Eng. Sci. 2018, 178, 27–38. [Google Scholar] [CrossRef]
- Montalvillo, M.; Silva, V.; Palacio, L.; Calvo, J.I.; Carmona, F.J.; Hernandez, A.; Pradanos, P. Charge and dielectric characterization of nanofiltration membranes by impedance spectroscopy. J. Membr. Sci. 2014, 454, 163–173. [Google Scholar] [CrossRef]
- Duparré, A.; Ferre-Borrull, J.; Gliech, S.; Notni, G.; Steinert, J.; Bennett, J.M. Surface characterization techniques for determining the root-mean-square roughness and power spectral densities of optical components. Appl. Opt. 2002, 41, 154–171. [Google Scholar] [CrossRef]
- Gómez-Rodríguez, J.M.; Asenjo, A.; Salvarezza, R.C.; Baró, A.M. Measuring the fractal dimension with STM: application to vacuum-evaporated gold. Ultramicroscopy 1992, 42, 1321–1328. [Google Scholar] [CrossRef]
- Iadicicco, N.; Paduano, L.; Vitagliano, V. Diffusion coefficients for the system potassium chromate-water at 25 °C. J. Chem. Eng. Data 1996, 41, 529–533. [Google Scholar] [CrossRef]
- Melnikov, S.; Kolot, D.; Nosova, E.; Zabolotskiy, V. Peculiarities of transport-structural parameters of ion-exchange membranes in solutions containing anions of carboxylic acids. J. Membr. Sci. 2018, 557, 1–12. [Google Scholar] [CrossRef]
- Park, S.Y.; Kim, Y.J.; Kwak, S.Y. Versatile surface charge-mediated anti-fouling UF/MF membrane comprising charged hyperbranched polyglycerols (HPGs) and PVDF membranes. RSC Advances 2016, 6, 88959–88966. [Google Scholar] [CrossRef]
- Breite, D.; Went, M.; Prager, A.; Schulze, A. Tailoring membrane surface charges: a novel study on electrostatic interactions during membrane fouling. Polymers 2015, 7, 2017–2030. [Google Scholar] [CrossRef]
- Deeks, C.; Mack, P.; Nunney, T.S. Hard X-ray photoelectron spectroscopy for multi-layer semiconductor samples. Available online: http://assets.thermofisher.com/TFS-Assets/MSD/posters/Hard-XPS-Multi-Layer-Semiconductor-Samples-Poster.pdf (accessed on 8 October 2019).
- Chen, F.; Shi, X.; Chen, X.; Chen, W. Preparation and characterization of amphiphilic copolymer PVDF-g-PMABS and its application in improving hydrophilicity and protein fouling resistance of PVDF membrane. Appl. Surf. Sci. 2018, 427, 787–797. [Google Scholar] [CrossRef]
- Li, J.-H.; Li, M.-Z.; Miao, J.; Wang, J.-B.; Shao, X.-S.; Zhang, Q.-Q. Improved surface property of PVDF membrane with amphiphilic zwitterionic copolymer as membrane additive. Appl. Surf. Sci. 2012, 258, 6398–6405. [Google Scholar] [CrossRef]
- Qiu, J.; Zhai, M.; Chen, J.; Wang, Y.; Peng, J.; Xu, L.; Li, J.; Wei, G. Performance of vanadium redox flow battery with a novel amphoteric ion exchange membrane synthesized by two-step grafting method. J. Membr. Sci. 2009, 342, 215–220. [Google Scholar] [CrossRef]
- Ji, Y.; Liu, J.; Jiang, Y.; Liu, Y. Analysis of raman and infrared spectra of poly(vinylidene fluoride) irradiated by KrF excimer laser. Spectrochim. Acta, Part A 2008, 70, 297–300. [Google Scholar] [CrossRef]
- Cui, Z.; Hassankiadeh, N.T.; Zhuang, Y.; Drioli, E.; Lee, Y.M. Crystalline polymorphism in poly(vinylidenefluoride) membranes. Prog. Polym. Sci. 2015, 51, 94–126. [Google Scholar] [CrossRef]


| Membrane | Water Permeability (m·Pa−1·s−1) | Pore Radii from SEM Images (rp ± σ) (nm) | Observed KCrO4 Retention (%) | Zeta Potential at pH = 7 (mV) |
|---|---|---|---|---|
| HFM-183 | (8.09 ± 1.57)·10−10 | 4.45 ± 0.15 | <2 | +2.2 ± 0.4 |
| HFM-183+PSS | (1.31 ± 0.10)·10−10 | 2.90 ± 0.20 | (58.4 ± 3.5) | −7.8 ± 0.8 |
| HFM-183+PSS+Ar | (0.65 ± 0.01)·10−10 | 2.70 ± 0.25 | (66.0 ± 1.4) | −4.3 ± 0.7 |
(Figure 4) | α (Slopes in Figure 4) | (Equation (6)) | |
|---|---|---|---|
| HFM-183 | 0.490 | −2.96 | 1.02 |
| HFM-183+PSS | 0.602 | −2.77 | 1.12 |
| HFM-183+PSS+Ar | 1.44 | −2.65 | 1.17 |
| Membrana | (rp ± σ) nm | (MWCO ± σ) kDa |
|---|---|---|
| HFM-183 | 4.76 ± 0.49 | 50.49 ± 8.61 |
| HFM-183+PSS | 2.37 ± 0.13 | 11.89 ± 0.31 |
| HFM-183+PSS+Ar | 2.31 ± 0.12 | 11.23 ± 0.99 |
| Composition (atom %). | C1s | N1s | O1s | F1s | Na1s | Si2p | S2p |
|---|---|---|---|---|---|---|---|
| HFM-183 | 66.01 | 2.01 | 14.91 | 16.65 | 0 | 0.26 | 0.16 |
| HFM-183+PSS | 68.79 | 1.51 | 17.26 | 8.14 | 1.42 | 1.58 | 1.29 |
| HFM-183+PSS+Ar | 71.1 | 1.38 | 19.74 | 4.04 | 1.32 | 1.02 | 1.39 |
| HFM-183 | HFM-183+PSS | HFM-183+PSS+Ar | ||||
|---|---|---|---|---|---|---|
| Component of the C1s Peak. | B.E. (eV) | %Atom | B.E. (eV) | % Atom | B.E. (eV) | % Atom |
| C1 | 284.53 | 38.11 | 284.6 | 57.24 | 284.61 | 58.82 |
| C2 | 285.66 | 29.48 | 285.75 | 18.94 | 285.7 | 18.91 |
| C3 | 286.70 | 10.01 | 286.7 | 11.32 | 286.7 | 12.27 |
| C4 | 288.54 | 8.44 | 288.72 | 4.82 | 288.73 | 5.81 |
| C5 | 290.21 | 13.96 | 290.59 | 7.68 | 290.57 | 4.20 |
| HFM-183 | HFM-183+PSS | HFM-183+PSS+Ar | ||||
|---|---|---|---|---|---|---|
| Component of the N1s Peak | B.E. (eV) | % Atom | B.E. (eV) | % Atom | B.E. (eV) | %Atom |
| N1 | 399.21 | 65.65 | 399.19 | 72.37 | 399.09 | 68.77 |
| N2 | 402.24 | 34.35 | 401.95 | 27.63 | 401.97 | 31.23 |
© 2019 by the authors. Licensee MDPI, Basel, Switzerland. This article is an open access article distributed under the terms and conditions of the Creative Commons Attribution (CC BY) license (http://creativecommons.org/licenses/by/4.0/).
Share and Cite
Sandoval-Olvera, I.G.; González-Muñoz, P.; Díaz, D.R.; Maroto-Valiente, Á.; Ochoa, N.A.; Carmona, F.J.; Palacio, L.; Calvo, J.I.; Hernández, A.; Ávila-Rodríguez, M.; et al. Morphological, Electrical, and Chemical Characteristics of Poly(sodium 4-styrenesulfonate) Coated PVDF Ultrafiltration Membranes after Plasma Treatment. Polymers 2019, 11, 1689. https://doi.org/10.3390/polym11101689
Sandoval-Olvera IG, González-Muñoz P, Díaz DR, Maroto-Valiente Á, Ochoa NA, Carmona FJ, Palacio L, Calvo JI, Hernández A, Ávila-Rodríguez M, et al. Morphological, Electrical, and Chemical Characteristics of Poly(sodium 4-styrenesulfonate) Coated PVDF Ultrafiltration Membranes after Plasma Treatment. Polymers. 2019; 11(10):1689. https://doi.org/10.3390/polym11101689
Chicago/Turabian StyleSandoval-Olvera, Ivette G., Pilar González-Muñoz, Darío R. Díaz, Ángel Maroto-Valiente, Nelio A. Ochoa, Francisco J. Carmona, Laura Palacio, José I. Calvo, Antonio Hernández, Mario Ávila-Rodríguez, and et al. 2019. "Morphological, Electrical, and Chemical Characteristics of Poly(sodium 4-styrenesulfonate) Coated PVDF Ultrafiltration Membranes after Plasma Treatment" Polymers 11, no. 10: 1689. https://doi.org/10.3390/polym11101689