Initial Survival and Development of Planted European Beech (Fagus sylvatica L.) and Small-Leaved Lime (Tilia cordata Mill.) Seedlings Competing with Black Cherry (Prunus serotina Ehrh.)


Abstract
:
1. Introduction
2. Results
2.1. Mortality
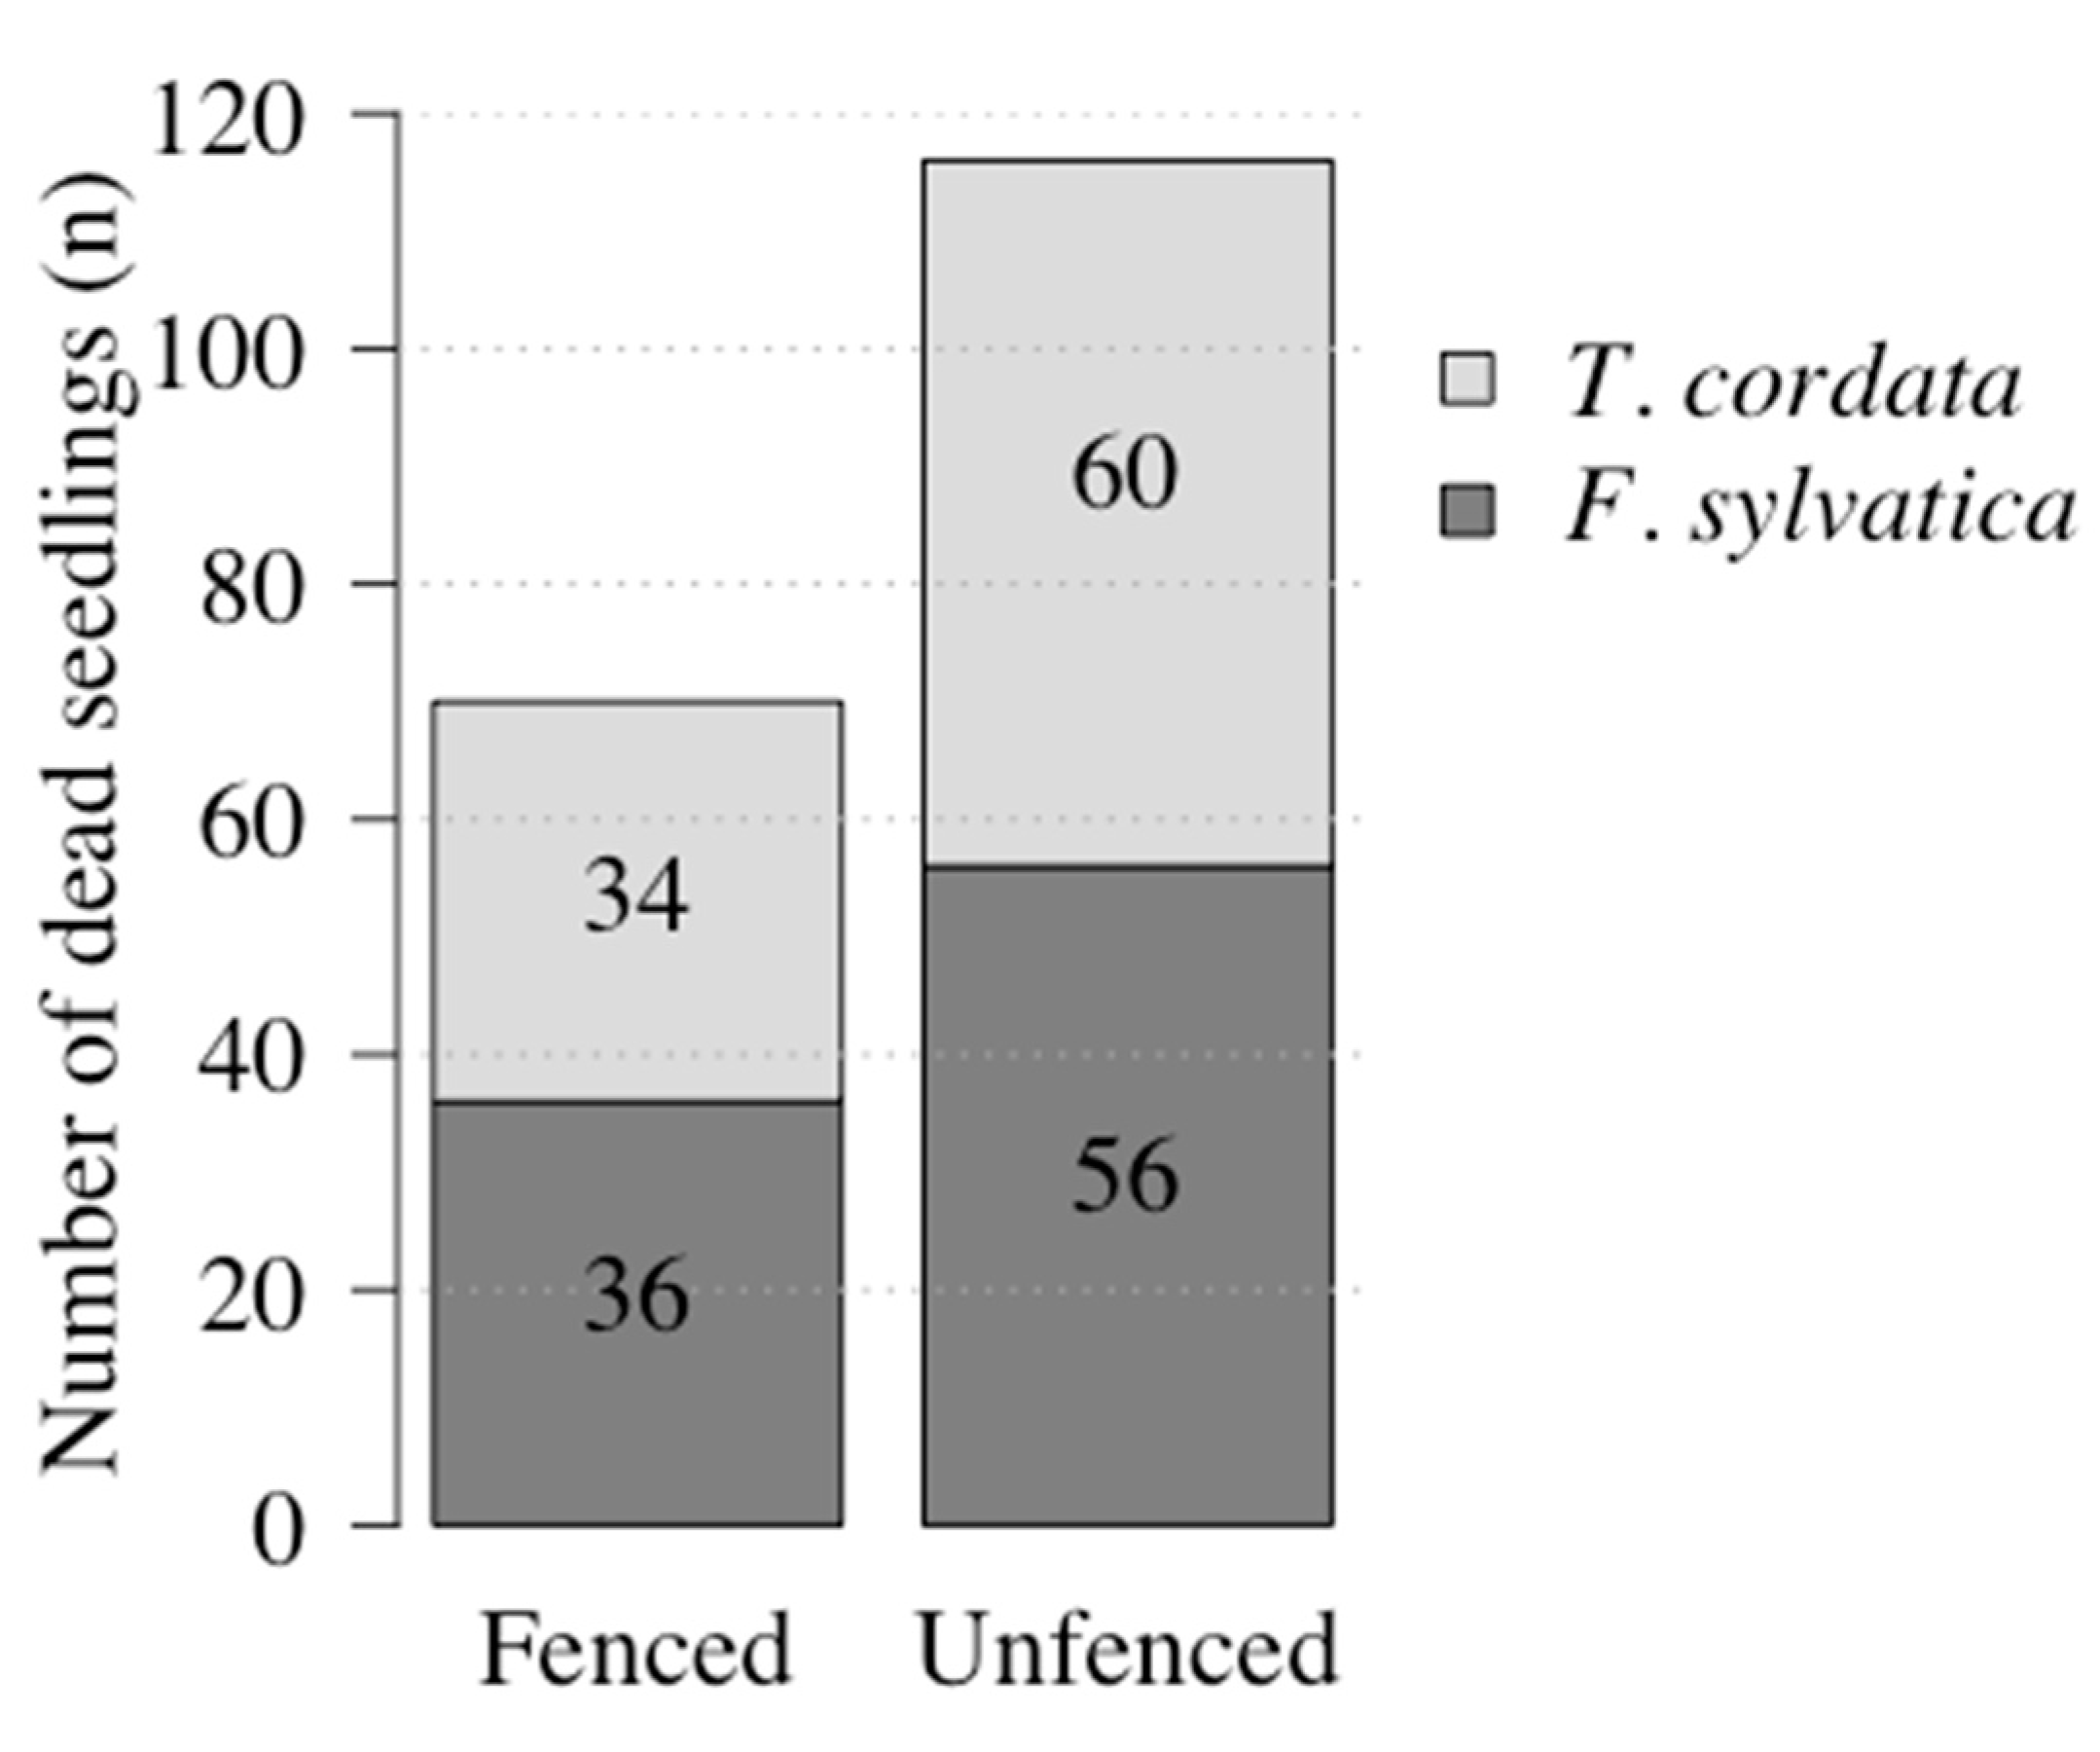
2.1.1. Seedling Mortality Inside and Outside the Fences
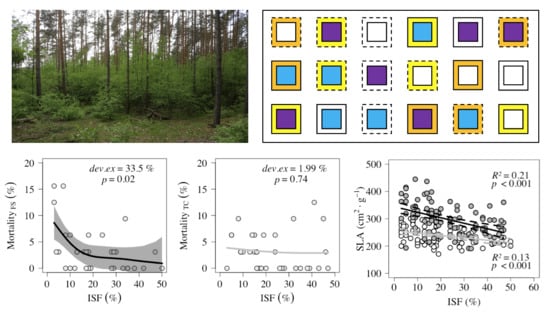
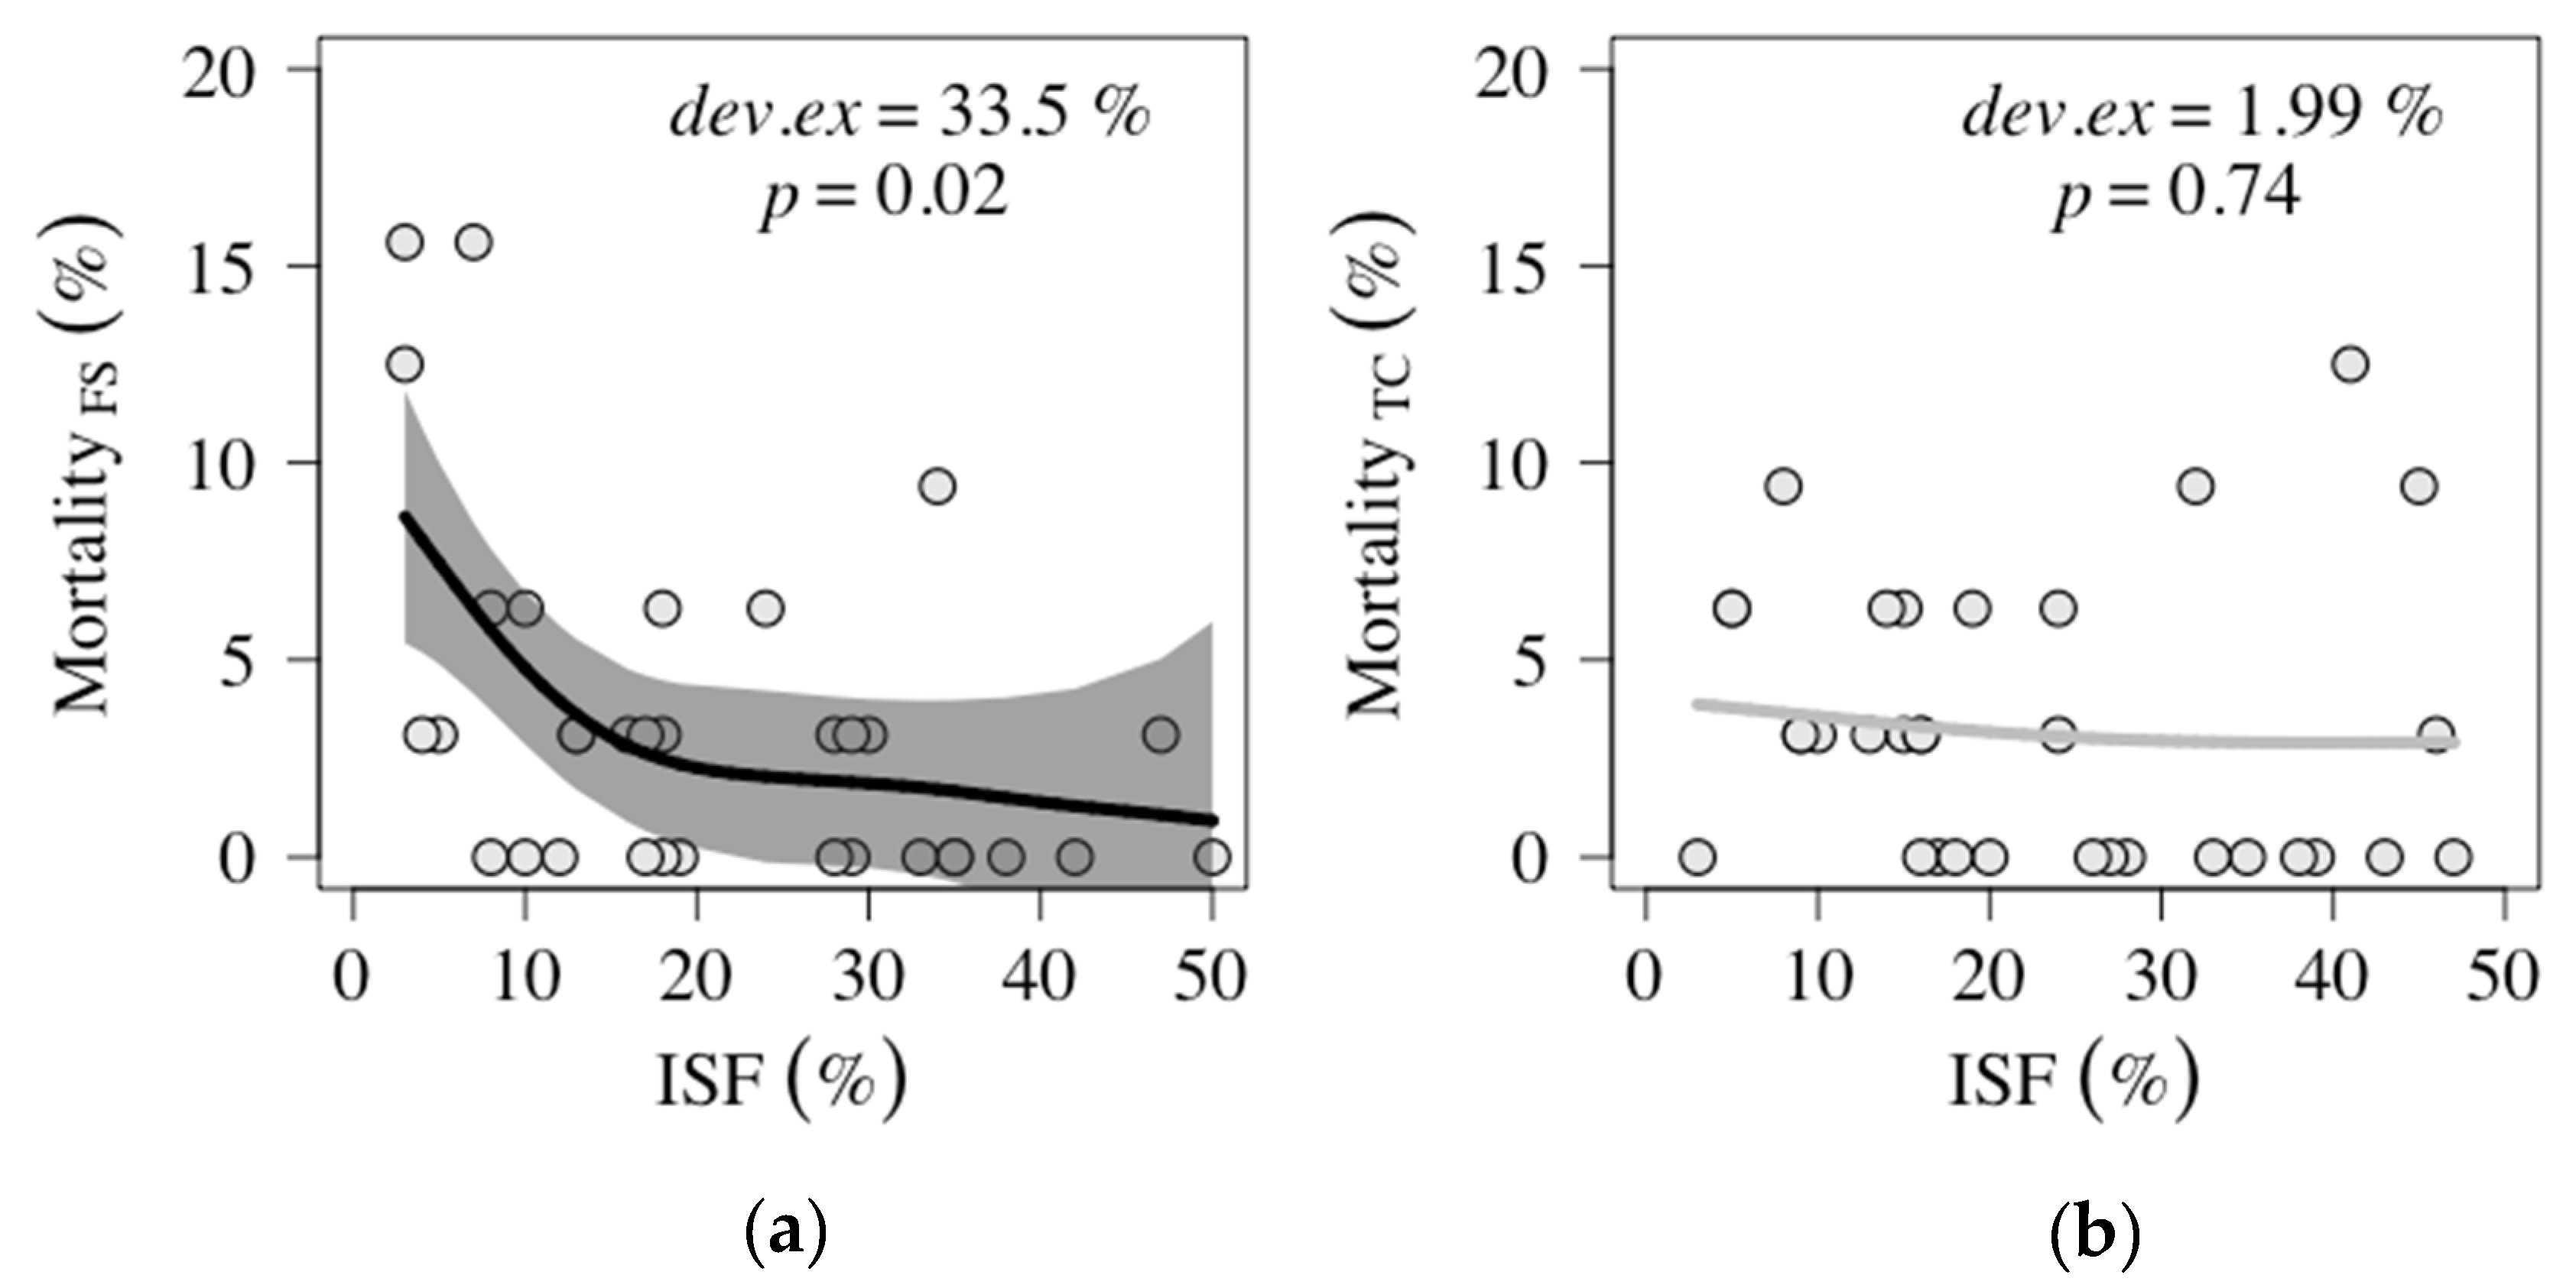
2.1.2. Mortality along light gradient
2.2. Seedling Biomass
2.2.1. Biomass before and after Growing Season
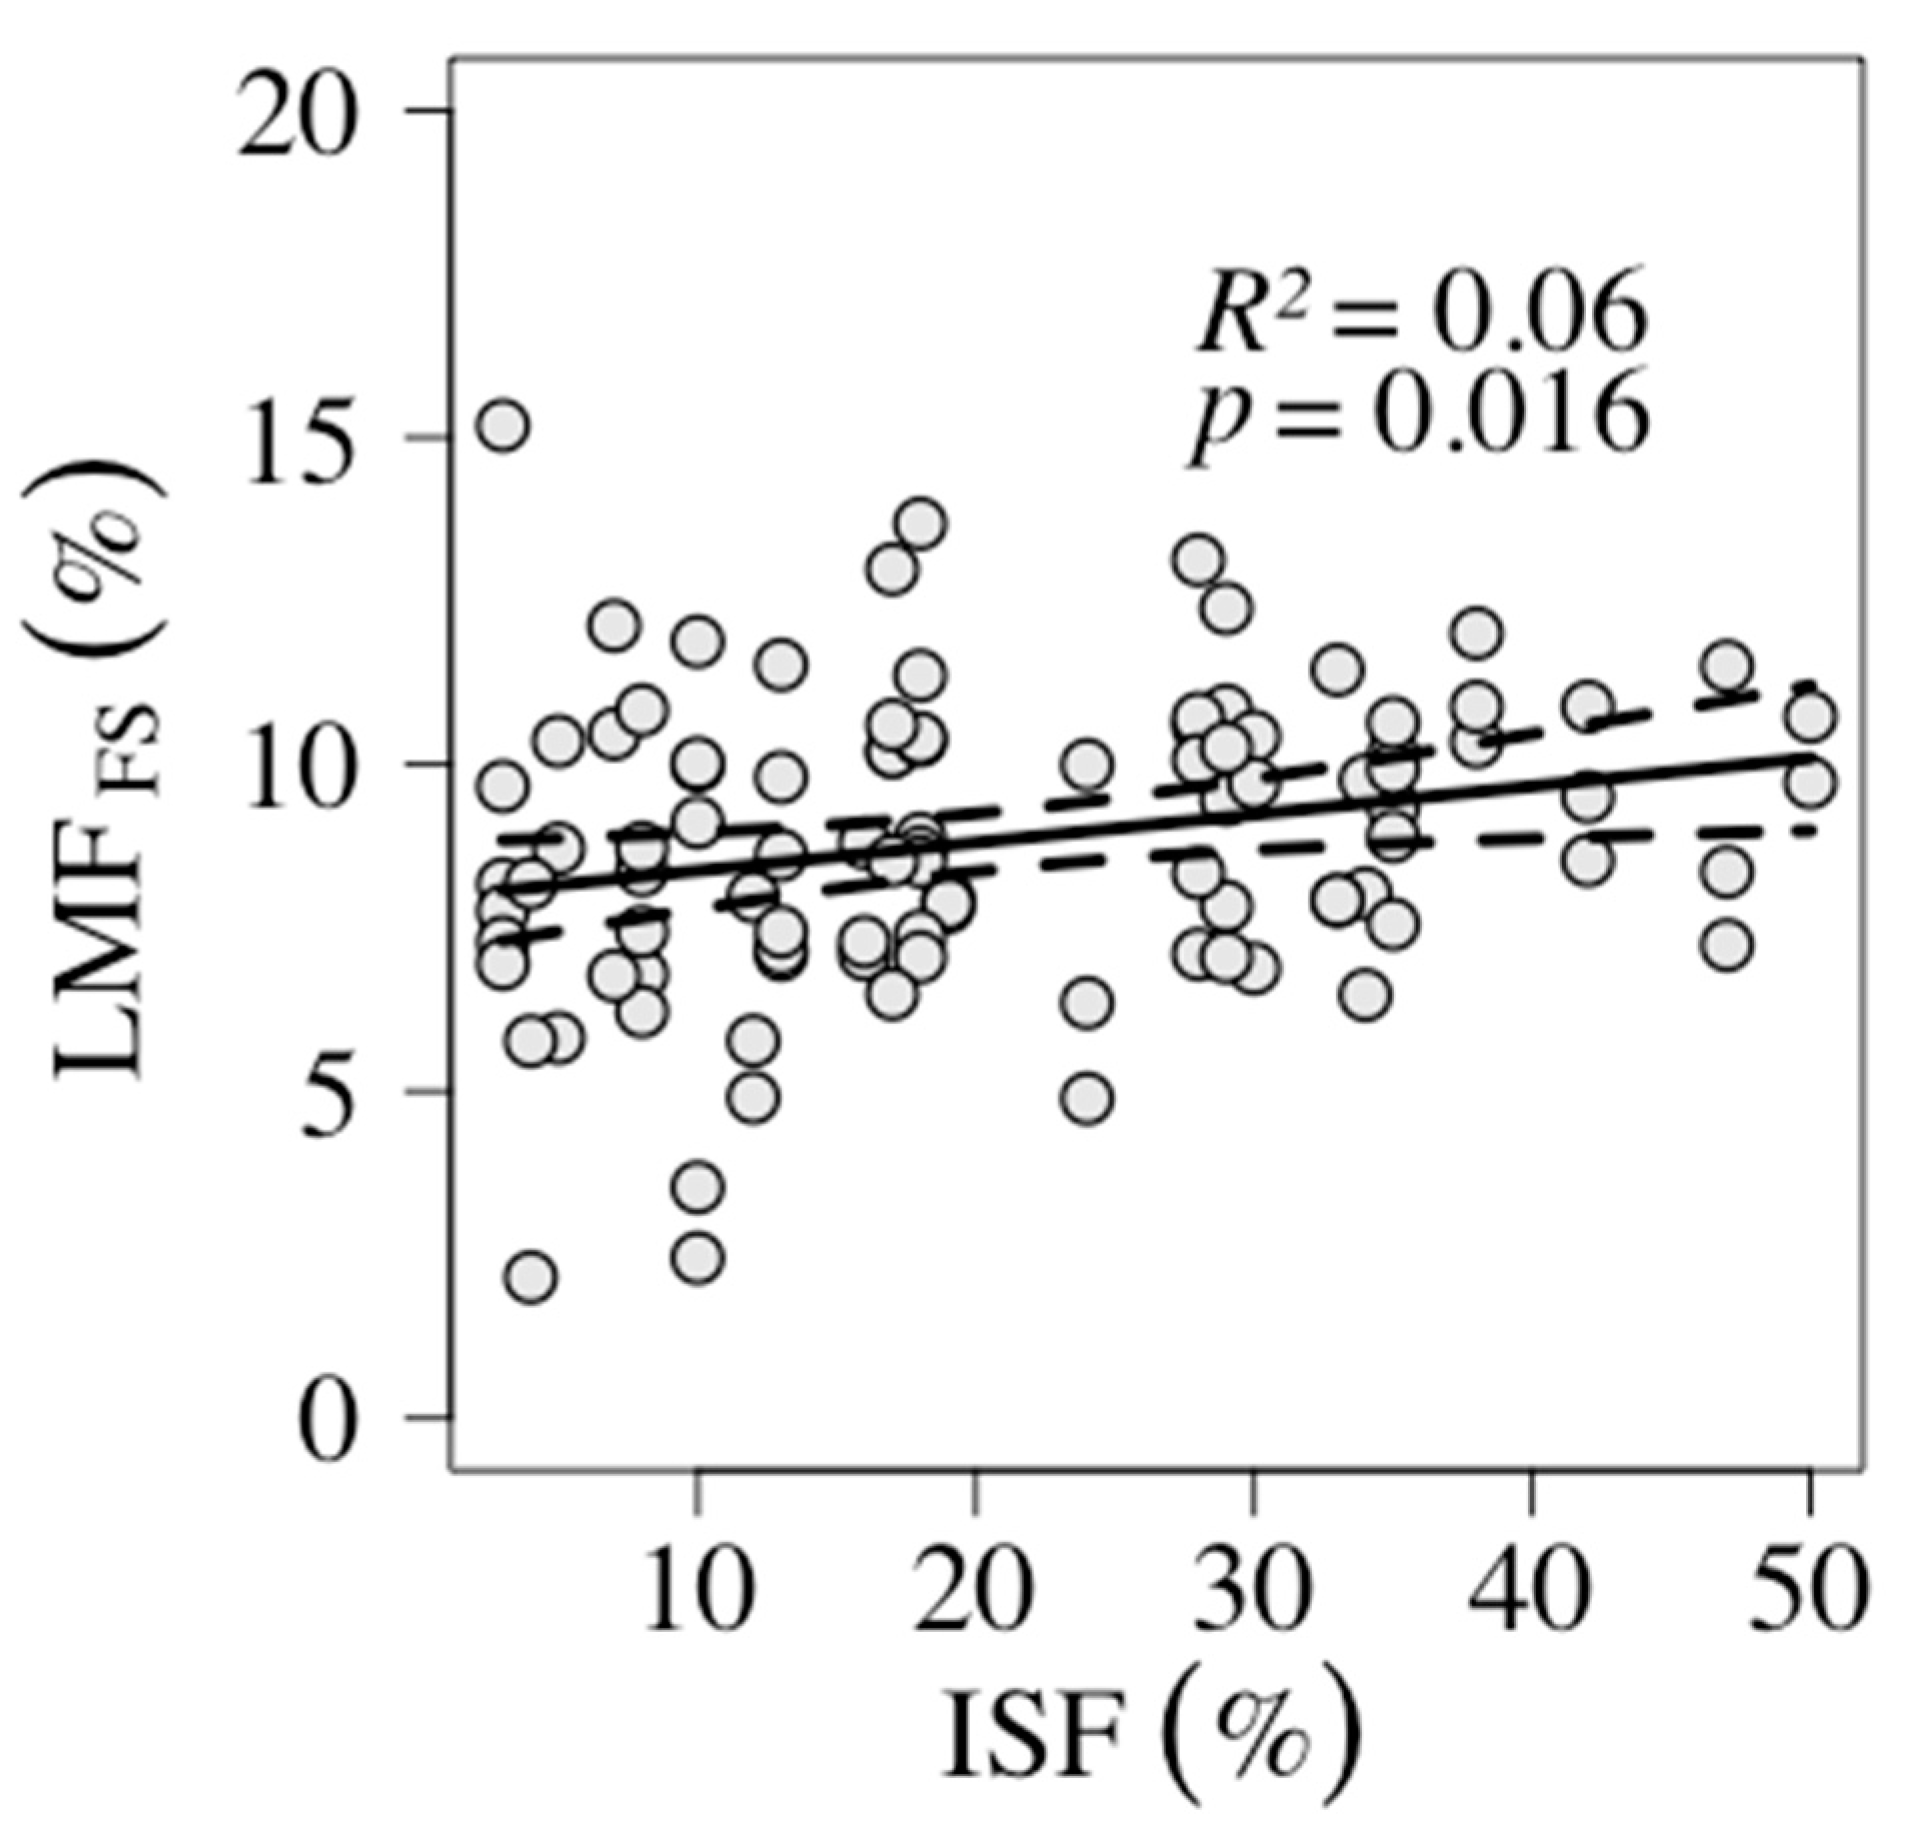
2.2.2. Response in Mass Fractions along the Light Gradient
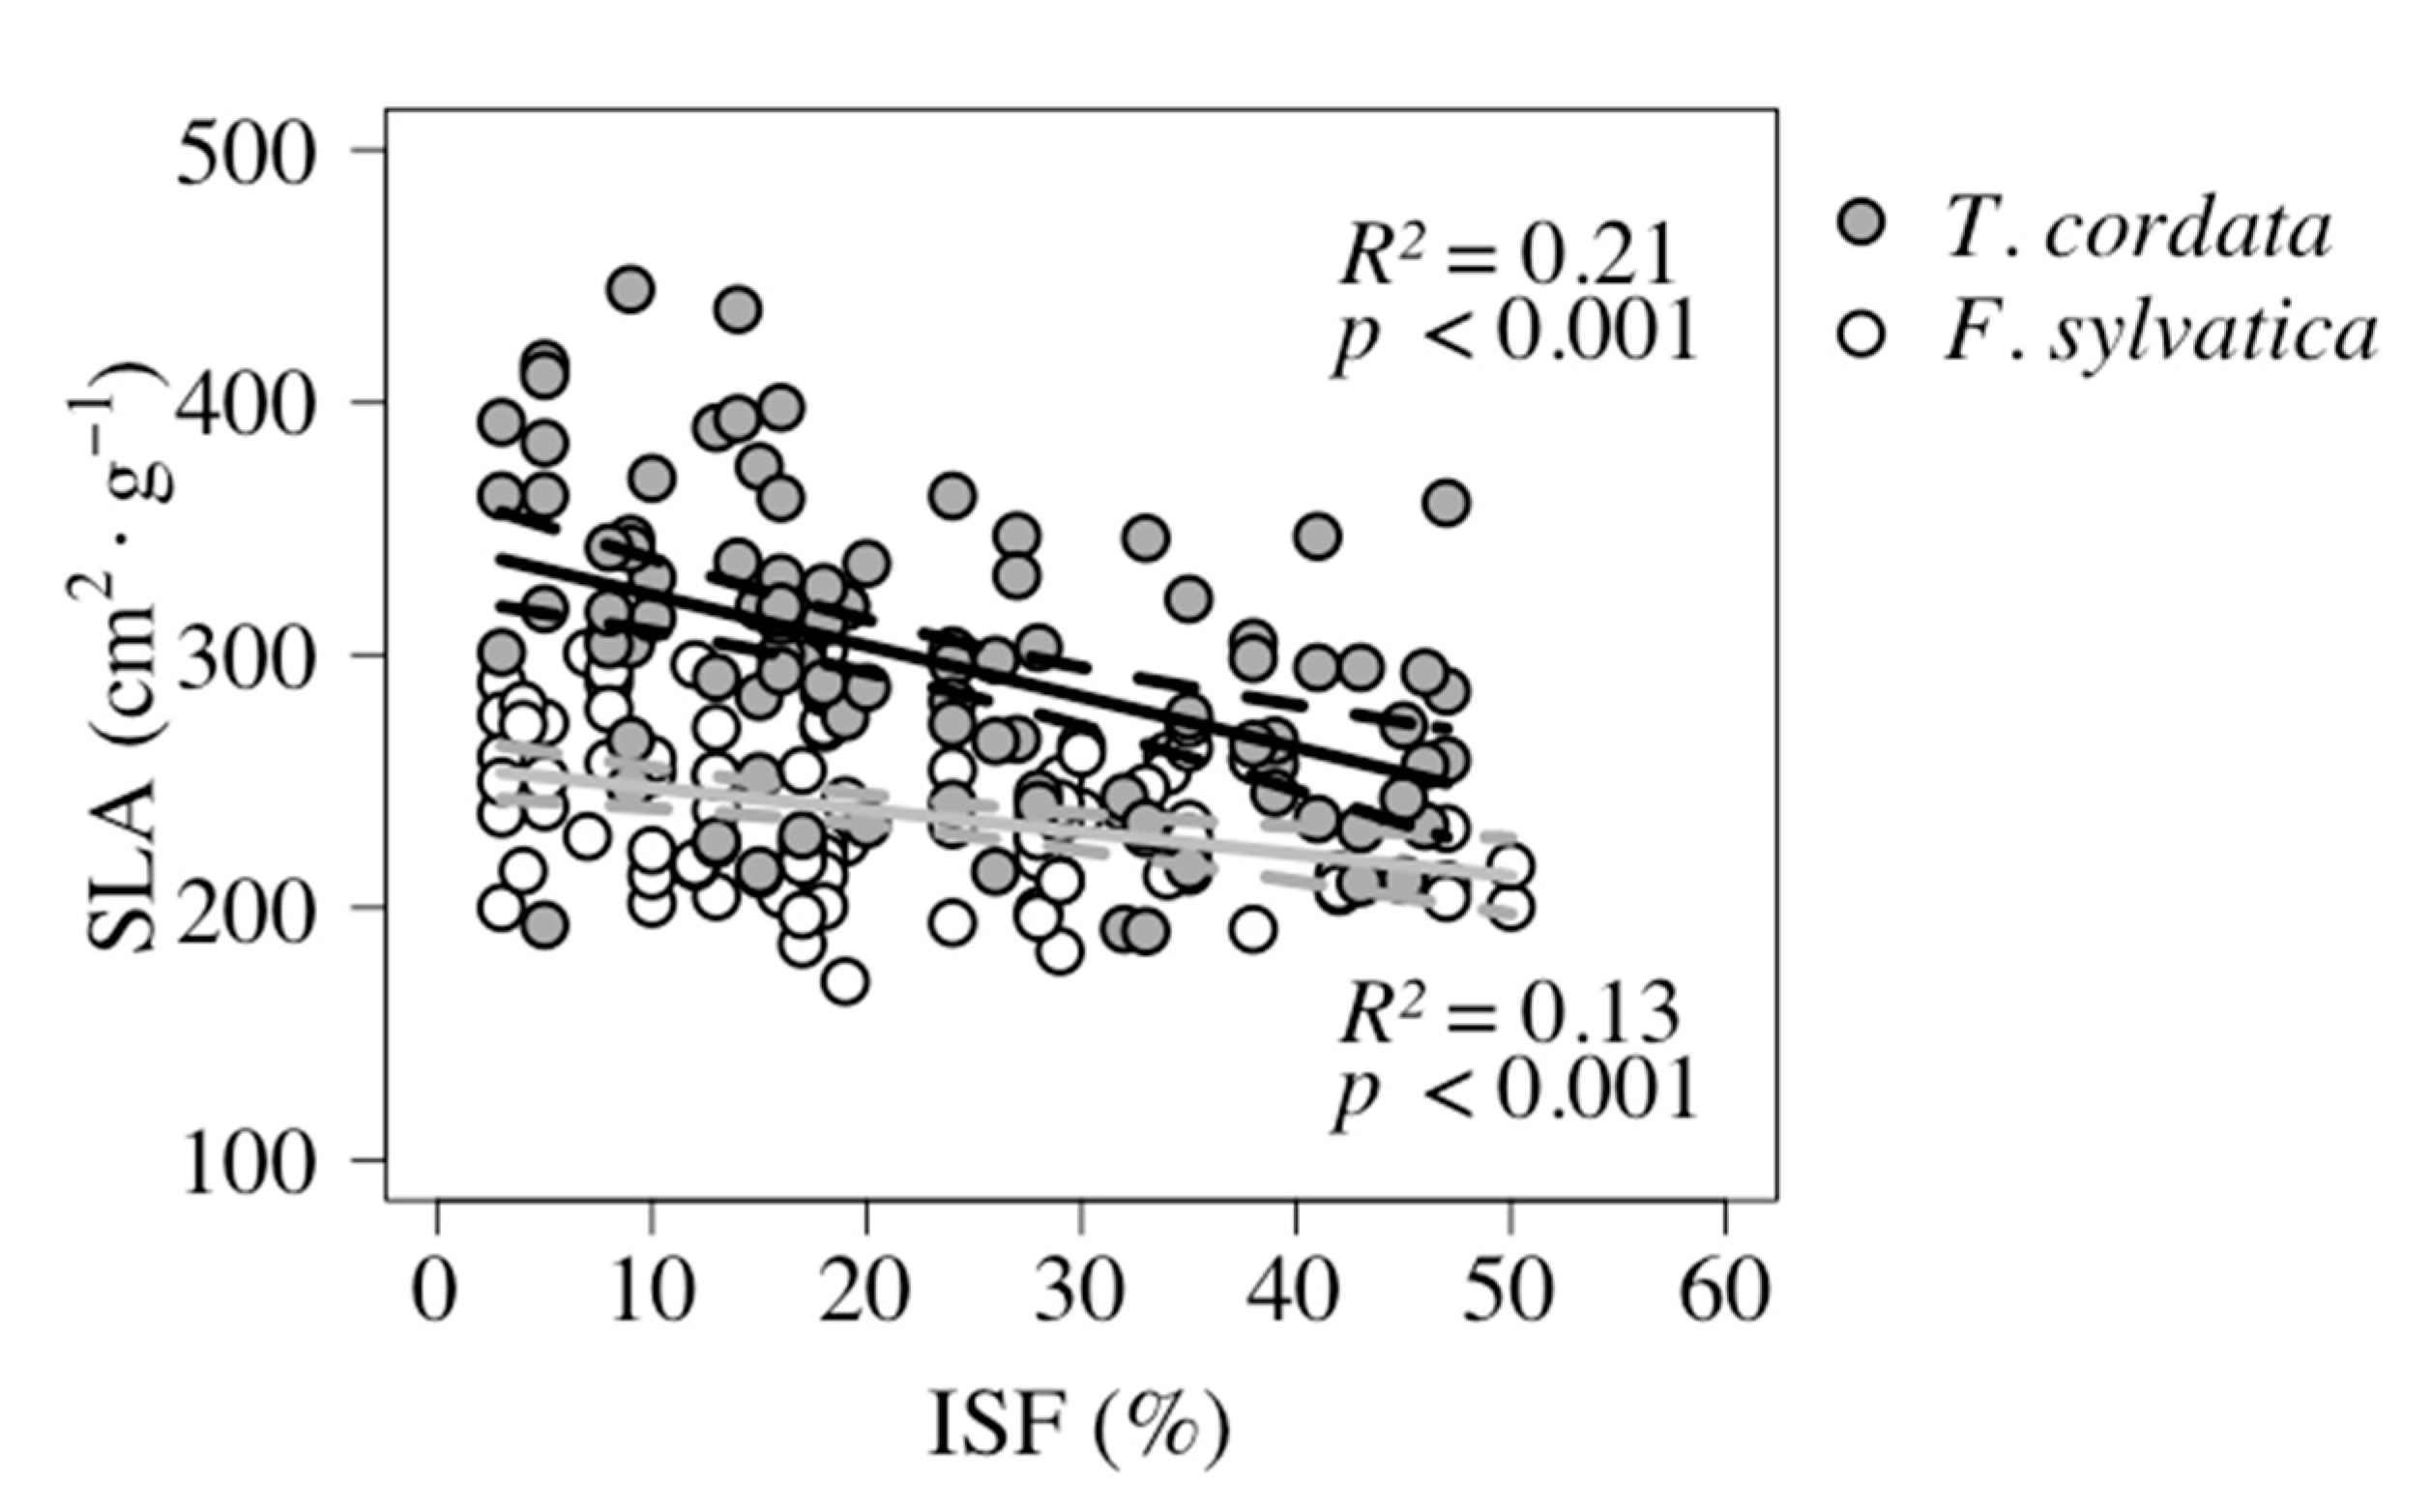
2.3. Specific Leaf Area
3. Discussion
3.1. Mortality
3.1.1. Higher Mortality outside the Fence Due to Herbivory
3.1.2. F. sylvatica Mortality Response to Light
3.2. Seedling Biomass
3.2.1. No Detectable Biomass Increases after the Growing Season
3.2.2. Unexpected Response in F. sylvatica LMF
3.3. Shade Tolerant Species-Specific Reaction in Leaves
4. Materials and Methods
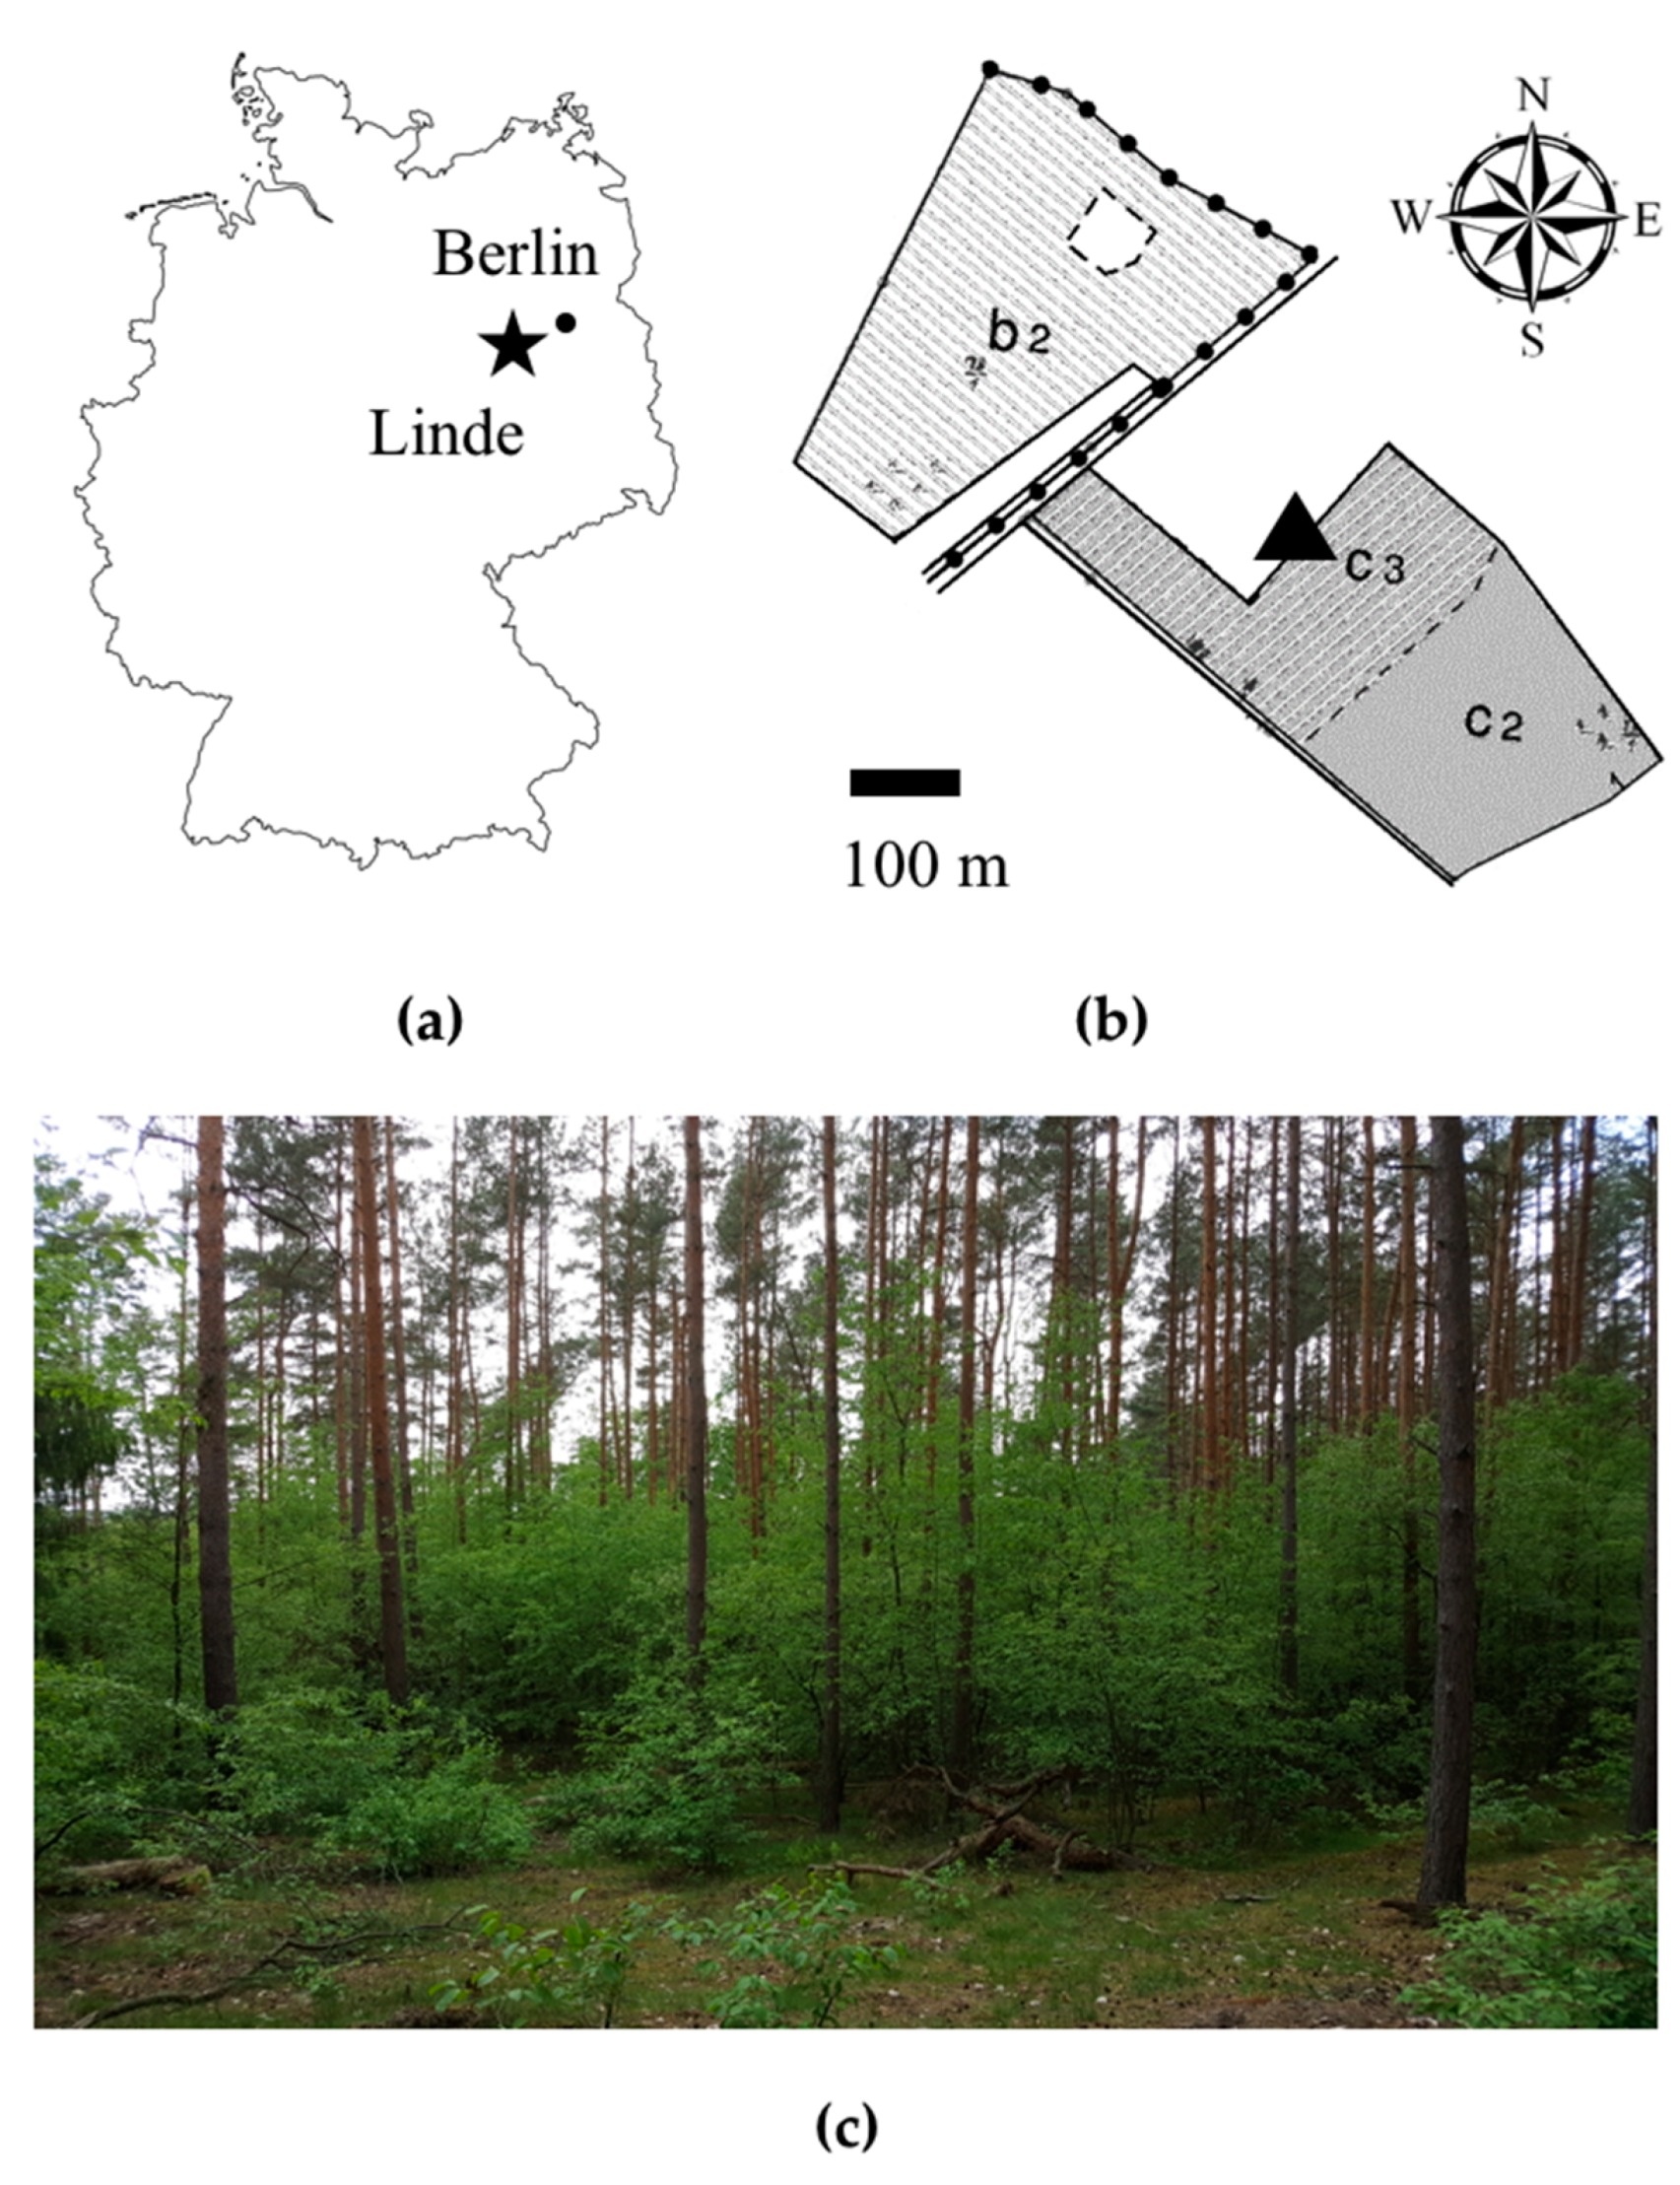
4.1. Study Area
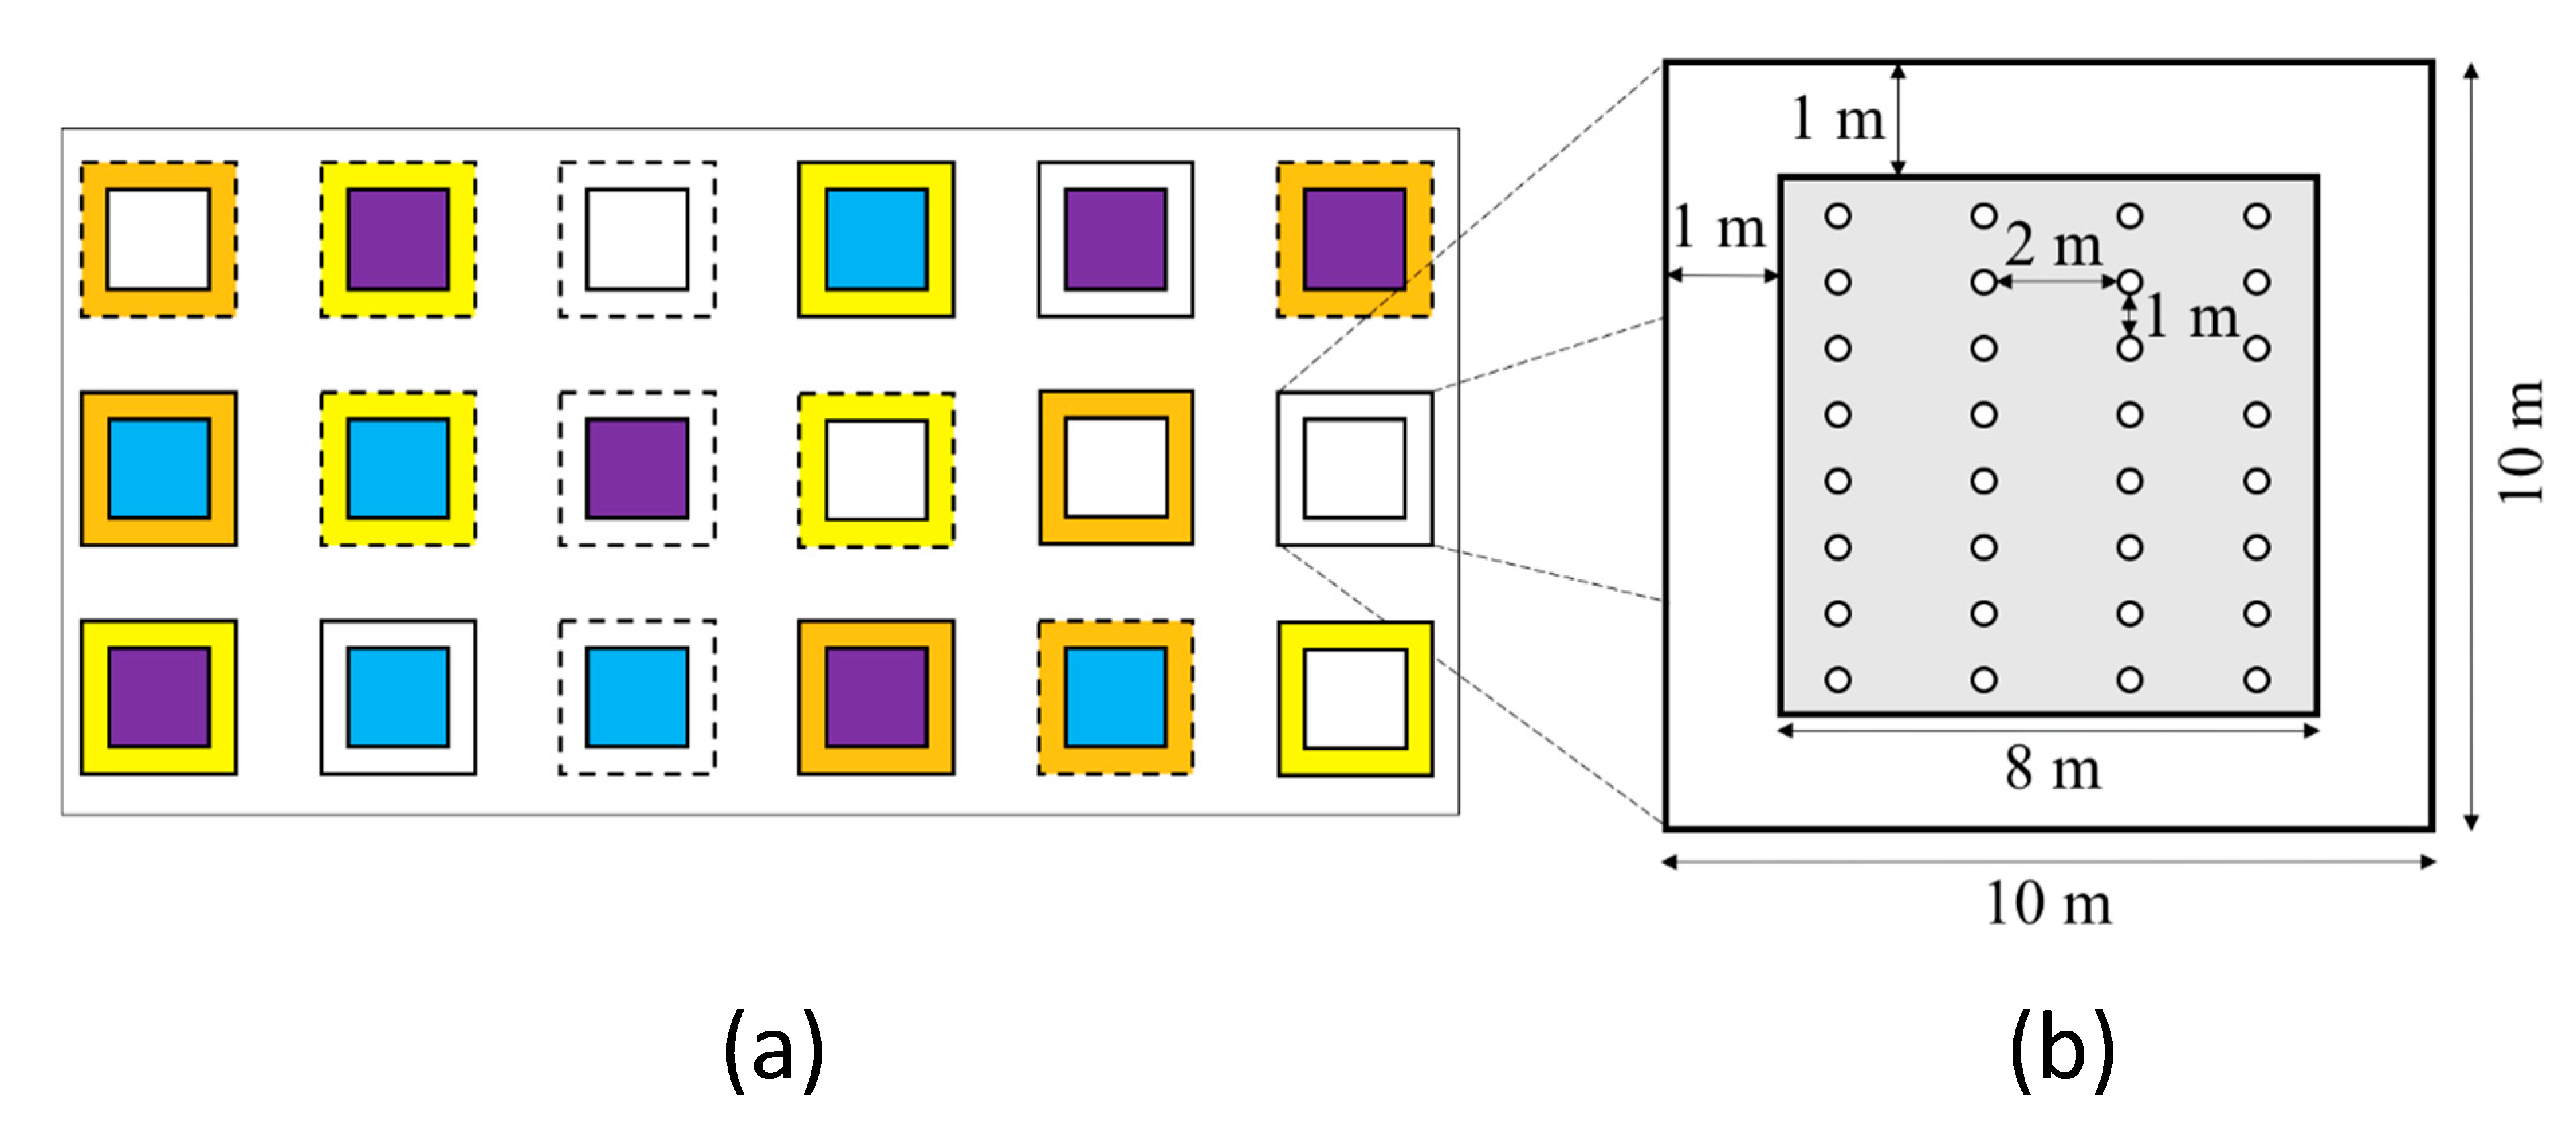
4.2. Study Design
4.3. Field Data Collection
4.3.1. Seedling Delivery
4.3.2. Seedling Mortality
4.3.3. Seedling Harvest
4.3.4. Light Measurements
4.4. Lab Data Collection
4.5. Data Analysis and Modelling
5. Conclusions
Supplementary Materials
Author Contributions
Funding
Acknowledgments
Conflicts of Interest
References
- Mack, R.N.; Simberloff, D.; Lonsdale, W.M.; Evans, H.; Clout, M.; Bazzaz, F.A. Biotic Invasions: Causes, Epidemiology, Global Consequences, and Control. Ecol. Appl. 2000, 10, 689–710. [Google Scholar] [CrossRef]
- Ehrenfeld, J.G. Effects of Exotic Plant Invasions on Soil Nutrient Cycling Processes. Ecosystems 2003, 6, 503–523. [Google Scholar] [CrossRef]
- Starfinger, U. Population Biology of an Invading Tree Species—Prunus serotina. In Species Conservation: A population-Biological Approach Advances in Life Sciences; Seitz, A., Loeschke, V., Eds.; Birkhäuser-Verlag Basel: Basel, Switzerland, 1991; pp. 171–184. [Google Scholar]
- Fowell, H.A. Silvics of Forest Trees of the United States; No. 271. US Department of Agriculture, Forest Service: Washington, DC, USA, 1965. [Google Scholar]
- Marquis, D.A. Prunus serotina Ehrh. Black Cherry. Silv. N. Am. 1990, 2, 594–604. [Google Scholar]
- Hough, A.F. Preliminary recommendations for the management of black cherry on the northern Allegheny Plateau. J. Forest. 1953, 51, 184–188. [Google Scholar]
- Wein, K. Die erste Einführung nordamerikanischer Gehölze in Europa: Teil 1. Mitt. Dtsch. Dendrol. Ges. 1930, 42, 137–163. [Google Scholar]
- Wein, K. Die erste Einführung nordamerikanischer Gehölze in Europa. Teil 2. Mitt. Dtsch. Dendrol. Ges. 1931, 43, 95–154. [Google Scholar]
- Starfinger, U. Die Einbürgerung der Spätblühenden Traubenkirsche (Prunus serotina Ehrh.) in Mitteleuropa. Ph.D. Thesis, Technical University Berlin, Berlin, Germany, 1990. [Google Scholar]
- Starfinger, U.; Kowarik, I.; Rode, M.; Schepker, H. From desirable ornamental plant to pest to accepted addition to the flora?—The perception of an alien tree species through the centuries. Biol. Invasions 2003, 5, 323–335. [Google Scholar] [CrossRef]
- Sinner, H. Prunus serotina, die spätblühende Traubenkirsche als Waldbaum. Mitt. Dtsch. Dendrol. Ges. 1926, 164–184. [Google Scholar]
- Kowarik, I. Biologische Invasionen. Neophyten und Neozoen in Mitteleuropa, 2; Auflage; Ulmer Verlag: Stuttgart, Germany, 2010. [Google Scholar]
- Leclercq, W.L. Dennenmoorder en Prunus serotina. Ned. Bosb. 1960, 32, 74–75. [Google Scholar]
- Starfinger, U. Über Agriophyten: Das Beispiel Prunus serotina. Verh. Berl. Bot. Ver. 1990, 8, 179–188. [Google Scholar]
- Klotz, S. Prunus serotina Ehrh., black cherry (Rosaceae, Magnoliophyta). In Handbook of Alien Species in Europe; Drake, J.A., Ed.; Springer: Dordrecht, The Netherlands, 2009. [Google Scholar]
- Brehm, K. Erfahrungen mit der Bekämpfung der Spätblühenden Traubenkirsche (Prunus serotina) in Schleswig-Holstein in den Jahren 1977 bis 2004. Schriftenreihe des LANU SH–Natur 2004, 10, 66–78. [Google Scholar]
- Bundesministerium für Umwelt, Naturschutz und Reaktorsicherheit. Ökonomische Folgen der Ausbreitung von Neobiota; Bundesministerium für Umwelt, Naturschutz und Reaktorsicherheit: Berlin, Germany, 2003; Available online: http://www.umweltbundesamt.de (accessed on 3 July 2019).
- Petersen, R.; Annighöfer, P.; Spellmann, H.; Leder, B. Spätblühende Traubenlkirsche (Prunus serotina Ehrh.). In Potenziale und Risiken Eingeführter Baumarten: Baumartenportraits mit Naturschutzfachlicher Bewertung; Vor, T., Spellmann, H., Bolte, A., Ammer, C., Eds.; Univ.-Verl. Göttingen: Göttingen, Germany, 2015; pp. 167–186. ISBN 9783863952402. [Google Scholar]
- Spaeth, I.; Balder, H.; Kilz, E. Das Problem mit der Spätblühenden Traubenkirsche in den Berliner Forsten. Allg. Forst Jagdzeitschrift 1994, 11, 234–236. [Google Scholar]
- Closset-Kopp, D.; Chabrerie, O.; Valentin, B.; Delachapelle, H.; Decocq, G. When Oskar meets Alice: Does a lack of trade-off in r/K-strategies make Prunus serotina a successful invader of European forests? For. Ecol. Manag. 2007, 247, 120–130. [Google Scholar] [CrossRef]
- Annighöfer, P.; Schall, P.; Kawaletz, H.; Mölder, I.; Terwei, A.; Zerbe, S.; Ammer, C. Vegetative growth response of black cherry (Prunus serotina) to different mechanical control methods in a biosphere reserve. Can. J. For. Res. 2012, 42, 2037–2051. [Google Scholar] [CrossRef]
- Auclair, A.N. Sprouting Response in Prunus serotina Erhr.: Multivariate Analysis of Site, Forest Structure and Growth Rate Relationships. Am. Midl. Nat. 1975, 94, 72–87. [Google Scholar] [CrossRef]
- Annighöfer, P.; Kawaletz, H.; Terwei, A.; Mölder, I.; Zerbe, S.; Ammer, C. Managing an invasive tree species—Silvicultural recommendations for black cherry (Prunus serotina Ehrh.): Bewirtschaftung einer invasiven Baumart—Waldbauliche Empfehlungen für die Spätblühende Traubenkirsche (Prunus serotina Ehrh.). Forstarchiv 2015, 86, 139–152. [Google Scholar]
- Borrmann, K. Ausbreitung und rationelle Bekämpfung der Spatblühenden Traubenkirsche (Prunus serotina). Soc. Forstwirtsch. 1988, 38, 366–371. [Google Scholar]
- Muys, B.; Maddelein, D.; Lust, N. Ecology, Practice and Policy of Black cherry (Prunus serotina Ehrh.) Management in Belgium. Silva Gandav. 1992, 57, 28–45. [Google Scholar] [CrossRef] [Green Version]
- Hamm, T.; Huth, F.; Wagner, S. Kiefernforsten renaturieren trotz Spätblühender Traubenkirsche? AFZ-DerWald 2015, 70, 22–25. [Google Scholar]
- Hamm, T.; Huth, F.; Wagner, S. Einfluss der Spätblühenden Traubenkirsche (Prunus serotina EHRH.) auf die Verjüngung heimischer Laubbaumarten in Kiefernforsten. Forsch. DBU-Nat. Dyn. Offenland Wald Dtsch. Bundesstiftung Umw. Osnabrück 2017, 2017, 40–46. [Google Scholar]
- Petersen, R. Waldbaulicher Umgang mit der Spätblühenden Traubenkirsche. AFZ-DerWald 2015, 70, 18–21. [Google Scholar]
- Lambers, H.; Chapin, F.S., III; Pons, T.L. Plant Physiological Ecology, 2nd ed.; Springer: New York, NY, USA, 2008. [Google Scholar]
- Matyssek, R.; Fromm, J.; Rennenberg, H.; Roloff, A. Biologie der Bäume: Von der Zelle zur globalen Ebene. 32 Tabellen, 1; Auflage Ulmer; UTB: Stuttgart, Germany, 2010. [Google Scholar]
- Thomas, D.S. Hydrogel applied to the root plug of subtropical eucalypt seedlings halves transplant death following planting. For. Ecol. Manag. 2008, 255, 1305–1314. [Google Scholar] [CrossRef]
- Gill, R.M.A. A Review of Damage by Mammals in North Temperate Forests: 3. Impact on trees and Forests. Forestry 1992, 65, 363–388. [Google Scholar] [CrossRef] [Green Version]
- Rüegg, D.; Nigg, H. Schweizerische Zeitschrift für Forstwesen. Schweiz. Z. Forstwes. 2003, 154, 314–321. [Google Scholar] [CrossRef] [Green Version]
- Gill, R.M.A. A Review of Damage by Mammals in North Temperate Forests: 1. Deer. Forestry 1992, 65, 145–169. [Google Scholar] [CrossRef] [Green Version]
- Ammer, C.; Vor, T.; Knoke, T.; Wagner, S. Der Wald-Wild-Konflikt: Analyse und Lösungsansätze vor dem Hintergrund Rechtlicher, Ökologischer und Ökonomischer Zusammenhänge; Universitätsverlag Göttingen: Göttingen, Germany, 2010. [Google Scholar]
- Gill, R.M.A. A Review of Damage by Mammals in North Temperate Forests. 2. Small Mammals. Forestry 1992, 65, 281–308. [Google Scholar] [CrossRef]
- Bartsch, N.; Röhrig, E. Waldökologie. Einführung für Mitteleuropa; 1. Aufl. 2016; Springer Spektrum: Berlin/Heidelberg, Germany, 2016; ISBN 9783662442678. [Google Scholar]
- Vallandares, F.; Niinemets, Ü. Shade tolerance, a key plant feature of complex nature and consequences. Ann. Rev. Ecol. Evol. Sys. 2008, 39, 237–257. [Google Scholar] [CrossRef] [Green Version]
- Ellenberg, H.; Leuschner, C. Vegetation Mitteleuropas mit den Alpen: In Ökologischer, Dynamischer und Historischer Sicht, 6; Auflage; UTB: Stuttgart, Germany, 2010. [Google Scholar]
- Grubb, P.J.; Lee, W.G.; Kollmann, J.; Bastow Wilson, J. Interaction of Irradiance and Soil Nutrient Supply on Growth of Seedlings of Ten European Tall-Shrub Species and Fagus sylvatica. J. Ecol. 1996, 84, 827–840. [Google Scholar] [CrossRef]
- Kunstler, G.; Curt, T.; Bouchaud, M.; Lepart, J. Growth, mortality, and morphological response of European beech and downy oak along a light gradient in sub-Mediterranean forest. Can. J. For. Res. 2005, 35, 1657–1668. [Google Scholar] [CrossRef]
- Löf, M.; Karlsson, M.; Sonesson, K.; Welander, T.N.; Collet, C. Growth and mortality in underplanted tree seedlings in response to variations in canopy closure of Norway spruce stands. Forestry 2007, 80, 371–383. [Google Scholar] [CrossRef]
- Petritan, A.M.; von Lupke, B.; Petritan, I.C. Effects of shade on growth and mortality of maple (Acer pseudoplatanus), ash (Fraxinus excelsior) and beech (Fagus sylvatica) saplings. Forestry 2007, 80, 397–412. [Google Scholar] [CrossRef]
- Vernay, A.; Malagoli, P.; Fernandez, M.; Perot, T.; Améglio, T.; Balandier, P. Improved Deschampsia cespitosa growth by nitrogen fertilization jeopardizes Quercus petraea regeneration through intensification of competition. Basic Appl. Ecol. 2018, 31, 21–32. [Google Scholar] [CrossRef]
- Brouwer, R. Some aspects of the equilibrium between overground and underground plant parts. Jaarboek van het Instituut voor Biologisch en Scheikundig onderzoek aan Landbouwgewassen 1963, 1963, 31–39. [Google Scholar]
- Brouwer, R. Functional equilibrium: Sense or nonsense? Neth. J. Agric. Sci. 1983, 31, 335–348. [Google Scholar]
- Shipley, B.; Meziane, D. The balanced-growth hypothesis and the allometry of leaf and root biomass allocation. Func. Ecol. 2002, 16, 326–331. [Google Scholar] [CrossRef]
- Poorter, H.; Niklas, K.J.; Reich, P.B.; Oleksyn, J.; Poot, P.; Mommer, L. Biomass allocation to leaves, stems and roots: Meta-analyses of interspecific variation and environmental control. New Phytol. 2012, 193, 30–50. [Google Scholar] [CrossRef]
- Annighöfer, P. Stress relief through gap creation? Growth response of a shade tolerant species (Fagus sylvatica L.) to a changed light environment. For. Ecol. Manag. 2018, 415, 139–147. [Google Scholar] [CrossRef]
- Van Hees, A.F.M.; Clerkx, A.P.P.M. Shading and root–shoot relations in saplings of silver birch, pedunculate oak and beech. For. Ecol. Manag. 2003, 176, 439–448. [Google Scholar] [CrossRef]
- Poorter, L.; Oberbauer, S.F. Photosynthetic induction responses of two rainforest tree species in relation to light environment. Oecologia 1993, 96, 193–199. [Google Scholar] [CrossRef]
- Brown, C.E.; Mickelbart, M.V.; Jacobs, D.F. Leaf physiology and biomass allocation of backcross hybrid American chestnut (Castanea dentata) seedlings in response to light and water availability. Tree Physiol. 2014, 34, 1362–1375. [Google Scholar] [CrossRef]
- Canham, C.D.; Berkowitz, A.R.; Kelly, V.R.; Lovett, G.M.; Ollinger, S.V.; Schnurr, J. Biomass allocation and multiple resource limitation in tree seedlings. Can. J. For. Res. 1996, 26, 1521–1530. [Google Scholar] [CrossRef]
- Enquist, B.J.; Niklas, K.J. Global allocation rules for patterns of biomass partitioning in seed plants. Science 2002, 295, 1517–1520. [Google Scholar] [CrossRef] [PubMed] [Green Version]
- Jarčuška, B.; Barna, M. Plasticity in above-ground biomass allocation in Fagus sylvatica L. saplings in response to light availability. Ann. For. Res. 2011, 54, 151–160. [Google Scholar]
- Ammer, C. Growth and biomass partitioning of Fagus sylvatica L. and Quercus robur L. seedlings in response to shading and small changes in the R/FR-ratio of radiation. Ann. For. Sci. 2003, 60, 163–171. [Google Scholar] [CrossRef]
- Legner, N.; Fleck, S.; Leuschner, C. Within-canopy variation in photosynthetic capacity, SLA and foliar N in temperate broad-leaved trees with contrasting shade tolerance. Trees 2014, 28, 263–280. [Google Scholar] [CrossRef]
- Vile, D.; Garnier, E.; Shipley, B.; Laurent, G.; Navas, M.-L.; Roumet, C.; Lavorel, S.; Díaz, S.; Hodgson, J.G.; Lloret, F.; et al. Specific leaf area and dry matter content estimate thickness in laminar leaves. Ann. Bot.-Lond. 2005, 96, 1129–1136. [Google Scholar] [CrossRef]
- Witkowski, E.T.F.; Lamont, B.B. Leaf specific mass confounds leaf density and thickness. Oecologia 1991, 88, 486–493. [Google Scholar] [CrossRef]
- Landschaftsrahmenplan Landkreis Havelland. Band 2 Bestand und Bewertung. Available online: https://www.havelland.de/fileadmin/dateien/amt66/66.2_UNB/LRP/LRP_HVL_Band_2_Bestand_und_Bewertung_Entwurf.pdf (accessed on 28 January 2019).
- Bundesanstalt für Landwirtschaft und Ernährung. Forstliches Vermehrungsgut—Informationen für die Praxis; Bundesanstalt für Landwirtschaft und Ernährung: Bonn, Germany, 2017; Available online: https://www.ble-medienservice.de/frontend/esddownload/index/id/300/on/1164_DL/act/dl (accessed on 15 January 2019).
- Balandier, P.; Lacointe, A.; Le Roux, X.; Sinoquet, H.; Cruiziat, P.; Le Dizès, S. SIMWAL: A structural-functional model simulating single walnut tree growth in response to climate and pruning. Ann. For. Sci. 2000, 57, 571–585. [Google Scholar] [CrossRef]
- R Development Core Team 2013. R: A Language and Environment for Statistical Computing. Available online: http://www.R-project.org (accessed on 5 November 2017).
- Otto, S.A.; Diekmann, R.; Flinkman, J.; Kornilovs, G.; Möllmann, C. Habitat heterogeneity determines climate impact on zooplankton community structure and dynamics. PLoS ONE 2014, 9, e90875. [Google Scholar] [CrossRef] [Green Version]
- Mgcv: Mixed GAM Computation Vehicle with Automatic Smoothness Estimation. Available online: https://rdrr.io/cran/mgcv/ (accessed on 11 November 2019).


| Species | Fencing | Plots (n) | Mortality Per Plot (%) | Ass. Figure | ||
|---|---|---|---|---|---|---|
| Min | Mean ± SD (Median) | Max | ||||
| F. sylvatica | Fenced | 33 | 0 | 3.41 ± 4.38 (3.13) | 15.63 | Figure 2a |
| Unfenced | 33 | 0 | 5.31 ± 6.08 (3.13) | 25.00 | ||
| T. cordata | Fenced | 33 | 0 | 3.22 ± 3.54 (3.13) | 12.50 | Figure 2b |
| Unfenced | 32 | 0 | 5.87 ± 6.77 (3.13) | 31.25 | ||
| Species | Nursery | Harvest | p (Kruskal) | ||||||||
|---|---|---|---|---|---|---|---|---|---|---|---|
| Sample | Unit | n1 | Min | Mean ± SD (Median) | Max | n2 | Min | Mean ± SD (Median) | Max | ||
| F. sylvatica | TDM | g | 30 | 13.39 | 26.68 ± 11.02 (25.29) | 59.63 | 98 | 12.42 | 31.33 ± 12.95 (29.16) | 70.59 | 0.09 |
| AGB | g | 30 | 5.93 | 12.62 ± 5.97 (11.28) | 31.38 | 98 | 6.20 | 14.47 ± 6.34 (13.09) | 35.91 | 0.11 | |
| RM | g | 30 | 6.60 | 14.06 ± 5.46 (13.80) | 28.26 | 98 | 6.09 | 16.86 ± 7.21 (15.18) | 39.78 | 0.07 | |
| T. cordata | TDM | g | 28 | 3.17 | 7.74 ± 4.12 (7.35) | 19.08 | 99 | 1.46 | 9.14 ± 4.84 (7.68) | 24.51 | 0.20 |
| AGB | g | 28 | 1.52 | 3.46 ± 1.67 (2.94) | 8.65 | 99 | 0.86 | 3.93 ± 1.89 (3.59) | 9.38 | 0.24 | |
| RM | g | 28 | 1.05 | 4.28 ± 2.59 (3.82) | 11.27 | 99 | 0.58 | 5.21 ± 3.13 (4.44) | 15.27 | 0.17 | |
| Species | Response Variable | Slope | p-Value | Intercept | Model Equation | R2 | Ass. Figure |
|---|---|---|---|---|---|---|---|
| F. sylvatica | AGB | 0.08 | 0.194 | 15.86 | 0.08 x + 15.86 | 0.02 | |
| LMF | 0.04 | 0.016 | 7.94 | 0.04 x + 7.94 | 0.06 | Figure 3 | |
| BMF | −0.03 | 0.310 | 11.64 | −0.03 + 11.64 | 0.01 | ||
| SMF | −0.06 | 0.127 | 32.51 | −0.06 + 32.51 | 0.02 | ||
| RMF | 0.05 | 0.205 | 47.91 | 0.05 + 47.91 | 0.02 | ||
| SLA | −0.87 | >0.001 | 256.14 | −0.87 + 256.14 | 0.13 | Figure 4 | |
| T. cordata | AGB | 0.03 | 0.127 | 4.29 | 0.03 + 4.29 | 0.02 | |
| LMF | 0.03 | 0.226 | 9.25 | 0.03 + 9.25 | 0.02 | ||
| BMF | −0.005 | 0.839 | 3.55 | −0.005 + 3.55 | >0.001 | ||
| SMF | −0.03 | 0.589 | 37.83 | −0.03 + 37.83 | 0.003 | ||
| RMF | 0.01 | 0.841 | 49.37 | 0.01 + 49.37 | >0.001 | ||
| SLA | −2.01 | > 0.001 | 343.87 | −2.01 + 343.87 | 0.21 | Figure 4 |
| Species | N | Scanned Leaves per Subsample (n) | SLA (cm2g −1) | ||||
|---|---|---|---|---|---|---|---|
| Min | Mean ± SD (Median) | Max | Min | Mean ± SD (Median) | Max | ||
| F. sylvatica | 96 | 6 | 19.8 ± 1.8 (20) | 22 | 170.7 | 237.6 ± 31.4 (232.4) | 307.0 |
| T. cordata | 99 | 3 | 9.6 ± 1.6 (10) | 13 | 190.6 | 297.7 ± 56.8 (298.0) | 444.8 |
© 2020 by the authors. Licensee MDPI, Basel, Switzerland. This article is an open access article distributed under the terms and conditions of the Creative Commons Attribution (CC BY) license (http://creativecommons.org/licenses/by/4.0/).
Share and Cite
Hasstedt, S.L.; Annighöfer, P. Initial Survival and Development of Planted European Beech (Fagus sylvatica L.) and Small-Leaved Lime (Tilia cordata Mill.) Seedlings Competing with Black Cherry (Prunus serotina Ehrh.). Plants 2020, 9, 677. https://doi.org/10.3390/plants9060677
Hasstedt SL, Annighöfer P. Initial Survival and Development of Planted European Beech (Fagus sylvatica L.) and Small-Leaved Lime (Tilia cordata Mill.) Seedlings Competing with Black Cherry (Prunus serotina Ehrh.). Plants. 2020; 9(6):677. https://doi.org/10.3390/plants9060677
Chicago/Turabian StyleHasstedt, Sarah L., and Peter Annighöfer. 2020. "Initial Survival and Development of Planted European Beech (Fagus sylvatica L.) and Small-Leaved Lime (Tilia cordata Mill.) Seedlings Competing with Black Cherry (Prunus serotina Ehrh.)" Plants 9, no. 6: 677. https://doi.org/10.3390/plants9060677