Salt Tolerance and Na Allocation in Sorghum bicolor under Variable Soil and Water Salinity


 , and
, and
Abstract
:1. Introduction
2. Materials and Methods
2.1. Acronyms
2.2. Experimental Set Up
2.3. Plant Growth
2.4. Leaf Water Status
2.5. Mineral Elements
2.5.1. Bioaccumulation Factor
2.5.2. Selective Absorption
2.5.3. Translocation Index
2.5.4. Vector Analysis of Dry Weight and Element Concentration and Content
2.6. Statistical Analysis and Data Presentation
3. Results
3.1. Water and Na Input to the System
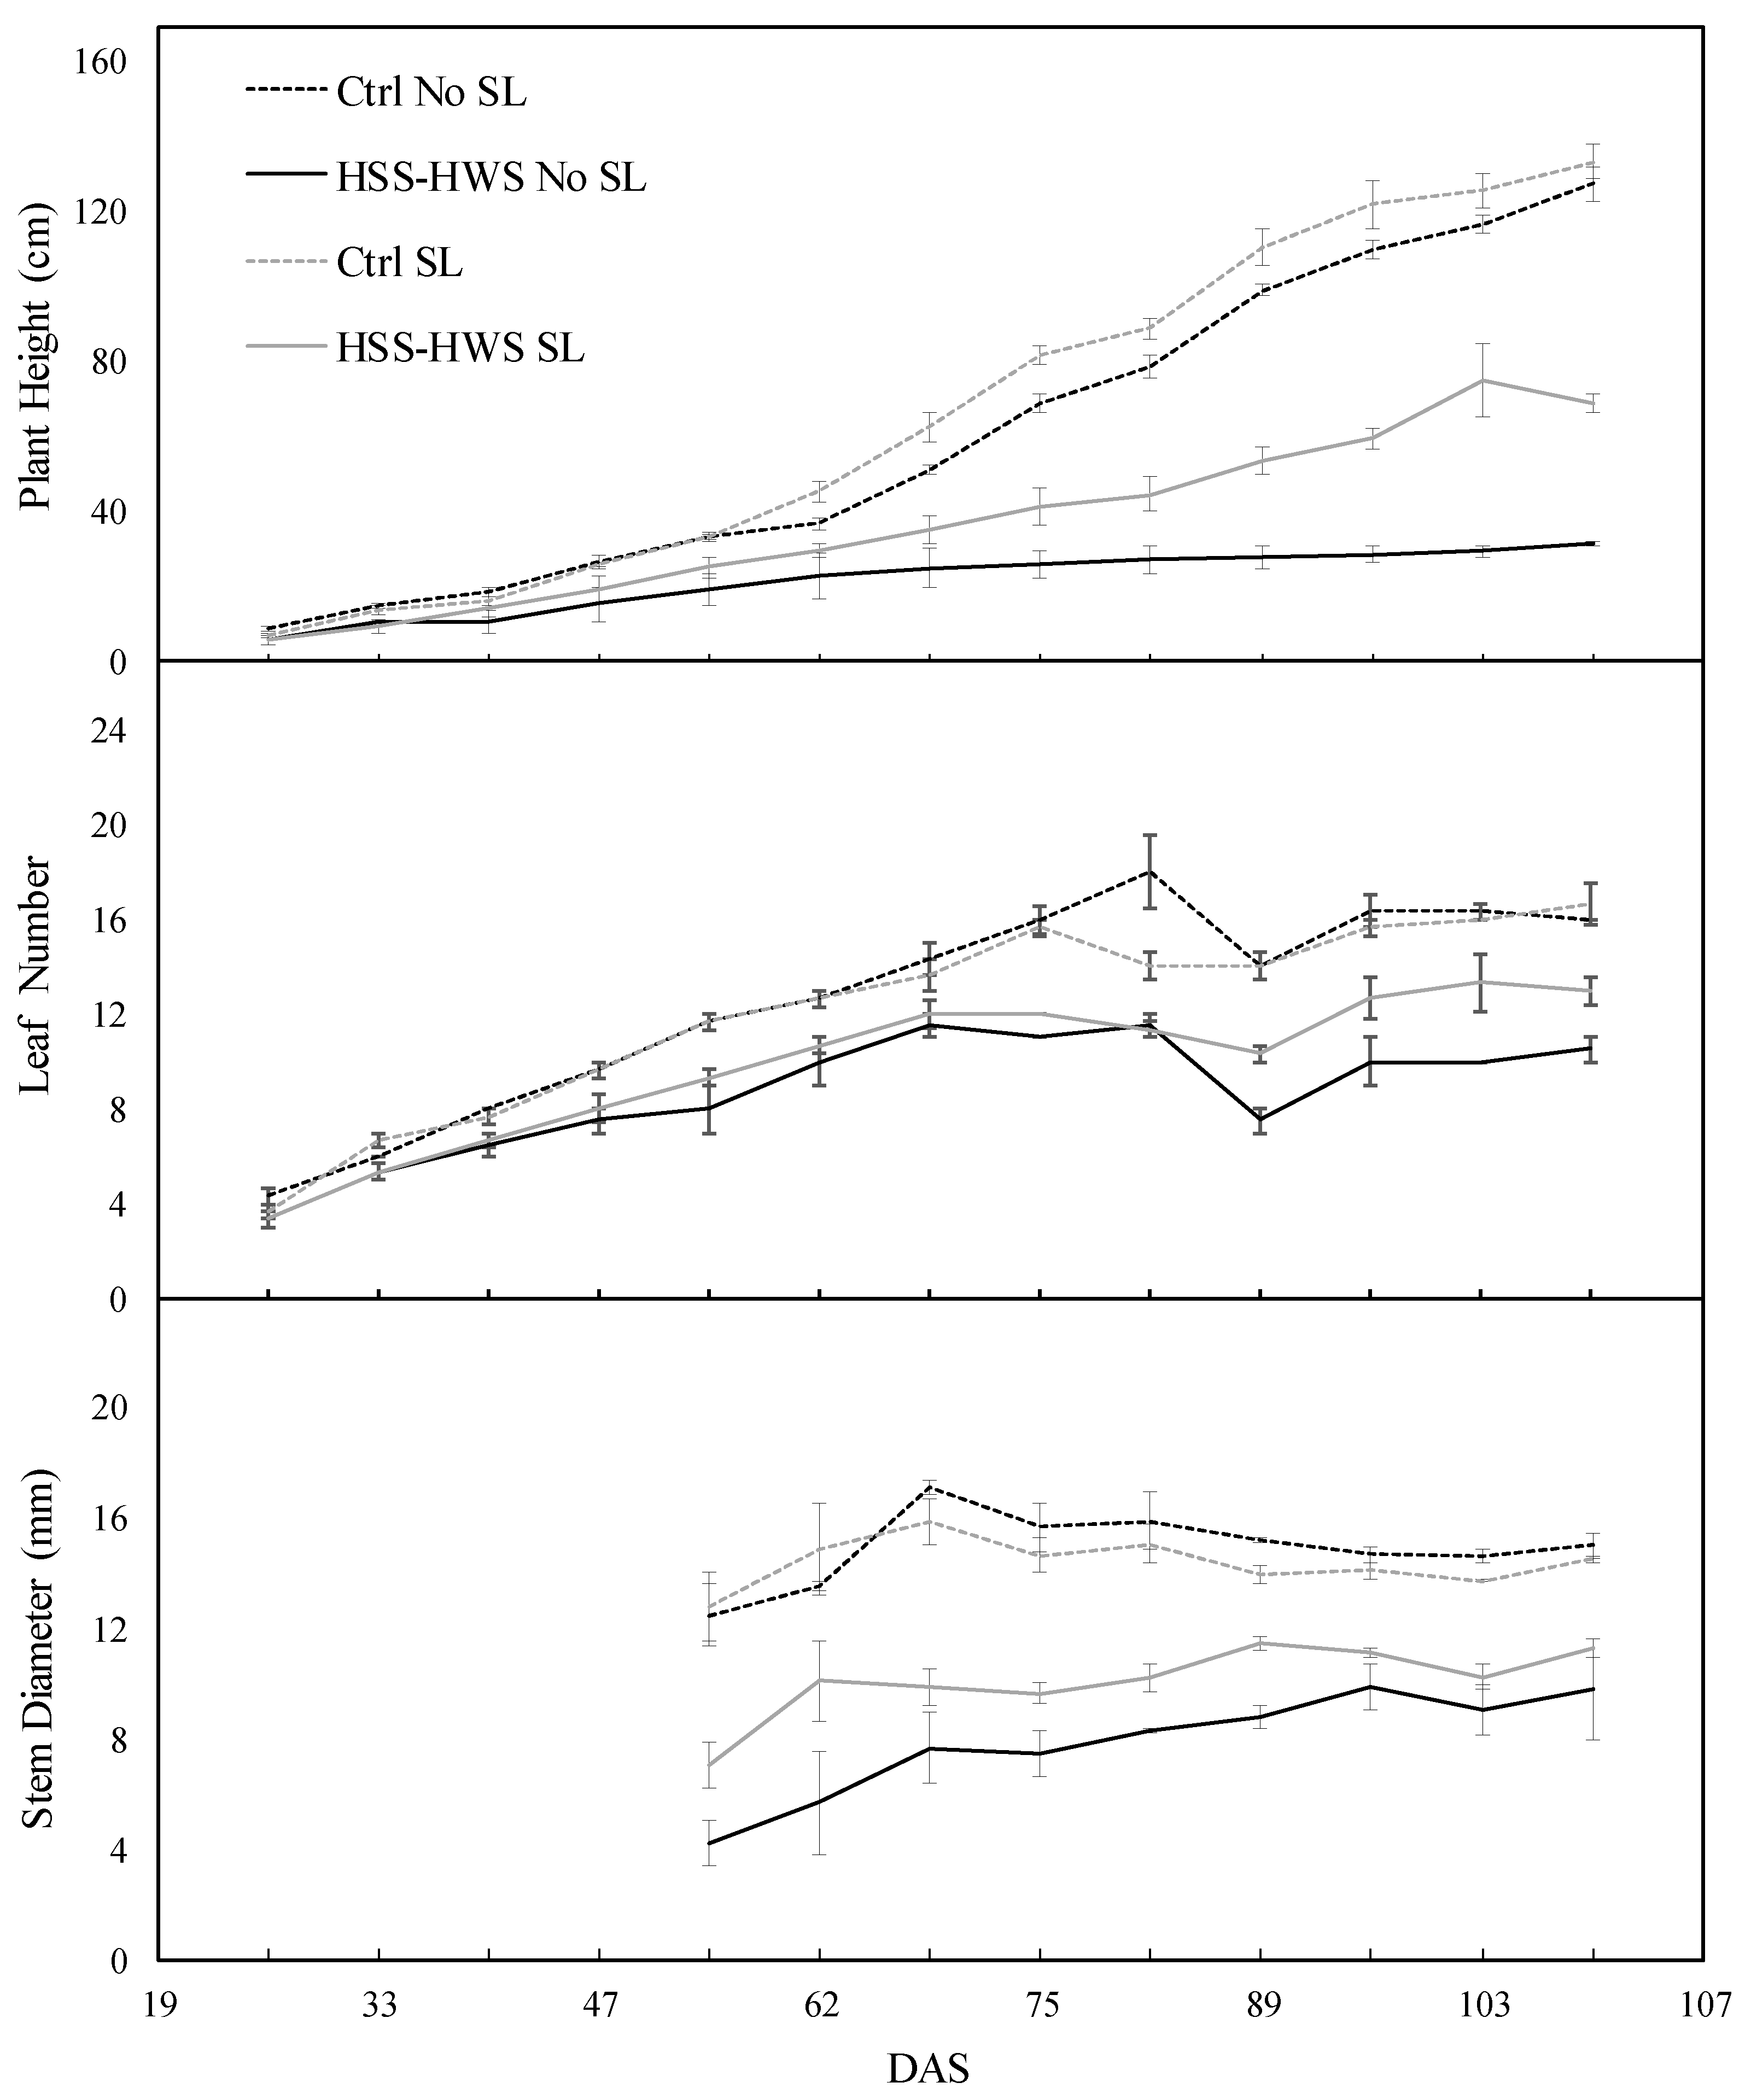
3.2. Morphological Traits
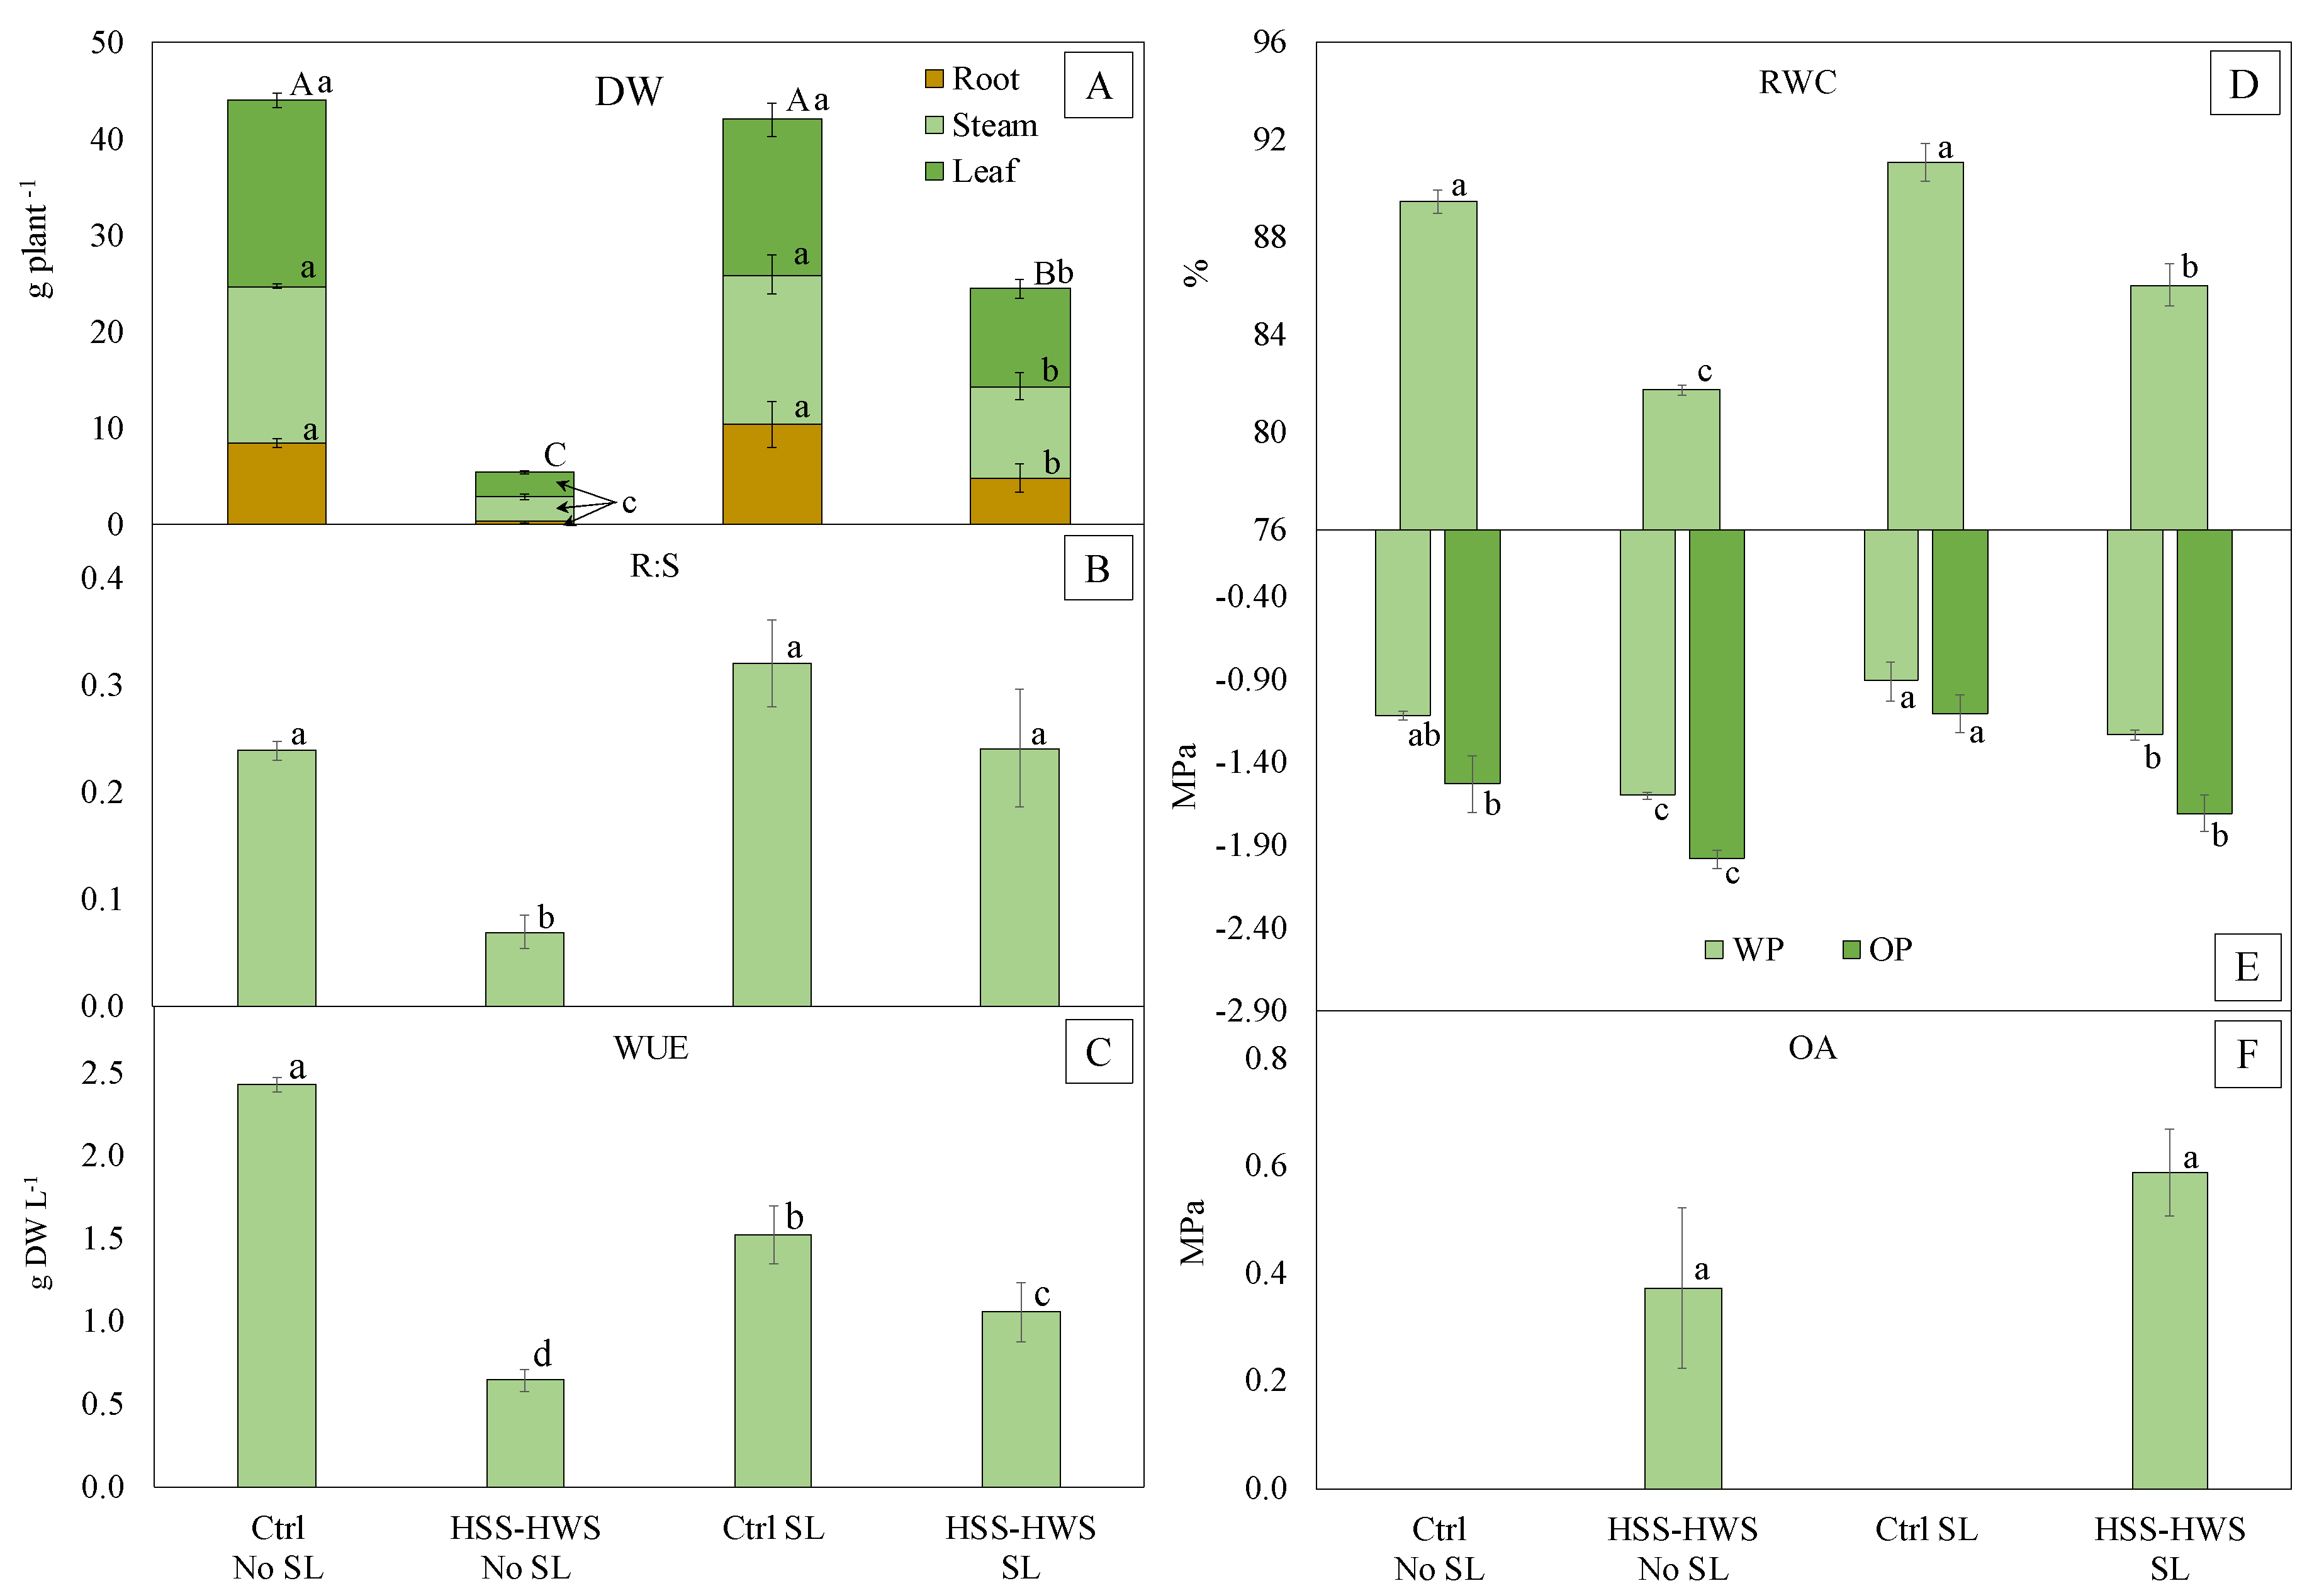
3.3. Final Plant Growth
3.4. Leaf Water Status
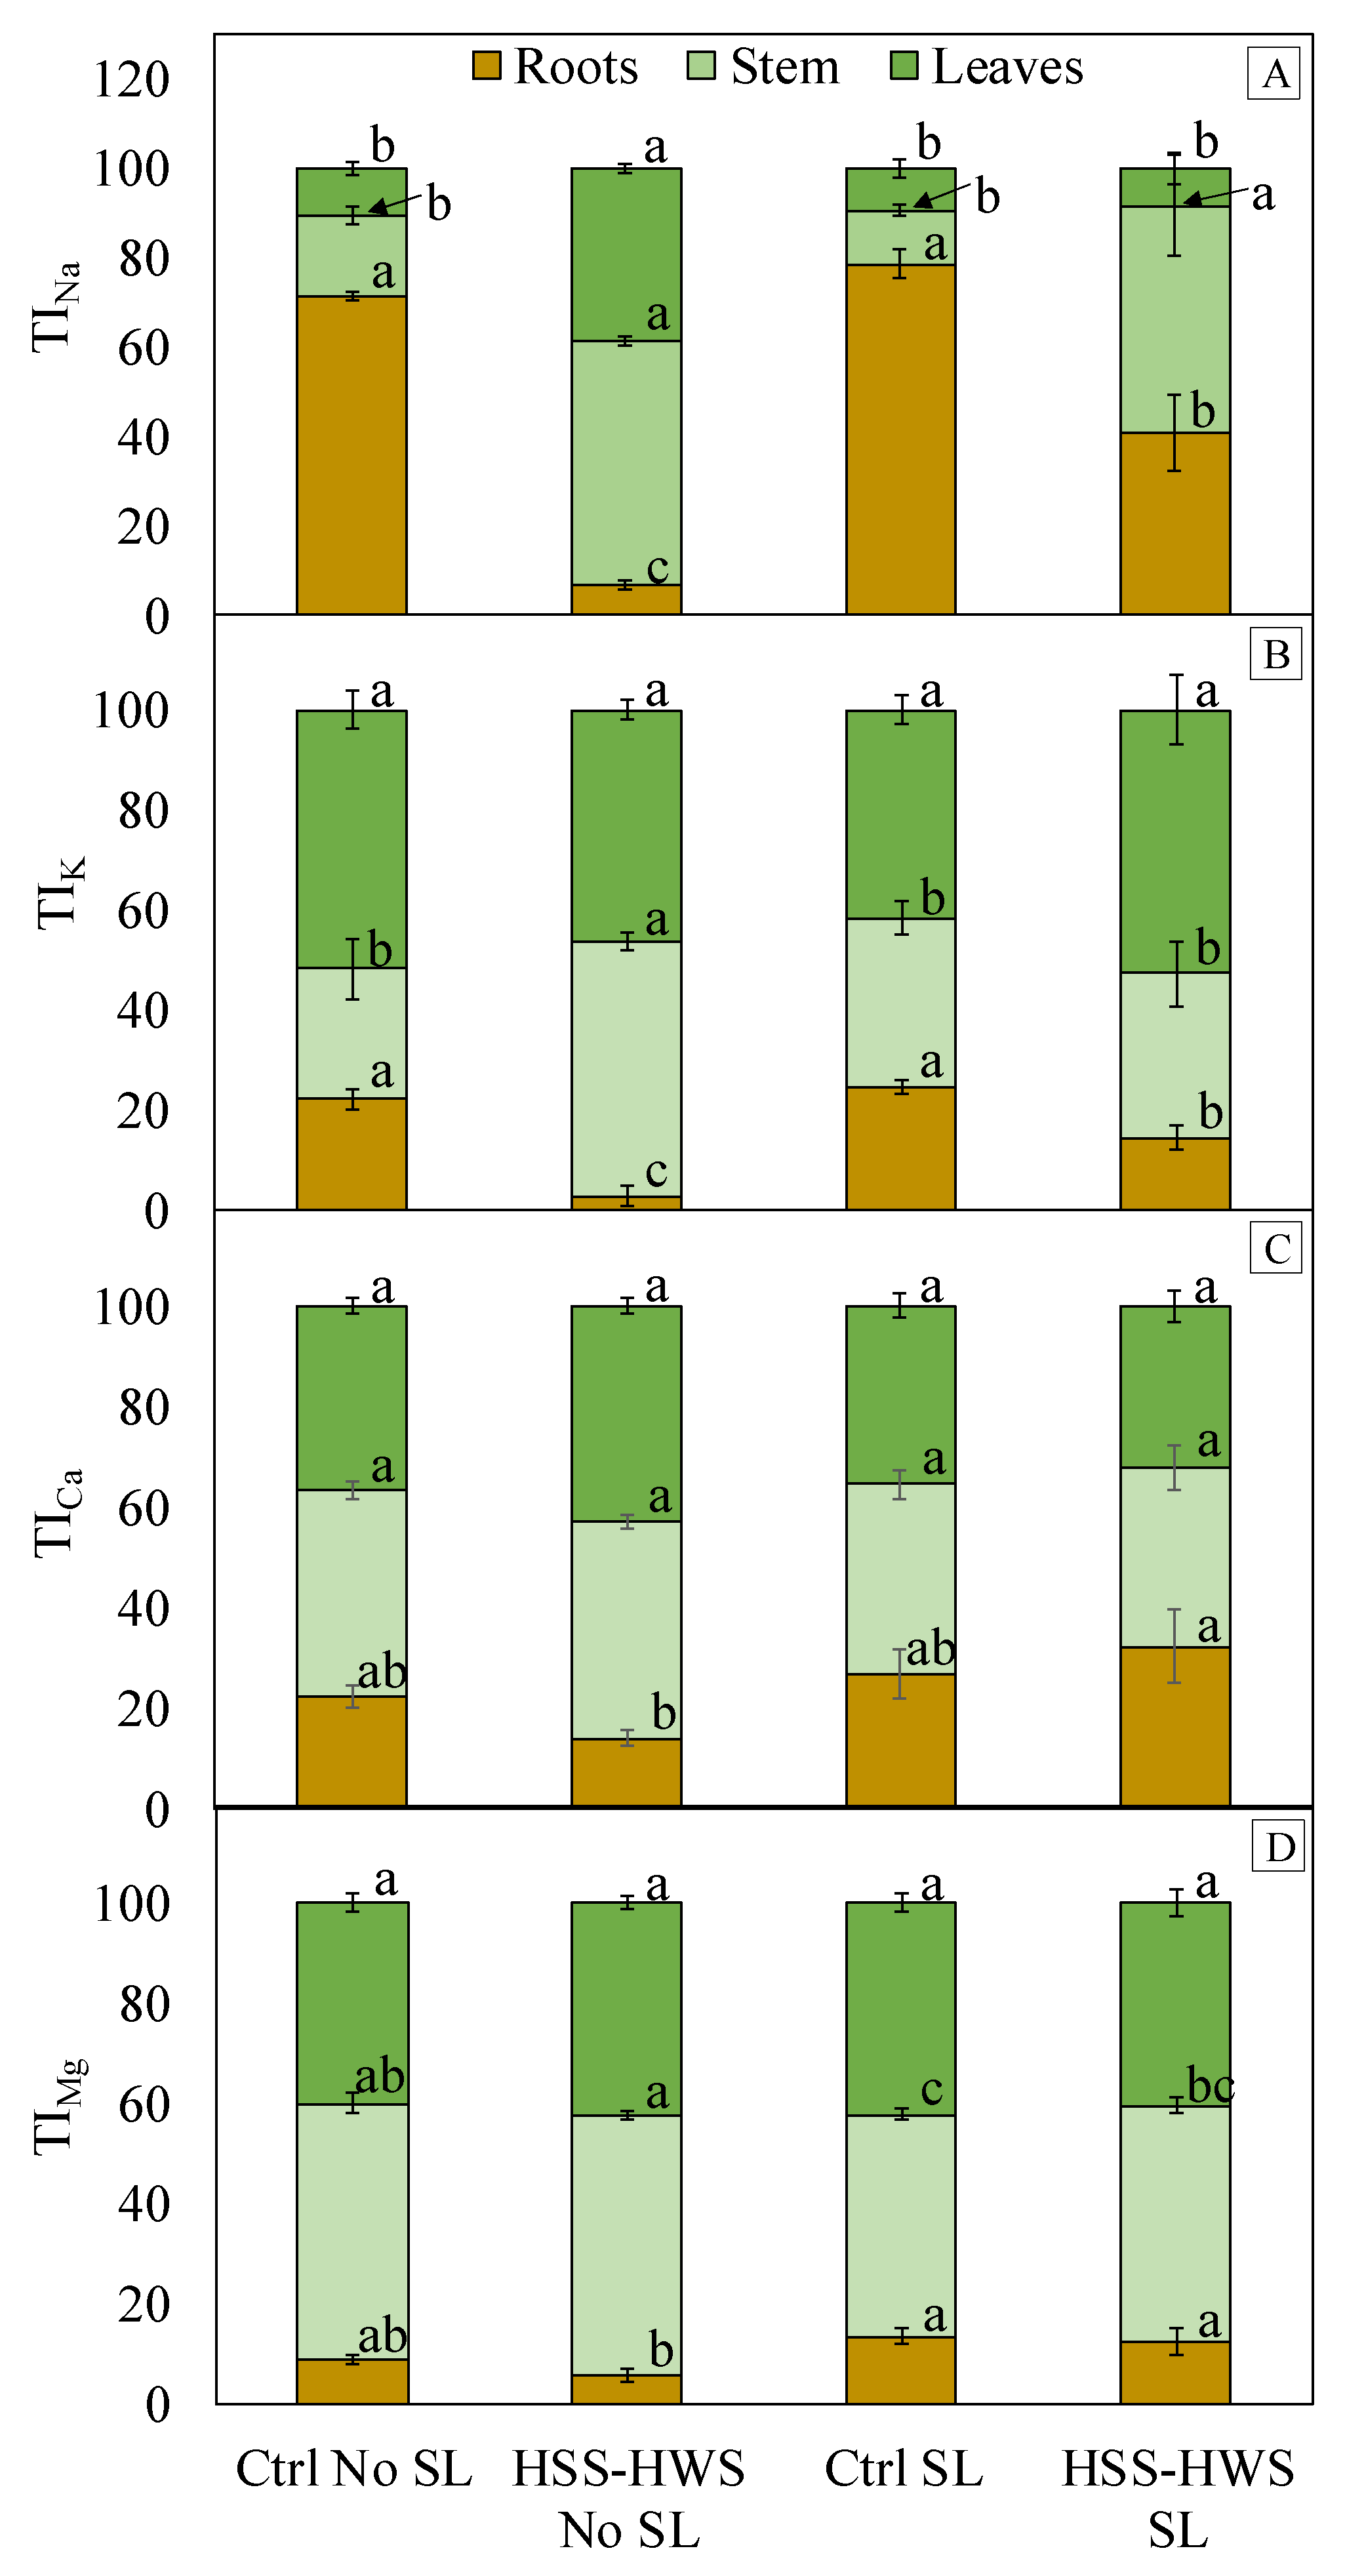
3.5. Cation Accumulation and Translocation
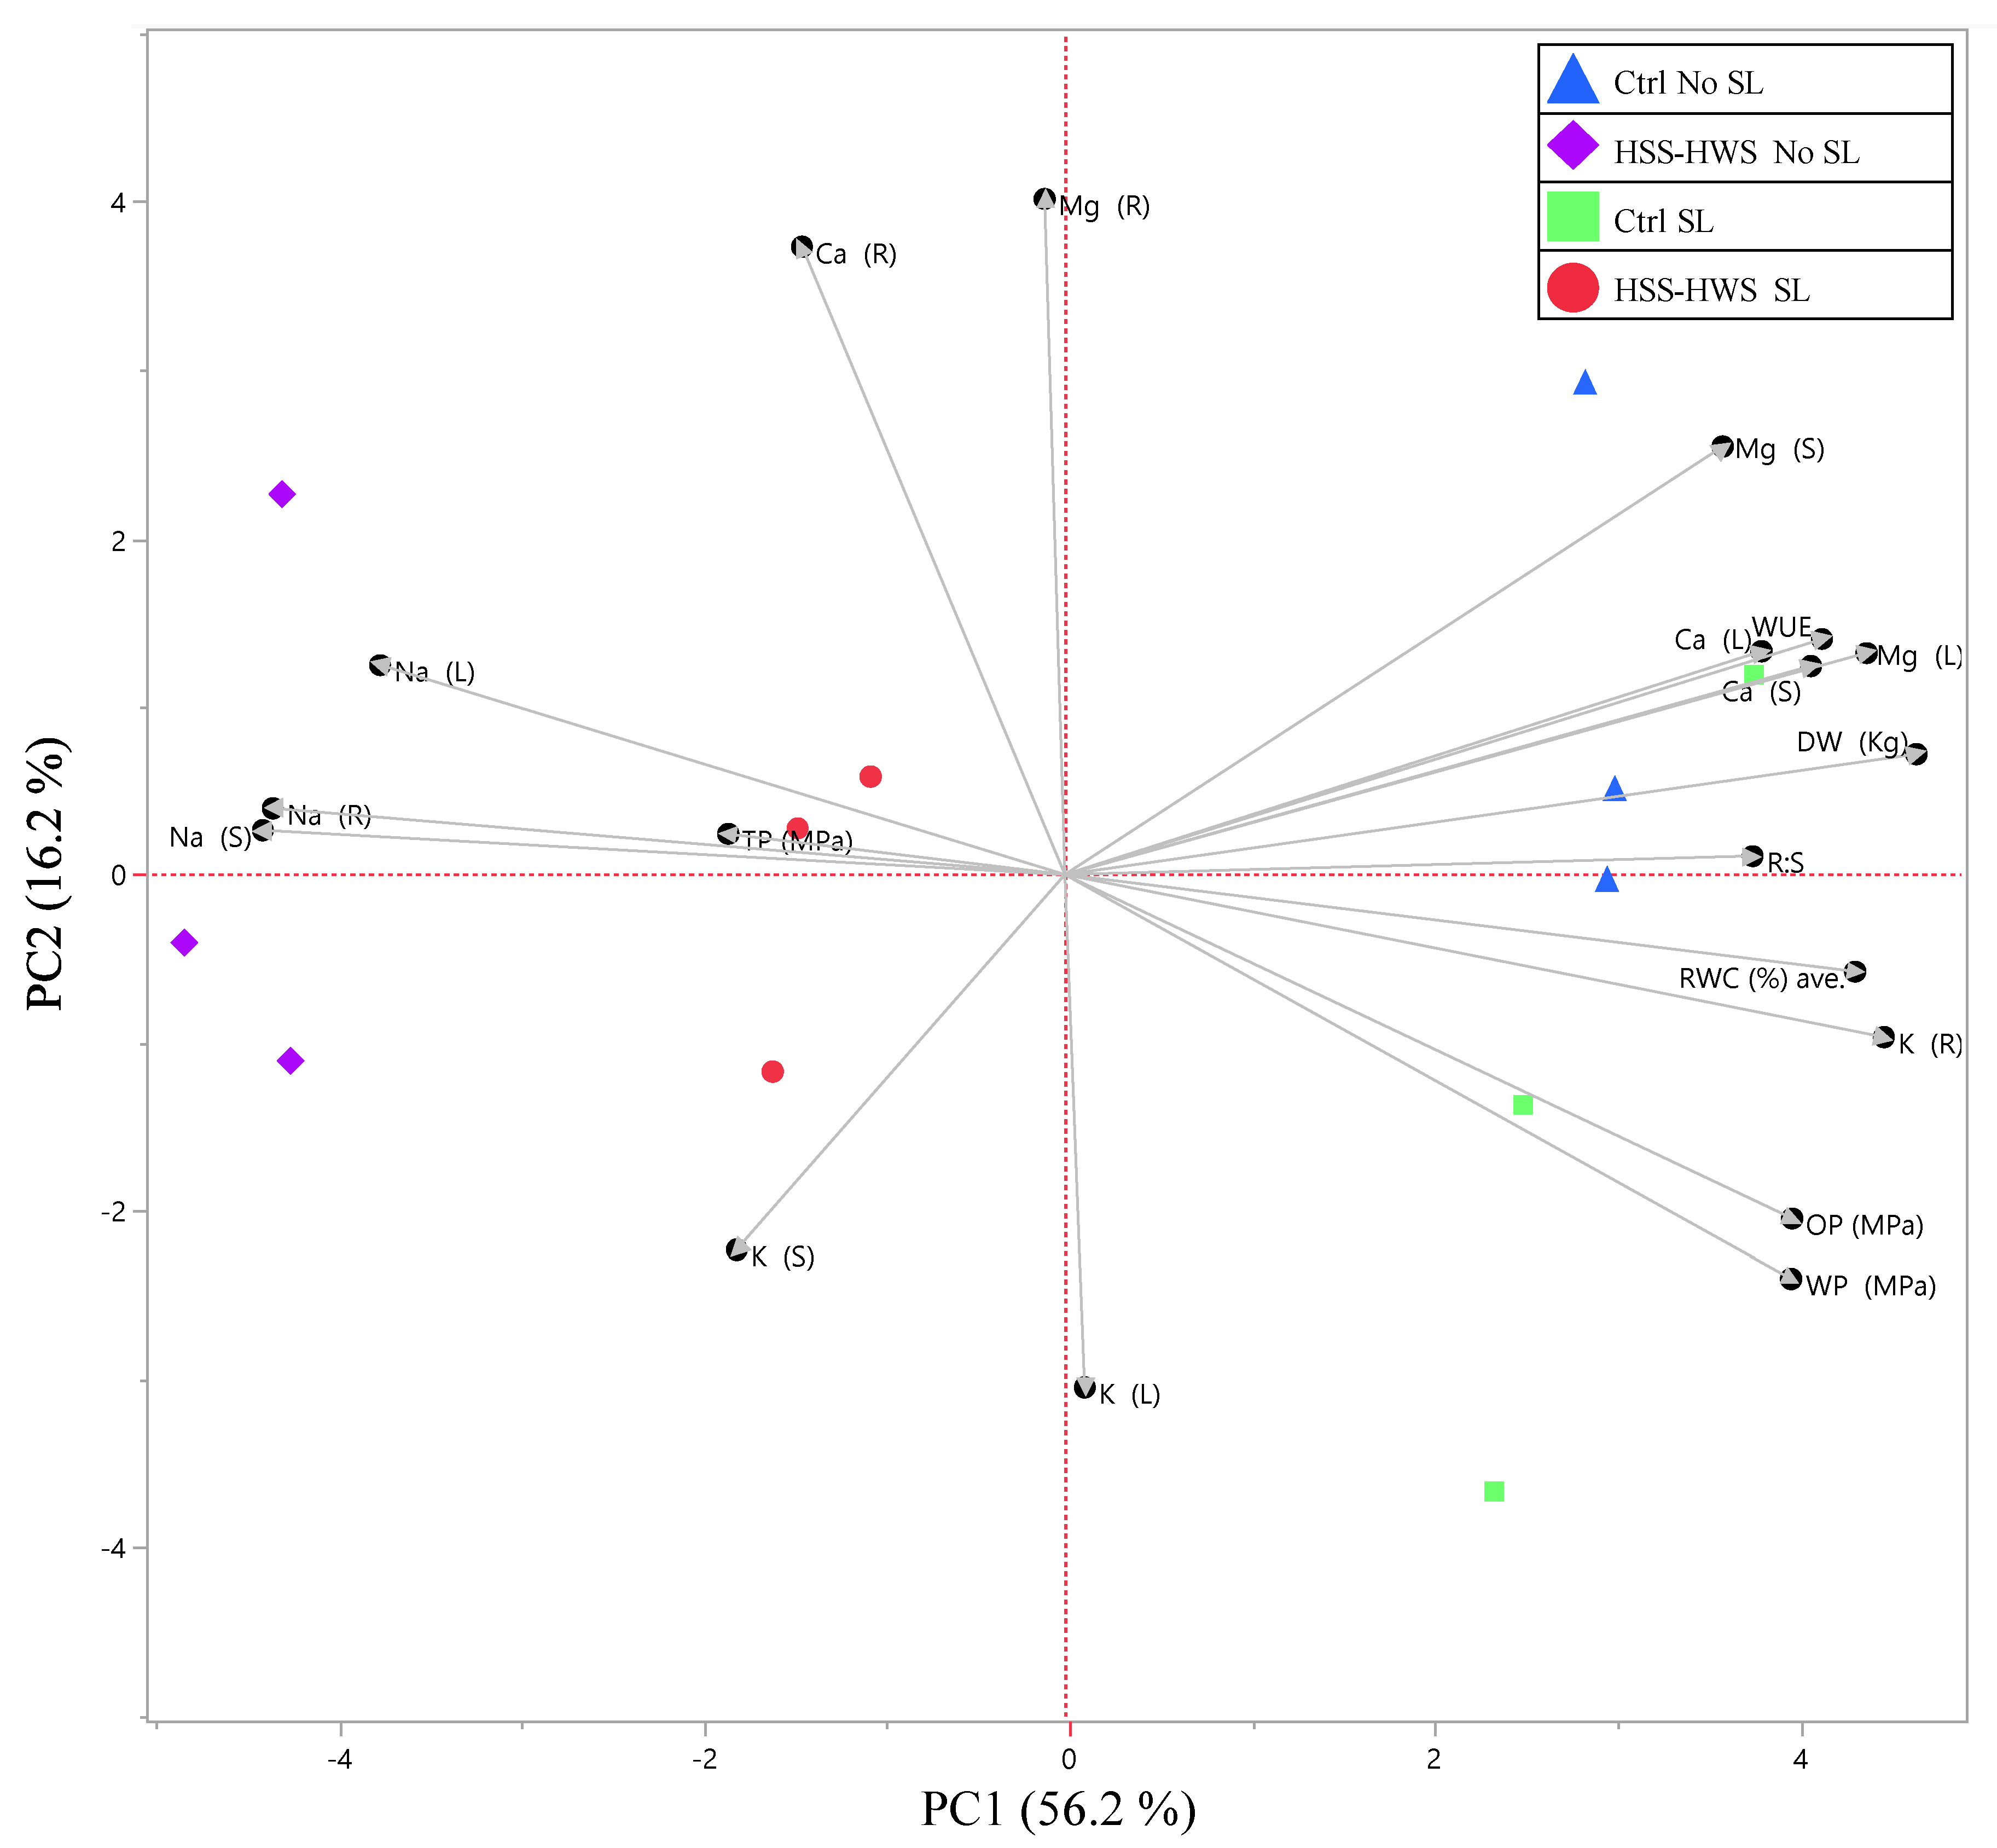
3.6. Principal Component Analysis of Plant Traits
4. Discussion
5. Conclusions
Supplementary Materials
Author Contributions
Funding
Acknowledgments
Conflicts of Interest
References
- Tomaz, A.; Palma, P.; Alvarenga, P.; Gonçalves, M.C. Soil salinity risk in a climate change scenario and its effect on crop yield. In Climate Change and Soil Interactions; Prasad, M.N.V., Pietrzykowski, M., Eds.; Elsevier: Amsterdam, The Netherlands, 2020; pp. 351–396. ISBN 9780128180327. [Google Scholar]
- Libutti, A.; Cammerino, A.R.B.; Monteleone, M. Risk assessment of soil salinization due to tomato cultivation in mediterranean climate conditions. Water 2018, 10, 1503. [Google Scholar] [CrossRef] [Green Version]
- Masina, M.; Calone, R.; Barbanti, L.; Mazzotti, C.; Lamberti, A.; Speranza, M. Smart water and soil-salinity management in agro-wetlands. Environ. Eng. Manag. J. 2019, 18, 2273–2285. [Google Scholar]
- Badaruddin, S.; Werner, A.; Morgan, L. Water table salinization due to seawater intrusion. Water Resour. Res. 2007, 51, 8397–8408. [Google Scholar] [CrossRef]
- Shokri-Kuehni, S.M.S.; Raaijmakers, B.; Kurz, T.; Or, D.; Helmig, R.; Shokri, N. Water Table Depth and Soil Salinization: From Pore-Scale Processes to Field-Scale Responses. Water Resour. Res. 2020, 56, 1–13. [Google Scholar] [CrossRef]
- Daliakopoulos, I.N.; Tsanis, I.K.; Koutroulis, A.; Kourgialas, N.N.; Varouchakis, A.E.; Karatzas, G.P.; Ritsema, C.J. The threat of soil salinity: A European scale review. Sci. Total Environ. 2016, 573, 727–739. [Google Scholar] [CrossRef] [PubMed]
- Zia-ur-rehman, M.; Murtaza, G. Salt-affected Soils: Sources, Genesis and Management. In Soil Science Concepts and Applications; Muhammad, S., Javaid, A., Khalid, R.H., Eds.; University of Agriculture Faisalabad: Faisalabad, Pakistan, 2017. [Google Scholar]
- Singh, K. Microbial and Enzyme Activities of Saline and Sodic Soils. Land Degrad. Dev. 2016, 27, 706–718. [Google Scholar] [CrossRef]
- Okur, B.; Örçen, N. Soil salinization and climate change. In Climate Change and Soil Interactions; Elsevier: Amsterdam, The Netherlands, 2020; pp. 331–350. ISBN 9780128180327. [Google Scholar]
- Begum, M.A.J.; Selvaraju, P.; Venudevan, B. Saline stress on seed germination. Sci. Res. Essays 2013, 8, 1420–1423. [Google Scholar]
- Munns, R. Comparative physiology of salt and water stress. Plant Cell Environ. 2002, 25, 239–250. [Google Scholar] [CrossRef]
- Munns, R.; Tester, M. Mechanisms of Salinity Tolerance. Annu. Rev. Plant Biol. 2008, 59, 651–681. [Google Scholar] [CrossRef] [Green Version]
- Morton, M.J.L.; Awlia, M.; Al-Tamimi, N.; Saade, S.; Pailles, Y.; Negrão, S.; Tester, M. Salt stress under the scalpel—dissecting the genetics of salt tolerance. Plant J. 2019, 97, 148–163. [Google Scholar] [CrossRef] [Green Version]
- Amzallag, G.N.; Lerner, H.R.; Poljakoff-Mayber, A. Induction of Increased Salt Tolerance in Sorghum bicolor by NaCl Pretreatment. J. Exp. Bot. 2007, 41, 29–34. [Google Scholar] [CrossRef]
- Karmakar, R.; Das, I.; Dutta, D.; Rakshit, A. Potential Effects of Climate Change on Soil Properties: A Review. Sci. Int. 2016, 4, 51–73. [Google Scholar] [CrossRef] [Green Version]
- Machado, R.M.A.; Serralheiro, R.P. Soil salinity: Effect on Vegetable Crop Growth. Management Practices to Prevent and Mitigate Soil Salinization. Horticulturae 2017, 3, 30. [Google Scholar] [CrossRef]
- Phogat, V.; Mallants, D.; Cox, J.W.; Šimůnek, J.; Oliver, D.P.; Awad, J. Management of soil salinity associated with irrigation of protected crops. Agric. Water Manag. 2020, 227, 105845. [Google Scholar] [CrossRef]
- Ventura, Y.; Eshel, A.; Pasternak, D.; Sagi, M. The development of halophyte-based agriculture: Past and present. Ann. Bot. 2015, 115, 529–540. [Google Scholar] [CrossRef] [Green Version]
- Reddy, P.S. Breeding for Abiotic Stress Resistance in Sorghum. In Breeding Sorghum for Diverse End Uses; Aruna, C., Visarada, K.B.R.S., Bhat, B.V., Tonapi, V.A., Eds.; Woodhead Publishing Series in Food Science, Technology and Nutrition; Woodhead Publishing: Sawston, UK, 2019; pp. 325–340. ISBN 978-0-08-101879-8. [Google Scholar]
- Rooney, L.W. Overview: Sorghum and millet food research failures and successes. In Proceedings of the AFRIPRO Workshop on the Proteins of Sorghum and Millets: Enhancing Nutritional and Functional Properties for Africa, Pretoria, South Africa, 2–4 April 2003; Belton, P.S., Taylor, J.P.N., Eds.; [Google Scholar]
- Prasad, P.V.V.; Djanaguiraman, M.; Stewart, Z.P.; Ciampitti, I.A. Agroclimatology of Maize, Sorghum, and Pearl Millet. In Agroclimatology: Linking Agriculture to Climate; Hatfield, J.L., Sivakumar, M.V.K., Prueger, J.H., Eds.; American Society of Agronomy: Madison, WI, USA, 2018; pp. 201–241. ISBN 9780891183570. [Google Scholar]
- Ayers, R.S.; Westcot, D.W. Salinity problems. In Water Quality for Agriculture; Irrigation and Drainage, Paper 29; FAO: Rome, Italy, 1985; pp. 13–56. ISBN 9251022631. [Google Scholar]
- Kenneth, K.T.; Neeltje, C.K. Agricultural Drainage Water Management in Arid and Semi-Arid Areas; Irrigation and Drainage, Paper 61; FAO: Rome, Italy, 2002; ISBN 92-5-104839-8. [Google Scholar]
- Yang, Z.; Zheng, H.; Wei, X.; Song, J.; Wang, B.; Sui, N. Transcriptome analysis of sweet Sorghum inbred lines differing in salt tolerance provides novel insights into salt exclusion by roots. Plant Soil 2018, 430, 423–439. [Google Scholar] [CrossRef]
- Shakeri, E.; Emam, Y. Selectable traits in sorghum genotypes for tolerance to salinity stress. J. Agric. Sci. Technol. 2017, 19, 1319–1332. [Google Scholar]
- Almodares, A.; Hadi, M.R.; Kholdebarin, B.; Samedani, B. The response of sweet sorghum cultivars to salt stress and accumulation of Na+, CI and K+ ions in relation to salinity Article. J. Environ. Biol. 2014, 35, 733–739. [Google Scholar]
- Tari, I.; Laskay, G.; Takács, Z.; Poór, P. Response of sorghum to abiotic stresses: A review. J. Agron. Crop Sci. 2013, 199, 264–274. [Google Scholar] [CrossRef] [Green Version]
- Yan, K.; Xu, H.; Cao, W.; Chen, X. Salt priming improved salt tolerance in sweet sorghum by enhancing osmotic resistance and reducing root Na+ uptake. Acta Physiol. Plant 2015, 37, 1–10. [Google Scholar] [CrossRef] [Green Version]
- De Lacerda, C.F.; Cambraia, J.; Oliva, M.A.; Ruiz, H.A. Changes in growth and in solute concentrations in sorghum leaves and roots during salt stress recovery. Environ. Exp. Bot. 2005, 54, 69–76. [Google Scholar] [CrossRef]
- Shakeri, E.; Emam, Y.; Pessarakli, M.; Tabatabaei, S.A. Biochemical traits associated with growing sorghum genotypes with saline water in the field. J. Plant Nutr. 2020, 43, 1136–1153. [Google Scholar] [CrossRef]
- Netondo, G.W.; Onyango, J.C.; Beck, E. Sorghum and salinity: I. Response of growth, water relations, and ion accumulation to NaCl salinity. Crop Sci. 2004, 44, 797–805. [Google Scholar] [CrossRef]
- Bavei, V.; Shiran, B.; Arzani, A. Evaluation of salinity tolerance in sorghum (Sorghum bicolor L.) using ion accumulation, proline and peroxidase criteria. Plant Growth Regul. 2011, 64, 275–285. [Google Scholar] [CrossRef]
- Netondo, G.W.; Onyango, J.C.; Beck, E. Sorghum and Salinity: II. Gas Exchange and Chlorophyll Fluorescence of Sorghum under Salt Stress. Crop Sci. 2004, 44, 806–811. [Google Scholar] [CrossRef]
- Joardar, J.C.; Razir, S.; Islam, M.; Kobir, M.H. Salinity impacts on experimental fodder sorghum production. SAARC J. Agric. 2018, 16, 145–155. [Google Scholar] [CrossRef]
- Nxele, X.; Klein, A.; Ndimba, B.K. Drought and salinity stress alters ROS accumulation, water retention, and osmolyte content in sorghum plants. S. Afr. J. Bot. 2017, 108, 261–266. [Google Scholar] [CrossRef]
- Yang, Z.; Li, J.L.; Liu, L.N.; Xie, Q.; Sui, N. Photosynthetic Regulation Under Salt Stress and Salt-Tolerance Mechanism of Sweet Sorghum. Front. Plant Sci. 2020, 10, 1–12. [Google Scholar] [CrossRef] [PubMed]
- Yilmaz, S.; Temizgül, R.; Yürürdurmaz, C.; Kaplan, M. Oxidant and antioxidant enzyme response of redbine sweet sorghum under NaCl salinity stress. Bioagro 2020, 32, 31–38. [Google Scholar]
- Hussain, S.; Shaukat, M.; Ashraf, M.; Zhu, C.; Jin, Q.; Zhang, J. Salinity Stress in Arid and Semi-Arid Climates: Effects and Management in Field Crops. In Climate Change and Agriculture; Hussain, S., Ed.; InTech Open: Rijeka, Croatia, 2019; p. 655-201. [Google Scholar]
- WHO; FAO. Guidelines on Food Fortification with Micronutrients; Allen, L., de Benoist, B., Dary, O., Hurrell, R., Eds.; World Health Organization, Food and Agricultural Organization of the United Nations: Geneva, Switzerland, 2006. [Google Scholar]
- Smart, R.E.; Bingham, G.E. Rapid Estimates of Relative Water Content. Plant Physiol. 1974, 53, 258–260. [Google Scholar] [CrossRef] [Green Version]
- Wilson, J.R.; Fisher, M.J.; Schulze, E.-D.; Dolby, G.R.; Ludlow, M.M. Comparison Between Pressure-volume and Dewpoint-hygrometry for Determining the Water Relations Characteristics of Grass and Legume Leaves. Oecologia 1979, 41, 77–88. [Google Scholar] [CrossRef] [PubMed]
- Rostamza, M.; Richards, R.A.; Watt, M. Response of millet and sorghum to a varying water supply around the primary and nodal roots. Ann. Bot. 2013, 112, 439–446. [Google Scholar] [CrossRef] [PubMed]
- Oti, W.O. Bioaccumulation Factors and Pollution Indices of Heavy Metals in Selected Fruits and Vegetables From a Derelict Mine and Their Associated Health Implications. Int. J. Environ. Sustain. 2015, 3, 9–15. [Google Scholar] [CrossRef]
- Wang, S.; Zhao, G.; Gao, Y.; Tang, Z.; Zhang, C. Puccinellia tenuiflora Exhibits Stronger Selectivity for K+ over Na+ than Wheat. J. Plant Nutr. 2005, 27, 1841–1857. [Google Scholar] [CrossRef]
- Vittori Antisari, L.; Carbone, S.; Gatti, A.; Vianello, G.; Nannipieri, P. Uptake and translocation of metals and nutrients in tomato grown in soil polluted with metal oxide (CeO2, Fe3O4, SnO2, TiO2) or metallic (Ag, Co, Ni) engineered nanoparticles. Environ. Sci. Pollut. Res. 2015, 22, 1841–1853. [Google Scholar] [CrossRef] [PubMed]
- Haase, D.L.; Rose, R. Vector analysis and its use for interpreting plant nutrient shifts in response to silvicultural treatments. For. Sci. 1995, 41, 54–66. [Google Scholar] [CrossRef]
- Sadeghi, H.; Ansar, S.F. Salinity Induced Effects on Growth Parameters, Chemical and Biochemical Characteristics of two Forage Sorghum (Sorghum bicolor L.) Cultivars. Asian J. Plant Sci. 2012, 11, 19–27. [Google Scholar] [CrossRef] [Green Version]
- Farooq, M.; Hussain, M.; Wakeel, A.; Siddique, K.H.M. Salt stress in maize: Effects, resistance mechanisms, and management. A review. Agron. Sustain. Dev. 2015, 35, 461–481. [Google Scholar] [CrossRef] [Green Version]
- Qu, C.; Liu, C.; Gong, X.; Li, C.; Hong, M.; Wang, L.; Hong, F. Impairment of maize seedling photosynthesis caused by a combination of potassium deficiency and salt stress. Environ. Exp. Bot. 2012, 75, 134–141. [Google Scholar] [CrossRef]
- Roy, R.C.; Sagar, A.; Tajkia, J.E.; Razzak, M.A.; Hossain, A.Z. Effect of salt stress on growth of sorghum germplasms at vegetative stage. J. Bangladesh Agric. Univ. 2018, 16, 67. [Google Scholar] [CrossRef] [Green Version]
- Jafari, M.H.S.; Kafi, M.; Astaraie, A. Interactive effects of Nacl induced salinity, calcium and potassium on physiomorphological traits of Sorghum (Sorghum bicolor L.). Pakistan J. Bot. 2009, 41, 3053–3063. [Google Scholar]
- El Naim, A.M.; Mohammed, K.E.; Ibrahim, E.A.; Suleiman, N.N. Impact of Salinity on Seed Germination and Early Seedling Growth of Three Sorghum (Sorghum biolor L. Moench) Cultivars. Sci. Technol. 2012, 2, 16–20. [Google Scholar] [CrossRef] [Green Version]
- Sun, Y.; Niu, G.; Osuna, P.; Zhao, L.; Ganjegunte, G.; Peterson, G.; Peralta-Videa, J.R.; Gardea-Torresde, J.L. Variability in Salt Tolerance of Sorghum bicolor L. Agric. Sci. 2014, 2, 9–21. [Google Scholar] [CrossRef] [Green Version]
- Niu, G.; Xu, W.; Rodriguez, D.; Sun, Y. Growth and Physiological Responses of Maize and Sorghum Genotypes to Salt Stress. ISRN Agron. 2012, 2012, 1–12. [Google Scholar] [CrossRef] [Green Version]
- Shakeri, E.; Emam, Y.; Tabatabaei, S.A.; Sepaskhah, A.R. Evaluation of grain sorghum (Sorghum bicolor L.) lines/cultivars under salinity stress using tolerance indices. Int. J. Plant Prod. 2017, 11, 101–116. [Google Scholar]
- Ashraf, M. Some important physiological selection criteria for salt tolerance in plants. Flora 2004, 199, 361–376. [Google Scholar] [CrossRef]
- De Lacerda, C.F.; Cambraia, J.; Oliva, M.A.; Ruiz, H.A.; Prisco, J.T. Solute accumulation and distribution during shoot and leaf development in two sorghum genotypes under salt stress. Environ. Exp. Bot. 2003, 49, 107–120. [Google Scholar] [CrossRef] [Green Version]
- Sagar, A. Screening of Sorghum Germplasms for Salinity Tolerance based on Morphophysiological and Biochemical Traits; Bangladesh Agricultural University: Mymensingh, Bangladesh, 2017. [Google Scholar]
- Barbanti, L.; Sher, A.; Di Girolamo, G.; Cirillo, E.; Ansar, M. Growth and physiological response of two biomass sorghum (Sorghum bicolor (L.) Moench) genotypes bred for different environments, to contrasting levels of soil moisture. Ital. J. Agron. 2015, 10, 208. [Google Scholar] [CrossRef] [Green Version]
- De Lacerda, C.F.; Cambraia, J.; Cano, M.A.O.; Ruiz, H.A. Plant growth and solute accumulation and distribution in two sorghum genotypes, under NaCl stress. Rev. Bras. Fisiol. Veg. 2001, 13, 270–284. [Google Scholar] [CrossRef]
- Al-Amoudi, O.A.; Rashed, A.A. Effect of Nutrient Cations To Improving Salinity-Tolerance Responses in Sorghum Bicolor L. Life 2012, 50, 77. [Google Scholar]
- Aishah, S.; Saberi, H.A.R.; Halim, R.A.; Zaharah, A.R. Yield responses of forage sorghums to salinity and irrigation frequency. Afr. J. Biotechnol. 2011, 10, 4114–4120. [Google Scholar]
- Mahmood, T.; Iqbal, N.; Raza, H.; Qasim, M.; Yasin Ashraf, M. Growth modulation and ion partitioning in salt stressed sorghum (Sorghum bicolor L.) by exogenous supply of salicylic acid. Pakistan J. Bot. 2010, 42, 3047–3054. [Google Scholar]
- Shannon, M.C.; Grieve, C.M.; Francois, L. Whole-plant response to salinity. In Plant-Environmental Interactions; Wilkinson, R.E., Ed.; Marcel-Decker: New York, NY, USA, 1994; pp. 199–244. [Google Scholar]
- De Aquino, A.J.S.; De Lacerda, C.F.; Bezerra, M.A.; Filho, E.G.; Costa, R.N.T. Crescimento, partição de matéria seca e retenção de Na+, K+ e Cl− em dois genotipos de sorgo irrigados com águas salinas. Rev. Bras. Cienc. Solo 2007, 31, 961–971. [Google Scholar] [CrossRef] [Green Version]
- Guimarães, M.J.M.; Simões, W.L.; Oliveira, A.R.D.E.; Araujo, G.G.L.D.E.; Silva, Ê.F.D.F.; Willadino, L.G. Biometrics and grain yield of sorghum varieties irrigated with salt water. Rev. Bras. Eng. Agrícola Ambient. 2019, 23, 285–290. [Google Scholar] [CrossRef]
- Richardson, S.G.; McCree, K.J. Carbon Balance and Water Relations of Sorghum Exposed to Salt and Water Stress. Plant Physiol. 1985, 79, 1015–1020. [Google Scholar] [CrossRef] [Green Version]
- Yan, K.; Chen, P.; Shao, H.; Zhao, S.; Zhang, L.; Zhang, L.; Xu, G.; Sun, J. Responses of Photosynthesis and Photosystem II to Higher Temperature and Salt Stress in Sorghum. J. Agron. Crop Sci. 2012, 198, 218–225. [Google Scholar] [CrossRef]
- Katerji, N.; Van Hoorn, J.W.; Hamdy, A.; Mastrorilli, M.; Karzel, E.M. Osmotic adjustment of sugar beets in response to soil salinity and its influence on stomatal conductance, growth and yield. Agric. Water Manag. 1997, 34, 57–69. [Google Scholar] [CrossRef]
- Hasegawa, P.M.; Bressan, R.A.; Zhu, J.-K.; Bohnert, H.J. Plant cellular and molecular responses to high salinity. Annu. Rev. Plant Physiol. Plant Mol. Biol. 2000, 51, 463–499. [Google Scholar] [CrossRef] [Green Version]
- Leigh, R.A.; Storey, R. Intercellular compartmentation of ions in barley leaves in relation to potassium nutrition and salinity. J. Exp. Bot. 1993, 44, 755–762. [Google Scholar] [CrossRef]
- Yin, L.; Wang, S.; Li, J.; Tanaka, K.; Oka, M. Application of silicon improves salt tolerance through ameliorating osmotic and ionic stresses in the seedling of Sorghum bicolor. Acta Physiol. Plant 2013, 35, 3099–3107. [Google Scholar] [CrossRef]
- Renault, S.; Croser, C.; Franklin, J.A.; Zwiazek, J.J. Effects of NaCl and Na2SO4 on red-osier dogwood (Cornus stolonifera Michx) seedlings. Plant Soil 2001, 233, 261–268. [Google Scholar] [CrossRef]
- De Lacerda, C.F.; Cambraia, J.; Oliva, M.A.; Ruiz, H.A. Osmotic adjustment in roots and leaves of two sorghum genotypes under NaCl stress. Bras. J. Plant Physiol. 2003, 15, 113–118. [Google Scholar] [CrossRef] [Green Version]
- Chattopadhayay, M.K.; Tiwari, B.S.; Chattopadhyay, G.; Bose, A.; Sengupta, D.N.; Ghosh, B. Protective role of exogenous polyamines on salinity-stressed rice (Oryza sativa) plants. Physiol. Plant 2002, 116, 192–199. [Google Scholar] [CrossRef]
- Alarcon, J.J.; Sanchez-Blanco, M.J.; Bolarin, M.C.; Torrecillas, A. Growth and osmotic adjustment of two tomato cultivars during and after saline stress. Plant Soil 1994, 166, 75–82. [Google Scholar] [CrossRef]
- Carroll, A.D.; Moyen, C.; Kesteren, P.V.a.n.; Tooke, F.; Battey, N.H.; Brownlee, C. Ca2+, Annexins, and GTP Modulate Exocytosis from Maize Root Cap Protoplasts. Plant Cell 1998, 10, 1267–1276. [Google Scholar] [CrossRef] [PubMed] [Green Version]
- Schachtman, D.; Liu, W. Molecular pieces to the puzzle of the interaction between potassium and sodium uptake in plants. Trends Plant Sci. 1999, 4, 281–287. [Google Scholar] [CrossRef]
- Ashraf, M.; O’Leary, J.W. Responses of a salt-tolerant and a salt-sensitive line of sunflower to varying sodium/calcium ratios in saline sand culture. J. Plant Nutr. 1997, 20, 361–377. [Google Scholar] [CrossRef]
- Essah, P.A.; Davenport, R.; Tester, M. Sodium influx and accumulation in arabidopsis. Plant Physiol. 2003, 133, 307–318. [Google Scholar] [CrossRef] [Green Version]
- Cramer, G.R.; Läuchli, A.; Polito, V.S. Displacement of Ca2+ by Na+ from the Plasmalemma of Root Cells. Plant Physiol. 1985, 79, 207–211. [Google Scholar] [CrossRef] [Green Version]
- Choi, J.H.; Chung, G.C.; Suh, S.R.; Yu, J.A.; Sung, J.H.; Choi, K.J. Suppression of Calcium Transport to Shoots by Root Restriction in Tomato Plants. Plant Cell Physiol. 1997, 38, 495–498. [Google Scholar] [CrossRef] [Green Version]
- Coskun, D.; Britto, D.T.; Huynh, W.Q.; Kronzucker, H.J. The role of silicon in higher plants under salinity and drought stress. Front. Plant Sci. 2016, 7, 1072. [Google Scholar] [CrossRef] [PubMed] [Green Version]


| Treatment No. | Soil Salinity ECe (dS m−1) | Water Salinity ECw (dS m−1) | Salt Leaching (SL) |
|---|---|---|---|
| 1 | 0 | 0 | No |
| 2 | 0 | 2–4 | No |
| 3 | 0 | 4–8 | No |
| 4 | 3 | 0 | No |
| 5 | 3 | 2–4 | No |
| 6 | 3 | 4–8 | No |
| 7 | 6 | 0 | No |
| 8 | 6 | 2–4 | No |
| 9 | 6 | 4–8 | No |
| 10 | 0 | 0 | Yes |
| 11 | 0 | 2–4 | Yes |
| 12 | 0 | 4–8 | Yes |
| 13 | 3 | 0 | Yes |
| 14 | 3 | 2–4 | Yes |
| 15 | 3 | 4–8 | Yes |
| 16 | 6 | 0 | Yes |
| 17 | 6 | 2–4 | Yes |
| 18 | 6 | 4–8 | Yes |
| Treatment | Water Input (L) | Water Output (L) | LF (%) | Na Input Soil (g) | Na Input Water (g) | Na Output with Leaching (g) | Na Output–Input (g) |
|---|---|---|---|---|---|---|---|
| Ctrl No SL | 33.8 | 0.8 | 2.4 | 3.6 | 0.4 | 0.02 | 4.0 |
| HSS-HWS No SL | 24.6 | 0.5 | 2.1 | 15.2 | 10.0 | 1.59 | 23.6 |
| Ctrl SL | 55.1 | 15.9 | 28.8 | 3.6 | 0.6 | 0.33 | 3.8 |
| HSS-HWS SL | 49.1 | 21.5 | 43.8 | 15.2 | 27.9 | 16.09 | 27.1 |
| Treatment | Na(R) | Na(S) | Na(L) | K(R) | K(S) | K(L) | Ca(R) | Ca(S) | Ca(L) | Mg(R) | Mg(S) | Mg(L) | BAF(Na) | SA(K) | SA(Ca) | SA(Mg) |
|---|---|---|---|---|---|---|---|---|---|---|---|---|---|---|---|---|
| Ctrl No SL | 3.19 b | 0.44 b | 0.20 c | 7.39 a | 4.76 | 7.62 | 8.62 | 8.31 a | 6.25 a | 1.68 | 5.20 a | 3.40 a | 1.72 b | 0.79 | 0.07 a | 0.31 a |
| HSS-HWS No SL | 8.66 a | 8.47 a | 6.59 a | 3.32 c | 8.11 | 7.83 | 9.74 | 3.89 c | 4.19 b | 1.69 | 2.08 b | 1.70 c | 3.16 a | 0.51 | 0.02 b | 0.08 b |
| Ctrl SL | 2.50 b | 0.25 b | 0.18 c | 7.82 a | 6.97 | 8.08 | 7.39 | 6.48 b | 5.89 a | 1.56 | 3.39 b | 3.08 ab | 1.58 b | 1.04 | 0.06 a | 0.26 a |
| HSS-HWS SL | 8.58 a | 5.99 a | 0.71 b | 4.66 b | 5.73 | 7.58 | 8.62 | 4.66 bc | 3.91 b | 1.61 | 3.06 b | 2.44 bc | 1.73 b | 0.73 | 0.05 a | 0.23 b |
| p | 0.001 ** | 0.001 ** | 0.001 ** | 0.001 ** | 0.338 ns | 0.833 ns | 0.651 ns | 0.022 ** | 0.018 * | 0.962 ns | 0.080 ** | 0.0043 ** | 0.018 * | 0.054 (+) | 0.003 ** | 0.002 ** |
| Treat. | DW | Elem. | Conc. | Cont. | Interpretation |
|---|---|---|---|---|---|
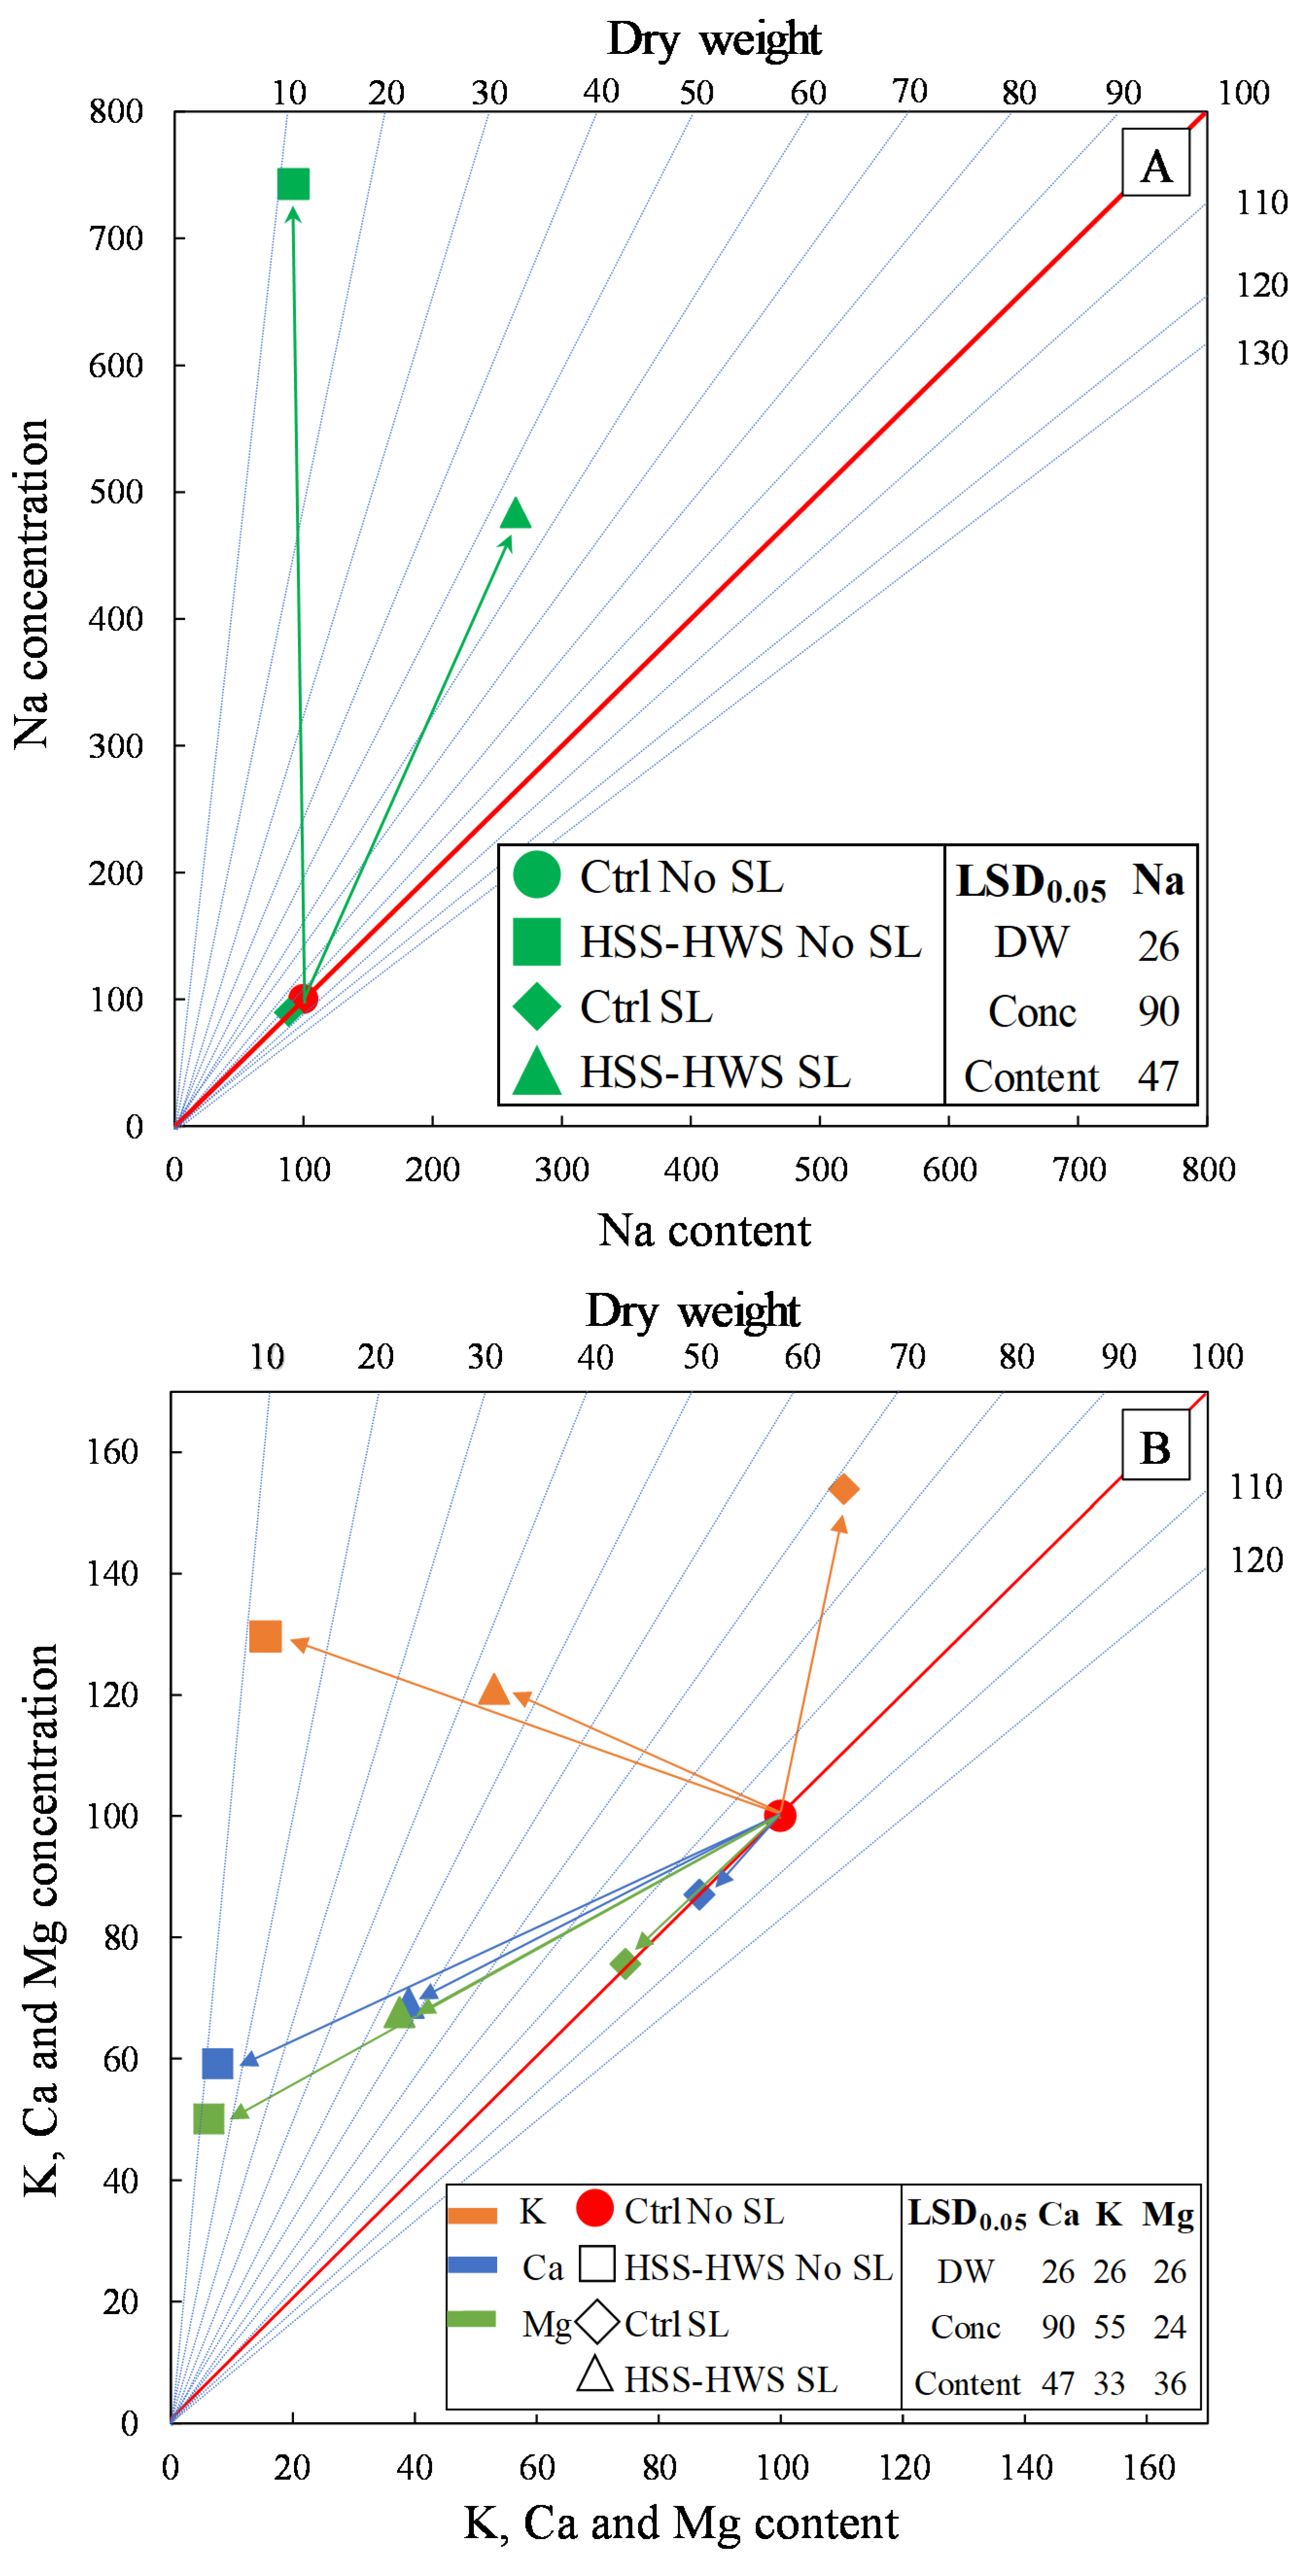
| HSS-HWS No SL |  | Na |  | ~ | Na toxicity Excess Na associated with normal soil moisture caused a strong decrease in biomass and K, Ca, and Mg content. However, the concentration of all these elements except Mg remained constant, meaning that the reduction in their content was proportional to biomass reduction. The drop in Mg concentration indicates a reduction in Mg uptake proportionally greater than biomass reduction. Na content remained unvaried but, due to the drastic biomass reduction, its concentration increased dramatically. |
| K | ~ |  | |||
| Ca | ~ |  | |||
| Mg |  |  | |||
| CTRL SL | ~ | Na | ~ | ~ | Water excess Water availability exceeding the soil water holding capacity did not determine extra biomass gain, nor did it influence Na, K, Ca, and Mg concentration and content. |
| K | ~ | ~ | |||
| Ca | ~ | ~ | |||
| Mg | ~ | ~ | |||
| HSS-HWS SL |  | Na |  |  | Na and water excess Irrigation with saline water exceeding the soil water holding capacity slightly reduced K, Ca, and Mg concentration and content and plant biomass. The concentration of all these elements except Mg remained constant, meaning that the reduction in their content was proportional to biomass reduction. The drop in Mg concentration indicates a reduction in Mg uptake proportionally greater than biomass reduction. Na concentration and content, on the contrary, increased considerably. |
| K | ~ |  | |||
| Ca | ~ |  | |||
| Mg |  |  |
© 2020 by the authors. Licensee MDPI, Basel, Switzerland. This article is an open access article distributed under the terms and conditions of the Creative Commons Attribution (CC BY) license (http://creativecommons.org/licenses/by/4.0/).
Share and Cite
Calone, R.; Sanoubar, R.; Lambertini, C.; Speranza, M.; Vittori Antisari, L.; Vianello, G.; Barbanti, L. Salt Tolerance and Na Allocation in Sorghum bicolor under Variable Soil and Water Salinity. Plants 2020, 9, 561. https://doi.org/10.3390/plants9050561
Calone R, Sanoubar R, Lambertini C, Speranza M, Vittori Antisari L, Vianello G, Barbanti L. Salt Tolerance and Na Allocation in Sorghum bicolor under Variable Soil and Water Salinity. Plants. 2020; 9(5):561. https://doi.org/10.3390/plants9050561
Chicago/Turabian StyleCalone, Roberta, Rabab Sanoubar, Carla Lambertini, Maria Speranza, Livia Vittori Antisari, Gilmo Vianello, and Lorenzo Barbanti. 2020. "Salt Tolerance and Na Allocation in Sorghum bicolor under Variable Soil and Water Salinity" Plants 9, no. 5: 561. https://doi.org/10.3390/plants9050561