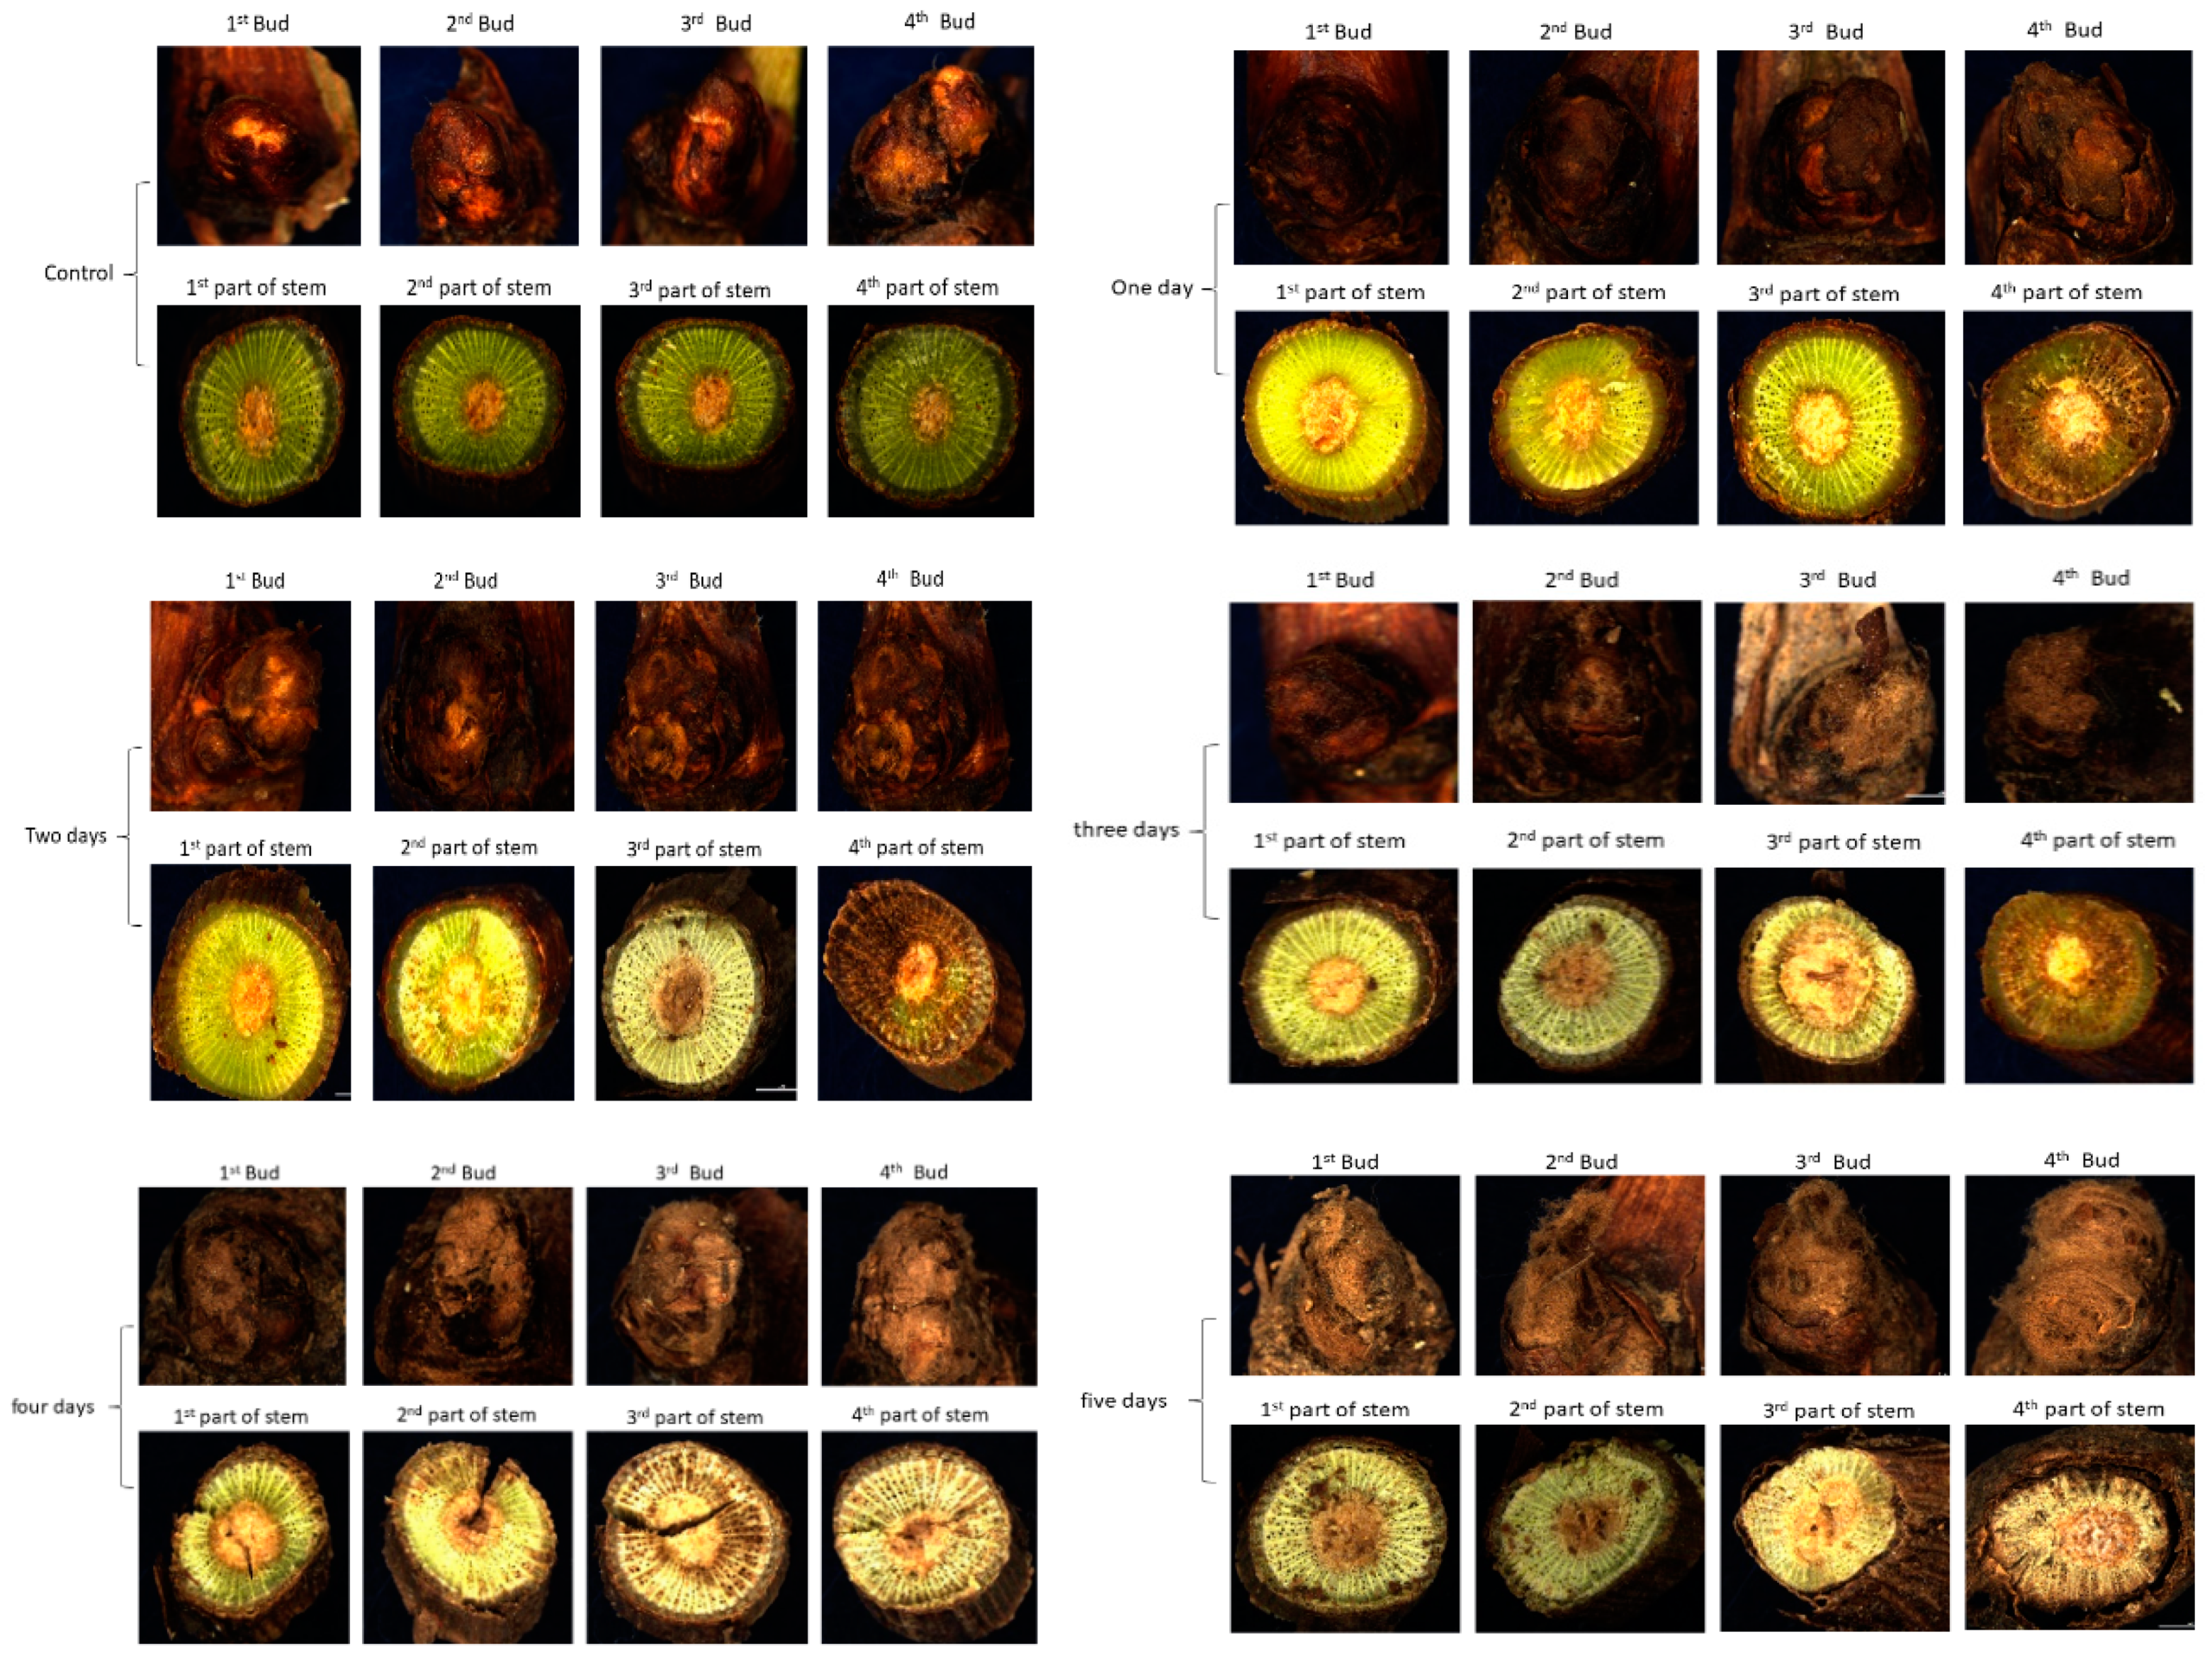
Figure 1.
Microscopic appearance of bud and stem segments of dormant grape seedlings after 0–5-day bare roots treatment.
Figure 1.
Microscopic appearance of bud and stem segments of dormant grape seedlings after 0–5-day bare roots treatment.
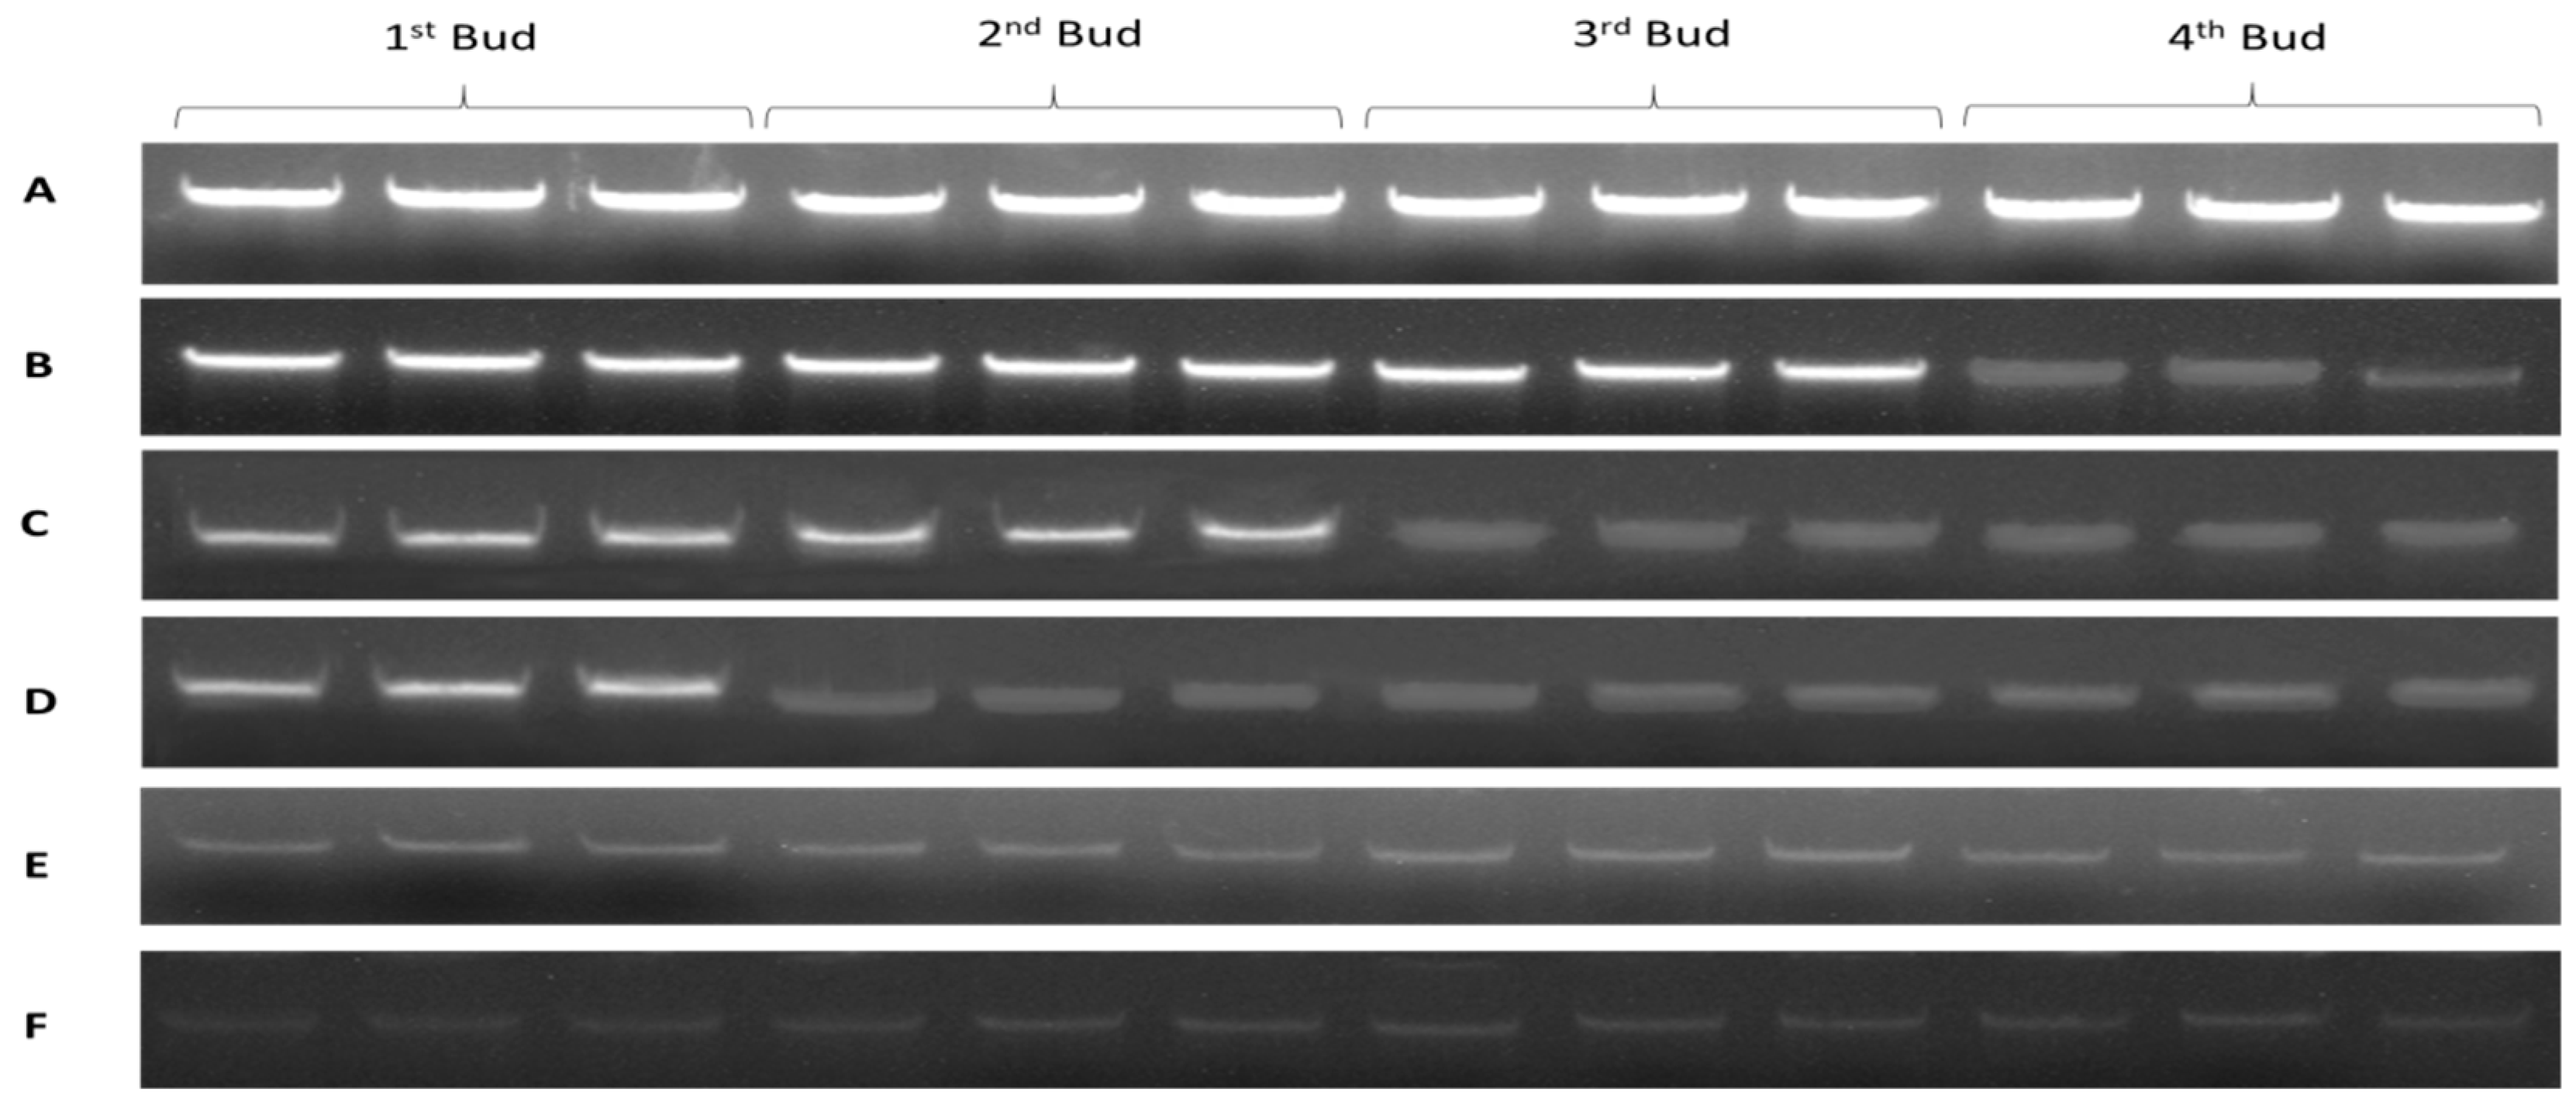
Figure 2.
Agarose gel analysis of genomic DNA extracted from four buds of dormant grape seedlings. (A) Control, (B) 1 day, (C) 2 days, (D) 3 days, (E) 4 days, (F) 5 days of bare roots treatment.
Figure 2.
Agarose gel analysis of genomic DNA extracted from four buds of dormant grape seedlings. (A) Control, (B) 1 day, (C) 2 days, (D) 3 days, (E) 4 days, (F) 5 days of bare roots treatment.
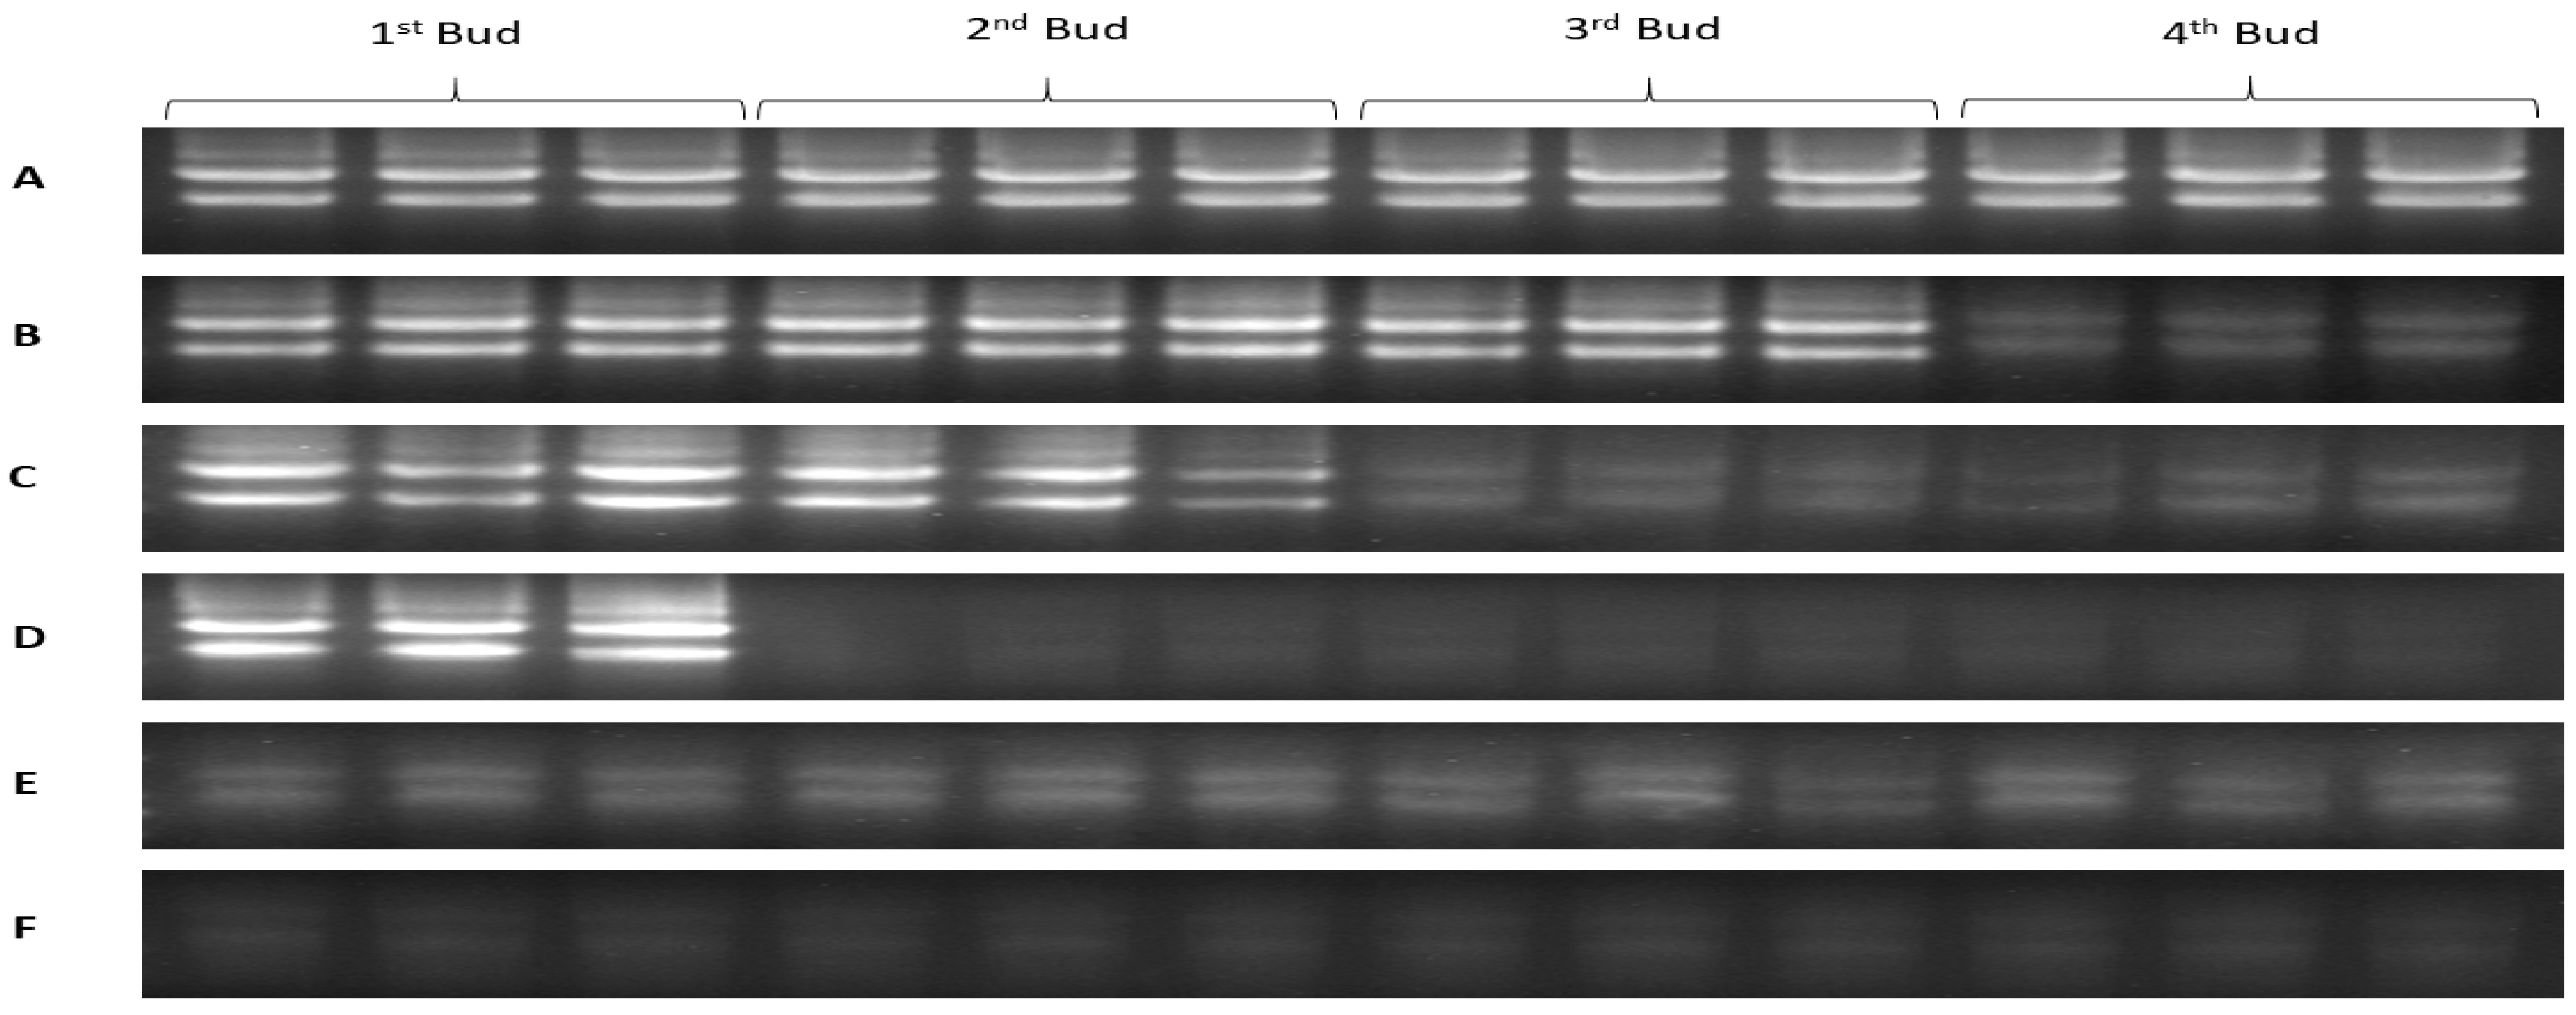
Figure 3.
Agarose gel analysis of total RNA extracted from four buds of dormant grape seedlings. (A) Control, (B) 1 day, (C) 2 days, (D) 3 days, (E) 4 days, (F) 5 days.
Figure 3.
Agarose gel analysis of total RNA extracted from four buds of dormant grape seedlings. (A) Control, (B) 1 day, (C) 2 days, (D) 3 days, (E) 4 days, (F) 5 days.
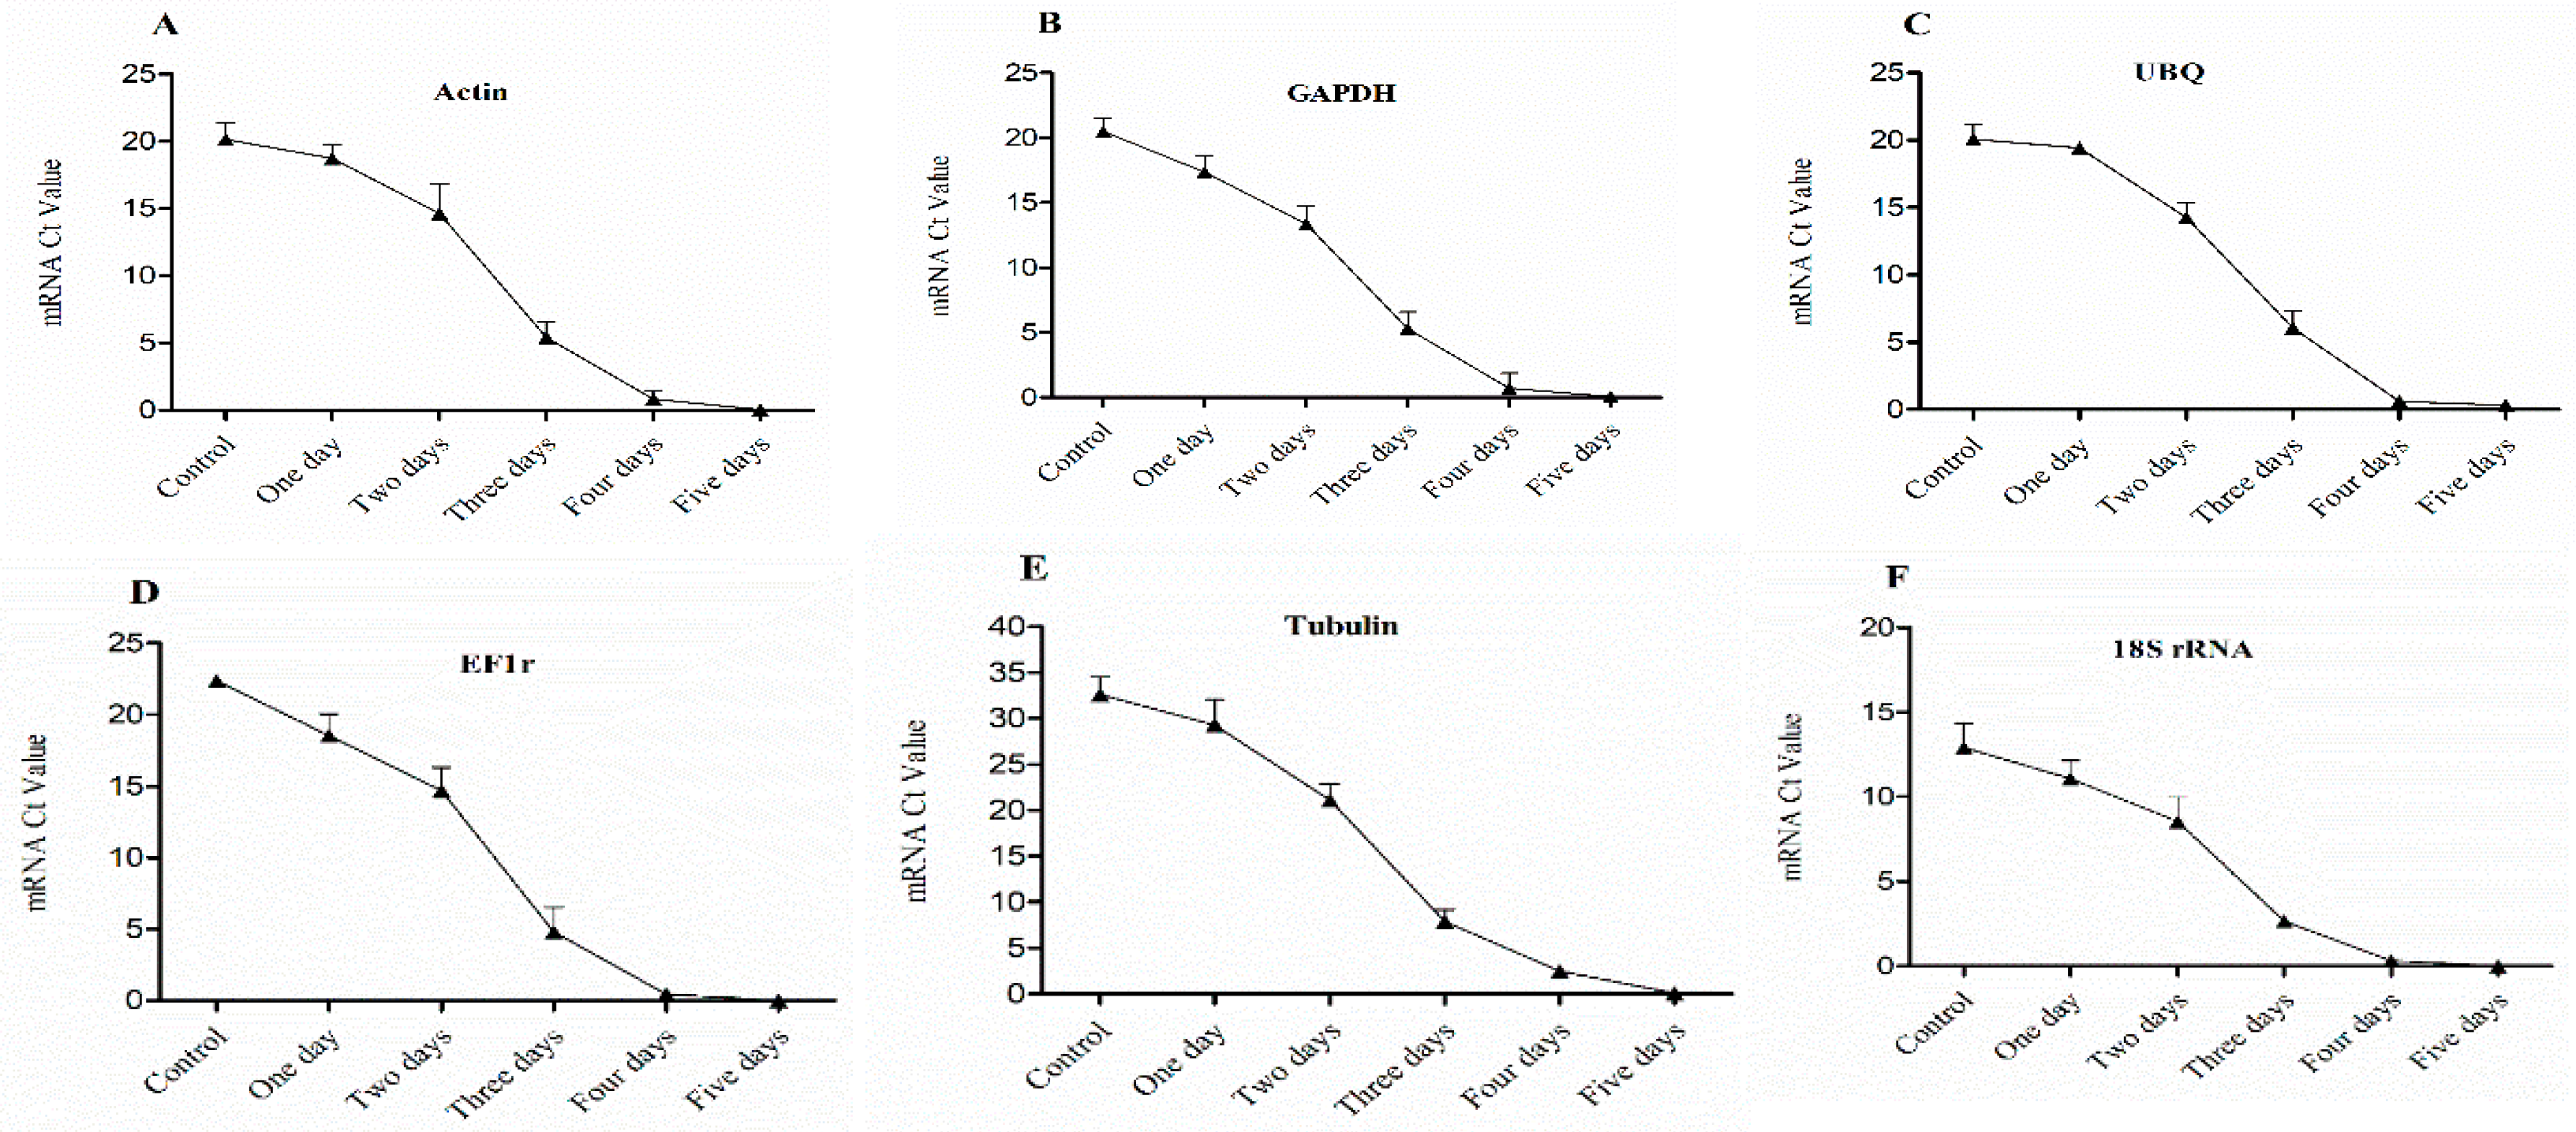
Figure 4.
Expression level of mRNA in 1st bud (base bud) of dormant grape seedlings. (A) Actin, (B) GAPDH, (C) UBQ, (D) EF1r, (E) Tubulin, and (F) 18S rRNA were determined by qRT-PCR (1–5 days). Vertical bars represented standard error (SE) of means (n = 3). Different values indicated as statistical differences at p < 0.05 as determined by Duncan’s multiple range tests.
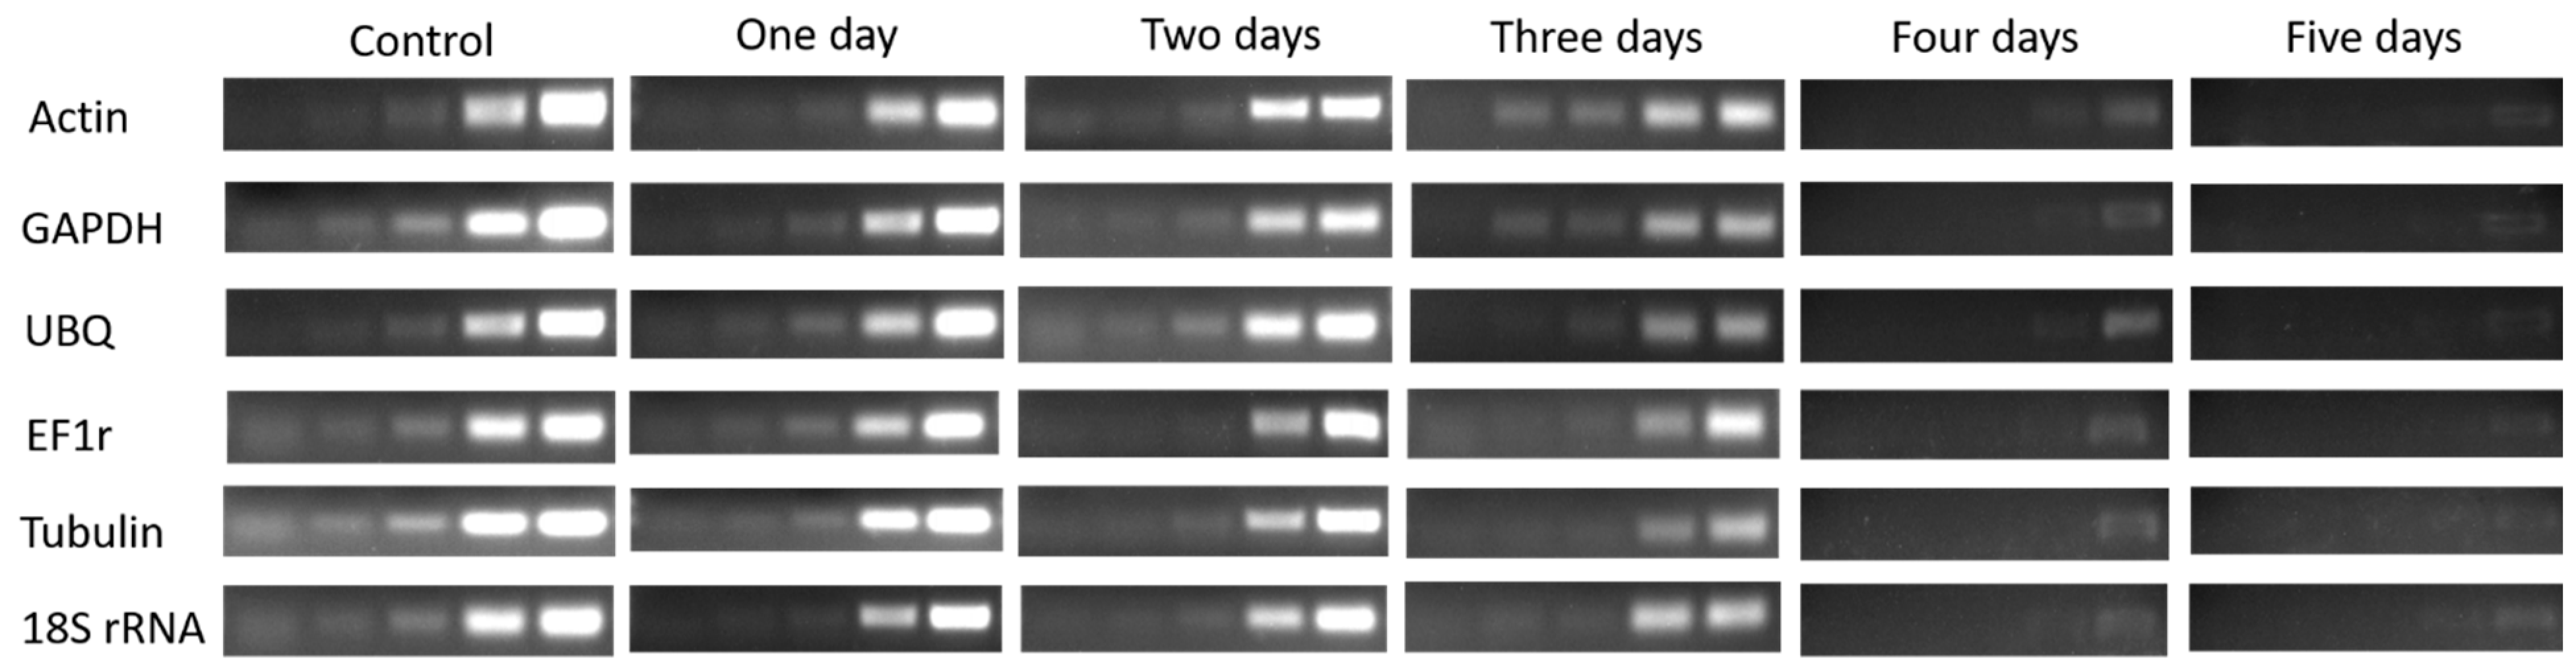
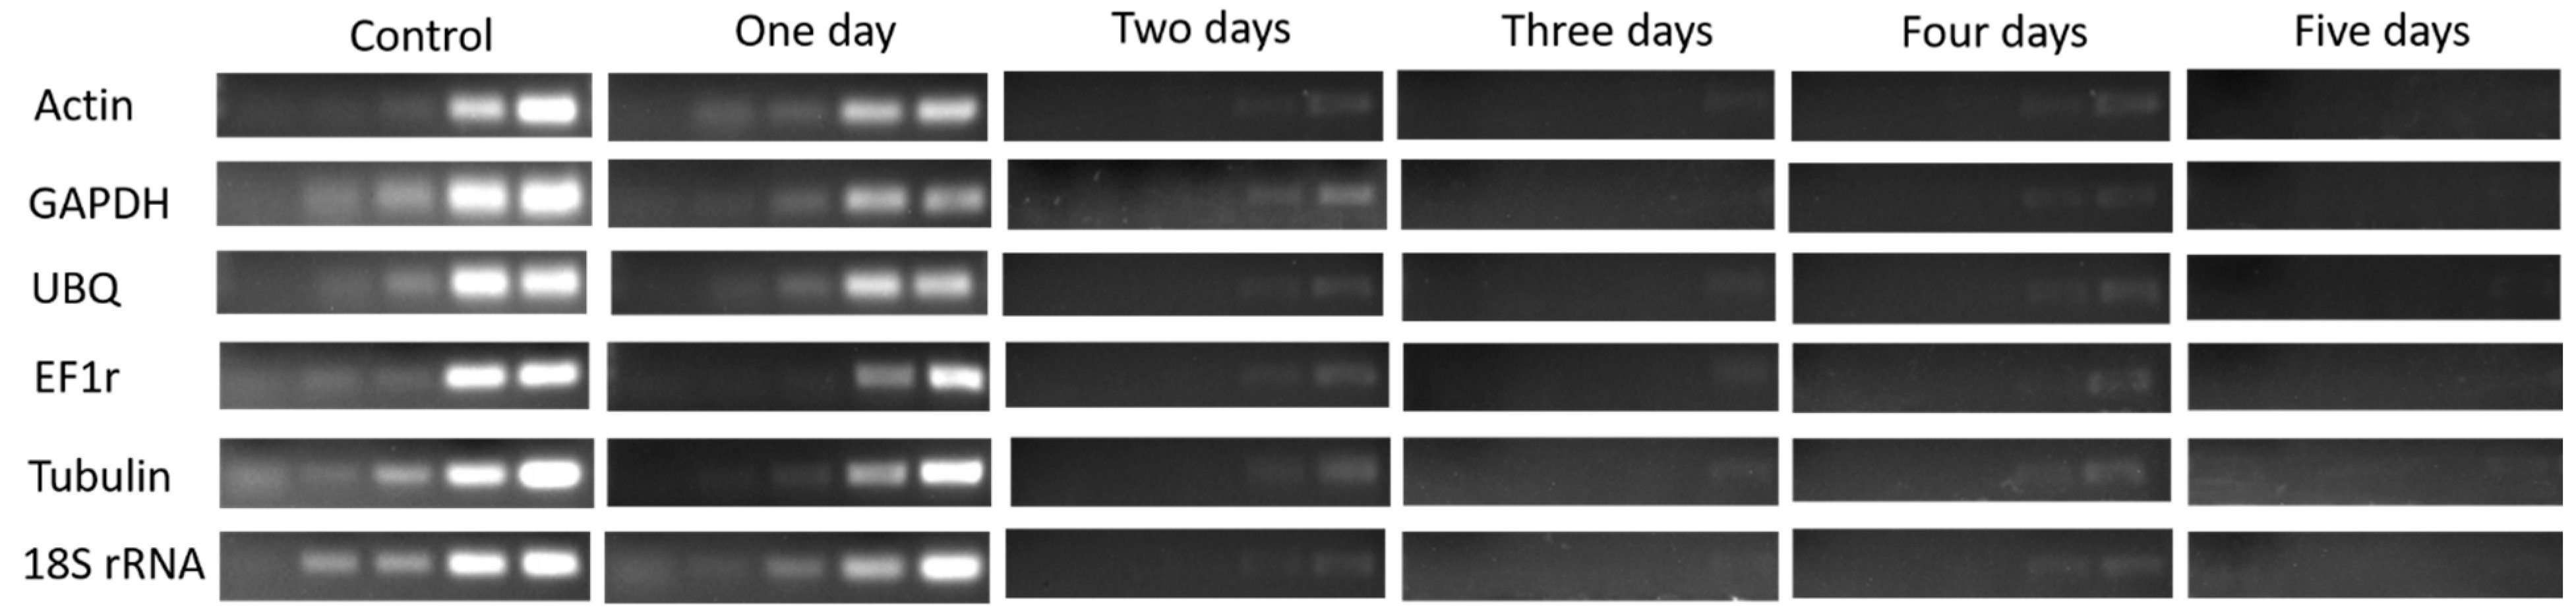
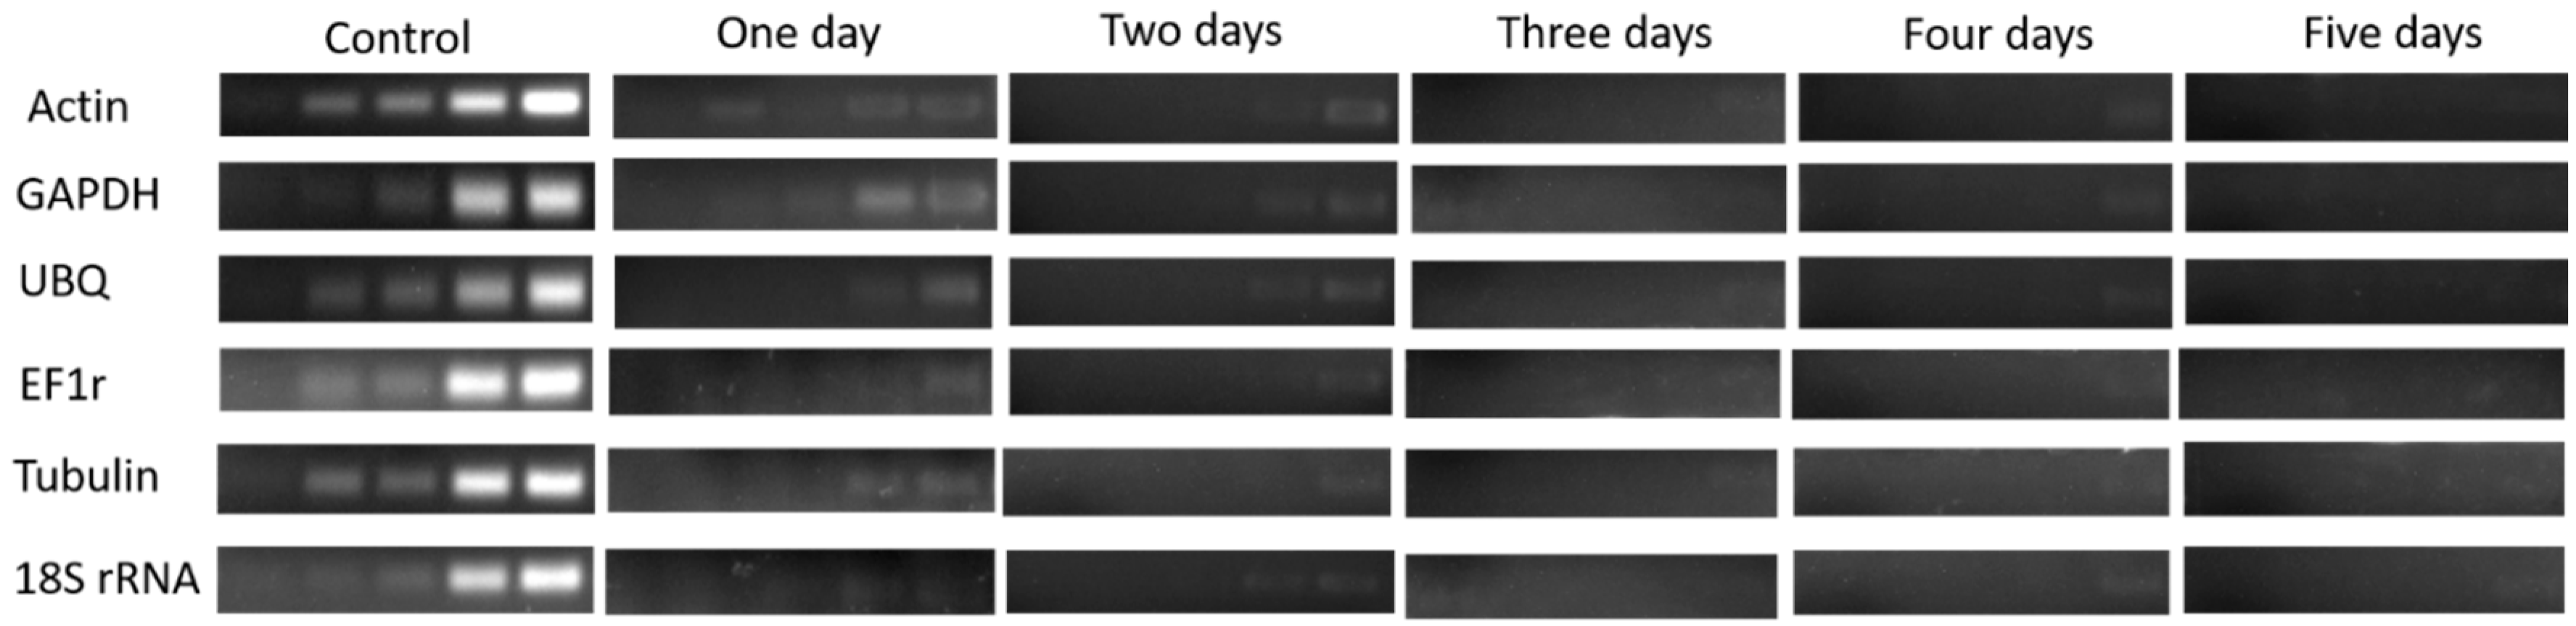
Figure 5.
(Sq.) RT-PCR analysis of mRNA level in the 1st bud during 1–5 days of treatment in dormant grape seedlings. 18, 21, 23, 27, and 30 cycles were used for Actin, GHAPDH, UBQ, and EF1r; 27, 30 33, 36, and 39 cycles were used for Tubulin; and 12, 15, 18, 21, and 27 cycles were used for 18S rRNA.
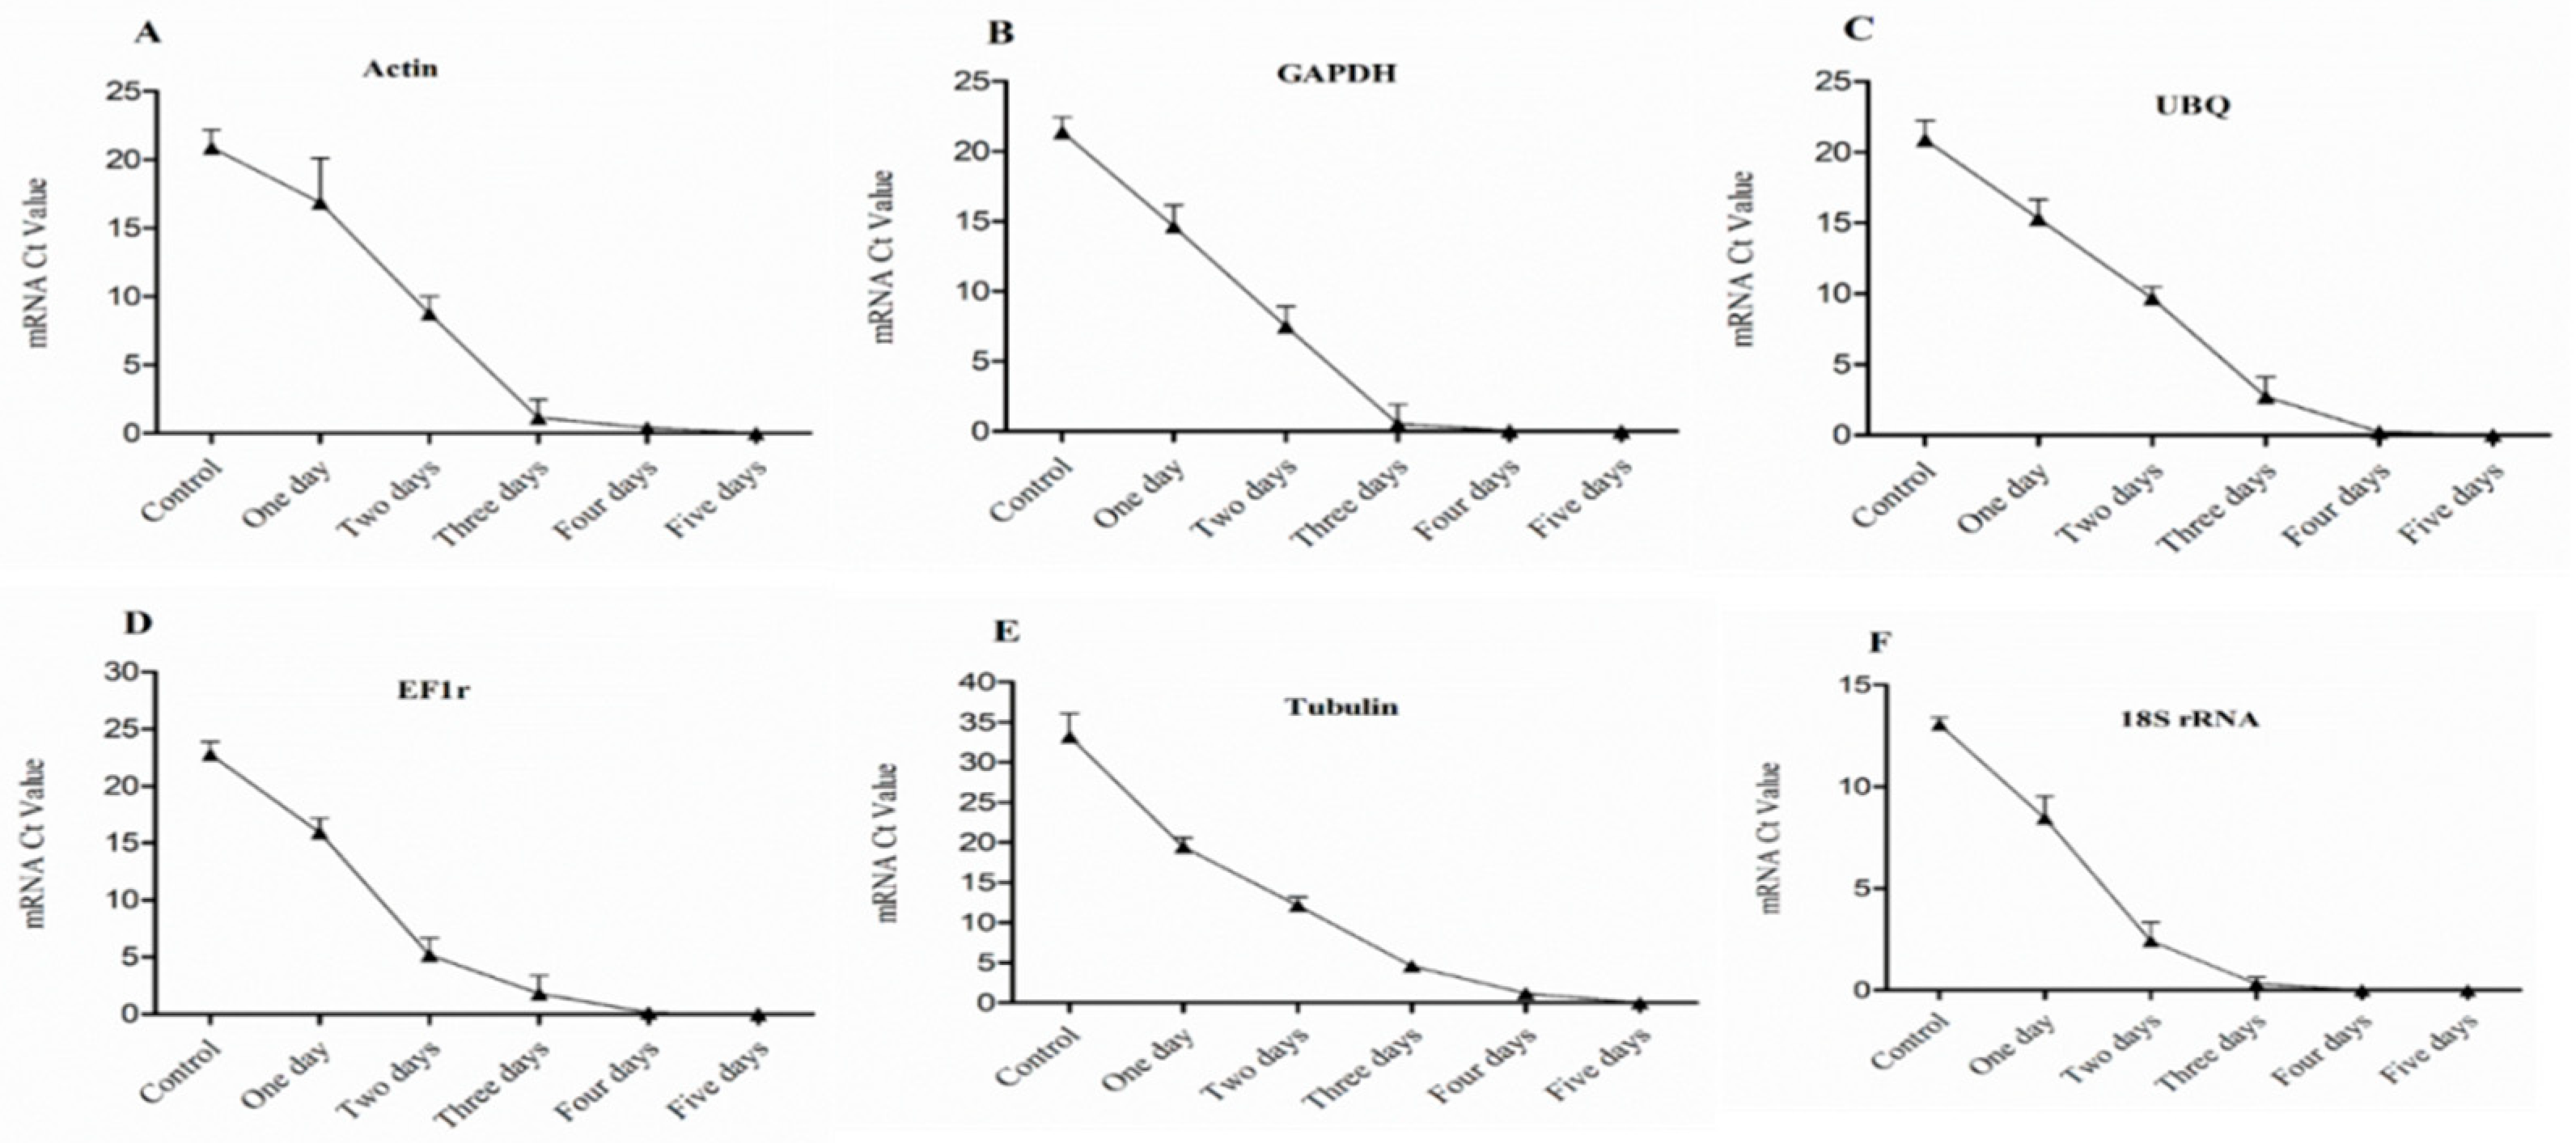
Figure 6.
Expression level of mRNA in 2nd bud of dormant grape seedlings, (A) Actin, (B) GAPDH, (C) UBQ, (D) EF1r, (E) Tubulin, and (F) 18S rRNA were determined by qRT-PCR (1–5 days). Vertical bars represented standard error (SE) of means (n = 3). Different values indicated as statistical differences at p < 0.05 as determined by Duncan’s multiple range tests.
Figure 7.
(Sq.) RT-PCR analysis of the mRNA level in the 2nd bud during 1–5 days of treatment in dormant grape seedlings. 18, 21, 23, 27, and 30 cycles were used for Actin, GHAPDH, UBQ, and EF1r; 27, 30 33, 36, and 39 cycles were used for Tubulin; and 12, 15, 18, 21, and 27 cycles were used for 18S rRNA.
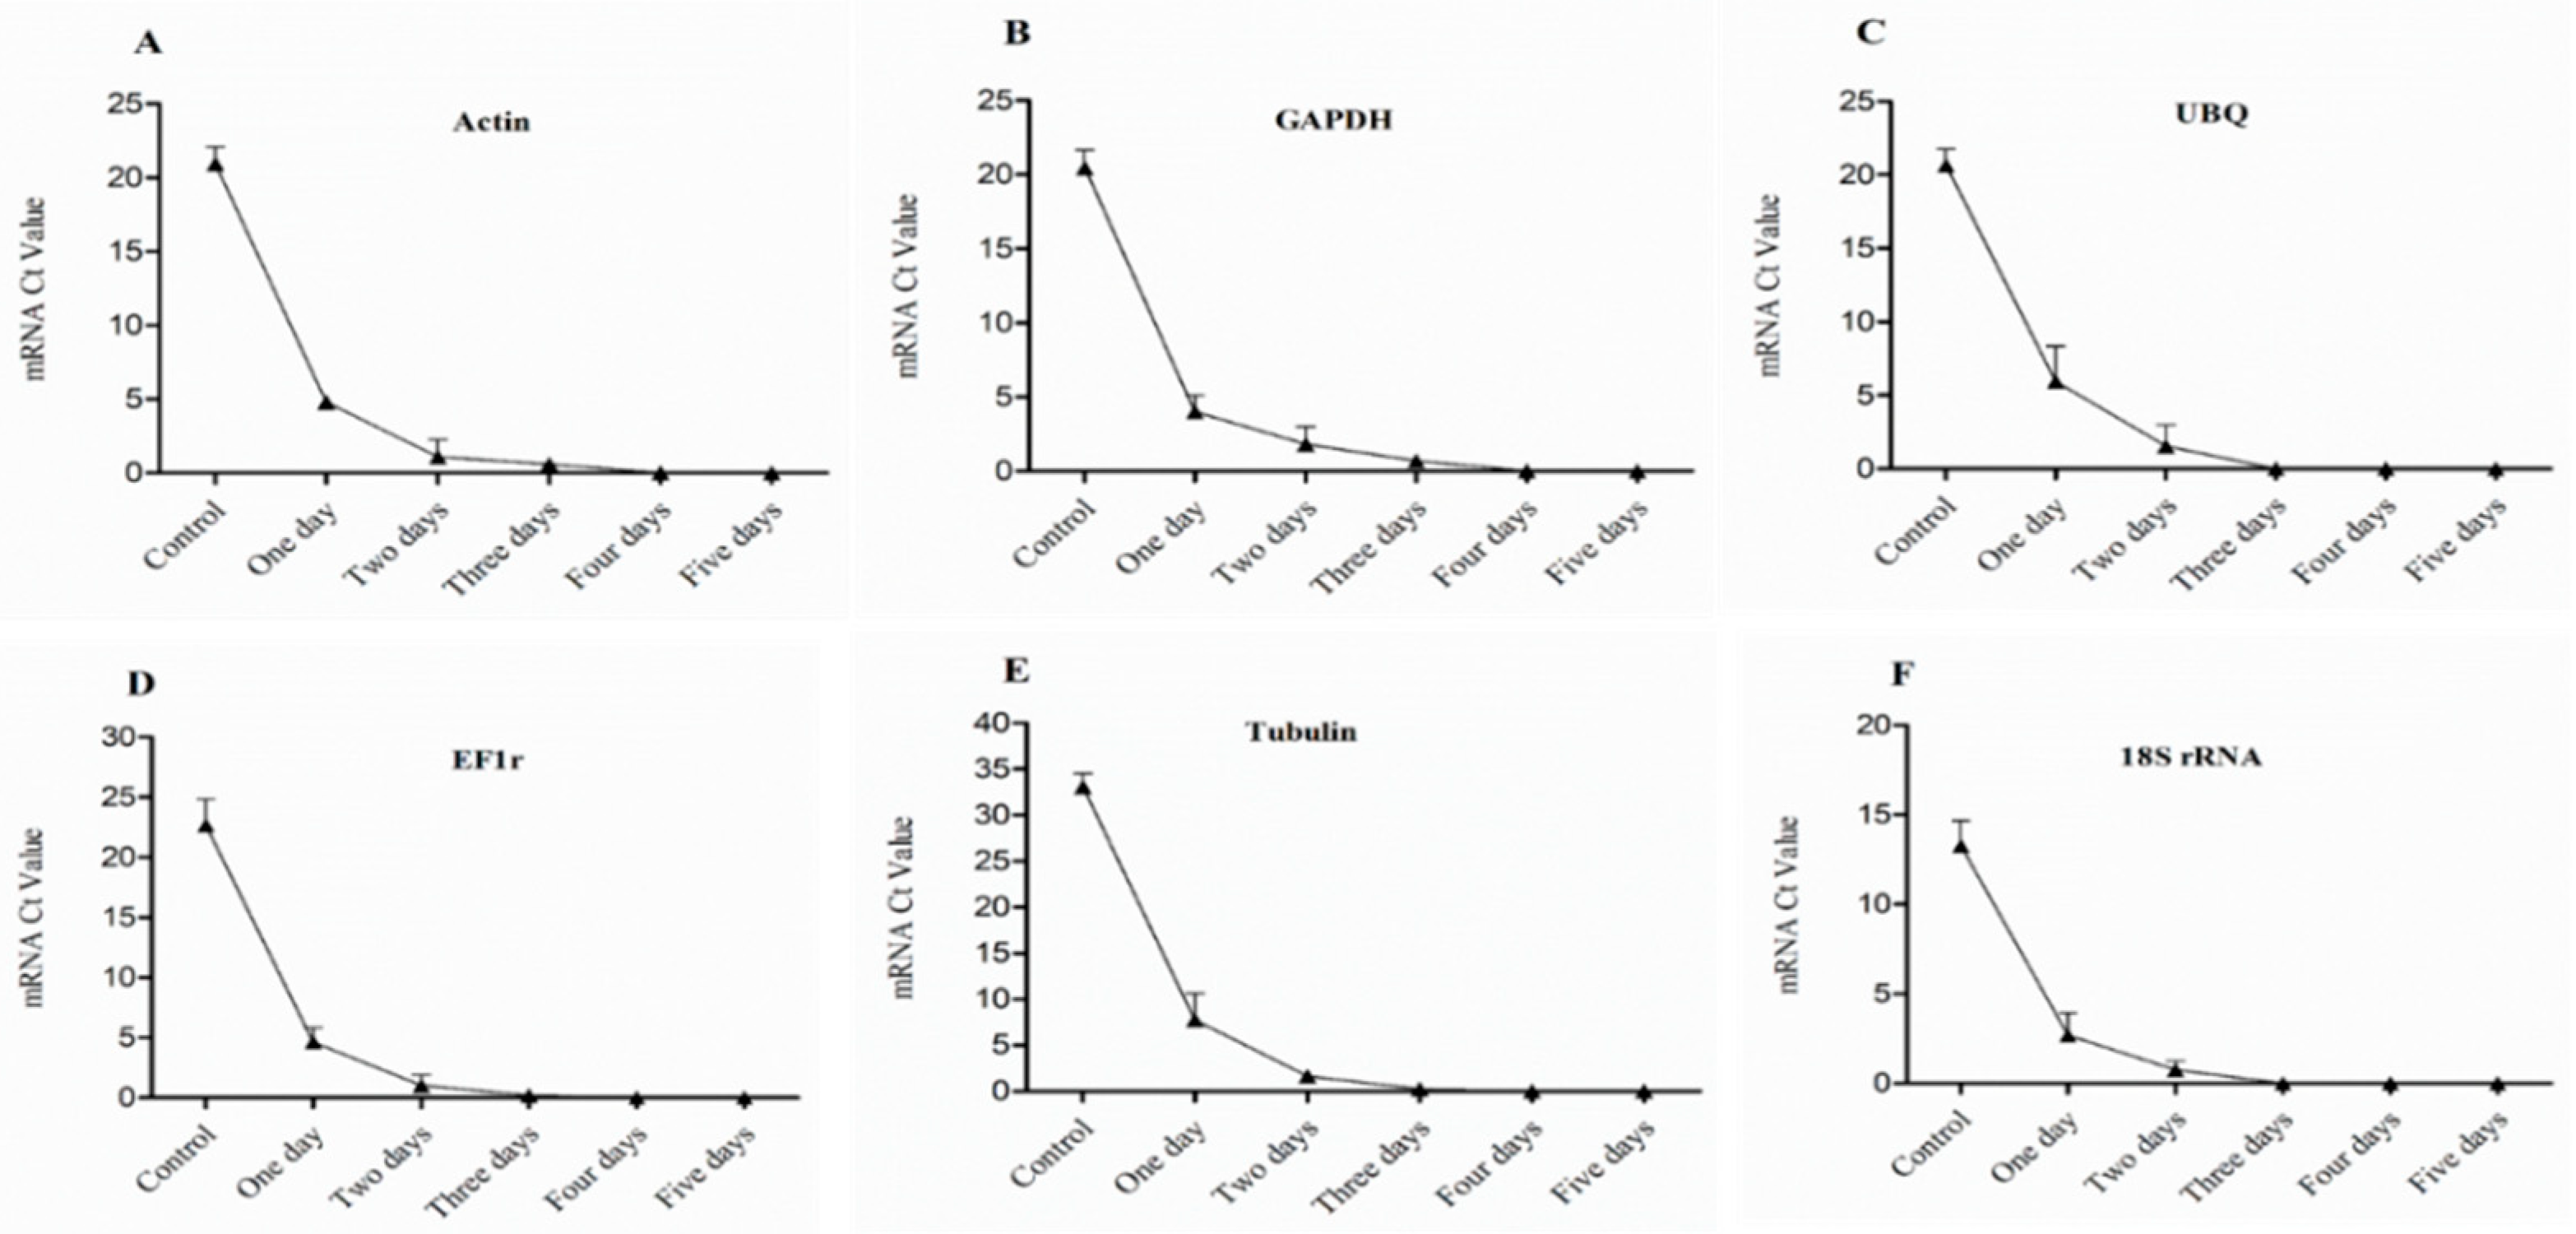
Figure 8.
Expression level of mRNA in 3rd bud of dormant grape seedlings. (A) Actin, (B) GAPDH, (C) UBQ, (D) EF1r, (E) Tubulin, and (F) 18S rRNA were determined by qRT-PCR (1–5 days). Vertical bars represented standard error (SE) of means (n = 3). Different values indicated as statistical differences at p < 0.05 as determined by Duncan’s multiple range tests.
Figure 9.
(Sq.) RT-PCR analysis of mRNA level in the 3rd bud during 1–5 days of treatment in dormant grape seedlings. 18, 21, 23, 27, and 30 cycles were used for Actin, GHAPDH, UBQ, and EF1r; 27, 30 33, 36, and 39 cycles were used for Tubulin; and 12, 15, 18, 21, and 27 cycles were used for 18S rRNA. Vertical bars represented standard error (SE) of means (n = 3). Different values indicated as statistical differences at p < 0.05 as determined by Duncan’s multiple range tests.
Figure 10.
Expression level of mRNA in 4th bud of dormant grape seedlings. (A) Actin, (B) GAPDH, (C) UBQ, (D) EF1r, (E) Tubulin, and (F) 18S rRNA were determined by qRT-PCR (1–5 days). Vertical bars represented standard error (SE) of means (n = 3). Different values indicated as statistical differences at p < 0.05 as determined by Duncan’s multiple range tests.
Figure 11.
(Sq.) RT-PCR analysis of mRNA level in the 4th bud during 1–5 days of treatment in dormant grape seedlings. 18, 21, 23, 27, and 30 cycles were used for Actin, GHAPDH, UBQ, and EF1r; 27, 30 33, 36, and 39 cycles were used for Tubulin; and 12, 15, 18, 21, and 27 cycles were used for 18S rRNA. Vertical bars represented standard error (SE) of means (n = 3).
Figure 12.
Morphological changes and viability rate of grape seedlings treated at different times under bare roots condition.
Figure 12.
Morphological changes and viability rate of grape seedlings treated at different times under bare roots condition.
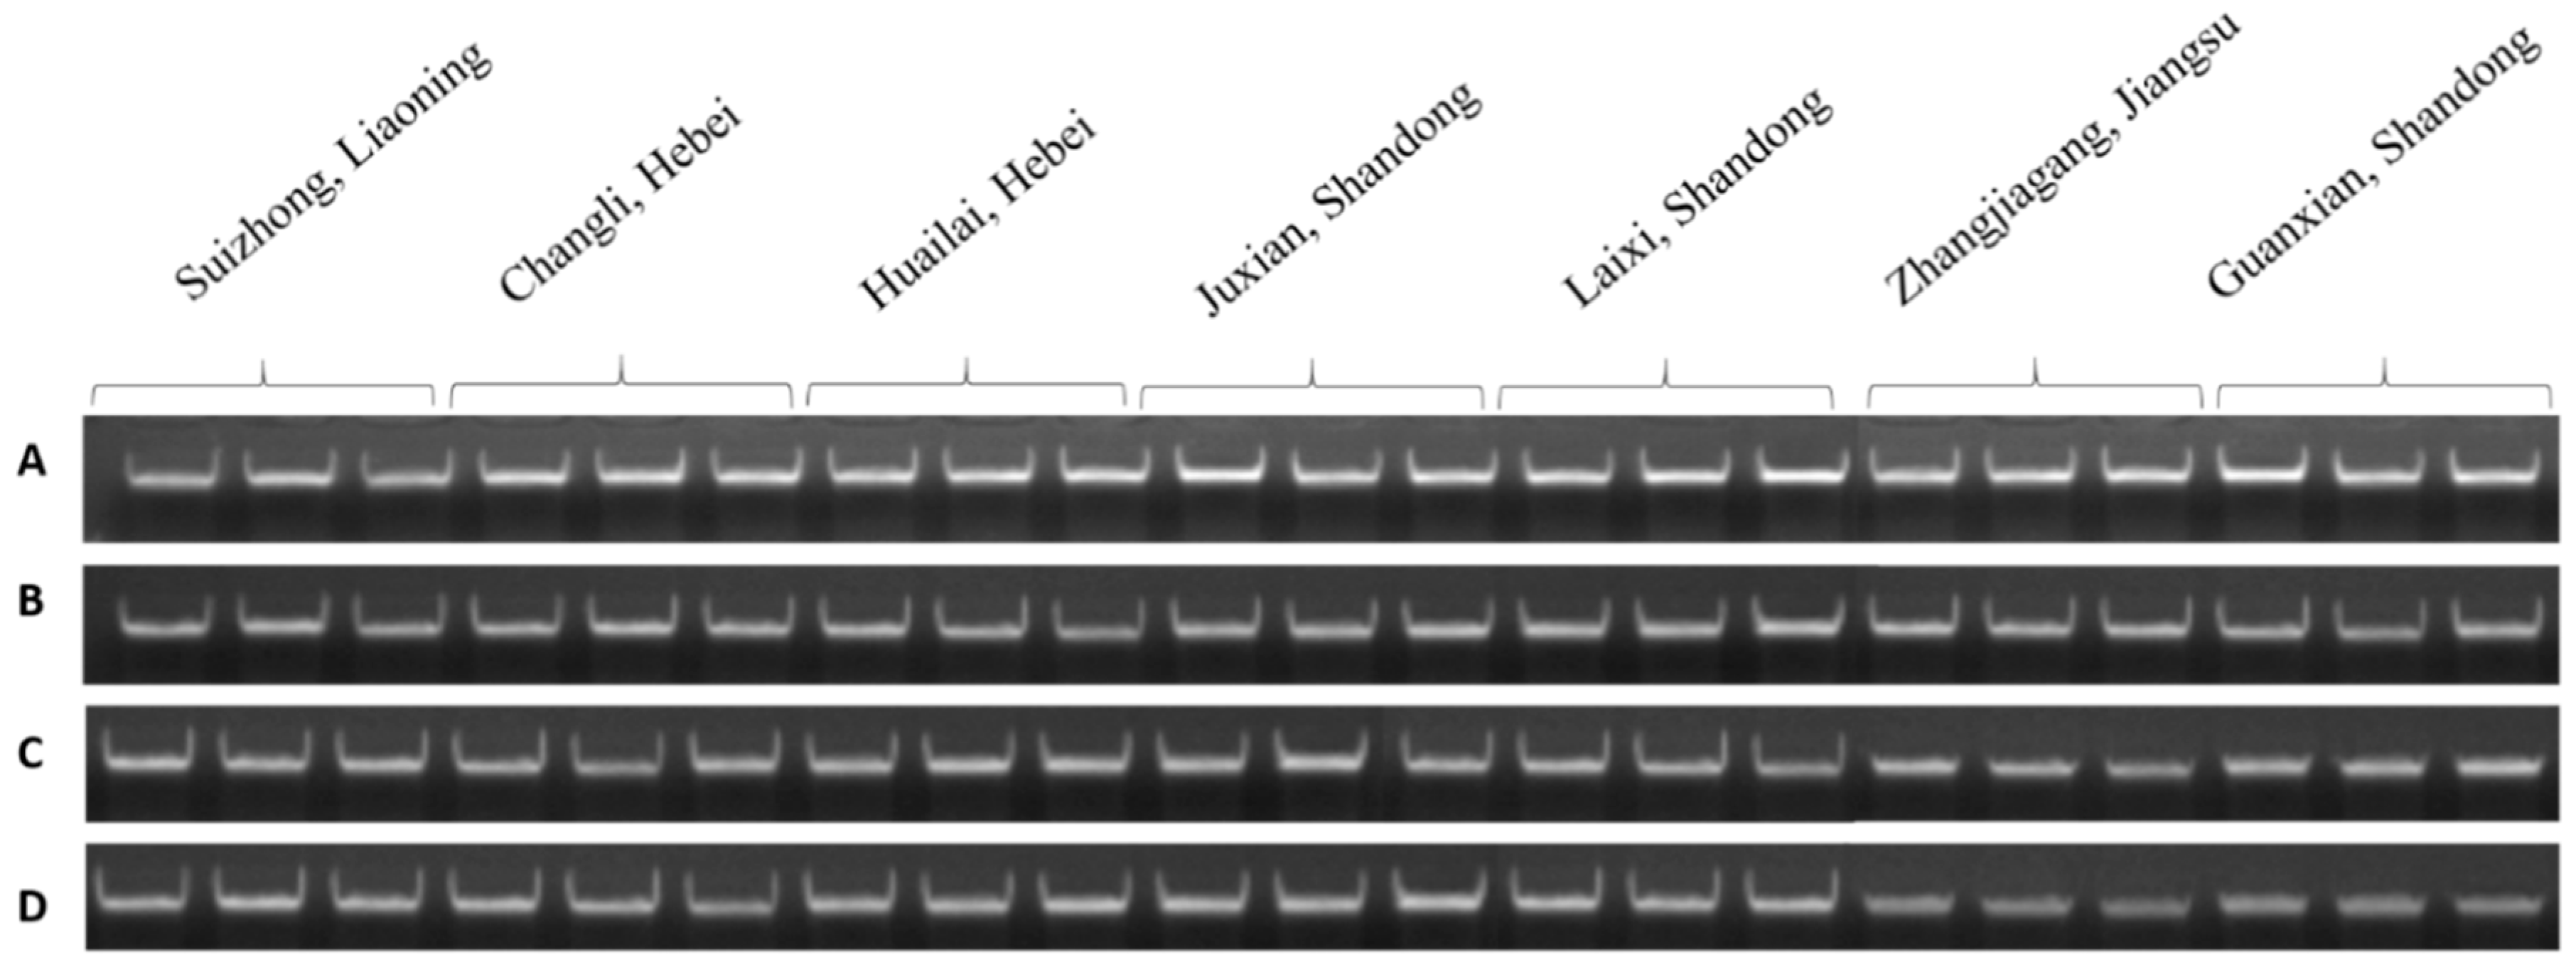
Figure 13.
Agarose gel analysis of DNA extracted from dormant grape seedlings (A) 1st bud (lower bud), (B) 2nd bud, (C) 3rd bud, and (D) 4th bud (upper bud) tissues.
Figure 13.
Agarose gel analysis of DNA extracted from dormant grape seedlings (A) 1st bud (lower bud), (B) 2nd bud, (C) 3rd bud, and (D) 4th bud (upper bud) tissues.
Figure 14.
Agarose gel analysis of total RNA extracted from grape dormant seedlings (A) 1st bud (lower bud), (B) 2nd bud, (C) 3rd bud, and (D) 4th bud (upper buds) tissues.
Figure 14.
Agarose gel analysis of total RNA extracted from grape dormant seedlings (A) 1st bud (lower bud), (B) 2nd bud, (C) 3rd bud, and (D) 4th bud (upper buds) tissues.
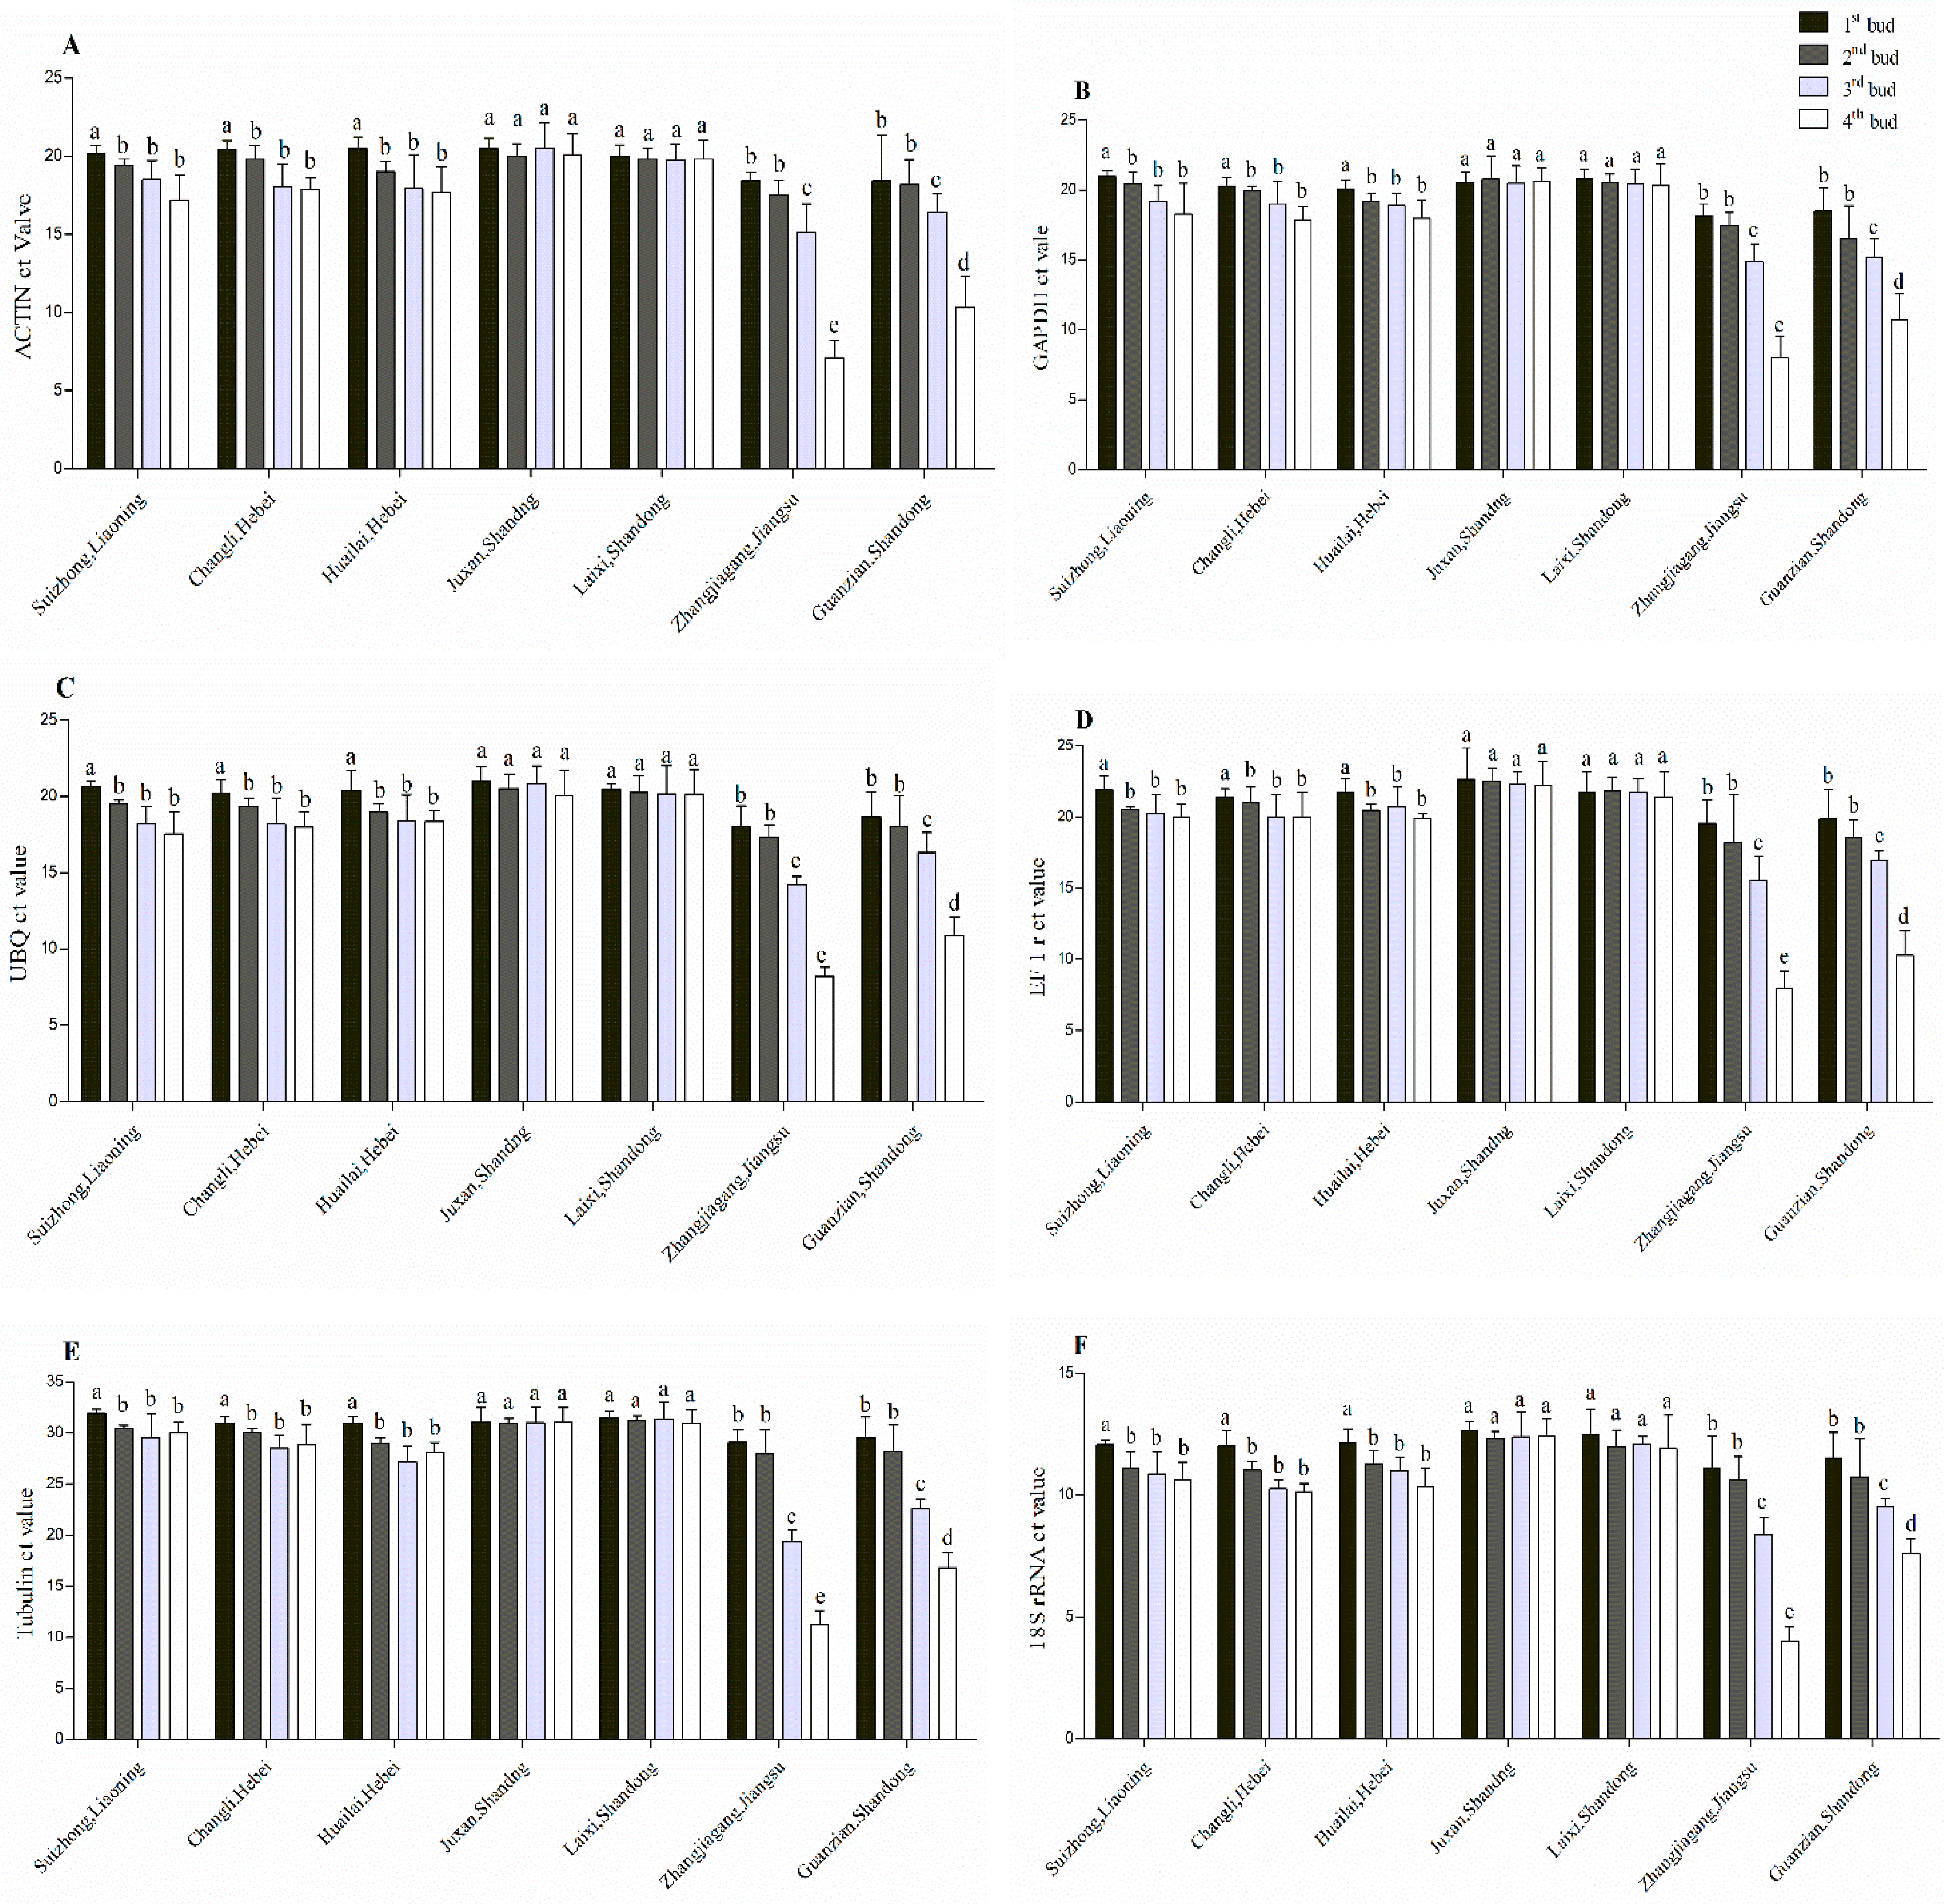
Figure 15.
qRT-PCR analysis of mRNA level in four buds in dormant grape seedlings. (A) Actin, (B) GHAPDH, (C) UBQ, (D) EF1r, (E) Tubulin, and (F) 18S rRNA. Vertical bars represented standard error (SE) of means (n = 3). Different superscript letters indicated statistical differences at p < 0.05 as determined by Duncan’s multiple range tests.
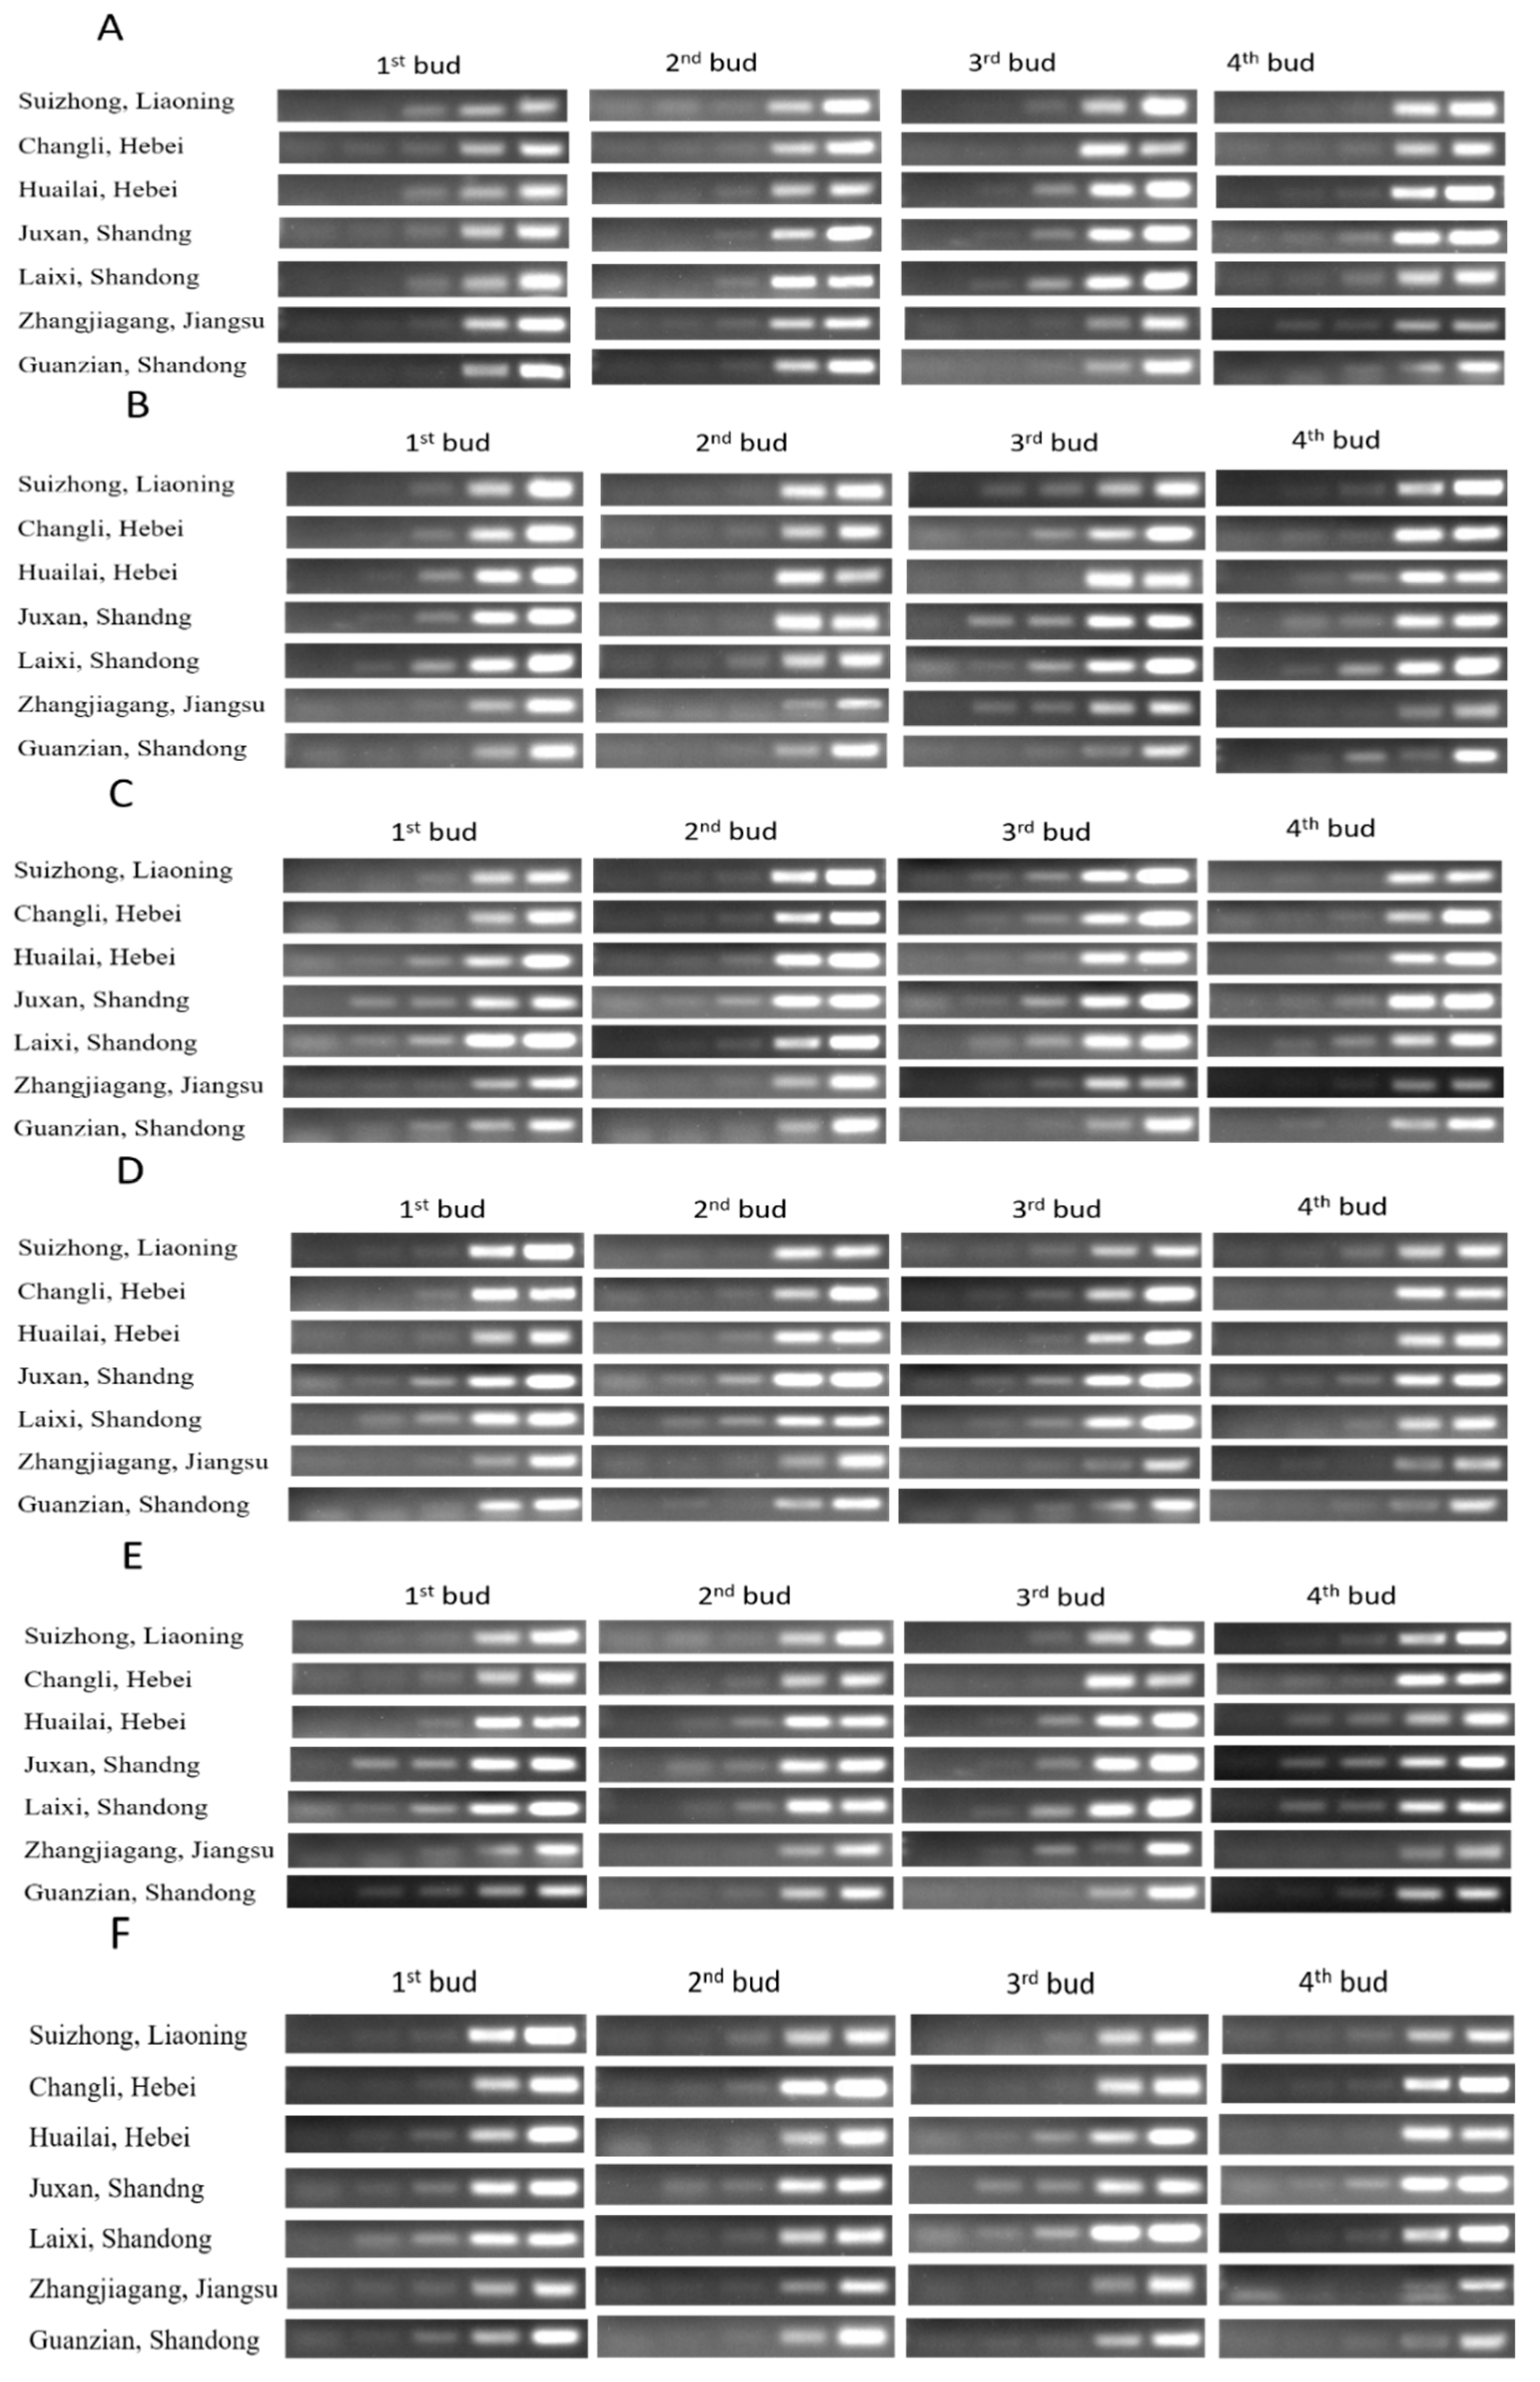
Figure 16.
(Sq.) RT-PCR analysis of mRNA level in four buds of dormant grape seedlings produced in different geographical regions of china. (A) Actin, (B) GHAPDH, (C) UBQ, (D) EF1r, (E) Tubulin, and (F) 18S rRNA; 18, 21, 23, 27, and 30 cycles were used for Actin, GHAPDH, UBQ, and EF1r; 27, 30 33, 36, and 39 cycles were used for Tubulin; and 12, 15, 18, 21, and 27 cycles were used for 18S rRNA.
Figure 17.
Morphological appearance and growth differences of Kyoho grape seedlings produced in seven different areas. (A) Growth appearance. (B) Survival rate.
Figure 17.
Morphological appearance and growth differences of Kyoho grape seedlings produced in seven different areas. (A) Growth appearance. (B) Survival rate.
Figure 18.
Cutting of the seedlings into 4 parts for sampling purpose.
Figure 18.
Cutting of the seedlings into 4 parts for sampling purpose.
Table 1.
UV abstraction of total DNA extracted from four different buds of the treated grape seedlings with bare roots.
Table 1.
UV abstraction of total DNA extracted from four different buds of the treated grape seedlings with bare roots.
| DNA Quantity Analysis of Bare Roots Treated Seedlings |
|---|
| Buds | OD & Concentration | Control | One Day | Two Days | Three Days | Four Days | Five Days |
|---|
| 1st Bud | OD 260/280 | 1.95 ± 0.05 | 1.92 ± 0.04 | 1.82 ± 0.06 | 1.73 ± 0.03 | 1.23 ± 0.07 | 1.14 ± 0.03 |
| OD 260/230 | 1.96 ± 0.03 | 1.91 ± 0.03 | 1.73 ± 0.11 | 1.63 ± 0.07 | 0.93 ± 0.11 | 0.86 ± 0.06 |
| concentration(µg·mL−1) | 1220 ± 28 | 1001 ± 46 | 891 ± 83 | 742 ± 27 | 443 ± 26 | 382 ± 33 |
| 2nd Bud | OD 260/280 | 1.93 ± 0.04 | 1.83 ± 0.04 | 1.71 ± 0.05 | 1.21 ± 0.03 | 1.2 ± 0.05 | 1.12 ± 0.05 |
| OD 260/230 | 1.92 ± 0.12 | 1.86 ± 0.03 | 1.62 ± 0.07 | 0.95 ± 0.05 | 0.76 ± 0.03 | 0.62 ± 0.02 |
| concentration(µg·mL−1) | 1271 ± 53 | 977 ± 37 | 726 ± 73 | 419 ± 72 | 325 ± 25 | 267 ± 44 |
| 3rd Bud | OD 260/280 | 1.96 ± 0.07 | 1.74 ± 0.02 | 1.22 ± 0.09 | 1.19 ± 0.04 | 1.13 ± 0.03 | 1.07 ± 0.03 |
| OD 260/230 | 1.92 ± 0.04 | 1.73 ± 0.07 | 0.82 ± 0.03 | 0.72 ± 0.07 | 0.66 ± 0.07 | 0.32 ± 0.01 |
| concentration(µg·mL−1) | 1239 ± 51 | 821 ± 33 | 629 ± 42 | 383 ± 92 | 298 ± 38 | 215 ± 23 |
| 4th Bud | OD 260/280 | 1.95 ± 0.1 | 1.18 ± 0.03 | 1.21 ± 0.02 | 1.16 ± 0.03 | 1.09 ± 0.04 | 1.05 ± 0.03 |
| OD 260/230 | 1.910.08 | 1.03 ± 0.02 | 0.76 ± 0.06 | 0.63 ± 0.07 | 0.56 ± 0.03 | 0.29 ± 0.01 |
| concentration(µg.mL−1) | 1193 ± 45 | 522 ± 41 | 437 ± 47 | 314 ± 43 | 213 ± 42 | 127 ± 19 |
Table 2.
UV abstraction of total RNA extracted from four different buds of the treated grape seedlings with bare roots.
Table 2.
UV abstraction of total RNA extracted from four different buds of the treated grape seedlings with bare roots.
| RNA Quantity Analysis of Bare Roots Treated Seedlings |
|---|
| Buds | Od & Concentration | Control | One Day | Two Days | Three Days | Four Days | Five Days |
|---|
| 1st Bud | OD 260/280 | 1.95 ± 0.12 | 1.9 ± 0.08 | 1.81 ± 0.09 | 1.72 ± 0.11 | 1.55 ± 0.05 | 1.21 ± 0.06 |
| OD 260/230 | 1.94 ± 0.04 | 1.52 ± 0.03 | 1.52 ± 0.05 | 1.42 ± 0.08 | 1.07 ± 0.07 | 0.9 ± 0.04 |
| concentration(µg·mL−1) | 1221 ± 82 | 1100 ± 39 | 980 ± 44 | 833 ± 21 | 579 ± 23 | 322 ± 47 |
| 2nd Bud | OD 260/280 | 1.95 ± 0.11 | 1.82 ± 0.04 | 1.73 ± 0.04 | 1.62 ± 0.03 | 1.42 ± 0.02 | 1.18 ± 0.07 |
| OD 260/230 | 1.96 ± 0.05 | 1.51 ± 0.2 | 1.46 ± 0.07 | 1.03 ± 0.06 | 0.92 ± 0.09 | 0.68 ± 0.02 |
| concentration(µg·mL−1) | 1253 ± 57 | 1053 ± 29 | 930 ± 64 | 589 ± 52 | 513 ± 37 | 282 ± 46 |
| 3rd Bud | OD 260/280 | 1.87 ± 0.08 | 1.71 ± 0.06 | 1.440.03 | 1.31 ± 0.03 | 1.21 ± 0.03 | 1.12 ± 0.03 |
| OD 260/230 | 1.92 ± 0.02 | 1.47 ± 0.04 | 0.93 ± 0.07 | 0.81 ± 0.04 | 0.68 ± 0.06 | 0.54 ± 0.03 |
| concentration(µg·mL−1) | 1219 ± 83 | 970 ± 19 | 687 ± 53 | 407 ± 71 | 310 ± 26 | 219 ± 18 |
| 4th Bud | OD 260/280 | 1.94 ± 0.04 | 1.19 ± 0.05 | 1.18 ± 0.04 | 1.15 ± 0.08 | 1.11 ± 0.03 | 1.05 ± 0.08 |
| OD 260/230 | 1.97 ± 0.11 | 0.93 ± 0.12 | 0.73 ± 0.09 | 0.55 ± 0.03 | 0.41 ± 0.07 | 0.36 ± 0.04 |
| concentration(µg.mL−1) | 1228 ± 32 | 622 ± 19 | 483 ± 42 | 320 ± 27 | 277 ± 19 | 175 ± 34 |
Table 3.
Relation of plant growth in different buds 10, 20, and 30 days after first bud burst and survival rate of dormant treated grape seedlings.
Table 3.
Relation of plant growth in different buds 10, 20, and 30 days after first bud burst and survival rate of dormant treated grape seedlings.
| Growth Analysis of Four Buds and Survival Rate of the Treated Seedlings |
|---|
| Treatment | Buds | Bud Burst Time (DAP) | Growth Rate (10 DAFBB) | Growth Rate (20 DAFBB) | Growth Rate (30 DAFBB) | Seedling Survival Rate (%) |
|---|
| Shoots Length (cm) | Number of Leaves Per Shoot | Shoots Length (cm) | Number of Leaves per Shoot | Shoots Length (cm) | Number of Leaves Per Shoot |
|---|
| Control | 1st bud | 21 | 14.90 ± 4.64 a | 9 ± 1.39 a | 22.15 ± 9.26 a | 17 ± 5.39 a | 37.30 ± 7.09 a | 27 ± 4.75 a | 100.00 |
| 2nd bud | 21 | 13.38 ± 5.32 a | 8 ± 3.41 a | 23.17 ± 2.14 a | 20 ± 2.85 a | 37.83 ± 6.62 a | 28 ± 7.63 a |
| 3rd bud | 21 | 15.93 ± 6.48 a | 10 ± 2.95 a | 21.85 ± 4.73 a | 16 ± 2.37 a | 34.87 ± 3.75 a | 25 ± 5.73 a |
| 4th bud | 21 | 14.16 ± 4.91 a | 9 ± 3.31 a | 25.74 ± 5.92 a | 24 ± 38 a | 40.51 ± 2.73 a | 31 ± 3.99 a |
| one day | 1st bud | 23 | 11.96 ± 3.29 b | 7 ± 2.61 b | 18.32 ± 2.53 b | 14 ± 4.72 b | 25.69 ± 3.71 b | 16 ± 5.48 b | 85.55 |
| 2nd bud | 24 | 8.13 ± 2.74 c | 5 ± 1.35 c | 15.35 ± 3.50 c | 10 ± 1.42 c | 18.74 ± 2.37 c | 19 ± 3.31 c |
| 3rd bud | 25 | 5.61 ± 2.47 d | 4 ± 1.17 d | 10.79 ± 2.16 d | 5 ± 1.03 d | 13.76 ± 0.93 d | 8 ± 2.62 d |
| 4th bud | 28 | 0.54 ± 0.53 g | 0 ± 0.21 g | 0.83 ± 0.96 g | 1 ± 0.43 g | 0.84 ± 0.57 g | 1 ± 0.53 g |
| two days | 1st bud | 28 | 5.63 ± 2.11 d | 4 ± 2.84 d | 9.40 ± 3.26 d | 6 ± 2.03 d | 14.35 ± 5.82 d | 10 ± 2.69 d | 75.55 |
| 2nd bud | 30 | 3.86 ± 1.21 e | 3 ± 0.94 e | 7.15 ± 2.04 e | 5 ± 1.37 e | 11.22 ± 2.32 e | 7 ± 0.98 e |
| 3rd bud | 33 | 0.31 ± 0.31 g | 0 ± 0.20 g | 0.75 ± 0.84 g | 1 ± 0.74 g | 0.77 ± 0.64 g | 1 ± 0.43 g |
| 4th bud | 0 | 0.00 | 0.00 | 0.00 | 0.00 | 0.00 | 0.00 |
| three days | 1st bud | 36 | 2.56 ± 1.78 f | 2 ± 1.65 f | 4.25 ± 2.62 f | 3 ± 3.41 f | 8.60 ± 2.43 f | 6 ± 1.71 f | 51.11 |
| 2nd bud | 39 | 0.00 | 0.00 | 0.74 ± 0.03 g | 1 ± 0.04 g | 0.79 ± 0.04 g | 1 ± 0.06 g |
| 3rd bud | 0 | 0.00 | 0.00 | 0.00 | 0.00 | 0.00 | 0.00 |
| 4th bud | 0 | 0.00 | 0.00 | 0.00 | 0.00 | 0.00 | 0.00 |
| four days | 1st bud | 47 | 0.00 | 0.00 | 0.28 ± 0.04 g | 1 ± 0.01 g | 0.42 ± 0.31 g | 1 ± 0.07 g | 2.22 |
| 2nd bud | 0 | 0.00 | 0.00 | 0.00 | 0.00 | 0.00 | 0.00 |
| 3rd bud | 0 | 0.00 | 0.00 | 0.00 | 0.00 | 0.00 | 0.00 |
| 4th bud | 0 | 0.00 | 0.00 | 0.00 | 0.00 | 0.00 | 0.00 |
| five days | 1st bud | 0 | 0.00 | 0.00 | 0.00 | 0.00 | 0.00 | 0.00 | 0.00 |
| 2nd bud | 0 | 0.00 | 0.00 | 0.00 | 0.00 | 0.00 | 0.00 |
| 3rd bud | 0 | 0.00 | 0.00 | 0.00 | 0.00 | 0.00 | 0.00 |
| 4th bud | 0 | 0.00 | 0.00 | 0.00 | 0.00 | 0.00 | 0.00 |
Table 4.
DNA analysis of four buds in dormant Kyoho grapes produced in different regions.
Table 4.
DNA analysis of four buds in dormant Kyoho grapes produced in different regions.
| DNA Analysis of Four Buds in Different Regions’ Seedlings |
|---|
| Region of Seedlings Production | Optical Density OD260/OD280 | Optical Density OD260/OD230 | Concentration (µg.mL−1) |
|---|
| Suizhong, Liaoning | 1st bud | 1.94 ± 0.01 | 1.92 ± 0.02 | 1222 ± 36 |
| 2nd bud | 1.87 ± 0.03 | 1.86 ± 0.03 | 1159 ± 47 |
| 3rd bud | 1.88 ± 0.02 | 1.83 ± 0.04 | 1173 ± 68 |
| 4th bud | 1.84 ± 0.04 | 1.84 ± 0.02 | 1187 ± 56 |
| Changli, Hebei | 1st bud | 1.92 ± 0.05 | 1.91 ± 0.03 | 1217 ± 61 |
| 2nd bud | 1.86 ± 0.02 | 1.87 ± 0.07 | 1074 ± 47 |
| 3rd bud | 1.87 ± 0.03 | 1.83 ± 0.04 | 1095 ± 56 |
| 4th bud | 1.85 ± 0.04 | 1.81 ± 0.03 | 1166 ± 37 |
| Huailai, Hebei | 1st bud | 1.97 ± 0.05 | 1.92 ± 0.02 | 1213 ± 91 |
| 2nd bud | 1.87 ± 0.02 | 1.84 ± 0.02 | 1062 ± 62 |
| 3rd bud | 1.89 ± 0.01 | 1.85 ± 0.03 | 1027 ± 26 |
| 4th bud | 1.84 ± 0.05 | 1.84 ± 0.04 | 1193 ± 56 |
| Juxian, Shandong | 1st bud | 1.96 ± 0.03 | 1.95 ± 0.02 | 1351 ± 37 |
| 2nd bud | 1.94 ± 0.04 | 1.91 ± 0.06 | 1218 ± 42 |
| 3rd bud | 1.94 ± 0.02 | 1.90 ± 0.03 | 1302 ± 37 |
| 4th bud | 1.93 ± 0.03 | 1.97 ± 0.02 | 1344 ± 39 |
| Laixi, Shandong | 1st bud | 1.92 ± 0.02 | 1.92 ± 0.02 | 1310 ± 39 |
| 2nd bud | 1.91 ± 0.06 | 1.95 ± 0.02 | 1206 ± 62 |
| 3rd bud | 1.93 ± 0.02 | 1.93 ± 0.07 | 1295 ± 37 |
| 4th bud | 1.89 ± 0.02 | 1.92 ± 0.03 | 1294 ± 81 |
| Zhangjiagang, Jiangsu | 1st bud | 1.82 ± 0.13 | 1.81 ± 0.06 | 911 ± 54 |
| 2nd bud | 1.71 ± 0.08 | 1.69 ± 0.01 | 798 ± 36 |
| 3rd bud | 1.63 ± 0.03 | 1.62 ± 0.03 | 702 ± 24 |
| 4th bud | 1.142 ± 0.06 | 1.39 ± 0.05 | 617 ± 44 |
| Guanxian, Shandong | 1st bud | 1.84 ± 0.04 | 1.84 ± 0.06 | 915 ± 93 |
| 2nd bud | 1.73 ± 0.02 | 1.77 ± 0.04 | 812 ± 72 |
| 3rd bud | 1.67 ± 0.03 | 1.71 ± 0.01 | 738 ± 42 |
| 4th bud | 1.46 ± 0.06 | 1.40 ± 0.04 | 658 ± 46 |
Table 5.
RNA analysis of four buds in dormant Kyoho grapes produced in different regions.
Table 5.
RNA analysis of four buds in dormant Kyoho grapes produced in different regions.
| RNA Analysis of Four Buds in Different Regions’ Seedlings |
|---|
| Region of Seedlings Production | Optical Density OD260/OD280 | Optical Density OD260/OD230 | Concentration (µg·mL−1) |
|---|
| Suizhong, Liaoning | 1st bud | 1.93 ± 0.02 | 1.92 ± 0.03 | 1160 ± 32 |
| 2nd bud | 1.9 ± 0.6 | 1.91 ± 0.04 | 110 ± 41 |
| 3rd bud | 1.87 ± 0.07 | 1.88 ± 0.07 | 1093 ± 27 |
| 4th bud | 1.84 ± 0.01 | 1.84 ± 0.01 | 1131 ± 24 |
| Changli, Hebei | 1st bud | 1.92 ± 0.05 | 1.91 ± 0.03 | 1095 ± 33 |
| 2nd bud | 1.87 ± 0.06 | 1.91 ± 0.04 | 1135 ± 29 |
| 3rd bud | 1.86 ± 0.05 | 1.87 ± 0.02 | 1063 ± 34 |
| 4th bud | 1.86 ± 0.02 | 1.86 ± 0.02 | 1092 ± 63 |
| Huailai, Hebei | 1st bud | 1.91 ± 0.21 | 1.90 ± 0.01 | 1157 ± 66 |
| 2nd bud | 1.88 ± 0.07 | 1.86 ± 0.02 | 1021 ± 38 |
| 3rd bud | 1.92 ± 0.1 | 1.85 ± 0.04 | 1023 ± 26 |
| 4th bud | 1.86 ± 0.03 | 1.86 ± 0.02 | 1123 ± 18 |
| Juxian, Shandong | 1st bud | 1.97 ± 0.02 | 1.95 ± 0.03 | 1295 ± 23 |
| 2nd bud | 1.96 ± 0.05 | 1.93 ± 0.02 | 1219 ± 41 |
| 3rd bud | 1.92 ± 0.03 | 1.91 ± 0.05 | 1257 ± 37 |
| 4th bud | 1.97 ± 0.03 | 1.97 ± 0.02 | 1220 ± 26 |
| Laixi, Shandong | 1st bud | 1.94 ± 0.01 | 1.95 ± 0.03 | 1225 ± 82 |
| 2nd bud | 1.96 ± 0.04 | 1.94 ± 0.02 | 1252 ± 39 |
| 3rd bud | 1.98 ± 0.05 | 1.94 ± 0.07 | 1283 ± 41 |
| 4th bud | 1.94 ± 0.02 | 1.94 ± 0.03 | 1151 ± 38 |
| Zhangjiagang, Jiangsu | 1st bud | 1.81 ± 0.08 | 1.80 ± 0.04 | 924 ± 25 |
| 2nd bud | 1.72 ± 0.03 | 1.71 ± 0.08 | 847 ± 46 |
| 3rd bud | 1.67 ± 0.07 | 1.64 ± 0.05 | 783 ± 57 |
| 4th bud | 1.41 ± 0.05 | 1.33 ± 0.05 | 683 ± 29 |
| Guanxian, Shandong | 1st bud | 1.83 ± 0.07 | 1.81 ± 0.04 | 936 ± 87 |
| 2nd bud | 1.73 ± 0.04 | 1.69 ± 0.03 | 866 ± 49 |
| 3rd bud | 1.72 ± 0.01 | 1.67 ± 0.01 | 791 ± 27 |
| 4th bud | 1.45 ± 0.06 | 1.37 ± 0.06 | 703 ± 45 |
Table 6.
Growth observation and survival rate of grape seedlings produced in seven different geographical regions of China.
Table 6.
Growth observation and survival rate of grape seedlings produced in seven different geographical regions of China.
| Geographical Regions of the Seedlings | Buds | BBD (DAP) | Growth Rate 10 (DAFBB) | Growth Rate 20 (DAFBB) | Growth Rate 30 (DAFBB) | Survival Rate (%) |
|---|
| Shoots Length (cm) | Number of Leaves Per Plant | Shoots Length (cm) | Number of Leaves Per Plant | Shoots Length (cm) | Number of Leaves Per Plant |
|---|
| Suizhong, Liaoning | 1st | 18 March 2019 | 17.44 ± 3.12 a | 8 ± 2.20 a | 23.33 ± 5.32 a | 12 ± 2.64 a | 43.88 ± 5.81 a | 33 ± 4.28 a | 100.00 |
| 2nd | 15.32 ± 3.42 b | 8 ± 3.21 b | 21.85 ± 4.63 b | 12 ± 3.42 b | 40.34 ± 4.42 b | 30 ± 4.32 b |
| 3rd | 15.21 ± 4.37 b | 7 ± 4.53 b | 20.86 ± 4.87 b | 11 ± 2.24 b | 40.84 ± 3.72 b | 27 ± 7.37 b |
| 4th | 14.39 ± 6.72 b | 7 ± 5.63 b | 20.01 ± 7.43 b | 10 ± 2.12 b | 38.99 ± 5.38 b | 26 ± 6.73 b |
| Changli, Hebei | 1st | 17 March 2019 | 17.45 ± 2.93 a | 10 ± 2.02 a | 24.54 ± 6.59 a | 12 ± 1.42 a | 43.90 ± 5.97 a | 34 ± 7.03 a | 100.00 |
| 2nd | 15.32 ± 4.32 b | 9 ± 2.31 b | 22.37 ± 3.48 b | 11 ± 3.28 b | 41.02 ± 7.57 b | 29 ± 5.69 b |
| 3rd | 14.35 ± 2.21 b | 8 ± 2.83 b | 22.10 ± 0.41 b | 10 ± 1.12 b | 39.34 ± 8.73 b | 31 ± 2.49 b |
| 4th | 13.23 ± 2.82 b | 8 ± 2.74 b | 21.72 ± 3.74 b | 10 ± 2.00 b | 38.95 ± 6.74 b | 30 ± 7.38 b |
| Huailai, Hebei | 1st | 17 March 2019 | 17.30 ± 2.40 a | 9 ± 1.39 a | 24.60 ± 7.41 a | 12 ± 3.16 a | 44.50 ± 3.34 a | 35 ± 5.94 a | 100.00 |
| 2nd | 16.28 ± 3.74 b | 9 ± 1.75 b | 22.15 ± 6.37 b | 10 ± 3.27 b | 40.46 ± 7.43 b | 35 ± 3.86 b |
| 3rd | 16.74 ± 3.38 b | 8 ± 2.37 b | 21.74 ± 4.37 b | 10 ± 2.91 b | 42.85 ± 3.65 b | 32 ± 2.75 b |
| 4th | 14.72 ± 3.17 b | 8 ± 4.65 b | 20.20 ± 2.45 b | 10 ± 1.69 b | 39.26 ± 2.74 b | 31 ± 5.14 b |
| Juxian, Shandong | 1st | 12 March 2019 | 18.32 ± 3.44 a | 9 ± 2.22 a | 25.70 ± 7.63 a | 13 ± 1.50 a | 45.71 ± 7.04 a | 35 ± 6.48 a | 100.00 |
| 2nd | 17.92 ± 2.64 a | 9 ± 2.12 a | 24.84 ± 5.38 a | 11 ± 3.82 a | 44.52 ± 6.62 a | 33 ± 5.43 a |
| 3rd | 18.11 ± 3.93 a | 8 ± 3.25 a | 26.43 ± 6.72 a | 12 ± 4.62 a | 43.19 ± 3.29 a | 37 ± 4.23 a |
| 4th | 18.06 ± 2.19 a | 9 ± 2.51 a | 25.73 ± 5.62 a | 13 ± 2.76 a | 45.13 ± 3.51 a | 34 ± 3.39 a |
| Laixi, Shandong | 1st | 14 March 2019 | 18.70 ± 4.64 a | 9 ± 1.84 a | 25.10 ± 5.24 a | 13 ± 6.39 a | 44.30 ± 8.09 a | 34 ± 4.75 a | 100.00 |
| 2nd | 17.97 ± 3.23 a | 10 ± 3.32 a | 26.35 ± 3.87 a | 14 ± 3.23 a | 46.42 ± 4.51 a | 33 ± 6.34 a |
| 3rd | 18.17 ± 4.32 a | 9 ± 3.46 a | 24.32 ± 3.23 a | 15 ± 4.34 a | 43.29 ± 4.51 a | 31 ± 4.61 a |
| 4th | 18.35 ± 3.97 a | 10 ± 3.28 a | 24.47 ± 4.51 a | 13 ± 2.34 a | 42.43 ± 2.36 a | 30 ± 3.42 a |
| Zhangjiagang, Jiangsu | 1st | 23 March 2019 | 15.40 ± 0.96 b | 7 ± 0.84 b | 22.40 ± 7.33 b | 10 ± 4.68 b | 37.21 ± 4.02 b | 27 ± 3.72 b | 87.77 |
| 2nd | 12.97 ± 1.84 b | 6 ± 1.14 b | 18.63 ± 2.12 b | 7 ± 2.32 b | 29.97 ± 4.42 b | 20 ± 5.43 b |
| 3rd | 10.26 ± 0.34 c | 5 ± 0.92 c | 15.87 ± 2.31 c | 5 ± 1.46 c | 23.96 ± 3.41 c | 15 ± 2.74 c |
| 4th | 8.37 ± 0.75 d | 4 ± 0.28 d | 12.27 ± 1.03 d | 4 ± 0.43 d | 18.84 ± 2.15 d | 11 ± 1.63 d |
| Guanxian, Shandong | 1st | 20 March 2019 | 15.54 ± 0.84 b | 8 ± 0.73 b | 22.80 ± 6.19 b | 11 ± 1.33 b | 38.34 ± 3.72 b | 29 ± 4.11 b | 93.33 |
| 2nd | 14.37 ± 1.20 b | 7 ± 0.37 b | 19.54 ± 3.58 b | 8 ± 1.81 b | 33.63 ± 5.63 b | 24 ± 3.17 b |
| 3rd | 9.27 ± 0.53 c | 4 ± 0.48 c | 13.77 ± 1.85 c | 5 ± 0.45 c | 21.97 ± 2.23 c | 13 ± 1.96 c |
| 4th | 5.96 ± 0.74 e | 3 ± 2.97 e | 9.14 ± 0.77 e | 3 ± 0.43 e | 16.88 ± 0.71 e | 9 ± 0.95 e |
Table 7.
Primers used in (Sq.) RT-PCR and qRT-PCR.
Table 7.
Primers used in (Sq.) RT-PCR and qRT-PCR.
| Name | Sequence | Accession No | Product Size (bp) |
|---|
| ACTIN-F | CTTGCATCCCTCAGCACCTT | XM_002282480.4 | 82 |
| ACTIN-R | TCCTGTGGACAATGGATGGA | | |
| GAPDH-F | TTCCGTGTTCCTACTGTTG | XM_002263109.3 | 106 |
| GAPDH-R | CCTCTGACTCCTCCTTGAT | | |
| UBQ-F | GTGGTATTATTGAGCCATCCTT | XM_002273532.2 | 182 |
| UBQ-R | AACCTCCAATCCAGTCATCTAC | | |
| EF1r-F | CAAGAGAAACCATCCCTAGCTG | XM_002264364.4 | 92 |
| EF1r-R | TCAATCTGTCTAGGAAAGGAAG | | |
| Tubulin-F | TTTGCTCCACTCACTTCC | XM_002281253.4 | 181 |
| Tubulin-R | TCTGCTCGTCCACTTCTT | | |
| 18S rRNA-F | TGGCCTTCGGGATCGGAGTAA | GQ849399.1 | 209 |
| 18S rRNA-R | ATCCCTGGTCGGCATCGTTTAT | | |

 ,
, 


