Article

Common Bean (Phaseolus vulgaris L.) Accumulates Most S-Methylcysteine as Its γ-Glutamyl Dipeptide

1
Genomics and Biotechnology, London Research and Development Centre, Agriculture and Agri-Food Canada, London, ON N5V 4T3, Canada
2
Department of Plant Breeding and Biotechnology, Faculty of Agriculture, University of Zabol, Zabol 538-98615, Iran
3
Department of Biology, University of Western Ontario, London, ON N6A 3K7, Canada
4
Horticultural Sciences Department, University of Florida, Gainesville, FL 32611, USA
5
Agricultural Biotechnology Research Institute of Iran (ABRII), Agricultural Research Education and Extension Organization (AREEO), Karaj 31585-845, Iran
*
Author to whom correspondence should be addressed.
Plants 2019, 8(5), 126; https://doi.org/10.3390/plants8050126
Submission received: 26 March 2019 / Revised: 1 May 2019 / Accepted: 12 May 2019 / Published: 14 May 2019
(This article belongs to the Special Issue Advances in Plant Sulfur Research)

Abstract

:
The common bean (Phaseolus vulgaris) constitutes an excellent source of vegetable dietary protein. However, there are sub-optimal levels of the essential amino acids, methionine and cysteine. On the other hand, P. vulgaris accumulates large amounts of the γ-glutamyl dipeptide of S-methylcysteine, and lower levels of free S-methylcysteine and S-methylhomoglutathione. Past results suggest two distinct metabolite pools. Free S-methylcysteine levels are high at the beginning of seed development and decline at mid-maturation, while there is a biphasic accumulation of γ-glutamyl-S-methylcysteine, at early cotyledon and maturation stages. A possible model involves the formation of S-methylcysteine by cysteine synthase from O-acetylserine and methanethiol, whereas the majority of γ-glutamyl-S-methylcysteine may arise from S-methylhomoglutathione. Metabolite profiling during development and in genotypes differing in total S-methylcysteine accumulation showed that γ-glutamyl-S-methylcysteine accounts for most of the total S-methylcysteine in mature seed. Profiling of transcripts for candidate biosynthetic genes indicated that BSAS4;1 expression is correlated with both the developmental timing and levels of free S-methylcysteine accumulated, while homoglutathione synthetase (hGS) expression was correlated with the levels of γ-glutamyl-S-methylcysteine. Analysis of S-methylated phytochelatins by liquid chromatography and high resolution tandem mass spectrometry revealed only small amounts of homophytochelatin-2 with a single S-methylcysteine. The mitochondrial localization of phytochelatin synthase 2—predominant in seed, determined by confocal microscopy of a fusion with the yellow fluorescent protein—and its spatial separation from S-methylhomoglutathione may explain the lack of significant accumulation of S-methylated phytochelatins.

1. Introduction

The common bean (Phaseolus vulgaris L.) is an important source of protein, dietary fiber, complex carbohydrates, vitamins, minerals and phenolic compounds [1,2,3,4,5]. However, its nutritional quality is restricted by a low concentration of the essential sulfur amino acids, methionine and cysteine. A large number of studies have focused on improving sulfur-containing amino acids in crops by transgenic development [6,7,8,9,10], synthetic protein synthesis [11] or traditional breeding [12]. Major seed proteins present in the common bean, including the 7S globulin phaseolin and lectin phytohaemagglutinin, have a low concentration of methionine and cysteine. On the other hand, the common bean accumulates non-protein sulfur amino acid derivatives such as γ–glutamyl-S-methylcysteine [13,14], S-methylcysteine [15,16,17] and S-methylhomoglutathione [18].
Two genetically related lines of the common bean, SARC1 and SMARC1N-PN1 differ in their composition of major storage proteins [19]. SMARC1N-PN1 is deficient in phaseolin and major lectins, through introgressions from Phaseolus coccineus and Great Northern 1140, respectively. SARC1 contains the lectin arcelin-1 introduced from a wild accession. SMARC1N-PN1 has an increased concentration of methionine and cysteine, by 10 and 70%, respectively. This increase occurs largely at the expense of total S-methylcysteine measured after acid hydrolysis, which is reduced by 70% [20]. This non-protein amino acid cannot replace methionine or cysteine in the diet [21]. Shifting sulfur from the non-protein amino acid pool to methionine and cysteine could be an effective strategy for protein quality improvement.
The biosynthesis of S-methylcysteine likely intersects with sulfur metabolism, particularly of cysteine. Sulfur is an essential macronutrient which plays a significant role in plant metabolism, increases yield and gives rise to the sulfur amino acids cysteine and methionine [22]. The most abundant environmental source of sulfur is sulfate (SO42-). Utilizing this essential nutrient requires a series of steps for incorporation into metabolically active forms. This includes uptake of sulfate from the environment, reduction to sulfide and synthesis of cysteine [23,24,25,26]. Delivery of adequate sulfur to seed tissues is needed for maximizing yield and to improve protein quality [22]. During cysteine biosynthesis, several enzymes are active in developing seeds of the common bean (Figure 1) [18,27]. Serine acetyltransferase catalyzes the conversion of serine to O-acetylserine using acetyl-CoA [28,29]. Cysteine synthase is part of the β-substituted alanine synthase (BSAS) family, along with enzymes that use cysteine and cyanide to produce β-cyanoalanine [30]. One fate of cysteine is homoglutathione that is formed via a two-step process [31,32]. γ-Glutamylcysteine is synthesized from cysteine by glutamate–cysteine ligase, and homoglutathione from γ-glutamylcysteine by homoglutathione synthetase. Another fate of sulfur is to form homophytochelatins, through the reaction of phytochelatin synthase with homoglutathione as its substrate. Phytochelatins are cysteine-rich polypeptides that chelate toxic metals [33,34].
From past studies, a model emerges for possible pathways of S-methylcysteine biosynthesis. There appears to be two different metabolite pools, with a different pattern of temporal accumulation. Free S-methylcysteine concentration is relatively high at early developmental stages, and rapidly declines at mid-maturation, whereas γ–glutamyl-S-methylcysteine rapidly accumulates during the early cotyledon and maturation stages [35]. BSAS4;1 represents the dominant cytosolic cysteine synthase expressed in developing seeds [36]. As can be inferred from data in Arabidopsis [37], this enzyme might be involved in the condensation of O-acetylserine and methanethiol, produced by methionine γ-lyase, to form S-methylcysteine (Figure 1). The presence of S-methylhomoglutathione suggests that a pathway similar to that of the alk(en)yl sulfoxides in Allium [38] might be involved in the formation of γ–glutamyl-S-methylcysteine in P. vulgaris. Since homoglutathione biosynthesis takes place in plastids, such a biosynthetic mechanism would ensure an absence of interference with the cytosolic pathway of cysteine biosynthesis, predominant in seed [39,40]. This hypothesis is consistent with the depletion of O-acetylserine in SMARC1N-PN1, associated with increased cysteine concentration [27].
In the present study, the different forms of S-methylcysteine and its possible precursors, including homoglutathione and S-methylhomoglutathione, were profiled during seed development and between genotypes that differ in total S-methylcysteine concentration. The relationship between metabolite levels and transcript levels of several candidate genes, including BSAS4;1, glutamate–cysteine ligase (GCL1), homoglutathione synthetase (hGS) and phytochelatin synthase (PCS2) was evaluated. The subcellular localization of PCS2 was determined and the possible presence of S-methylated phytochelatins analyzed by liquid chromatography and tandem mass spectrometry (MS/MS). The results of these experiments provide further insight into S-methylcysteine biosynthesis in P. vulgaris.

2. Results

2.1. Analysis of Sulfur Metabolite Profiles During Seed Development

To obtain more information on the accumulation of the different forms of S-methylcysteine and its precursors, free amino acids were profiled at seven developmental stages in BAT93 seed by high pressure liquid chromatography (HPLC) after derivatization with 3-mercaptopropionic acid and O-phthalaldehyde (Table 1). Developmental stages are designated after Walbot et al. [41]. Stages IV–early cotyledon to VI–early maturation are characterized by the presence of storage protein transcripts, while storage proteins accumulate from stages V–mid-cotyledon to VII–mid-maturation [42]. Stage VI–early maturation is marked by a decrease in photosynthetic capacity, with white cotyledons by stage VII–mid-maturation. Amino acids had been profiled previously using a different methodology involving derivatization with phenyl isothiocyanate [35]. This time, additional sulfur metabolites were quantified, namely homoglutathione and S-methylhomoglutathione, as possible precursors to γ-glutamyl-S-methylcysteine. Attempts to measure the homoglutathione precursor, γ-glutamyl-cysteine, were unsuccessful. Its levels were too low for accurate quantification using the present method. Accumulation of γ-glutamyl-S-methylcysteine followed a biphasic curve, as previously observed, with a steady rise from stage IV–early cotyledon until stage VI–early maturation, followed by a lag, and resumption of accumulation at stage VIII–late maturation. The levels of free S-methylcysteine were high at the first two stages of seed development, followed by a rapid decline during the late cotyledon and maturation stages. Concentrations of S-methylhomoglutathione were also higher at the beginning of seed development, when γ-glutamyl-S-methylcysteine accumulation is most rapid. Concentrations of homoglutathione were in the same range as those of S-methylhomoglutathione.

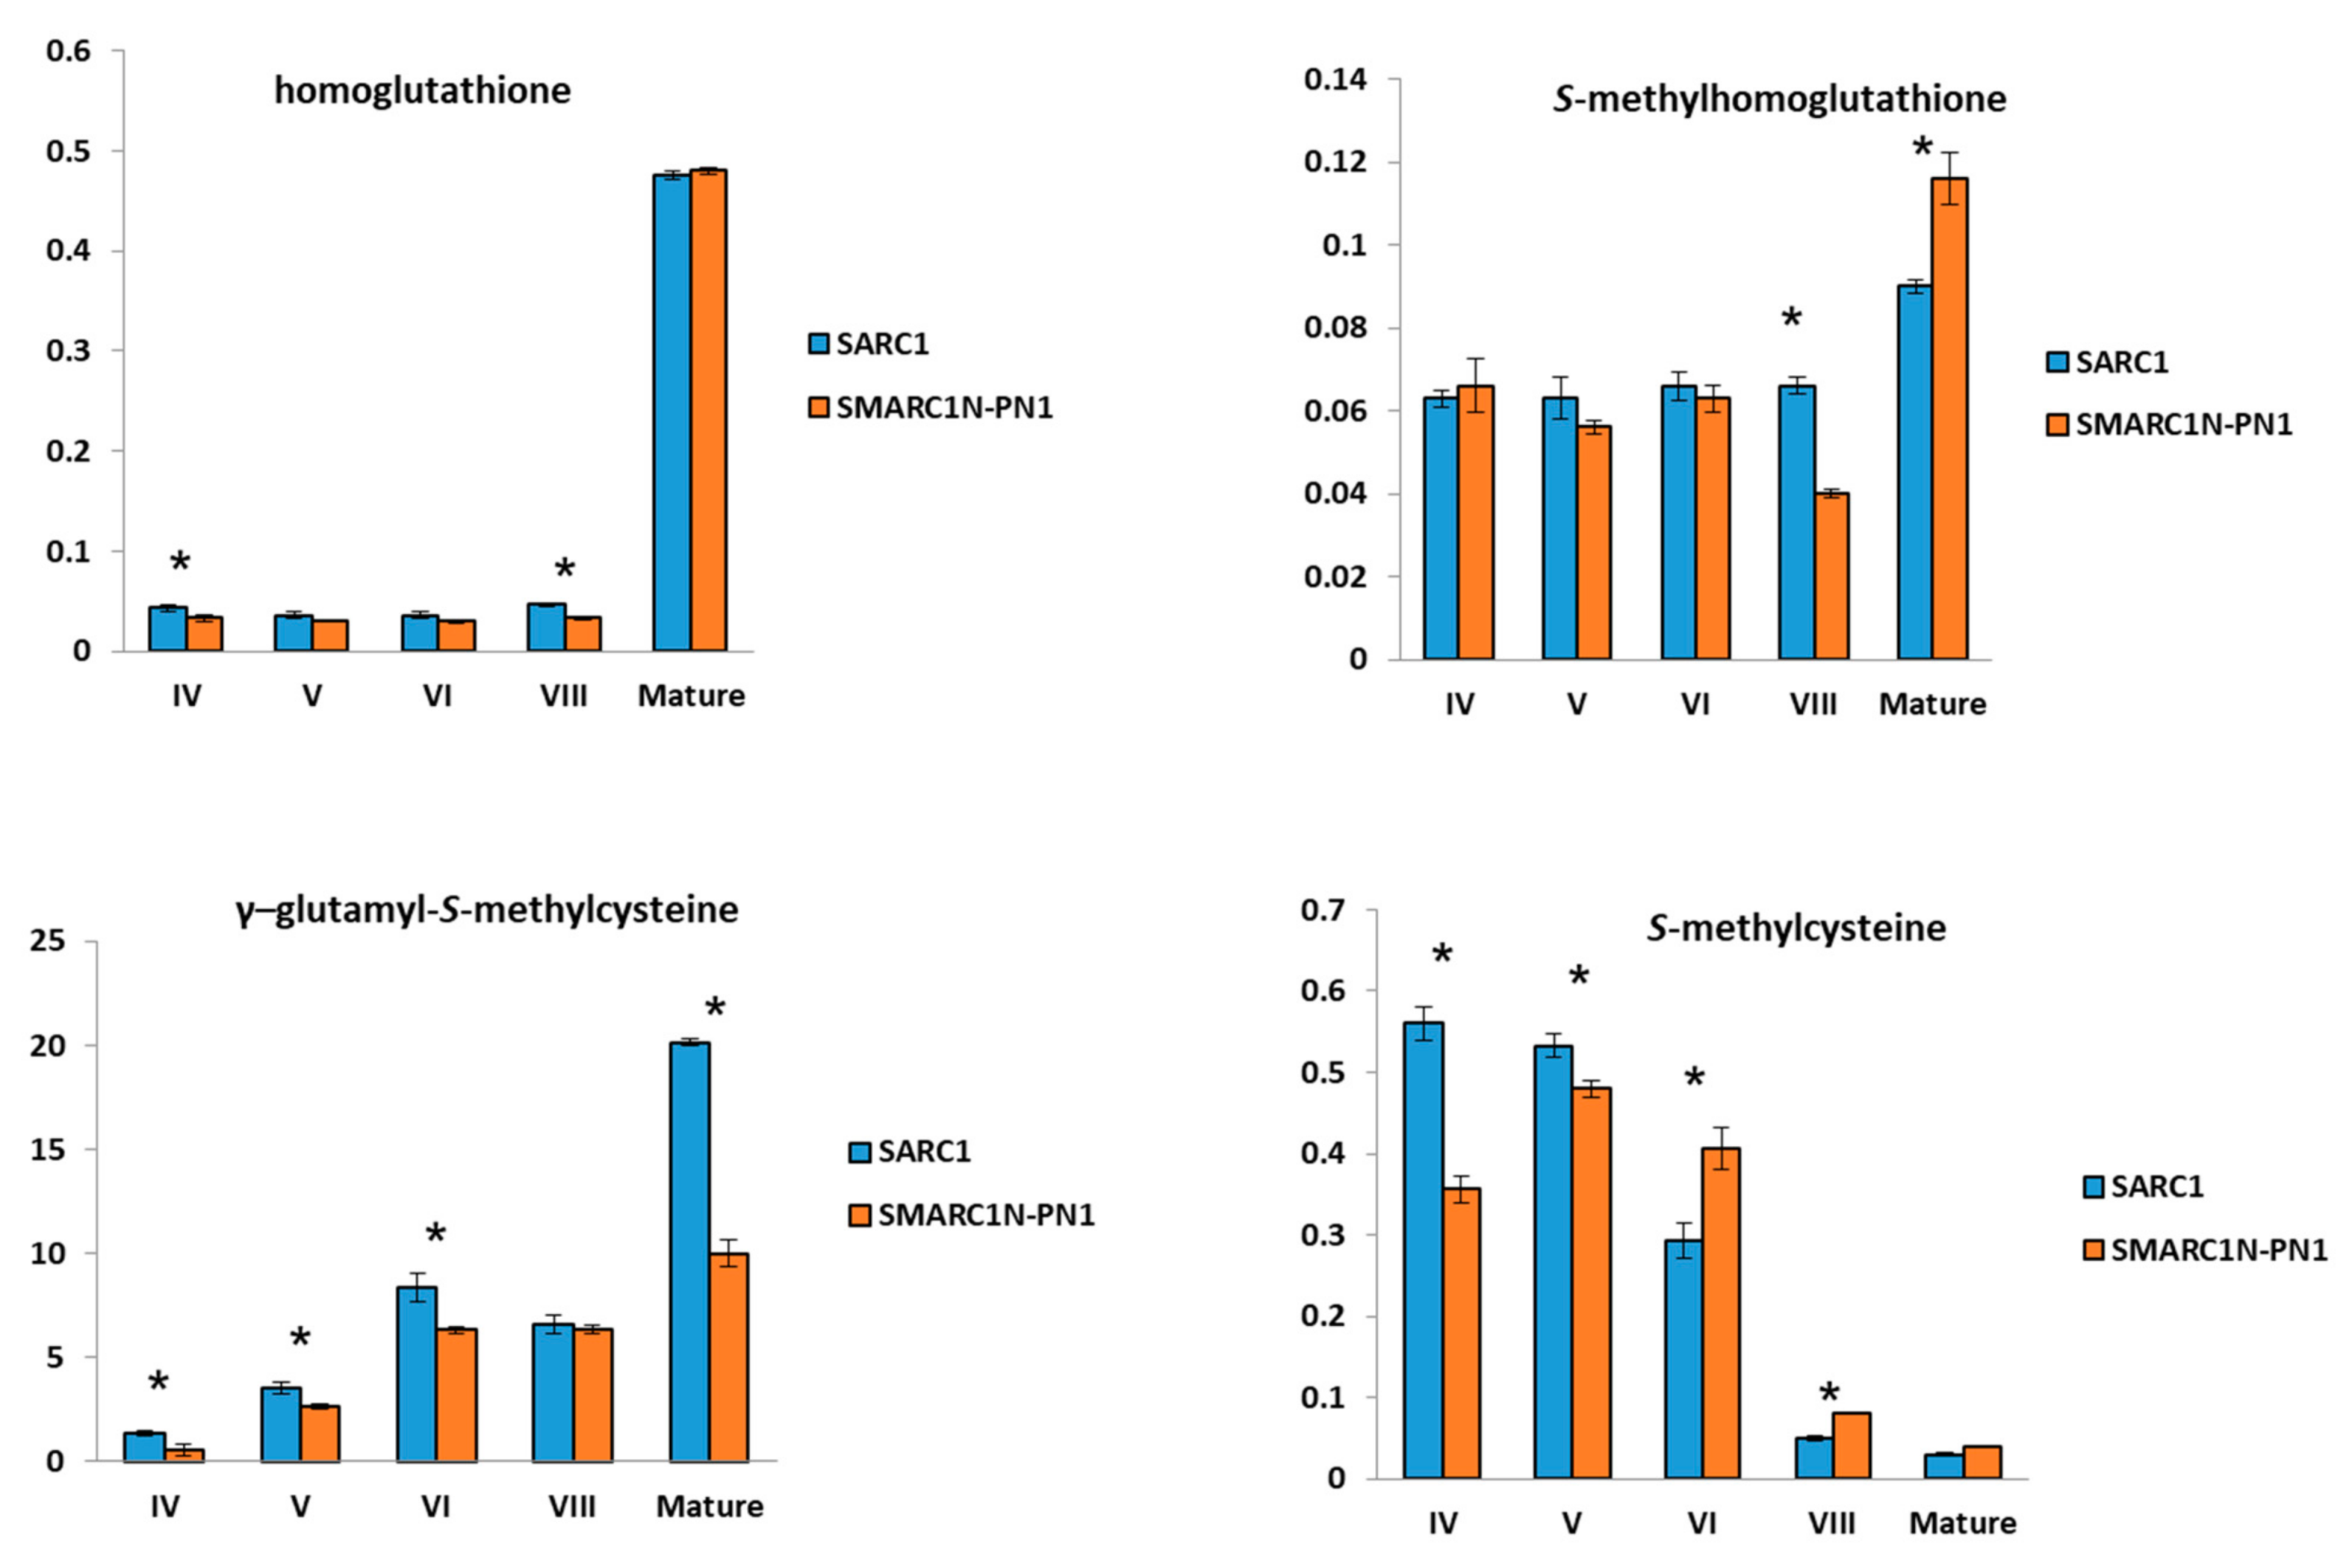
2.2. Differences in Sulfur Amino Acid Concentrations between SARC1 and SMARC1N-PN1 under Sulfate Sufficient Conditions

The same sulfur metabolites were quantified at five developmental stages between SARC1 and SMARC1N-PN1 under defined, sulfate sufficient conditions. Free amino acids had been profiled before in SARC1 and SMARC1N-PN1, however, the levels of homoglutathione and S-methylhomoglutathione had not been determined [27]. The work by Pandurangan et al. [43] indicated that 2 mM is a suitable sulfate-sufficient concentration, at which the two genotypes accumulate different levels of total S-methylcysteine after hydrolysis. As expected, levels of γ-glutamyl-S-methylcysteine were higher in SARC1 than SMARC1N-PN1, at four out of five developmental stages (Figure 2). Similar to what was previously observed, the levels of free S-methylcysteine were higher in SARC1 than SMARC1N-PN1 at early developmental stages, when concentrations are most elevated. The concentration of S-methylhomoglutathione was higher in SMARC1N-PN1 at maturity, consistent with a reduced use of the putative γ-glutamyl-S-methylcysteine precursor in this genotype. Homoglutathione concentration was higher in SARC1 at stages IV and VIII, and S-methylhomoglutathione concentration at stage VIII, suggesting a possible enhanced flux through these putative precursors at these developmental stages.

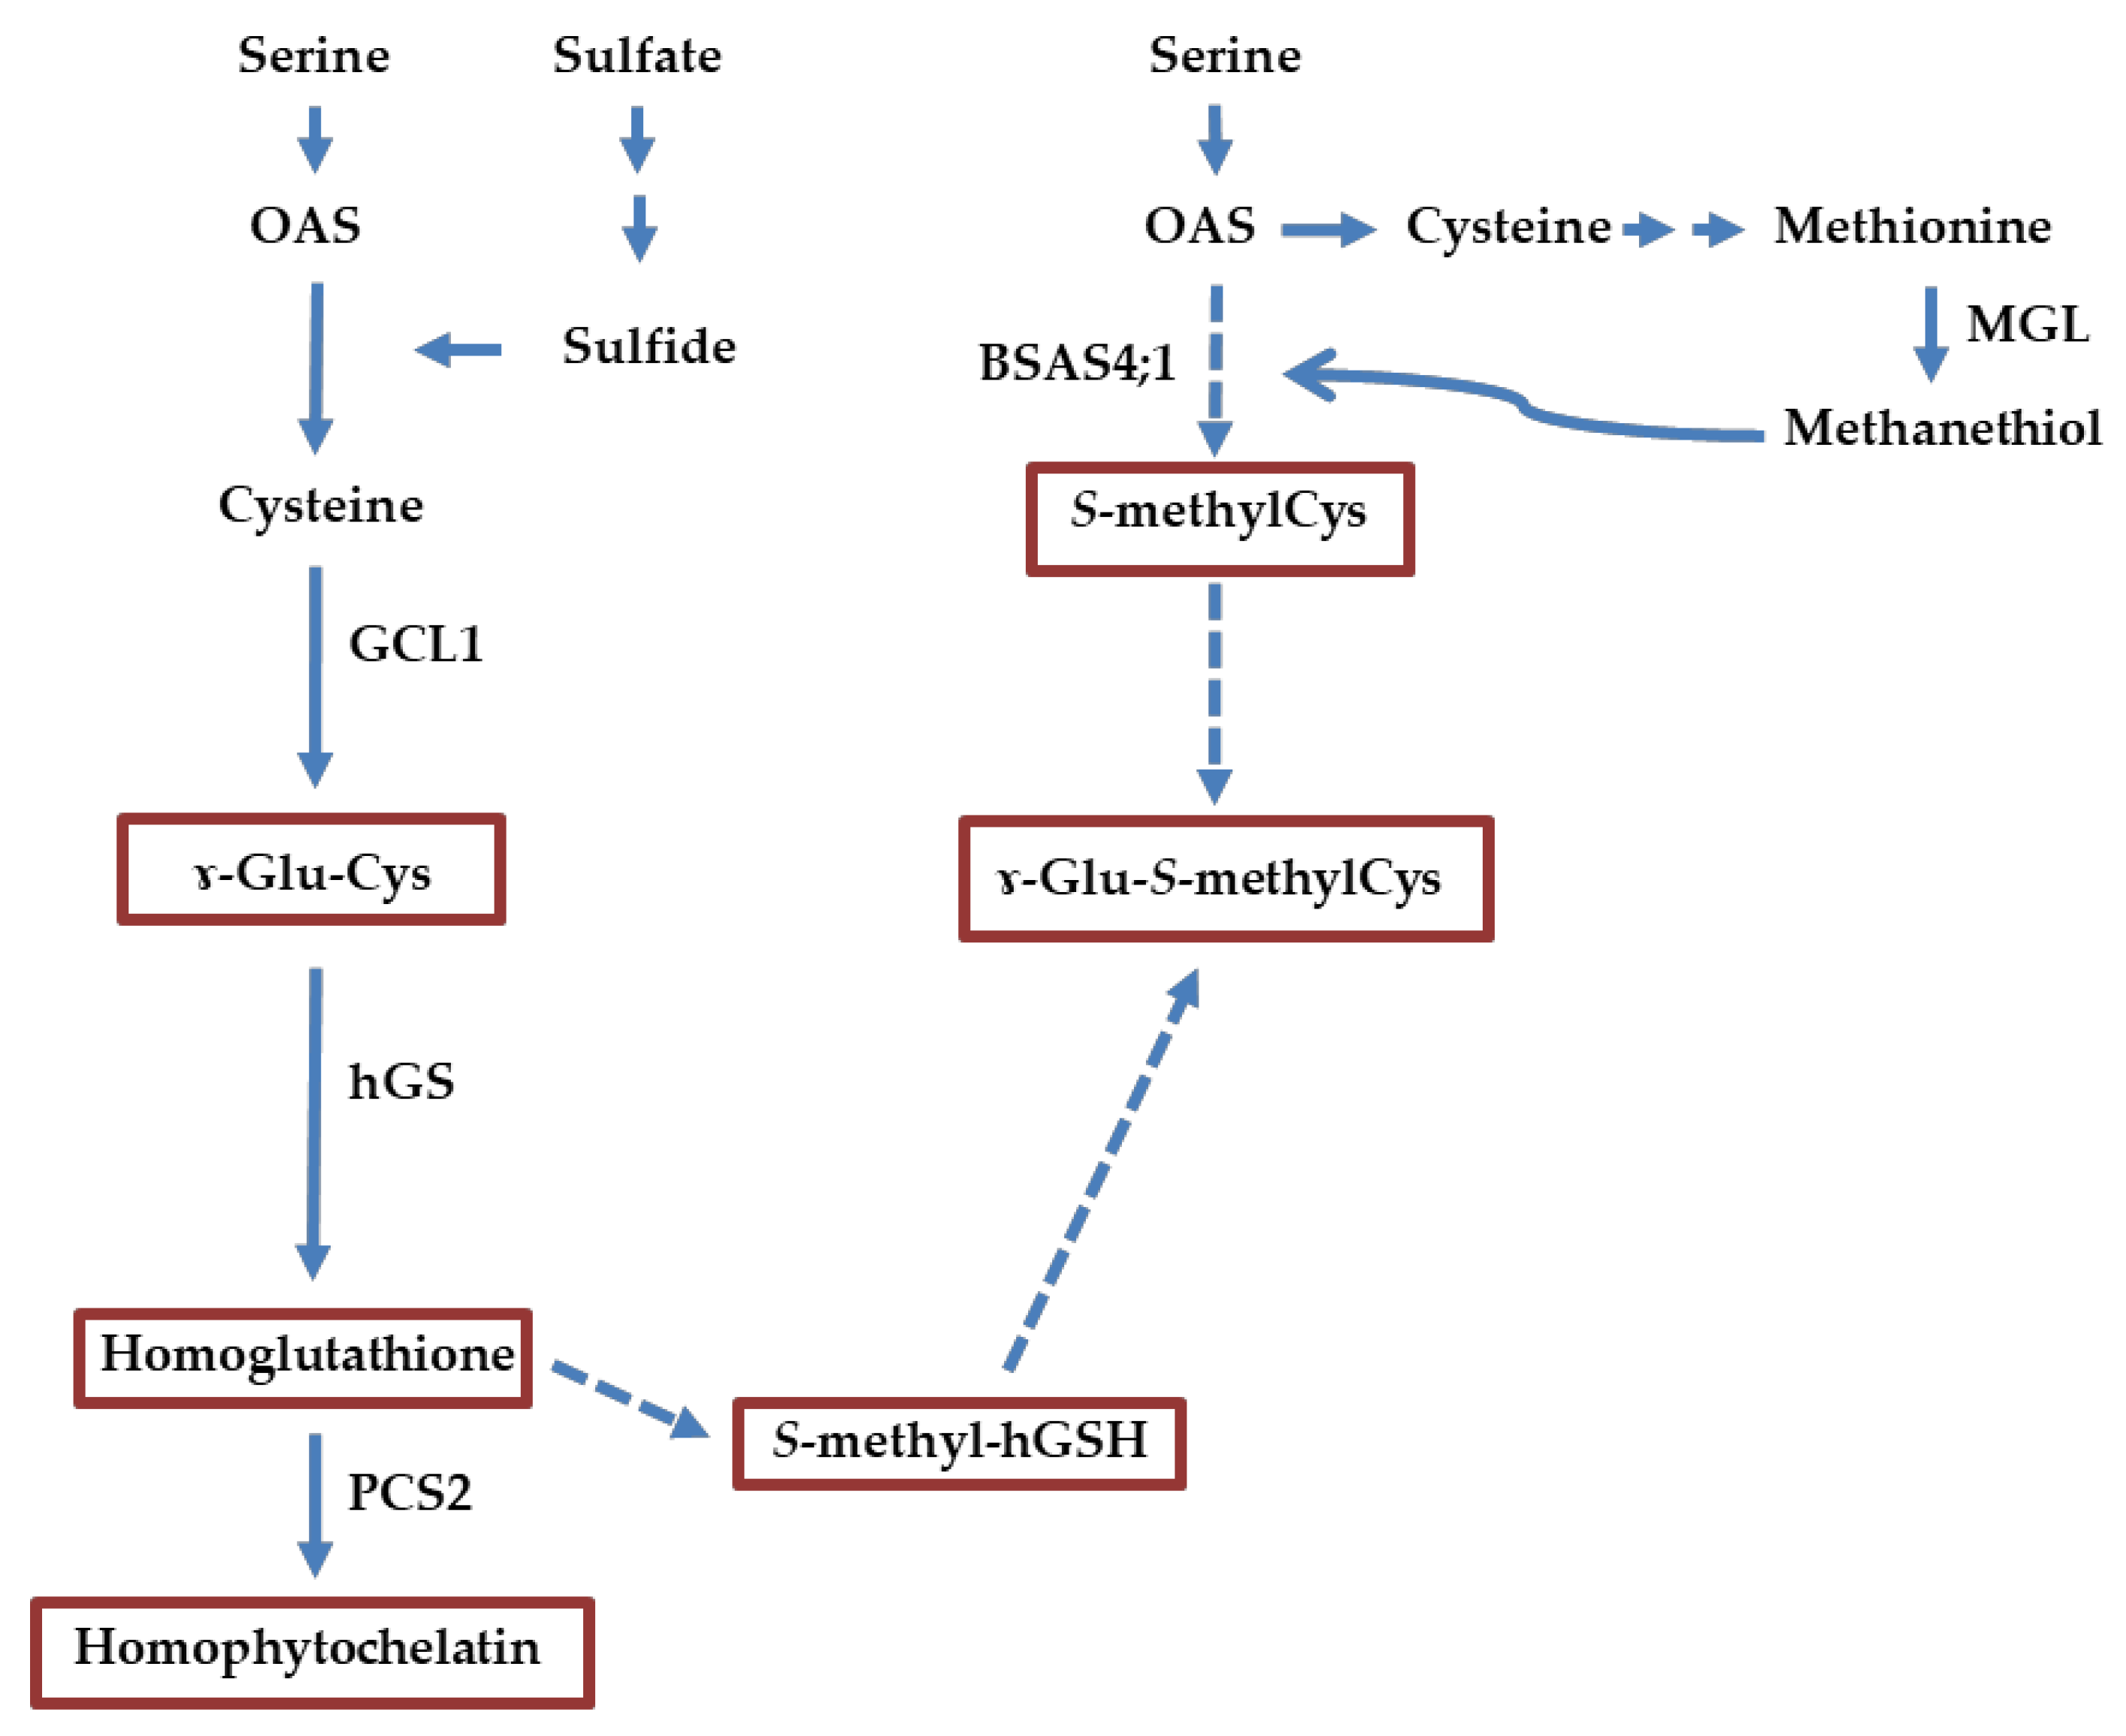
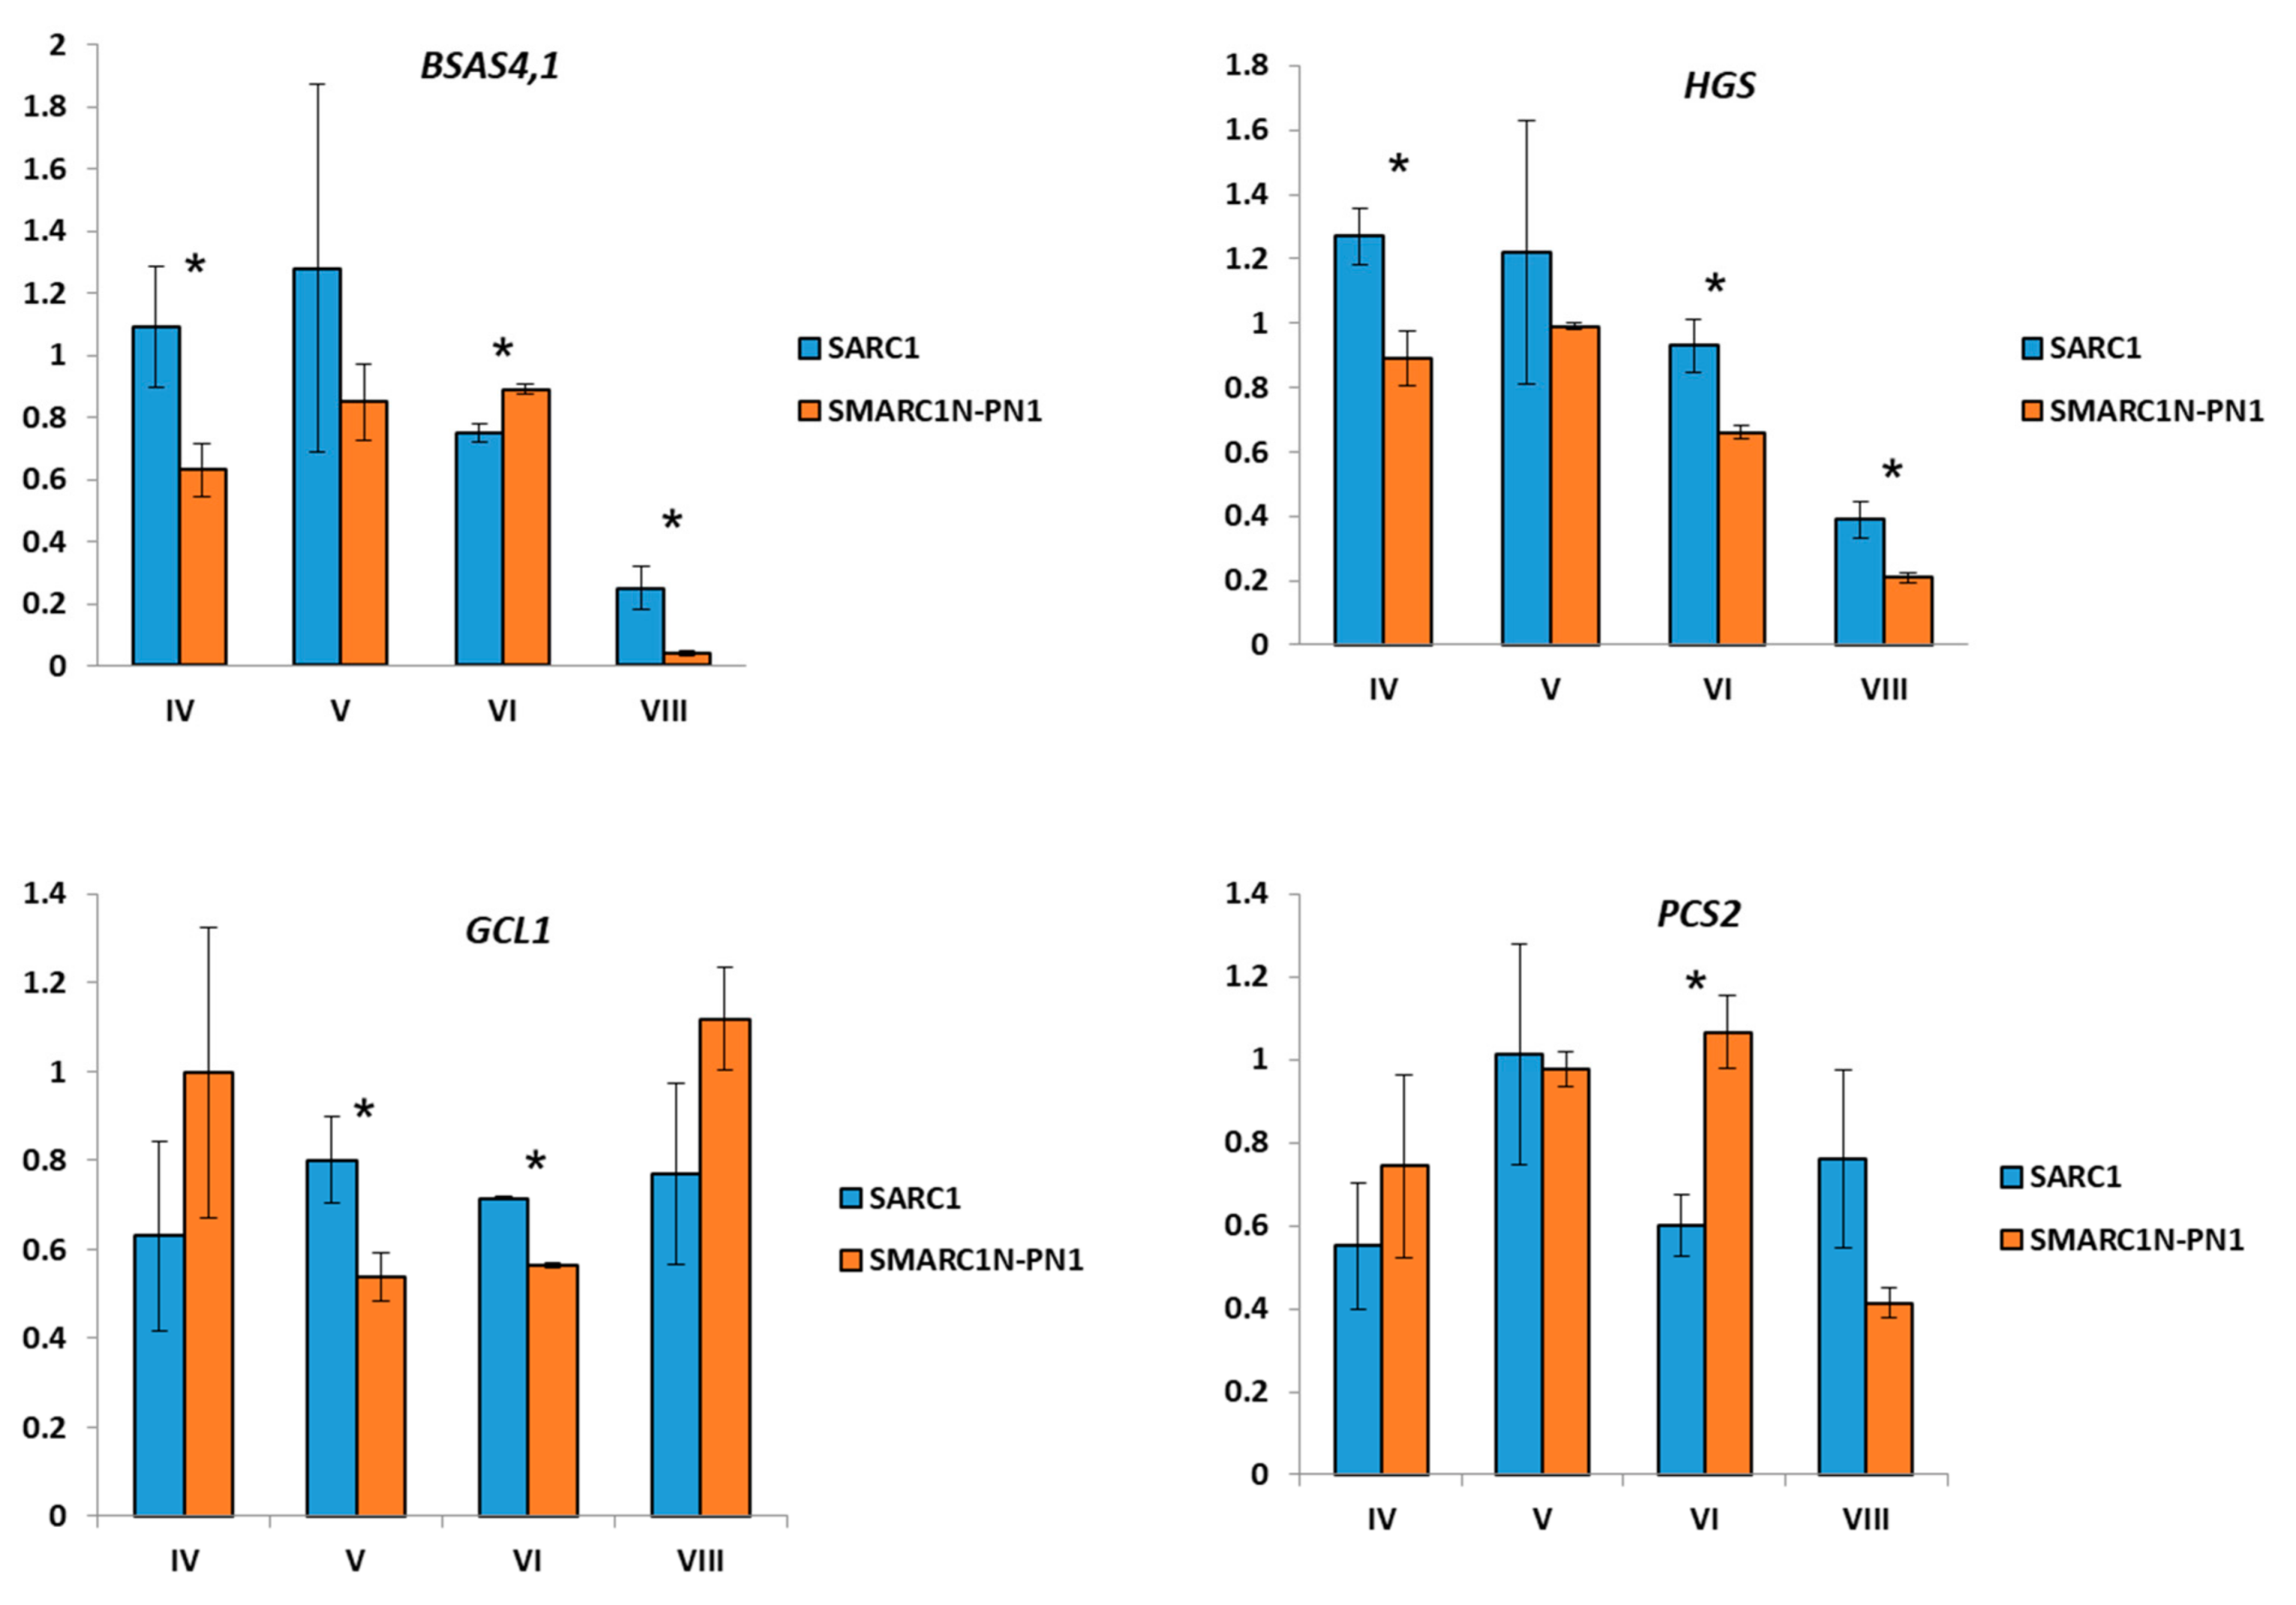
2.3. Expression Analysis of Genes Related to S-Methylcysteine and γ-Glutamyl-S-methylcysteine Biosynthesis

The expression patterns of candidate genes related with the biosynthesis or metabolism of S-methylcysteine or γ-glutamyl-S-methylcysteine, BSAS4;1, GCL1, hGS and PCS2, were examined (Figure 3). BSAS4;1 is the predominantly expressed cytosolic cysteine synthase gene in developing seeds [36]. There are two GCL genes in P. vulgaris. GCL2 is expressed at very low levels, whereas GCL1 and hGS expression is developmentally correlated (Pearson correlation coefficient = 0.85) (visualized at https://phytozome.jgi.doe.gov) [44]. Expression of the two glutathione synthetase (GS) genes is marginal, which explains the low level of accumulation of glutathione in P. vulgaris. Among two PCS genes, expression of PCS1 was very low. Attempts to detect its expression by reverse transcription quantitative polymerase chain reaction (RT-qPCR) were unsuccessful. Expression of BSAS4;1 was higher in SARC1 at the first developmental stage, which correlates with the higher levels of free S-methylcysteine (Figure 3). There was also a correlation between the levels of BSAS4;1 transcripts and free S-methylcysteine during development (Pearson correlation coefficient = 0.83 in SARC1 and 0.96 in SMARC1N-PN1). Expression of hGS was significantly higher in SARC1 at three out of four developmental stages and GCL1 at two developmental stages. This correlates with the higher levels of γ-glutamyl-S-methylcysteine in this genotype. PCS2 transcript levels were higher in SMARC1N-PN1 at stage VI, opposite to what was observed for GCL1 and hGS.

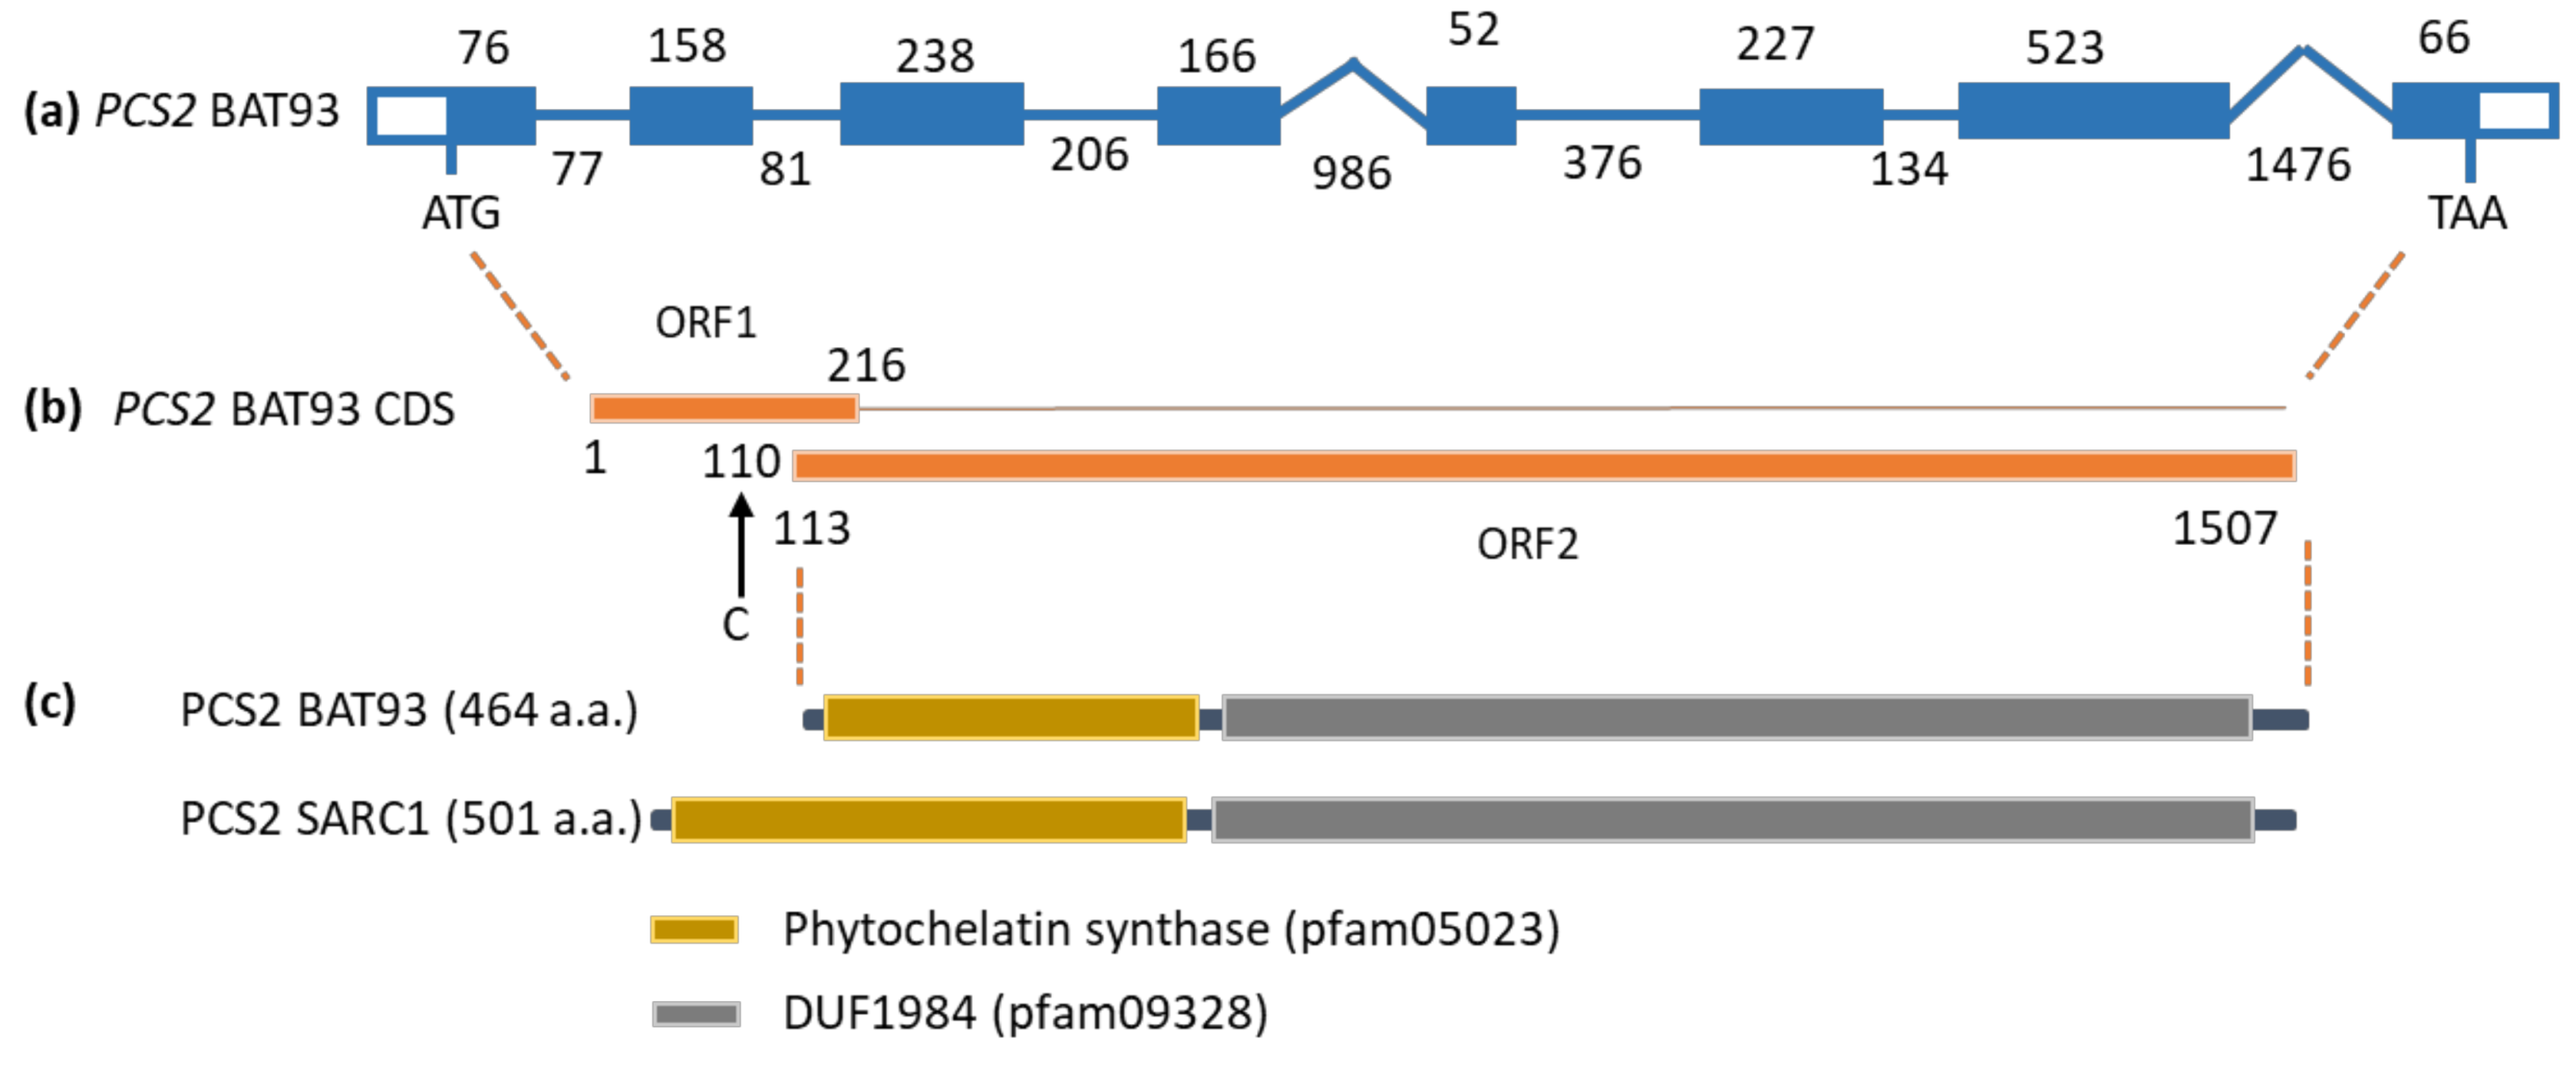
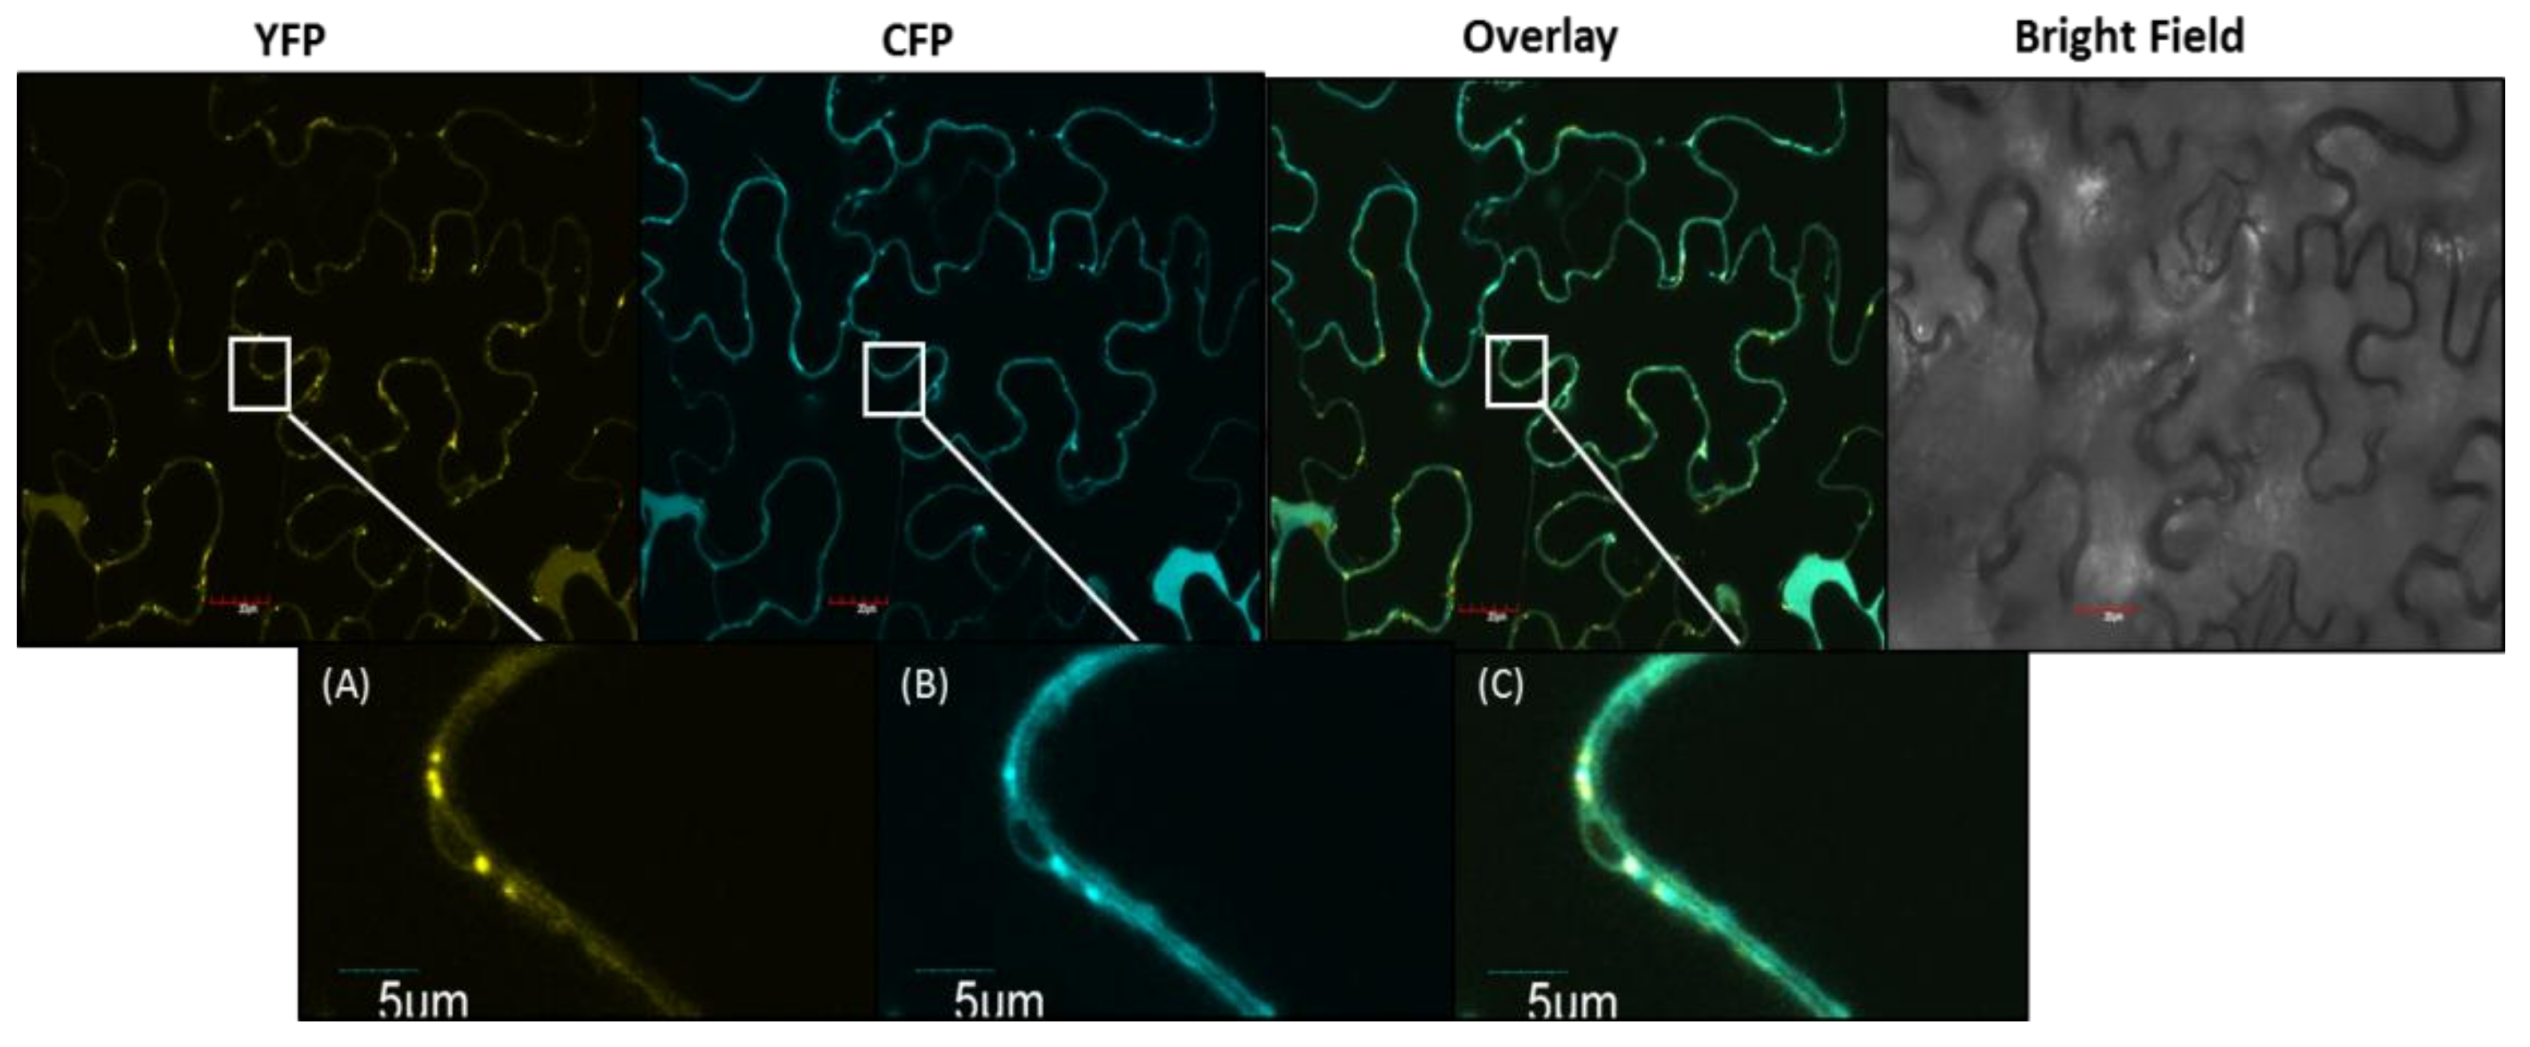
2.4. Subcellular Localization of PCS2

PCS2 is the major phytochelatin synthase gene expressed in developing seed. In vitro, S-methylglutathione can be used as substrate by phytochelatin synthase, in place of the metal thiolate complex with glutathione [45]. The subcellular localization of PCS2 may therefore determine whether S-methylated phytochelatins can accumulate in seed. While analyzing the PCS2 sequence from BAT93, a polymorphism specific to this genotype was uncovered which affects the length of the predicted PCS2 protein (Figure 4) [46]. This polymorphism was confirmed by RT-PCR and DNA sequencing. There is an insertion of a cytosine after position 109 downstream from the first start codon, as compared with the sequence from SARC1, SMARC1N-PN1 and the reference genome (accession G19833) [47]. The polymorphism results in a frameshift, such that PCS2 may only be translated from a downstream, alternative start codon, resulting in a shorter protein of 464 amino acid residues as compared with the longer PCS2 of 501 residues.
cDNAs encoding the long and short versions of PCS2 were cloned from SARC1 and constructs were made to express C-terminal yellow fluorescent protein (YFP) fusions transiently in Nicotiana benthamiana epidermal cells. Figure 5 shows representative results obtained with the longer version of the protein. When PCS2-YFP was co-expressed with a CFP-tagged mitochondrial marker protein, PCS2-YFP was co-localized with the marker to the mitochondria. Similar results were obtained with the shorter version of the protein.

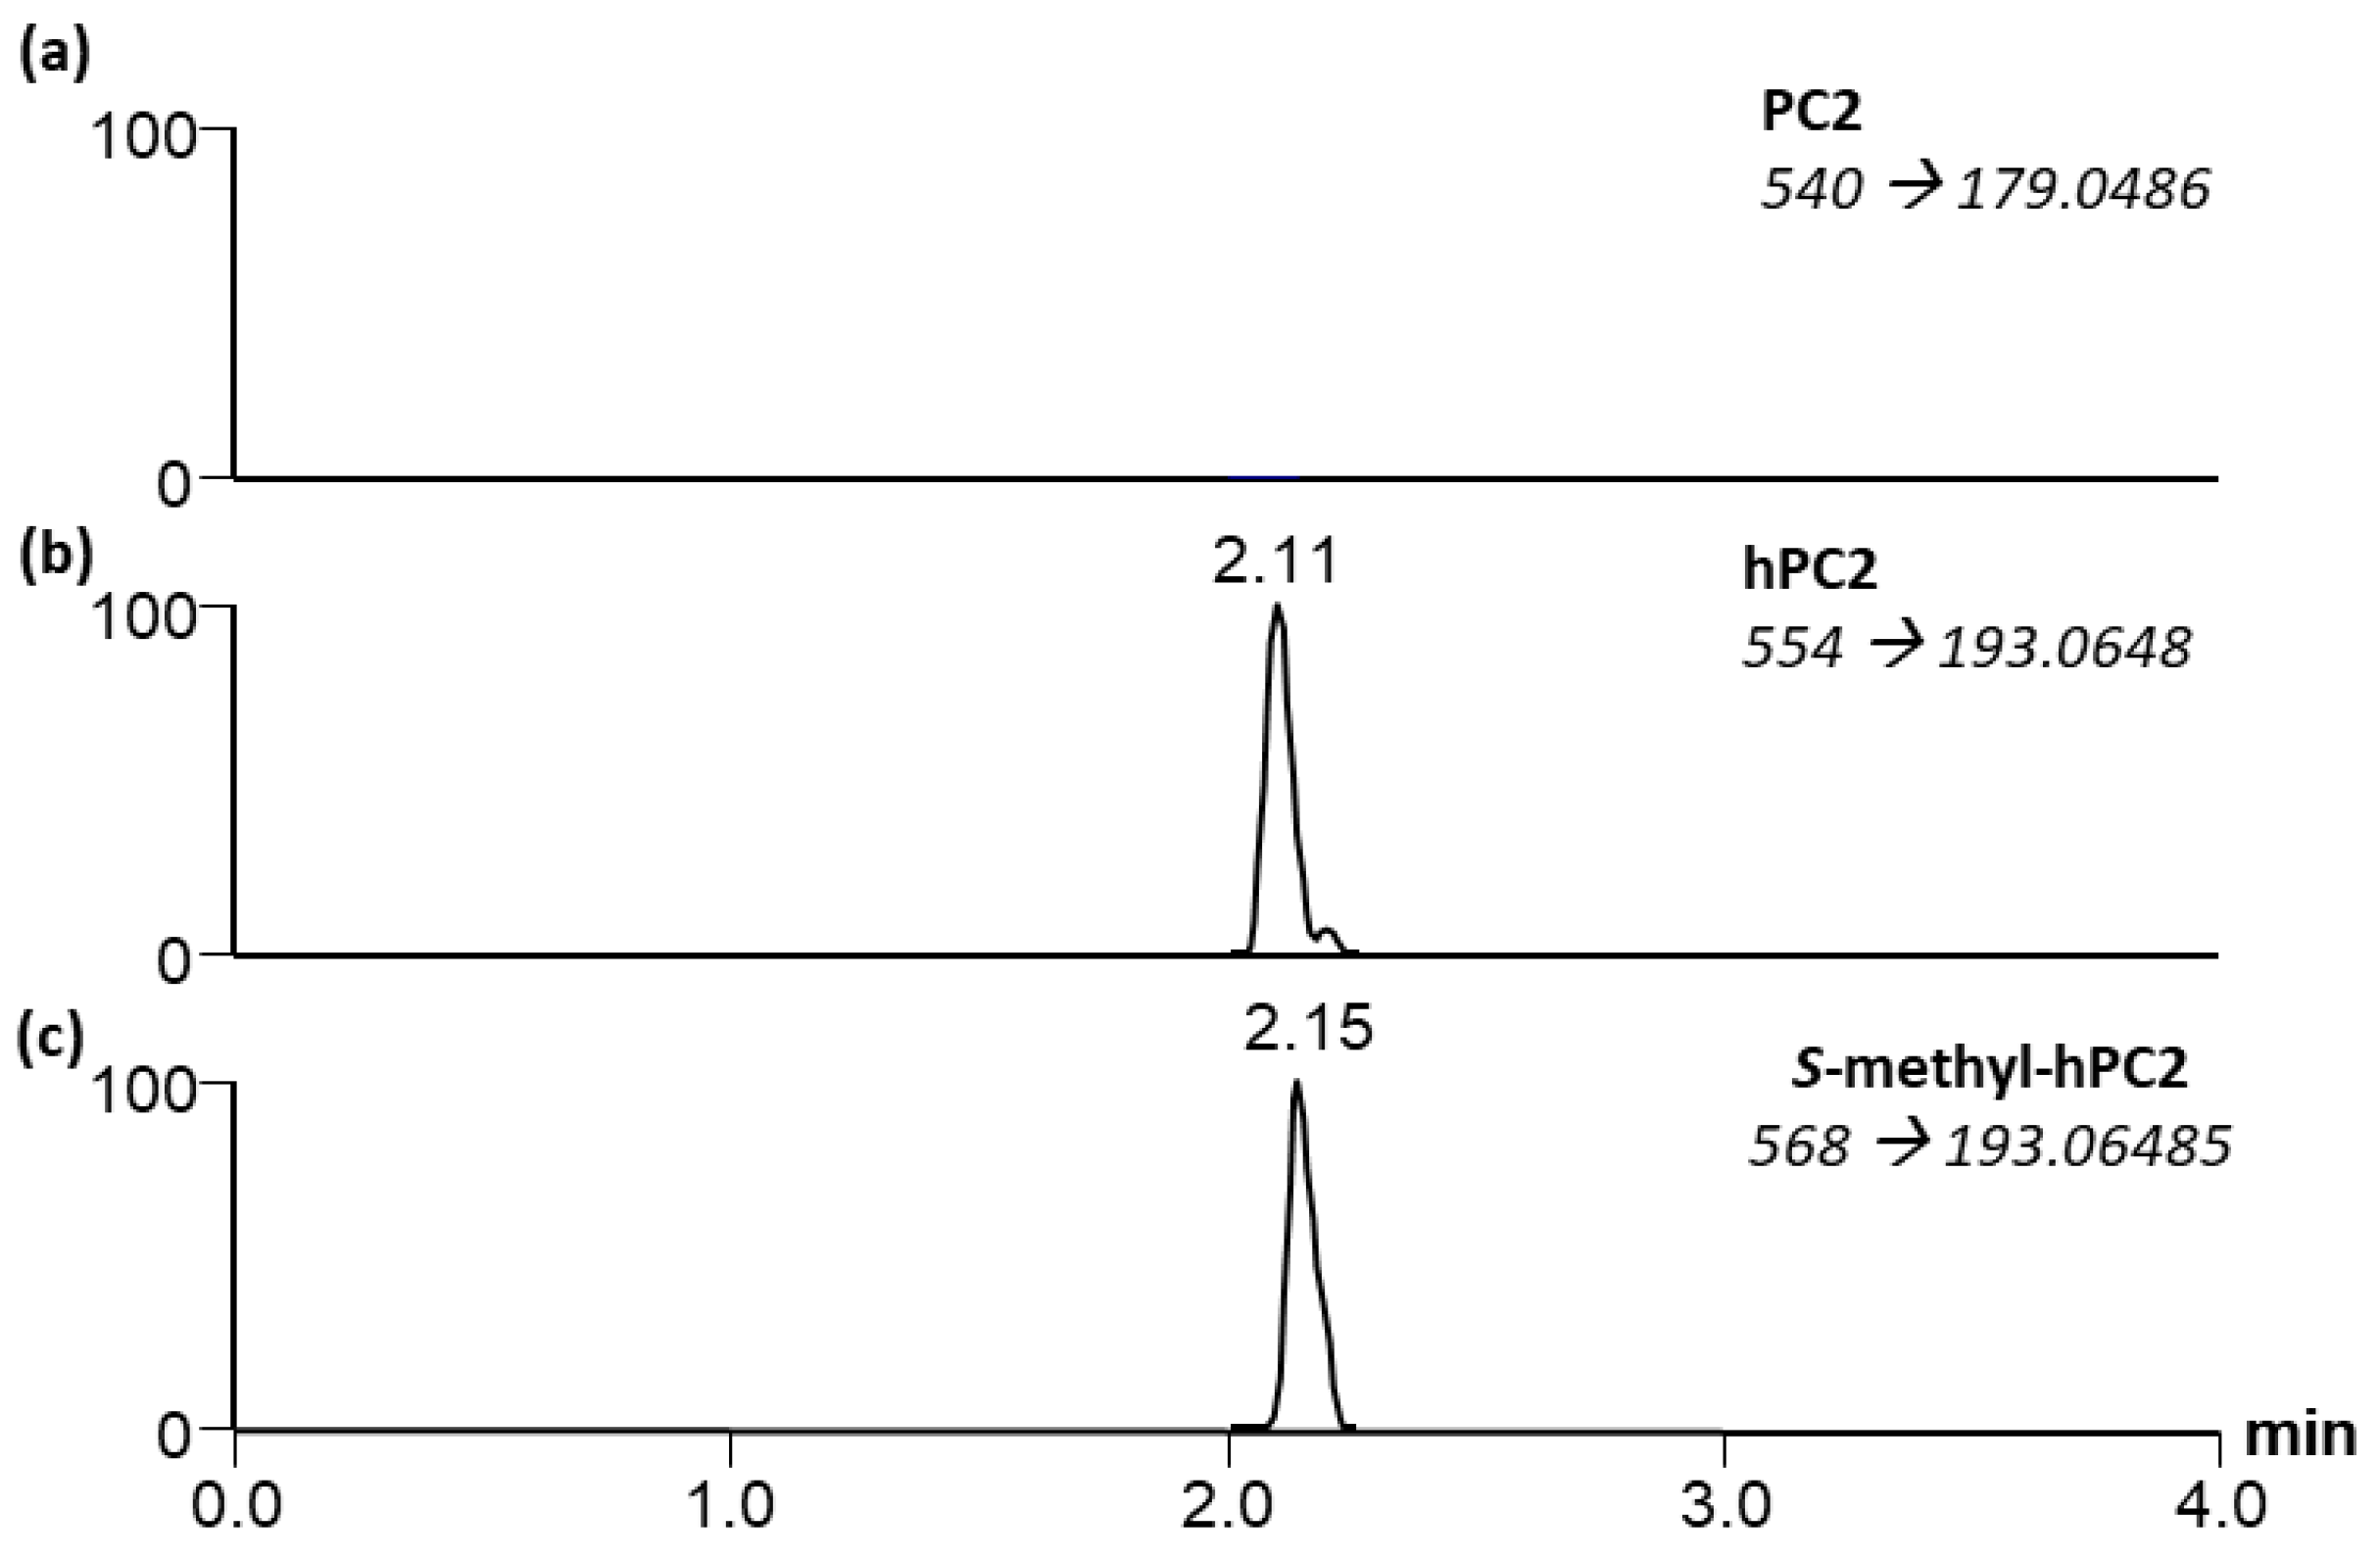
2.5. Analysis of S-Methylated Phytochelatins

To determine whether S-methylated phytochelatins could constitute a significant sink for S-methylcysteine, a systematic analysis of mature seed extracts from BAT93, SARC1 and SMARC1N-PN1 was performed by liquid chromatography and MS/MS. Similar results were obtained for the three genotypes. There are 12 distinct phytochelatins and homophytochelatins with 2–7 repeat units. However, allowing for the possibility that phytochelatins and homophytochelatins may incorporate variable numbers of S-methylcysteines instead of cysteines increases this number to 28 possible phytochelatins, homophytochelatins and S-methylated analogues (Table S1). The full MS data was screened for the theoretical m/z of these compounds (< 3 ppm). When putatively detected, the profiles were scrutinized for the presence of the 34S isotope and MS/MS was performed.
In these extracts, the most abundant compound based on relative peak areas was γ-glutamyl-S-methylcysteine, followed by homoglutathione and S-methylhomoglutathione. γ-Glutamylcysteine, S-methylglutathione and glutathione were present at lower concentrations. Homophytochelatin-2 and S-methylhomophytochelatin-2 with a single S-methylcysteine were detected (Figure 5). Their concentration was similar and in the same range as that of glutathione. Phytochelatin-2 was not detected (Figure 6a). A phytochelatin-2 that contains a single S-methylcysteine residue is isobaric with homophytochelatin-2 which contains an alanine residue in place of glycine and would not be distinguishable by high resolution MS. However, homophytochelatin and phytochelatin can be distinguished by their MS/MS product ions. Upon MS/MS, phytochelatins and homophytochelatins yield m/z 179.0486 and 193.0648 product ions, respectively. Within the analyzed samples, homophytochelatin-2 was detected and distinguished from S-methylphytochelatin-2 by observing this product ion (Figure 6b). Additionally, S-methylhomophytochelatin-2 with a single S-methyl group was detected with slightly more retention than homophytochelatin-2, as is expected by the additional methyl group (Figure 6c). Although a standard of S-methylhomophytochelatin-2 with two S-methyl cysteines was utilized, this compound was not detected in the seed extracts. No larger phytochelatin oligomers (<7) were detected within the samples by high resolution MS. Based on its low relative abundance, S-methylhomophytochelatin does not appear to constitute a major sink for S-methylcysteine.

3. Discussion

3.1. Most of the S-Methylcysteine Accumulates as γ-Glutamyl-S-methylcysteine in P. vulgaris Seed

The present study revisited the quantification of γ-glutamyl-S-methylcysteine in seed. Taylor et al. [20] reported that γ-glutamyl-S-methylcysteine accounted for only approximately 35% of total S-methylcysteine. Here, the final levels of γ-glutamyl-S-methylcysteine were about 3-fold higher than previously reported [14,35], in line with the concentration of total S-methylcysteine, measured after acid hydrolysis of mature seed flour, ranging from 14 to 35 nmol per mg seed weight [15,17,20]. We conclude that γ-glutamyl-S-methylcysteine accounts for most of the S-methylcysteine accumulated in mature seed. Giada et al. [14] determined that the average concentration of γ-glutamyl-S-methylcysteine was equal to 11 nmol per mg, with free S-methylcysteine accounting for the balance of the remaining 20% of total S-methylcysteine measured after acid hydrolysis. In the present study, a lower concentration of free S-methylcysteine was measured. The higher levels of free S-methylcysteine measured by Giada et al. [12] may have been due to partial hydrolysis of the dipeptide during extraction, or in vivo, such as during seed storage. The difference in γ-glutamyl-S-methylcysteine levels between BAT93 and SARC1 suggests that there may be substantial genetic variability for the concentration of this metabolite (Table 1 and Figure 2). In future, it may be useful to quantify γ-glutamyl-S-methylcysteine or total S-methylcysteine in a wide range of P. vulgaris accessions or cultivars.

3.2. The Concentration of Homoglutathione or S-Methylhomoglutathione does not Appear to Limit the Accumulation of γ-Glutamyl-S-Methylcysteine

S-Methylhomoglutathione concentration measured in mature seed of BAT93 in the present study was slightly higher than previously reported [18] and similar to that in Vigna radiata seeds [13]. Quantification of homoglutathione and S-methylhomoglutathione at different time points during seed development in SARC1 and SMARC1N-PN1 did not reveal major fluctuations with respect to the different levels of accumulation of the end-product, γ-glutamyl-S-methylcysteine (Figure 2). This is in contrast with the cysteine precursor, O-acetylserine, which was shown to be depleted in SMARC1N-PN1, in relation with the higher concentration of total cysteine in this genotype [27]. In BAT93, the decrease in S-methylhomoglutathione at early stages of seed development paralleled a rapid increase in γ-glutamyl-S-methylcysteine levels (Table 1).

3.3. Transcript Expression of BSAS4;1 and hGS is Correlated with the Accumulation of Free S-Methylcysteine and γ-Glutamyl-S-methylcysteine, Respectively

The product of BSAS4;1 is presumed to be directly involved in the formation of free S-methylcysteine. The developmental correlation between BSAS4;1 transcript levels and free S-methylcysteine concentration, observed in either SARC1 or SMARC1N-PN1 (Figure 2 and Figure 3), takes its meaning in this context. The positive genotypic correlation, observed at an early time point, when S-methylcysteine is at its highest levels, further implicates BSAS4;1 as a plausible candidate gene (Figure 2 and Figure 3). The higher levels of hGS transcript in SARC1 as compared with SMARC1N-PN1 at three out of four developmental stages (Figure 3) supports the idea that flux through homoglutathione synthetase may control, at least in part, γ-glutamyl-S-methylcysteine accumulation.

3.4. Mitochondrial Localization of PCS2 Prevents the Accumulation of S-methylated Phytochelatins

The presence of S-methylhomoglutathione throughout seed development raises the question of whether S-methylphytochelatins can accumulate in P. vulgaris. Analysis of PCS2, the major phytochelatin synthase gene expressed in seed, revealed a polymorphism in BAT93 which would result in alternative translation initiation at a downstream start codon (Figure 4). Determination of subcellular localization by confocal microscopy demonstrated that both variants are targeted to mitochondria (Figure 5). Information on the subcellular localization of plant phytochelatin synthases is relatively limited. Arabidopsis PCS1 was shown to be present in the cytosol [48], and rice PCS1 and PCS2 were also reported to be cytosolic [49]. In the yeast Schizosaccharomyces pombe, phytochelatin synthase is localized in mitochondria [50]. This is logical, given that heavy metal toxicity targets mitochondrial respiration [51]. A systematic analysis of S-methylated phytochelatins in seed extracts found S-methylhomophytochelatin with a single S-methylcysteine, at low levels (Figure 6 and Table S1). The present results suggest that the localization of PCS2 in mitochondria ensures that the formation of phytochelatins does not interfere with the accumulation of γ-glutamyl-S-methycysteine.
In conclusion, our results indicate that most of the S-methylcysteine accumulates as γ-glutamyl-S-methylcysteine in mature seed. Analysis of metabolite profiles and quantitative RT-PCR data for transcripts of candidate genes of S-methylcysteine metabolism supports the hypothesis that expression of BSAS4;1, encoding the major cytosolic synthase in seed, may regulate the accumulation of free S-methylcysteine, whereas expression of hGS may regulate the accumulation of γ-glutamyl-S-methylcysteine, through the provision of homoglutathione and S-methylhomoglutathione. The mitochondrial localization of PCS2, the major phytochelatin synthase expressed in seed, is a likely explanation for the lack of substantial accumulation of S-methylated homophytochelatins.

4. Materials and Methods

4.1. Plant Materials and Growth Conditions

Three genotypes of the common bean (Phaseolus vulgaris L.), SARC1, SMARC1N-PN1 and BAT93 were used to evaluate sulfur metabolite profiles. Seeds were sown in small trays containing vermiculite. Ten-day-old seedlings were transplanted to a bigger pot measuring 17 cm × 20 cm containing sand, perlite, and vermiculite in a 2:1:1 ratio. SARC1 and SMARC1N-PN1 plants were grown under sulfate sufficient conditions as described in previous works [43,52]. The sulfate solution included 0.2 mM K2SO4 and 1.8 mM MgSO4 with other nutrients as follows: 4.5 mM Ca(NO3)2, 1.7 mM K2HPO4, 4 μM MnSO4.H2O, 5 μM H3BO3, 10 μM FeEDTA, 0.25 μM CuSO4.5H2O, 1 μM ZnSO4.7H2O, and 0.2 μM Na2MoO4.2H2O. The BAT93 genotype was grown as previously described [35]. The pots used in the study were placed in a randomized block design with 15 plants per genotype. Each sample consisted of three biological replicates. A biological replicate consisted of a pool of 10 seeds collected randomly from 15 plants per genotype. Plants were grown in a greenhouse with 16 h light (300–400 μmol photons m−2 s−1) and 8 h dark with a temperature cycling between 18 and 24 °C.

4.2. Extraction and Quantification of Free Amino Acids

The frozen seeds in liquid nitrogen were ground to a fine powder using a mortar and pestle. Replicate samples consisted of independent pools of ten seeds of which 100 mg were used for extraction. Sample extraction was carried out in ethanol/water (70:30), optimal for sulfur containing γ-glutamyl dipeptides [20]. Standards for γ-glutamylcysteine, γ-glutamyl-S-methylcysteine, S-methylhomoglutathione, homoglutathione and S-methylhomophytochelatin-2 with two S-methylcysteines were from Bachem (Torrance, CA, USA). Homophytochelatin-2 and phytochelatin-3 standards were from Anaspec (Fremont, CA, USA). S-Methylglutathione was from Millipore Sigma (Oakville, ON, Canada). Quantification of free amino acids was performed after derivatization with O-phthalaldehyde and mercaptopropionic acid using an Agilent 1260 Infinity HPLC system (Mississauga, ON, Canada) as described in Jafari et al. [53].

4.3. RNA Extraction and Quantitative RT-PCR

Sequence analyses were performed using Phaseolus vulgaris v2.1, DOE-JGI and USDA-NIFA (http://phytozome.jgi.doe.gov/). Total RNA from the developmental seed samples was extracted using a modified lithium chloride method [54]. RNA was quantified with a NanoDrop 1000 (Thermo Fisher Scientific, https://www.thermofisher.com) and its quality evaluated from A260/A280 ratio. DNase I was used to remove DNA contamination that may have happened during the RNA extraction (Thermo Fisher Scientific). RNA quality was evaluated prior to cDNA synthesis by using gel electrophoresis on a 1% (w/v) agarose gel. cDNA synthesis and PCR procedures were performed using Thermoscript RT-PCR System (Thermo Fisher Scientific) and SsoFast EvaGreen Supermix (Bio-Rad Laboratories, Mississauga, ON, Canada), respectively. Primers used for RT-qPCR are listed in Table 2. Reactions contained 2 µL of cDNA diluted 5-fold, primers at a concentration of 0.5 µM and 5 µL SsoFast EvaGreen Supermix in a final volume of 10 µL. Samples were run in Hard-Shell 96-well clear PCR plates (Bio-Rad Laboratories). In each plate, three biological replicates, with three technical replicates per biological replicate and controls without template were run for developmental seed samples. The PCR program consisted in an initial step of 2 min at 95 °C, followed by 35 cycles of 30 s at 94 °C and 30 s at 60 °C. CFX Maestro software was used to analyze the RT-qPCR data. After completion of the reactions, the threshold fluorescence (Cq) value for each reaction was calculated. All data were normalized using the expression of the ubiquitin reference gene. The specificity of primer pairs was confirmed by melt curve analysis in comparison with controls without template. PCR efficiency was calculated from a standard curve of Cq versus the logarithm of starting template quantity. Each assay was optimized so that the efficiency ranged between 98% and 108%, with a coefficient of determination (R2) > 0.98.

4.4. Cloning of PCS2 for Subcellular Localization

The coding sequence of PCS2 was PCR amplified using attB1 and attB2 site-containing Gateway primers from SARC1 cDNA. For the full-length version, primers were, PVPCS2-ATTB1YFPF, 5’-GGGGACAAGTTTGTACAAAAAAGCAGGCTTCATGTGCATGGCGAACCCAG-3’ and PVPCS2-ATTB1YFPR, 5’-GGGGACCACTTTGTACAAGAAAGCTGGGTTCCGCTGCACAGTCCAGATTGCT-3’. For the short variant using the alternative downstream start codon, the forward primer was PCS2-ATTB1YFPF, 5’-GGGGACAAGTTTGTACAAAAAAGCAGGCTTCATGGAAGCCTTCTTCAAGC-3’. The PCR products were inserted into the entry vector pDONR-Zeo (Thermo Fisher Scientific). The integrity of the PCR fragments was confirmed with Sanger sequencing. Using Gateway technology, LR recombination reactions were performed with entry clones pDONR-Zeo-PCS2fl and pDONR-Zeo-PCS2tr and destination vector pEarleyGate101 [55]. The final expression constructs (pEG101-PCS2fl and pEG101-PCS2tr) were transformed into Agrobacterium tumefaciens strain GV3101.

4.5. Plant Transformation and Confocal Observations

Nicotiana benthamiana plants were grown for 6 weeks and used for transient expression. Plants were grown in a growth chamber at 22 °C with a 16 h photoperiod (110 µmol photons m−2 s−1). Plants were always watered with the water soluble fertilizer (N:P:K = 20:8:20) at 0.25 g/L (Plant Products, Brampton, ON, Canada). Agrobacterium tumefaciens cultures were grown to an optical density at 600 nm (OD600) of 0.5–0.8, and collected by centrifugation at 3,000 × g for 30 min. The pellets were resuspended in Gamborg’s solution (3.2 g/L Gamborg’s B5 medium and vitamins, 20 g/L sucrose, 10 mM 2-(N-morpholino)ethanesulfonic acid pH 5.6, 200 µM acetosyringone) to a final OD600 of 1, followed by incubation at room temperature (21 °C) with gentle agitation for 1 h. For co-infiltration, the mitochondrial protein (cytochrome oxidase with CFP) was mixed with YFP construct (pEG101-PCS2) in a 1:1 ratio [56]. The suspension was used for co-infiltration of the abaxial side of the leaf with a 1 mL syringe. Three to four days post infiltration, the abaxial epidermis of the leaves was observed using an OLYMPUS FV1200 Laser Scanning Microscope (https://www.olympus-lifescience.com/). A 60 × water immersion objective was used at excitation wavelengths of 514 and 458 nm. The fluorescence signals were detected using an emission spectra of 530–560 nm for YFP and 470-500 nm for CFP. Sequential Scan Tool, which records fluorescence in a sequential fashion, was used for studying co-localization of PCS2 with marker protein.

4.6. Analysis of S-methylated Phytochelatins

Extraction of phytochelatins from mature seed tissue was performed according to a published method with slight modifications [57]. The mature seed samples were ground with a Kleco ball mill (Garcia Machine, Visalia, CA, USA). One hundred mg of powder was mixed with 1 mL of cold (4 °C) 100 mM dithiothreitol in a polypropylene centrifuge tube. The suspension was vortexed for 1 min, and then sonicated for 5 min at room temperature. The extract was precipitated by centrifugation at 15,000× g at 4 °C for 20 min. The supernatants were transferred to a polypropylene centrifuge tube and the centrifugation repeated one more time. The supernatants were filtered with PTFE syringe filters (0.22 µm) into 2 mL amber glass HPLC vials.
The extracts were screened using a Q-Exactive Quadrupole Orbitrap mass spectrometer (Thermo Fisher Scientific), coupled to an Agilent 1290 high-performance liquid chromatography (HPLC) system with a Zorbax Eclipse Plus RRHD C18 column maintained at 35 °C (2.1 × 50 mm, 1.8 µm; Agilent). Mobile phase A (0.1% formic acid in LC-MS grade H2O, Thermo Fisher Scientific) began at 100% and was held for 1.25 min. Mobile phase B (0.1% formic acid in LC-MS grade acetonitrile, Thermo Fisher Scientific) was then increased to 50% over 1.75 min, and 100% over 0.5 min. Mobile phase B was maintained at 100% for 1.5 min and returned to 0% over 0.5 min. The following heated electrospray ionization (HESI) parameters were used in positive ionization mode: spray voltage, 3.9 kV; capillary temperature, 250 °C; probe heater temperature, 450 °C; sheath gas, 30 arbitrary units; auxiliary gas, 8 arbitrary units; and S-Lens RF level, 60%. High resolution, full MS was used to detect any possible phytochelatins and homophytochelatins (PC2-7) by accurate mass (Table S1), while MS/MS scans performed concurrently monitored PC2 (m/z 540 → 179.0486), homoPC2 (m/z 554 → 193.0648) and S-methyl-homoPC2 (m/z 568 → 193.0648) all at normalized collision energies (NCE) of 24. The full MS scans were performed at 70,000 resolution over a mass range of 100–2000 m/z; automatic gain control (AGC) target and maximum injection time (max IT) was 3 × 10⁶ and 256 msecond respectively. The MS/MS scans were performed at 17,500 resolution AGC target and max IT were 3 × 10⁶ and 64 msecond respectively. Data were analyzed and all theoretical masses were calculated with Xcalibur™ software.

4.7. Statistical Analysis

The experiments were carried out as a factorial in a completely randomized experimental design with three replications. t-Test was performed using IBM SPSS® software (Armonk, NY, USA).

Supplementary Materials

Table S1. Monitoring of phytochelatin ions in MS/MS data.

Author Contributions

E.S.-R., A.P. and J.R. performed the experiments. J.J. and F.M. designed the research. M.S., M.M. and F.M. supervised E.S.-R. E.S.-R., A.P., J.R. and F.M. analyzed the data. E.S.-R., J.R. and F.M. wrote the manuscript.

Funding

This research was funded by Agriculture and Agri-Food Canada (project no. J-001331). E.S.-R. received funding from the Ministry of Science, Research and Technology of Iran. J.J. was the recipient of the Dr. René Roth Memorial Award during her Ph. D. studies in the Department of Biology of the University of Western Ontario.

Acknowledgments

We thank Mark Bernards for acting as J.J.’s co-supervisor during her Ph. D. program and Alex Molnar for help with figures.

Conflicts of Interest

The authors declare no conflict of interest.

References

  1. Campos-Vega, R.; Reynoso-Camacho, R.; Pedraza-Aboytes, G.; Acosta-Gallegos, J.; Guzman-Maldonado, S.; Paredes-Lopez, O.; Oomah, B.; Loarca-Piña, G. Chemical composition and in vitro polysaccharide fermentation of different beans (Phaseolus vulgaris L.). J. Food Sci. 2009, 74, T59–T65. [Google Scholar] [CrossRef] [PubMed]
  2. Mojica, L.; de Mejía, E.G. Characterization and comparison of protein and peptide profiles and their biological activities of improved common bean cultivars (Phaseolus vulgaris L.) from Mexico and Brazil. Plant Foods Hum. Nutr. 2015, 70, 105–112. [Google Scholar] [CrossRef] [PubMed]
  3. Ganesan, K.; Xu, B. Polyphenol-rich dry common beans (Phaseolus vulgaris L.) and their health benefits. Int. J. Mol. Sci. 2017, 18, 2331. [Google Scholar] [CrossRef]
  4. Chen, Y.; Zhang, H.; Liu, R.; Mats, L.; Zhu, H.; Pauls, K.P.; Deng, Z.; Tsao, R. Antioxidant and anti-inflammatory polyphenols and peptides of common bean (Phaseolus vulgaris L.) milk and yogurt in Caco-2 and HT-29 cell models. J. Funct. Foods 2019, 53, 125–135. [Google Scholar] [CrossRef]
  5. Chen, P.X.; Zhang, H.; Marcone, M.F.; Pauls, K.P.; Liu, R.; Tang, Y.; Zhang, B.; Renaud, J.B.; Tsao, R. Anti-inflammatory effects of phenolic-rich cranberry bean (Phaseolus vulgaris L.) extracts and enhanced cellular antioxidant enzyme activities in Caco-2 cells. J. Funct. Foods 2017, 38, 675–685. [Google Scholar] [CrossRef]
  6. Nguyen, H.C.; Hoefgen, R.; Hesse, H. Improving the nutritive value of rice seeds: Elevation of cysteine and methionine contents in rice plants by ectopic expression of a bacterial serine acetyltransferase. J. Exp. Bot. 2012, 63, 5991–6001. [Google Scholar] [CrossRef]
  7. Xiang, X.; Wu, Y.; Planta, J.; Messing, J.; Leustek, T. Overexpression of serine acetyltransferase in maize leaves increases seed-specific methionine-rich zeins. Plant Biotechnol. J. 2017. [Google Scholar] [CrossRef]
  8. Kim, W.S.; Chronis, D.; Juergens, M.; Schroeder, A.C.; Hyun, S.W.; Jez, J.M.; Krishnan, H.B. Transgenic soybean plants overexpressing O-acetylserine sulfhydrylase accumulate enhanced levels of cysteine and Bowman-Birk protease inhibitor in seeds. Planta 2012, 235, 13–23. [Google Scholar] [CrossRef]
  9. Galili, G.; Amir, R. Fortifying plants with the essential amino acids lysine and methionine to improve nutritional quality. Plant Biotechnol. J. 2013, 11, 211–222. [Google Scholar] [CrossRef]
  10. Chiaiese, P.; Ohkama-Ohtsu, N.; Molvig, L.; Godfree, R.; Dove, H.; Hocart, C.; Fujiwara, T.; Higgins, T.J.V.; Tabe, L.M. Sulphur and nitrogen nutrition influence the response of chickpea seeds to an added, transgenic sink for organic sulphur. J. Exp. Bot. 2004, 55, 1889–1901. [Google Scholar] [CrossRef] [Green Version]
  11. Zhang, Y.; Schernthaner, J.; Labbé, N.; Hefford, M.A.; Zhao, J.; Simmonds, D.H. Improved protein quality in transgenic soybean expressing a de novo synthetic protein, MB-16. Transgenic Res. 2014, 23, 455–467. [Google Scholar] [CrossRef] [PubMed]
  12. Van, K.; McHale, L.K. Meta-analyses of QTLs associated with protein and oil contents and compositions in soybean [Glycine max (L.) Merr.] seed. Int. J. Mol. Sci. 2017, 18, 1180. [Google Scholar] [CrossRef]
  13. Kasai, T.; Shiroshita, Y.; Sakamura, S. γ-Glutamyl peptides of Vigna radiata seeds. Phytochemistry 1986, 25, 679–682. [Google Scholar] [CrossRef]
  14. Giada, M.D.L.R.; Miranda, M.T.M.; Marquez, U.M.L. Sulphur γ-glutamyl peptides in mature seeds of common beans (Phaseolus vulgaris L.). Food Chem. 1998, 61, 177–184. [Google Scholar] [CrossRef]
  15. Baldi, G.; Salamini, F. Variability of essential amino acid content in seeds of 22 Phaseolus species. Theor. Appl. Genet. 1973, 43, 75–78. [Google Scholar] [CrossRef] [PubMed]
  16. Li, C.J.; Brownson, D.M.; Mabry, T.J.; Perera, C.; Bell, E.A. Nonprotein amino acids from seeds of Cycas circinalis and Phaseolus vulgaris. Phytochemistry 1996, 42, 443–445. [Google Scholar] [CrossRef]
  17. Evans, I.M.; Boulter, D. S-Methyl-L-cysteine content of various legume meals. Plant Foods Hum. Nutr. 1975, 24, 257–261. [Google Scholar] [CrossRef]
  18. Liao, D.; Cram, D.; Sharpe, A.G.; Marsolais, F. Transcriptome profiling identifies candidate genes associated with the accumulation of distinct sulfur γ-glutamyl dipeptides in Phaseolus vulgaris and Vigna mungo seeds. Front. Plant Sci. 2013, 4, 60. [Google Scholar] [CrossRef] [PubMed]
  19. Osborn, T.; Hartweck, L.; Harmsen, R.; Vogelzang, R.; Kmiecik, K.; Bliss, F. Registration of Phaseolus vulgaris genetic stocks with altered seed protein compositions. Crop Sci. 2003, 43, 1570–1572. [Google Scholar] [CrossRef]
  20. Taylor, M.; Chapman, R.; Beyaert, R.; Hernández-Sebastià, C.; Marsolais, F. Seed storage protein deficiency improves sulfur amino acid content in common bean (Phaseolus vulgaris L.): Redirection of sulfur from γ-glutamyl-S-methyl-cysteine. J. Agric. Food Chem. 2008, 56, 5647–5654. [Google Scholar] [CrossRef]
  21. Padovese, R.; Kina, S.M.; Barros, R.M.C.; Borelli, P.; Marquez, U.M.L. Biological importance of γ-glutamyl-S-methylcysteine of kidney bean (Phaseolus vulgaris L.). Food Chem. 2001, 73, 291–297. [Google Scholar] [CrossRef]
  22. Hawkesford, M.J.; De Kok, L.J. Managing sulphur metabolism in plants. Plant Cell Environ. 2006, 29, 382–395. [Google Scholar] [CrossRef] [Green Version]
  23. Takahashi, H.; Watanabe-Takahashi, A.; Smith, F.W.; Blake-Kalff, M.; Hawkesford, M.J.; Saito, K. The roles of three functional sulphate transporters involved in uptake and translocation of sulphate in Arabidopsis thaliana. Plant J. 2000, 23, 171–182. [Google Scholar] [CrossRef]
  24. Hell, R.; Wirtz, M. Molecular biology, biochemistry and cellular physiology of cysteine metabolism in Arabidopsis thaliana. Arabidopsis Book 2011, 9, e0154. [Google Scholar] [CrossRef]
  25. Smith, F.W.; Ealing, P.M.; Hawkesford, M.J.; Clarkson, D.T. Plant members of a family of sulfate transporters reveal functional subtypes. Proc. Natl. Acad. Sci. USA 1995, 92, 9373–9377. [Google Scholar] [CrossRef] [PubMed]
  26. Takahashi, H.; Kopriva, S.; Giordano, M.; Saito, K.; Hell, R. Sulfur assimilation in photosynthetic organisms: Molecular functions and regulations of transporters and assimilatory enzymes. Annu. Rev. Plant Biol. 2011, 62, 157–184. [Google Scholar] [CrossRef]
  27. Liao, D.; Pajak, A.; Karcz, S.R.; Chapman, B.P.; Sharpe, A.G.; Austin, R.S.; Datla, R.; Dhaubhadel, S.; Marsolais, F. Transcripts of sulphur metabolic genes are co-ordinately regulated in developing seeds of common bean lacking phaseolin and major lectins. J. Exp. Bot. 2012, 63, 6283–6295. [Google Scholar] [CrossRef] [PubMed] [Green Version]
  28. Hell, R.; Jost, R.; Berkowitz, O.; Wirtz, M. Molecular and biochemical analysis of the enzymes of cysteine biosynthesis in the plant Arabidopsis thaliana. Amino Acids 2002, 22, 245–257. [Google Scholar] [CrossRef]
  29. Bonner, E.R.; Cahoon, R.E.; Knapke, S.M.; Jez, J.M. Molecular basis of cysteine biosynthesis in plants: Structural and functional analysis of O-acetylserine sulfhydrylase from Arabidopsis thaliana. J. Biol. Chem. 2005, 280, 38803–38813. [Google Scholar] [CrossRef]
  30. Hatzfeld, Y.; Maruyama, A.; Schmidt, A.; Noji, M.; Ishizawa, K.; Saito, K. β-Cyanoalanine synthase is a mitochondrial cysteine synthase-like protein in spinach and Arabidopsis. Plant Physiol. 2000, 123, 1163–1172. [Google Scholar] [CrossRef]
  31. Hell, R.; Bergmann, L. γ-Glutamylcysteine synthetase in higher plants: Catalytic properties and subcellular localization. Planta 1990, 180, 603. [Google Scholar] [CrossRef] [PubMed]
  32. Hicks, L.M.; Cahoon, R.E.; Bonner, E.R.; Rivard, R.S.; Sheffield, J.; Jez, J.M. Thiol-based regulation of redox-active glutamate-cysteine ligase from Arabidopsis thaliana. Plant Cell 2007, 19, 2653–2661. [Google Scholar] [CrossRef]
  33. Yadav, S. Heavy metals toxicity in plants: An overview on the role of glutathione and phytochelatins in heavy metal stress tolerance of plants. S. Afr. J. Bot. 2010, 76, 167–179. [Google Scholar] [CrossRef] [Green Version]
  34. Oven, M.; Raith, K.; Neubert, R.H.; Kutchan, T.M.; Zenk, M.H. Homo-phytochelatins are synthesized in response to cadmium in azuki beans. Plant Physiol. 2001, 126, 1275–1280. [Google Scholar] [CrossRef]
  35. Yin, F.; Pajak, A.; Chapman, R.; Sharpe, A.; Huang, S.; Marsolais, F. Analysis of common bean expressed sequence tags identifies sulfur metabolic pathways active in seed and sulfur-rich proteins highly expressed in the absence of phaseolin and major lectins. BMC Genomics 2011, 12, 268. [Google Scholar] [CrossRef]
  36. O’Rourke, J.A.; Iniguez, L.P.; Fu, F.; Bucciarelli, B.; Miller, S.S.; Jackson, S.A.; McClean, P.E.; Li, J.; Dai, X.; Zhao, P.X.; et al. An RNA-Seq based gene expression atlas of the common bean. BMC Genomics 2014, 15, 866. [Google Scholar] [CrossRef] [PubMed]
  37. Rébeillé, F.; Jabrin, S.; Bligny, R.; Loizeau, K.; Gambonnet, B.; Van Wilder, V.; Douce, R.; Ravanel, S. Methionine catabolism in Arabidopsis cells is initiated by a γ-cleavage process and leads to S-methylcysteine and isoleucine syntheses. Proc. Natl. Acad. Sci. USA 2006, 103, 15687–15692. [Google Scholar] [CrossRef] [PubMed]
  38. Yoshimoto, N.; Saito, K. Biosynthesis of S-alk(en)yl-L-cysteine sulfoxides in Allium: Retro perspective. In Sulfur Metabolism in Higher Plants—Fundamental, Environmental and Agricultural Aspects; De Kok, L.J., Hawkesford, M.J., Haneklaus, S.H., Schnug, E., Eds.; Springer International Publishing: Cham, Switzerland, 2017; Volume 49–60. [Google Scholar]
  39. Watanabe, M.; Mochida, K.; Kato, T.; Tabata, S.; Yoshimoto, N.; Noji, M.; Saito, K. Comparative genomics and reverse genetics analysis reveal indispensable functions of the serine acetyltransferase gene family in Arabidopsis. Plant Cell 2008, 20, 2484–2496. [Google Scholar] [CrossRef]
  40. Haas, F.H.; Heeg, C.; Queiroz, R.; Bauer, A.; Wirtz, M.; Hell, R. Mitochondrial serine acetyltransferase functions as a pacemaker of cysteine synthesis in plant cells. Plant Physiol. 2008, 148, 1055–1067. [Google Scholar] [CrossRef]
  41. Walbot, V.; Clutter, M.; Sussex, I.M. Reproductive development and embryogeny in Phaseolus. Phytomorphology 1972, 22, 59–68. [Google Scholar]
  42. Bobb, A.J.; Eiben, H.G.; Bustos, M.M. PvAlf, an embryo-specific acidic transcriptional activator enhances gene expression from phaseolin and phytohemagglutinin promoters. Plant J. 1995, 8, 331–343. [Google Scholar] [CrossRef] [PubMed]
  43. Pandurangan, S.; Sandercock, M.; Beyaert, R.; Conn, K.L.; Hou, A.; Marsolais, F. Differential response to sulfur nutrition of two common bean genotypes differing in storage protein composition. Front. Plant Sci. 2015, 6, 92. [Google Scholar] [CrossRef]
  44. Schmutz, J.; McClean, P.E.; Mamidi, S.; Wu, G.A.; Cannon, S.B.; Grimwood, J.; Jenkins, J.; Shu, S.; Song, Q.; Chavarro, C.; et al. A reference genome for common bean and genome-wide analysis of dual domestications. Nat. Genet. 2014, 46, 707–713. [Google Scholar] [CrossRef] [Green Version]
  45. Vatamaniuk, O.K.; Mari, S.; Lu, Y.-P.; Rea, P.A. Mechanism of heavy metal ion activation of phytochelatin (PC) synthase: Blocked thiols are sufficient for PC synthase-catalyzed transpeptidation of glutathione and related thiol peptides. J. Biol. Chem. 2000, 275, 31451–31459. [Google Scholar] [CrossRef] [PubMed]
  46. Vlasova, A.; Capella-Gutierrez, S.; Rendon-Anaya, M.; Hernandez-Onate, M.; Minoche, A.E.; Erb, I.; Camara, F.; Prieto-Barja, P.; Corvelo, A.; Sanseverino, W.; et al. Genome and transcriptome analysis of the Mesoamerican common bean and the role of gene duplications in establishing tissue and temporal specialization of genes. Genome Biol. 2016, 17, 32. [Google Scholar] [CrossRef] [Green Version]
  47. Pandurangan, S.; Diapari, M.; Yin, F.; Munholland, S.; Perry, G.; Chapman, B.P.; Huang, S.; Sparvoli, F.; Bollini, R.; Crosby, W.; et al. Genomic analysis of storage protein deficiency in genetically related lines of common bean (Phaseolus vulgaris). Front. Plant Sci. 2016, 7, 389. [Google Scholar] [CrossRef]
  48. Blum, R.; Meyer, K.C.; Wünschmann, J.; Lendzian, K.J.; Grill, E. Cytosolic action of phytochelatin synthase. Plant Physiol. 2010, 153, 159–169. [Google Scholar] [CrossRef] [PubMed]
  49. Hayashi, S.; Kuramata, M.; Abe, T.; Takagi, H.; Ozawa, K.; Ishikawa, S. Phytochelatin synthase OsPCS1 plays a crucial role in reducing arsenic levels in rice grains. Plant J. 2017, 91, 840–848. [Google Scholar] [CrossRef]
  50. Shine, A.M.; Shakya, V.P.; Idnurm, A. Phytochelatin synthase is required for tolerating metal toxicity in a basidiomycete yeast and is a conserved factor involved in metal homeostasis in fungi. Fungal Biol. Biotechnol. 2015, 2, 3. [Google Scholar] [CrossRef]
  51. Mendoza-Cózatl, D.G.; Jobe, T.O.; Hauser, F.; Schroeder, J.I. Long-distance transport, vacuolar sequestration, tolerance, and transcriptional responses induced by cadmium and arsenic. Curr. Opin. Plant Biol. 2011, 14, 554–562. [Google Scholar] [CrossRef] [PubMed]
  52. Sánchez, E.; Ruiz, J.M.; Romero, L. Proline metabolism in response to nitrogen toxicity in fruit of French Bean plants (Phaseolus vulgaris L. cv Strike). Sci. Hortic. 2002, 93, 225–233. [Google Scholar] [CrossRef]
  53. Jafari, M.; Rajabzadeh, A.R.; Tabtabaei, S.; Marsolais, F.; Legge, R.L. Physicochemical characterization of a navy bean (Phaseolus vulgaris) protein fraction produced using a solvent-free method. Food Chem. 2016, 208, 35–41. [Google Scholar] [CrossRef]
  54. Bruneau, L.; Chapman, R.; Marsolais, F. Co-occurrence of both L-asparaginase subtypes in Arabidopsis: At3g16150 encodes a K+-dependent L-asparaginase. Planta 2006, 224, 668–679. [Google Scholar] [CrossRef]
  55. Earley, K.W.; Haag, J.R.; Pontes, O.; Opper, K.; Juehne, T.; Song, K.; Pikaard, C.S. Gateway-compatible vectors for plant functional genomics and proteomics. Plant J. 2006, 45, 616–629. [Google Scholar] [CrossRef] [Green Version]
  56. Nelson, B.K.; Ca, X.; Nebenführ, A. A multicolored set of in vivo organelle markers for co-localization studies in Arabidopsis and other plants. Plant J. 2007, 51, 1126–1136. [Google Scholar] [CrossRef]
  57. Yu, S.; Bian, Y.; Zhou, R.; Mou, R.; Chen, M.; Cao, Z. Robust method for the analysis of phytochelatins in rice by high-performance liquid chromatography coupled with electrospray tandem mass spectrometry based on polymeric column materials. J. Sep. Sci. 2015, 38, 4146–4152. [Google Scholar] [CrossRef]
Figure 1. Possible biosynthetic pathway of sulfur amino acids in seed of the common bean. Solid arrows indicate steps taking place in seeds based on gene expression analysis. Multiple arrows refer to multiple steps. Broken arrows represent hypothetical steps. Metabolites in boxes are related to S-methylcysteine and were profiled in this study. The predominant pathway of cysteine biosynthesis in seed is cytosolic and BSAS4;1 is the main cytosolic cysteine synthase expressed in seed. Formation of free S-methylcysteine by cysteine synthase is inferred from data in Arabidopsis. The presence of S-methylhomoglutathione suggests a pathway similar to that of the S-alk(enyl) sulfoxides in Allium leading to the formation of γ–glutamyl-S-methylcysteine (see text for details). OAS: O-acetylserine; γ–Glu-Cys, γ-glutamylcysteine; γ–Glu-S-methylCys, γ–glutamyl-S-methylcysteine; S-methyl-hGSH, S-methylhomoglutathione; BSAS4;1, β-substituted alanine synthase 4;1; PCS2, phytochelatin synthase 2; GCL1, glutamate–cysteine ligase 1; hGS, homoglutathione synthetase; MGL, methionine γ-lyase.
Plants 08 00126 g001
Figure 2. Quantification of sulfur metabolites at different developmental stages in SARC1 and SMARC1N-PN1. Concentration is expressed in nmol per mg seed weight; average ± standard deviation; n = 3. Asterisks indicate significant differences at t-test p value ≤ 0.01. n = 3.
Plants 08 00126 g002
Figure 3. Relative expression of transcripts at different developmental stages in SARC1 and SMARC1N-PN1 determined by RT-qPCR. Average ± standard deviation. Asterisks indicate significant differences at t-test p value ≤ 0.02. n = 3.
Plants 08 00126 g003
Figure 4. Naturally occurring variant of PCS2 in BAT93. (a) Intron–exon structure of the BAT93 PCS2 gene. The length of introns and exons is indicated starting from the first translation initiation codon and ending at the stop codon. (b) The gene gives rise to two open reading frames, due to the insertion of a cytosine at position 110 of the coding sequence (CDS), which results in a premature stop codon. Corresponding positions in the cDNA with respect to the first initiation codon is indicated. ORF1 encodes a predicted polypeptide of 71 amino acids. (c) Due to the insertion, PCS2 encoded in BAT93 represents a shorter form translated from an alternative, downstream start codon as compared with PCS2 encoded by SARC1, SMARC1N-PN1 and the reference bean genome, G19833. Pfam domains present in the phytochelatin synthase sequence are indicated.
Plants 08 00126 g004
Figure 5. Subcellular localization of PCS2. (a) YFP-tagged PCS2; (b) CFP-tagged mitochondrial marker (Mt-CFP); (c) Co-localization of PCS2 with Mt-CFP. YFP: Yellow fluorescent protein; CFP: Cyan fluorescent protein.
Plants 08 00126 g005
Figure 6. MS/MS chromatograms for monitoring (a) phytochelatin-2 (PC2); (b) homophytochelatin-2 (hPC2) and (c) S-methylhomophytochelatin-2 with a single S-methylcysteine (S-methyl-hPC2).
Plants 08 00126 g006
Table 1. Free amino acid profiles in developing seeds of BAT93. Metabolites related to S-methylcysteine are highlighted.
Average Seed Weight (mg)/Develop-Mental Stage25/IV- Cotyledon52/V- Cotyledon105/V-Cotyledon157/VI- Maturation200/VI- Maturation348/VIII- Maturation160/Mature
Asp1.6 ± 0.10.80 ± 0.100.79 ± 0.021.2 ± 0.11.3 ± 0.11.4 ± 0.23.4 ± 0.4
Glu4.5 ± 0.24.1 ± 0.24.0 ± 0.13.3 ± 0.12.9 ± 0.12.8 ± 0.14.4 ± 0.3
hGSH0.06 ± 0.010.06 ±0.010.06 ± 0.010.12 ± 0.010.12 ± 0.020.11 ± 0.010.35 ± 0.06
Ser1.3 ± 0.10.77 ± 0.090.56 ± 0.010.50 ± 0.010.39 ± 0.010.52 ± 0.120.24 ± 0.02
His1.8 ± 0.11.3 ± 0.20.84 ± 0.020.98 ± 0.070.11 ± 0.010. 45 ± 0.292.5 ± 0.2
γ-Glu-S-methylCys2.4 ± 0.17.0 ± 0.19.3 ± 0.210.2 ± 0.28.6 ± 0.311.4 ± 2.738.0 ± 2.0
Gly0.33 ± 0.010.30 ± 0.010.25 ± 0.010.25 ± 0.010.24 ± 0.010.27 ± 0.030.58 ± 0.36
Thr3.2 ± 0.13.3 ± 0.21.8 ± 0.11.6 ± 0.10.66 ± 0.021.3 ± 0.60.66 ± 0.06
S-methylhGSH0.35 ± 0.020.28 ± 0.030.18 ± 0.010.17 ± 0.010.12 ± 0.010.13 ± 0.010.44 ± 0.04
Arg5.2 ± 0.45.6 ± 0.42.9 ± 0.14.2 ± 3.20.41 ± 0.021.7 ± 1. 12.4 ± 0.2
Ala2.6 ± 0.31.4 ± 0.11.3 ± 0. 10.82 ± 0.040.50 ± 0.020.44 ± 0.041.7± 0.1
γ-Glu-Leu0.26 ± 0.050.39 ± 0.012.0 ± 0.11.3 ± 0.11.9 ± 0.11.1 ± 0.61.9 ± 1.4
Tyr0.18 ± 0.030.19 ± 0.020.17 ± 0.010.13 ± 0.010.10 ± 0.010.08 ± 0.020.22 ± 0.02
S-methylCys1.3 ± 0.11.3 ± 0. 10.43 ± 0.010.28 ± 0.010.13 ± 0.010.18 ± 0.050.32 ± 0.02
Val1.8 ± 0.13.0 ± 0.30.94 ± 0.020.90 ± 0.050.41 ± 0.010.64 ± 0.210.93 ± 0.08
Met2.9 ± 0.52.4 ± 0.10.75 ± 0.020.55 ± 0.030.24 ± 0.010.31 ± 0.070.38 ± 0.01
Trp0.70 ± 0.090.38 ± 0.110.95 ± 0.030.66 ± 0.010.66 ± 0.010.51 ± 0.120.49 ± 0.01
Phe0.47 ± 0.010.39 ± 0.050.20 ± 0.030.14 ± 0.010.09 ± 0.010.11 ± 0.020.37 ± 0.03
Ile1.9 ± 0.13.7 ± 0.31.6 ± 0.10.90 ± 0.020.90 ± 0.010.77 ± 0.110.28 ± 0.04
Leu4.0 ± 2.31.4 ± 0.52.2 ± 0.10.39 ± 0.380.36 ± 0.010.42 ± 0.060.26 ± 0.02
Lys0.30 ± 0.020.59 ± 0.070.19 ± 0.010.27 ± 0.020.14 ± 0.070.19 ± 0.020.35 ± 0.03
Values presented are in nmol per mg seed weight; average ± standard deviation; n = 3. hGSH: homoglutathione; γ-Glu-S-methylCys: γ-glutamyl-S-methylcysteine; S-methylhGSH: S-methylhomoglutathione; S-methylCys: S-methylcysteine.
Table 2. Primer sequences used for RT-qPCR.
Gene Accession NumberForward Primer Sequence (5́–3́)Reverse Primer Sequence (5́–3́)
BSAS4;1Phvul.007G185200.2GCGGCTGATGGTGGTTATATTTCACCAGTTCCTATCCCTGCA
GCL1Phvul.002G289200.1TGCATTACCAGCACTTTGGGACATCTGTCTTTCTTCTGGGGT
hGSPhvul.006G094500.1CCGCAAAGAGAAGGAGGAGGTGCTGGAAAAGTGGCTGGAA
PCS2Phvul.001G162700.1TTCTCTGGGAGGCAATGAGCACCTTCATCTCTACAACTCACAGT
UbiquitinPhvul.007G05260.1ACAGCTGGAGGATGAAAGGAGTCCGAACTCTCCACCTCAA

