Article

Transcriptome Analysis Revealed the Potential Molecular Mechanism of Anthocyanidins’ Improved Salt Tolerance in Maize Seedlings

1
Beijing Innovation Center for Crop Seed Technology, Ministry of Agriculture and Rural Affairs, College of Agronomy and Biotechnology, China Agricultural University, Beijing 100193, China
2
Tropical Crops Genetic Resources Institute, Chinese Academy of Tropical Agricultural Science, Haikou 571101, China
3
Sanya Research Institute, Chinese Academy of Tropical Agricultural Science, Sanya 572000, China
4
Sanya Institute, China Agricultural University, Sanya 572025, China
5
Institute of Crop Sciences, Chinese Academy of Agricultural Sciences, Beijing 100081, China
*
Authors to whom correspondence should be addressed.
These authors contributed equally to this work.
Plants 2023, 12(15), 2793; https://doi.org/10.3390/plants12152793
Submission received: 26 June 2023 / Revised: 20 July 2023 / Accepted: 26 July 2023 / Published: 27 July 2023

Abstract

:
Anthocyanin, a kind of flavonoid, plays a crucial role in plant resistance to abiotic stress. Salt stress is a kind of abiotic stress that can damage the growth and development of plant seedlings. However, limited research has been conducted on the involvement of maize seedlings in salt stress resistance via anthocyanin accumulation, and its potential molecular mechanism is still unclear. Therefore, it is of great significance for the normal growth and development of maize seedlings to explore the potential molecular mechanism of anthocyanin improving salt tolerance of seedlings via transcriptome analysis. In this study, we identified two W22 inbred lines (tolerant line pur–W22 and sensitive line bro–W22) exhibiting differential tolerance to salt stress during seedling growth and development but showing no significant differences in seedling characteristics under non–treatment conditions. In order to identify the specific genes involved in seedlings’ salt stress response, we generated two recombinant inbred lines (RILpur–W22 and RILbro–W22) by crossing pur–W22 and bro–W22, and then performed transcriptome analysis on seedlings grown under both non–treatment and salt treatment conditions. A total of 6100 and 5710 differentially expressed genes (DEGs) were identified in RILpur–W22 and RILbro–W22 seedlings, respectively, under salt–stressed conditions when compared to the non–treated groups. Among these DEGs, 3160 were identified as being present in both RILpur–W22 and RILbro–W22, and these served as commonly stressed EDGs that were mainly enriched in the redox process, the monomer metabolic process, catalytic activity, the plasma membrane, and metabolic process regulation. Furthermore, we detected 1728 specific DEGs in the salt–tolerant RILpur–W22 line that were not detected in the salt–sensitive RILbro–W22 line, of which 887 were upregulated and 841 were downregulated. These DEGs are primarily associated with redox processes, biological regulation, and the plasma membrane. Notably, the anthocyanin synthesis related genes in RILpur–W22 were strongly induced under salt treatment conditions, which was consistented with the salt tolerance phenotype of its seedlings. In summary, the results of the transcriptome analysis not only expanded our understanding of the complex molecular mechanism of anthocyanin in improving the salt tolerance of maize seedlings, but also, the DEGs specifically expressed in the salt–tolerant line (RILpur–W22) provided candidate genes for further genetic analysis.

1. Introduction

Maize is the largest grain product in the world, renowned for its rich protein, starch, vitamin, and trace element content [1]. Maize exhibits various colors, including yellow, white, purple, and red [2]. The different colored maize seeds contain different kinds of pigments [3]. For example, the pigments in yellow maize are mainly carotene and riboflavin, and the pigments in purple and red maize are mainly anthocyanins [4,5,6]. As awareness grows regarding the nutritional and functional health benefits of anthocyanins, there has been an increased demand for maize varieties enriched with these pigments [7,8].
Anthocyanin is a natural water–soluble pigment and one of the flavonoid compounds widely found in nature [9]. Enzymes such as phenylalanine ammonialyase (PAL), cinnamate 4–hydroxylase (C4H), 4–coumarate CoA ligase (4CL), chalcone synthase (CHS), chalcone isomerase (CHI), flavanone 3–hydroxylase (F3H), flavonoid 3′–hydroxylase (F3′H), flavonoid 3′5′–hydroxylase (F3′5′H), dihydroflavonol 4–reductase (DFR), anthocyanin synthase (ANS), and flavonoid 3–O–glucosyltransferase (UFGT) are involved in the anthocyanin biosynthesis pathway [10,11,12,13,14,15,16]. Meanwhile, v–myb avian myeloblastosis viral oncogene homolog (MYB), basic helix–loop–helix (bHLH), WD–repeat protein (WD40), and other transcription factors can affect the synthesis of anthocyanins by regulating the expression of structural genes [17,18,19]. Furthermore, environmental factors also impact the accumulation of anthocyanins in plants [20,21,22,23,24].
The global area of saline–alkali land is about 950 million hectares. Saline soil will directly affect seed germination, seedling morphogenesis, and plant growth and development, thus affecting crop yield [25,26,27]. Under environmental stress, plants can regulate the expression of structural genes and regulatory genes in the anthocyanin synthesis pathway to accumulate anthocyanins in plants and thus withstand the damage caused by environmental stress [28,29,30,31]. Especially under salt stress, in one study, AtDFR expression in Brassica napus L. was upregulated, anthocyanidin accumulation was increased, and plant tolerance to salt stress was enhanced [31]. Therefore, increasing the anthocyanin content of maize seedlings and enhancing their salt stress tolerance are essential for maize production.
A transcriptome refers to the sum of all gene transcription products of a specific organism at specific development stage. Transcriptome analysis is a powerful tool for identifying genes that contribute to complex traits [32,33,34,35]. The molecular regulation mechanism of flavonoid biosynthesis under salt stress has been reported in plants such as sorghum [36], radish [37], grape [38], and alfalfa [39]. Many differentially expressed genes (DEGs) related to seedling growth via their role in regulating flavonoid biosynthesis under salt stress have also been identified. However, there is limited research on the role of anthocyanins in conferring salt stress resistance in maize seedlings. In this study, we used seedlings of two W22 inbred lines (RILpur–W22 and RILbro–W22) for transcriptome analysis. Expected to explore the differentially expressed genes (DEGs) involved in the salt tolerance of maize seedlings via transcriptome analysis, so as to further understand the potential molecular mechanism of anthocyanin in improving the salt tolerance of maize seedlings.

2. Results

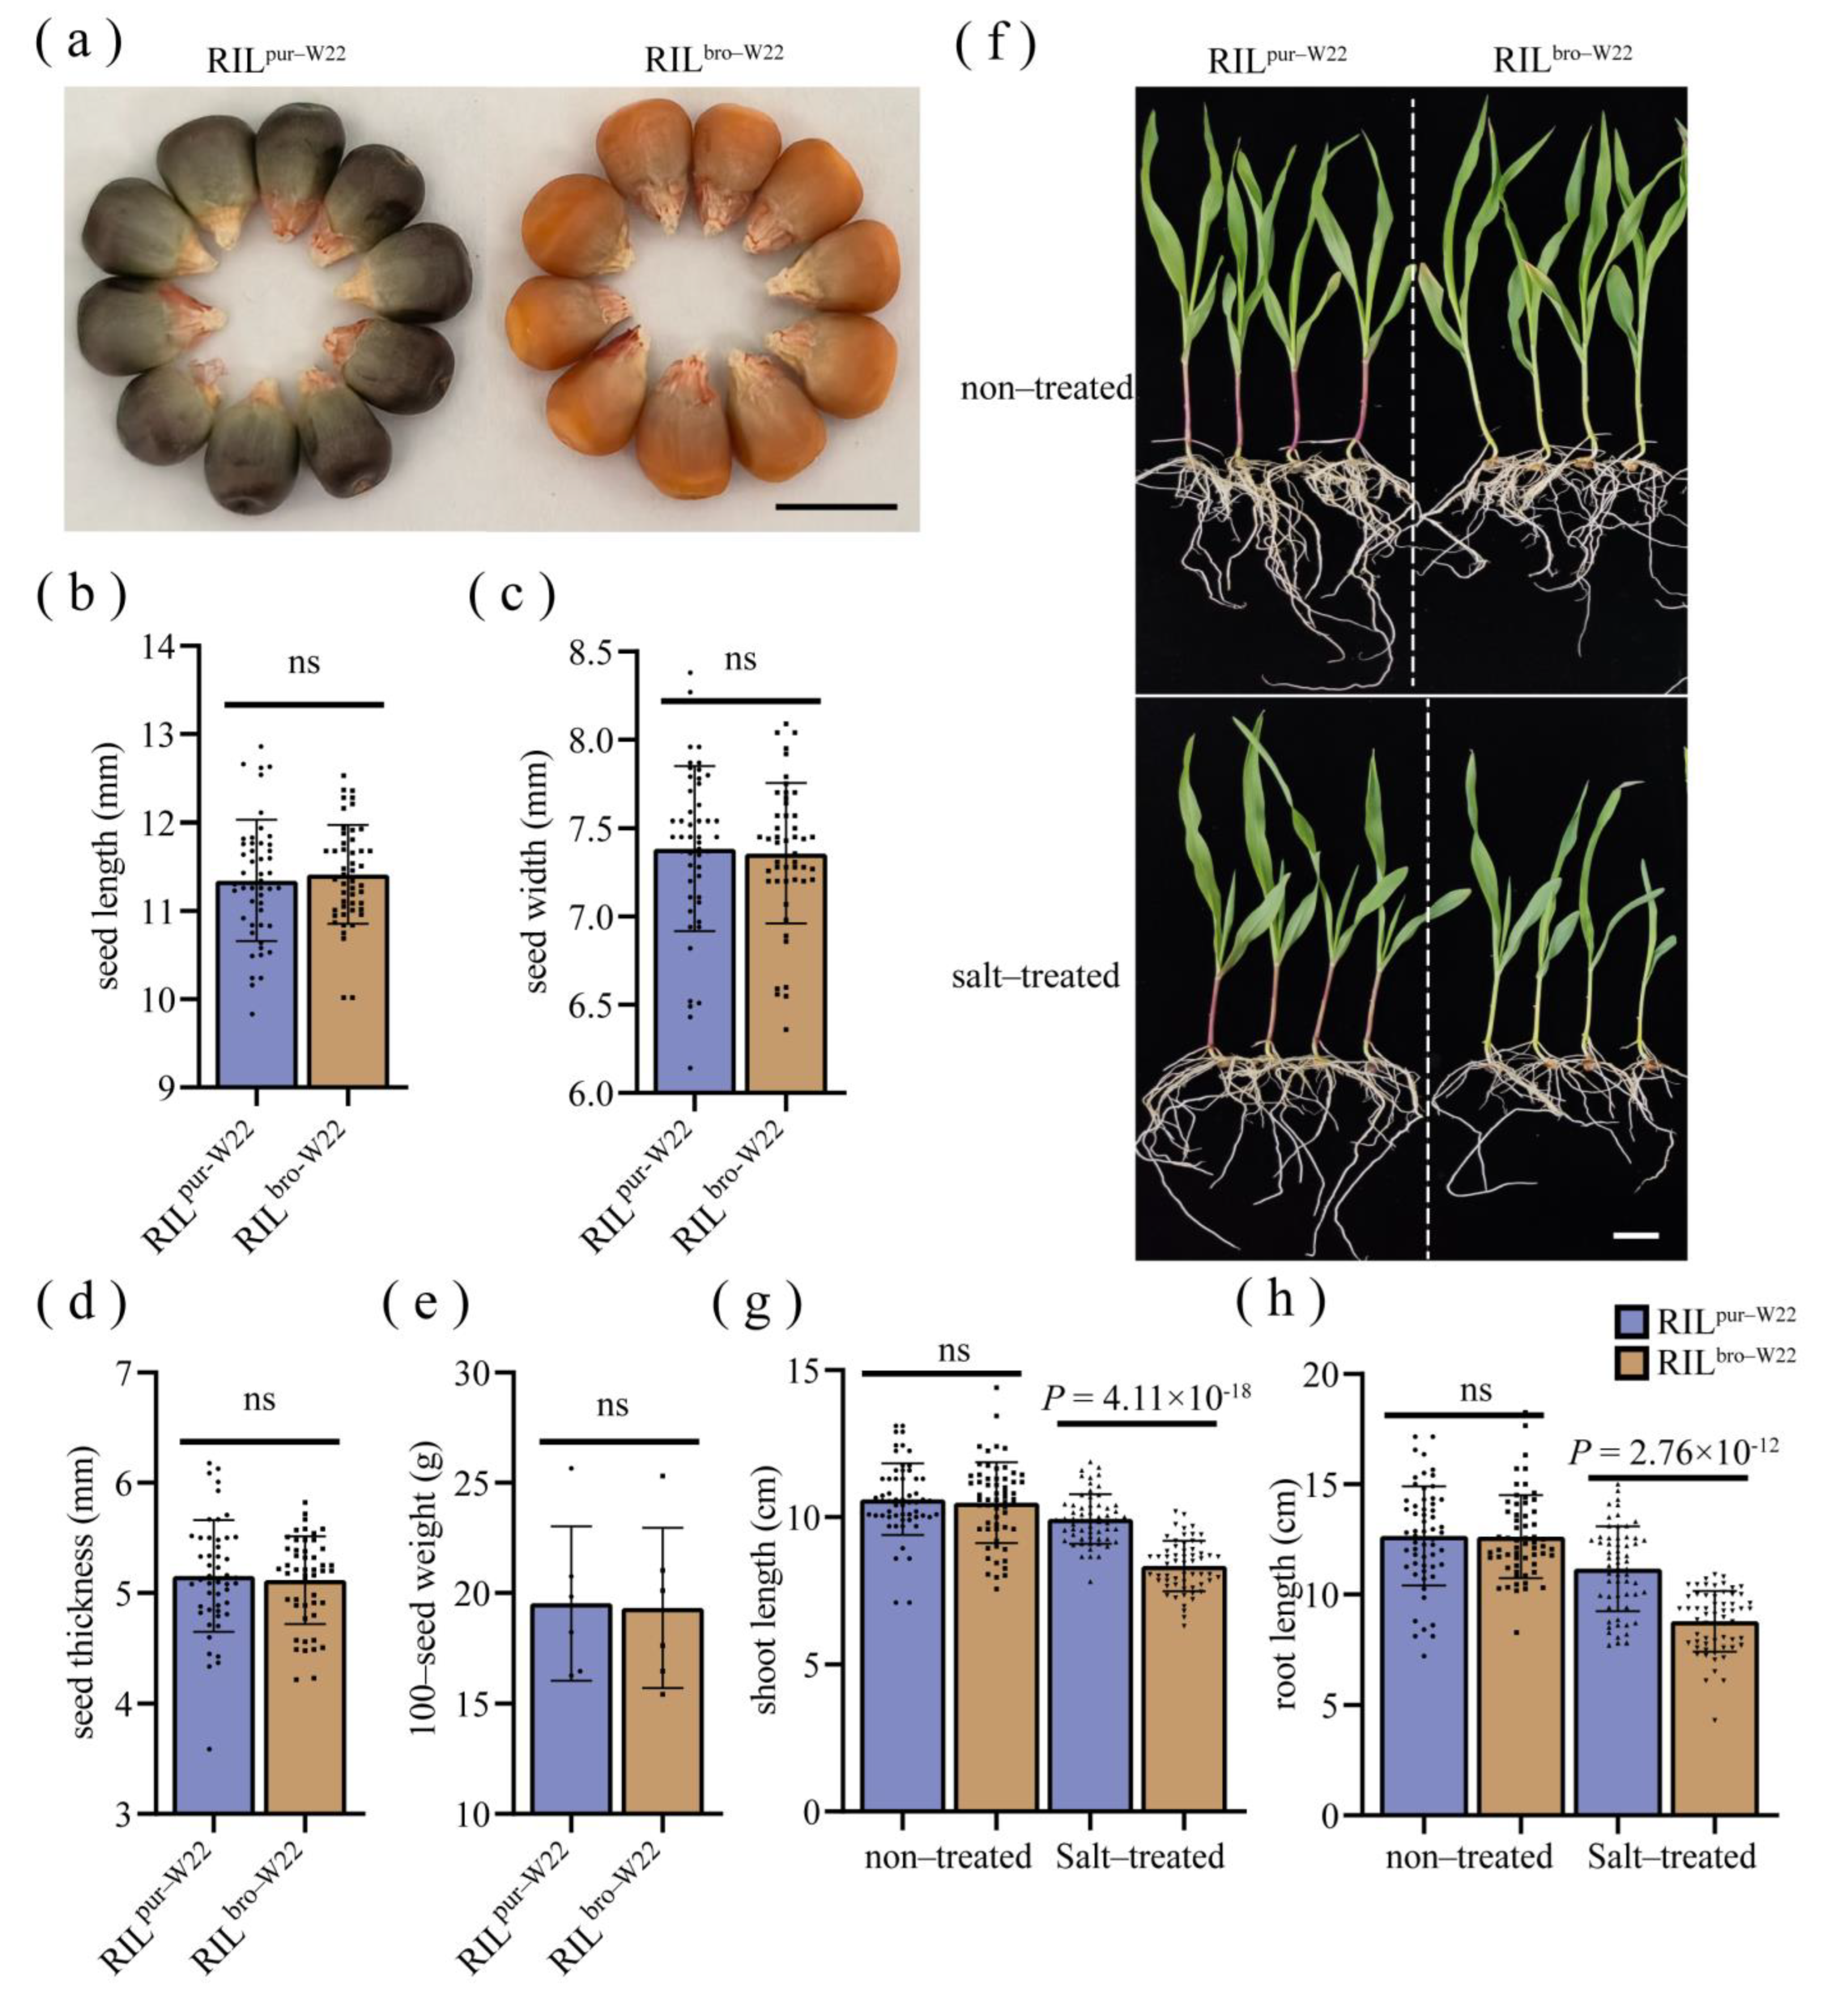
2.1. The Purple–Colored W22 and Bronze–Colored W22 Show Different Seedling Growth under Salt Stress

The seeds of purple W22 (pur–W22) inbred lines were purple, while the seeds of bronze W22 (bro–W22) inbred lines were bronze. Upon comparing the seed traits of the two W22 inbred lines, it was observed that, apart from the color difference, the seed length, width, and thickness of the pur–W22 inbred lines were significantly larger than those of bro–W22 (Figure S1a–d). Additionally, bro–W22 displayed a significant decrease in 100–grain weight (Figure S1e). To evaluate the salt stress tolerance of the pur–W22 and bro–W22 lines, we subjected them to a 100 mM NaCl solution to simulate salt stress. Under salt–treated conditions, bro–W22 exhibited shorter seedling length and root length compared to pur–W22. However, no significant differences in seedling length and root length were observed between the seedlings under non–treated conditions. Furthermore, both pur–W22 and bro–W22 seedlings displayed inhibited root and seedling lengths under salt treatment compared to non–treated conditions (Figure S1f–i). In addition, both lines exhibited similar germination rates, exceeding 96%, under both non–treated and salt–treated conditions (Figure S1g). By simulating a salt stress environment using sand culture, we corroborated the findings obtained from the germination experiment, indicating that pur–W22 exhibits stronger salt stress tolerance than bro–W22 (Figure S1j).
After conducting a cross between pur–W22 and bro–W22, we obtained the F2 population through self–pollination. Subsequently, the F6 generation RILs (RILpur–W22 and RILbro–W22) were derived by self–pollinating the F2 generation plants over multiple generations. Comparing the seed traits of the two RIL populations, we observed no significant differences in seed length, width, thickness, or 100–grain weight between RILpur–W22 and RILbro–W22, except for the variations in color (Figure 1a–e). Furthermore, we observed that RILpur–W22 seedlings exhibited significantly longer seedling and root lengths compared to RILbro–W22 under salt stress conditions. And the seedling length and root length of RILpur–W22 and RILbro–W22 seedlings were inhibited under salt–treated compared with non–treated conditions (Figure 1f–h). It was noteworthy that RILpur–W22 seedlings still showed similar salt tolerance to its parent pur–W22 after the differences in seed length, seed width, seed thickness, and 100–seed weight were removed (Figure 1f–h).

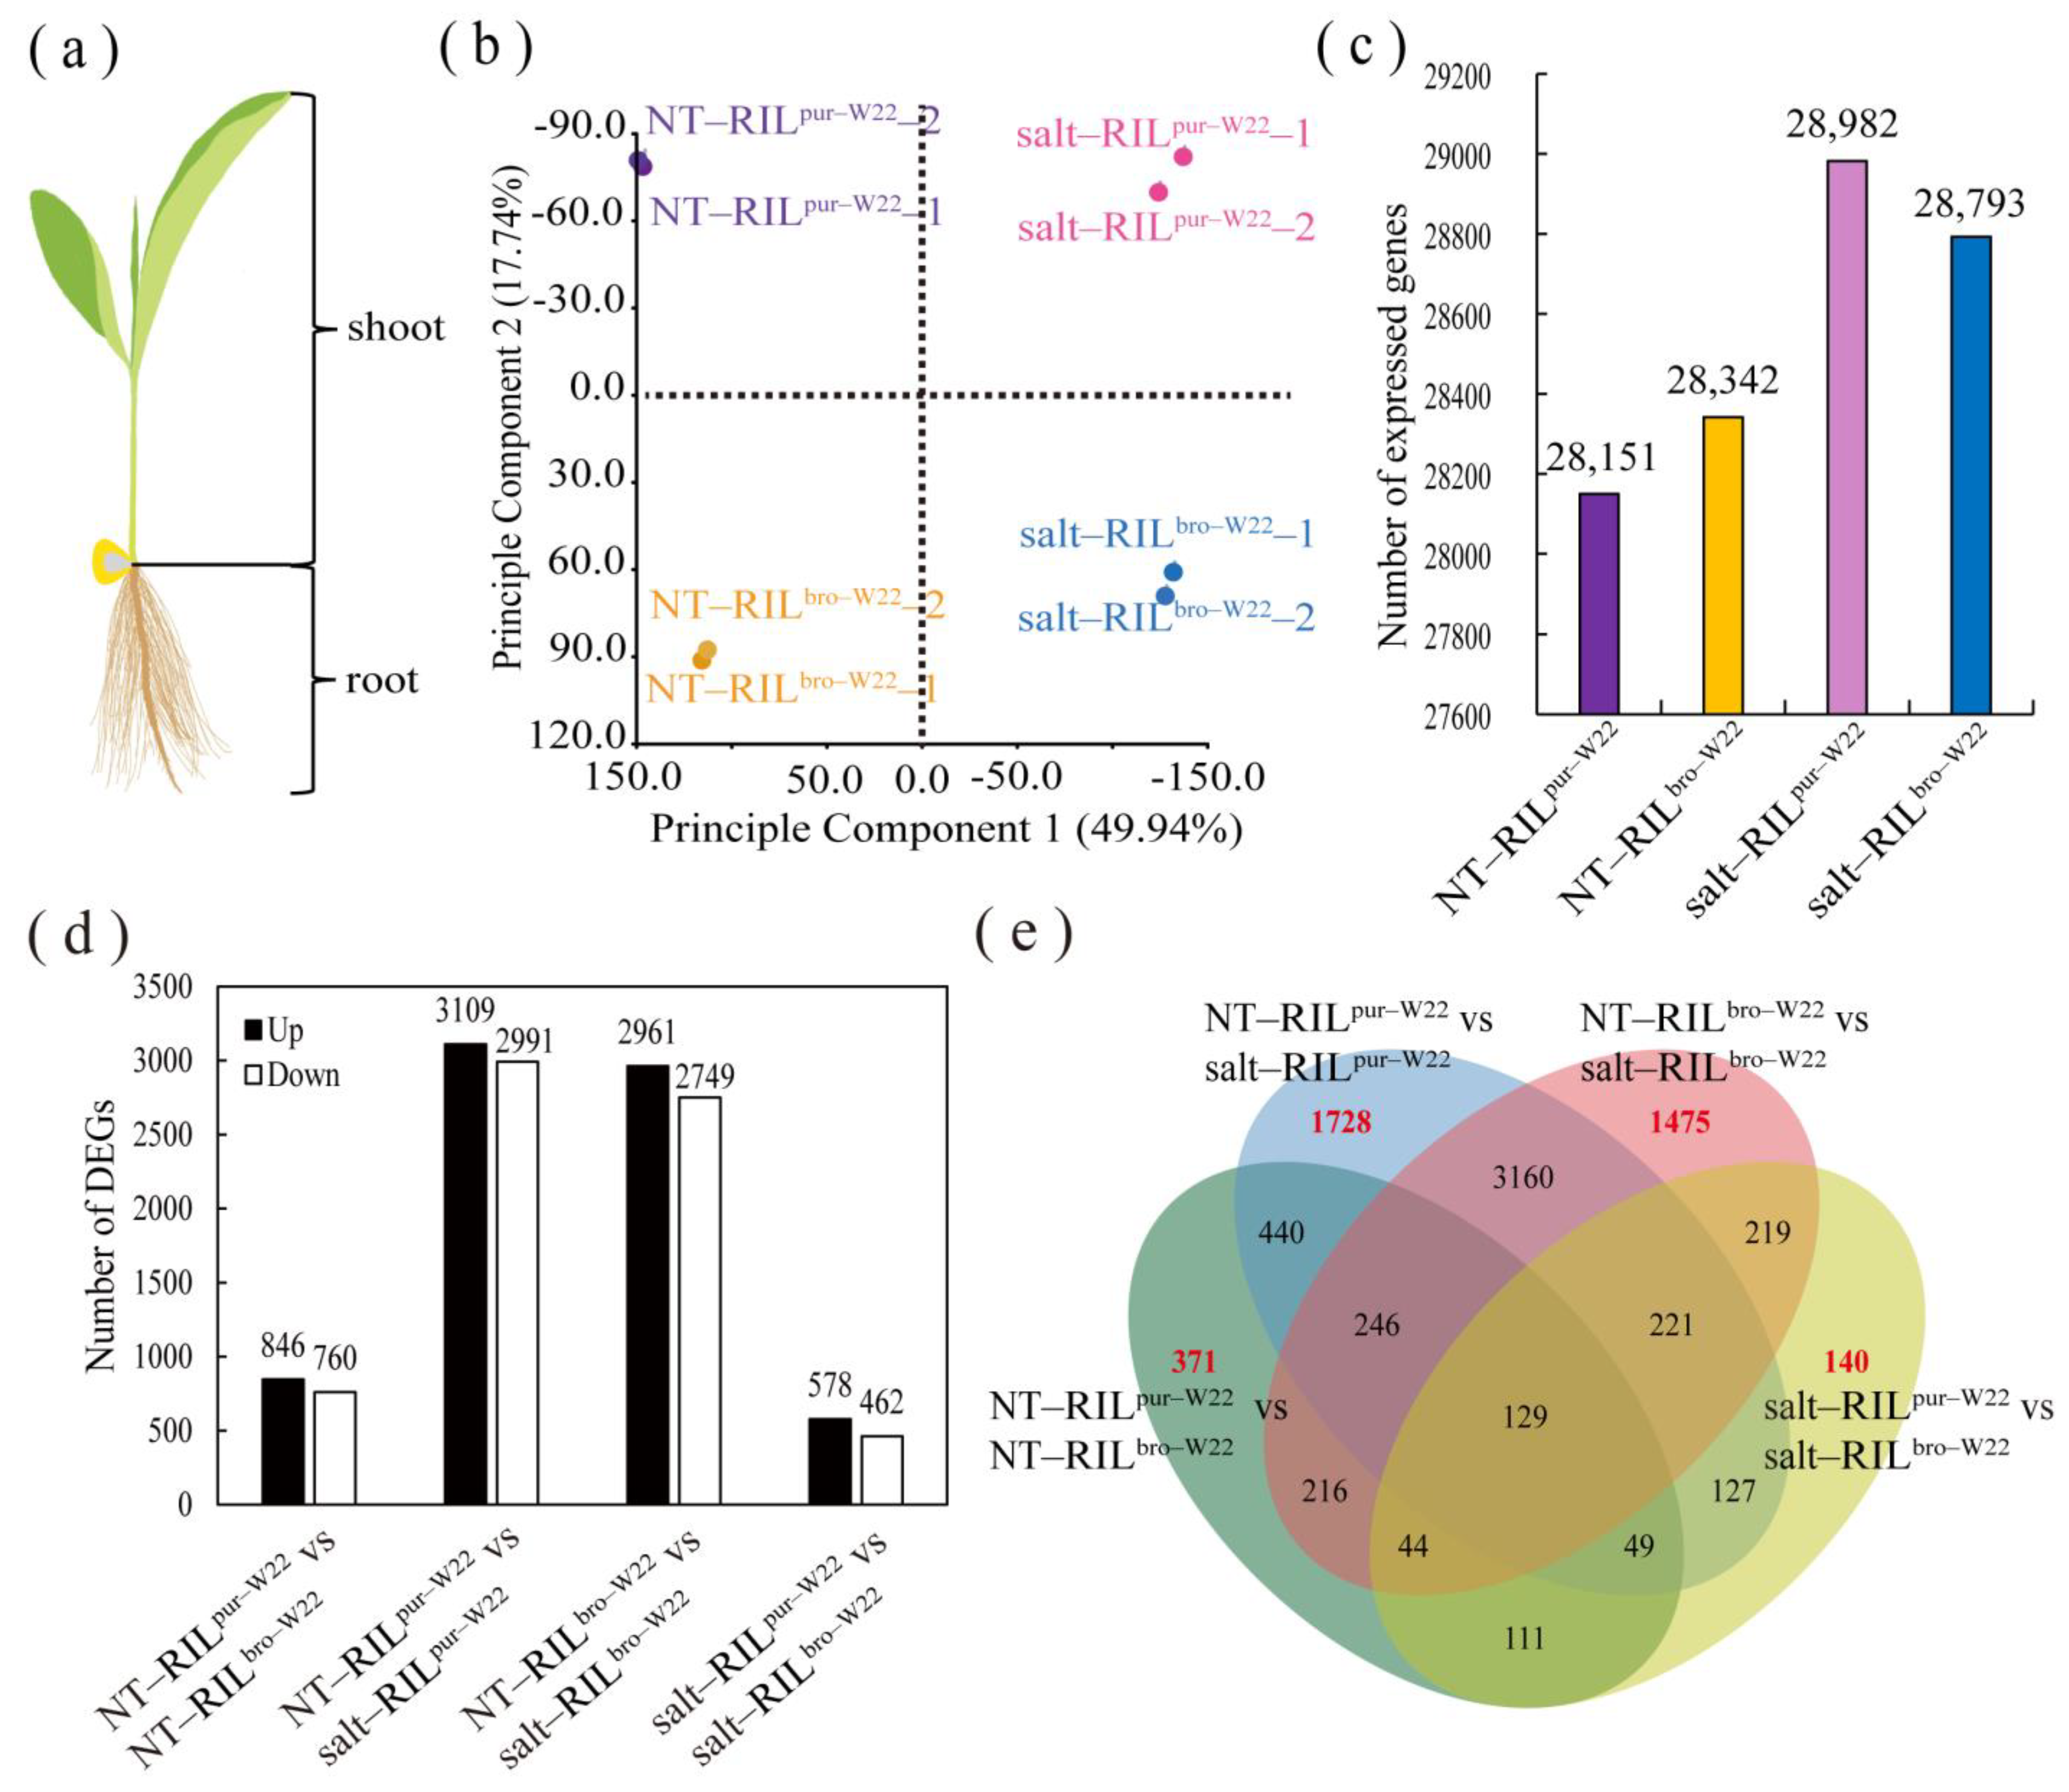
2.2. Transcriptome Analysis of RILs undergoing Salt Treatment

To further investigate the impact of salt treatment on the development of seedlings of different seed colors, we selected RILpur–W22 and RILbro–W22 seedlings (consisting of aboveground stems and leaves, with the seeds removed) that had germinated and grown for 14 days under non–treated and salt stress environments (Figure 2a). We performed two biological replicates, totaling eight samples, and extracted total RNA for sequencing. Principal component analysis using the expression data from these samples demonstrated better repeatability between the two biological replicates (Figure 2b). Moreover, we observed significant differences between the transcriptomes of non–treated RILpur–W22 seedlings (NT–RILpur–W22) and salt–treated RILpur–W22 seedlings (salt–RILpur–W22). Similar distinctions were observed between non–treated RILbro–W22 seedlings (NT–RILbro–W22) and salt–treated RILbro–W22 seedlings (salt–RILbro–W22) (Figure 2b). These findings indicate that salt stress had a considerable impact on the growth and development of the seedlings of RILpur–W22 and RILbro–W22.
A total of 369,817,976 clean reads were obtained from transcriptome sequencing. The number of reads per sample ranged from 44,597,506 to 47,933,524, accounting for 95.15% to 97.33% of the total unfiltered reads. Following the alignment of the clean reads to the reference genome of the maize V4 version (Zm–B73–REFERENCE–GRAMENE–4.0), the number of reads and fragment length were calculated for 46,424 genes, which were then assigned FPKM (fragments per kilobase of transcript per million mapped reads) values. Genes with an FPKM value ≥ 1 were considered to be expressed genes. We observed a similar number of expressed genes in non–treated RILpur–W22 and RILbro–W22, while the number of expressed genes in non–treated RILs was lower than that in salt–treated RILs, indicating that there was an induction of gene expression in the salt–stressed environment compared to the non–treated RILs. Notably, the highest number of expressed genes was observed in salt–treated RILpur–W22 seedlings (Figure 2c, Table 1).

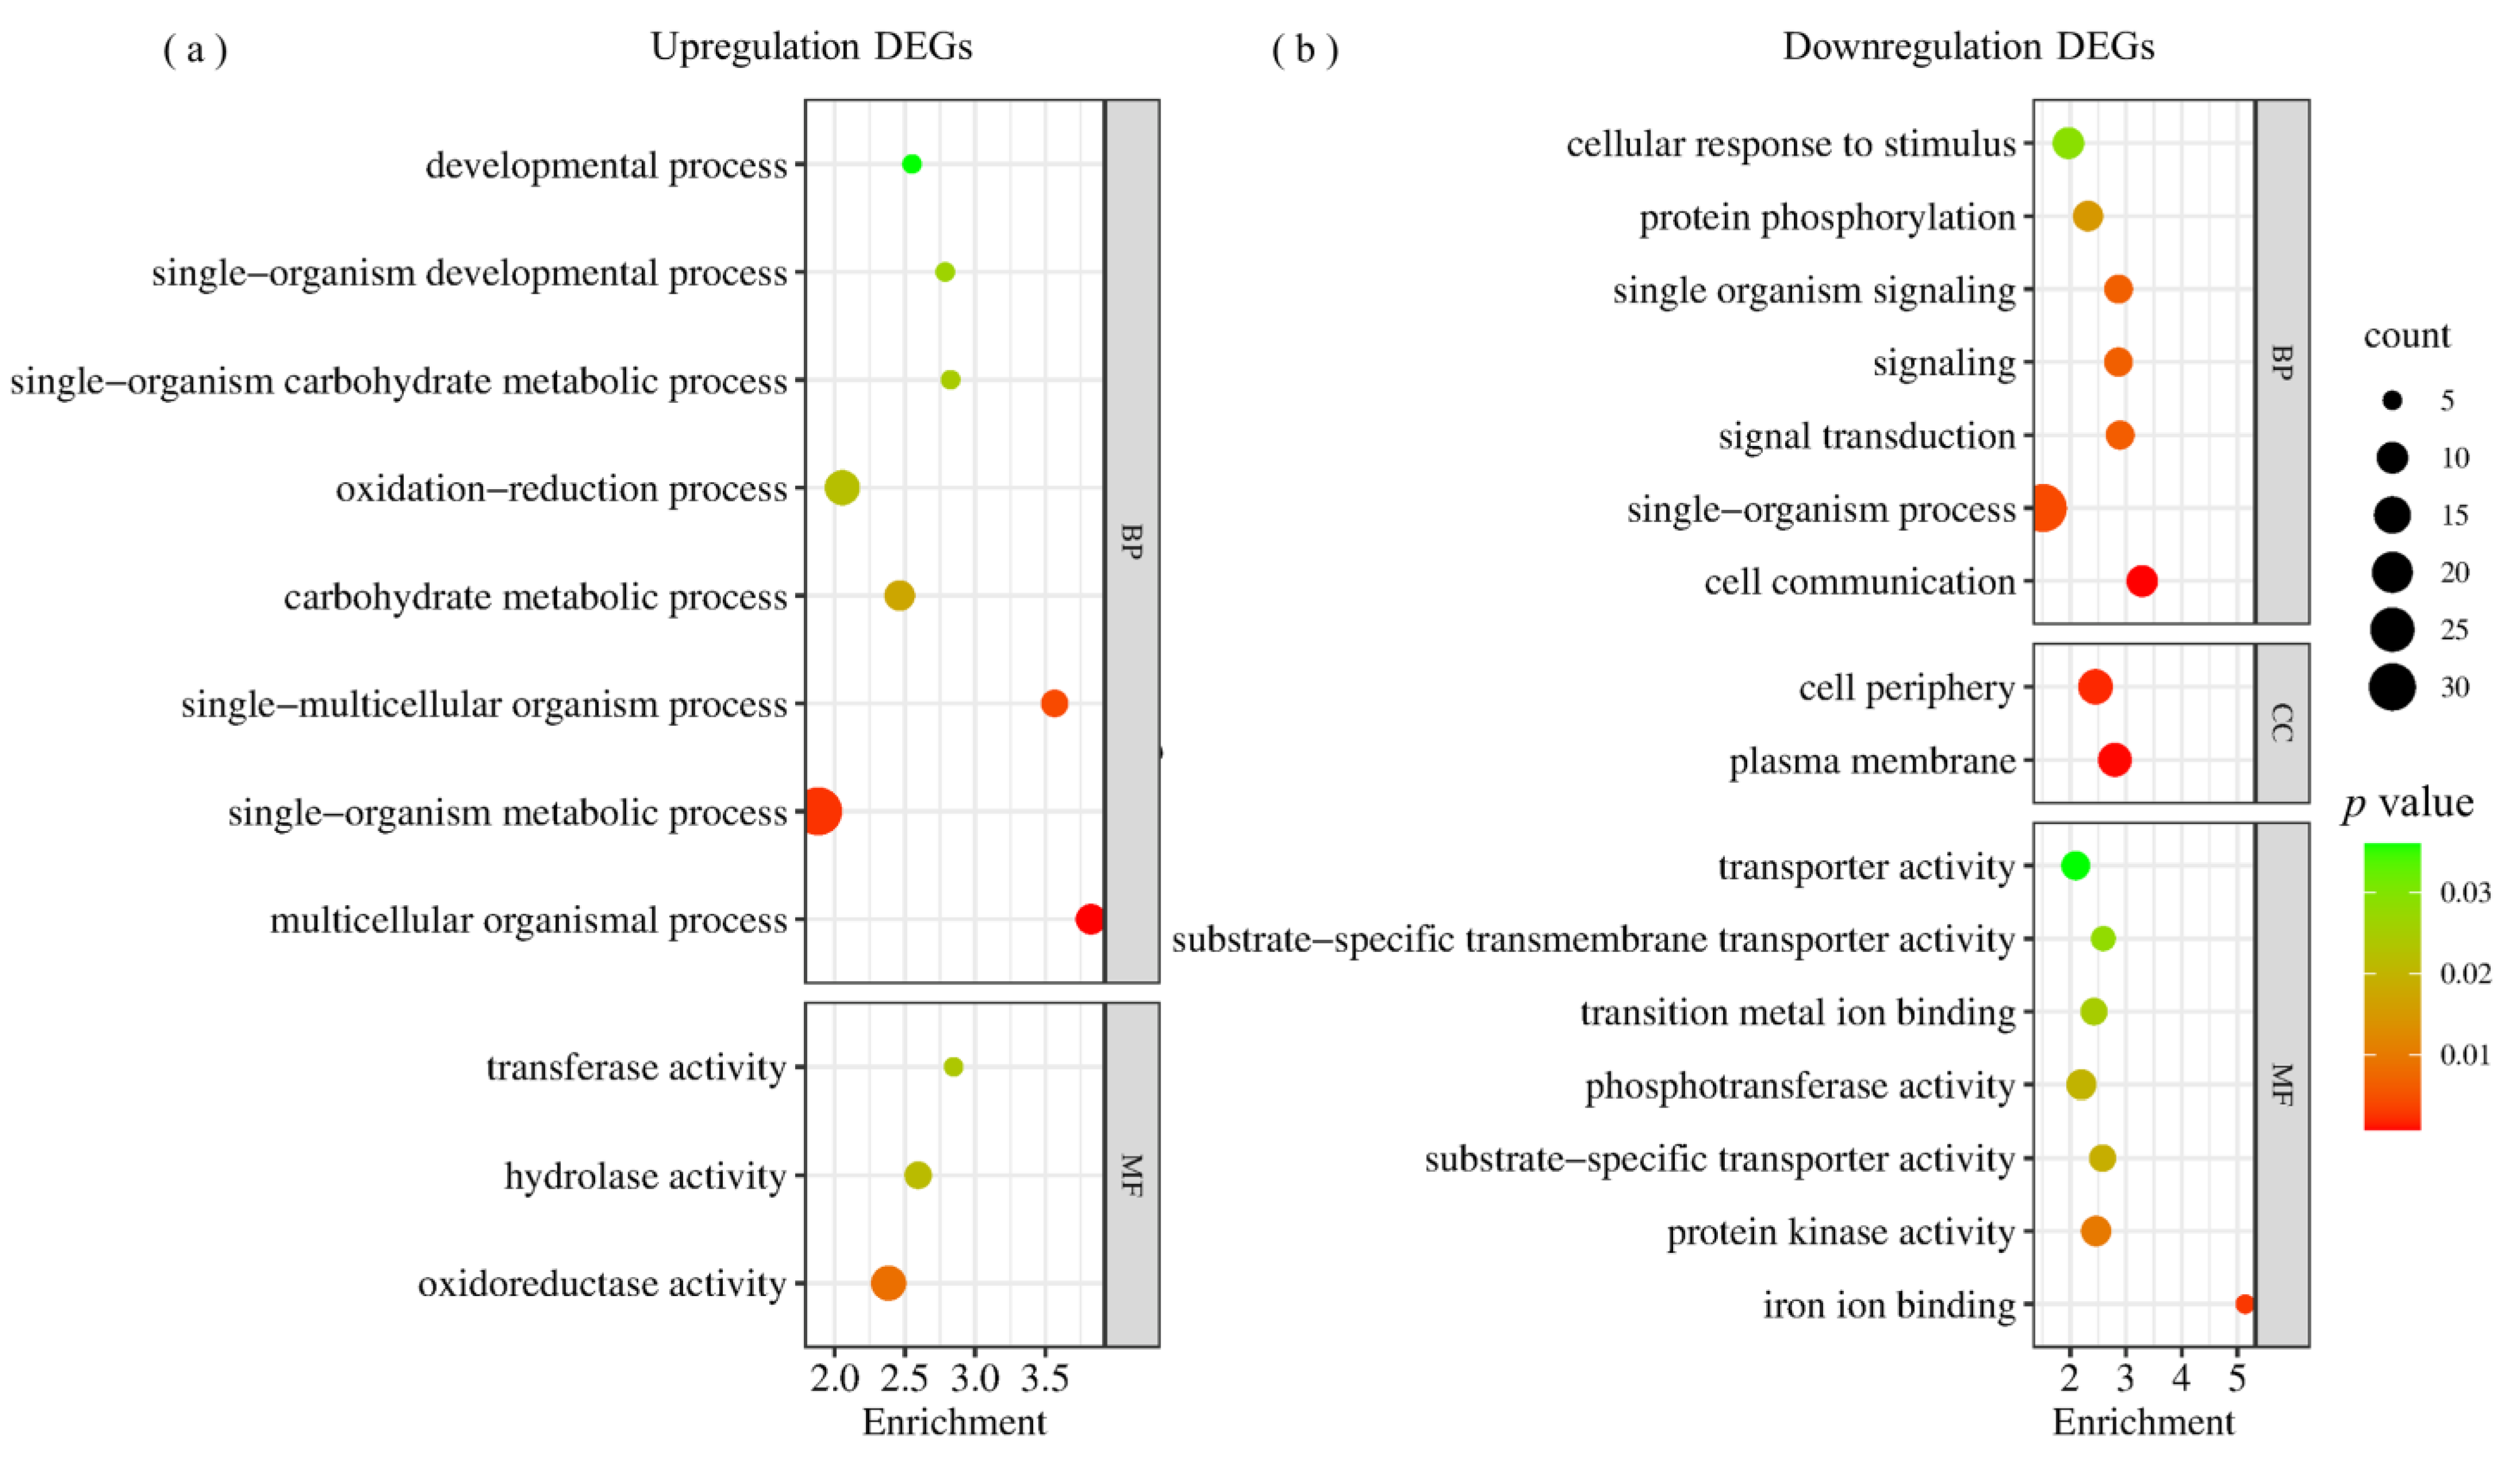
2.3. Differentially Expressed Genes in RILpur–W22 and RILbro–W22 Seedlings

Using the criteria of fold change ≥2 and a corrected p–value of ≤0.01, we screened the DEGs and compared them in various combinations. In the NT–RILpur–W22 vs. NT–RILbro–W22 group, which compares non–treated RILpur–W22 and RILbro–W22 seedlings based on their color difference, we identified 1606 DEGs, including 846 up– and 760 downregulated DEGs. The NT–RILpur–W22 vs. salt–RILpur–W22 group represents DEGs produced by RILpur–W22 seedlings under salt stress, which accounted for 6100 DEGs, with 3109 up– and 2991 downregulated DEGs. Similarly, in the NT–RILbro–W22 vs. salt–RILbro–W22 group, which compares RILbro–W22 seedlings under salt stress, we identified 5710 DEGs, with 2961 up– and 2749 downregulated DEGs. Lastly, the salt–RILpur–W22 vs. salt–RILbro–W22 group represents DEGs resulting from the combined effects of color difference and salt stress between RILpur–W22 and RILbro–W22 seedlings. We found 1040 DEGs, including 578 up– and 462 downregulated DEGs (Figure 2d). Furthermore, the volcano plot (Figure S2) provides a clear and intuitive visualization of the DEGs.
To investigate the genes and pathways influencing the growth and development of RILpur–W22 and RILbro–W22 seedlings in different groups, we conducted Venn diagram analysis on the DEGs from the four groups (Figure 2e). The analysis revealed that 371, 1728, 1475, and 140 DEGs had specific roles in the NT–RILpur–W22 vs. NT–RILbro–W22, NT–RILpur–W22 vs. salt–RILpur–W22, NT–RILbro–W22 vs. salt–RILbro–W22, and salt–RILpur–W22 vs. salt–RILbro–W22 groups, respectively. Moreover, we identified 3160 DEGs that were exclusively co–expressed in the NT–RILbro–W22 vs. salt–RILbro–W22 and NT–RILpur–W22 vs. salt–RILpur–W22 groups. These DEGs were considered to be common salt stress response genes (Figure 2e).

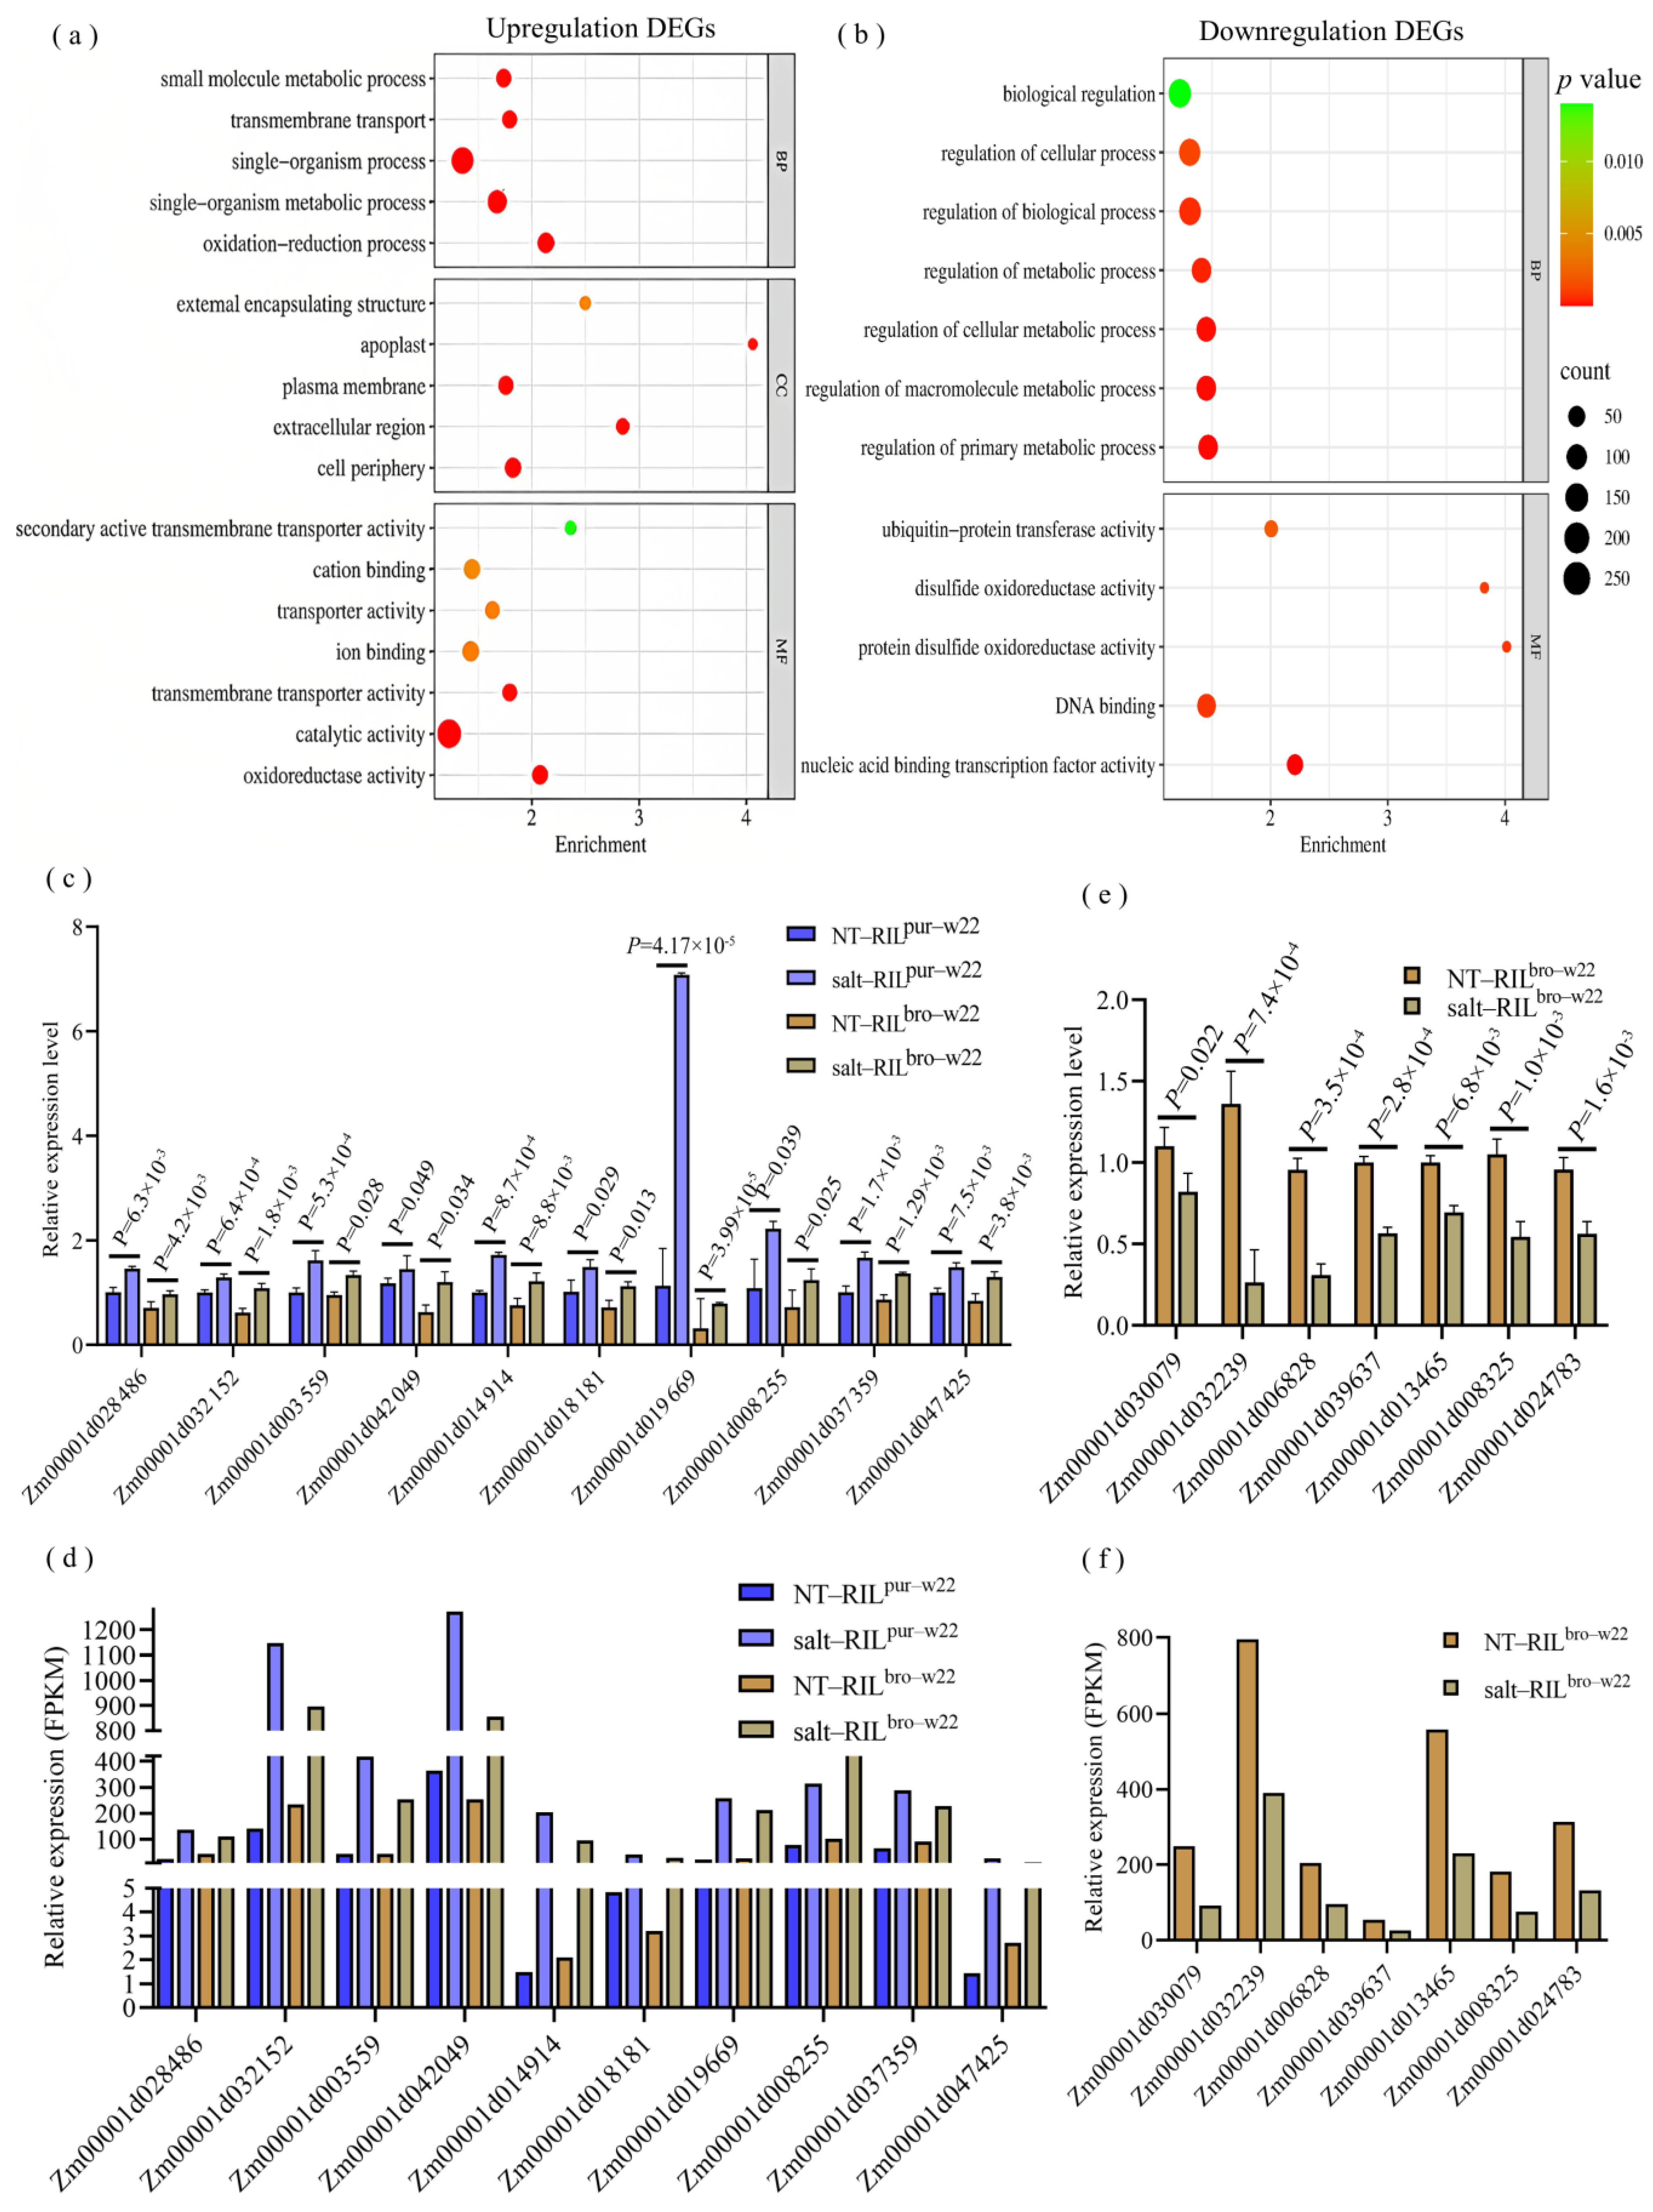
2.4. Common Salt–Induced DEGs in RILpur–W22 and RILbro–W22

Out of the 3160 common salt response DEGs identified in RILpur–W22 and RILbro–W22 seedlings, 1637 DEGs were upregulated, while 1521 DEGs were downregulated (Figure 2e, Table S1). To gain further insights into the functional pathways associated with these common DEGs, we conducted a GO functional enrichment analysis (Table S2). Among the 1637 upregulated DEGs, significant enrichment was observed in biological processes (BP) related to redox processes (GO: 0055114), monomer metabolic processes (GO: 0044710), transmembrane transport (GO: 0055085), and small molecule metabolic processes (GO: 0044281). The significantly enriched molecular functions (MF) were primarily associated with oxidoreductase activity (GO: 0016491), catalytic activity (GO: 0003824), ion binding (GO: 0043167), and transport activity (GO: 0005215). The significantly enriched cellular components (CC) were linked to the cell periphery (GO: 0071944), plasma membrane (GO: 0005886), and apoplast (GO: 0048046) (Figure 3a, Table S2). Regarding the 1521 downregulated DEGs, significant categories were mainly associated with biological regulation (GO: 0065007), metabolic process regulation (GO: 0019222), DNA binding (GO: 0003677), and ubiquitin protein transferase activity (GO: 00004842) (Figure 3b, Table S2). These findings indicate that processes such as oxidoreductase activity, ion binding, catalytic activity, and monomer metabolism play crucial roles in promoting salt stress tolerance in RILpur–W22 and RILbro–W22 seedlings.
To validate the transcriptome results, we selected several DEGs involved in the oxidoreductase activity term and performed qRT–PCR to measure their expression levels in NT–RILpur–W22, NT–RILbro–W22, salt–RILpur–W22, and salt–RILbro–W22 seedlings. Remarkably, the expression patterns of these DEGs were consistent with the transcriptome data, reinforcing the reliability of the transcriptome sequencing results (Figure 3c).

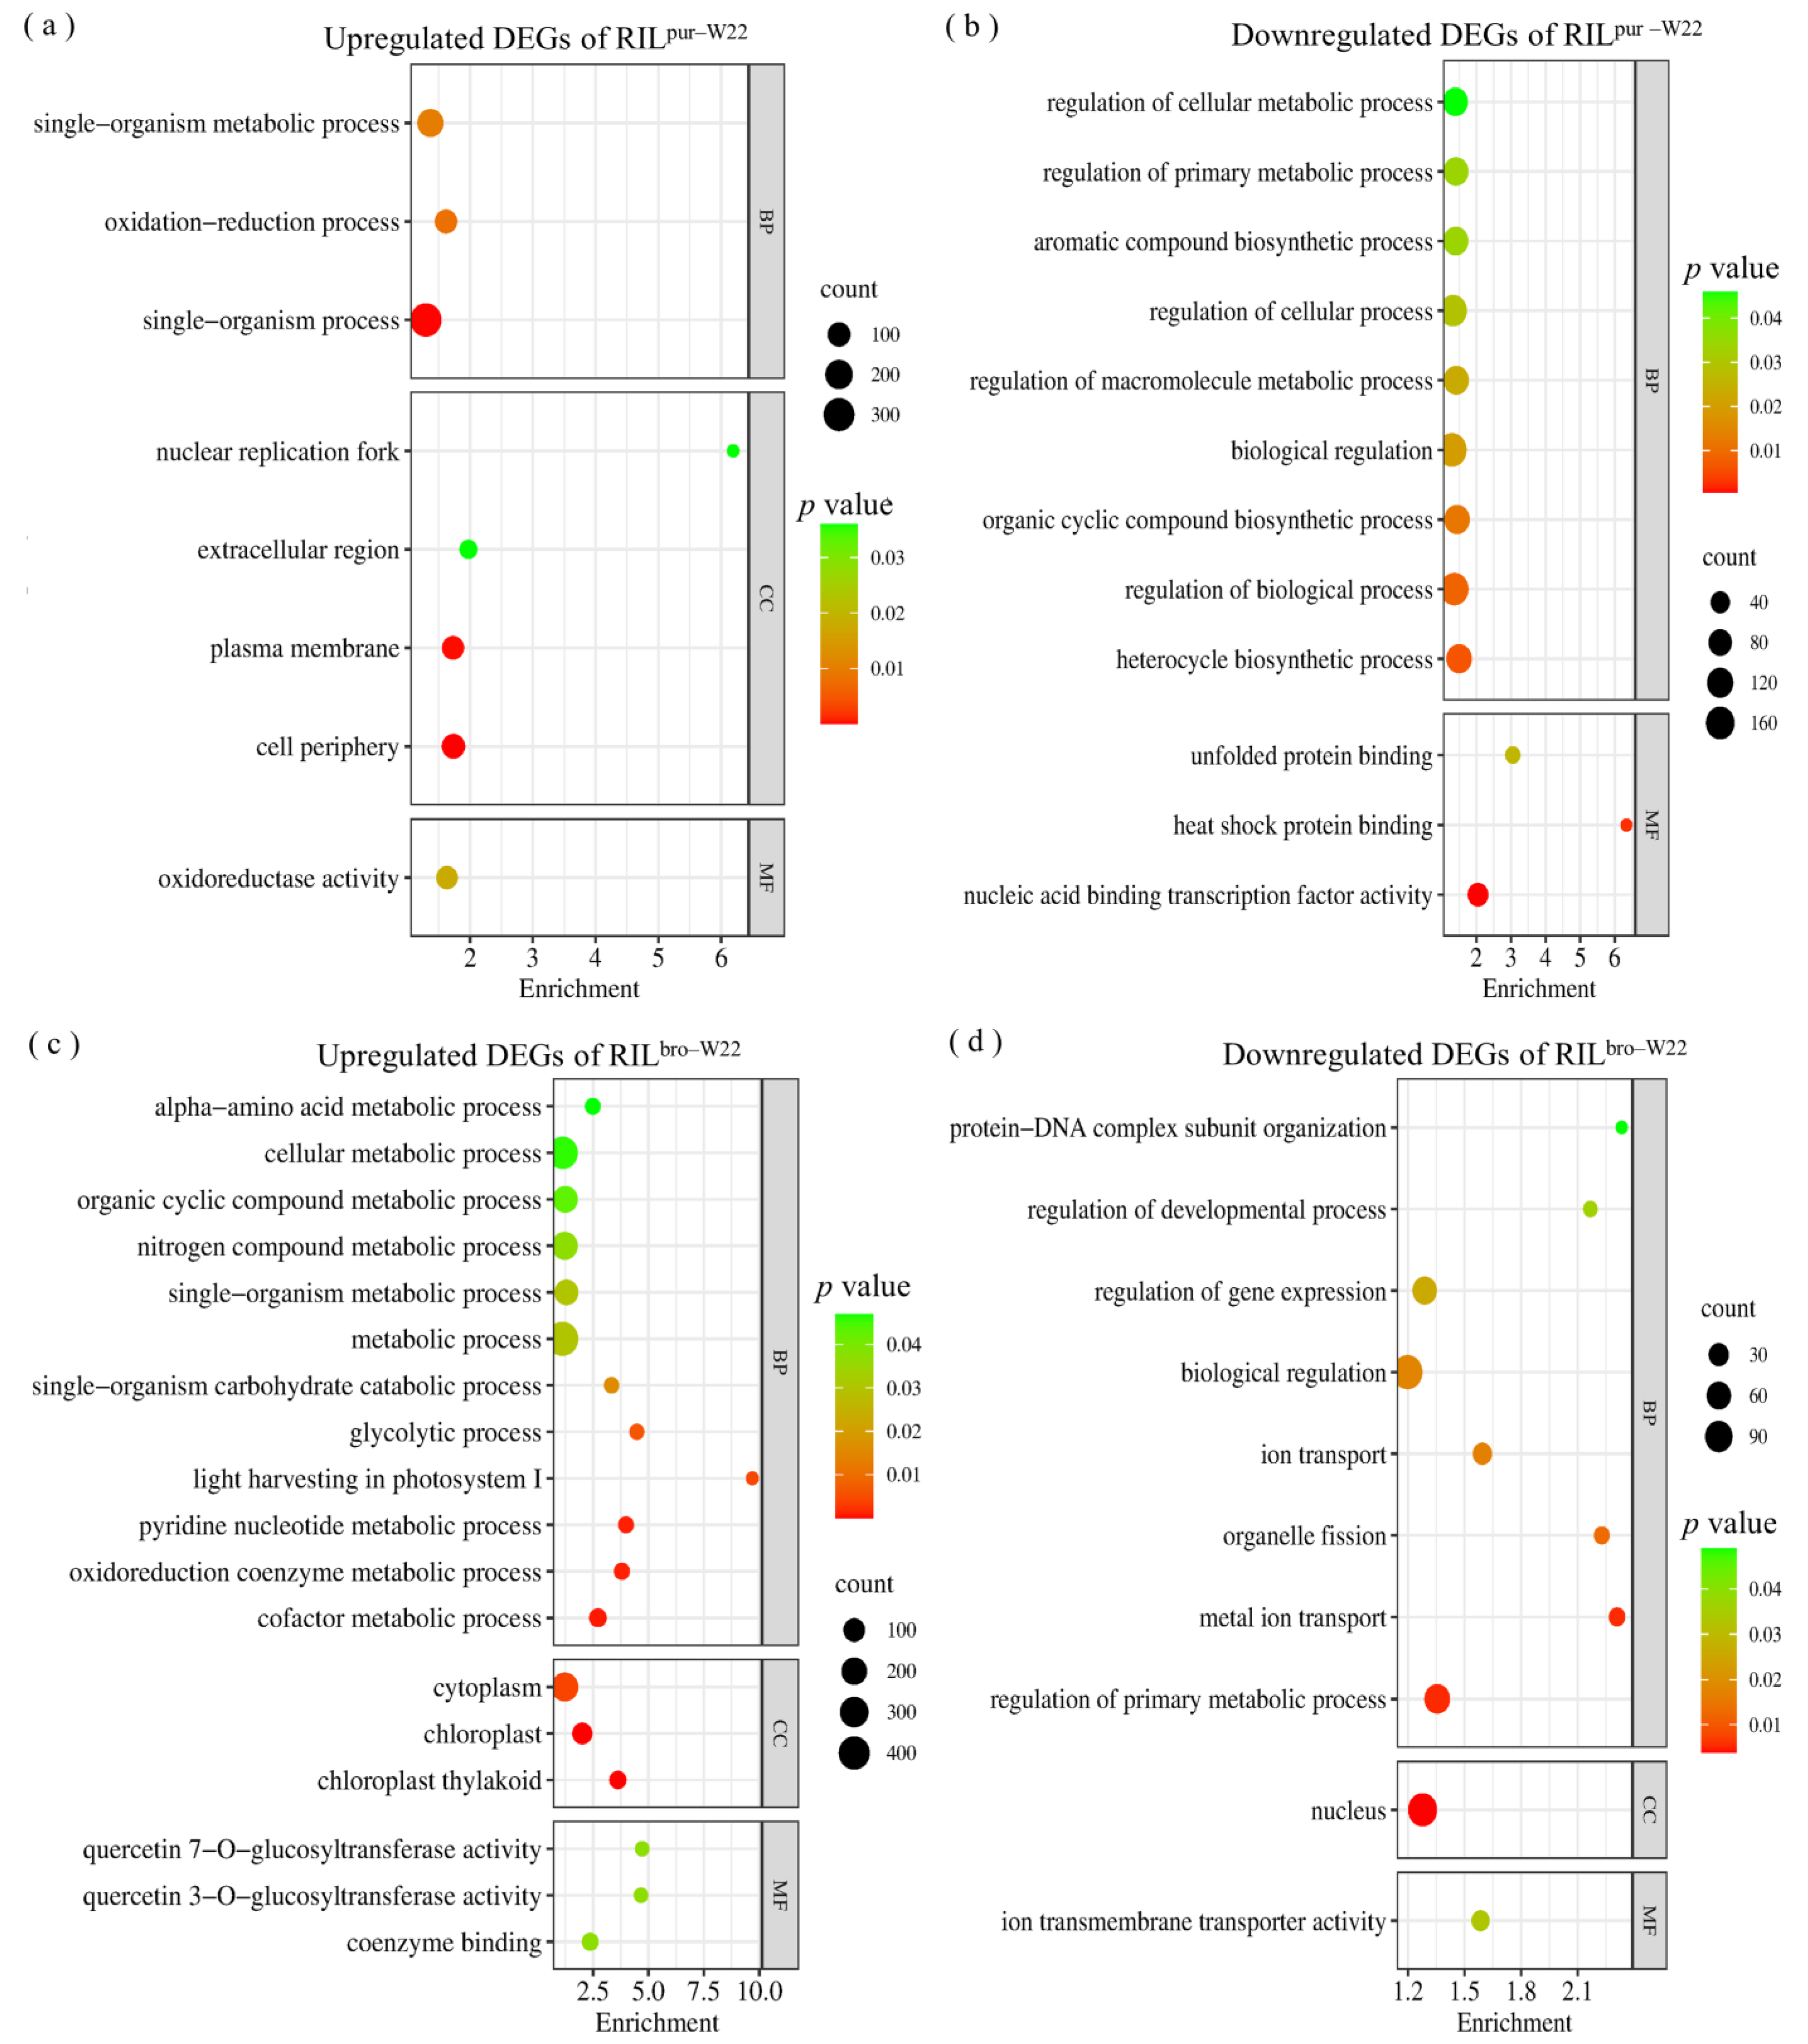
2.5. Specific Salt–Induced DEGs in RILpur–W22 and RILbro–W22

In comparison to RILbro–W22 seedlings, RILpur–W22 seedlings exhibited stronger salt tolerance. We identified 1728 DEGs (887 up– and 841 downregulated) that were exclusively expressed in non–treated RILpur–W22 seedlings and salt–treated RILpur–W22 seedlings (NT–RILpur–W22 vs. salt–RILpur–W22) and were not observed in other groups (Figure 2e, Tables S3 and S4). Therefore, these genes are considered to be DEGs specifically responding to salt stress in RILpur–W22 seedlings. Additionally, we discovered 1475 DEGs (818 up– and 657 downregulated) exclusively expressed in non–treated RILbro–W22 seedlings and salt–treated RILbro–W22 seedlings (NT–RILbro–W22 vs. salt–RILbro–W22).
We examined the expression patterns of these DEGs in RILpur–W22 and RILbro–W22 seedlings and observed that the specific DEGs in the NT–RILpur–W22 vs. salt–RILpur–W22 group exhibited significant expression changes in RILpur–W22 seedlings under salt stress compared to non–treated RILpur–W22 seedlings, while the expression levels in RILbro–W22 either remained unchanged or changed to a lesser extent (Figure S3a). Similarly, specific DEGs were identified in the NT–RILbro–W22 vs. salt–RILbro–W22 group, and consistent findings were observed in RILpur–W22 (Figure S3b).
To gain further insights into the functional pathways of the DEGs specifically expressed in RILpur–W22 and RILbro–W22 seedlings, we conducted a GO enrichment analysis on the 3203 DEGs identified in these two groups (Table S6). The analysis revealed that the 887 specific, upregulated DEGs in the NT–RILpur–W22 vs. salt–RILpur–W22 group were significantly enriched in functional pathways related to single biological metabolic processes (GO: 0044710), redox processes (GO: 0055114), oxidoreductase activity (GO: 0016491), and the plasma membrane (GO: 0005886) (Figure 4a). On the other hand, the 841 specific, downregulated DEGs were primarily enriched in functional pathways associated with the regulation of anabolism, such as biological regulation (GO: 0065007), the regulation of cellular processes (GO: 0050794), and the regulation of primary metabolic processes (GO: 0080090) (Figure 4b). Additionally, under salt stress, RILpur–W22 seedlings exhibited the induction of genes involved in the anthocyanin synthesis pathway, leading to anthocyanin accumulation (Figure 4b). The upregulation of genes related to redox processes and oxidoreductase activity in RILpur–W22 seedlings after salt treatment further indicates the enhancement of salt tolerance, as it promotes the accumulation of antioxidant substances.
Furthermore, we observed that the GO enrichment analysis of the 818 specific, upregulated DEGs in the NT–RILbro–W22 vs. salt–RILbro–W22 group revealed significant enrichment in functional pathways related to cell metabolism (GO: 0044237), nitrogen compound metabolism (GO: 0006807), chloroplast (GO: 0009507), photosynthesis (GO: 0009768), and quercetin 7–O–glucosyltransferase activity (GO: 0080044) (Figure 4c, Table S7). On the other hand, the 657 specific, downregulated DEGs showed significant enrichment in functional pathways associated with biological regulation (GO: 0065007), the nucleus (GO: 0005634), gene expression regulation (GO: 0010468), ion transport (GO: 0006811), and the regulation of developmental processes (GO: 0050793) (Figure 4d, Table S7). Notably, the enrichment analysis of upregulated DEGs in RILbro–W22 seedlings revealed the enrichment of genes related to quercetin 3–O–glucosyltransferase activity and quercetin 7–O–glucosyltransferase activity. These enzymes are involved in the glycosylation of unstable anthocyanins in the flavonoid synthesis pathway, resulting in the production of stable and antioxidant quercetin [40,41]. Additionally, the enrichment of downregulated DEGs in genes related to the regulation of developmental processes indicates that the growth and development of RILbro–W22 seedlings were hindered under salt stress. Moreover, the results of a qRT–PCR analysis of seven DEGs that regulate the developmental process and the seedling growth phenotype of RILbro–W22 under salt treated also confirmed this point (Figure 3d).
In addition, to investigate additional functional pathways that may contribute to the salt tolerance of RILbro–W22 under salt–treated conditions, we conducted a GO enrichment analysis on 140 DEGs (65 upregulated DEGs and 75 downregulated DEGs) specifically responsive to salt stress in the salt–RILpur–W22 vs. salt–RILbro–W22 group (Figure 2e, Table S5). The enrichment analysis revealed that the upregulated DEGs, in addition to being enriched in functional pathways related to single–cell biological processes, oxidoreductase activity, and redox processes, were also significantly enriched in functional pathways associated with ester bond hydrolase activity (GO: 0016788), glycosyltransferase activity (GO: 0016757), and the carbohydrate metabolism process (GO: 0005975) (Figure 5a, Table S8). On the other hand, the downregulated DEGs showed significant enrichment in functional pathways related to the plasma membrane (GO: 0005886), iron ion binding (GO: 0005506), signal transduction (GO: 0007165), cell response to stimulation (GO: 0051716), and transport activity (GO: 0005215) (Figure 5b, Table S8). The enrichment of these functional categories in the upregulated genes suggests potential mechanisms underlying the enhanced salt tolerance of RILbro–W22. Additionally, it was observed that the RILbro–W22 seedlings exhibited greater damage under stress conditions compared to RILpur–W22 seedlings, particularly affecting the plasma membrane system.

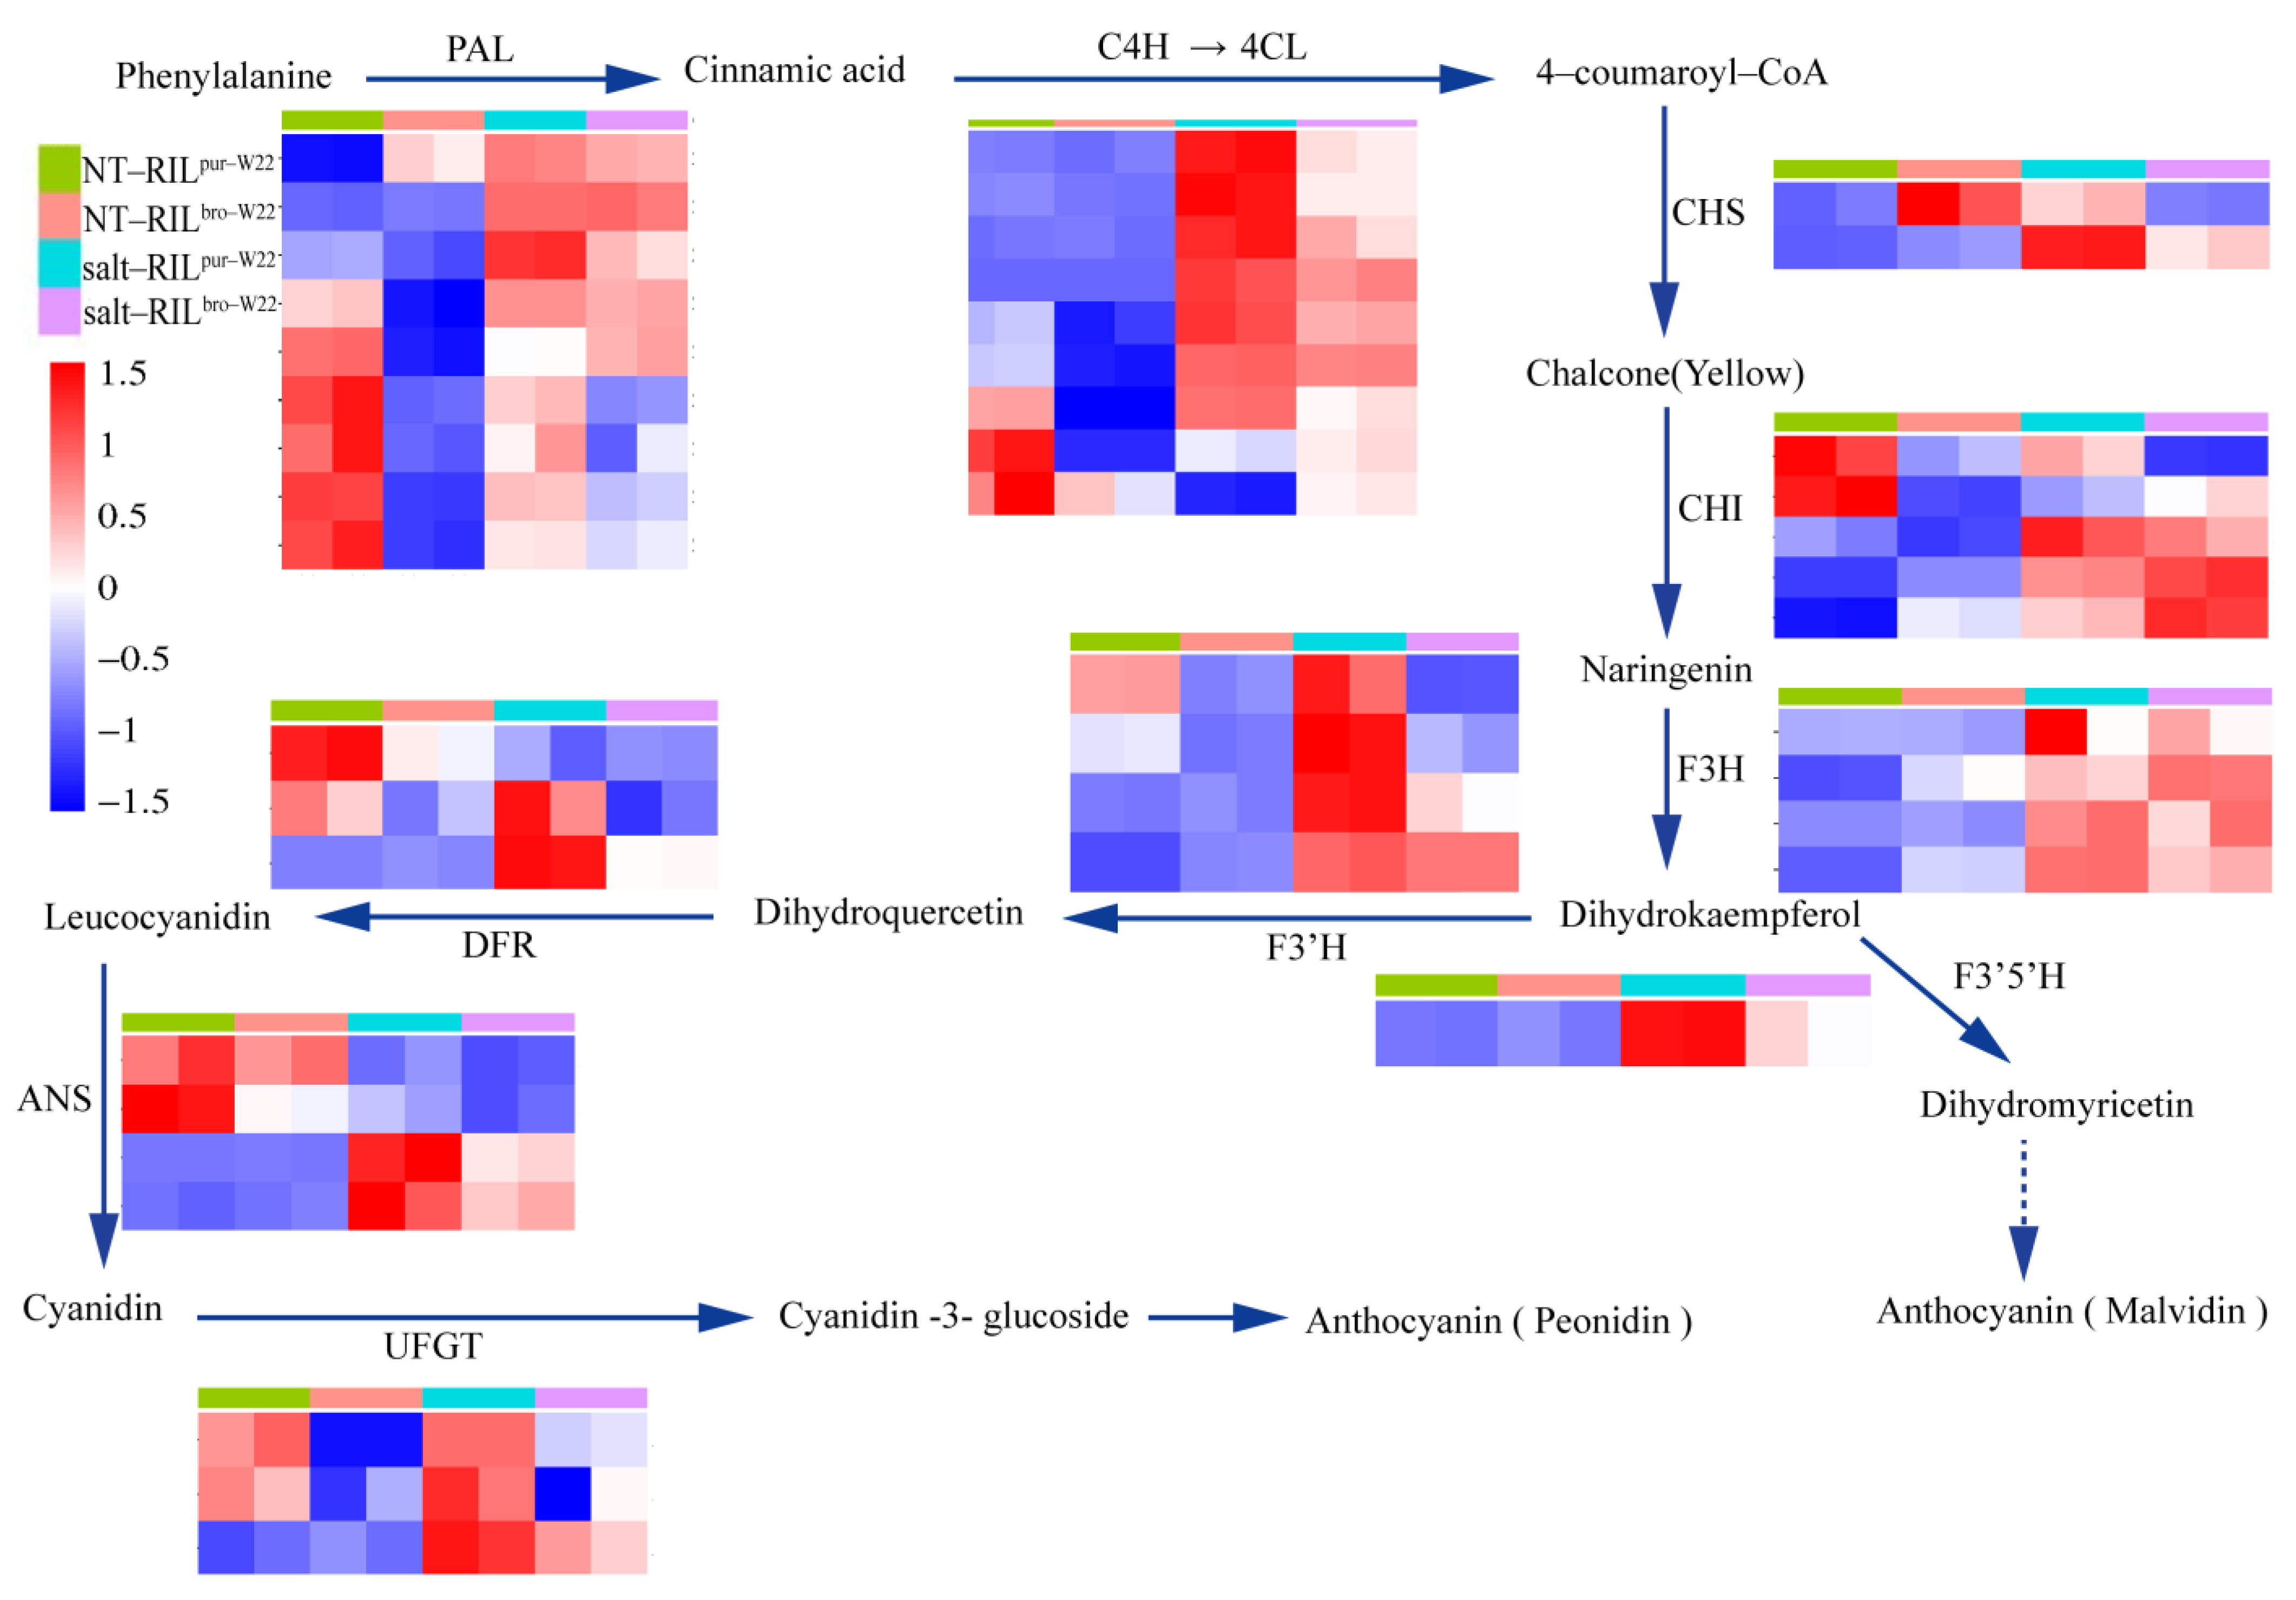
2.6. Analysis of DEGs Related to Anthocyanin Biosynthesis in RILs

To further investigate the role of anthocyanin accumulation in RILpur–W22 and RILbro–W22, we focused on 44 DEGs associated with the anthocyanin biosynthesis metabolic pathway. Analysis of these DEGs revealed that they could be classified into 11 types of enzymes involved in the anthocyanin synthesis pathway. These enzymes catalyze the conversion of phenylalanine into stable anthocyanins. To visualize the expression patterns of these genes, we normalized the gene expression data across all samples and generated a heat map. The results demonstrated that the majority of genes encoding enzymes in the anthocyanin synthesis pathway were strongly induced in salt–treated RILpur–W22 seedlings, exhibiting higher expression levels than in non–treated RILpur–W22 seedlings. Interestingly, some genes were also slightly induced in salt–treated RILbro–W22 seedlings. Notably, the genes Zm00001d034635 and Zm00001d001960, which encode CHI enzymes, showed even stronger induction in RILbro–W22 seedlings compared to RILpur–W22 seedlings (Figure 6a). In the previous qRT–PCR verification results, we found that the anthocyanin–synthesis–pathway–related genes Zm00001d014914 (a2), Zm00001d018181 (fls2), and Zm00001d047425 (F3′5′H) were upregulated in RILpur–W22 under salt stress (Figure 3c). At the same time, the results of previous studies in our laboratory have shown that salt stress can induce the expression of the anthocyanin–synthesis–pathway–related genes F3H, DFR, and ANS [20], and the expression levels of these three genes in RILpur–W22 seedlings are always higher than those in RILbro–W22, regardless of whether they are untreated or salt–treated (Figure 6).
Furthermore, anthocyanin serves as a non–enzymatic scavenger of reactive oxygen species (ROS) and can effectively neutralize excessive ROS under stress conditions, thereby contributing to salt tolerance in seedlings [42,43]. In the case of RILpur–W22 seedlings exposed to salt stress, the genes involved in the anthocyanin synthesis pathway were induced, resulting in increased anthocyanin accumulation in the seedlings (Figure 6). Therefore, it can be speculated that RILpur–W22 seedlings enhance their tolerance to salt stress by accumulating anthocyanins and participating in the scavenging of reactive oxygen species.

3. Discussions

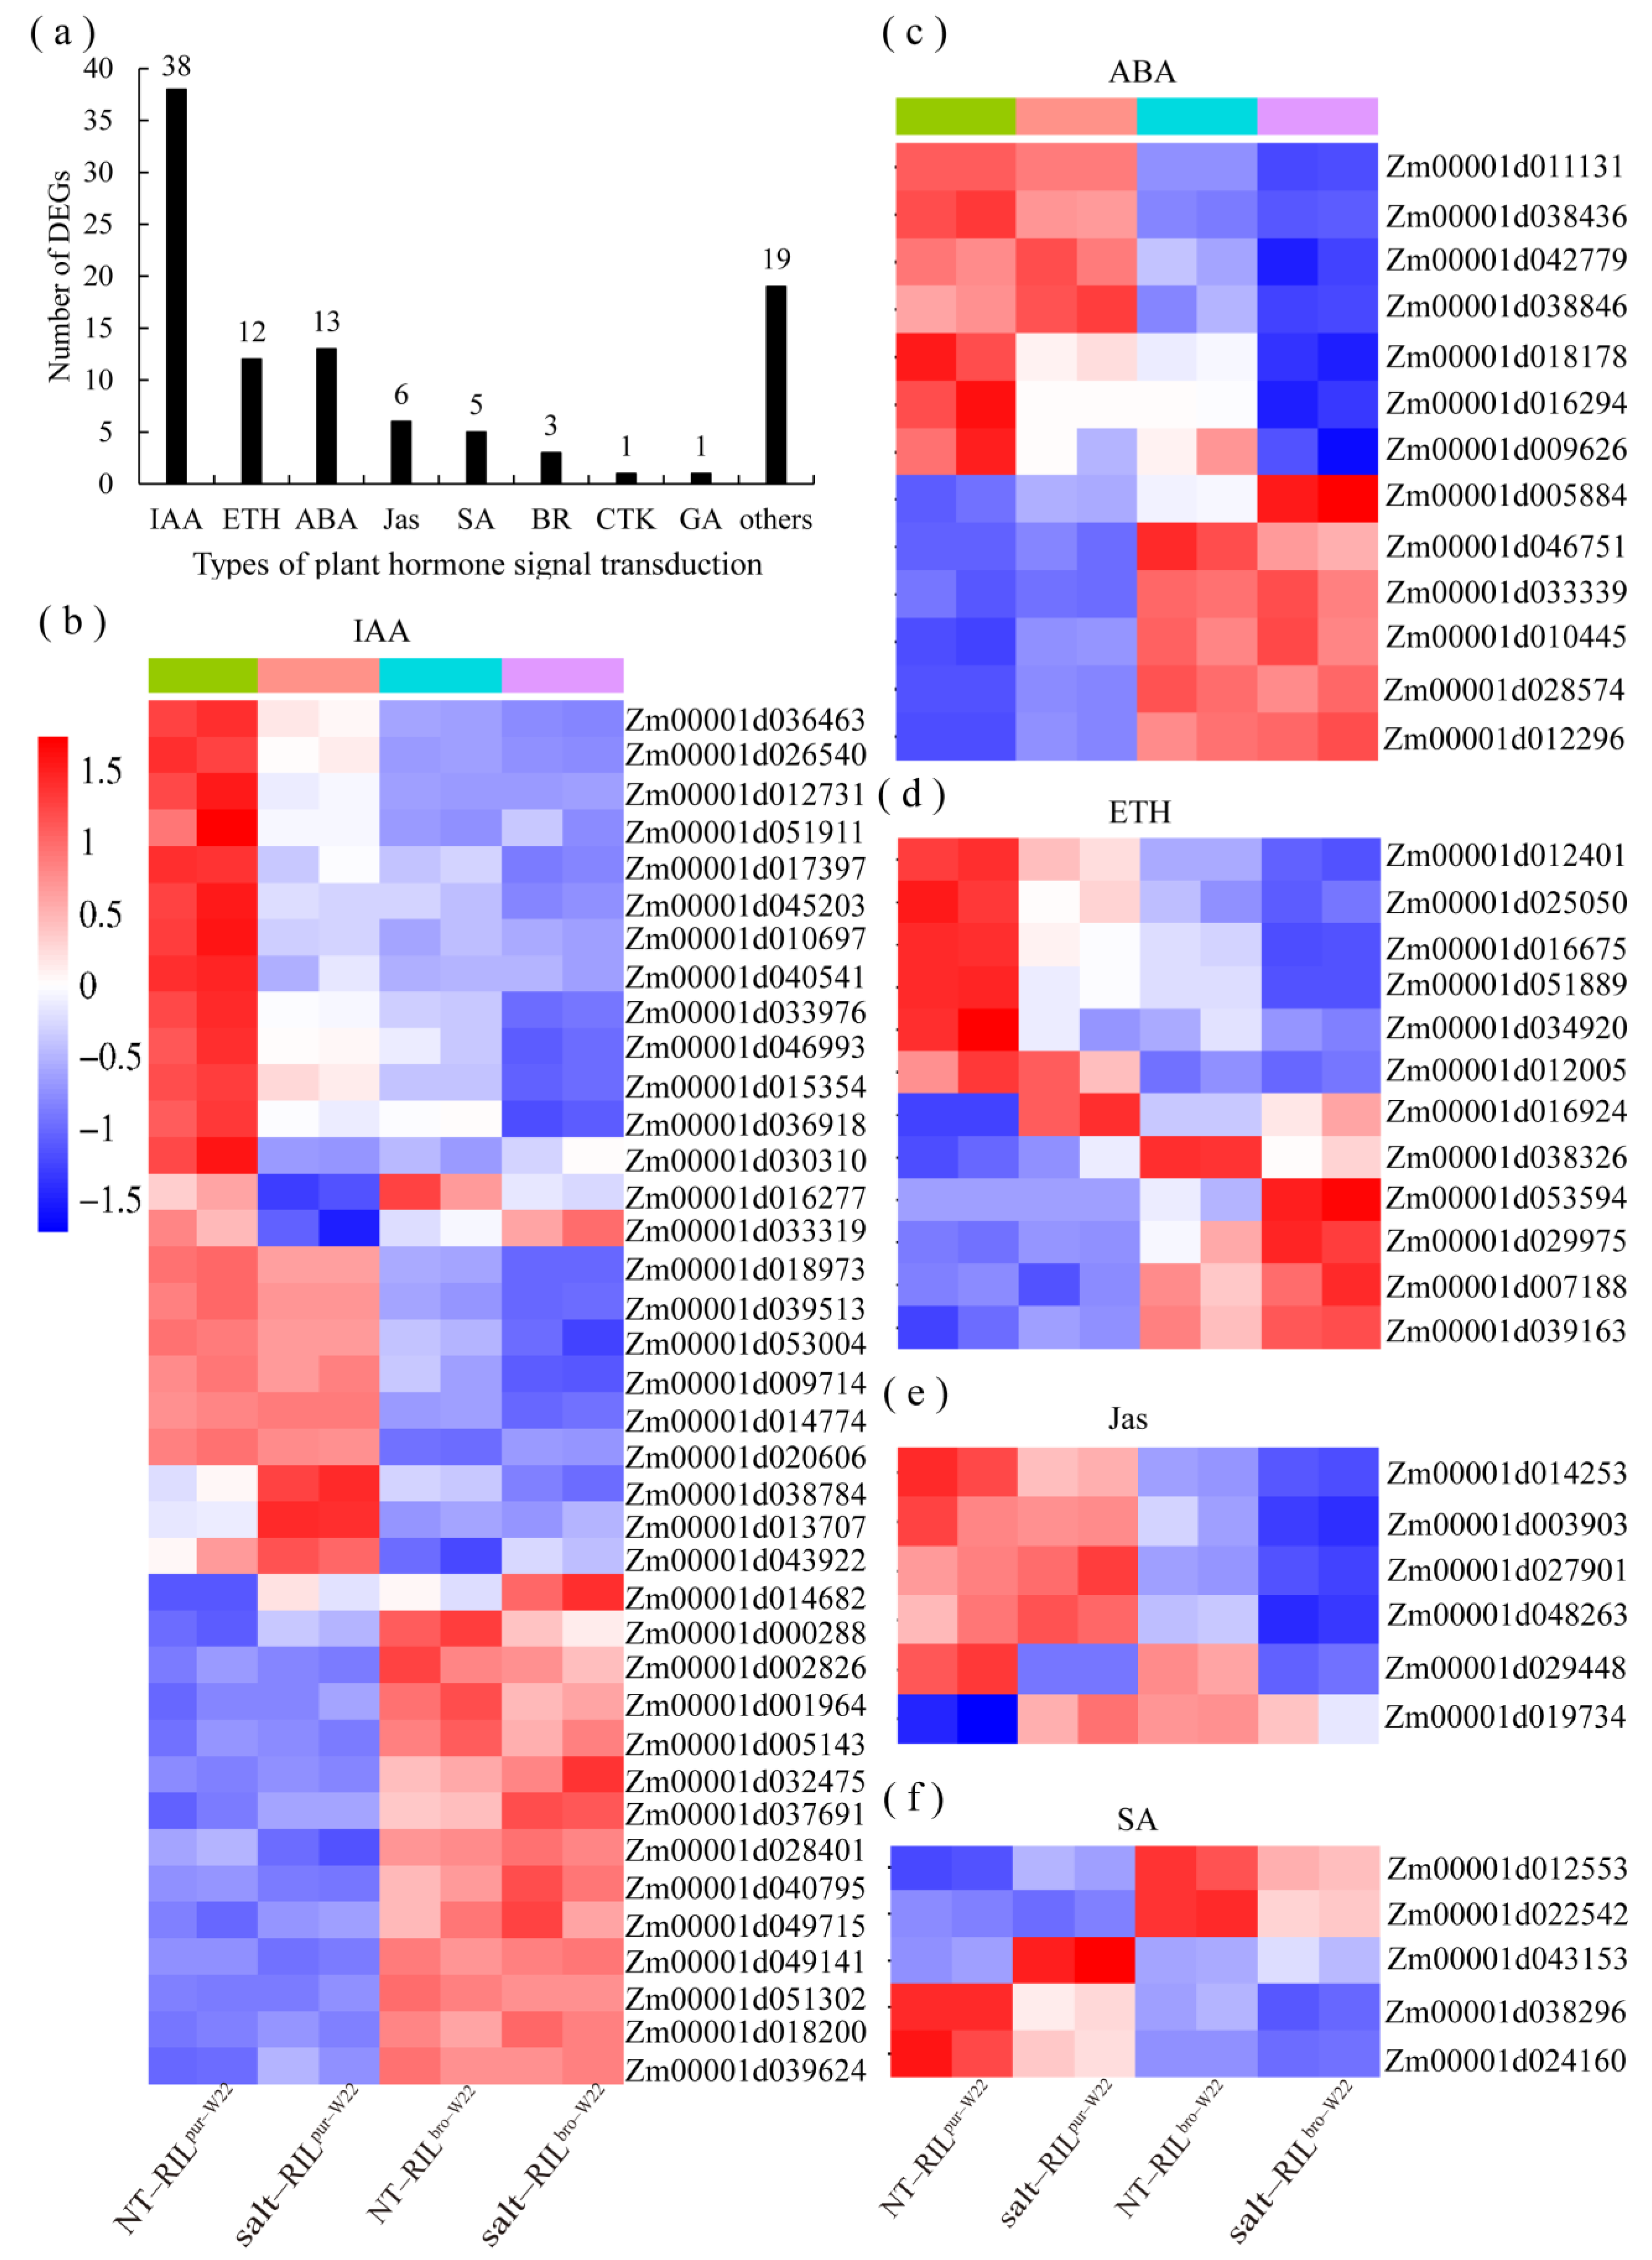
3.1. The Salt Stress Tolerance in Maize Seedlings May Be Mediated by Plant Hormones

Hormones play a crucial role in regulating plant responses to abiotic stress. Numerous studies have demonstrated the involvement of hormones in mediating plant tolerance to stress conditions [44,45,46,47]. In our study, transcriptome analysis revealed that a significant number of DEGs was enriched in the “plant hormone signaling” pathway when comparing non–treated and salt–treated RILpur–W22 and RILbro–W22 seedlings. Additionally, through KEGG pathway enrichment analysis, we observed the enrichment of precursor synthesis or metabolic pathways related to various plant hormones [48,49,50,51]. For instance, the “tryptophan biosynthesis” pathway is associated with auxin, the “methionine metabolism” pathway corresponds to ethylene, the “carotenoid synthesis” pathway is related to abscisic acid (ABA), and the “linoleic acid metabolism” pathway is correlated with jasmonic acid (Jas) (Figure S3). These findings indicate the involvement of multiple hormone pathways in the response of RILpur–W22 and RILbro–W22 seedlings to salt stress.
Under abiotic stress conditions, plants exhibit the upregulation of genes related to ABA biosynthesis pathway. High levels of ABA can induce the accumulation of H2O2 in chloroplasts, leading to stomatal closure and enhancing plant resistance to abiotic stress [52]. Additionally, gibberellins (GAs) can regulate seed germination and seedling growth tolerance to abiotic stress by maintaining ROS homeostasis, thereby increasing the germination rate and productivity [53]. IAA plays a crucial role in plant tolerance to abiotic stresses. For instance, loss of function of the OsIAA20 gene in rice reduces salt tolerance, affecting yield and seed viability [54]. In apples, the degradation of the MdIAA26 protein by auxin promotes anthocyanin accumulation in fruits [55]. In this study, DEGs enriched in the “plant hormone signal transduction” pathway were analyzed. It was found that of the 98 DEGs, 38 encoded proteins related to indole–3–acetic acid (IAA), 13 encoded ABA–related proteins, 12 encoded ethylene–related proteins, and 16 encoded proteins related to Jas, salicylic acid (SA), brassinosteroids (BR), cytokinins (CTK), and GA (Figure 7a). The cluster heat map of the above hormone–related DEGs was drawn, and it was found that only 15 IAA–related genes were upregulated, while the remaining 23 were downregulated (Figure 7b). Similarly, there were six upregulated and seven downregulated DEGs related to ABA, five upregulated and seven downregulated DEGs related to ACC, one upregulated and five downregulated DEGs related to Jas, and three upregulated and two downregulated DEGs related to SA (Figure 7c–f). Based on the results of previous studies and the transcriptome analysis performed in this study, we speculated that the biosynthesis and signal transduction of plant hormones are inhibited during the development of RILbro–W22 seedlings under salt stress conditions. As a result, RILbro–W22 seedlings may experience difficulty in efficiently removing excessive ROS accumulation, leading to reduced salt tolerance.

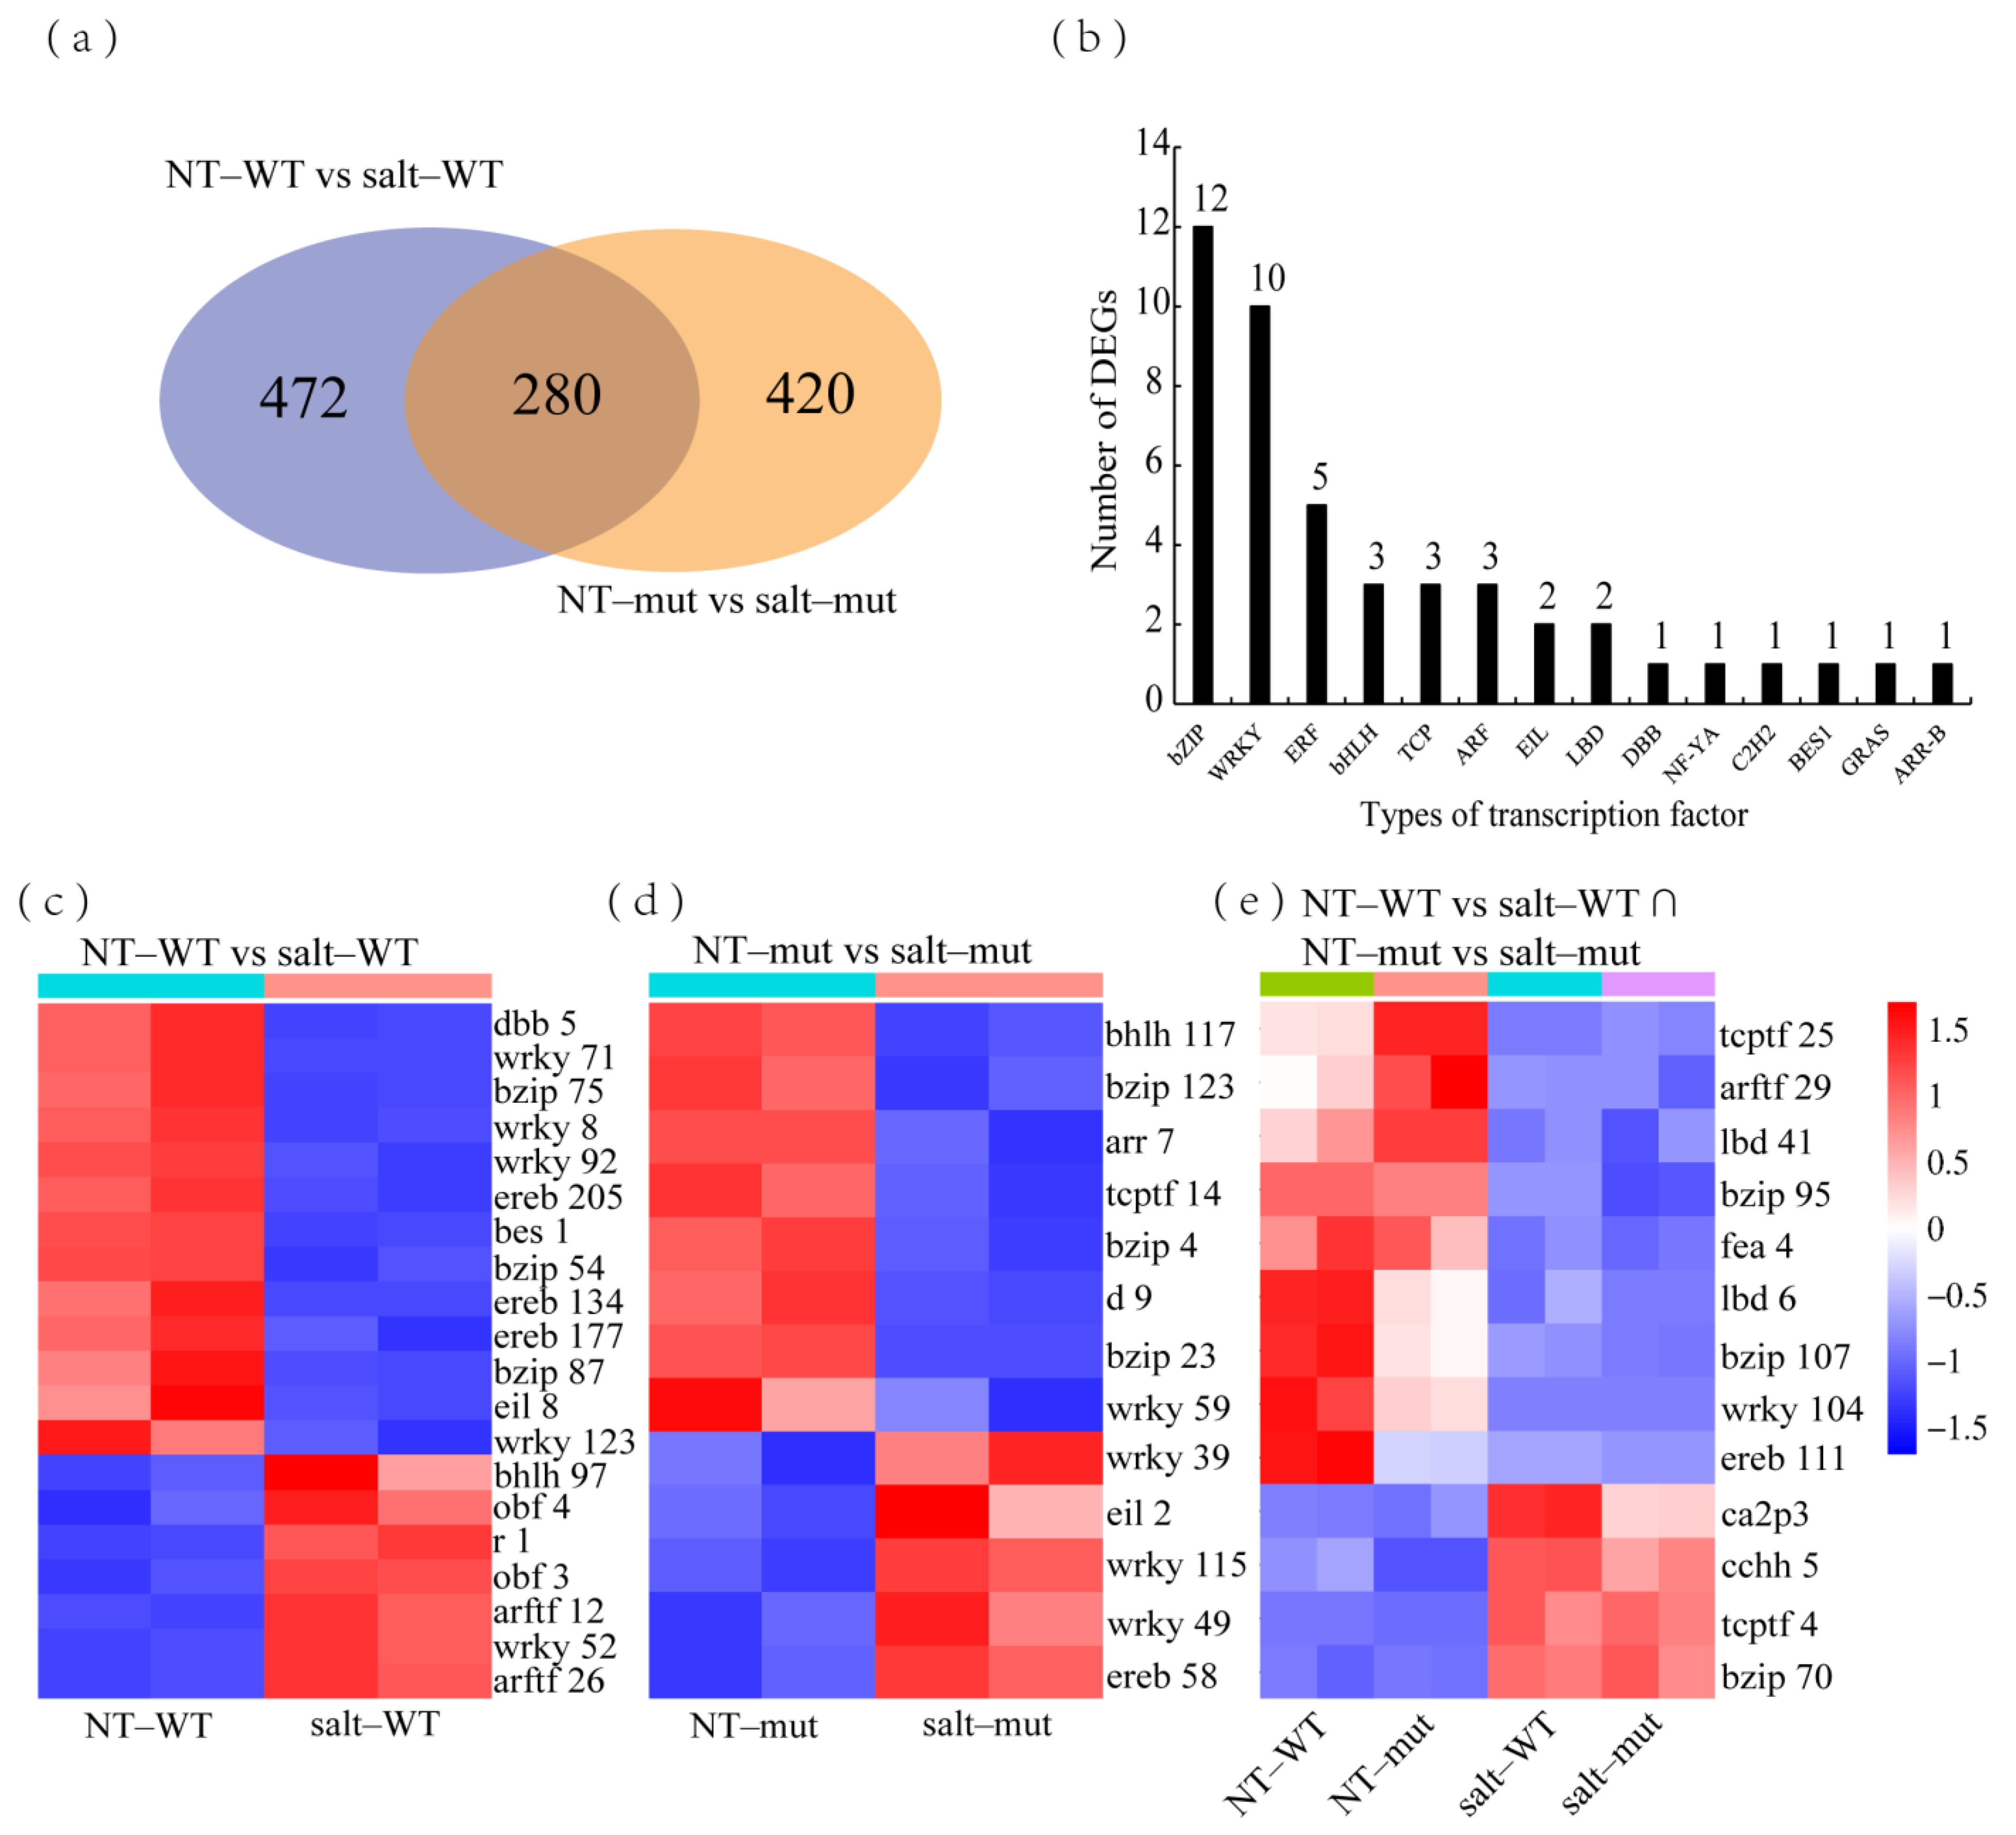
3.2. Mining Transcription Factors That Potentially Regulate Salt Stress Tolerance in Maize Seedlings

Previous studies have demonstrated the involvement of transcription factors belonging to the bZIP, NAC, MYB, and WRKY families in regulating plant responses to salt stress [56,57,58,59]. In this study, we retrieved a total of 2194 transcription factors from the Plant Transcription Factor Database (http://planttfdb.gao–lab.org/index.php, accessed on 26 June 2023). And we identified 472 and 420 DEGs encoding transcription factors in the NT–RILpur–W22 vs. salt–RILpur–W22 and NT–RILbro–W22 vs. salt–RILbro–W22 groups, respectively (Figure 8a). KEGG analysis revealed the significant enrichment of DEGs encoding transcription factors in the “plant hormone signal transduction” and “plant MAPK signaling pathway” categories for both groups (Figure S4). These results further support the involvement of plant hormones in mediating salt stress tolerance in maize seedlings. Notably, studies by Cai et al. have demonstrated that maize ZmWRKY17 negatively regulates ABA signal transduction to enhance salt tolerance in seedlings [60], while rice OsWRKY50 gene positively regulates ABA–independent signaling to enhance salt tolerance [61]. These findings further corroborate our speculations.
Further analysis focused on the 46 enriched transcription factors (Figure 8b). Among them, twelve DEGs belonged to the bZIP family, ten belonged to the WRKY family, and the remaining belonged to ERF (five DEGs), bHLH (three DEGs), and TCP (three DEGs) families. By comparing the expression patterns of these 46 transcription factors between non–treated and salt–stressed RILpur–W22 and RILbro–W22 seedlings, we observed significant changes in expression levels in RILpur–W22 seedlings under salt stress compared to non–treated RILpur–W22 seedlings. Similarly, DEGs exclusively expressed in the NT–RILbro–W22 vs. salt–RILbro–W22 group showed similar expression patterns in RILbro–W22 seedlings under different treatments (Figure 8c–e). These findings suggest that different transcription factors may positively regulate seedling tolerance to salt stress while others may exert negative regulatory roles. This also provides new insights and candidate genes for further research on transcription factors to enhance the salt tolerance of maize seedlings by regulating anthocyanin–synthesis–related genes in the future.

4. Materials and Methods

4.1. Evaluation of Plant Materials and Traits

The purple W22 (pur–W22) inbred line was obtained from the laboratory of Professor Mingliang Xu, International Maize Improvement Center, China Agricultural University. The bronze W22 (bro–W22) inbred line was obtained from the mutant maize COOP stock center. The homozygous RILpur–W22 and RILbro–W22 materials were selected from the cross–pollination (or reciprocal cross) of pur–W22/bro–W22 for generations in both Sanya (Hainan province) and Zhuozhou (Hei Bei province), in winter and summer, respectively.
Standard germination: 90 seeds (3 replicates, 30 in each replicate) were disinfected in 0.1% sodium hypochlorite for 5 min, rinsed with distilled water three times, and then sown in germination paper. The rolled germination paper was placed vertically in a sealed plastic bag and cultured in an incubator with a light/dark cycle of 16 h/8 h at 25 °C.
Salt–treated paper germination: 90 seeds were disinfected using standard germination steps, seeded on germination paper containing 100 mM NaCl solution, and then cultured according to standard germination culture conditions.
Cultivation in sand: 90 seeds were sterilized in 0.1% sodium hypochlorite solution, washed three times with distilled water, and sowed in sandy soil containing 0 mM and 100 mM NaCl solutions. The germination box after sowing was placed in an incubator at 25 °C and cultured at a 16 h/8 h light–dark ratio for 14 days. Stem length and root length were measured with a ruler 14 days after sowing. The histogram of root length and seedling length was drawn using the Graphpad Prism 8 software package, and the p value was calculated by one–way analysis of variance.

4.2. Phenotypic Analysis of Seed Morphology

Fifty randomly selected seeds were scanned three times repeatedly using an EPSON J221A scanner (Seiko Epson Corporation, Suga, Nagano–ken, Japan), and then the data regarding seed length, seed width, and seed thickness were analyzed using the Seeds Identification and Photoshop software packages [62]. Finally, the Graphpad Prism 8 software package was used to plot the measured data, and one–way analysis of variance was used to calculate the p value.

4.3. RNA Extraction and Sequencing

RILpur–W22 and RILbro–W22 seedlings (including shoots and roots, with the seeds removed) germinated for 14 days in 0 mM and 100 mM NaCl solution environments for RNA sequencing, with two replicates for each sample. Total RNA was extracted using the RNA extraction kit (Mei5bio, Beijing, China). RNA concentration and quality were measured using an ultra–micro spectrophotometer ND2000 (Thermo Scientific, New York, NY, USA). The prepared RNA was sent to Annoroad Gene Technology (Beijing, China) for library construction, sequencing, and data filtering (Table S9). Using the DNBSEQ–T7 sequencing platform, and the libraries were sequenced with a read length of 150 bp (pair–end).

4.4. Sequence Data Analysis

The filtered data were used to establish a genome index file using the Hisat2 program and were compared to the maize reference genome (B73_RefGen_v4) [63]. The Samtools program was used to convert the compared.sam format file into a .bam format file for subsequent data call and analysis. Transcripts were assembled and gene expression was estimated using the Stringtie and FeatureCounts programs. Differentially expressed genes were analyzed using the R language program DESeq2 (https://bioconductor.org/packages/release/bioc/html/DESeq2.html, accessed on 26 June 2023) [64]. When analyzing the RNA–Seq data of non–treated and salt–treated seedlings, the screening conditions were an adjusted p–value of <0.01 and an absolute difference multiple fold change (FC) of ≥2. The FPKM value is calculated using the number of raw reads, and the formula is: FPKM = read count/(mapping reads (millions)) × exon length (KB). If FPKM ≥ 1 in at least one sample, the gene was considered to be an expressed gene. All of the expressed genes from different samples were applied to TBtools for PCA calculation, using the default settings [65].

4.5. Cluster Analysis and Functional Annotation Enrichment Analysis

The obtained differentially expressed genes were subjected to gene ontology (GO) enrichment analysis using agriGO v2.0 (agriGO single species analysis) [66]. After the gene ID was converted using MaizeGDB (https://www.maizegdb.org/gene_center/gene, accessed on 26 June 2023), KOBAS (http://kobas.cbi.pku.edu.cn/, accessed on 26 June 2023) was used for Kyoto Encyclopedia of Genes and Genomes (KEGG) pathway enrichment analysis [67].

4.6. qRT–PCR Analysis

First–strand cDNA was synthesized using a StarScript II RT Mix with gDNA Remover kit (GenStar, Beijing, China). qRT–PCR was performed using 2 × HQ SYBR qPCR Mix (Zomanbio, Beijing, China) in triplicate on an ABI Life Q6 real–time fluorescent quantitative PCR instrument (Applied Biosystems, Waltham, MA, USA) and using the obtained results and the 2–ΔCT method for relative quantification. The GAPDH was used as an internal control. The primer sequences used are listed in Table S10.

5. Conclusions

We screened two maize W22 inbred lines (salt–tolerant line pur–W22 and sensitive line bro–W22) regarding the different salt tolerance levels of seedlings under a salt stress environment and performed transcriptome analysis of their RILs to identify the genes related to the salt stress tolerance of maize seedlings. We found that the specific expression of DEGs in the salt tolerance of RILpur–W22 seedlings was mainly related to the redox process, biological regulation, and the plasma membrane. Among them, anthocyanidin–synthesis–related genes were strongly induced under salt treatment, which was partially consistent with the physiological results regarding salt tolerance in seedlings. The results showed that improving the anthocyanidin–synthesis–related genes in maize could effectively compensate for seedling growth inhibition caused by salt stress. This study could lay a foundation for mining and cloning key genes affecting the salt tolerance of maize seedlings under salt stress conditions.

Supplementary Materials

The following supporting information can be downloaded at: https://www.mdpi.com/article/10.3390/plants12152793/s1. Figure S1: Characteristic analysis of seeds and seedlings for pur–W22 and bro–W22. (a–e) Seed phenotypes (a), seed lengths (b), seed widths (c), seed thicknesses (d), and 100–seed weight (e) of pur–W22 and bro–W22. (f–i) Seedling phenotypes (f), seed germination rates (g), shoot lengths (h), and root lengths (i) of pur–W22 and bro–W22 grown for 7 days under non–treated and salt–treated (100 mM NaCl solution) conditions. Bar = 1 cm; black dots represent individual values; p values calculated by one–way ANOVA; p < 0.05 represents a significant difference; p < 0.01 represents the difference is extremely significant; ns represents no difference. (j) Seedling phenotypes of pur–W22 and bro–W22 grown for 14 days under non–treated and salt–treated conditions. Figure S2: The volcano plots of differentially expressed genes (DEGs) in the NT–RILpur–W22 vs. NT–RILbro–W22 (a), NT–RILpur–W22 vs. salt–RILpur–W22 (b), NT–RILbro–W22 vs. salt–RILbro–W22 (c), and salt–RILpur–W22 vs. salt–RILbro–W22 (d) groups. Figure S3: Heatmap cluster of DEGs which specifically expressed in RILpur–W22 (a) and RILbro–W22 (b) seedlings in response salt stress. The left side shows upregulated DEGs, and the right side shows downregulated DEGs. Each sample has two compartments, which are two biological replicates. According to the standardized FPKM, red and blue indicate high and low abundance, respectively. Figure S4: KEGG analysis of DEGs in the NT–RILpur–W22 vs. NT–RILbro–W22 (a), salt–RILpur–W22 vs. salt–RILbro–W22 (b), NT–RILpur–W22 vs. salt–RILpur–W22 (c), NT–RILbro–W22 vs. salt–RILbro–W22 (d), and NT–RILpur–W22 vs. salt–RILpur–W22 ∩ NT–RILbro–W22 vs. salt–RILbro–W22 (e) groups. Figure S5: KEGG analysis the DEGs’ encoding transcription factors in the NT–RILpur–W22 vs. salt–RILpur–W22 (a), NT–RILbro–W22 vs. salt–RILbro–W22 (b) and NT–RILpur–W22 vs. salt–RILpur–W22∩NT–RILbro–W22 vs. salt–RILbro–W22 (c) groups. Table S1: Common DEGs’ responses to salt stress in RILpur–W22 and RILbro–W22 seedlings. Table S2: GO analysis of common DEGs. Table S3: Specially expressed DEGs in RILpur–W22 seedlings under non–treated and salt–treated conditions. Table S4: Specially expressed DEGs in RILbro–W22 seedlings under non–treated and salt–treated conditions. Table S5: Specially expressed DEGs in RILpur–W22 and RILbro–W22 seedlings under salt–treated conditions. Table S6: GO analysis of specially expressed DEGs in RILpur–W22 seedlings under non–treated and salt–treated conditions. Table S7: GO analysis of specially expressed DEGs in RILbro–W22 seedlings under non–treated and salt–treated conditions. Table S8: GO analysis of specially expressed DEGs in RILpur–W22 and RILbro–W22 seedlings under salt–treated conditions. Table S9: Summary of RNA–Seq data. Table S10: Primer list for qRT–PCR.

Author Contributions

L.L. conceived and designed the research. J.W. (Jie Wang) and Z.Y. performed the experiments and analyzed the data. D.L., Z.L. and M.C. assisted with the field work. X.D. and Q.C. provided technical assistance. R.G. and J.W. (Jianhua Wang) provided technical support. L.L. and J.W. (Jie Wang) wrote the article. All authors have read and agreed to the published version of the manuscript.

Funding

This work was funded by the National Key R & D Program of China (2022YFD1900704); the National Natural Science Foundation of China: 32272162, 32072130; the Biological breeding support program of China (2022ZD040190101, 2022ZD040190502); the China Agriculture Research System: (CARS–02–13); the Sanya Yazhou Bay Science & Technology City Joint project of Hainan Science & Technology Plan (320LH012), and the 2115 Talent Development Program of China Agricultural University.

Institutional Review Board Statement

Not applicable.

Informed Consent Statement

Not applicable.

Data Availability Statement

The data that support the findings of this study are available at www.ncbi.nlm.nih.gov/geo with accession number PRJNA986440.

Acknowledgments

We would like to thank Patrick S. Schnable for the technical support he provided in the genetic selection of the population background, Mingliang Xu from International Maize Improvement Center in CAU for his generous donation of W22 seeds, and Guoying Wang and his team for funding the winter nursery.

Conflicts of Interest

The authors declare that they have no known competing financial interest or personal relationships that could have appeared to influence the work reported in this paper.

References

  1. Prasanna, B.M.; Palacios–Rojas, N.; Hossain, F.; Muthusamy, V.; Menkir, A.; Dhliwayo, T.; Ndhlela, T.; San Vicente, F.; Nair, S.K.; Vivek, B.S.; et al. Molecular breeding for nutritionally enriched maize: Status and prospects. Front. Genet. 2020, 10, 1392. [Google Scholar] [CrossRef] [PubMed] [Green Version]
  2. Colombo, R.; Ferron, L.; Papetti, A. Colored corn: An up–date on metabolites extraction, health implication, and potential use. Molecules 2021, 26, 199. [Google Scholar] [CrossRef] [PubMed]
  3. Suriano, S.; Balconi, C.; Valoti, P.; Redaelli, R. Comparison of total polyphenols, profile anthocyanins, color analysis, carotenoids and tocols in pigmented maize. LWT–Food Sci. Technol. 2021, 144, 111257. [Google Scholar] [CrossRef]
  4. Chatham, L.A.; Paulsmeyer, M.; Juvik, J.A. Prospects for economical natural colorants: Insights from maize. Theor. Appl. Genet. 2019, 132, 2927–2946. [Google Scholar] [CrossRef] [PubMed]
  5. Paulaneyer, M.; Chatham, L.; Becker, T.; West, M.; West, L.; Juvik, J. Survey of anthocyanin composition and concentration in diverse maize germplasms. J. Agric. Food Chem. 2017, 65, 4341–4350. [Google Scholar] [CrossRef]
  6. Zilic, S.; Serpen, A.; Akillioglu, G.; Gokmen, V.; Vancetovic, J. Phenolic compounds, carotenoids, anthocyanins, and antioxidant capacity of colored maize (Zea mays L.) kernels. J. Agric. Food Chem. 2012, 60, 1224–1231. [Google Scholar] [CrossRef]
  7. Mannino, G.; Di Stefano, V.; Lauria, A.; Pitonzo, R.; Gentile, C. Vaccinium macrocarpon (Cranberry)–based dietary supplements: Variation in mass uniformity, proanthocyanidin dosage and anthocyanin profile demonstrates quality control standard needed. Nutrients 2020, 12, 992. [Google Scholar] [CrossRef] [Green Version]
  8. Pojer, E.; Mattivi, F.; Johnson, D.; Stockley, C.S. The case for anthocyanin consumption to promote human health: A review. Compr. Rev. Food Sci. Food Saf. 2013, 12, 483–508. [Google Scholar] [CrossRef]
  9. Cruz, L.; Basilio, N.; Mateus, N.; de Freitas, V.; Pina, F. Natural and synthetic flavylium–based dyes: The chemistry behind the color. Chem. Rev. 2022, 122, 1416–1481. [Google Scholar] [CrossRef]
  10. Kou, M.; Liu, Y.J.; Li, Z.Y.; Zhang, Y.G.; Tang, W.; Yan, H.; Wang, X.; Chen, X.G.; Su, Z.X.; Arisha, M.H.; et al. A novel glutathione S–transferase gene from sweet potato, IbGSTF4, is involved in anthocyanin sequestration. Plant Physiol. Bioch. 2019, 135, 395–403. [Google Scholar] [CrossRef]
  11. Graham, T.L. Flavonoid and flavonol glycoside metabolism in Arabidopsis. Plant Physiol. Bioch. 1998, 36, 135–144. [Google Scholar] [CrossRef]
  12. Anderson, D.W.; Gueffroy, D.E.; Webb, A.D.; Kepner, R.E. Identification of acetic acid as an acylating agent of anthocyanin pigments in grapes. Phytochemistry 1970, 9, 1579–1583. [Google Scholar] [CrossRef]
  13. Jez, J.M.; Noel, J.P. Reaction mechanism of chalcone isomerase: PH–dependence, diffusion control, and product binding differences. J. Biol. Chem. 2002, 277, 1361–1369. [Google Scholar] [CrossRef] [Green Version]
  14. Kovinich, N.; Saleem, A.; Arnason, J.T.; Miki, B. Functional characterization of a UDP–glucose: Flavonoid 3–O–glucosyltransferase from the seed coat of black soybean (Glycine max (L.) Merr.). Phytochemistry 2010, 71, 1253–1263. [Google Scholar] [CrossRef] [PubMed]
  15. Jaakola, L. New insights into the regulation of anthocyanin biosynthesis in fruits. Trends Plant Sci. 2013, 18, 477–483. [Google Scholar] [CrossRef] [PubMed] [Green Version]
  16. Sun, L.; Huo, J.; Liu, J.; Yu, J.; Zhou, J.; Sun, C.; Wang, Y.; Leng, F. Anthocyanins distribution, transcriptional regulation, epigenetic and post–translational modification in fruits. Food Chem. 2023, 411, 135540. [Google Scholar] [CrossRef]
  17. Li, X.L.; Qian, X.K.; Lu, X.; Wang, X.H.; Jia, N.; Zhang, M.S.; Ren, M.J. Upregulated structural and regulatory genes involved in anthocyanin biosynthesis for coloration of purple grains during the middle and late grain–filling stages. Plant Physiol. Bioch. 2018, 130, 235–247. [Google Scholar] [CrossRef]
  18. Ming, H.N.; Wang, Q.; Wu, Y.; Liu, H.M.; Zheng, L.M.; Zhang, G.F. Transcriptome analysis reveals the mechanism of anthocyanidins biosynthesis during grains development in purple corn (Zea mays L.). J. Plant Physiol. 2021, 257, 153328. [Google Scholar] [CrossRef]
  19. Li, T.C.; Zhang, W.; Yang, H.Y.; Dong, Q.; Ren, J.; Fan, H.H.; Zhang, X.; Zhou, Y.B. Comparative transcriptome analysis reveals differentially expressed genes related to the tissue–specific accumulation of anthocyanins in pericarp and aleurone layer for maize. Sci. Rep. 2019, 9, 2485. [Google Scholar] [CrossRef] [Green Version]
  20. Wang, J.; Li, D.L.; Peng, Y.X.; Cai, M.H.; Liang, Z.; Yuan, Z.P.; Du, X.M.; Wang, J.H.; Schnable, P.S.; Gu, R.L.; et al. The anthocyanin accumulation related ZmBZ1, facilitates seedling salinity stress tolerance via ROS scavenging. Int. J. Mol. Sci. 2022, 23, 16123. [Google Scholar] [CrossRef]
  21. Shomali, A.; Das, S.; Arif, N.; Sarraf, M.; Zahra, N.; Yadav, V.; Aliniaeifard, S.; Chauhan, D.K.; Hasanuzzaman, M. Diverse physiological roles of flavonoids in plant environmental stress responses and tolerance. Plants 2022, 11, 3158. [Google Scholar] [CrossRef] [PubMed]
  22. Li, J.H.; Zhao, D.M.; Akram, M.A.; Guo, C.X.; Jin, H.X.; Hu, W.G.; Zhang, Y.H.; Wang, X.T.; Ma, A.; Xiong, J.L.; et al. Effects of environmental factors on anthocyanin accumulation in the fruits of Lycium ruthenicum Murray across different desert grasslands. J. Plant Physiol. 2022, 279, 153828. [Google Scholar] [CrossRef] [PubMed]
  23. Kruger, E.; Will, F.; Kumar, K.; Celejewska, K.; Chartier, P.; Masny, A.; Mott, D.; Petit, A.; Savini, G.; Sonsteby, A. Influence of Post–Flowering Climate Conditions on Anthocyanin Profile of Strawberry Cultivars Grown from North to South Europe. Appl. Sci. 2021, 11, 1326. [Google Scholar] [CrossRef]
  24. Gunther, C.S.; Plunkett, B.J.; Cooney, J.M.; Jensen, D.; Trower, T.M.; Elborough, C.; Nguyen, H.M.; Deng, C.H.; Lafferty, D.J.; Albert, N.W.; et al. Biotic stress–induced and ripening–related anthocyanin biosynthesis are regulated by alternate phytohormone signals in blueberries. Environ. Exp. Bot. 2022, 203, 105065. [Google Scholar] [CrossRef]
  25. van Zelm, E.; Zhang, Y.X.; Testerink, C. Salt tolerance mechanisms of plants. Annu. Rev. Plant Biol. 2020, 71, 403–433. [Google Scholar] [CrossRef] [PubMed] [Green Version]
  26. Negrao, S.; Schmockel, S.M.; Tester, M. Evaluating physiological responses of plants to salinity stress. Ann. Bot. 2017, 119, 1–11. [Google Scholar] [CrossRef] [Green Version]
  27. Konapala, G.; Mishra, A.K.; Wada, Y.; Mann, M.E. Climate change will affect global water availability through compounding changes in seasonal precipitation and evaporation. Nat. Commun. 2020, 11, 3044. [Google Scholar] [CrossRef]
  28. Zhang, P.; Liu, S.; Zhao, Z.; You, L.; Harrison, M.D.; Zhang, Z. Enzymatic acylation of cyanidin–3–glucoside with fatty acid methyl esters improves stability and antioxidant activity. Food Chem. 2021, 343, 128482. [Google Scholar] [CrossRef]
  29. Wang, F.B.; Kong, W.L.; Wong, G.; Fu, L.F.; Peng, R.H.; Li, Z.J.; Yao, Q.H. AtMYB12 regulates flavonoids accumulation and abiotic stress tolerance in transgenic Arabidopsis thaliana. Mol. Genet. Genom. 2016, 291, 1545–1559. [Google Scholar] [CrossRef]
  30. Wang, D.R.; Yang, K.; Wang, X.; Lin, X.L.; Rui, L.; Liu, H.F.; Liu, D.D.; You, C.X. Overexpression of MdZAT5, an C2H2–Type Zinc Finger Protein, Regulates Anthocyanin Accumulation and Salt Stress Response in Apple Calli and Arabidopsis. Int. J. Mol. Sci. 2022, 23, 1897. [Google Scholar] [CrossRef]
  31. Kim, J.; Lee, W.J.; Vu, T.T.; Jeong, C.Y.; Hong, S.W.; Lee, H. High accumulation of anthocyanins via the ectopic expression of AtDFR confers significant salt stress tolerance in Brassica napus L. Plant Cell Rep. 2017, 36, 1215–1224. [Google Scholar] [CrossRef] [PubMed]
  32. Xiao, Y.N.; Chen, M.; Zheng, N.N.; Xu, Z.Y.; Zhang, J.; Hu, X.M.; Li, L.; Gu, R.L.; Du, X.M.; Wang, J.H. Transcriptome analysis identifies novel genes associated with low–temperature seed germination in sweet corn. Plants 2023, 12, 159. [Google Scholar] [CrossRef]
  33. Li, X.H.; Hu, H.R.; Hu, X.M.; Wang, G.H.; Du, X.M.; Li, L.; Wang, F.; Fu, J.J.; Wang, G.Y.; Wang, J.H.; et al. Transcriptome analysis of near–isogenic lines provides novel insights into genes associated with seed low–temperature germination ability in maize (Zea mays L.). Plants 2022, 11, 887. [Google Scholar] [CrossRef]
  34. Liu, W.W.; Zhang, Y.L.; He, H.; He, G.M.; Deng, X.W. From hybrid genomes to heterotic trait output: Challenges and opportunities. Curr. Opin. Plant Biol. 2022, 66, 102193. [Google Scholar] [CrossRef]
  35. Zheng, H.X.; Yang, Z.; Wang, W.Q.; Guo, S.J.; Li, Z.X.; Liu, K.C.; Sui, N. Transcriptome analysis of maize inbred lines differing in drought tolerance provides novel insights into the molecular mechanisms of drought responses in roots. Plant Physiol. Bioch. 2020, 149, 11–26. [Google Scholar] [CrossRef]
  36. Ma, S.Q.; Lv, L.; Meng, C.; Zhang, C.S.; Li, Y.Q. Integrative analysis of the metabolome and transcriptome of Sorghum bicolor reveals dynamic changes in flavonoids accumulation under saline–alkali stress. J. Agric. Food Chem. 2020, 68, 14781–14789. [Google Scholar] [CrossRef]
  37. Zhang, X.Y.; Su, N.N.; Jia, L.; Tian, J.Y.; Li, H.; Huang, L.S.; Shen, Z.G.; Cui, J. Transcriptome analysis of radish sprouts hypocotyls reveals the regulatory role of hydrogen–rich water in anthocyanin biosynthesis under UV–A. BMC Plant Biol. 2018, 18, 227. [Google Scholar] [CrossRef] [Green Version]
  38. Wei, H.R.; Wang, P.P.; Chen, J.Q.; Li, C.J.; Wang, Y.Z.; Yuan, Y.B.; Fang, J.G.; Leng, X.P. Genome–wide identification and analysis of B–BOX gene family in grapevine reveal its potential functions in berry development. BMC Plant Biol. 2020, 20, 72. [Google Scholar] [CrossRef]
  39. Zhang, L.; Zhang, Z.J.; Fang, S.Z.; Liu, Y.; Shang, X.L. Integrative analysis of metabolome and transcriptome reveals molecular regulatory mechanism of flavonoid biosynthesis in Cyclocarya paliurus under salt stress. Ind. Crop. Prod. 2021, 170, 113823. [Google Scholar] [CrossRef]
  40. Kim, J.H.; Kim, B.G.; Park, Y.; Ko, J.H.; Lim, C.E.; Lim, J.; Lim, Y.; Ahn, J.H. Characterization of flavonoid 7–O–glucosyltransferase from Arabidopsis thaliana. Biosci. Biotechnol. Biochem. 2006, 70, 1471–1477. [Google Scholar] [CrossRef] [Green Version]
  41. Singh, P.; Arif, Y.; Bajguz, A.; Hayat, S. The role of quercetin in plants. Plant Physiol. Bioch. 2021, 166, 10–19. [Google Scholar] [CrossRef]
  42. Naing, A.H.; Kim, C.K. Abiotic stress–induced anthocyanins in plants: Their role in tolerance to abiotic stresses. Physiol. Plant. 2021, 172, 1711–1723. [Google Scholar] [CrossRef]
  43. Lee, Y.J.; Lee, W.J.; Le, Q.T.; Hong, S.W.; Lee, H. Growth performance can be increased under high nitrate and high salt stress through enhanced nitrate reductase activity in Arabidopsis anthocyanin over–producing mutant plants. Front. Plant Sci. 2021, 12, 644455. [Google Scholar] [CrossRef]
  44. Sharma, A.; Shahzad, B.; Kumar, V.; Kohli, S.K.; Sidhu, G.; Bali, A.S.; Handa, N.; Kapoor, D.; Bhardwaj, R.; Zheng, B.S. Phytohormones regulate accumulation of osmolytes under abiotic stress. Biomolecules 2019, 9, 285. [Google Scholar] [CrossRef] [Green Version]
  45. Rai, K.K. Revisiting the critical role of ROS and RNS in plant defense. J. Plant Growth Regul. 2022. [Google Scholar] [CrossRef]
  46. Yu, Z.P.; Duan, X.B.; Luo, L.; Dai, S.J.; Ding, Z.J.; Xia, G.M. How plant hormones mediate salt stress responses. Trends Plant Sci. 2020, 25, 1117–1130. [Google Scholar] [CrossRef]
  47. Gao, H.N.; Jiang, H.; Cui, J.Y.; You, C.X.; Li, Y.Y. Review: The effects of hormones and environmental factors on anthocyanin biosynthesis in apple. Plant Sci. 2021, 312, 111024. [Google Scholar] [CrossRef] [PubMed]
  48. Zhu, Y.T.; Hu, X.Q.; Wang, P.; Gao, L.Y.; Pei, Y.K.; Ge, Z.Y.; Ge, X.Y.; Li, F.G.; Hou, Y.X. GhPLP2 positively regulates cotton resistance to verticillium wilt by modulating fatty acid accumulation and jasmonic acid signaling pathway. Front. Plant Sci. 2021, 12, 749630. [Google Scholar] [CrossRef]
  49. Li, X.Y.; Liao, M.M.; Huang, J.Y.; Xu, Z.; Lin, Z.Q.; Ye, N.H.; Zhang, Z.S.; Peng, X.X. Glycolate oxidase–dependent H2O2 production regulates IAA biosynthesis in rice. BMC Plant Biol. 2021, 21, 326. [Google Scholar] [CrossRef]
  50. Jia, K.P.; Mi, J.N.; Ali, S.; Ohyanagi, H.; Moreno, J.C.; Ablazov, A.; Balakrishna, A.; Berqdar, L.; Fiore, A.; Diretto, G.; et al. An alternative, zeaxanthin epoxidase–independent abscisic acid biosynthetic pathway in plants. Mol. Plant 2022, 15, 151–166. [Google Scholar] [CrossRef]
  51. Fu, B.L.; Wang, W.Q.; Liu, X.F.; Duan, X.W.; Allan, A.C.; Grierson, D.; Yin, X.R. An ethylene–hypersensitive methionine sulfoxide reductase regulated by NAC transcription factors increases methionine pool size and ethylene production during kiwifruit ripening. New Phytol. 2021, 232, 237–251. [Google Scholar] [CrossRef] [PubMed]
  52. Postiglione, A.E.; Muday, G.K. Abscisic acid increases hydrogen peroxide in mitochondria to facilitate stomatal closure. Plant Physiol. 2022, 192, 469–487. [Google Scholar] [CrossRef] [PubMed]
  53. Zhang, K.K.; Khan, Z.; Wu, H.H.; Khan, M.N.; Hu, L.Y. Gibberellic acid priming improved rapeseed drought tolerance by modulating root morphology, ROS homeostasis, and chloroplast autophagy. J. Plant Growth Regul. 2022. [Google Scholar] [CrossRef]
  54. Zhang, A.Y.; Yang, X.; Lu, J.; Song, F.Y.; Sun, J.H.; Wang, C.; Lian, J.; Zhao, L.L.; Zhao, B.C. OsIAA20, an Aux/IAA protein, mediates abiotic stress tolerance in rice through an ABA pathway. Plant Sci. 2021, 308, 110903. [Google Scholar] [CrossRef]
  55. Wang, C.K.; Han, P.L.; Zhao, Y.W.; Ji, X.L.; Yu, J.Q.; You, C.X.; Hu, D.G.; Hao, Y.J. Auxin regulates anthocyanin biosynthesis through the auxin repressor protein MdIAA26. Biochem. Biophys. Res. Commun. 2020, 533, 717–722. [Google Scholar] [CrossRef]
  56. Ye, H.; Qiao, L.Y.; Guo, H.Y.; Guo, L.P.; Ren, F.; Bai, J.F.; Wang, Y.K. Genome–wide identification of wheat WRKY gene family reveals that TaWRKY75–A is referred to drought and salt resistances. Front. Plant Sci. 2021, 12, 663118. [Google Scholar] [CrossRef]
  57. Liu, L.; DU, H.; Tang, X.; Wu, Y.; Huang, Y.; Tang, Y. The roles of MYB transcription factors on plant defense responses and its molecular mechanism. Yi Chuan = Hereditas 2008, 30, 1265–1271. [Google Scholar] [CrossRef]
  58. Li, M.; Wu, Z.Y.; Gu, H.; Cheng, D.W.; Guo, X.Z.; Li, L.; Shi, C.Y.; Xu, G.Y.; Gu, S.C.; Abid, M.; et al. AvNAC030, a NAC domain transcription factor, enhances salt stress tolerance in kiwifruit. Int. J. Mol. Sci. 2021, 22, 11897. [Google Scholar] [CrossRef]
  59. Huang, J.J.; Liu, F.H.; Chao, D.; Xin, B.N.; Liu, K.; Cao, S.L.; Chen, X.X.; Peng, L.Y.; Zhang, B.L.; Fu, S.; et al. The WRKY transcription factor OsWRKY54 is involved in salt tolerance in rice. Int. J. Mol. Sci. 2022, 23, 11999. [Google Scholar] [CrossRef]
  60. Lee, Y.H.; Song, S.I. OsbZIP62 positively regulates drought and salt stress tolerance and ABA signaling in rice. J. Plant Biol. 2022, 66, 123–133. [Google Scholar] [CrossRef]
  61. Huang, S.Z.; Hu, L.J.; Zhang, S.H.; Zhang, M.X.; Jiang, W.Z.; Wu, T.; Du, X.L. Rice OsWRKY50 mediates ABA–dependent seed germination and seedling growth, and ABA–independent salt stress tolerance. Int. J. Mol. Sci. 2021, 22, 8625. [Google Scholar] [CrossRef] [PubMed]
  62. Tu, K.L.; Cheng, Y.; Ning, C.L.; Yang, C.M.; Dong, X.H.; Cao, H.L.; Sun, Q. Non–destructive viability discrimination for individual scutellaria baicalensis seeds based on high–throughput phenotyping and machine learning. Agriculture 2022, 12, 1616. [Google Scholar] [CrossRef]
  63. Kim, D.; Paggi, J.M.; Park, C.; Bennett, C.; Salzberg, S.L. Graph–based genome alignment and genotyping with hisat2 and hisat–genotype. Nat. Biotechnol. 2019, 37, 907–915. [Google Scholar] [CrossRef] [PubMed]
  64. Love, M.I.; Huber, W.; Anders, S. Moderated estimation of fold change and dispersion for RNA–seq data with DESeq2. Genome Biol. 2014, 15, 550. [Google Scholar] [CrossRef] [Green Version]
  65. Chen, C.J.; Chen, H.; Zhang, Y.; Thomas, H.R.; Frank, M.H.; He, Y.H.; Xia, R. TBtools: An Integrative Toolkit Developed for Interactive Analyses of Big Biological Data. Mol. Plant 2020, 13, 1194–1202. [Google Scholar] [CrossRef]
  66. Tian, T.; Liu, Y.; Yan, H.Y.; You, Q.; Yi, X.; Du, Z.; Xu, W.Y.; Su, Z. Agrigo v2.0: A go analysis toolkit for the agricultural community, 2017 update. Nucleic Acids Res. 2017, 45, W122–W129. [Google Scholar] [CrossRef] [PubMed] [Green Version]
  67. Bu, D.C.; Luo, H.T.; Huo, P.P.; Wang, Z.H.; Zhang, S.; He, Z.H.; Wu, Y.; Zhao, L.H.; Liu, J.J.; Guo, J.C.; et al. Kobas–i: Intelligent prioritization and exploratory visualization of biological functions for gene enrichment analysis. Nucleic Acids Res. 2021, 49, W317–W325. [Google Scholar] [CrossRef] [PubMed]
Figure 1. Seeds and seedling characteristics of RILpur–w22 and RILbro–w22. (ae) Seed phenotypes of two RILs and their (a), seed lengths (b), seed widths (c), seed thicknesses (d), and 100–seed weights (e). (fh) Seedling phenotypes (f), shoot lengths (g), and root lengths (h) of two RILs grown for 14 days under non–treated and salt–treated (100 mM NaCl solution) conditions. Bar = 1 cm; black dots, squares and triangles represent individual values for different samples; p values calculated by one–way ANOVA; p < 0.01 indicates that the difference is extremely significant; ns represents no difference.
Plants 12 02793 g001
Figure 2. Seedling transcriptome analysis of RILpur–W22 and RILbro–W22 under non–treated and salt–treated conditions. (a) Seedling sample schematic for RNA extraction. (b) Principal component analysis of the gene expression profiles of RILpur–W22 and RILbro–W22 seedlings under non–treated and salt–treated conditions. (c) The number of expressed genes (FPKM ≥ 1) identified in non–treated RILpur–W22 (NT–RILpur–W22), non–treated RILbro–W22 (NT–RILbro–W22), salt–treated RILpur–W22 (salt–RILpur–W22), and salt–treated RILbro–W22 (salt–RILbro–W22). (d) Comparison of the number of upregulated and downregulated DEGs in the NT–RILpur–W22 vs. NT–RILbro–W22, NT–RILpur–W22 vs. salt–RILpur–W22, NT–RILbro–W22 vs. salt–RILbro–W22, and salt–RILpur–W22 vs. salt–RILbro–W22 groups. (e) Venn diagram drawn using the DEGs in the NT–RILpur–W22 vs. NT–RILbro–W22, NT–RILpur–W22 vs. salt–RILpur–W22, NT–RILbro–W22 vs. salt–RILbro–W22 and salt–RILpur–W22 vs. salt–RILbro–W22 groups. Red numbers refer to DEGs specifically expressed in the above groups.
Plants 12 02793 g002
Figure 3. GO enrichment analysis of 3160 DEGs’ common response to salt stress in RILpur−W22 (NT−RILpur−W22 vs. salt−RILpur−W22) and RILbro–W22 (NT–RILbro–W22 vs. salt–RILbro–W22) seedlings, of which 1637 DEGs were upregulated (a) and 1521 DEGs were downregulated (b). The size and color scale of the points in the figure represent the number and significance level of DEGs in GO terms, respectively. (c,d) qRT–PCR (c) and RNA–seq (d) analysis of the DEGs with regard to oxidoreductase activity. (e,f) qRT–PCR (e) and RNA–seq (f) analysis of the DEGs with regard to the regulation of the developmental process. GAPDH was used as an internal control. Values are shown as means ± SE, n = 3; p values calculated by one–way ANOVA; p < 0.05 represents a significant difference; p < 0.01 indicates that the difference is extremely significant.
Plants 12 02793 g003
Figure 4. GO analysis of the 1728 DEGs which specifically respond to salt stress in RILpur–W22 (NT–RILpur–W22 vs. salt–RILpur–W22) seedlings. The left side refers to the 887 upregulated DEGs (a), and the right side refers to the 841 downregulated DEGs (b). GO analysis of the 1475 DEGs which specifically respond to salt stress in RILbro–W22 (NT–RILbro–W22 vs. salt–RILbro–W22) seedlings. The left side refers to the 818 upregulated DEGs (c), and the right side refers to the 657 downregulated DEGs (d). The size and color scale of the points in the figure represent the number and significance level of DEGs in GO terms, respectively.
Plants 12 02793 g004
Figure 5. GO analysis of the 140 DEGs which specifically respond to salt stress in salt–treated RILpur–W22 and RILbro–W22 (salt–RILpur–W22 vs. salt–RILbro–W22) seedlings. The left side refers to the 65 upregulated DEGs (a), and the right side refers to the 75 downregulated DEGs (b). The size and color scale of the points in the figure represent the number and significance level of DEGs in GO terms, respectively.
Plants 12 02793 g005
Figure 6. Clustering heatmap of genes related to anthocyanin synthesis pathway in expressed genes. Each sample has two compartments, which are two biological replicates. According to the standardized FPKM, red and blue indicate high and low abundance, respectively.
Plants 12 02793 g006
Figure 7. DEGs identified in “plant hormone pathways”. (a) The types of hormones in the “plant hormone pathway” and the number of DEGs belonging to these types. (bf) Heatmap clustering of the 46 DEGs related to auxin (IAA, (b)), abscisic acid (ABA, (c)), ethylene (ETH, (d)), Jas monic acid (Jas, (e)), and salicylic acid (SA, (f)) in non–treated and salt–treated RILpur–W22 and RILbro–W22 seedlings (NT–RILpur–W22, salt–RILpur–W22, NT–RILbro–W22, and salt–RILbro–W22). Each sample has two compartments, which are two biological replicates. According to the standardized FPKM, red and blue indicate high and low abundance, respectively.
Plants 12 02793 g007
Figure 8. Analysis of DEGs encoding transcription factors. (a) DEGs encoding transcription factors in the NT–RILpur–W22 vs. salt–RILpur–W22 and NT–RILbro–W22 vs. salt–RILbro–W22 groups. (b) Transcription factor types and numbers. (c) Heatmap of 20 transcription factors which exhibit special expression in non–treated and salt–treated RILpur–W22 (NT–RILpur–W22 vs. salt–RILpur–W22) seedlings (seven upregulated and thirteen downregulated). (d) The heatmap of thirteen transcription factors which special expression in non–treated and salt–treated RILbro–W22 (NT–RILbro–W22 vs. salt–RILbro–W22) seedlings (five upregulated and right downregulated). (e) The heatmap of thirteen transcription factors which common expression in non–treated and salt–treated RILpur–W22 and RILbro–W22 (NT–RILbro–W22 vs. salt–RILbro–W22 ∩ NT–RILbro–W22 vs. salt–RILbro–W22) seedlings (four upregulated and nine downregulated). Each sample has two compartments, which are two biological replicates. According to the standardized FPKM, red and blue indicate high and low abundance, respectively.
Plants 12 02793 g008
Table 1. Transcriptome sequencing data statistics.
LinesRepTotal ReadsRate of Total Mapped Reads (%)Num. of Expressed GenesRate of Expressed Genes (%)
NT–RILpur–W22147,540,65496.828,18760.72
247,933,52497.0428,11560.56
NT–RILbro–W22144,597,50697.3328,31761.00
245,014,47296.0028,36761.10
salt–RILpur–W22147,815,59896.4128,99162.45
246,306,71495.1528,97462.41
salt–RILbro–W22145,334,56296.6328,88662.22
245,274,94695.5828,70161.82
Note: Total reads: the number of reads after filtering the original data; rate of total mapped reads (%): the ratio of the remaining reads after filtering to the original unfiltered reads; num. of expressed genes: total number of expressed genes with FPKM ≥ 1; rate of expressed genes (%): the proportion of the total number of expressed genes with FPKM ≥ 1 to the total number of genes.
Disclaimer/Publisher’s Note: The statements, opinions and data contained in all publications are solely those of the individual author(s) and contributor(s) and not of MDPI and/or the editor(s). MDPI and/or the editor(s) disclaim responsibility for any injury to people or property resulting from any ideas, methods, instructions or products referred to in the content.

