
Plant Species’ Capacity for Range Shifts at the Habitat and Geographic Scales: A Trade-Off-Based Framework

1
School of Biological Sciences, University of Nebraska–Lincoln, 1101 T Street, 402 Manter Hall, Lincoln, NE 68588-0118, USA
2
Center for Plant Science Innovation, University of Nebraska–Lincoln, 1901 Vine Street, N300 Beadle Center, Lincoln, NE 68588-0118, USA
*
Author to whom correspondence should be addressed.
Plants 2023, 12(6), 1248; https://doi.org/10.3390/plants12061248
Submission received: 31 January 2023
/
Revised: 18 February 2023
/
Accepted: 20 February 2023
/
Published: 9 March 2023
(This article belongs to the Section Plant Ecology)
Abstract
:Climate change is causing rapid shifts in the abiotic and biotic environmental conditions experienced by plant populations, but we lack generalizable frameworks for predicting the consequences for species. These changes may cause individuals to become poorly matched to their environments, potentially inducing shifts in the distributions of populations and altering species’ habitat and geographic ranges. We present a trade-off-based framework for understanding and predicting whether plant species may undergo range shifts, based on ecological strategies defined by functional trait variation. We define a species’ capacity for undergoing range shifts as the product of its colonization ability and the ability to express a phenotype well-suited to the environment across life stages (phenotype–environment matching), which are both strongly influenced by a species’ ecological strategy and unavoidable trade-offs in function. While numerous strategies may be successful in an environment, severe phenotype–environment mismatches result in habitat filtering: propagules reach a site but cannot establish there. Operating within individuals and populations, these processes will affect species’ habitat ranges at small scales, and aggregated across populations, will determine whether species track climatic changes and undergo geographic range shifts. This trade-off-based framework can provide a conceptual basis for species distribution models that are generalizable across plant species, aiding in the prediction of shifts in plant species’ ranges in response to climate change.
1. Introduction
Climate change is influencing the abiotic and biotic environmental conditions experienced by plants, with implications for species distributions [1,2,3,4]. Not only is contemporary climate change occurring more rapidly than in previous geologic time periods [5], there is also a high likelihood of the emergence of future climate regimes with no modern analog, as well as the loss of existing climate regimes [6,7,8]. These changes may cause some individuals and populations to become poorly matched to their local environments, and aggregated across all the populations of a species, this may cause changes in species’ ranges, depending on the extent of seed dispersal. However, migration rates exceeding the seed dispersal capacity of many plant species may be necessary for populations to track the environmental conditions to which they are presently adapted [9,10,11]. Range shifts, which we define as movement of a species’ range into new areas with potentially more suitable environmental conditions (terms in boldface font are defined in the Glossary), have been observed among plant species in the palaeoecological record in response to shorter and longer-term climatic cycles [12,13,14,15]. However, recent projections suggest that the range shifts for many plant species will lag behind the present-day rate of climate change [16,17,18,19], contributing to biodiversity redistribution globally [20].
The ranges of plant species can be defined at multiple scales (Figure 1) [21], but fundamentally are a function of the occurrence of individuals across a landscape, which is usually highly heterogeneous, because it depends on how environmental conditions are spatially and temporally distributed with respect to the ecological niche, as well as colonization ability (the ability to colonize sites with propagules). The ecological niche is the complete set of abiotic (e.g., soil, climate, topography) and biotic (e.g., mutualists and antagonists) environmental conditions allowing a plant species or population to maintain positive population growth [22,23]. How ecological niche conditions are manifested in space and time provides the template defining the habitat and geographic ranges of a species. The processes controlling fitness operate at the levels of individuals and populations responding to local environmental conditions, which we define as the habitat scale. In aggregate, the ecological and evolutionary processes operating at the habitat scale across all the populations of a species govern the distribution of a species at the largest scale, which we define as the geographic scale. Hence, the habitat range is the local (i.e., small spatial scale) spatial distribution of individuals of a species’ populations [24,25,26], whereas the geographic range is the boundary defining the geographic area encompassing the complete set of locations where those populations occur [27,28].
The capacity for shifts in habitat and geographic ranges depends on colonization ability and phenotype-environment matching [29,30], that is, expressing the optimal phenotype for the local environment across life stages. Phenotype-environment (PE) matching is mediated by how well the local environment matches the ecological niche [31,32,33,34], ultimately determining individual vital rates, and in aggregate, the population fitness in existing and novel environments [35,36,37,38,39]. Individuals that colonize a site, but have phenotypes that are mismatched with the environment, will not survive long enough to reproduce. If this consistently occurs at the population scale, then these species will experience habitat filtering, whereas species with phenotypes matched to the environment will establish populations. In the longer term, adaptive evolution allows plant populations to adjust to climate change across generations through PE matching [6,40], but rates of evolution may not keep pace with rapid climate change, particularly in long-lived plants with multi-decade maturation ages [12,41,42]. However, plants have enormous capacity for phenotypic plasticity [43,44,45], which, when adaptive, can enable shorter term PE matching, particularly in response to fluctuating environmental conditions, which have become a hallmark of climate change [46,47]. Phenotypic plasticity can thus allow plants to persist in their contemporary ranges, even though the climate has changed, as well as in new areas with novel environmental conditions.
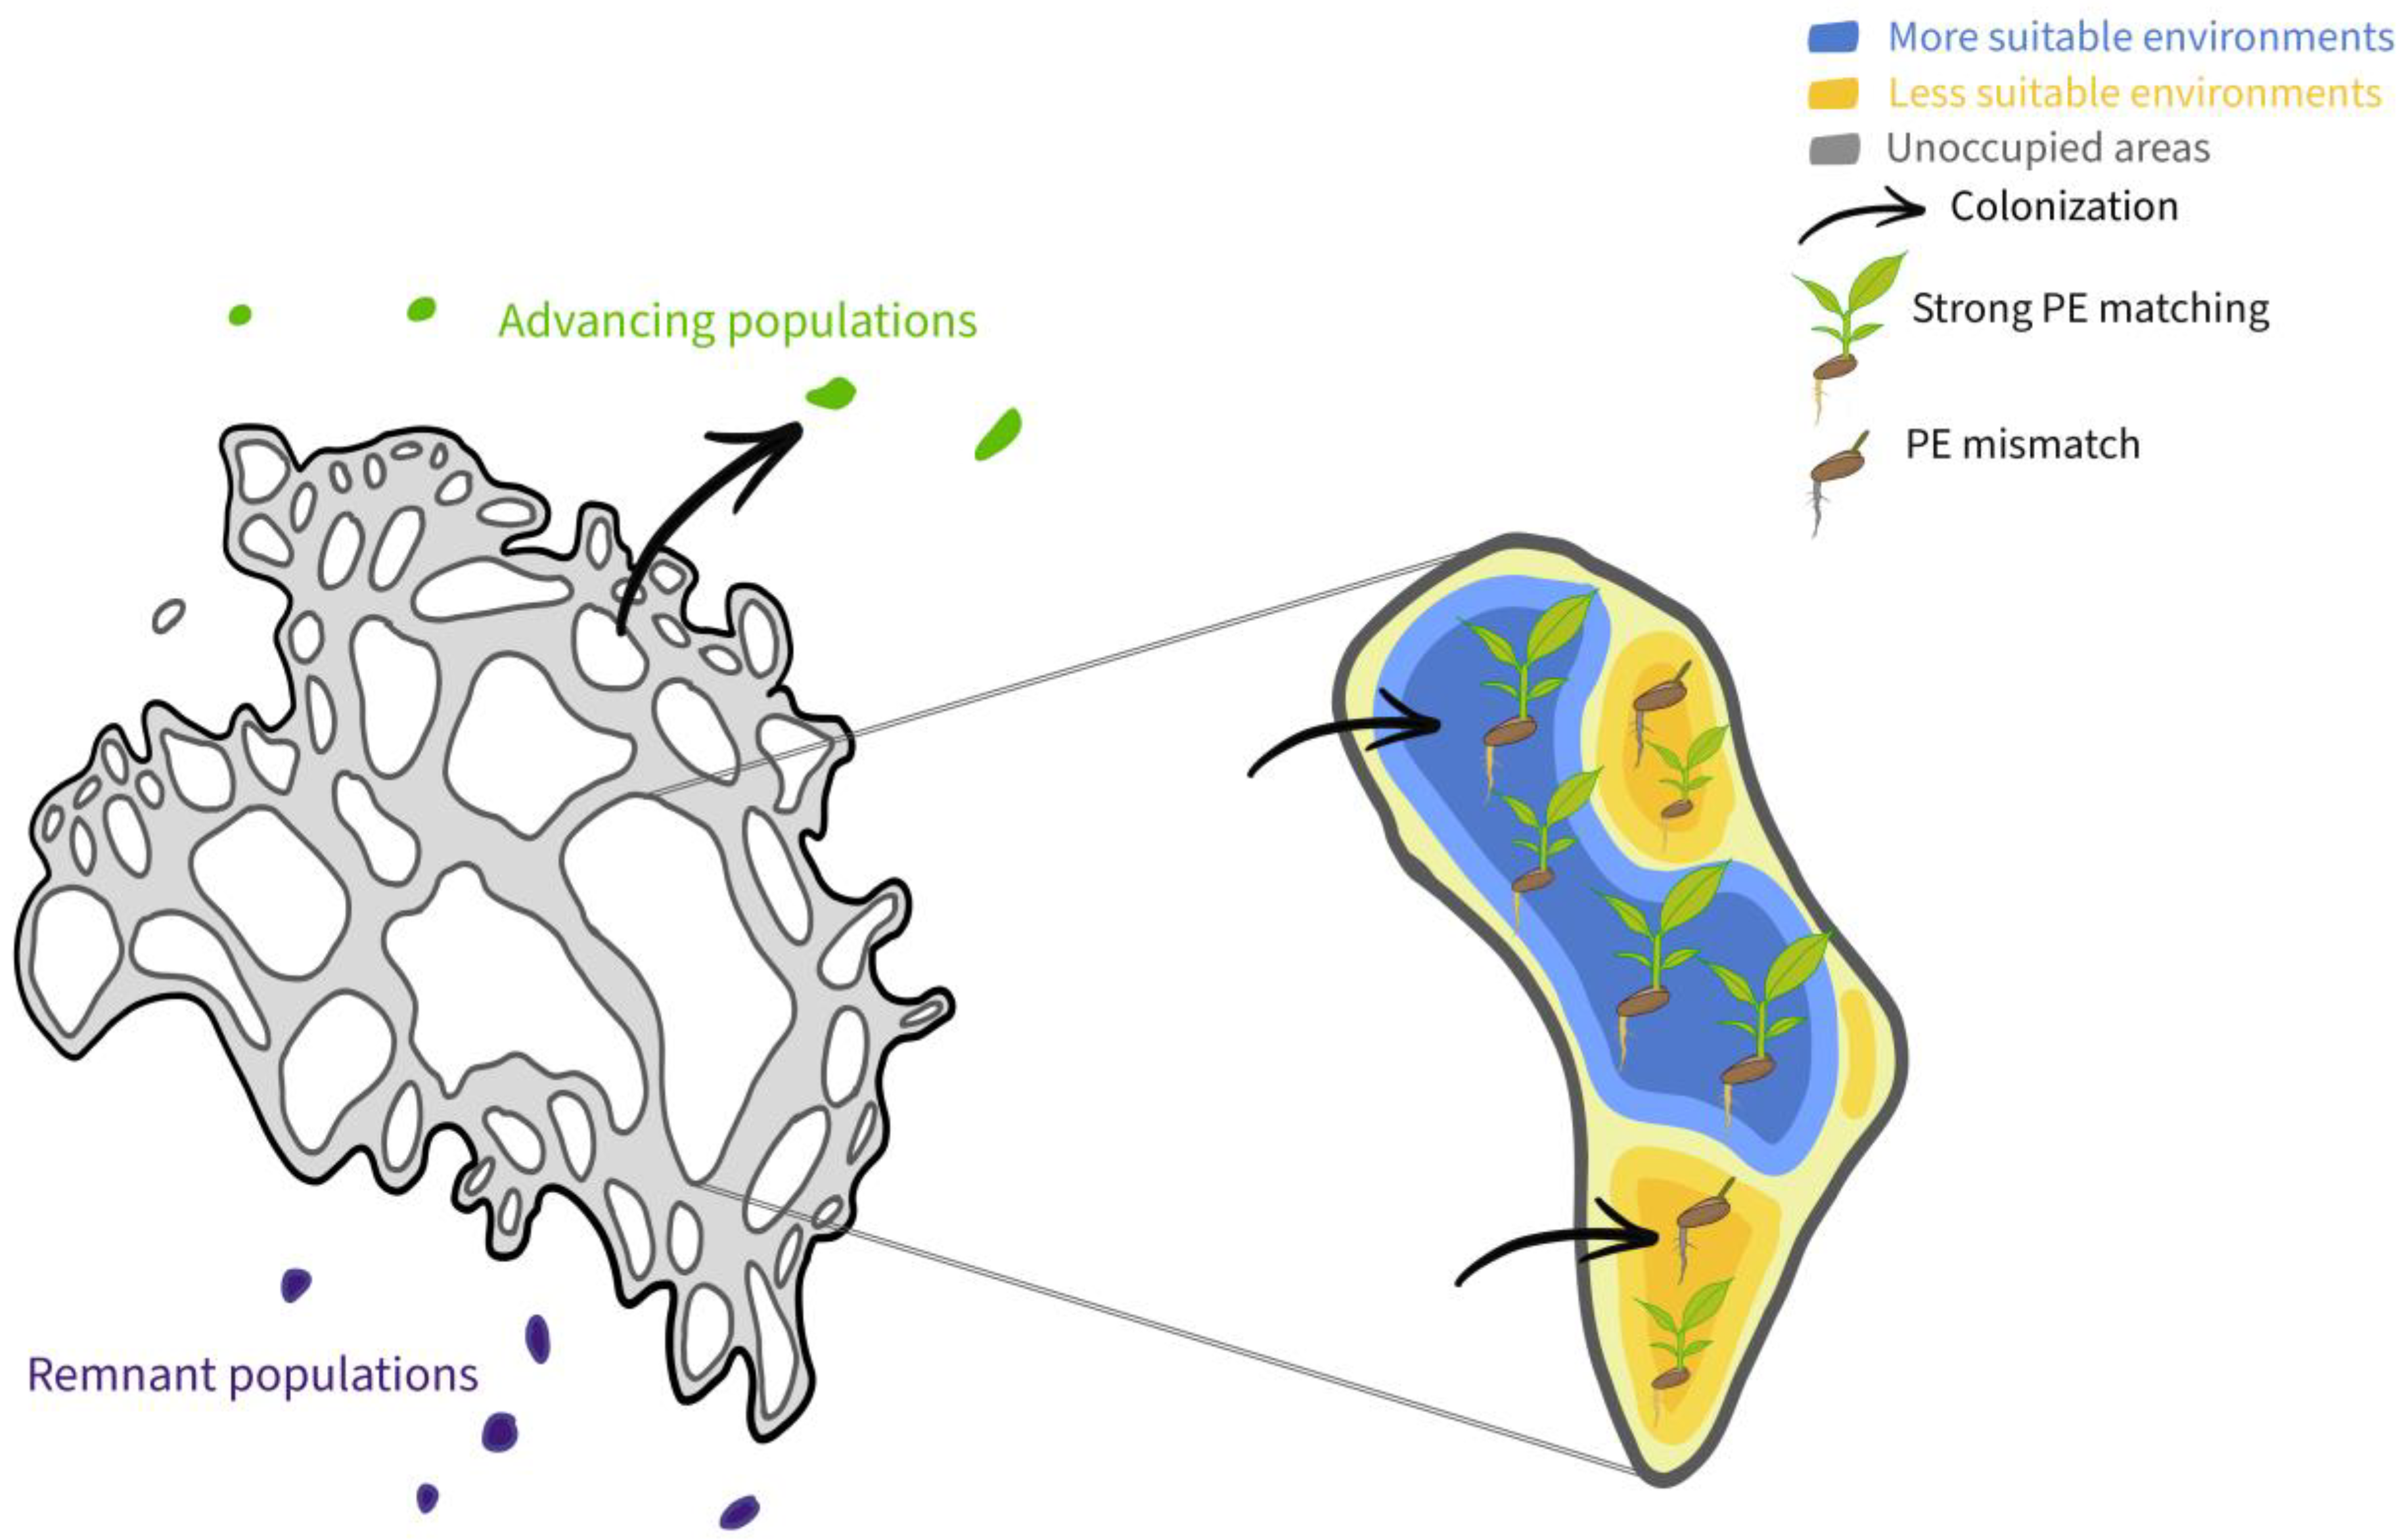
Most plant species’ geographic ranges consist of a number of differently sized, spatially structured populations connected by varying rates of dispersal (metapopulation) [48,49,50] in areas with a range of environmental suitability (Figure 1), with the potential for source–sink population dynamics [51,52]. For example, many glacial remnant populations of tree species remaining in microclimate refugia may be becoming PE-mismatched sink populations with low fecundity and survival, which persist largely because of seed subsidies from source populations and the storage effect of long lifespans and vegetative propagation [53,54,55,56]. On the other hand, propagules may disperse from the range center, seeding populations at advancing range edges that, if they establish, would cause range shift or expansion.
Together, these processes lead to four broad outcomes for species’ habitat and geographic ranges under climate change. First, sufficient seed dispersal and PE matching may cause successful establishment in previously uncolonized areas, which allows plant populations to track favorable environmental conditions. Second, phenotypic adjustments, in the form of phenotypic plasticity at the individual level or adaptive evolution at the population level, may facilitate PE matching and allow populations to be maintained in contemporary ranges despite climate change. Third, sink populations caused by PE mismatch in contemporary ranges may be subsidized by seed dispersal from source populations with more favorable PE matching. Fourth, if neither colonization nor phenotypic adjustments nor source–sink dynamics occur, local population extirpation or species extinction may result. The spatial and population-scale magnitudes of these outcomes will determine whether and how species’ habitat and geographic ranges change, and specifically whether range shifts enable population persistence as the climate changes.
The goal of this review is to develop an ecological conceptual framework for understanding the probability of habitat and geographic range shifts of plant species during climate change. We focus on the first two of the above four outcomes and define a spectrum of high to low capacity for habitat and geographic range shifts by plant species. Although our focus is on changes in ranges mediated by natural processes, the expansion of non-native species in introduced ranges is governed by similar processes, and so we draw examples from plant invasion ecology. We use a trade-off-based approach to position species along this spectrum, based on ecological strategies and phenotypic trait variation. Since source–sink dynamics are likely to occur, but also likely to create complex population and range dynamics, and have been reviewed elsewhere [48,51], they are not the focus of this review. We first define habitat and geographic ranges and their scale of variation. Second, we define plant ecological strategies, in terms of how unavoidable trade-offs in function produce demographic trade-offs. Third, we lay out two distinct stages of processes determining the capacity for range shifts, as “arrival and survival” [57]. We translate these into colonization ability [58,59] and habitat filtering resulting from PE matching [60,61] and explain how their product determines the capacity for plant range shifts. We integrate these concepts into a trait-based conceptual model that describes combinations of traits causing variation in colonization ability and in PE matching, which together determine the capacity for range shifts in an environment. We close by identifying future research directions that will help us to better understand how plant species’ ranges will be affected by climate change at the habitat and geographic scales.
2. What’s in a Range? Defining Geographic and Habitat Ranges
Across spatial scales, plants can only arrive, establish, and persist in locations in which their ecological niche requirements are met [22,23,62,63]. Assuming no dispersal limitation, the mapping of this niche space onto the landscape determines the potential physical space in which a species can occur [8,64,65]. A species’ geographic range is the geographic area that encompasses the complete set of locations where a species occurs [27,28]. Geographic ranges often take the form of a system of spatially structured populations or metapopulations [48,49], because environmental heterogeneity means that not all locations within a species’ geographic range fall within its ecological niche, nor are all locations that do fall within the niche equally favorable (Figure 1). It is therefore relevant to define the habitat range [66,67] as the small-scale spatial distribution of individuals and populations, determined by where abiotic and biotic conditions are suitable [24,25,26]. As a result, the distribution, density, and demography of populations of a species are not uniform. Habitat range limits arise, where births and immigration no longer exceed deaths and emigration, and aggregated across all populations of a species, these processes define the geographic range [25,68,69,70,71] (Figure 1).
Ecological niche breadth can affect both habitat and geographic ranges. Some species have very narrow ecological niches (specialists), whereas others are found across a wide range of abiotic and biotic environmental conditions (generalists) [72,73,74]. The fundamental niche [22] refers specifically to the abiotic requirements of species, but as it is impossible to eliminate the effect of biotic interactions [75], the fundamental niche is a largely theoretical construct. It is therefore more useful to consider a species’ realized niche [22,51], which accounts for both the abiotic and biotic environment, in determining the capacity for habitat and geographic range shifts. Metrics of realized niche breadth, including stress tolerance, the availability of suitable environmental conditions, and the stability of climatic conditions through time [4,76,77,78], have been demonstrated to be associated with plant species’ geographic range sizes [4,78,79,80]. However, ecological niches may not always correspond to geographic ranges because seed dispersal can subsidize populations in sites with environmental conditions outside of the niche, and dispersal limitation can prevent populations from occupying sites with conditions inside the niche [68]. The present-day size of species’ geographic ranges may reflect the integration of these processes and therefore predict the capacity for range shifts. For example, species distribution models incorporating bioclimatic variables predicted that tree species with larger geographic ranges would have higher climatic range filling, whereas smaller-ranged species showed a stronger influence of dispersal limitation [81]. However, many “rules” of species ranges have not always been supported by empirical data [82].
The history of plant species’ evolutionary lineages and the size of the clade to which they belong also play a role in determining the species’ ranges [27,66,83,84]. However, numerous studies have assessed the influence of species’ evolutionary history on their habitat and geographic ranges [85,86,87,88,89,90], as well as the importance of taxon cycles in facilitating range shifts over evolutionary timescales [91,92,93]. While evolutionary and ecological dynamics have intertwined effects on range limits [71], we focus our review on the role of plant ecological strategies in shaping species’ ranges and determining species’ capacities for habitat and geographic range shifts.
3. Ecological Strategies and Trade-Offs
Plants exhibit a wide variety of ecological strategies, which we define as the expression of phenotypically integrated traits from molecular to whole-plant biological scales, which determine the acquisition of resources from the environment and how those resources are allocated endogenously to different functions [94,95,96,97,98]. Trade-offs in function and the need for phenotypic integration constrain the phenotypic variation defining these strategies to a more limited set of permissible combinations, relative to those that are possible [43,99,100]. Ultimately, trade-offs in function produce demographic trade-offs manifested at higher levels of organization (Table 1), because allocation of endogenous resources is a zero-sum game [101,102]. For example, the resource economic spectrum (Table 1) defines a productivity-durability trade-off in the construction cost of organs, such as leaves and stems. The greater investment in construction required to build physically and chemically well-defended organs is advantageous because of greater damage resistance, but this advantage comes at the cost of lower productivity and growth, due to the greater mass investment required per unit volume. This is an example of a trade-off in function that is thought to underlie a demographic trade-off of higher plant survival at the cost of reduced growth (growth-mortality trade-off; Table 1) [96,101,103,104]. Plant species falling at different points along the growth–mortality trade-off axis tend to be found in different types of environments, because more stressful environments (e.g., infertile soils) favor investment in defense and other functions promoting survival, whereas more productive environments (e.g., fertile soils) favor investment in functions supporting growth [105].
Due to numerous types of trade-offs in function (Table 1) and the need for phenotypic integration, the phenotypic traits of plant species exhibit covariation across life stages. An example comparing large and small seeded tree species is instructive. Large seeds with storage cotyledons promote survival of tree seedlings in the low-light conditions of the forest understory, and so tree species with large seeds are often tolerant of shade. Limited allocation to reproduction and seed size–number and fecundity–tolerance trade-offs (Table 1) also mean that although fewer larger seeds are produced [106,107,108,109], they tend to have a higher seedling survival. As they are heavy and not easily dispersed by wind, they also tend to be fleshy fruited and dispersed by animals [110,111,112]. Conversely, small seeds are more easily dispersed by the wind and have little room for storing resources, and so they have photosynthetic cotyledons that favor survival of seedlings in high-light environments. Small-seeded tree species thus tend to be intolerant of shade and their high fecundity facilitates colonization of rare canopy gaps where insolation is high [57], resulting in a colonization–competition trade-off (Table 1). There are certainly exceptions to these types of trait “syndromes” defining plant species ecological strategies [113,114,115], but as they are principally defined by nearly unavoidable trade-offs in function, they have implications for plant species’ capacity for shifts in habitat and geographic ranges. In the following sections, we describe how these strategies and underlying trade-offs affect processes influencing the capacity for range shifts at two plant life stages [57]: colonization ability and the likelihood of habitat filtering mediated by PE matching across life stages (Figure 2).
4. Colonization Ability
For shifts in plant species’ habitat and geographic ranges to occur, colonization of a new, previously unoccupied area or habitat is necessary. Following the literature on colonization–competition trade-offs (Table 1) [59,116], we define colonization as seed arrival to a site. As they are sessile, plants are notoriously dispersal limited [117,118]. Colonization limitation can prevent species from occupying suitable environments, thereby limiting the potential for populations to migrate, to follow their ecological niche during climate change (Figure 1) [9,39,65,119]. Colonization is so essential that programs in assisted migration are an attempt to overcome its limitations and facilitate plant species’ climate-driven range shifts [120,121]. Colonization also influences ecological and evolutionary dynamics within and between plant populations, and hence source–sink dynamics [51,65,122]. Aside from vicariance (i.e., fragmentation of a continuous distribution caused by dispersal barriers), rare very long-distance dispersal events [27,123,124,125,126], the spatial extent of seed rain and number of seeds dispersed far distances (the “fat tail” of the seed dispersal curve) are known to affect the rate of plant geographic range shifts and the ability to colonize new areas and habitats [14,57,127,128]. Plant traits influencing colonization ability also evolve in spatially and temporally variable environments, which can facilitate range shifts during climate change [122].

Table 1.
Summary of the key whole-plant and trait-specific trade-offs in woody species’ ecological strategies, and implications of trade-offs for the capacity for range shifts at habitat and geographic range scales.
Table 1.
Summary of the key whole-plant and trait-specific trade-offs in woody species’ ecological strategies, and implications of trade-offs for the capacity for range shifts at habitat and geographic range scales.
| Trade-Off | Combinations of Traits or Strategies | Effect on Habitat and Geographic Ranges | Citations |
|---|---|---|---|
| Growth–mortality trade-off (the fast-slow continuum) | Fast growth and short lifespan, or slow growth and long lifespan | Fast-growing individuals would be favored when colonization ability is more limiting and rapid climate shifts could favor a shorter lifespan (i.e., generation time) | [96,101,129,130,131,132] |
| Growth–defense trade-off | Greater investment in defensive compounds and/or carbohydrate storage, or in growth | Well-defended individuals with more carbohydrates (greater stress tolerance) should be less likely to be filtered out of a site than fast growers when habitat filtering is more limiting | [73,130,133,134,135] |
| Growth–maturation trade-off (or stature–recruitment trade-off) | Greater investment in sapling and adult stem growth and survival, or in reproduction at a younger age and smaller size (greater seedling recruitment and more years of reproduction) | Individuals with higher adult and sapling growth and survival should be less likely to be filtered out; otherwise, higher reproductive investment may be more beneficial | [129,136,137] |
| Seed size–seed number trade-off | Produce and disperse many small seeds or few large seeds | Smaller seed size and higher fecundity should increase colonization ability when colonization is more limiting, increasing capacity for range shift | [106,107,109,138] |
| Colonization–competition trade-off | Better colonizer (early arrival, fast growth, high fecundity); or better competitor (late arrival, high survival, low fecundity) | High fecundity may increase range shift capacity through increased colonization ability, but high survival may more effectively reduce probability of being filtered out | [58,116,139,140,141] |
| Tolerance–fecundity trade-off | Produce more, less stress tolerant seeds (better colonizer), or produce fewer, more stress-tolerant seeds (better competitor) | High fecundity may increase range shift capacity through increased colonization ability, but higher stress tolerance may reduce probability of being filtered out | [142,143,144,145] |
| Specialist–generalist trade-off (low or high ecological niche specialization) | Express ecological niche specialization (i.e., in abiotic conditions and relationships with mutualists and/or antagonists), or exhibit low ecological niche specialization (i.e., wider range of abiotic conditions and generalist relationships with mutualists and/or antagonists) | Higher specialization in abiotic conditions and/or with mutualists should increase the probability of being filtered out of a site; higher specialization with antagonists may decrease probability of being filtered out through reduced conspecific negative density-dependence | [85,146,147,148] |
| Acquisitive–conservative spectrum (leaf economics spectrum, wood economics spectrum) | Build low-cost, short-lived, thin leaves, and low-density, low- fiber wood with small carbohydrate storage; or high-cost, long-lived, thick leaves, and high-density, high-fiber wood with large carbohydrate storage | Acquisitive traits may increase an individual’s probability of being filtered out of a site when habitat filtering is more limiting, reducing capacity for range shifts | [103,104,149,150,151] |
| High versus low phenotypic plasticity | Express highly plastic, more costly phenotype, or less plastic, less costly phenotype | Individuals with high phenotypic plasticity should be less likely to be filtered out of a site than less plastic individuals when habitat filtering is more limiting | [29,42,43,152,153,154,155] |
The spatial pattern of seed rain depends on the abundance and distribution of adults, and the shape of seed dispersal curves (probability density functions describing the probability of a seed landing a given distance from the mother tree), which is primarily determined by three axes of variation in traits related to seed dispersal: seed size, fecundity, and dispersal mode (the agents by which seeds are dispersed and their spatial movements) [111,112,117,156]. A fourth axis can be added that enables seed dispersal in time, that of seed dormancy, which has been shown to trade-off with dispersal in space [157]. These traits are frequently correlated among plant species, often referred to as seed dispersal syndromes [113,158]. Ultimately, it is the covariation in seed size, fecundity, dispersal mode, and seed dormancy defining species’ dispersal syndromes, combined with the abundance and distribution of adults, that influence colonization ability (Figure 2).
Seed size has been viewed as an organizing trait for understanding variation in colonization ability, because it is correlated with other properties of plants influencing dispersal and seedling establishment (e.g., fecundity). Across plant species globally, seed sizes vary 1011-fold, and among coexisting species in an environment, seed mass commonly varies over five to six orders of magnitude [159,160,161]. Although the variation between species is much more dramatic, there is also within-species variation in seed mass [162,163]. The size of a seed corresponds to maternal resource allocation per offspring, with greater mass indicating greater resource investment per seed [108,158,162].
The number of opportunities for a species’ population to disperse seeds to suitable sites is determined by the total seed production of all adults. The total seed production of a species’ population is determined by individual-level fecundity (often size-dependent), the age of reproductive maturity, and longevity [164,165]. Some species have fewer opportunities for dispersal, with a higher probability of success for each (e.g., large, high-resource investment seeds), or more opportunities, with a lower probability of success per propagule (e.g., small, low-investment seeds). This unavoidable seed size–number trade-off (Table 1) [106,107,109,138], whereby species produce few large or many small seeds, results in smaller-seeded species often being more fecund [106,107,166,167], increasing opportunities for dispersal and enhancing species’ colonization ability [168].
Beyond trade-offs with fecundity, seed size can also influence the probability of seed survival (discussed in Section 5) and secondary dispersal [108,169,170,171]. Trade-offs in the capacity for seed dispersal associated with producing smaller versus larger seeds contribute to the maintenance of seed size diversity in plant communities [144,166]. Though larger seed size can confer tolerance and higher survival when seeds are dispersed to stressful environments [142,144], there is likely to be consistent selection pressure for smaller seeds, as this directly influences population fitness [161].
Pollination limitation, in which plants produce more ovules than are ultimately fertilized, can limit seed production, reducing colonization opportunities and wasting reproductive effort [172,173]. Plant phenological shifts related to climate change (e.g., early or delayed flowering) may increase or decrease individual fecundity [174,175], suggesting strong variation in seed production could occur across a species’ geographic range, which could enhance or reduce the colonization ability of specific populations. For example, the fecundity in eastern North American forests was shown to be highest towards southern edges of species’ distributions, limiting northward spread, whereas the ample fecundity and higher recruitment in western forests is facilitating tree species’ migration to higher latitudes [19]. However, long-lived, iteroparous plant species, such as most trees, may be protected against short-term constraints on reproduction by repeated opportunities for reproduction during their lifespan [176].
Both seed size and fecundity are correlated with dispersal mode [165,177]. Smaller-seeded species can be dispersed by biotic agents with a range of body sizes (e.g., ants, vertebrates) or by abiotic agents (e.g., wind, water) [128,159,176], whereas larger-seeded species are typically dispersed by birds or mammals [112,178,179]. Directed seed dispersal, e.g., by an animal with habitat preferences, can lead to disproportionate arrival of seeds to particular locations or habitats [110,111,128], which may or may not benefit the plant [110,112]. Within growth forms, smaller-seeded species often have longer average dispersal distances than species with larger seeds [125,126,177], and may therefore have a greater colonization ability, due to their higher fecundity. However, larger-seeded species dispersed by larger-bodied animals with wide home ranges can also be carried over long distances [110,112,180], even tens of kilometers [125]. Pleistocene migration rates of large-seeded, animal-dispersed species can be comparable to those of smaller-seeded, wind-dispersed species [128], perhaps because larger seeds often survive better [108,139,178], as discussed in Section 5. Although rare, long-distance dispersal events are particularly influential in range shifts and expansions, as they enable the colonization of novel sites [126,156,181].
Beyond dispersal in space, some plant species undergo dispersal in time via seed dormancy, arising from physiological mechanisms that prevent germination when environmental conditions are unfavorable for seedling establishment [182]. Seed dormancy is often observed in particularly stressful environments (e.g., deserts), in which the favorable window is unpredictable and short [183,184], and in closed-canopy forests among light-demanding species, as the appearance of canopy gaps is rare and unpredictable [128,185,186]. Water availability, temperature, and light quality are key environmental cues affecting the breakage of seed dormancy [187,188]. Plant species with dormant seeds often have more limited spatial dispersal, representing a trade-off in dispersal in time and space [157], although this may not be true for small-seeded, light-demanding tree species. As large seeds are attractive to granivores, they often do not exhibit dormancy [157,189].
Seed dormancy allows for the establishment of a population-level seed bank at a site, enabling germination at different times within a year or in future years when conditions become suitable [182,189,190]. Given the current pace of climate change [5], the climate at a location may have changed appreciably during a period of long seed dormancy, which could be beneficial or detrimental for germination. For example, while seed dormancy release is expected to occur more quickly in response to warming temperatures, this accelerated timing may or may not correspond to periods with sufficient water availability [187], potentially negating the benefits of dormancy. The current environmental conditions of a novel site, in conjunction with other attributes of the seed, will determine whether dormancy is a strategy that enhances or limits a species’ colonization ability.
In summary, the ability of a plant population to produce ample, well-dispersed seeds is critical in determining its capacity for shifting its habitat and geographic ranges to track favorable environmental conditions. This is particularly important to consider with respect to the responses of vegetation to climate change, because the pace of migration of climate envelopes is considered to be more rapid than the migration rates of most plants, even ignoring post-dispersal survival [12,14,39]. Early-successional species with greater dispersal abilities are predicted to track climatic shifts via range shifts more readily than mid- to late-successional species, which are predicted to experience range shifts more slowly, as a consequence of reduced dispersal [191]. However, whether seeds colonize novel habitats with suitable conditions for establishment is crucial [128,168,192], as this directly affects the proportion of seeds that will survive and progress to future life stages, shaping the local population trajectory.
5. Phenotype–Environment Matching
After seeds successfully colonize a site, PE matching will determine whether a plant species’ population will become established in a new area (Figure 1). PE matching occurs at all life stages, including seed survival and germination, seedling survival, and maturation to a reproductive adult. Abiotic (i.e., soil, topography, climate) and biotic (i.e., mutualists and antagonists) factors and phenotypic plasticity mediate a plant’s phenotypic expression across life stages. These post-dispersal processes are critical in determining habitat and geographic range expansion and shifts. This is underscored by the fact that species that are released from dispersal limitation (e.g., species introduced by humans into a non-native range) and become invasive often have phenotypic and demographic traits that enable rapid population growth, provided the environment sufficiently matches their niche requirements, and many of these traits are also shared by native invasive species [193,194,195,196,197]. However, if a sufficiently strong PE mismatch occurs at any life stage, individuals may not survive and if this occurs at the population level, then the species will be excluded from the site via habitat filtering [198,199,200,201]. The terms “abiotic filtering”, “environmental filtering”, “habitat filtering”, and “ecological sorting” have been used in studies of community assembly and coexistence to describe the mechanisms by which plant species are excluded or “filtered out of” an environment, with nuanced differences in their definitions [105,202,203,204,205,206]. Here, we define habitat filtering, as in Maire et al. (2012) [200], to include any abiotic and/or biotic factors preventing the establishment and persistence of a particular species at a particular site. At one geographic range margin (e.g., higher latitudes in temperate regions), species’ distributions are thought to be more strongly limited by abiotic stress, whereas at the opposite range margin (e.g., lower latitudes), increasing interspecific interactions may limit distributions [27,28,207,208], but both are important in limiting geographic ranges [209]. While interactions between abiotic and biotic factors influence plant PE matching [96,209,210,211] and the potential for species’ habitat and geographic range shifts to occur, we discuss their effects separately here.
5.1. Abiotic Environment
A plant’s abiotic environment is principally shaped by soil properties, topography, and climate, which affect the availability of the key abiotic resources required by all plants: light, water, and nutrients [31,212,213,214]. Since plants compete for these resources and often associate with symbionts to acquire them, their availability is also moderated by biotic interactions, which will be addressed in Section 5.2. Aside from resource availability, abiotic environmental factors affect physiological and metabolic processes at all life stages and from molecular to organ-levels, such as the breaking of seed dormancy and photosynthetic carbon assimilation, as well as the expression of phenotypic plasticity, to determine plant growth, survival, and reproduction. Soil properties, topography, solar radiation, and climate differ among species and among biogeographic regions in their relative importance for defining habitat and geographic ranges [215,216,217].
Many properties of soil, including nutrient concentrations, texture, and pH, can act as local habitat filters, limiting plant distributions, often through competition for limited resources [105,199,200,218]. Soil properties can also have direct negative effects on non-adapted plant species, as in the case of serpentine soils or soils with extreme pH [219,220]. Habitat filtering mediated by soil properties and topography can limit habitat ranges. Numerous studies have found plant species to specialize on particular soil types and topographic environments [221,222,223,224], and to exhibit variation in vital rates across them [105,225]. These patterns often owe to less favorable abiotic conditions at range edges [68], limiting range shift and expansion. For example, lower soil moisture has been shown to strongly reduce germination and limit establishment towards species’ range edges [226,227].
Topography can cause heterogeneity in abiotic conditions at a range of scales [228,229], influencing the availability of belowground resources and light, as well as climate [31,230,231]. Local topographic gradients (e.g., in slope, aspect) may result in much more abrupt changes in abiotic conditions compared to broad environmental gradients (e.g., latitude) at the scale of species’ geographic ranges [25,232,233]. The rate of change and degree of variation in abiotic conditions along topographic gradients is crucial, as many plant species, particularly long-lived ones, tend to be relatively fixed in the range of climatic conditions they can tolerate [234]. As a result, microclimate refugia created by topography, rivers, and other landscape features can allow populations to persist in otherwise unfavorable regions [235]. Historically, these refugia have played important roles in defining geographic range limits, supporting remnant populations persisting outside of the core part of the range (Figure 1) [76,235,236]. Plant species with less plastic climatic niches are arguably more likely to exhibit range shifts, provided the dispersal is not limiting. For example, in warming mountainous regions across the globe, there is abundant evidence of plant populations exhibiting range shifts or contractions to higher elevations that are cooler [237,238,239]. While plant species with extensive dispersal would be expected to arrive at upslope habitats where PE matching may be better maintained [191,192], less well-dispersed species may not be able to track favorable abiotic conditions, potentially leading to local extirpation.
The rate at which plant species’ range shifts occur along elevational gradients, to track favorable thermal and moisture conditions, will likely depend on their degree of abiotic environment specialization. The degree of variation in abiotic conditions that a plant species can tolerate corresponds to a specialist–generalist trade-off, or a trade-off in low versus high ecological niche specialization (Table 1) [85,146,147], whereby species tend to have either low or high specialization to particular abiotic conditions. This ecological niche specialization also extends to plant species’ relationships with mutualist and antagonists, which we discuss in Section 5.2. The degree of specialization to abiotic conditions may directly shape species’ performance along environmental gradients. For example, a reciprocal transplant experiment evaluating seedling performance along a climatic gradient found a higher survival and growth of specialists than widespread generalist species, when planted in the specialists’ home habitat [32]. This supports the idea that widely distributed (generalist) species with large geographic or elevation ranges may have higher stress tolerance but lower competitive ability [224,240], a direct consequence of low versus high ecological niche specialization.
As average climate shifts and climatic variation increases, the proportion of surviving seedlings determines whether populations will expand, contract, or maintain their current ranges [35,74,241], which will be influenced by changes in the rate and timing of seed germination (covered in Section 4). Plant species with larger seeds generally produce more robust seedlings with higher survival (i.e., more competitive), whereas small-seeded species tend to have higher colonization abilities, reflecting a colonization–competition trade-off (Table 1) [116,168,178]. However, more severe drought events and soil warming are likely to negatively influence seedling emergence and survival [187,242], decreasing the favorability of novel sites and increasing the probability of PE mismatches. For tree seedlings, the effects of drought and climate warming on survival and growth can be buffered considerably by forest canopies reducing exposure and temperatures in the understory [243,244]. However, for species colonizing novel sites that lack overstory buffering (e.g., beyond the edge of a forest canopy or in a large canopy gap produced by a disturbance event), abiotic stress tolerance may be critical for seed survival and seedling establishment [144,145]. Species that produce large numbers of seeds tend to invest less resources per seed in conferring stress tolerance (e.g., defenses, carbohydrates, hard seed coat), whereas species that produce fewer seeds generally have more stress-tolerant seeds with higher survival, creating a tolerance–fecundity trade-off (Table 1) [142,144,145]. Thus, while having larger seeds may be favorable for species’ survival in less favorable environments, highly fecund species may be able to avoid stressful environments through increased chances for dispersal; a trade-off that can help to facilitate PE matching for species across this spectrum.
As environmental variation often increases with spatial scale, regional climatic variation shapes the pattern and limits of species’ ranges at geographic scales [80,245], whereas local microclimate variation within habitats influences the environmental conditions that individual trees experience [246]. Therefore, microclimate directly affects individual vital rates, which translates to effects on population fitness across species’ geographic ranges [25,247]. For example, some boreal tree species exhibit fitness trade-offs between growth rates and freezing tolerance in populations across their geographic ranges, limiting their ability to grow quickly and resulting in these species being outcompeted at their southern range limits by species with faster growth rates [248]. A study of 19 tree species in a North American temperate forest found differences in growth rate for populations at their range limit versus range center, with growth rates generally being lower at the colder northern limit and higher at the warmer southern limit [38]. Alternatively, species with geographic range limits imposed by climatic gradients may experience increased survival and/or reproduction at a range edge in response to increasing temperatures [41], potentially allowing for expansion of their range limits into favorable novel environments. Unavoidable resource allocation trade-offs result in species generally increasing investment in sapling and adult growth and having a later reproductive age, or prioritizing maturation, with an earlier reproductive age and more years of reproduction, representing a growth–maturation trade-off (Table 1) [141]. Indeed, plant populations at their warmer range limit have been shown to undergo compensatory shifts in their demographic rates in response to warming conditions, experiencing higher growth and lower recruitment and survival (growth–mortality trade-off; Table 1) [249]. However, tree mortality has also been shown to increase towards the warmer limits of species’ geographic ranges [250], indicating that climate warming, and potentially its interactions with other stressors (e.g., pests), are causing range contractions.
In addition to lower survival, reproductive failure may also be more likely towards habitat and geographic range limits, where conditions are often at the edge of species’ ecological niche [9,68,88,251]. Climatic conditions including rainfall, change in temperature between summers, and preceding year temperature are known to affect seed production, although interannual variation in production can be considerable in long-lived species [252,253,254]. Reproductive failure and/or reduced seed production at range edges may often be a stronger factor limiting the expansion of habitat and geographic ranges compared to the survival of offspring [26,145,255], with potentially significant consequences for edge population persistence. In summary, the effects of climate change on the suitability of abiotic environmental conditions for a species will affect PE matching across habitat and geographic ranges and in any new areas that may be colonized. However, the biotic environment can moderate the abiotic environment, and these interactions can affect PE matching.
5.2. Biotic Environment
Biotic interactions influence plant growth, survival, and reproduction, and the magnitude of these effects often depends on the abiotic environment [256,257,258]. Many plants rely on mutualisms for essential functions, such as seed dispersal and pollination (discussed in Section 4), as well as resource acquisition (e.g., root symbionts like nitrogen-fixing bacteria, mycorrhizae). Beneficial symbioses can cause the realized niche of plants to be larger than the fundamental niche; for example, by enabling plants to maintain populations in less fertile soils than would be possible without root symbionts [148]. Biotic interactions can also be antagonistic, as in the competitive interactions between plants and the negative effects on plants of natural enemies, such as pests, pathogens, and herbivores. Since the populations of mutualists and antagonists that plants interact with are also likely to be affected by climate change [259,260], these interactions can affect range shifts in potentially complex ways [260,261,262].
A plant species’ probability of range shifts depends on the distribution and abundance of key mutualists and antagonists and whether or not their ranges are undergoing shifts in correspondence with plant range shifts [33,148,263]. Asynchrony in biotic interactions may affect plant distributions if their partners respond to climate change in different ways, resulting in a phenological mismatch [264,265,266]. In the case of pollination, plants that rely on specialized animal pollinators, as opposed to wind pollination, generalist pollinators, or self-pollination, may be particularly vulnerable to decoupled shifts in plant and pollinator ranges [266]. The absence or lowered abundance of key specialist pollinators could lead to reduced seed set, impairing colonization and causing PE mismatch [176]. On the other hand, having less specialized interactions with mutualists is considered an important trait, allowing non-native species to become established in new areas [267]. In the case of root symbioses, decoupled range shifts could result in reduced nutrient acquisition by plants. As with pollinators, this effect would be expected to be particularly acute in the case of highly specialized symbioses, such as between pines (Pinus sp.) and ectomycorrhizal fungi [268]. In the case of plant antagonists, decoupled range shifts could be advantageous for plant populations, by allowing for escape from natural enemies, facilitating establishment in novel sites [34,269]. For example, the grassland species Tragopogon dubius experienced antagonistic effects of soil pathogens in numerous parts of its established range but avoided these effects in a newly occupied part of its range [270], suggesting this species benefitted from the decoupling of the plant and antagonists’ ranges. However, plant species with either generalist antagonists or specialist mutualists may benefit less from decoupled range shifts, as novel sites may feature other limiting natural enemies or lack key mutualists, corresponding to a specialist–generalist trade-off related to species’ ecological niche specialization (Table 1) [85,147,148].
Decoupling of the ranges of interacting plant species will also affect species’ capacity to undergo range shifts, as plants encounter differences in the magnitude of competition compared to the core parts of their ranges. Encountering better or worse competitors will affect both individual vital rates and plant species’ responses to competition [271,272]. Inferior competitors may be restricted to narrow distributions on interspersed patches of habitat due to their inability to compete for space [273], with more limited capacity for range shifts than strong competitors. Increased interspecific competition where species’ ranges overlap may impede plants from shifting their ranges to track favorable climatic conditions [273,274,275], reducing their ability to maintain PE matching.
Both mutualistic and antagonistic interactions affect the ability of plants to maintain PE matching, particularly at the seed and seedling stages. Connections of seedlings to the mycorrhizal networks of adult trees strongly increase their survival and access to soil water [276], which may facilitate better establishment of seedlings at range edges. Fungal mutualists can also allow for large-scale range expansion into otherwise unsuitable environments by reducing abiotic stressors on plants [259]. However, antagonistic interactions operating at the seed and seedling stage can halt range shifts, as seed and seedling survival are strong demographic filters [277]. Seeds and seedlings will not survive if they are vulnerable to or poorly defended against antagonists [278,279]. Seed predators can dramatically reduce the number of seeds available to establish at a site [280,281]. Indeed, most seeds are consumed by granivores [105,112,279,282], limiting potential seedling recruitment and capacity for range shifts if seed predation is high compared to seed production.
Many biotic interactions operate in density-dependent ways. For antagonistic interactions, the effects on plants can be increasingly negative as the density of plants increases, which has important consequences for population dynamics [283]. For example, optimally foraging seed predators and herbivores should spend more time in denser resource patches [284], and higher conspecific neighborhood density is often associated with lower survival and growth, mediated by intraspecific competition and natural enemies [285,286,287,288]. Soil pathogens that can strongly limit seed germination and seedling survival [289] accumulate in areas of high population density [290]. Plant apparency is greater in areas of high host plant population density, which can increase rates of herbivory [291,292]. These and other similar processes result in conspecific negative density-dependence (CNDD) of plant vital rates, particularly growth and survival. Seed dispersal can allow offspring to escape the CNDD operating at early life stages [128]. At species’ habitat and geographic range edges, densities of individuals at early life stages and adults are often lower than in more central parts of the range [24,219]. Colonization of areas with reduced conspecific density may alleviate CNDD and promote population growth at the range edge, facilitating range expansion [34,293]. Indeed, the enemy release hypothesis may explain the invasion success of some non-native plant species [194,293,294], although, over time, negative feedbacks can develop [295]. However, growth–defense trade-offs (Table 1) may moderate the strength of CNDD. The greater investment in physical and chemical defenses often found in slower-growing plant species may allow them to avoid the negative effects of antagonists, whereas faster-growing species may better tolerate aboveground herbivory because their organs, particularly leaves, are rapidly replaced anyway [134,296,297].
On the other hand, low population density may not always be beneficial, as it can adversely affect some interactions, particularly for mutualisms. For example, pollinators are often attracted to large floral displays, occurring in areas with a high density of flowering individuals [298,299]. Allee effects may occur if animal pollinators are less likely to visit more isolated individuals or low-density populations, such as at a range edge, which could limit the seed set [176,300,301,302]. Changes in the density or composition of root mutualists, such as mycorrhizal fungi, can also affect range shifts [260,303,304,305]. For example, reduced densities of mycorrhizal mutualists of native plant species have been shown to enhance the population growth of invading non-native plant species [306]. For plant species with high mutualist specialization, as in the example of pines (Pinus sp.) and ectomycorrhizal fungi described earlier, the density of mutualists can strongly influence plant niche breadth [268], with decreases in fungal densities limiting such species’ distributions [259,303].
Ultimately, climate change will not only affect plants via direct effects on the abiotic dimensions of the ecological niche, but it will also affect the organisms with which plants have mutualistic and antagonistic interactions, likely causing changes in their population densities and ranges. Complex decoupling of the distributions of plants from their mutualists and antagonists could inhibit or promote range shifts in ways that depend on the species’ ecological strategy and unavoidable trade-offs across life stages [263,304,305].
5.3. Phenotypic Plasticity
Another consequence of plants’ sessile lifestyle is phenotypic plasticity. Shifting biotic and abiotic environmental conditions can induce changes in plant phenotypic traits [307,308], which, when adaptive, can result in better PE matching [154,309]. Phenotypic plasticity may be an important property that makes non-native introduced plant species become invasive [310,311]. However, the degree to which plasticity is adaptive may depend on the time lag between the environmental change and the organism’s phenotypic shift; the longer the lag, the less adaptive the change may be, increasing the likelihood of PE mismatch [12,42]. The ability of plants to respond adaptively to climate change therefore depends on their magnitude and direction of phenotypic plasticity [312,313], within constraints imposed by phenotypic integration [97,307,308], by buffering individuals against the effects of short- and long-term shifts in environmental conditions [41,247]. This buffering may be particularly important for long-lived plants with longer generation times, by allowing individuals to plastically adjust their phenotypes in response to changing conditions [207,247]. Plasticity in phenotypic expression can also operate as habitat selection, because through their growth, plants modify their own environment [152,219], which can moderate their response to climate change throughout their lifespans [10]. Despite the potential advantages, there are still costs to expressing a flexible phenotype, representing a trade-off in high versus low phenotypic plasticity (Table 1) [42,152,154]. These costs may arise from the production of plastic phenotypes, maintaining the physiological “machinery” that allows for plastic responses, or from fitness costs if a more plastic phenotype has lower survival or performance in an environment [43,60,152,314].
Phenotypic plasticity can affect the course of evolution, and hence, the long-term responses to climate change. This can happen by either facilitating adaptive evolutionary change, by “buying time” for evolution to occur [315,316,317] or constraining it, by reducing the strength of natural selection [318,319,320]. In the plane tree (Platanus orientalis), populations from more favorable growing environments had greater leaf trait plasticity, which enabled beneficial adjustments during experimentally induced droughts. For individuals from populations in drier, hotter climates, however, reductions in plasticity were associated with trait values more adaptive for the prevailing, more stressful environmental conditions [321]. Whether phenotypic plasticity itself can be considered a trait is controversial, but there is evidence that, when genetic variation in plasticity is present, it can be selected for and evolve in response to environmental changes [43,313,322]. However, it is ultimately both the rate of these environmental changes and the rate and type of adjustment in plants’ expressed traits that will determine whether plasticity is adaptive and allows PE matching to be maintained and the local population to persist.
6. Plant Species’ Capacity for Range Shifts
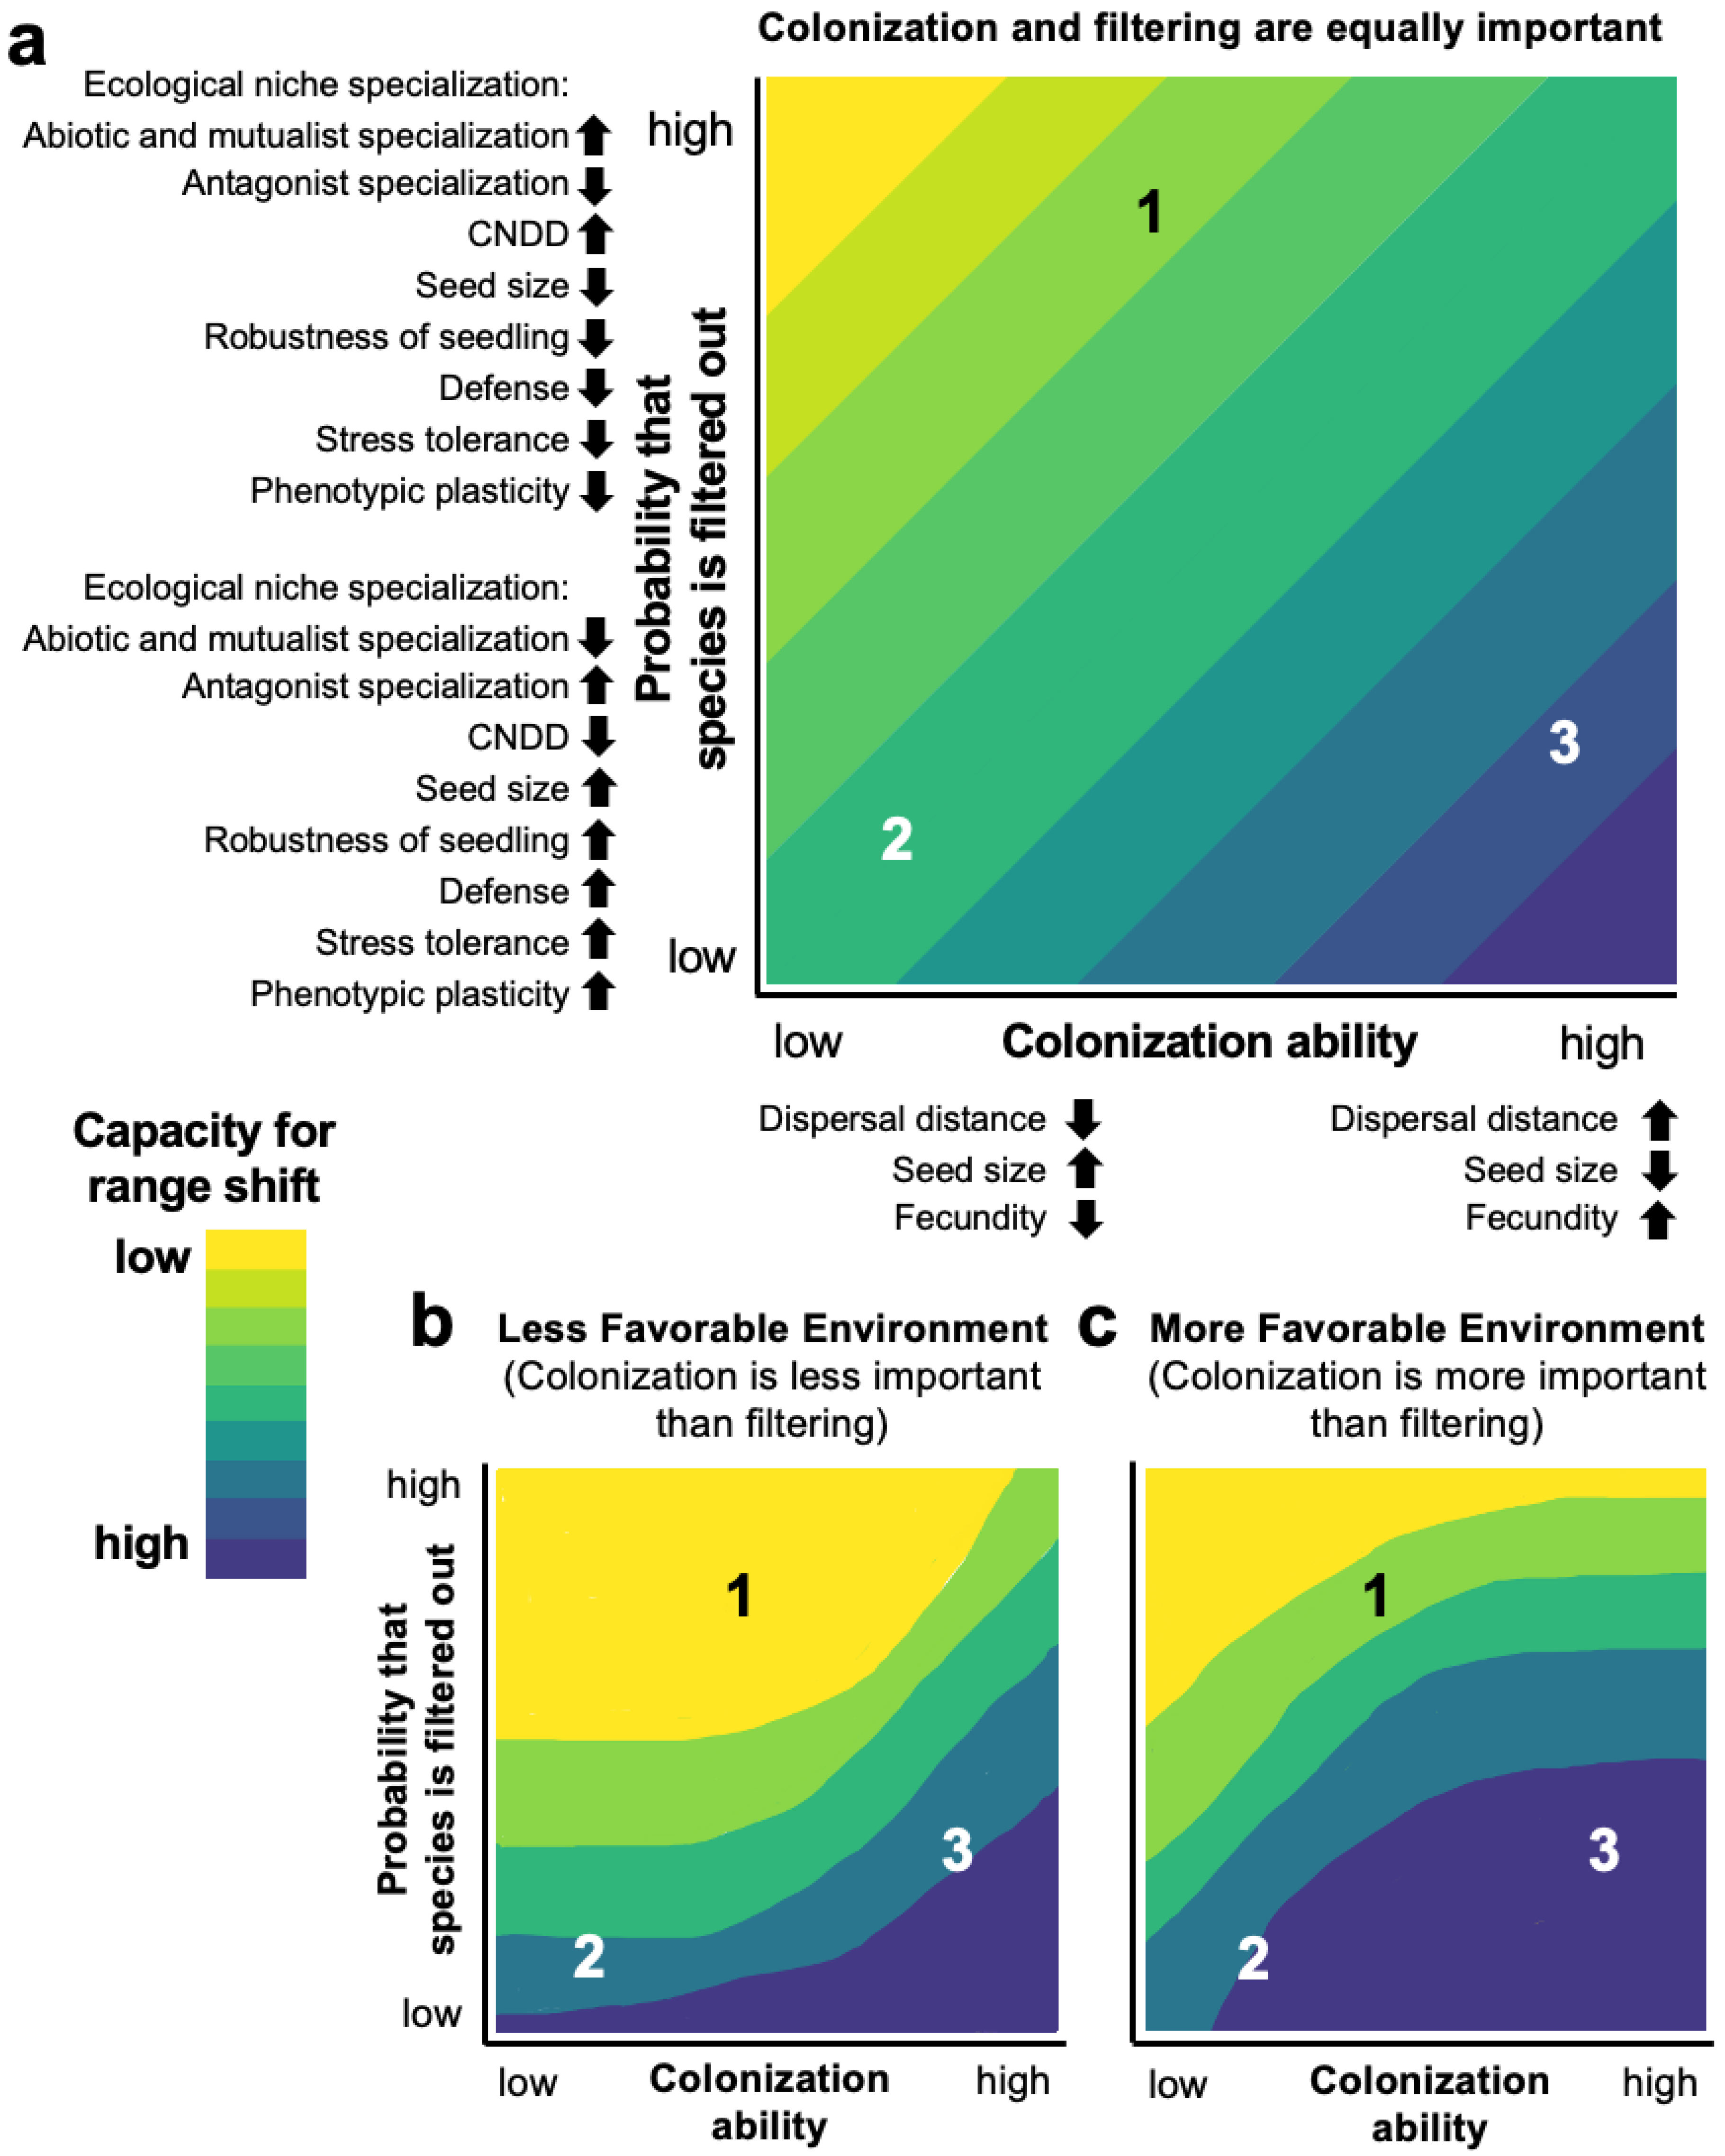
The numerous functional and demographic trade-offs (Table 1) form a basis for defining a conceptual framework describing how variation in ecological strategies affects the ability of plant populations and species to undergo shifts in habitat and/or geographic ranges in response to climate change (Figure 2). We consider the likelihood of range shifts occurring to be a function of two factors, represented on the axes of Figure 2: (1) colonization ability, and (2) the probability that a given genotype will be filtered out of a particular environment due to PE mismatch (i.e., chances of habitat filtering). Variation in colonization ability and in the chances of habitat filtering both depend on components of plant ecological strategy, and patterns of qualitative variation in phenotypic traits defining this dependence are shown on each axis (traits on axes of Figure 2 are in italic face font throughout this section and apply for panels a–c). Using a conceptual state-space representation with three hypothetical plant species, the color ramp in Figure 2 shows possible ways that the capacity for range shifts depends on colonization ability and the chances of habitat filtering, with this capacity ranging from low (yellow) to high (purple). The capacity for plant range shifts is equally determined by the effects of colonization ability and the probability that a species will be filtered out of a site after colonization in Figure 2a, is more limited by a species’ probability of being filtered out in Figure 2b (i.e., less favorable environment), and is more limited by a species’ colonization ability in Figure 2c (i.e., more favorable environment). Species 1 would have a moderate dispersal distance and fecundity and small to moderate seed size, could represent an abiotic condition and mutualist specialist and antagonist generalist (with respect to ecological niche specialization), experience high pressure from conspecific negative density-dependence (CNDD), produce less robust seedlings (robustness of seedling), be a less well-defended and stress tolerant individual (defense and stress tolerance), and/or exhibit low phenotypic plasticity. Species 2 would have low seed dispersal distance and low fecundity, would be a large-seeded species, and could represent an abiotic condition and mutualist generalist and antagonist specialist, experience minimal effects of CNDD, produce more robust seedlings, be a well-defended and stress tolerant individual, and/or exhibit high phenotypic plasticity. Species 3 would have high colonization ability, due to having a longer dispersal distance, smaller seed size, and higher fecundity, and similar traits on the y-axis as Species 2. In this section, we describe the rationale for this trade-off-based framework.
The influence of seed size on a species’ capacity for range shifts will vary depending on the species’ dispersal distance and fecundity, and on whether habitat filtering, or colonization ability, is more limiting (Figure 2b, c). In general, species with increased dispersal distances will have a greater colonization ability, increasing their capacity for range shifts across environments (e.g., Species 3). However, species with larger seed sizes are often animal dispersed [111,282], and so colonization into more favorable environments depends on whether the animal dispersal agents use those environments, potentially decreasing their colonization ability (e.g., Species 2). Conversely, plant species with smaller seed sizes are often wind dispersed, or dispersed by generalist animals (e.g., small birds) [164,176], so colonization may be less constrained by the dispersal mode, increasing the capacity for range shifts (e.g., Species 3).
The proportion of seeds that survive and establish as seedlings will strongly affect the capacity for range shifts. Seeds and seedlings are vulnerable stages of plants and are arguably more susceptible to PE mismatch, due to several mechanisms. As a result of the colonization–competition trade-off [59,178], when habitat filtering is more limiting, having a smaller seed size and/or less robust seedlings should increase a species’ probability of being filtered out, reducing the capacity for range shift (e.g., Species 1 in Figure 2b). Conversely, when colonization ability is more limiting, having a smaller seed size may facilitate colonization, increasing capacity for range shift (e.g., Species 1 in Figure 2c; Table 1). Owing to the seed size–seed number trade-off [106,109], small-seeded species may not be filtered out, due to having many opportunities to colonize new sites through increased fecundity, increasing the species’ capacity for range shift, despite a potentially lower survivorship of individuals (e.g., Species 3 in Figure 2; Table 1). However, having high fecundity may be less beneficial in a less favorable environment [144,145], where habitat filtering is more limiting (e.g., Species 3 in Figure 2b), since each seed has an advantage through increased stress tolerance (tolerance–fecundity trade-off; Table 1), reducing the probability of being filtered out and facilitating range shift (e.g., Species 2 in Figure 2). Stress tolerance frequently corresponds with greater investment in defense against natural enemies, reducing the resources available to allocate to growth (growth-defense trade-off; Table 1). Investment in defenses corresponds with longer lifespan [130,323], therefore reducing the probability that a species is filtered out of a site, particularly in less favorable environments (Species 2 and 3 in Figure 2). The benefits of investment in defenses for species’ capacity for range shifts may be greater in less favorable environments (concave-up down in Figure 2b), because tissue replacement is more costly in poor environments [133,134].
By defining the range of possible novel sites that, once colonized, are suitable for establishment, the ecological niche affects the capacity for habitat and geographic range shifts [68]. Higher ecological niche specialization in abiotic conditions and mutualists, and lower specialization in antagonists (i.e., an antagonist generalist), should increase the probability that a species is excluded from a site via habitat filtering, reducing its capacity for range shifts (Figure 2). Niche specialists are expected to be more susceptible to climate change [79], due to their often narrower habitat and geographic ranges. However, if environmental changes cause suitable areas to become more available, higher specialization in abiotic conditions and mutualists and lower specialization in antagonists may less strongly influence a species’ probability of being filtered out of a site (concave-down contours, Figure 2c). A species’ degree of antagonist specialization should also be related to the relative importance of CNDD: species with highly specialized natural enemies should be able to escape their adverse effects through reduced CNDD, decreasing their probability of being filtered out of a site (e.g., Species 2 in Figure 2). CNDD, while important at all size classes, has strong negative effects on seeds and seedlings and may increase a species’ probability of being filtered out of a site [282,285,286,287], reducing the capacity for range shifts (e.g., Species 1 in Figure 2). Alternatively, if the species’ colonization ability is high, propagules dispersing to novel sites where population densities are low may escape sources of negative density dependence [34,324], increasing their capacity for range shifts (e.g., Species 3 in Figure 2). Finally, by expressing adaptive phenotypic plasticity, species may avoid being filtered out of a site, potentially increasing their capacity for range shifts [247,325,326] (e.g., Species 2 and 3 in Figure 2). Nonetheless, the costs associated with expressing phenotypic plasticity (Table 1), particularly in less favorable environments, may result in a species being filtered out of a site (concave-up contours, Figure 2b).
Ultimately, the patterns of qualitative variation in expressed phenotypic trait values that we illustrated in this conceptual model define plant species’ ecological strategies, and result in the associated, unavoidable functional and demographic trade-offs. Species’ ecological strategies and the trade-offs that characterize them shape species’ colonization abilities and their likelihood of being filtered out of a site via PE mismatches, determining their capacities for range shifts into novel environments.
7. Synthesis and Future Directions
Climate change may dramatically reshape the distribution of diversity on Earth, particularly in combination with other anthropogenic stressors related to human population growth, such as land-use change and landscape fragmentation and degradation [5,327,328,329]. There is a need to predict the effects of climate change on species habitat and geographic ranges, particularly for species already of conservation concern [21,330,331,332,333]. Quantitative species distribution models that predict occurrence or abundance as a function of ecological niche variables using correlative formulations, based on existing distribution information (e.g., Maxent, Bioclim) [334,335] or more mechanistic formulations (e.g., NicheMapR, Ecosystem Demography Model) [336,337,338,339], have been used to predict plant range shifts under future climate change scenarios, for both rare and common species and across plant growth forms [340,341,342,343]. Mechanistic models are viewed as more generalizable, although correlative and mechanistic models have been shown to make similar predictions [344]. These complex models take various data inputs and make many assumptions, both explicitly and implicitly, and their application is complicated [345,346]. Data integration and modeling advances have expanded the types of data that can be used in species distribution models [346], and the sources of freely available diversity data are growing (e.g., Global Biodiversity Information Facility) [347]. Still, for many plant species, particularly rare species, we presently lack the data needed to fit and validate quantitative species distribution models [8]. Moreover, the predictive accuracy of these models is often not tested or only tested in limited scenarios. Recent meta-analyses have found species distribution models in many cases to have mediocre accuracy for occurrence, and even lower accuracy for other population parameters, such as abundance [348]. Moreover, others have pointed out that many species ranges are not shifting in the expected ways [349]. These observations highlight the need for reproducibility and assessment of quantitative species distribution models and their predictions [349,350].
Modeling plant species’ distributions presents several challenges, many of which are ultimately due to their sessile nature. As described above, colonization, phenotypic plasticity, and interactions with mutualists and antagonists are fundamental to much of plant population ecology yet are still not well understood or are less predictable, making them hard to integrate into mechanistic quantitative species distribution models [102]. For example, phenotypic plasticity means that the rate of a physiological process not only changes due to the environmental conditions, but that the plant can adjust aspects of its form and function to changing conditions, in ways that allow a more adaptive response to its current environment. These types of feedbacks can be difficult to constrain in mechanistic models. Modeling at larger, geographic scales and correlative models may circumvent the need to prescribe these sorts of processes explicitly [344,351]. However, models making quantitative predictions at smaller, habitat scales would ideally represent processes affecting individuals and populations more explicitly, which may make them difficult to develop and parameterize.
The trade-off-based framework that we present here for evaluating the range shift capacity of plants clearly does not enable quantitative prediction. However, it provides a readily accessible, conceptual basis for making qualitative predictions that are predicated on generally well-supported fundamental trade-offs in function, including some that have not yet been, or only implicitly, incorporated into quantitative species distribution models. Our framework also provides a set of hypotheses about the ecological processes influencing range shifts, most of which can be tested using data that are readily available for many plant species. The untestable hypotheses point to future data collection and modeling needs, for example, on the role of mutualist specialization in limiting plant species range shifts. Our framework is likely to be particularly useful for making qualitative predictions of range shift capacity for poorly known species, such as in highly diverse tropical ecosystems, in which only basic ecological and functional information may exist, and for when there is a need to predict the range shift capacity for many plant species using a similar set of criteria. Summarizing the key trade-offs and aspects of species biology that should be considered in building a quantitative distribution model, our framework can serve as a guide for model developers.
Author Contributions
Conceptualization, B.H.M. and S.E.R.; writing—original draft preparation, B.H.M. and S.E.R.; writing—review and editing, B.H.M. and S.E.R.; visualization, B.H.M. and S.E.R.; funding acquisition, S.E.R. All authors have read and agreed to the published version of the manuscript.
Funding
B.H.M. and S.E.R. were supported during completion of this work by a National Science Foundation AccelNet award (OISE 2020424) to S.E.R.
Data Availability Statement
No new data were created or analyzed in this study. Data sharing is not applicable to this article.
Acknowledgments
We thank Timothy Arkebauer (University of Nebraska–Lincoln), Chad Brassil (University of Nebraska–Lincoln), Clay Cressler (University of Nebraska–Lincoln), and Sean McMahon (Smithsonian Environmental Research Center) for critical feedback on an earlier draft and robust discussion of the topics addressed by this review, in particular our conceptual model.
Conflicts of Interest
The authors declare no conflict of interest.
Glossary
| adaptation, adaptive evolution | a heritable change in a genetically determined phenotypic trait that results in higher fitness in a particular environment A |
| Allee effect | a form of positive density dependence; a positive relationship between population fitness and population density B,C |
| colonization ability | the capacity to arrive at a novel site via the dispersal of propagules D,E |
| conspecific negative density-dependence | decrease in individual-level components of fitness (i.e., growth, survival, reproduction) with increasing conspecific population densities, often due to host-specific natural enemies (e.g., pathogens, herbivores) and intraspecific competition for shared resources F,G. |
| dispersal limitation | factor(s) that impede a species from reaching suitable sites for recruitment H,I |
| ecological niche | the set of abiotic and biotic environmental conditions, including resources, mutualists, and antagonists, allowing a species or population to maintain positive population growth J,K |
| ecological strategy | attributes (e.g., phenotypic traits) from molecular to whole-organism scales that describe how individuals acquire and allocate resources to growth, survival, and reproduction, which may vary inter- and intraspecifically L,M |
| fundamental niche | a largely theoretical construct defining the complete set of abiotic environmental conditions under which a species can maintain positive population growth in the absence of biotic interactions K. |
| geographic range | the boundary defining the geographic area encompassing the complete set of locations where a species occurs N,O |
| habitat filtering | the abiotic and/or biotic factors preventing the establishment and persistence of individuals of a particular species at a particular site or in a particular habitat 16 P |
| habitat range | the local (i.e., small spatial scale) spatial distribution of populations of a species Q,R,S. |
| metapopulation and source-sink dynamics | a network of many discrete populations connected by dispersal, including high-quality habitat patches (sources) where population birth rates are greater than death rates, allowing for emigration to other patches, and low-quality habitat patches (sinks) where population death rates are greater than birth rates and therefore require immigration in order to be maintained T,U |
| phenotype-environment matching | maximizing fitness by expressing the optimal phenotype for the local environment V,W. |
| phenotypic integration | the coordination of the expression of functionally related traits within an individual that constrains trait variation to values that maximize fitness, given the values of all other traits 24 X. |
| phenotypic plasticity | the ability of a single genotype to express different phenotypes in different environments Y,Z |
| range shift | movement of a population into new, potentially more suitable, areas at the habitat or geographic range scale N,AA |
| realized niche | the set of abiotic environmental conditions under which a species can maintain positive population growth, after accounting for the effects of interspecific interactions (i.e., antagonists and mutualists) K,U |
| taxon cycle | phases of a species’ geographic range expansion and contraction that arise from the evolution of ecological strategies and phenotypes that favor expansion, followed by ecologically and evolutionarily driven shifts to a phenotype that promotes range contraction BB,CC |
| vital rates | the rates of growth, survival, and reproduction of individuals DD |
| Glossary References: A [208]; B [352]; C [300]; D [58]; E [59]; F [285]; G [286]; H [353]; I [65]; J [23]; K [22]; L [94]; M [354]; N [27]; O [28]; P [200]; Q [24]; R [26]; S [25]; T [48]; U [51]; V [60]; W [61]; X [308]; Y [43]; Z [44]; AA [9]; BB [91]; CC [93]; DD [355]. | |
References
- Parmesan, C.; Yohe, G. A globally coherent fingerprint of climate change impacts across natural systems. Nature 2003, 421, 37–42. [Google Scholar] [CrossRef] [PubMed]
- Weiskopf, S.R.; Rubenstein, M.A.; Crozier, L.G.; Gaichas, S.; Griffis, R.; Halofsky, J.E.; Hyde, K.J.W.; Morelli, T.L.; Morisette, J.T.; Muñoz, R.C.; et al. Climate change effects on biodiversity, ecosystems, ecosystem services, and natural resource management in the United States. Sci. Total Environ. 2020, 733, 137782. [Google Scholar] [CrossRef] [PubMed]
- Wiens, J.J. Climate-Related Local Extinctions Are Already Widespread among Plant and Animal Species. PLoS Biol. 2016, 14, e2001104. [Google Scholar] [CrossRef] [Green Version]
- Morueta-Holme, N.; Enquist, B.J.; McGill, B.J.; Boyle, B.; Jørgensen, P.M.; Ott, J.E.; Peet, R.K.; Šímová, I.; Sloat, L.L.; Thiers, B.; et al. Habitat area and climate stability determine geographical variation in plant species range sizes. Ecol. Lett. 2013, 16, 1446–1454. [Google Scholar] [CrossRef]
- Diffenbaugh, N.S.; Field, C.B. Changes in Ecologically Critical Terrestrial Climate Conditions. Science 2013, 341, 486–492. [Google Scholar] [CrossRef] [Green Version]
- Gougherty, A.V.; Keller, S.R.; Fitzpatrick, M.C. Maladaptation, migration and extirpation fuel climate change risk in a forest tree species. Nat. Clim. Chang. 2021, 11, 166–171. [Google Scholar] [CrossRef]
- Williams, J.W.; Jackson, S.T. Novel climates, no-analog communities, and ecological surprises. Front. Ecol. Environ. 2007, 5, 475–482. [Google Scholar] [CrossRef]
- Jackson, S.T.; Overpeck, J.T. Responses of plant populations and communities to environmental changes of the late Quaternary. Paleobiology 2000, 26, 28. [Google Scholar] [CrossRef]
- Davis, M.B.; Shaw, R.G. Range Shifts and Adaptive Responses to Quaternary Climate Change. Science 2001, 292, 673–679. [Google Scholar] [CrossRef] [Green Version]
- Savolainen, O.; Pyhäjärvi, T.; Knürr, T. Gene Flow and Local Adaptation in Trees. Annu. Rev. Ecol. Evol. Syst. 2007, 38, 595–619. [Google Scholar] [CrossRef]
- McLachlan, J.S.; Clark, J.S.; Manos, P.S. Molecular indicators of tree migration capacity under rapid climate change. Ecology 2005, 86, 2088–2098. [Google Scholar] [CrossRef] [Green Version]
- Aitken, S.N.; Yeaman, S.; Holliday, J.A.; Wang, T.; Curtis-McLane, S. Adaptation, migration or extirpation: Climate change outcomes for tree populations: Climate change outcomes for tree populations. Evol. Appl. 2008, 1, 95–111. [Google Scholar] [CrossRef]
- Birks, H.J.B. Holocene Isochrone Maps and Patterns of Tree-Spreading in the British Isles. J. Biogeogr. 1989, 16, 503. [Google Scholar] [CrossRef]
- Clark, J.S.; Fastie, C.; Hurtt, G.; Jackson, S.T.; Johnson, C.; King, G.A.; Lewis, M.; Lynch, J.; Pacala, S.; Prentice, C.; et al. Reid’s Paradox of Rapid Plant Migration. BioScience 1998, 48, 13–24. [Google Scholar] [CrossRef] [Green Version]
- Gear, A.J.; Huntley, B. Rapid Changes in the Range Limits of Scots Pine 4000 Years Ago. Science 1991, 251, 544–547. [Google Scholar] [CrossRef] [PubMed]
- Davis, M.B. Lags in vegetation response to greenhouse warming. Clim. Chang. 1989, 15, 75–82. [Google Scholar] [CrossRef]
- Iverson, L.R.; Schwartz, M.W.; Prasad, A.M. How fast and far might tree species migrate in the eastern United States due to climate change?: Migration of tree species due to climate change. Glob. Ecol. Biogeogr. 2004, 13, 209–219. [Google Scholar] [CrossRef]
- Scheller, R.; Mladenoff, D. Simulated effects of climate change, fragmentation, and inter-specific competition on tree species migration in northern Wisconsin, USA. Clim. Res. 2008, 36, 191–202. [Google Scholar] [CrossRef] [Green Version]
- Sharma, S.; Andrus, R.; Bergeron, Y.; Bogdziewicz, M.; Bragg, D.C.; Brockway, D.; Cleavitt, N.L.; Courbaud, B.; Das, A.J.; Dietze, M.; et al. North American tree migration paced by climate in the West, lagging in the East. Proc. Natl. Acad. Sci. USA 2022, 119, e2116691118. [Google Scholar] [CrossRef]
- Pecl, G.T.; Araújo, M.B.; Bell, J.D.; Blanchard, J.; Bonebrake, T.C.; Chen, I.-C.; Clark, T.D.; Colwell, R.K.; Danielsen, F.; Evengård, B.; et al. Biodiversity redistribution under climate change: Impacts on ecosystems and human well-being. Science 2017, 355, eaai9214. [Google Scholar] [CrossRef]
- Peterson, A.T.; Soberón, J.; Pearson, R.G.; Anderson, R.P.; Martínez-Meyer, E.; Nakamura, M.; Araújo, M.B. Ecological Niches and Geographic Distributions; MPB-49; Princeton University Press: Princeton, NJ, USA, 2012. [Google Scholar]
- Hutchinson, G.E. Concluding remarks. Quant. Biol. 1957, 22, 415–427. [Google Scholar] [CrossRef]
- Chase, J.M.; Leibold, M.A. Ecological Niches: Linking Classical and Contemporary Approaches; University of Chicago Press: Chicago, IL, USA, 2003. [Google Scholar]
- Brown, J.H. On the Relationship between Abundance and Distribution of Species. Am. Nat. 1984, 124, 255–279. [Google Scholar] [CrossRef]
- Sexton, J.P.; Dickman, E.E. What can local and geographic population limits tell us about distributions? Am. J. Bot. 2016, 103, 129–139. [Google Scholar] [CrossRef] [PubMed] [Green Version]
- Gaston, K.J. Geographic range limits: Achieving synthesis. Proc. R. Soc. B Biol. Sci. 2009, 276, 1395–1406. [Google Scholar] [CrossRef] [PubMed] [Green Version]
- Brown, J.H.; Stevens, G.C.; Kaufman, D.M. The Geographic Range: Size, Shape, Boundaries, and Internal Structure. Annu. Rev. Ecol. Syst. 1996, 27, 597–623. [Google Scholar] [CrossRef] [Green Version]
- Gaston, K.J. Geographic range limits of species. Proc. R. Soc. B Biol. Sci. 2009, 276, 1391–1393. [Google Scholar] [CrossRef]
- Edelaar, P.; Jovani, R.; Gomez-Mestre, I. Should I Change or Should I Go? Phenotypic Plasticity and Matching Habitat Choice in the Adaptation to Environmental Heterogeneity. Am. Nat. 2017, 190, 506–520. [Google Scholar] [CrossRef]
- Paul, J.R.; Sheth, S.N.; Angert, A.L. Quantifying the Impact of Gene Flow on Phenotype-Environment Mismatch: A Demonstration with the Scarlet Monkeyflower Mimulus cardinalis. Am. Nat. 2011, 178, S62–S79. [Google Scholar] [CrossRef] [Green Version]
- Baldeck, C.A.; Harms, K.E.; Yavitt, J.B.; John, R.; Turner, B.L.; Valencia, R.; Navarrete, H.; Davies, S.J.; Chuyong, G.B.; Kenfack, D.; et al. Soil resources and topography shape local tree community structure in tropical forests. Proc. R. Soc. B Biol. Sci. 2013, 280, 20122532. [Google Scholar] [CrossRef]
- Baltzer, J.L.; Davies, S.J. Rainfall seasonality and pest pressure as determinants of tropical tree species’ distributions. Ecol. Evol. 2012, 2, 2682–2694. [Google Scholar] [CrossRef]
- Hamann, E.; Denney, D.; Day, S.; Lombardi, E.; Jameel, M.I.; MacTavish, R.; Anderson, J.T. Review: Plant eco-evolutionary responses to climate change: Emerging directions. Plant Sci. 2021, 304, 110737. [Google Scholar] [CrossRef]
- Moorcroft, P.R.; Pacala, S.W.; Lewis, M.A. Potential role of natural enemies during tree range expansions following climate change. J. Theor. Biol. 2006, 241, 601–616. [Google Scholar] [CrossRef]
- Canham, C.D.; Murphy, L. The demography of tree species response to climate: Seedling recruitment and survival. Ecosphere 2016, 7, e01424. [Google Scholar] [CrossRef]
- Higgins, S.I.; Clark, J.S.; Nathan, R.; Hovestadt, T.; Schurr, F.; Fragoso, J.M.V.; Aguiar, M.R.; Ribbens, E.; Lavorel, S. Forecasting plant migration rates: Managing uncertainty for risk assessment. J. Ecol. 2003, 91, 341–347. [Google Scholar] [CrossRef] [Green Version]
- Nathan, R.; Casagrandi, R. A simple mechanistic model of seed dispersal, predation and plant establishment: Janzen-Connell and beyond. J. Ecol. 2004, 92, 733–746. [Google Scholar] [CrossRef]
- Purves, D.W. The demography of range boundaries versus range cores in eastern US tree species. Proc. R. Soc. B Biol. Sci. 2009, 276, 1477–1484. [Google Scholar] [CrossRef] [Green Version]
- Corlett, R.T.; Westcott, D.A. Will plant movements keep up with climate change? Trends Ecol. Evol. 2013, 28, 482–488. [Google Scholar] [CrossRef]
- Merilä, J.; Hendry, A.P. Climate change, adaptation, and phenotypic plasticity: The problem and the evidence. Evol. Appl. 2014, 7, 1–14. [Google Scholar] [CrossRef] [PubMed]
- Jump, A.S.; Peñuelas, J. Running to stand still: Adaptation and the response of plants to rapid climate change. Ecol. Lett. 2005, 8, 1010–1020. [Google Scholar] [CrossRef]
- Padilla, D.K.; Adolph, S.C. Plastic inducible morphologies are not always adaptive: The importance of time delays in a stochastic environment. Evol. Ecol. 1996, 10, 105–117. [Google Scholar] [CrossRef]
- Schlichting, C.D. The Evolution of Phenotypic Plasticity in Plants. Annu. Rev. Ecol. Syst. 1986, 17, 28. [Google Scholar] [CrossRef]
- Whitman, D.; Agrawal, A. What is Phenotypic Plasticity and Why is it Important? In Phenotypic Plasticity of Insects; Whitman, D., Ananthakrishnan, T., Eds.; CRC Press: Boca Raton, FL, USA, 2009; ISBN 978-1-57808-423-4. [Google Scholar]
- Bradshaw, A.D. Evolutionary Significance of Phenotypic Plasticity in Plants. Adv. Genet. 1965, 13, 115–155. [Google Scholar] [CrossRef]
- Harrison, S.P.; Sanchez Goñi, M.F. Global patterns of vegetation response to millennial-scale variability and rapid climate change during the last glacial period. Quat. Sci. Rev. 2010, 29, 2957–2980. [Google Scholar] [CrossRef]
- Lalejini, A.; Ferguson, A.J.; Grant, N.A.; Ofria, C. Adaptive Phenotypic Plasticity Stabilizes Evolution in Fluctuating Environments. Front. Ecol. Evol. 2021, 9, 715381. [Google Scholar] [CrossRef]
- Hanski, I. Metapopulation dynamics. Nature 1998, 396, 41–49. [Google Scholar] [CrossRef]
- Hanski, I.; Mononen, T.; Ovaskainen, O. Eco-Evolutionary Metapopulation Dynamics and the Spatial Scale of Adaptation. Am. Nat. 2011, 177, 29–43. [Google Scholar] [CrossRef] [Green Version]
- Negrín Dastis, J.O.; Milne, R.; Guichard, F.; Derry, A.M. Phenotype–environment mismatch in metapopulations—Implications for the maintenance of maladaptation at the regional scale. Evol. Appl. 2019, 12, 1475–1486. [Google Scholar] [CrossRef]
- Pulliam, H.R. Sources, Sinks, and Population Regulation. Am. Nat. 1988, 132, 652–661. [Google Scholar] [CrossRef]
- Van Horne, B. Density as a Misleading Indicator of Habitat Quality. J. Wildl. Manag. 1983, 47, 893. [Google Scholar] [CrossRef]
- Abrams, M.D.; Copenheaver, C.A.; Black, B.A.; van de Gevel, S. Dendroecology and climatic impacts for a relict, old-growth, bog forest in the Ridge and Valley Province of central Pennsylvania, U.S.A. Can. J. Bot. 2001, 79, 58–69. [Google Scholar]
- Chesson, P. Multispecies competition in variable environments. Theor. Popul. Biol. 1994, 45, 227–276. [Google Scholar] [CrossRef]
- Hampe, A.; Jump, A.S. Climate Relicts: Past, Present, Future. Annu. Rev. Ecol. Evol. Syst. 2011, 42, 313–333. [Google Scholar] [CrossRef] [Green Version]
- Kaul, R.B.; Kantak, G.E.; Churchill, S.P. The Niobrara River Valley, a Postglacial Migration Corridor and Refugium of Forest Plants and Animals in the Grasslands of Central North America. Bot. Rev. 1988, 54, 44–81. [Google Scholar] [CrossRef]
- Schupp, E.W.; Howe, H.F.; Augspurger, C.K.; Levey, D.J. Arrival and Survival in Tropical Treefall Gaps. Ecology 1989, 70, 562–564. [Google Scholar] [CrossRef]
- Levins, R.; Culver, D. Regional Coexistence of Species and Competition between Rare Species. Proc. Natl. Acad. Sci. USA 1971, 68, 1246–1248. [Google Scholar] [CrossRef] [Green Version]
- Yu, D.W.; Wilson, H.B. The Competition-Colonization Trade-off Is Dead; Long Live the Competition-Colonization Trade-off. Am. Nat. 2001, 158, 49–63. [Google Scholar] [CrossRef]
- DeWitt, T.J.; Sih, A.; Wilson, D.S. Costs and limits of phenotypic plasticity. Trends Ecol. Evol. 1998, 13, 77–81. [Google Scholar] [CrossRef]
- Levins, R. Evolution in Changing Environments: Some Theoretical Explorations; Monographs in Population Biology; Princeton University Press: Princeton, NJ, USA, 1968. [Google Scholar]
- Grinnell, J. The Niche-Relationships of the California Thrasher. Auk 1917, 34, 427–433. [Google Scholar] [CrossRef]
- Elton, C.S. Animal Ecology; University of Chicago Press: Chicago, IL, USA, 1927. [Google Scholar]
- Ackerly, D.D. Community Assembly, Niche Conservatism, and Adaptive Evolution in Changing Environments. Int. J. Plant Sci. 2003, 164, S165–S184. [Google Scholar] [CrossRef]
- Pulliam, H.R. On the relationship between niche and distribution. Ecol. Lett. 2000, 3, 349–361. [Google Scholar] [CrossRef]
- Gaston, K.J. How Large Is a Species’ Geographic Range? Oikos 1991, 61, 434. [Google Scholar] [CrossRef]
- Gaston, K.J. Species-range size distributions: Products of speciation, extinction and transformation. Philos. Trans. R. Soc. Lond. B Biol. Sci. 1998, 353, 219–230. [Google Scholar] [CrossRef] [Green Version]
- Angert, A.L. The niche, limits to species’ distributions, and spatiotemporal variation in demography across the elevation ranges of two monkeyflowers. Proc. Natl. Acad. Sci. USA 2009, 106, 19693–19698. [Google Scholar] [CrossRef] [Green Version]
- Holt, R.D.; Keitt, T.H.; Lewis, M.A.; Maurer, B.A.; Taper, M.L. Theoretical models of species’ borders: Single species approaches. Oikos 2005, 108, 18–27. [Google Scholar] [CrossRef]
- Watkinson, A.R. On the Abundance of Plants Along an Environmental Gradient. J. Ecol. 1985, 73, 569. [Google Scholar] [CrossRef]
- Holt, R.D. On the evolutionary ecology of species’ ranges. Evol. Ecol. Res. 2003, 5, 159–178. [Google Scholar]
- Desprez, J.; Iannone, B.V.; Yang, P.; Oswalt, C.M.; Fei, S. Northward migration under a changing climate: A case study of blackgum (Nyssa sylvatica). Clim. Chang. 2014, 126, 151–162. [Google Scholar] [CrossRef]
- Fine, P.V.A.; Miller, Z.J.; Mesones, I.; Irazuzta, S.; Appel, H.M.; Stevens, M.H.H.; Sääksjärvi, I.; Schultz, J.C.; Coley, P.D. The growth-defense trade-off and habitat specialization by plants in Amazonian forests. Ecology 2006, 87, S150–S162. [Google Scholar] [CrossRef] [PubMed] [Green Version]
- Fortunel, C.; Paine, C.E.T.; Fine, P.V.A.; Mesones, I.; Goret, J.; Burban, B.; Cazal, J.; Baraloto, C. There’s no place like home: Seedling mortality contributes to the habitat specialisation of tree species across Amazonia. Ecol. Lett. 2016, 19, 1256–1266. [Google Scholar] [CrossRef] [PubMed]
- Case, T.J.; Taper, M.L. Interspecific Competition, Environmental Gradients, Gene Flow, and the Coevolution of Species’ Borders. Am. Nat. 2000, 155, 23. [Google Scholar] [CrossRef] [PubMed]
- Burrows, M.T.; Schoeman, D.S.; Richardson, A.J.; Molinos, J.G.; Hoffmann, A.; Buckley, L.B.; Moore, P.J.; Brown, C.J.; Bruno, J.F.; Duarte, C.M.; et al. Geographical limits to species-range shifts are suggested by climate velocity. Nature 2014, 507, 492–495. [Google Scholar] [CrossRef] [Green Version]
- Sheth, S.N.; Jiménez, I.; Angert, A.L. Identifying the paths leading to variation in geographical range size in western North American monkeyflowers. J. Biogeogr. 2014, 41, 2344–2356. [Google Scholar] [CrossRef]
- Saupe, E.E.; Myers, C.E.; Peterson, A.T.; Soberón, J.; Singarayer, J.; Valdes, P.; Qiao, H. Non-random latitudinal gradients in range size and niche breadth predicted by spatial patterns of climate. Glob. Ecol. Biogeogr. 2019, 28, 928–942. [Google Scholar] [CrossRef]
- Slatyer, R.A.; Hirst, M.; Sexton, J.P. Niche breadth predicts geographical range size: A general ecological pattern. Ecol. Lett. 2013, 16, 1104–1114. [Google Scholar] [CrossRef]
- Xu, W.; Svenning, J.-C.; Chen, G.; Chen, B.; Huang, J.; Ma, K. Plant geographical range size and climate stability in China: Growth form matters. Glob. Ecol. Biogeogr. 2018, 27, 506–517. [Google Scholar] [CrossRef]
- Seliger, B.J.; McGill, B.J.; Svenning, J.; Gill, J.L. Widespread underfilling of the potential ranges of North American trees. J. Biogeogr. 2021, 48, 359–371. [Google Scholar] [CrossRef]
- Shay, J.E.; Pennington, L.K.; Mandussi Montiel-Molina, J.A.; Toews, D.J.; Hendrickson, B.T.; Sexton, J.P. Rules of Plant Species Ranges: Applications for Conservation Strategies. Front. Ecol. Evol. 2021, 9, 700962. [Google Scholar] [CrossRef]
- Gaston, K.J. Species-range-size distributions: Patterns, mechanisms and implications. Trends Ecol. Evol. 1996, 11, 197–201. [Google Scholar] [CrossRef] [PubMed]
- Waldron, A. Null Models of Geographic Range Size Evolution Reaffirm Its Heritability. Am. Nat. 2007, 170, 221–231. [Google Scholar] [CrossRef]
- Emery, N.C.; Forrestel, E.J.; Jui, G.; Park, M.S.; Baldwin, B.G.; Ackerly, D.D. Niche evolution across spatial scales: Climate and habitat specialization in California Lasthenia (Asteraceae). Ecology 2012, 93, S151–S166. [Google Scholar] [CrossRef]
- Kirkpatrick, M.; Barton, N.H. Evolution of a Species’ Range. Am. Nat. 1997, 150, 1–23. [Google Scholar] [CrossRef] [Green Version]
- Leão, T.C.C.; Lughadha, E.N.; Reich, P.B. Evolutionary patterns in the geographic range size of Atlantic Forest plants. Ecography 2020, 43, 1510–1520. [Google Scholar] [CrossRef]
- Sheth, S.N.; Angert, A.L. The evolution of environmental tolerance and range size: A comparison of geographically restricted and widespread Mimulus. Evolution 2014, 68, 2917–2931. [Google Scholar] [CrossRef] [PubMed]
- Wiens, J.J. The niche, biogeography and species interactions. Philos. Trans. R. Soc. B Biol. Sci. 2011, 366, 2336–2350. [Google Scholar] [CrossRef] [Green Version]
- Webb, T.J.; Gaston, K.J. On the Heritability of Geographic Range Sizes. Am. Nat. 2003, 161, 553–566. [Google Scholar] [CrossRef] [PubMed] [Green Version]
- Economo, E.P.; Sarnat, E.M. Revisiting the Ants of Melanesia and the Taxon Cycle: Historical and Human-Mediated Invasions of a Tropical Archipelago. Am. Nat. 2012, 180, E1–E16. [Google Scholar] [CrossRef]
- Rull, V. Taxon Cycles in Neotropical Mangroves. Plants 2023, 12, 244. [Google Scholar] [CrossRef]
- Wilson, E.O. The Nature of the Taxon Cycle in the Melanesian Ant Fauna. Am. Nat. 1961, 95, 169–193. [Google Scholar] [CrossRef]
- Grime, J.P. Vegetation classification by reference to strategies. Nature 1974, 250, 26–31. [Google Scholar] [CrossRef]
- Loehle, C. Strategy Space and the Disturbance Spectrum: A Life-History Model for Tree Species Coexistence. Am. Nat. 2000, 156, 14–33. [Google Scholar] [CrossRef]
- Reich, P.B. The world-wide ‘fast-slow’ plant economics spectrum: A traits manifesto. J. Ecol. 2014, 102, 275–301. [Google Scholar] [CrossRef]
- Salguero-Gómez, R.; Jones, O.R.; Jongejans, E.; Blomberg, S.P.; Hodgson, D.J.; Mbeau-Ache, C.; Zuidema, P.A.; de Kroon, H.; Buckley, Y.M. Fast–slow continuum and reproductive strategies structure plant life-history variation worldwide. Proc. Natl. Acad. Sci. USA 2016, 113, 230–235. [Google Scholar] [CrossRef] [PubMed] [Green Version]
- Westoby, M. A leaf-height-seed (LHS) plant ecology strategy scheme. Plant Soil 1998, 199, 213–227. [Google Scholar] [CrossRef]
- Gianoli, E.; Palacio-López, K. Phenotypic integration may constrain phenotypic plasticity in plants. Oikos 2009, 118, 1924–1928. [Google Scholar] [CrossRef]
- Matesanz, S.; Blanco-Sánchez, M.; Ramos-Muñoz, M.; Cruz, M.; Benavides, R.; Escudero, A. Phenotypic integration does not constrain phenotypic plasticity: Differential plasticity of traits is associated to their integration across environments. New Phytol. 2021, 231, 2359–2370. [Google Scholar] [CrossRef]
- Russo, S.E.; McMahon, S.M.; Detto, M.; Ledder, G.; Wright, S.J.; Condit, R.S.; Davies, S.J.; Ashton, P.S.; Bunyavejchewin, S.; Chang-Yang, C.-H.; et al. The interspecific growth–mortality trade-off is not a general framework for tropical forest community structure. Nat. Ecol. Evol. 2021, 5, 174–183. [Google Scholar] [CrossRef]
- Russo, S.E.; Ledder, G.; Muller, E.B.; Nisbet, R.M. Dynamic Energy Budget models: Fertile ground for understanding resource allocation in plants in a changing world. Conserv. Physiol. 2022, 10, coac061. [Google Scholar] [CrossRef]
- Díaz, S.; Kattge, J.; Cornelissen, J.H.C.; Wright, I.J.; Lavorel, S.; Dray, S.; Reu, B.; Kleyer, M.; Wirth, C.; Colin Prentice, I.; et al. The global spectrum of plant form and function. Nature 2016, 529, 167–171. [Google Scholar] [CrossRef]
- Wright, I.J.; Reich, P.B.; Westoby, M.; Ackerly, D.D.; Baruch, Z.; Bongers, F.; Cavender-Bares, J.; Chapin, T.; Cornelissen, J.H.C.; Diemer, M.; et al. The worldwide leaf economics spectrum. Nature 2004, 428, 821–827. [Google Scholar] [CrossRef]
- Russo, S.E.; Davies, S.J.; King, D.A.; Tan, S. Soil-related performance variation and distributions of tree species in a Bornean rain forest. J. Ecol. 2005, 93, 879–889. [Google Scholar] [CrossRef] [Green Version]
- Greene, D.F.; Johnson, E.A. Estimating the Mean Annual Seed Production of Trees. Ecology 1994, 75, 642–647. [Google Scholar] [CrossRef] [Green Version]
- Henery, M.L.; Westoby, M. Seed mass and seed nutrient content as predictors of seed output variation between species. Oikos 2001, 92, 479–490. [Google Scholar] [CrossRef]
- Moles, A.T.; Westoby, M. Seedling survival and seed size: A synthesis of the literature. J. Ecol. 2004, 92, 372–383. [Google Scholar] [CrossRef]
- Shipley, B.; Dion, J. The Allometry of Seed Production in Herbaceous Angiosperms. Am. Nat. 1992, 139, 467–483. [Google Scholar] [CrossRef]
- Wenny, D.G. Advantages of seed dispersal: A re-evaluation of directed dispersal. Evol. Ecol. Res. 2001, 3, 24. [Google Scholar]
- Chapman, C.A.; Russo, S.E. Primate seed dispersal: Linking behavioral ecology with forest community structure. In Primates in Perspective; Oxford University Press: London, UK, 2006; pp. 510–525. [Google Scholar]
- Russo, S.E.; Portnoy, S.; Augspurger, C.K. Incorporating animal behavior into seed dispersal models: Implications for seed shadows. Ecology 2006, 87, 3160–3174. [Google Scholar] [CrossRef] [Green Version]
- Butler, D.W.; Green, R.J.; Lamb, D.; McDonald, W.J.F.; Forster, P.I. Biogeography of seed-dispersal syndromes, life-forms and seed sizes among woody rain-forest plants in Australia’s subtropics. J. Biogeogr. 2007, 34, 1736–1750. [Google Scholar] [CrossRef]
- Howe, H.F. Making dispersal syndromes and networks useful in tropical conservation and restoration. Glob. Ecol. Conserv. 2016, 6, 152–178. [Google Scholar] [CrossRef] [Green Version]
- Albert, C.H.; Thuiller, W.; Yoccoz, N.G.; Douzet, R.; Aubert, S.; Lavorel, S. A multi-trait approach reveals the structure and the relative importance of intra- vs. interspecific variability in plant traits: Intra- vs. interspecific variability in plant traits. Funct. Ecol. 2010, 24, 1192–1201. [Google Scholar] [CrossRef]
- Bin, Y.; Lin, G.; Russo, S.E.; Huang, Z.; Shen, Y.; Cao, H.; Lian, J.; Ye, W. Testing the competition-colonization trade-off and its correlations with functional trait variations among subtropical tree species. Sci. Rep. 2019, 9, 14942. [Google Scholar] [CrossRef] [Green Version]
- Muller-Landau, H.C.; Wright, S.J.; Calderón, O.; Hubbell, S.P.; Foster, R.B. Assessing recruitment limitation: Concepts, methods and case-studies from a tropical forest. In Proceedings of the Seed Dispersal and Frugivory: Ecology, Evolution and Conservation. Third International Symposium-Workshop on Frugivores and Seed Dispersal, São Pedro, Brazil, 6–11 August 2000; Levey, D.J., Silva, W.R., Galetti, M., Eds.; CABI: Wallingford, UK, 2002; pp. 35–53, ISBN 978-0-85199-525-0. [Google Scholar]
- Schupp, E.W.; Milleron, T.; Russo, S.E. Dissemination limitation and the origin and maintenance of species-rich tropical forests. In Proceedings of the Seed Dispersal and Frugivory: Ecology, Evolution and Conservation. Third International Symposium-Workshop on Frugivores and Seed Dispersal, São Pedro, Brazil, 6–11 August 2000; Levey, D.J., Silva, W.R., Galetti, M., Eds.; CABI Publishing: Wallingford, UK, 2002; pp. 19–33, ISBN 978-0-85199-525-0. [Google Scholar]
- Svenning, J.-C.; Normand, S.; Skov, F. Postglacial dispersal limitation of widespread forest plant species in nemoral Europe. Ecography 2008, 31, 316–326. [Google Scholar] [CrossRef]
- Brodie, J.F.; Lieberman, S.; Moehrenschlager, A.; Redford, K.H.; Rodríguez, J.P.; Schwartz, M.; Seddon, P.J.; Watson, J.E.M. Global policy for assisted colonization of species. Science 2021, 372, 456–458. [Google Scholar] [CrossRef] [PubMed]
- McLACHLAN, J.S.; Hellmann, J.J.; Schwartz, M.W. A Framework for Debate of Assisted Migration in an Era of Climate Change. Conserv. Biol. 2007, 21, 297–302. [Google Scholar] [CrossRef] [PubMed]
- Oldfather, M.F.; Van Den Elzen, C.L.; Heffernan, P.M.; Emery, N.C. Dispersal evolution in temporally variable environments: Implications for plant range dynamics. Am. J. Bot. 2021, 108, 1584–1594. [Google Scholar] [CrossRef]
- Clark, J.S. Why Trees Migrate So Fast: Confronting Theory with Dispersal Biology and the Paleorecord. Am. Nat. 1998, 152, 21. [Google Scholar] [CrossRef]
- Dick, C.W.; Bermingham, E.; Lemes, M.R.; Gribel, R. Extreme long-distance dispersal of the lowland tropical rainforest tree Ceiba pentandra L. (Malvaceae) in Africa and the Neotropics. Mol. Ecol. 2007, 16, 3039–3049. [Google Scholar] [CrossRef]
- Kremer, A.; Ronce, O.; Robledo-Arnuncio, J.J.; Guillaume, F.; Bohrer, G.; Nathan, R.; Bridle, J.R.; Gomulkiewicz, R.; Klein, E.K.; Ritland, K.; et al. Long-distance gene flow and adaptation of forest trees to rapid climate change. Ecol. Lett. 2012, 15, 378–392. [Google Scholar] [CrossRef] [PubMed] [Green Version]
- Soons, M.B.; Bullock, J.M. Non-random seed abscission, long-distance wind dispersal and plant migration rates. J. Ecol. 2008, 96, 581–590. [Google Scholar] [CrossRef]
- Cain, M.L.; Damman, H.; Muir, A. Seed Dispersal and the Holocene Migration of Woodland Herbs. Ecol. Monogr. 1998, 68, 325–347. [Google Scholar] [CrossRef]
- Howe, H.F.; Smallwood, J. Ecology of Seed Dispersal. Annu. Rev. Ecol. Syst. 1982, 13, 201–228. [Google Scholar] [CrossRef]
- Detto, M.; Levine, J.M.; Pacala, S.W. Maintenance of high diversity in mechanistic forest dynamics models of competition for light. Ecol. Monogr. 2022, 92, e1500. [Google Scholar] [CrossRef]
- Loehle, C. Tree life history strategies: The role of defenses. Can. J. For. Res. 1988, 18, 209–222. [Google Scholar] [CrossRef]
- Russo, S.E.; Brown, P.; Tan, S.; Davies, S.J. Interspecific demographic trade-offs and soil-related habitat associations of tree species along resource gradients: Demographic trade-offs on habitat gradients. J. Ecol. 2008, 96, 192–203. [Google Scholar] [CrossRef] [Green Version]
- Wright, S.J.; Kitajima, K.; Kraft, N.J.B.; Reich, P.B.; Wright, I.J.; Bunker, D.E.; Condit, R.; Dalling, J.W.; Davies, S.J.; Engelbrecht, B.M.J.; et al. Functional traits and the growth–mortality trade-off in tropical trees. Ecology 2010, 91, 3664–3674. [Google Scholar] [CrossRef] [PubMed]
- Coley, P.D.; Bryant, J.P.; Chapin, F.S. Resource Availability and Plant Antiherbivore Defense. Science 1985, 230, 895–899. [Google Scholar] [CrossRef] [Green Version]
- Herms, D.A.; Mattson, W.J. The Dilemma of Plants: To Grow or Defend. Q. Rev. Biol. 1992, 67, 283–335. [Google Scholar] [CrossRef] [Green Version]
- Huot, B.; Yao, J.; Montgomery, B.L.; He, S.Y. Growth–Defense Tradeoffs in Plants: A Balancing Act to Optimize Fitness. Mol. Plant 2014, 7, 1267–1287. [Google Scholar] [CrossRef] [Green Version]
- Kohyama, T. Size-Structured Tree Populations in Gap-Dynamic Forest--The Forest Architecture Hypothesis for the Stable Coexistence of Species. J. Ecol. 1993, 81, 131. [Google Scholar] [CrossRef]
- Rüger, N.; Comita, L.S.; Condit, R.; Purves, D.; Rosenbaum, B.; Visser, M.D.; Wright, S.J.; Wirth, C. Beyond the fast–slow continuum: Demographic dimensions structuring a tropical tree community. Ecol. Lett. 2018, 21, 1075–1084. [Google Scholar] [CrossRef] [Green Version]
- Moles, A.T.; Westoby, M. Seed size and plant strategy across the whole life cycle. Oikos 2006, 113, 91–105. [Google Scholar] [CrossRef]
- Calcagno, V.; Mouquet, N.; Jarne, P.; David, P. Coexistence in a metacommunity: The competition–colonization trade-off is not dead. Ecol. Lett. 2006, 9, 897–907. [Google Scholar] [CrossRef] [PubMed]
- Tilman, D. Competition and Biodiversity in Spatially Structured Habitats. Ecology 1994, 75, 2–16. [Google Scholar] [CrossRef]
- Hara, T. Effects of variation in individual growth on plant species coexistence. J. Veg. Sci. 1993, 4, 409–416. [Google Scholar] [CrossRef]
- D’Andrea, R.; O’Dwyer, J.P. Competition for space in a structured landscape: The effect of seed limitation on coexistence under a tolerance-fecundity trade-off. J. Ecol. 2021, 109, 1886–1897. [Google Scholar] [CrossRef]
- Lebrija-Trejos, E.; Reich, P.B.; Hernández, A.; Wright, S.J. Species with greater seed mass are more tolerant of conspecific neighbours: A key driver of early survival and future abundances in a tropical forest. Ecol. Lett. 2016, 19, 1071–1080. [Google Scholar] [CrossRef]
- Muller-Landau, H.C. The tolerance–fecundity trade-off and the maintenance of diversity in seed size. Proc. Natl. Acad. Sci. USA 2010, 107, 4242–4247. [Google Scholar] [CrossRef] [Green Version]
- Villellas, J.; García, M.B. The role of the tolerance-fecundity trade-off in maintaining intraspecific seed trait variation in a widespread dimorphic herb. Plant Biol. 2013, 15, 899–909. [Google Scholar] [CrossRef]
- Sexton, J.P.; Montiel, J.; Shay, J.E.; Stephens, M.R.; Slatyer, R.A. Evolution of Ecological Niche Breadth. Annu. Rev. Ecol. Evol. Syst. 2017, 48, 183–206. [Google Scholar] [CrossRef] [Green Version]
- Futuyma, D.J.; Moreno, G. The evolution of ecological specialization. Annu. Rev. Ecol. Syst. 1988, 19, 207–233. [Google Scholar] [CrossRef]
- Peay, K.G. The Mutualistic Niche: Mycorrhizal Symbiosis and Community Dynamics. Annu. Rev. Ecol. Evol. Syst. 2016, 47, 143–164. [Google Scholar] [CrossRef]
- Chave, J.; Coomes, D.; Jansen, S.; Lewis, S.L.; Swenson, N.G.; Zanne, A.E. Towards a worldwide wood economics spectrum. Ecol. Lett. 2009, 12, 351–366. [Google Scholar] [CrossRef]
- Kitajima, K.; Myers, J.A. Seedling ecophysiology: Strategies toward achievement of positive net carbon balance. In Seedling Ecology and Evolution; Leck, M.A., Parker, V.T., Simpson, R.L., Eds.; Cambridge University Press: Cambridge, UK, 2008; pp. 172–188. ISBN 978-0-511-81513-3. [Google Scholar]
- Pierce, S.; Brusa, G.; Vagge, I.; Cerabolini, B.E.L. Allocating CSR plant functional types: The use of leaf economics and size traits to classify woody and herbaceous vascular plants. Funct. Ecol. 2013, 27, 1002–1010. [Google Scholar] [CrossRef] [Green Version]
- Donohue, K. Setting the Stage: Phenotypic Plasticity as Habitat Selection. Int. J. Plant Sci. 2003, 164, S79–S92. [Google Scholar] [CrossRef] [Green Version]
- Lande, R. Evolution of phenotypic plasticity in colonizing species. Mol. Ecol. 2015, 24, 2038–2045. [Google Scholar] [CrossRef]
- Murren, C.J.; Auld, J.R.; Callahan, H.; Ghalambor, C.K.; Handelsman, C.A.; Heskel, M.A.; Kingsolver, J.G.; Maclean, H.J.; Masel, J.; Maughan, H.; et al. Constraints on the evolution of phenotypic plasticity: Limits and costs of phenotype and plasticity. Heredity 2015, 115, 293–301. [Google Scholar] [CrossRef] [PubMed] [Green Version]
- Zettlemoyer, M.A.; Peterson, M.L. Does Phenological Plasticity Help or Hinder Range Shifts Under Climate Change? Front. Ecol. Evol. 2021, 9, 689192. [Google Scholar] [CrossRef]
- Nathan, R.; Schurr, F.M.; Spiegel, O.; Steinitz, O.; Trakhtenbrot, A.; Tsoar, A. Mechanisms of long-distance seed dispersal. Trends Ecol. Evol. 2008, 23, 638–647. [Google Scholar] [CrossRef]
- Chen, S.; Poschlod, P.; Antonelli, A.; Liu, U.; Dickie, J.B. Trade-off between seed dispersal in space and time. Ecol. Lett. 2020, 23, 1635–1642. [Google Scholar] [CrossRef] [PubMed]
- Westoby, M.; Leishman, M.; Lord, J. Comparative ecology of seed size and dispersal. Philos. Trans. R. Soc. Lond. B Biol. Sci. 1996, 351, 1309–1318. [Google Scholar]
- Leishman, M.R.; Westoby, M.; Jurado, E. Correlates of Seed Size Variation: A Comparison Among Five Temperate Floras. J. Ecol. 1995, 83, 517. [Google Scholar] [CrossRef]
- Moles, A.T.; Ackerly, D.D.; Webb, C.O.; Tweddle, J.C.; Dickie, J.B.; Westoby, M. A Brief History of Seed Size. Science 2005, 307, 576–580. [Google Scholar] [CrossRef] [Green Version]
- Westoby, M.; Jurado, E.; Leishman, M. Comparative evolutionary ecology of seed size. Trends Ecol. Evol. 1992, 7, 368–372. [Google Scholar] [CrossRef] [PubMed]
- Leishman, M.R.; Wright, I.J.; Moles, A.T.; Westoby, M. The evolutionary ecology of seed size. In Seeds: The Ecology of Regeneration in Plant Communities; Fenner, M., Ed.; CABI Publishing: Wallingford, UK, 2000; pp. 31–57. ISBN 978-0-85199-947-0. [Google Scholar]
- Michaels, H.J.; Benner, B.; Hartgerink, A.P.; Lee, T.D.; Rice, S.; Willson, M.F.; Bertin, R.I. Seed size variation: Magnitude, distribution, and ecological correlates. Evol. Ecol. 1988, 2, 157–166. [Google Scholar] [CrossRef] [Green Version]
- Clark, J.S.; Macklin, E.; Wood, L. Stages and spatial scales of recruitment limitation in Southern Appalachian forests. Ecol. Monogr. 1998, 68, 213–235. [Google Scholar] [CrossRef]
- Clark, J.S.; Ji, Y. Fecundity and Dispersal in Plant Populations: Implications for Structure and Diversity. Am. Nat. 1995, 146, 72–111. [Google Scholar] [CrossRef]
- Leishman, M.R. Does the seed size/number trade-off model determine plant community structure? An assessment of the model mechanisms and their generality. Oikos 2001, 93, 294–302. [Google Scholar] [CrossRef]
- Venable, D.L. Size-Number Trade-Offs and the Variation of Seed Size with Plant Resource Status. Am. Nat. 1992, 140, 287–304. [Google Scholar] [CrossRef]
- Coomes, D.A.; Grubb, P.J. Colonization, tolerance, competition and seed-size variation within functional groups. Trends Ecol. Evol. 2003, 18, 283–291. [Google Scholar] [CrossRef]
- Jansen, P.A.; Bartholomeus, M.; Bongers, F.; Elzinga, J.A.; den Ouden, J.; van Wieren, S.E. The role of seed size in dispersal by a scatter-hoarding rodent. In Proceedings of the Seed Dispersal and Frugivory: Ecology, Evolution and Conservation. Third International Symposium-Workshop on Frugivores and Seed Dispersal, São Pedro, Brazil, 6–11 August 2000; Levey, D.J., Silva, W.R., Galetti, M., Eds.; CABI Publishing: Wallingford, UK, 2002; pp. 209–225, ISBN 978-0-85199-525-0. [Google Scholar]
- Dylewski, Ł.; Ortega, Y.K.; Bogdziewicz, M.; Pearson, D.E. Seed size predicts global effects of small mammal seed predation on plant recruitment. Ecol. Lett. 2020, 23, 1024–1033. [Google Scholar] [CrossRef]
- Moles, A.T.; Falster, D.S.; Leishman, M.R.; Westoby, M. Small-seeded species produce more seeds per square metre of canopy per year, but not per individual per lifetime: Seed mass and lifetime seed production. J. Ecol. 2004, 92, 384–396. [Google Scholar] [CrossRef]
- Calvo, R.N.; Horvitz, C.C. Pollinator Limitation, Cost of Reproduction, and Fitness in Plants: A Transition-Matrix Demographic Approach. Am. Nat. 1990, 136, 499–516. [Google Scholar] [CrossRef]
- Price, M.V.; Campbell, D.R.; Waser, N.M.; Brody, A.K. Bridging the generation gap in plants: Pollination, parental fecundity, and offspring demography. Ecology 2008, 89, 1596–1604. [Google Scholar] [CrossRef] [PubMed] [Green Version]
- Pardee, G.L.; Jensen, I.O.; Inouye, D.W.; Irwin, R.E. The individual and combined effects of snowmelt timing and frost exposure on the reproductive success of montane forbs. J. Ecol. 2019, 107, 1970–1981. [Google Scholar] [CrossRef]
- Schiffer, A.; Loy, X.; Morozumi, C.; Brosi, B.J. Differences in individual flowering time change pollen limitation and seed set in three montane wildflowers. Am. J. Bot. 2022, e16123. [Google Scholar] [CrossRef] [PubMed]
- Ghazoul, J. Pollen and seed dispersal among dispersed plants. Biol. Rev. 2005, 80, 413. [Google Scholar] [CrossRef]
- Clark, J.S.; Silman, M.; Kern, R.; Macklin, E.; Hillerislambersi, J. Seed dispersal near and far: Patterns across temperate and tropical forests. Ecology 1999, 80, 1475–1494. [Google Scholar] [CrossRef]
- Howe, H.F.; Miriti, M.N. When Seed Dispersal Matters. BioScience 2004, 54, 651. [Google Scholar] [CrossRef]
- Russo, S.E. Responses of dispersal agents to tree and fruit traits in Virola calophylla (Myristicaceae): Implications for selection. Oecologia 2003, 136, 80–87. [Google Scholar] [CrossRef]
- Holbrook, K.M.; Smith, T.B. Seed dispersal and movement patterns in two species of Ceratogymna hornbills in a West African tropical lowland forest. Oecologia 2000, 125, 249–257. [Google Scholar] [CrossRef]
- Trakhtenbrot, A.; Nathan, R.; Perry, G.; Richardson, D.M. The importance of long-distance dispersal in biodiversity conservation: LDD in conservation. Divers. Distrib. 2005, 11, 173–181. [Google Scholar] [CrossRef]
- Willis, C.G.; Baskin, C.C.; Baskin, J.M.; Auld, J.R.; Venable, D.L.; Cavender-Bares, J.; Donohue, K.; de Casas, R.R.; The NESCent Germination Working Group. The evolution of seed dormancy: Environmental cues, evolutionary hubs, and diversification of the seed plants. New Phytol. 2014, 203, 300–309. [Google Scholar] [CrossRef]
- Baskin, C.C.; Chesson, P.L.; Baskin, J.M. Annual Seed Dormancy Cycles in Two Desert Winter Annuals. J. Ecol. 1993, 81, 551. [Google Scholar] [CrossRef]
- Pake, C.E.; Venable, D.L. Seed Banks in Desert Annuals: Implications for Persistence and Coexistence in Variable Environments. Ecology 1996, 77, 1427–1435. [Google Scholar] [CrossRef]
- Dalling, J.W.; Brown, T.A. Long-Term Persistence of Pioneer Species in Tropical Rain Forest Soil Seed Banks. Am. Nat. 2009, 173, 531–535. [Google Scholar] [CrossRef] [PubMed] [Green Version]
- Zalamea, P.; Dalling, J.W.; Sarmiento, C.; Arnold, A.E.; Delevich, C.; Berhow, M.A.; Ndobegang, A.; Gripenberg, S.; Davis, A.S. Dormancy-defense syndromes and tradeoffs between physical and chemical defenses in seeds of pioneer species. Ecology 2018, 99, 1988–1998. [Google Scholar] [CrossRef] [Green Version]
- Walck, J.L.; Hidayati, S.N.; Dixon, K.W.; Thompson, K.; Poschlod, P. Climate change and plant regeneration from seed: Climate change and plant regeneration. Glob. Chang. Biol. 2011, 17, 2145–2161. [Google Scholar] [CrossRef]
- Jankowska-Blaszczuk, M.; Daws, M.I. Impact of red: Far red ratios on germination of temperate forest herbs in relation to shade tolerance, seed mass and persistence in the soil. Funct. Ecol. 2007, 21, 1055–1062. [Google Scholar] [CrossRef]
- Rees, M. Evolutionary ecology of seed dormancy and seed size. Philos. Trans. R. Soc. Lond. B Biol. Sci. 1996, 351, 1299–1308. [Google Scholar]
- Penfield, S. Seed dormancy and germination. Curr. Biol. 2017, 27, R874–R878. [Google Scholar] [CrossRef] [PubMed] [Green Version]
- Meier, E.S.; Lischke, H.; Schmatz, D.R.; Zimmermann, N.E. Climate, competition and connectivity affect future migration and ranges of European trees: Future migration and ranges of European trees. Glob. Ecol. Biogeogr. 2012, 21, 164–178. [Google Scholar] [CrossRef]
- Bonte, D.; Van Dyck, H.; Bullock, J.M.; Coulon, A.; Delgado, M.; Gibbs, M.; Lehouck, V.; Matthysen, E.; Mustin, K.; Saastamoinen, M.; et al. Costs of dispersal. Biol. Rev. 2012, 87, 290–312. [Google Scholar] [CrossRef]
- Thompson, K.; Hodgson, J.G.; Rich, T.C.G. Native and alien invasive plants: More of the same? Ecography 1995, 18, 390–402. [Google Scholar] [CrossRef]
- Hawkes, C.V. Are Invaders Moving Targets? The Generality and Persistence of Advantages in Size, Reproduction, and Enemy Release in Invasive Plant Species with Time since Introduction. Am. Nat. 2007, 170, 832–843. [Google Scholar] [CrossRef]
- Holthuijzen, A.M.A.; Sharik, T.L.; Fraser, J.D. Dispersal of eastern red cedar (Juniperus virginiana) into pastures: An overview. Can. J. Bot. 1987, 65, 1092–1095. [Google Scholar] [CrossRef]
- Grotkopp, E.; Rejmánek, M.; Rost, T.L. Toward a Causal Explanation of Plant Invasiveness: Seedling Growth and Life-History Strategies of 29 Pine (Pinus) Species. Am. Nat. 2002, 159, 396–419. [Google Scholar] [CrossRef] [PubMed]
- Divíšek, J.; Chytrý, M.; Beckage, B.; Gotelli, N.J.; Lososová, Z.; Pyšek, P.; Richardson, D.M.; Molofsky, J. Similarity of introduced plant species to native ones facilitates naturalization, but differences enhance invasion success. Nat. Commun. 2018, 9, 4631. [Google Scholar] [CrossRef] [PubMed] [Green Version]
- Diaz, S.; Cabido, M.; Casanoves, F. Plant functional traits and environmental filters at a regional scale. J. Veg. Sci. 1998, 9, 113–122. [Google Scholar] [CrossRef]
- Laliberté, E.; Zemunik, G.; Turner, B.L. Environmental filtering explains variation in plant diversity along resource gradients. Science 2014, 345, 1602–1605. [Google Scholar] [CrossRef]
- Maire, V.; Gross, N.; Börger, L.; Proulx, R.; Wirth, C.; da Silveira Pontes, L.; Soussana, J.-F.; Louault, F. Habitat filtering and niche differentiation jointly explain species relative abundance within grassland communities along fertility and disturbance gradients. New Phytol. 2012, 196, 497–509. [Google Scholar] [CrossRef] [PubMed]
- Sargent, R.D.; Ackerly, D.D. Plant–pollinator interactions and the assembly of plant communities. Trends Ecol. Evol. 2008, 23, 123–130. [Google Scholar] [CrossRef]
- Bazzaz, F.A. Habitat Selection in Plants. Am. Nat. 1991, 137, S116–S130. [Google Scholar] [CrossRef]
- Cornwell, W.K.; Schwilk, D.W.; Ackerly, D.D. A trait-based test for habitat filtering: Convex hull volume. Ecology 2006, 87, 1465–1471. [Google Scholar] [CrossRef] [PubMed]
- Kraft, N.J.B.; Valencia, R.; Ackerly, D.D. Functional Traits and Niche-Based Tree Community Assembly in an Amazonian Forest. Science 2008, 322, 580–582. [Google Scholar] [CrossRef] [PubMed] [Green Version]
- Kraft, N.J.B.; Adler, P.B.; Godoy, O.; James, E.C.; Fuller, S.; Levine, J.M. Community assembly, coexistence and the environmental filtering metaphor. Funct. Ecol. 2015, 29, 592–599. [Google Scholar] [CrossRef]
- Weiher, E.; Clarke, G.D.P.; Keddy, P.A. Community Assembly Rules, Morphological Dispersion, and the Coexistence of Plant Species. Oikos 1998, 81, 309. [Google Scholar] [CrossRef]
- Sexton, J.P.; McIntyre, P.J.; Angert, A.L.; Rice, K.J. Evolution and Ecology of Species Range Limits. Annu. Rev. Ecol. Evol. Syst. 2009, 40, 415–436. [Google Scholar] [CrossRef] [Green Version]
- Darwin, C. On the Origin of Species by Means of Natural Selection, or, the Preservation of Favoured Races in the Struggle for Life; J. Murray: London, UK, 1859. [Google Scholar]
- Morris, W.F.; Ehrlén, J.; Dahlgren, J.P.; Loomis, A.K.; Louthan, A.M. Biotic and anthropogenic forces rival climatic/abiotic factors in determining global plant population growth and fitness. Proc. Natl. Acad. Sci. USA 2020, 117, 1107–1112. [Google Scholar] [CrossRef] [Green Version]
- Funk, J.L.; Larson, J.E.; Ames, G.M.; Butterfield, B.J.; Cavender-Bares, J.; Firn, J.; Laughlin, D.C.; Sutton-Grier, A.E.; Williams, L.; Wright, J. Revisiting the Holy Grail: Using plant functional traits to understand ecological processes. Biol. Rev. 2017, 92, 1156–1173. [Google Scholar] [CrossRef]
- Lavorel, S.; Garnier, E. Predicting changes in community composition and ecosystem functioning from plant traits: Revisiting the Holy Grail: Plant response and effect groups. Funct. Ecol. 2002, 16, 545–556. [Google Scholar] [CrossRef]
- Baltzer, J.L.; Thomas, S.C. Leaf optical responses to light and soil nutrient availability in temperate deciduous trees. Am. J. Bot. 2005, 92, 214–223. [Google Scholar] [CrossRef]
- Libalah, M.B.; Droissart, V.; Sonké, B.; Hardy, O.J.; Drouet, T.; Pescador, D.S.; Kenfack, D.; Thomas, D.W.; Chuyong, G.B.; Couteron, P. Shift in functional traits along soil fertility gradient reflects non-random community assembly in a tropical African rainforest. Plant Ecol. Evol. 2017, 150, 265–278. [Google Scholar] [CrossRef] [Green Version]
- Russo, S.E.; Zhang, L.; Tan, S. Covariation between understorey light environments and soil resources in Bornean mixed dipterocarp rain forest. J. Trop. Ecol. 2012, 28, 33–44. [Google Scholar] [CrossRef] [Green Version]
- Brown, C.D.; Vellend, M. Non-climatic constraints on upper elevational plant range expansion under climate change. Proc. R. Soc. B Biol. Sci. 2014, 281, 20141779. [Google Scholar] [CrossRef] [Green Version]
- Graae, B.J.; Vandvik, V.; Armbruster, W.S.; Eiserhardt, W.L.; Svenning, J.-C.; Hylander, K.; Ehrlén, J.; Speed, J.D.M.; Klanderud, K.; Bråthen, K.A.; et al. Stay or go—How topographic complexity influences alpine plant population and community responses to climate change. Perspect. Plant Ecol. Evol. Syst. 2018, 30, 41–50. [Google Scholar] [CrossRef] [Green Version]
- Solarik, K.A.; Messier, C.; Ouimet, R.; Bergeron, Y.; Gravel, D. Local adaptation of trees at the range margins impacts range shifts in the face of climate change. Glob. Ecol. Biogeogr. 2018, 27, 1507–1519. [Google Scholar] [CrossRef]
- Clark, D.B.; Palmer, M.W.; Clark, D.A. Edaphic factors and the landscape-scale distributions of tropical rain forest trees. Ecology 1999, 80, 2662–2675. [Google Scholar] [CrossRef]
- Thomson, D.M.; Baythavong, B.S.; Rice, K.J. Invasions and the Evolution of Range Limits. In Serpentine: The Evolution and Ecology of a Model System; University of California Press: Berkeley, CA, USA, 2011; Chapter 9; p. 20. [Google Scholar]
- Harrison, S.; Safford, H.D.; Grace, J.B.; Viers, J.H.; Davies, K.F. Regional and local species richness in an insular environment: Serpentine plants in California. Ecol. Monogr. 2006, 76, 41–56. [Google Scholar] [CrossRef] [Green Version]
- Davies, S.J.; Tan, S.; LaFrankie, J.V.; Potts, M.D. Soil-Related Floristic Variation in a Hyperdiverse Dipterocarp Forest. In Pollination Ecology and the Rain Forest; Roubik, D.W., Sakai, S., Hamid Karim, A.A., Eds.; Ecological Studies; Springer: New York, NY, USA, 2005; Volume 174, pp. 22–34. ISBN 978-0-387-21309-5. [Google Scholar]
- Zuleta, D.; Russo, S.E.; Barona, A.; Barreto-Silva, J.S.; Cardenas, D.; Castaño, N.; Davies, S.J.; Detto, M.; Sua, S.; Turner, B.L.; et al. Importance of topography for tree species habitat distributions in a terra firme forest in the Colombian Amazon. Plant Soil 2020, 450, 133–149. [Google Scholar] [CrossRef]
- Harms, K.E.; Condit, R.; Hubbell, S.P.; Foster, R.B. Habitat associations of trees and shrubs in a 50-ha neotropical forest plot: Habitat associations of trees and shrubs. J. Ecol. 2001, 89, 947–959. [Google Scholar] [CrossRef]
- Whitman, M.; Beaman, R.S.; Repin, R.; Kitayama, K.; Aiba, S.; Russo, S.E. Edaphic specialization and vegetation zones define elevational range-sizes for Mt Kinabalu regional flora. Ecography 2021, 44, 1698–1709. [Google Scholar] [CrossRef]
- Kenfack, D.; Chuyong, G.B.; Condit, R.; Russo, S.E.; Thomas, D.W. Demographic variation and habitat specialization of tree species in a diverse tropical forest of Cameroon. For. Ecosyst. 2014, 1, 22. [Google Scholar] [CrossRef] [Green Version]
- Foster, A.C.; Martin, P.H.; Redmond, M.D. Soil moisture strongly limits Douglas-fir seedling establishment near its upper elevational limit in the southern Rocky Mountains. Can. J. For. Res. 2020, 50, 837–842. [Google Scholar] [CrossRef]
- Moyes, A.B.; Castanha, C.; Germino, M.J.; Kueppers, L.M. Warming and the dependence of limber pine (Pinus flexilis) establishment on summer soil moisture within and above its current elevation range. Oecologia 2013, 171, 271–282. [Google Scholar] [CrossRef] [PubMed]
- Cramer, M.D.; Hedding, D.W.; Greve, M.; Midgley, G.F.; Ripley, B.S. Plant specialisation may limit climate-induced vegetation change to within topographic and edaphic niches on a sub-Antarctic island. Funct. Ecol. 2022, 36, 2636–2648. [Google Scholar] [CrossRef]
- Opedal, Ø.H.; Armbruster, W.S.; Graae, B.J. Linking small-scale topography with microclimate, plant species diversity and intra-specific trait variation in an alpine landscape. Plant Ecol. Divers. 2015, 8, 305–315. [Google Scholar] [CrossRef] [Green Version]
- Méndez-Toribio, M.; Meave, J.A.; Zermeño-Hernández, I.; Ibarra-Manríquez, G. Effects of slope aspect and topographic position on environmental variables, disturbance regime and tree community attributes in a seasonal tropical dry forest. J. Veg. Sci. 2016, 27, 1094–1103. [Google Scholar] [CrossRef]
- Muscarella, R.; Kolyaie, S.; Morton, D.C.; Zimmerman, J.K.; Uriarte, M. Effects of topography on tropical forest structure depend on climate context. J. Ecol. 2020, 108, 145–159. [Google Scholar] [CrossRef]
- Homeier, J.; Breckle, S.-W.; Günter, S.; Rollenbeck, R.T.; Leuschner, C. Tree Diversity, Forest Structure and Productivity along Altitudinal and Topographical Gradients in a Species-Rich Ecuadorian Montane Rain Forest: Ecuadorian Montane Forest Diversity and Structure. Biotropica 2010, 42, 140–148. [Google Scholar] [CrossRef]
- Pierick, K.; Leuschner, C.; Homeier, J. Topography as a factor driving small-scale variation in tree fine root traits and root functional diversity in a species-rich tropical montane forest. New Phytol. 2021, 230, 129–138. [Google Scholar] [CrossRef]
- Parmesan, C.; Hanley, M.E. Plants and climate change: Complexities and surprises. Ann. Bot. 2015, 116, 849–864. [Google Scholar] [CrossRef]
- Dobrowski, S.Z. A climatic basis for microrefugia: The influence of terrain on climate. Glob. Chang. Biol. 2011, 17, 1022–1035. [Google Scholar] [CrossRef]
- Bennett, K.D.; Tzedakis, P.C.; Willis, K.J. Quaternary Refugia of North European Trees. J. Biogeogr. 1991, 18, 103. [Google Scholar] [CrossRef]
- Vellend, M.; Béhé, M.; Carteron, A.; Crofts, A.L.; Danneyrolles, V.; Gamhewa, H.T.; Ni, M.; Rinas, C.L.; Watts, D.A. Plant Responses to Climate Change and an Elevational Gradient in Mont Mégantic National Park, Québec, Canada. Northeast. Nat. 2021, 28, 4–28. [Google Scholar] [CrossRef]
- Duque, A.; Stevenson, P.R.; Feeley, K.J. Thermophilization of adult and juvenile tree communities in the northern tropical Andes. Proc. Natl. Acad. Sci. USA 2015, 112, 10744–10749. [Google Scholar] [CrossRef] [Green Version]
- Feeley, K.J.; Silman, M.R.; Bush, M.B.; Farfan, W.; Cabrera, K.G.; Malhi, Y.; Meir, P.; Revilla, N.S.; Quisiyupanqui, M.N.R.; Saatchi, S. Upslope migration of Andean trees: Andean trees migrate upslope. J. Biogeogr. 2011, 38, 783–791. [Google Scholar] [CrossRef]
- Morin, X.; Chuine, I. Niche breadth, competitive strength and range size of tree species: A trade-off based framework to understand species distribution: Species range patterns and processes. Ecol. Lett. 2006, 9, 185–195. [Google Scholar] [CrossRef]
- Ibáñez, I.; Clark, J.S.; LaDeau, S.; Lambers, J.H.R. Exploiting temporal variability to understand tree recruitment response to climate change. Ecol. Monogr. 2007, 77, 163–177. [Google Scholar] [CrossRef]
- Anderson-Teixeira, K.J.; Miller, A.D.; Mohan, J.E.; Hudiburg, T.W.; Duval, B.D.; DeLucia, E.H. Altered dynamics of forest recovery under a changing climate. Glob. Chang. Biol. 2013, 19, 2001–2021. [Google Scholar] [CrossRef]
- De Frenne, P.; Rodriguez-Sanchez, F.; Coomes, D.A.; Baeten, L.; Verstraeten, G.; Vellend, M.; Bernhardt-Romermann, M.; Brown, C.D.; Brunet, J.; Cornelis, J.; et al. Microclimate moderates plant responses to macroclimate warming. Proc. Natl. Acad. Sci. USA 2013, 110, 18561–18565. [Google Scholar] [CrossRef] [Green Version]
- Scherrer, D.; Körner, C. Infra-red thermometry of alpine landscapes challenges climatic warming projections. Glob. Chang. Biol. 2010, 16, 2602–2613. [Google Scholar] [CrossRef]
- Willi, Y.; Van Buskirk, J. A review on trade-offs at the warm and cold ends of geographical distributions. Philos. Trans. R. Soc. B Biol. Sci. 2022, 377, 20210022. [Google Scholar] [CrossRef]
- Bin, Y.; Li, Y.; Russo, S.E.; Cao, H.; Ni, Y.; Ye, W.; Lian, J. Leaf trait expression varies with tree size and ecological strategy in a subtropical forest. Funct. Ecol. 2022, 36, 1010–1022. [Google Scholar] [CrossRef]
- Valladares, F.; Matesanz, S.; Guilhaumon, F.; Araújo, M.B.; Balaguer, L.; Benito-Garzón, M.; Cornwell, W.; Gianoli, E.; Kleunen, M.; Naya, D.E.; et al. The effects of phenotypic plasticity and local adaptation on forecasts of species range shifts under climate change. Ecol. Lett. 2014, 17, 1351–1364. [Google Scholar] [CrossRef] [Green Version]
- Loehle, C. Height growth rate tradeoffs determine northern and southern range limits for trees. J. Biogeogr. 1998, 25, 735–742. [Google Scholar] [CrossRef]
- Doak, D.F.; Morris, W.F. Demographic compensation and tipping points in climate-induced range shifts. Nature 2010, 467, 959–962. [Google Scholar] [CrossRef] [PubMed]
- Taccoen, A.; Piedallu, C.; Seynave, I.; Gégout-Petit, A.; Gégout, J.-C. Climate change-induced background tree mortality is exacerbated towards the warm limits of the species ranges. Ann. For. Sci. 2022, 79, 23. [Google Scholar] [CrossRef]
- Kawecki, T.J. Adaptation to Marginal Habitats. Annu. Rev. Ecol. Evol. Syst. 2008, 39, 321–342. [Google Scholar] [CrossRef] [Green Version]
- Bogdziewicz, M.; Szymkowiak, J.; Fernández-Martínez, M.; Peñuelas, J.; Espelta, J.M. The effects of local climate on the correlation between weather and seed production differ in two species with contrasting masting habit. Agric. For. Meteorol. 2019, 268, 109–115. [Google Scholar] [CrossRef]
- Kelly, D.; Geldenhuis, A.; James, A.; Penelope Holland, E.; Plank, M.J.; Brockie, R.E.; Cowan, P.E.; Harper, G.A.; Lee, W.G.; Maitland, M.J.; et al. Of mast and mean: Differential-temperature cue makes mast seeding insensitive to climate change. Ecol. Lett. 2013, 16, 90–98. [Google Scholar] [CrossRef]
- Koenig, W.D.; Knops, J.M.H. Patterns of Annual Seed Production by Northern Hemisphere Trees: A Global Perspective. Am. Nat. 2000, 155, 59–69. [Google Scholar] [CrossRef]
- Villellas, J.; Ehrlén, J.; Olesen, J.M.; Braza, R.; García, M.B. Plant performance in central and northern peripheral populations of the widespread Plantago coronopus. Ecography 2013, 36, 136–145. [Google Scholar] [CrossRef] [Green Version]
- Kaarlejärvi, E.; Olofsson, J. Concurrent biotic interactions influence plant performance at their altitudinal distribution margins. Oikos 2014, 123, 943–952. [Google Scholar] [CrossRef]
- Michalet, R.; Brooker, R.W.; Cavieres, L.A.; Kikvidze, Z.; Lortie, C.J.; Pugnaire, F.I.; Valiente-Banuet, A.; Callaway, R.M. Do biotic interactions shape both sides of the humped-back model of species richness in plant communities? Ecol. Lett. 2006, 9, 767–773. [Google Scholar] [CrossRef]
- Toll, K. An evolutionary framework for understanding habitat partitioning in plants. Am. J. Bot. 2023, 110, e16119. [Google Scholar] [CrossRef] [PubMed]
- Afkhami, M.E.; McIntyre, P.J.; Strauss, S.Y. Mutualist-mediated effects on species’ range limits across large geographic scales. Ecol. Lett. 2014, 17, 1265–1273. [Google Scholar] [CrossRef] [PubMed]
- Van der Putten, W.H. Climate Change, Aboveground-Belowground Interactions, and Species’ Range Shifts. Annu. Rev. Ecol. Evol. Syst. 2012, 43, 365–383. [Google Scholar] [CrossRef]
- Louthan, A.M.; Doak, D.F.; Angert, A.L. Where and When do Species Interactions Set Range Limits? Trends Ecol. Evol. 2015, 30, 780–792. [Google Scholar] [CrossRef]
- HilleRisLambers, J.; Harsch, M.A.; Ettinger, A.K.; Ford, K.R.; Theobald, E.J. How will biotic interactions influence climate change-induced range shifts?: Biotic interactions and range shifts. Ann. N. Y. Acad. Sci. 2013, 1297, 112–125. [Google Scholar] [CrossRef]
- Lankau, R.A.; Keymer, D.P. Ectomycorrhizal fungal richness declines towards the host species’ range edge. Mol. Ecol. 2016, 25, 3224–3241. [Google Scholar] [CrossRef]
- Visser, M.E.; Gienapp, P. Evolutionary and demographic consequences of phenological mismatches. Nat. Ecol. Evol. 2019, 3, 879–885. [Google Scholar] [CrossRef]
- Kharouba, H.M.; Wolkovich, E.M. Disconnects between ecological theory and data in phenological mismatch research. Nat. Clim. Chang. 2020, 10, 406–415. [Google Scholar] [CrossRef]
- Miller-Struttmann, N.E.; Geib, J.C.; Franklin, J.D.; Kevan, P.G.; Holdo, R.M.; Ebert-May, D.; Lynn, A.M.; Kettenbach, J.A.; Hedrick, E.; Galen, C. Functional mismatch in a bumble bee pollination mutualism under climate change. Science 2015, 349, 1541–1544. [Google Scholar] [CrossRef] [PubMed] [Green Version]
- Traveset, A.; Richardson, D.M. Mutualistic Interactions and Biological Invasions. Annu. Rev. Ecol. Evol. Syst. 2014, 45, 89–113. [Google Scholar] [CrossRef] [Green Version]
- Van Nuland, M.E.; Peay, K.G. Symbiotic niche mapping reveals functional specialization by two ectomycorrhizal fungi that expands the host plant niche. Fungal Ecol. 2020, 46, 100960. [Google Scholar] [CrossRef]
- Van Grunsven, R.H.A.; Van Der Putten, W.H.; Bezemer, T.M.; Tamis, W.L.M.; Berendse, F.; Veenendaal, E.M. Reduced plant-soil feedback of plant species expanding their range as compared to natives. J. Ecol. 2007, 95, 1050–1057. [Google Scholar] [CrossRef]
- Van GRUNSVEN, R.H.A.; Van Der PUTTEN, W.H.; Martijn Bezemer, T.; Berendse, F.; Veenendaal, E.M. Plant–soil interactions in the expansion and native range of a poleward shifting plant species: Plant–soil feedback in a poleward shifting plant. Glob. Chang. Biol. 2010, 16, 380–385. [Google Scholar] [CrossRef]
- Novoplansky, A. Picking battles wisely: Plant behaviour under competition. Plant Cell Environ. 2009, 32, 726–741. [Google Scholar] [CrossRef] [PubMed]
- Tilman, D. On the Meaning of Competition and the Mechanisms of Competitive Superiority. Funct. Ecol. 1987, 1, 304. [Google Scholar] [CrossRef]
- Case, T.J.; Holt, R.D.; McPeek, M.A.; Keitt, T.H. The community context of species’ borders: Ecological and evolutionary perspectives. Oikos 2005, 108, 28–46. [Google Scholar] [CrossRef]
- Hargreaves, A.L.; Samis, K.E.; Eckert, C.G. Are Species’ Range Limits Simply Niche Limits Writ Large? A Review of Transplant Experiments beyond the Range. Am. Nat. 2014, 183, 157–173. [Google Scholar] [CrossRef] [Green Version]
- Gaston, K.J. The Structure and Dynamics of Geographic Ranges; Oxford University Press: Oxford, UK, 2003. [Google Scholar]
- Booth, M.G.; Hoeksema, J.D. Mycorrhizal networks counteract competitive effects of canopy trees on seedling survival. Ecology 2010, 91, 2294–2302. [Google Scholar] [CrossRef] [PubMed]
- Eckhart, V.M.; Geber, M.A.; Morris, W.F.; Fabio, E.S.; Tiffin, P.; Moeller, D.A. The Geography of Demography: Long-Term Demographic Studies and Species Distribution Models Reveal a Species Border Limited by Adaptation. Am. Nat. 2011, 178, S26–S43. [Google Scholar] [CrossRef] [PubMed] [Green Version]
- Kirkpatrick, B.L.; Bazzaz, F.A. Influence of Certain Fungi on Seed Germination and Seedling Survival of Four Colonizing Annuals. J. Appl. Ecol. 1979, 16, 515. [Google Scholar] [CrossRef]
- Louda, S.M. Distribution Ecology: Variation in Plant Recruitment over a Gradient in Relation to Insect Seed Predation. Ecol. Monogr. 1982, 52, 25–41. [Google Scholar] [CrossRef] [Green Version]
- Janzen, D.H. Seed Predation by Animals. Annu. Rev. Ecol. Syst. 1971, 2, 465–492. [Google Scholar] [CrossRef]
- Russo, S.E. Linking seed fate to natural dispersal patterns: Factors affecting predation and scatter-hoarding of Virola calophylla seeds in Peru. J. Trop. Ecol. 2005, 21, 243–253. [Google Scholar] [CrossRef] [Green Version]
- Russo, S.E.; Augspurger, C.K. Aggregated seed dispersal by spider monkeys limits recruitment to clumped patterns in Virola calophylla: Seed dispersal and plant recruitment. Ecol. Lett. 2004, 7, 1058–1067. [Google Scholar] [CrossRef] [Green Version]
- Lloyd, M. Mean crowding. J. Anim. Ecol. 1967, 36, 1–30. [Google Scholar] [CrossRef]
- Pyke, G.H.; Pulliam, H.R.; Charnov, E.L. Optimal Foraging: A Selective Review of Theory and Tests. Q. Rev. Biol. 1977, 52, 137–154. [Google Scholar] [CrossRef] [Green Version]
- Connell, J.H. On the role of natural enemies in preventing competitive excusion in some marine animals and in rain forest trees. In Dynamics of Populations; Advanced Study Institute on Dynamics of Numbers in Populations: Wageningen, The Netherlands, 1971; pp. 298–312. [Google Scholar]
- Janzen, D.H. Herbivores and the Number of Tree Species in Tropical Forests. Am. Nat. 1970, 104, 501–528. [Google Scholar] [CrossRef]
- Augspurger, C.K. Light Requirements of Neotropical Tree Seedlings: A Comparative Study of Growth and Survival. J. Ecol. 1984, 72, 777. [Google Scholar] [CrossRef]
- Condit, R.; Hubbell, S.P.; Foster, R.B. Density Dependence in Two Understory Tree Species in a Neotropical Forest. Ecology 1994, 75, 671–680. [Google Scholar] [CrossRef]
- Beckstead, J.; Meyer, S.E.; Molder, C.J.; Smith, C. A Race for Survival: Can Bromus tectorum Seeds Escape Pyrenophora semeniperda-caused Mortality by Germinating Quickly? Ann. Bot. 2007, 99, 907–914. [Google Scholar] [CrossRef] [PubMed] [Green Version]
- Bever, J.D.; Platt, T.G.; Morton, E.R. Microbial Population and Community Dynamics on Plant Roots and Their Feedbacks on Plant Communities. Annu. Rev. Microbiol. 2012, 66, 265–283. [Google Scholar] [CrossRef] [Green Version]
- Chew, F.S.; Courtney, S.P. Plant Apparency and Evolutionary Escape from Insect Herbivory. Am. Nat. 1991, 138, 729–750. [Google Scholar] [CrossRef]
- Feeny, P. Plant Apparency and Chemical Defense. In Biochemical Interaction between Plants and Insects; Recent Advances in Phytochemistry; Springer: Boston, MA, USA, 1976; Volume 10. [Google Scholar]
- Mitchell, C.E.; Power, A.G. Release of invasive plants from fungal and viral pathogens. Nature 2003, 421, 625–627. [Google Scholar] [CrossRef]
- Colautti, R.I.; Ricciardi, A.; Grigorovich, I.A.; MacIsaac, H.J. Is invasion success explained by the enemy release hypothesis? Ecol. Lett. 2004, 7, 721–733. [Google Scholar] [CrossRef]
- Diez, J.M.; Dickie, I.; Edwards, G.; Hulme, P.E.; Sullivan, J.J.; Duncan, R.P. Negative soil feedbacks accumulate over time for non-native plant species: Plant-soil feedbacks change over time. Ecol. Lett. 2010, 13, 803–809. [Google Scholar] [CrossRef] [PubMed]
- Russo, S.E.; Kitajima, K. The Ecophysiology of Leaf Lifespan in Tropical Forests: Adaptive and Plastic Responses to Environmental Heterogeneity. In Tropical Tree Physiology; Goldstein, G., Santiago, L.S., Eds.; Tree Physiology; Springer International Publishing: Cham, Switzerland, 2016; Volume 6, pp. 357–383. ISBN 978-3-319-27420-1. [Google Scholar]
- Matsuki, S.; Koike, T. Comparison of Leaf Life Span, Photosynthesis and Defensive Traits Across Seven Species of Deciduous Broad-leaf Tree Seedlings. Ann. Bot. 2006, 97, 813–817. [Google Scholar] [CrossRef] [PubMed] [Green Version]
- Makino, T.T.; Sakai, S. Experience changes pollinator responses to floral display size: From size-based to reward-based foraging. Funct. Ecol. 2007, 21, 854–863. [Google Scholar] [CrossRef]
- Dauber, J.; Biesmeijer, J.C.; Gabriel, D.; Kunin, W.E.; Lamborn, E.; Meyer, B.; Nielsen, A.; Potts, S.G.; Roberts, S.P.M.; Sõber, V.; et al. Effects of patch size and density on flower visitation and seed set of wild plants: A pan-European approach: Patch size, flower visitation and seed set. J. Ecol. 2010, 98, 188–196. [Google Scholar] [CrossRef] [Green Version]
- Courchamp, F.; Clutton-Brock, T.; Grenfell, B. Inverse density dependence and the Allee effect. Trends Ecol. Evol. 1999, 14, 405–410. [Google Scholar] [CrossRef]
- Moeller, D.A.; Geber, M.A.; Eckhart, V.M.; Tiffin, P. Reduced pollinator service and elevated pollen limitation at the geographic range limit of an annual plant. Ecology 2012, 93, 1036–1048. [Google Scholar] [CrossRef] [PubMed]
- Groom, M.J. Allee Effects Limit Population Viability of an Annual Plant. Am. Nat. 1998, 151, 487–496. [Google Scholar] [CrossRef]
- Bennett, A.E.; Classen, A.T. Climate change influences mycorrhizal fungal–plant interactions, but conclusions are limited by geographical study bias. Ecology 2020, 101, e02978. [Google Scholar] [CrossRef]
- Wolfe, B.E.; Pringle, A. Geographically structured host specificity is caused by the range expansions and host shifts of a symbiotic fungus. ISME J. 2012, 6, 745–755. [Google Scholar] [CrossRef] [PubMed]
- Mueller, T.L.; Karlsen-Ayala, E.; Moeller, D.A.; Bellemare, J. Of mutualism and migration: Will interactions with novel ericoid mycorrhizal communities help or hinder northward Rhododendron range shifts? Oecologia 2022, 198, 839–852. [Google Scholar] [CrossRef]
- Vogelsang, K.M.; Bever, J.D. Mycorrhizal densities decline in association with nonnative plants and contribute to plant invasion. Ecology 2009, 90, 399–407. [Google Scholar] [CrossRef] [Green Version]
- Pigliucci, M. Phenotypic integration: Studying the ecology and evolution of complex phenotypes. Ecol. Lett. 2003, 6, 265–272. [Google Scholar] [CrossRef] [Green Version]
- Schlichting, C.D. Phenotypic Integration and Environmental Change. BioScience 1989, 39, 460–464. [Google Scholar] [CrossRef]
- Ghalambor, C.K.; McKAY, J.K.; Carroll, S.P.; Reznick, D.N. Adaptive versus non-adaptive phenotypic plasticity and the potential for contemporary adaptation in new environments. Funct. Ecol. 2007, 21, 394–407. [Google Scholar] [CrossRef]
- Drenovsky, R.E.; Grewell, B.J.; D’Antonio, C.M.; Funk, J.L.; James, J.J.; Molinari, N.; Parker, I.M.; Richards, C.L. A functional trait perspective on plant invasion. Ann. Bot. 2012, 110, 141–153. [Google Scholar] [CrossRef] [Green Version]
- Richards, C.L.; Bossdorf, O.; Muth, N.Z.; Gurevitch, J.; Pigliucci, M. Jack of all trades, master of some? On the role of phenotypic plasticity in plant invasions. Ecol. Lett. 2006, 9, 981–993. [Google Scholar] [CrossRef] [PubMed] [Green Version]
- Nicotra, A.B.; Atkin, O.K.; Bonser, S.P.; Davidson, A.M.; Finnegan, E.J.; Mathesius, U.; Poot, P.; Purugganan, M.D.; Richards, C.L.; Valladares, F.; et al. Plant phenotypic plasticity in a changing climate. Trends Plant Sci. 2010, 15, 684–692. [Google Scholar] [CrossRef] [PubMed]
- Matesanz, S.; Gianoli, E.; Valladares, F. Global change and the evolution of phenotypic plasticity in plants: Global change and plasticity. Ann. N. Y. Acad. Sci. 2010, 1206, 35–55. [Google Scholar] [CrossRef] [PubMed]
- Arnold, P.A.; Nicotra, A.B.; Kruuk, L.E.B. Sparse evidence for selection on phenotypic plasticity in response to temperature. Philos. Trans. R. Soc. B Biol. Sci. 2019, 374, 20180185. [Google Scholar] [CrossRef] [Green Version]
- Levis, N.A.; Pfennig, D.W. Evaluating ‘Plasticity-First’ Evolution in Nature: Key Criteria and Empirical Approaches. Trends Ecol. Evol. 2016, 31, 563–574. [Google Scholar] [CrossRef]
- Schwander, T.; Leimar, O. Genes as leaders and followers in evolution. Trends Ecol. Evol. 2011, 26, 143–151. [Google Scholar] [CrossRef]
- West-Eberhard, M.J. Developmental Plasticity and Evolution; Oxford University Press: Oxford, UK, 2003. [Google Scholar]
- Gupta, A.P.; Lewontin, R.C. A Study of Reaction Norms in Natural Populations of Drosophila pseudoobscura. Evolution 1982, 36, 934–948. [Google Scholar] [CrossRef]
- Price, T.D.; Qvarnström, A.; Irwin, D.E. The role of phenotypic plasticity in driving genetic evolution. Proc. R. Soc. Lond. B Biol. Sci. 2003, 270, 1433–1440. [Google Scholar] [CrossRef] [Green Version]
- Fox, R.J.; Donelson, J.M.; Schunter, C.; Ravasi, T.; Gaitán-Espitia, J.D. Beyond buying time: The role of plasticity in phenotypic adaptation to rapid environmental change. Philos. Trans. R. Soc. B Biol. Sci. 2019, 374, 20180174. [Google Scholar] [CrossRef] [PubMed]
- Velikova, V.; Arena, C.; Izzo, L.G.; Tsonev, T.; Koleva, D.; Tattini, M.; Roeva, O.; De Maio, A.; Loreto, F. Functional and Structural Leaf Plasticity Determine Photosynthetic Performances during Drought Stress and Recovery in Two Platanus orientalis Populations from Contrasting Habitats. Int. J. Mol. Sci. 2020, 21, 3912. [Google Scholar] [CrossRef] [PubMed]
- Chevin, L.-M.; Collins, S.; Lefèvre, F. Phenotypic plasticity and evolutionary demographic responses to climate change: Taking theory out to the field. Funct. Ecol. 2013, 27, 967–979. [Google Scholar] [CrossRef] [Green Version]
- Andersen, K.M.; Turner, B.L.; Dalling, J.W. Seedling performance trade-offs influencing habitat filtering along a soil nutrient gradient in a tropical forest. Ecology 2014, 95, 3399–3413. [Google Scholar] [CrossRef]
- Svenning, J.-C.; Gravel, D.; Holt, R.D.; Schurr, F.M.; Thuiller, W.; Münkemüller, T.; Schiffers, K.H.; Dullinger, S.; Edwards, T.C.; Hickler, T.; et al. The influence of interspecific interactions on species range expansion rates. Ecography 2014, 37, 1198–1209. [Google Scholar] [CrossRef] [PubMed]
- Benito Garzón, M.; Robson, T.M.; Hampe, A. ΔTraitSDMs: Species distribution models that account for local adaptation and phenotypic plasticity. New Phytol. 2019, 222, 1757–1765. [Google Scholar] [CrossRef]
- Pichancourt, J.-B.; van Klinken, R.D. Phenotypic Plasticity Influences the Size, Shape and Dynamics of the Geographic Distribution of an Invasive Plant. PLoS ONE 2012, 7, e32323. [Google Scholar] [CrossRef] [Green Version]
- Cunningham, S.A. Effects of Habitat Fragmentation on the Reproductive Ecology of Four Plant Species in Mallee Woodland. Conserv. Biol. 2000, 14, 758–768. [Google Scholar] [CrossRef]
- Masson-Delmotte, V.; Intergovernmental Panel on Climate Change; WMO; United Nations Environment Programme. Climate Change and Land: An IPCC Special Report on Climate Change, Desertification, Land Degradation, Sustainable Land Management, Food Security, and Greenhouse Gas Fluxes in Terrestrial Ecosystems: Summary for Policymakers; Intergovernmental Panel on Climate Change: Geneva, Switzerland, 2019; ISBN 978-92-9169-154-8. [Google Scholar]
- Albert, J.S.; Carnaval, A.C.; Flantua, S.G.A.; Lohmann, L.G.; Ribas, C.C.; Riff, D.; Carrillo, J.D.; Fan, Y.; Figueiredo, J.J.P.; Guayasamin, J.M.; et al. Human impacts outpace natural processes in the Amazon. Science 2023, 379, eabo5003. [Google Scholar] [CrossRef]
- Franklin, J. Mapping Species Distributions: Spatial Inference and Prediction; Cambridge University Press: Cambridge, UK, 2010. [Google Scholar]
- Guisan, A.; Zimmermann, N.E. Predictive habitat distribution models in ecology. Ecol. Model. 2000, 135, 147–186. [Google Scholar] [CrossRef]
- Kearney, M.; Porter, W. Mechanistic niche modelling: Combining physiological and spatial data to predict species’ ranges. Ecol. Lett. 2009, 12, 334–350. [Google Scholar] [CrossRef] [PubMed]
- Elith, J.; Graham, C.H.; Anderson, R.P.; Dudík, M.; Ferrier, S.; Guisan, A.; Hijmans, R.J.; Huettmann, F.; Leathwick, J.R.; Lehmann, A.; et al. Novel methods improve prediction of species’ distributions from occurrence data. Ecography 2006, 29, 129–151. [Google Scholar] [CrossRef] [Green Version]
- Charney, N.D.; Record, S.; Gerstner, B.E.; Merow, C.; Zarnetske, P.L.; Enquist, B.J. A Test of Species Distribution Model Transferability Across Environmental and Geographic Space for 108 Western North American Tree Species. Front. Ecol. Evol. 2021, 9, 689295. [Google Scholar] [CrossRef]
- Beaumont, L.J.; Hughes, L.; Poulsen, M. Predicting species distributions: Use of climatic parameters in BIOCLIM and its impact on predictions of species’ current and future distributions. Ecol. Model. 2005, 186, 251–270. [Google Scholar] [CrossRef]
- Kearney, M.; Porter, W.P. Mapping the fundamental niche: Physiology, climate, and the distribution of a nocturnal lizard. Ecology 2004, 85, 3119–3131. [Google Scholar] [CrossRef] [Green Version]
- Kearney, M.R.; Porter, W.P. NicheMapR—An R package for biophysical modelling: The ectotherm and Dynamic Energy Budget models. Ecography 2020, 43, 85–96. [Google Scholar] [CrossRef] [Green Version]
- Moorcroft, P.R.; Hurtt, G.C.; Pacala, S.W. A method for scaling vegetation dynamics: The Ecosystem Demography Model (ED). Ecol. Monogr. 2001, 71, 557–586. [Google Scholar] [CrossRef]
- Medvigy, D.; Wofsy, S.C.; Munger, J.W.; Hollinger, D.Y.; Moorcroft, P.R. Mechanistic scaling of ecosystem function and dynamics in space and time: Ecosystem Demography model version 2. J. Geophys. Res. 2009, 114, G01002. [Google Scholar] [CrossRef] [Green Version]
- Tomlinson, S.; Lewandrowski, W.; Elliott, C.P.; Miller, B.P.; Turner, S.R. High-resolution distribution modeling of a threatened short-range endemic plant informed by edaphic factors. Ecol. Evol. 2020, 10, 763–777. [Google Scholar] [CrossRef] [Green Version]
- Zhang, K.; Yao, L.; Meng, J.; Tao, J. Maxent modeling for predicting the potential geographical distribution of two peony species under climate change. Sci. Total Environ. 2018, 634, 1326–1334. [Google Scholar] [CrossRef]
- Zhang, L.; Zhu, L.; Li, Y.; Zhu, W.; Chen, Y. Maxent Modelling Predicts a Shift in Suitable Habitats of a Subtropical Evergreen Tree (Cyclobalanopsis glauca (Thunberg) Oersted) under Climate Change Scenarios in China. Forests 2022, 13, 126. [Google Scholar] [CrossRef]
- Hijmans, R.J.; Graham, C.H. The ability of climate envelope models to predict the effect of climate change on species distributions. Glob. Chang. Biol. 2006, 12, 2272–2281. [Google Scholar] [CrossRef]
- Kearney, M.R.; Wintle, B.A.; Porter, W.P. Correlative and mechanistic models of species distribution provide congruent forecasts under climate change: Congruence of correlative and mechanistic distribution models. Conserv. Lett. 2010, 3, 203–213. [Google Scholar] [CrossRef]
- Araújo, M.B.; Peterson, A.T. Uses and misuses of bioclimatic envelope modeling. Ecology 2012, 93, 1527–1539. [Google Scholar] [CrossRef] [PubMed] [Green Version]
- Isaac, N.J.B.; Jarzyna, M.A.; Keil, P.; Dambly, L.I.; Boersch-Supan, P.H.; Browning, E.; Freeman, S.N.; Golding, N.; Guillera-Arroita, G.; Henrys, P.A.; et al. Data Integration for Large-Scale Models of Species Distributions. Trends Ecol. Evol. 2020, 35, 56–67. [Google Scholar] [CrossRef] [PubMed] [Green Version]
- Heberling, J.M.; Miller, J.T.; Noesgaard, D.; Weingart, S.B.; Schigel, D. Data integration enables global biodiversity synthesis. Proc. Natl. Acad. Sci. USA 2021, 118, e2018093118. [Google Scholar] [CrossRef]
- Lee-Yaw, J.A.; McCune, J.L.; Pironon, S.; Sheth, S.N. Species distribution models rarely predict the biology of real populations. Ecography 2022, 2022, e05877. [Google Scholar] [CrossRef]
- Rubenstein, M.A.; Weiskopf, S.R.; Carter, S.L.; Eaton, M.J.; Johnson, C.; Lynch, A.J.; Miller, B.W.; Morelli, T.L.; Rodriguez, M.A.; Terando, A.; et al. Do empirical observations support commonly-held climate change range shift hypotheses? A systematic review protocol. Environ. Evid. 2020, 9, 10. [Google Scholar] [CrossRef]
- Feng, X.; Park, D.S.; Walker, C.; Peterson, A.T.; Merow, C.; Papeş, M. A checklist for maximizing reproducibility of ecological niche models. Nat. Ecol. Evol. 2019, 3, 1382–1395. [Google Scholar] [CrossRef] [Green Version]
- Wan, J.-Z.; Wang, C.-J.; Yu, F.-H. Effects of occurrence record number, environmental variable number, and spatial scales on MaxEnt distribution modelling for invasive plants. Biologia 2019, 74, 757–766. [Google Scholar] [CrossRef]
- Berec, L.; Angulo, E.; Courchamp, F. Multiple Allee effects and population management. Trends Ecol. Evol. 2007, 22, 185–191. [Google Scholar] [CrossRef] [PubMed]
- Ehrlen, J.; Eriksson, O. Dispersal Limitation and Patch Occupancy in Forest Herbs. Ecology 2000, 81, 1667–1674. [Google Scholar] [CrossRef]
- Westoby, M.; Falster, D.S.; Moles, A.T.; Vesk, P.A.; Wright, I.J. Plant Ecological Strategies: Some Leading Dimensions of Variation Between Species. Annu. Rev. Ecol. Syst. 2002, 33, 125–159. [Google Scholar] [CrossRef] [Green Version]
- Stearns, S.C. The Evolution of Life Histories; Oxford University Press: London, UK, 1992. [Google Scholar]
Figure 1.
A plant species’ geographic and habitat ranges are determined by colonization and the suitability of abiotic and biotic environmental conditions with respect to the ecological niche. The left-hand portion of the figure represents the species’ geographic range as a metapopulation, in which gray shading indicates areas that are unoccupied (due to dispersal limitations or unsuitable environmental conditions), and the white polygons indicate areas that are occupied, i.e., populations of the species in suitable environments. Populations towards the geographic range edges are depicted as being smaller and populations in the range center are larger, to symbolize that geographic range edges often consist of marginal, less suitable environments, and hence smaller populations. Purple polygons depicted outside of the main geographic range represent remnant populations of the species, and green polygons represent advancing populations that have recently established in a suitable environment outside the species’ current geographic range. The right-hand portion of the figure depicts the habitat-scale distributions of one population of the species, indicating the population’s habitat range, defined by regions of more (blue) and less (yellow) suitable environments that have phenotype-environment (PE) matching or some PE mismatch (see symbols in the figure legend), thereby causing a variation in population density. Arrows on both the left- and right-hand portions indicate colonization.

Figure 2.
A plant species’ capacity for range shifts is shaped by the relationship between its colonization ability and its probability of being filtered out of a site. The capacity for plant range shifts is determined equally by the effects of colonization ability and the probability that a species experiences habitat filtering (i.e., is filtered out of a site) after colonization in (a), is more limited by a species’ probability of being filtered out in (b), and is more limited by a species’ colonization ability in (c), with low (yellow) to high (purple) capacity for range shift. Trade-offs in species’ ecological strategies influence their colonization ability and their probability of being filtered out of a site through a phenotype–environment mismatch. Trait values that should increase or decrease colonization ability or probability of being filtered out are denoted on the high and low ends of each axis and apply to all three graphs, even though they are only detailed in (a). The numbers 1, 2, and 3 represent the positions of three hypothetical species positioned on the x and y axis coordinates based on their trait values. Species 1 would have a moderate dispersal distance and fecundity and small to moderately sized seeds; Species 1 could represent an abiotic condition and mutualist specialist and antagonist generalist, experience high pressure from conspecific negative density-dependence (CNDD), produce less robust seedlings, be a less well-defended and stress tolerant individual, and/or exhibit low phenotypic plasticity. Species 2 would have low seed dispersal distance and low fecundity and would be a large-seeded species; Species 2 could represent an abiotic condition and mutualist generalist and antagonist specialist, experience minimal effects of CNDD, produce more robust seedlings, be a well-defended and stress tolerant individual, and/or exhibit high phenotypic plasticity. Species 3 would have high colonization ability, due to having a longer dispersal distance, smaller seed size, and higher fecundity, and similar traits on the y-axis as Species 2. In (a), colonization ability and the probability of being filtering out are assumed to be equally important in determining the capacity for range shift (i.e., additive effects), leading to linear contours in plant range shift capacity. In this scenario, Species 1 has a low–moderate capacity for range shift because it has a moderate colonization ability but high probability of being filtered out; Species 2 has a moderate capacity for range shift, due to its low colonization ability and low probability of being filtered out; and Species 3 has a high capacity for range shift, due to a high colonization ability and relatively low probability of being filtered out. Both (b,c) represent environments where there are interactive effects between colonization ability and the probability of being filtered out, leading to curved contours. In (b), the environment is weighted by the probability of being filtered out, making it a stronger limiting factor than colonization ability on capacity for range shift, resulting in concave-up contours in plant range shift capacity. In this scenario, Species 1 will be unlikely to expand its range, while Species 2 and 3 should both be able to expand their ranges. In (c), the environment is weighted by colonization ability, making it a stronger limiting factor than the probability of being filtered out on the capacity for range shift, resulting in concave-down contours in plant range shift capacity. In this scenario, compared to (b), Species 1 has a better capacity for range shift, because the environment is more favorable, and Species 2 and 3 both have high capacities for range shift despite strong differences in colonization ability. There will not be any species located in the top left-most corner of the graphs with very low colonization ability and very high probability of being filtered out, as species with this strategy would have a very low capacity for range shifts and would not survive in their current distributions. Similarly, there should be relatively fewer species in the top right-most corner of the graphs that have high colonization ability and high probability of being filtered out, as species with these strategies would face challenges in establishing a viable population (due to high filtering) and would have below-moderate capacity for range shifts. See Table 1 and Section 6 text for further explication of trade-offs in species’ ecological strategies, and how these operate to increase or decrease the capacity of a species to shift its habitat and/or geographic range.

Disclaimer/Publisher’s Note: The statements, opinions and data contained in all publications are solely those of the individual author(s) and contributor(s) and not of MDPI and/or the editor(s). MDPI and/or the editor(s) disclaim responsibility for any injury to people or property resulting from any ideas, methods, instructions or products referred to in the content. |
© 2023 by the authors. Licensee MDPI, Basel, Switzerland. This article is an open access article distributed under the terms and conditions of the Creative Commons Attribution (CC BY) license (https://creativecommons.org/licenses/by/4.0/).
Share and Cite
MDPI and ACS Style
McNichol, B.H.; Russo, S.E. Plant Species’ Capacity for Range Shifts at the Habitat and Geographic Scales: A Trade-Off-Based Framework. Plants 2023, 12, 1248. https://doi.org/10.3390/plants12061248
AMA Style
McNichol BH, Russo SE. Plant Species’ Capacity for Range Shifts at the Habitat and Geographic Scales: A Trade-Off-Based Framework. Plants. 2023; 12(6):1248. https://doi.org/10.3390/plants12061248
Chicago/Turabian StyleMcNichol, Bailey H., and Sabrina E. Russo. 2023. "Plant Species’ Capacity for Range Shifts at the Habitat and Geographic Scales: A Trade-Off-Based Framework" Plants 12, no. 6: 1248. https://doi.org/10.3390/plants12061248
Note that from the first issue of 2016, this journal uses article numbers instead of page numbers. See further details here.