
Identification of Trehalose-6-Phosphate Synthase (TPS) Genes Associated with Both Source-/Sink-Related Yield Traits and Drought Response in Rapeseed (Brassica napus L.)
 ,
,  , ,
, ,  and
and
Abstract
:1. Introduction
2. Results
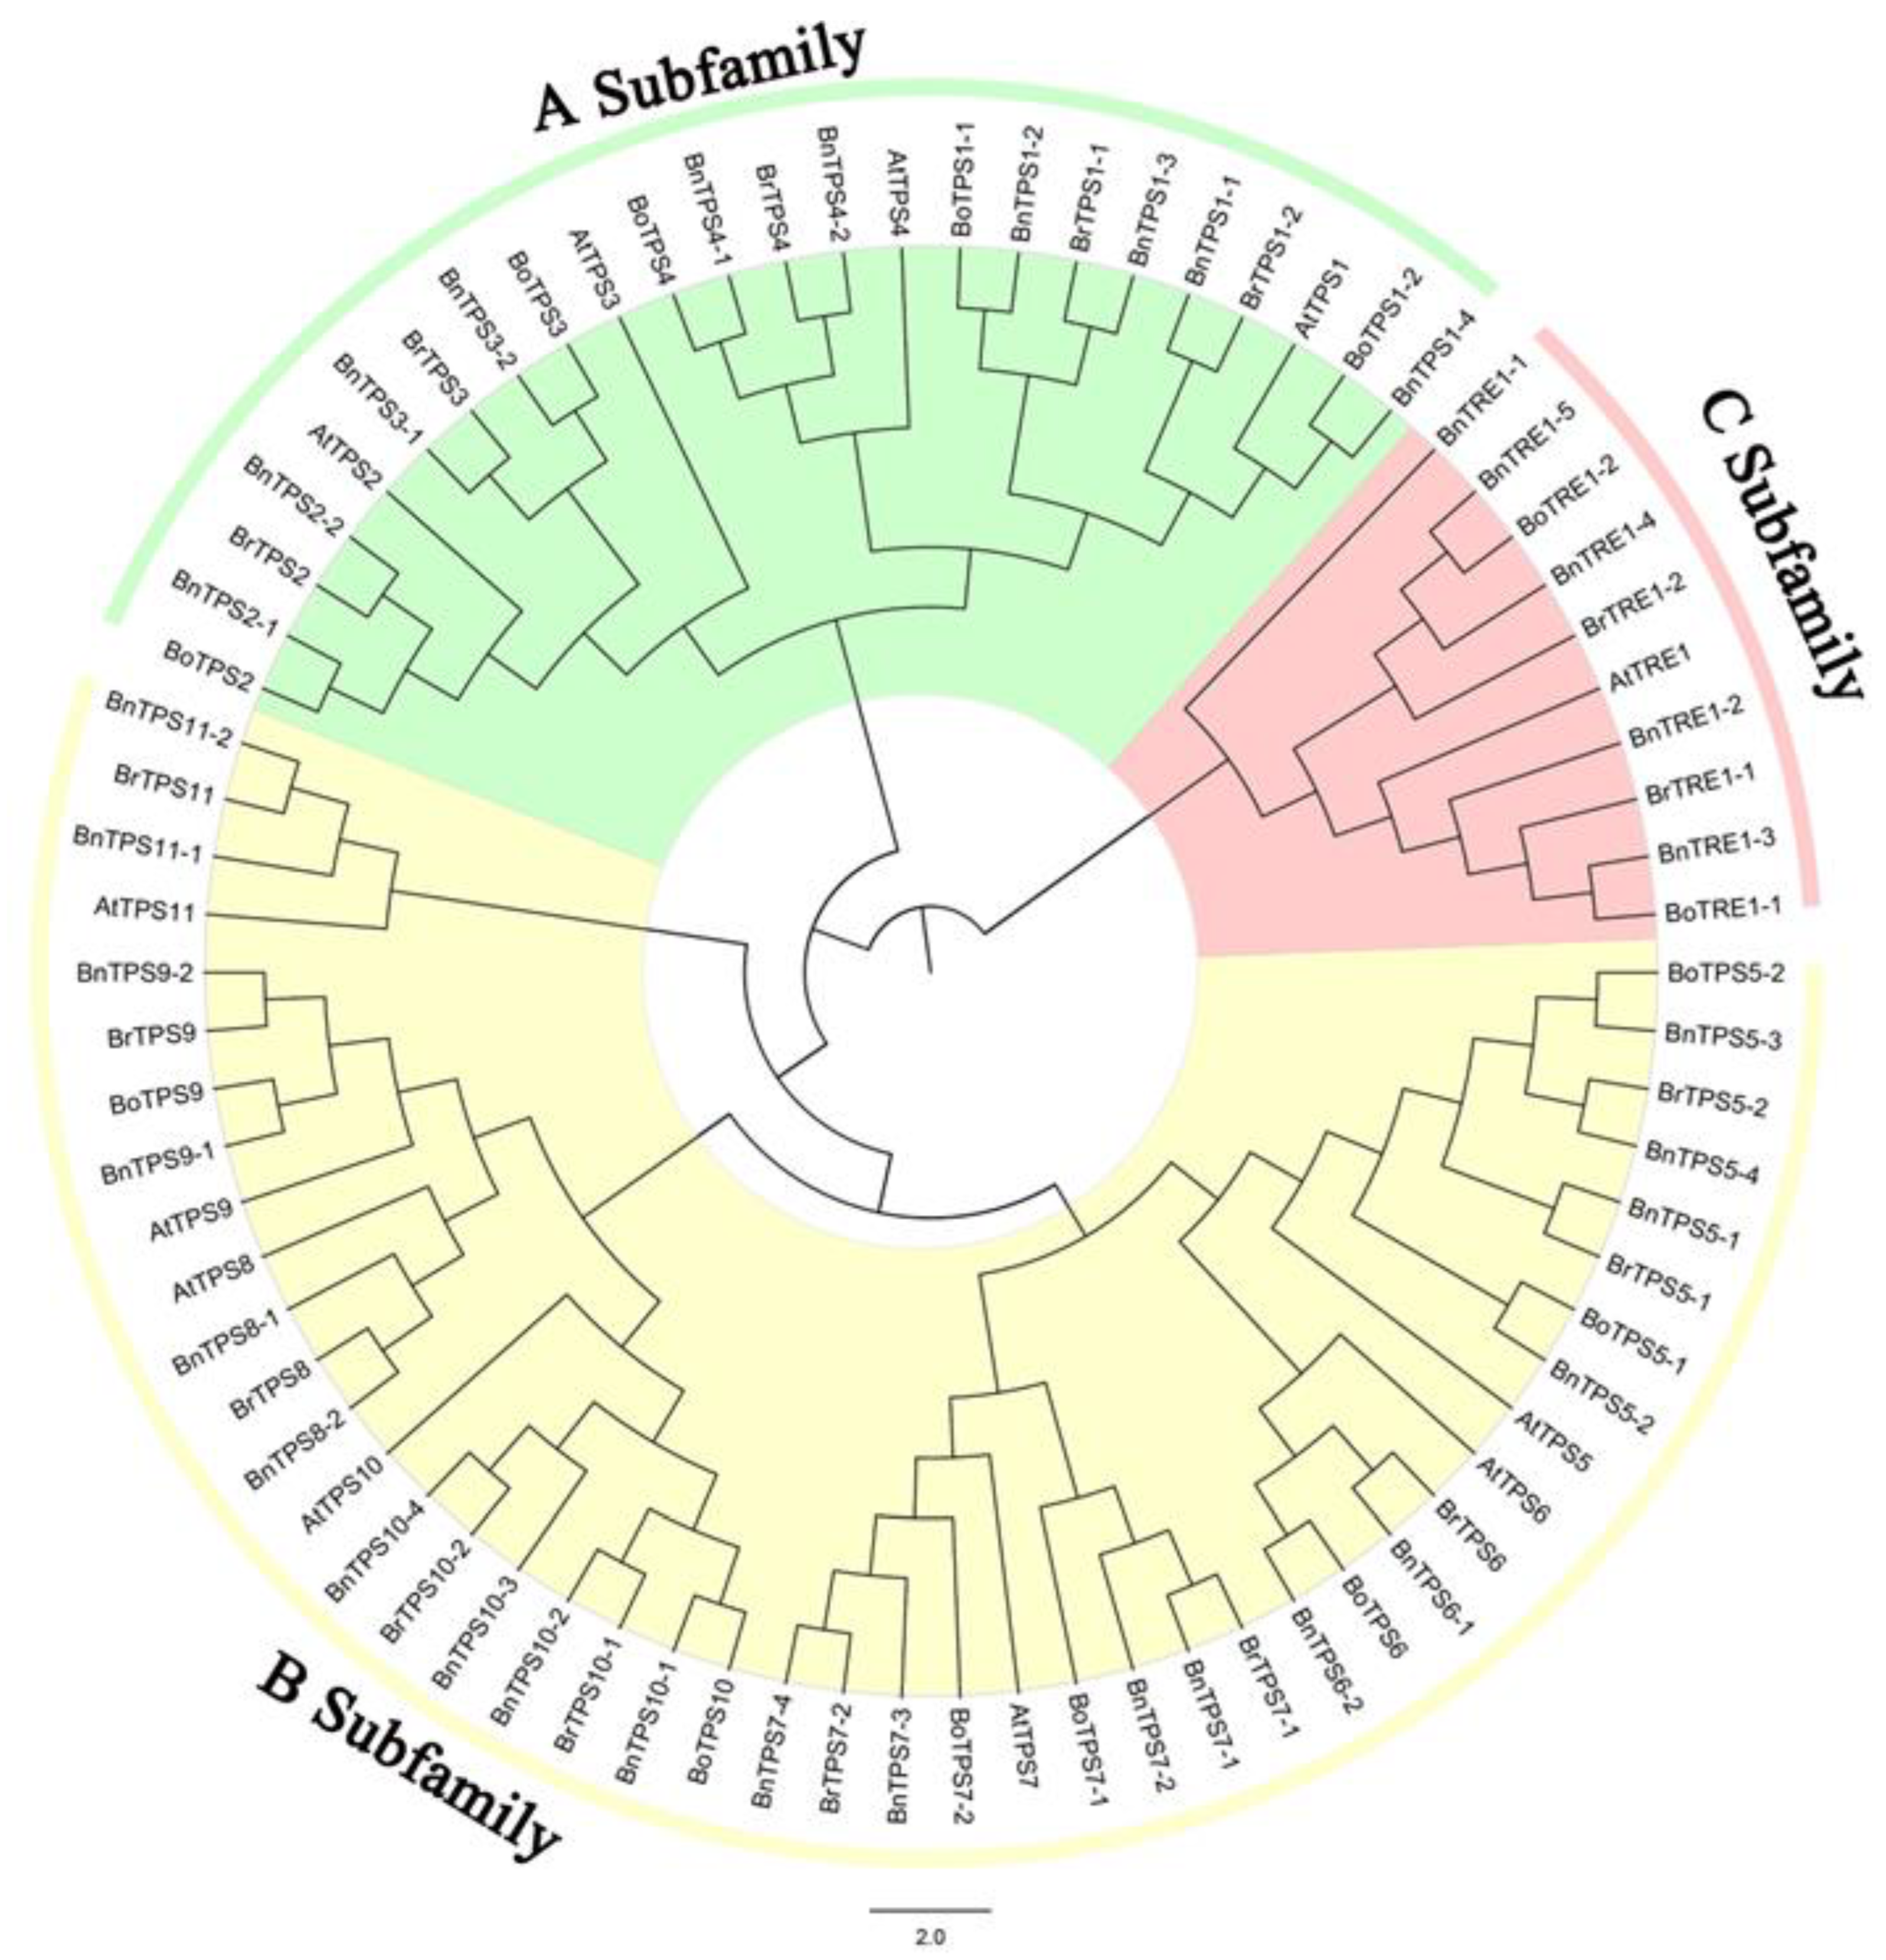
2.1. Identification and Phylogenetic Analysis of the Key TPSs
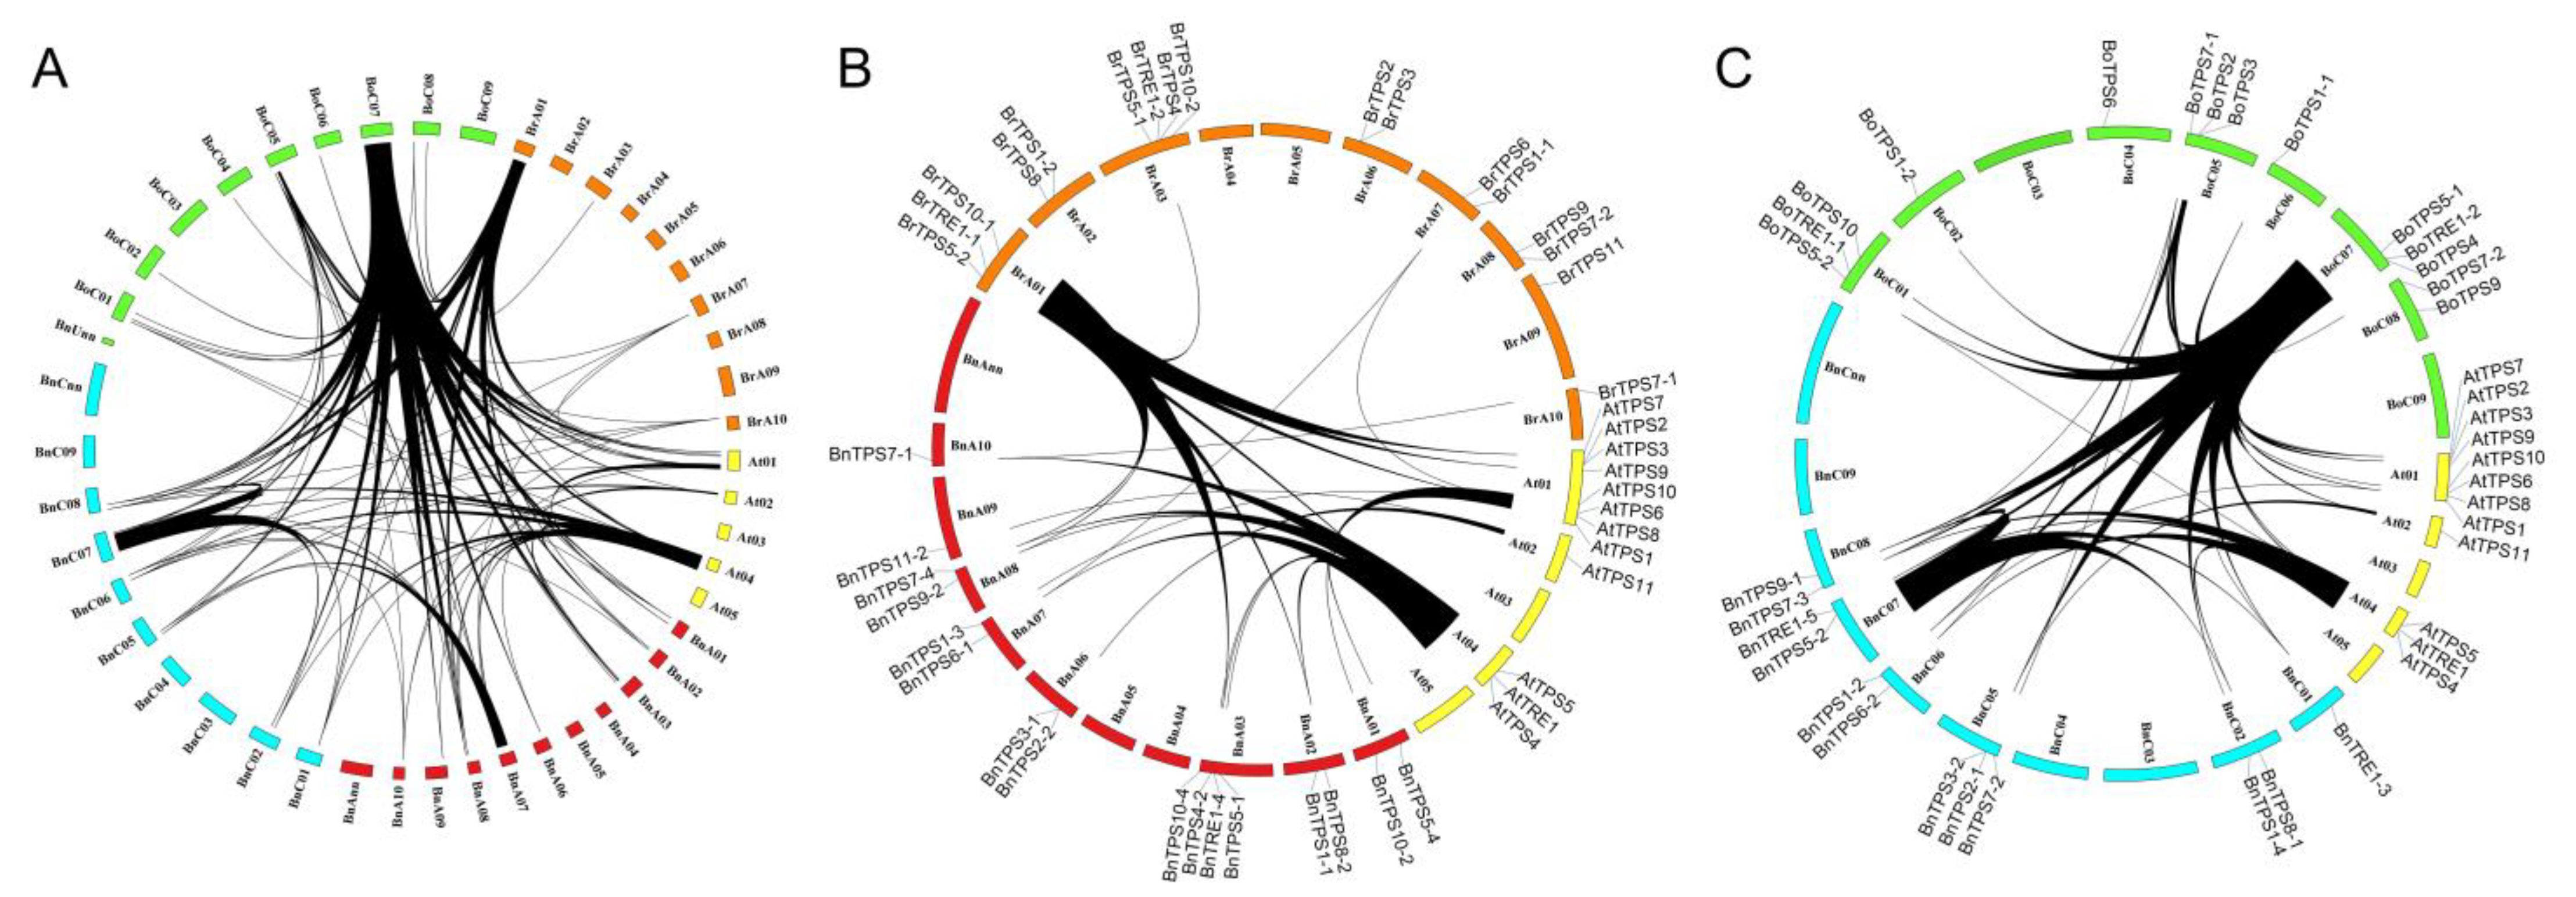
2.2. Syntenic Analysis of TPSs in the Four Cruciferous Species
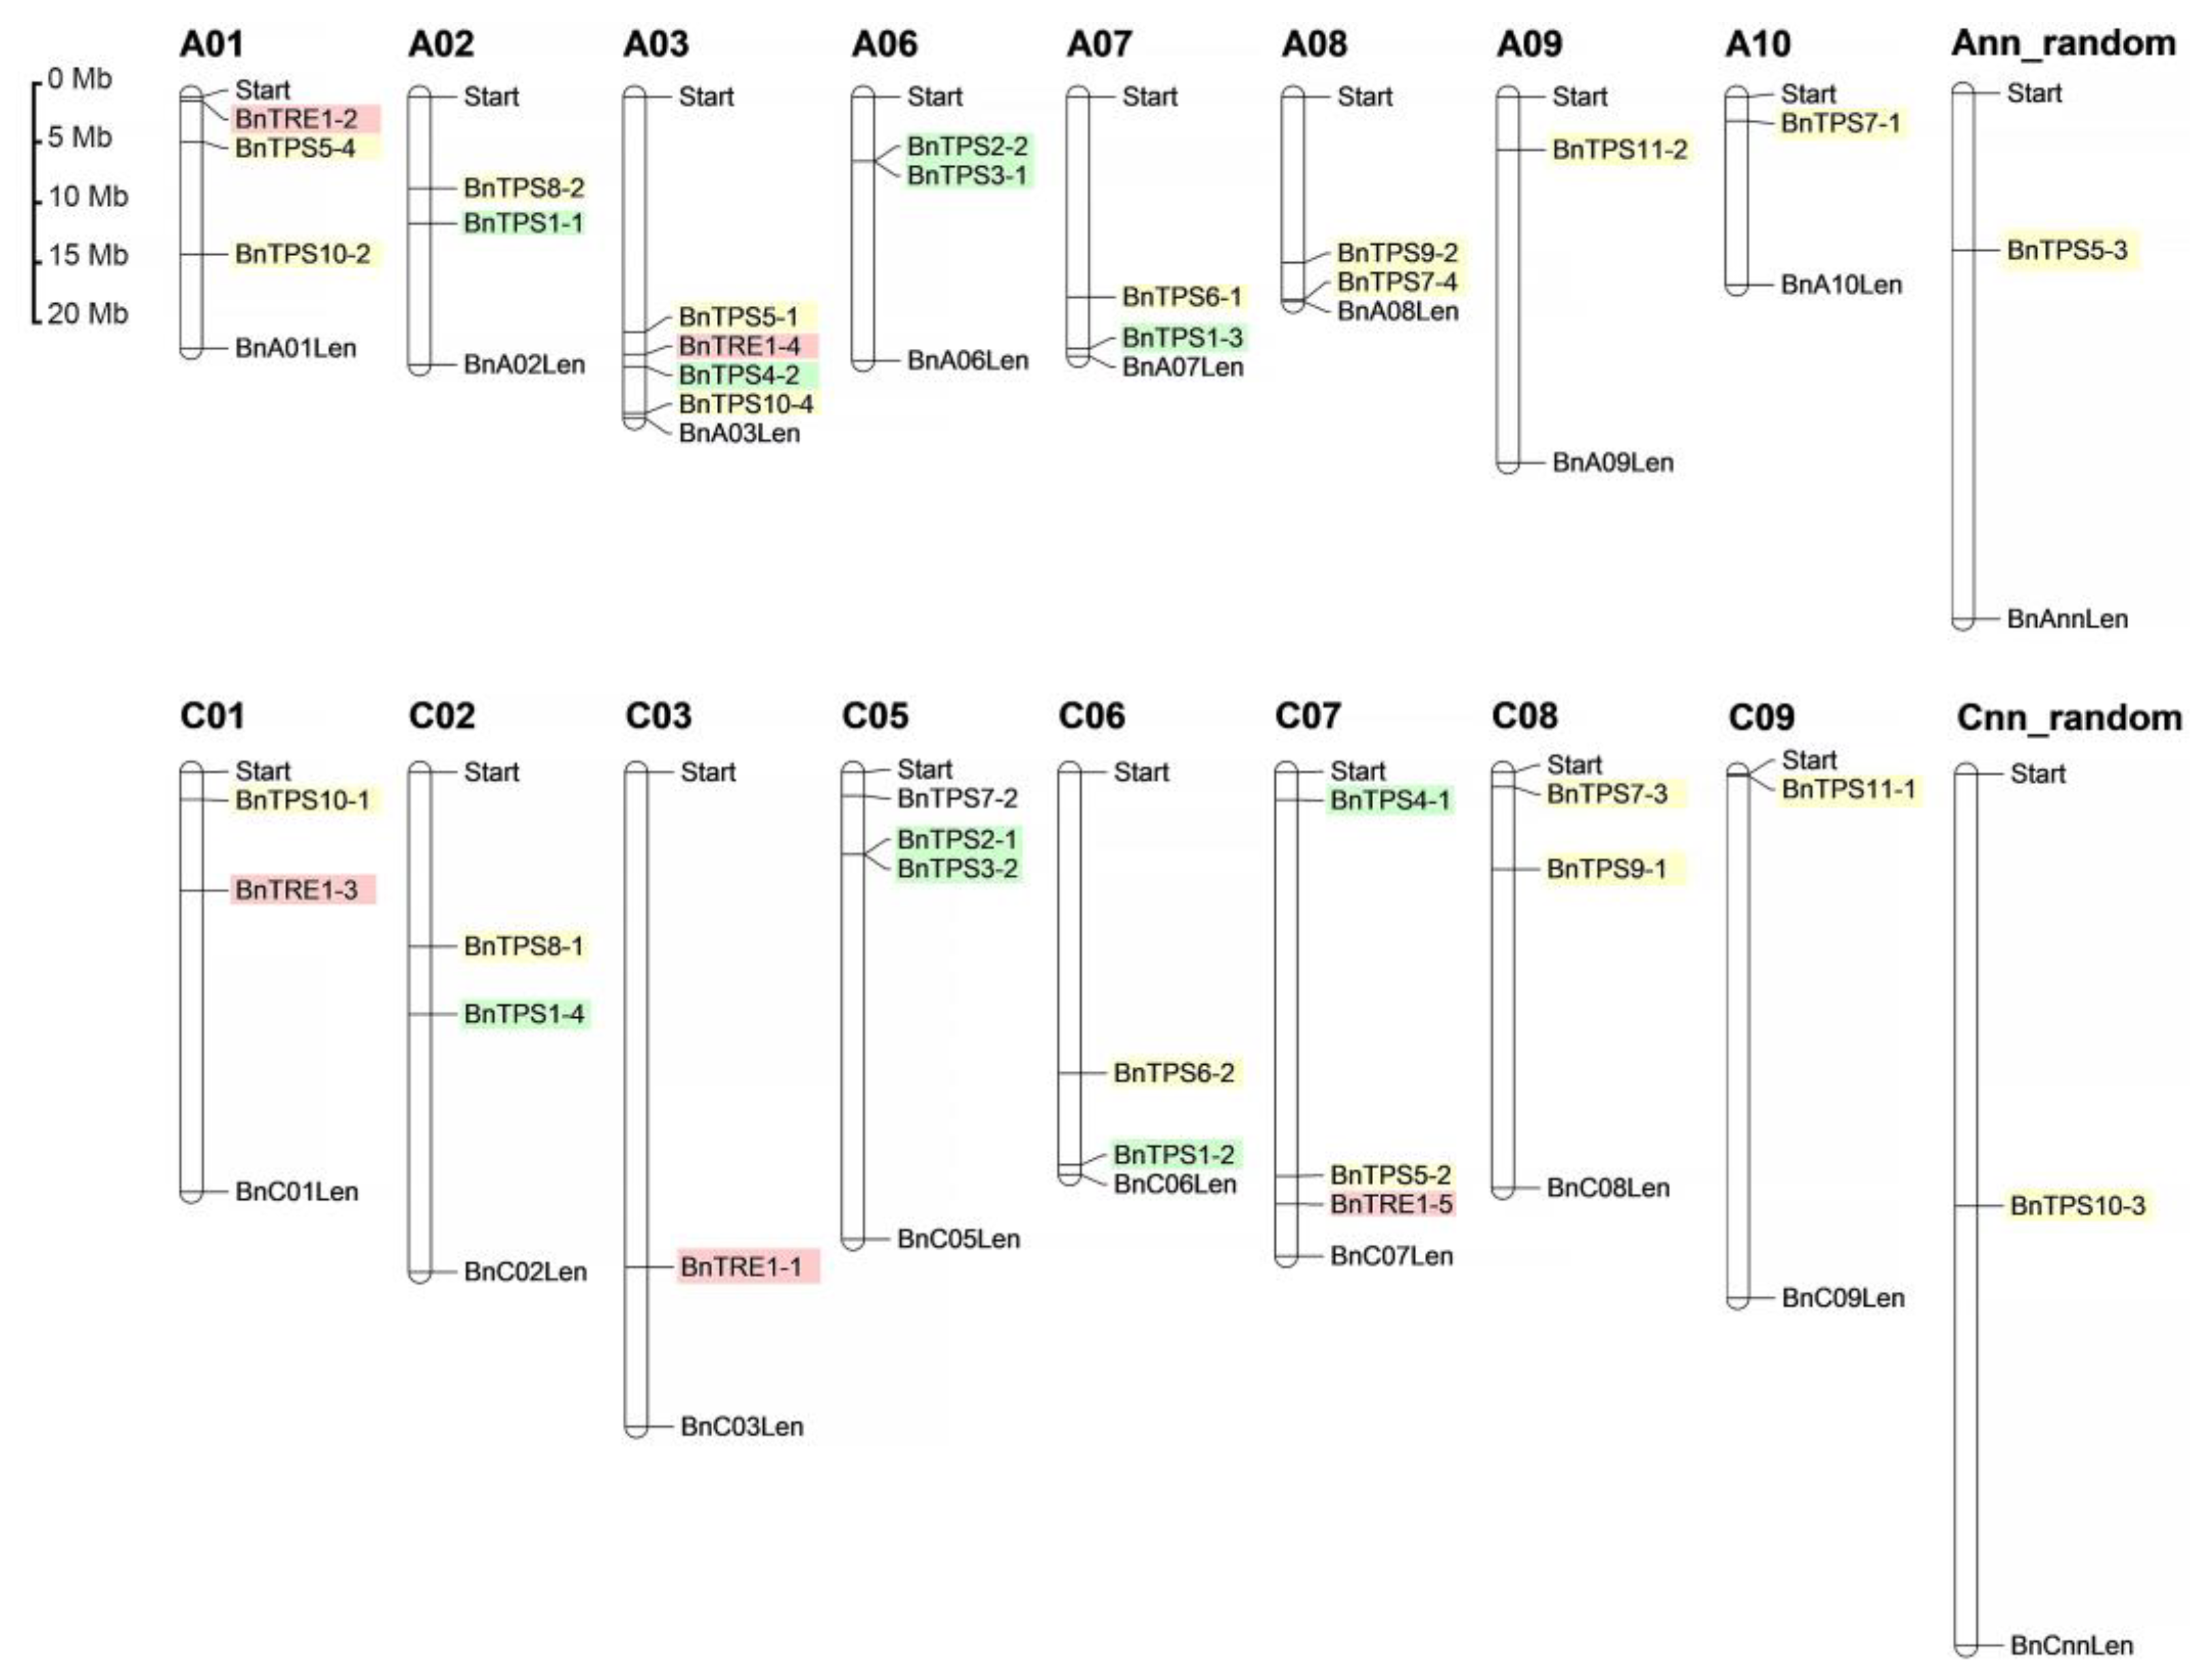
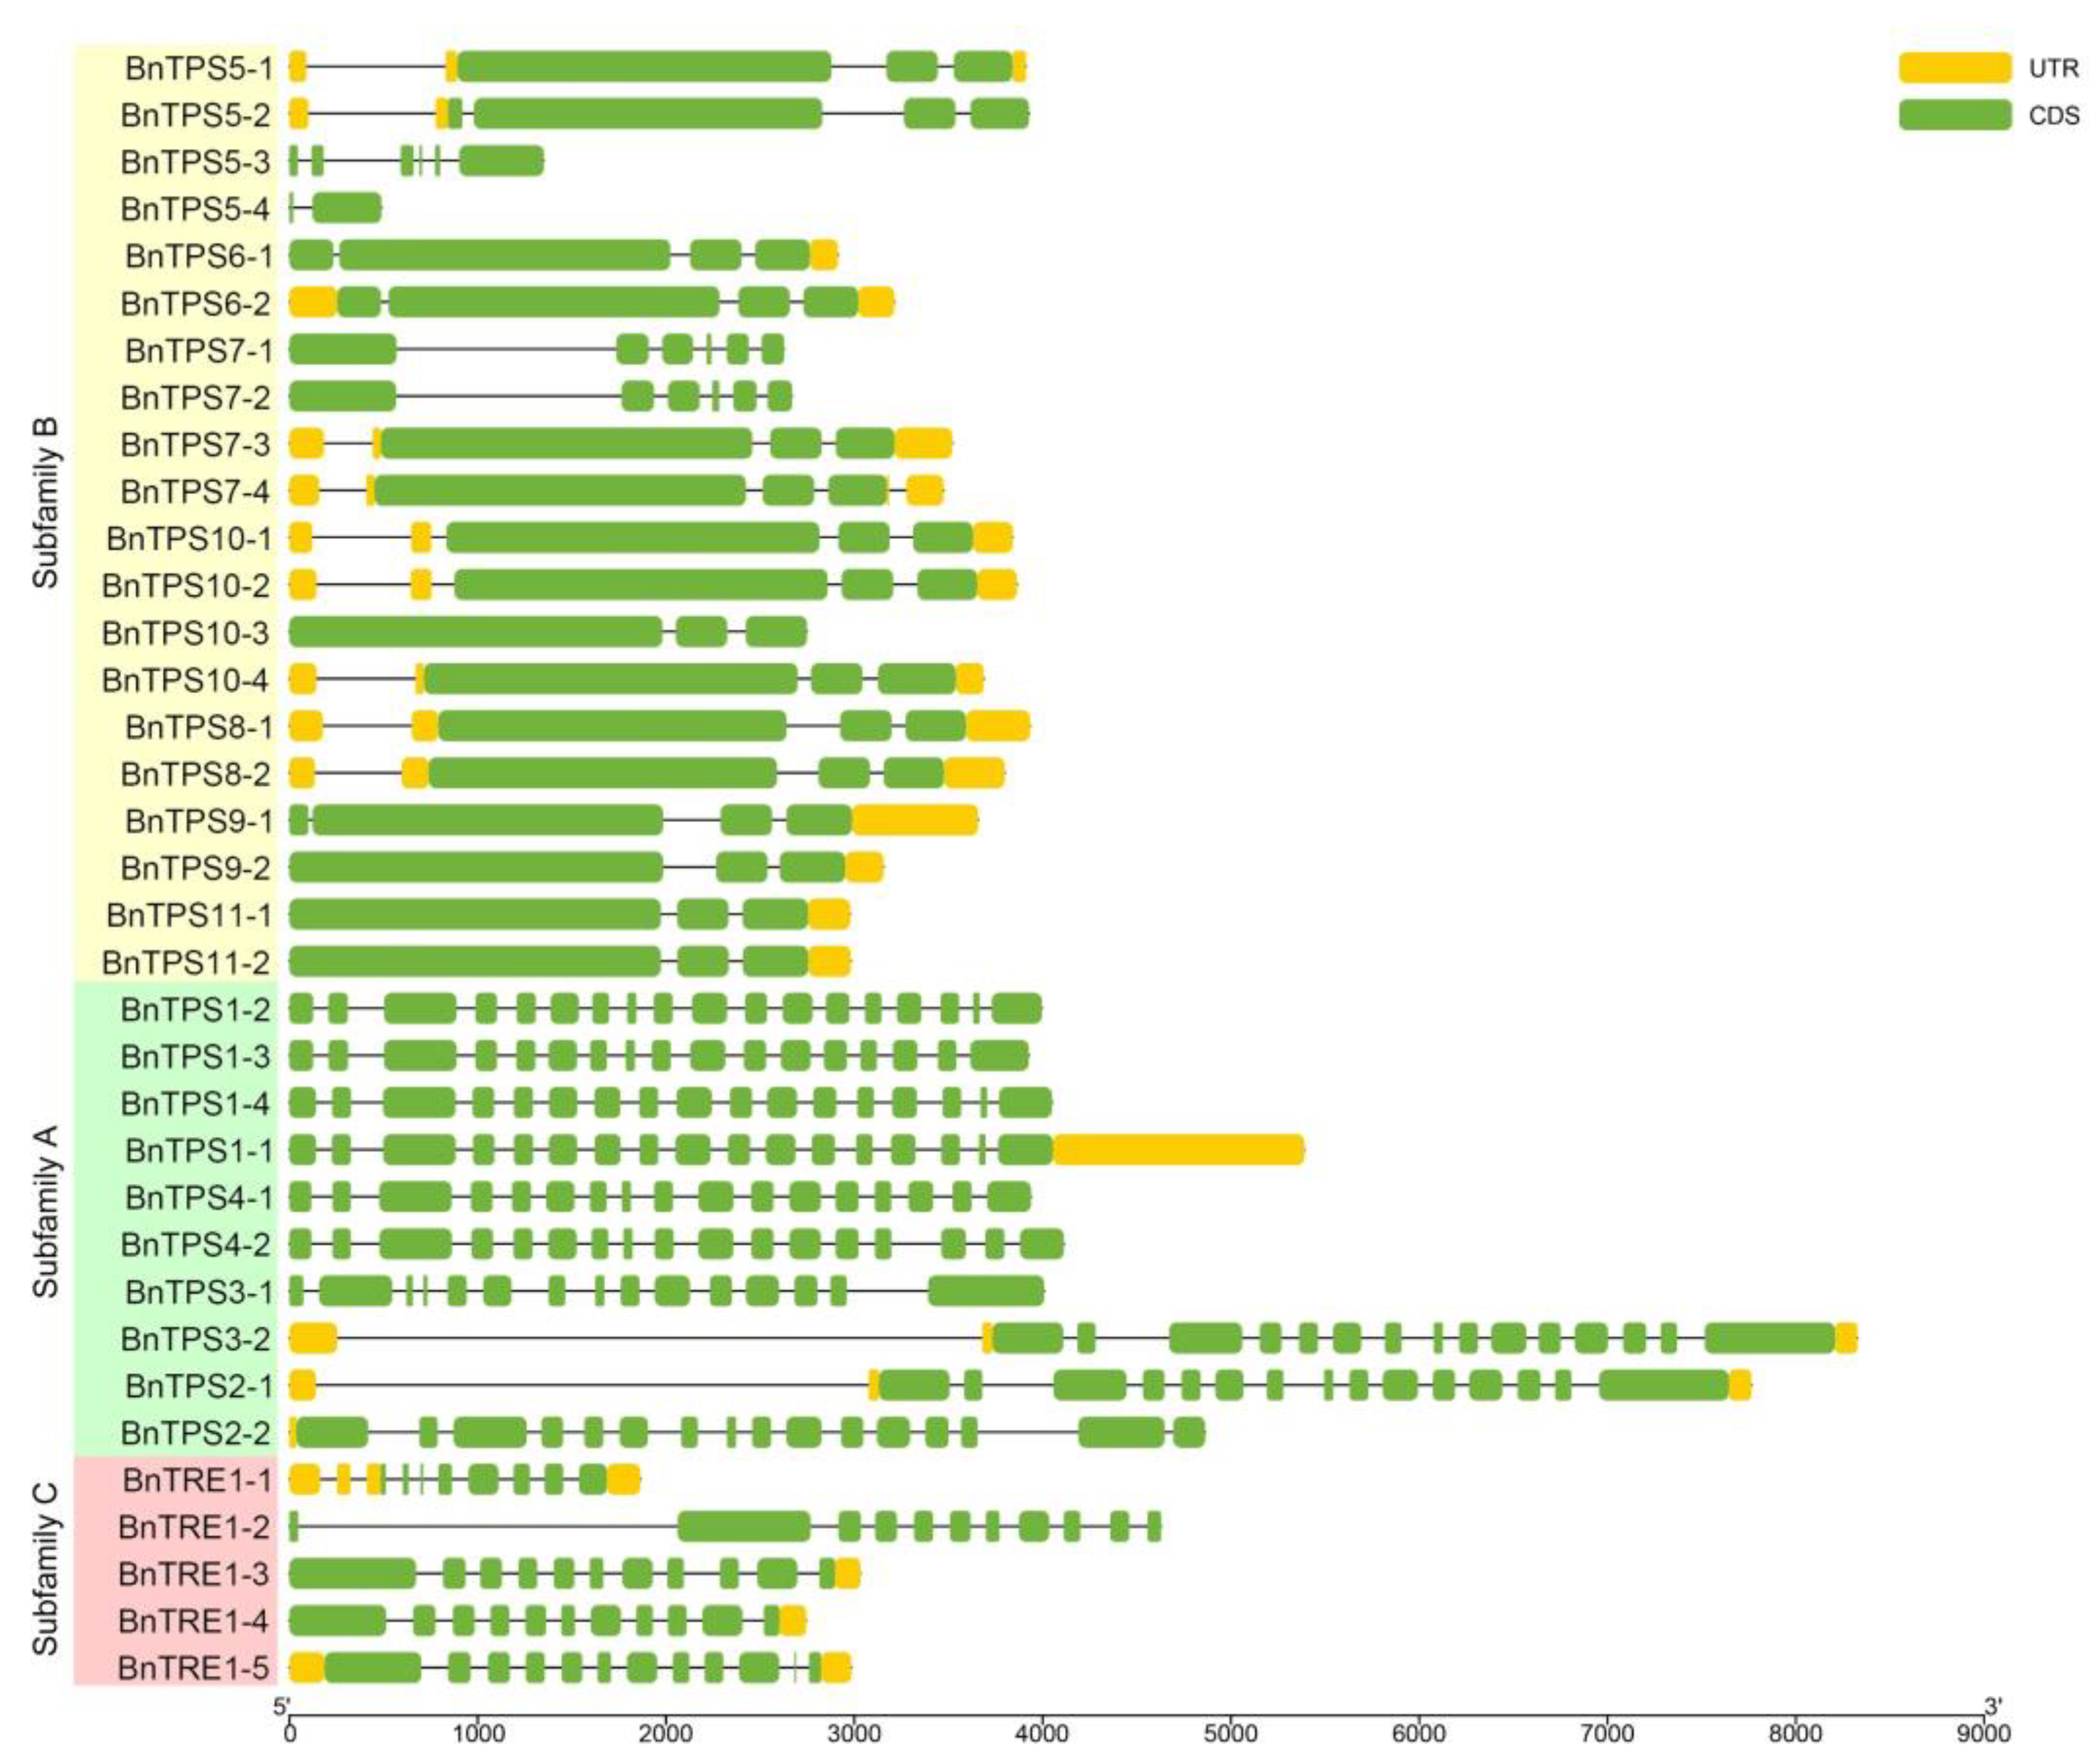
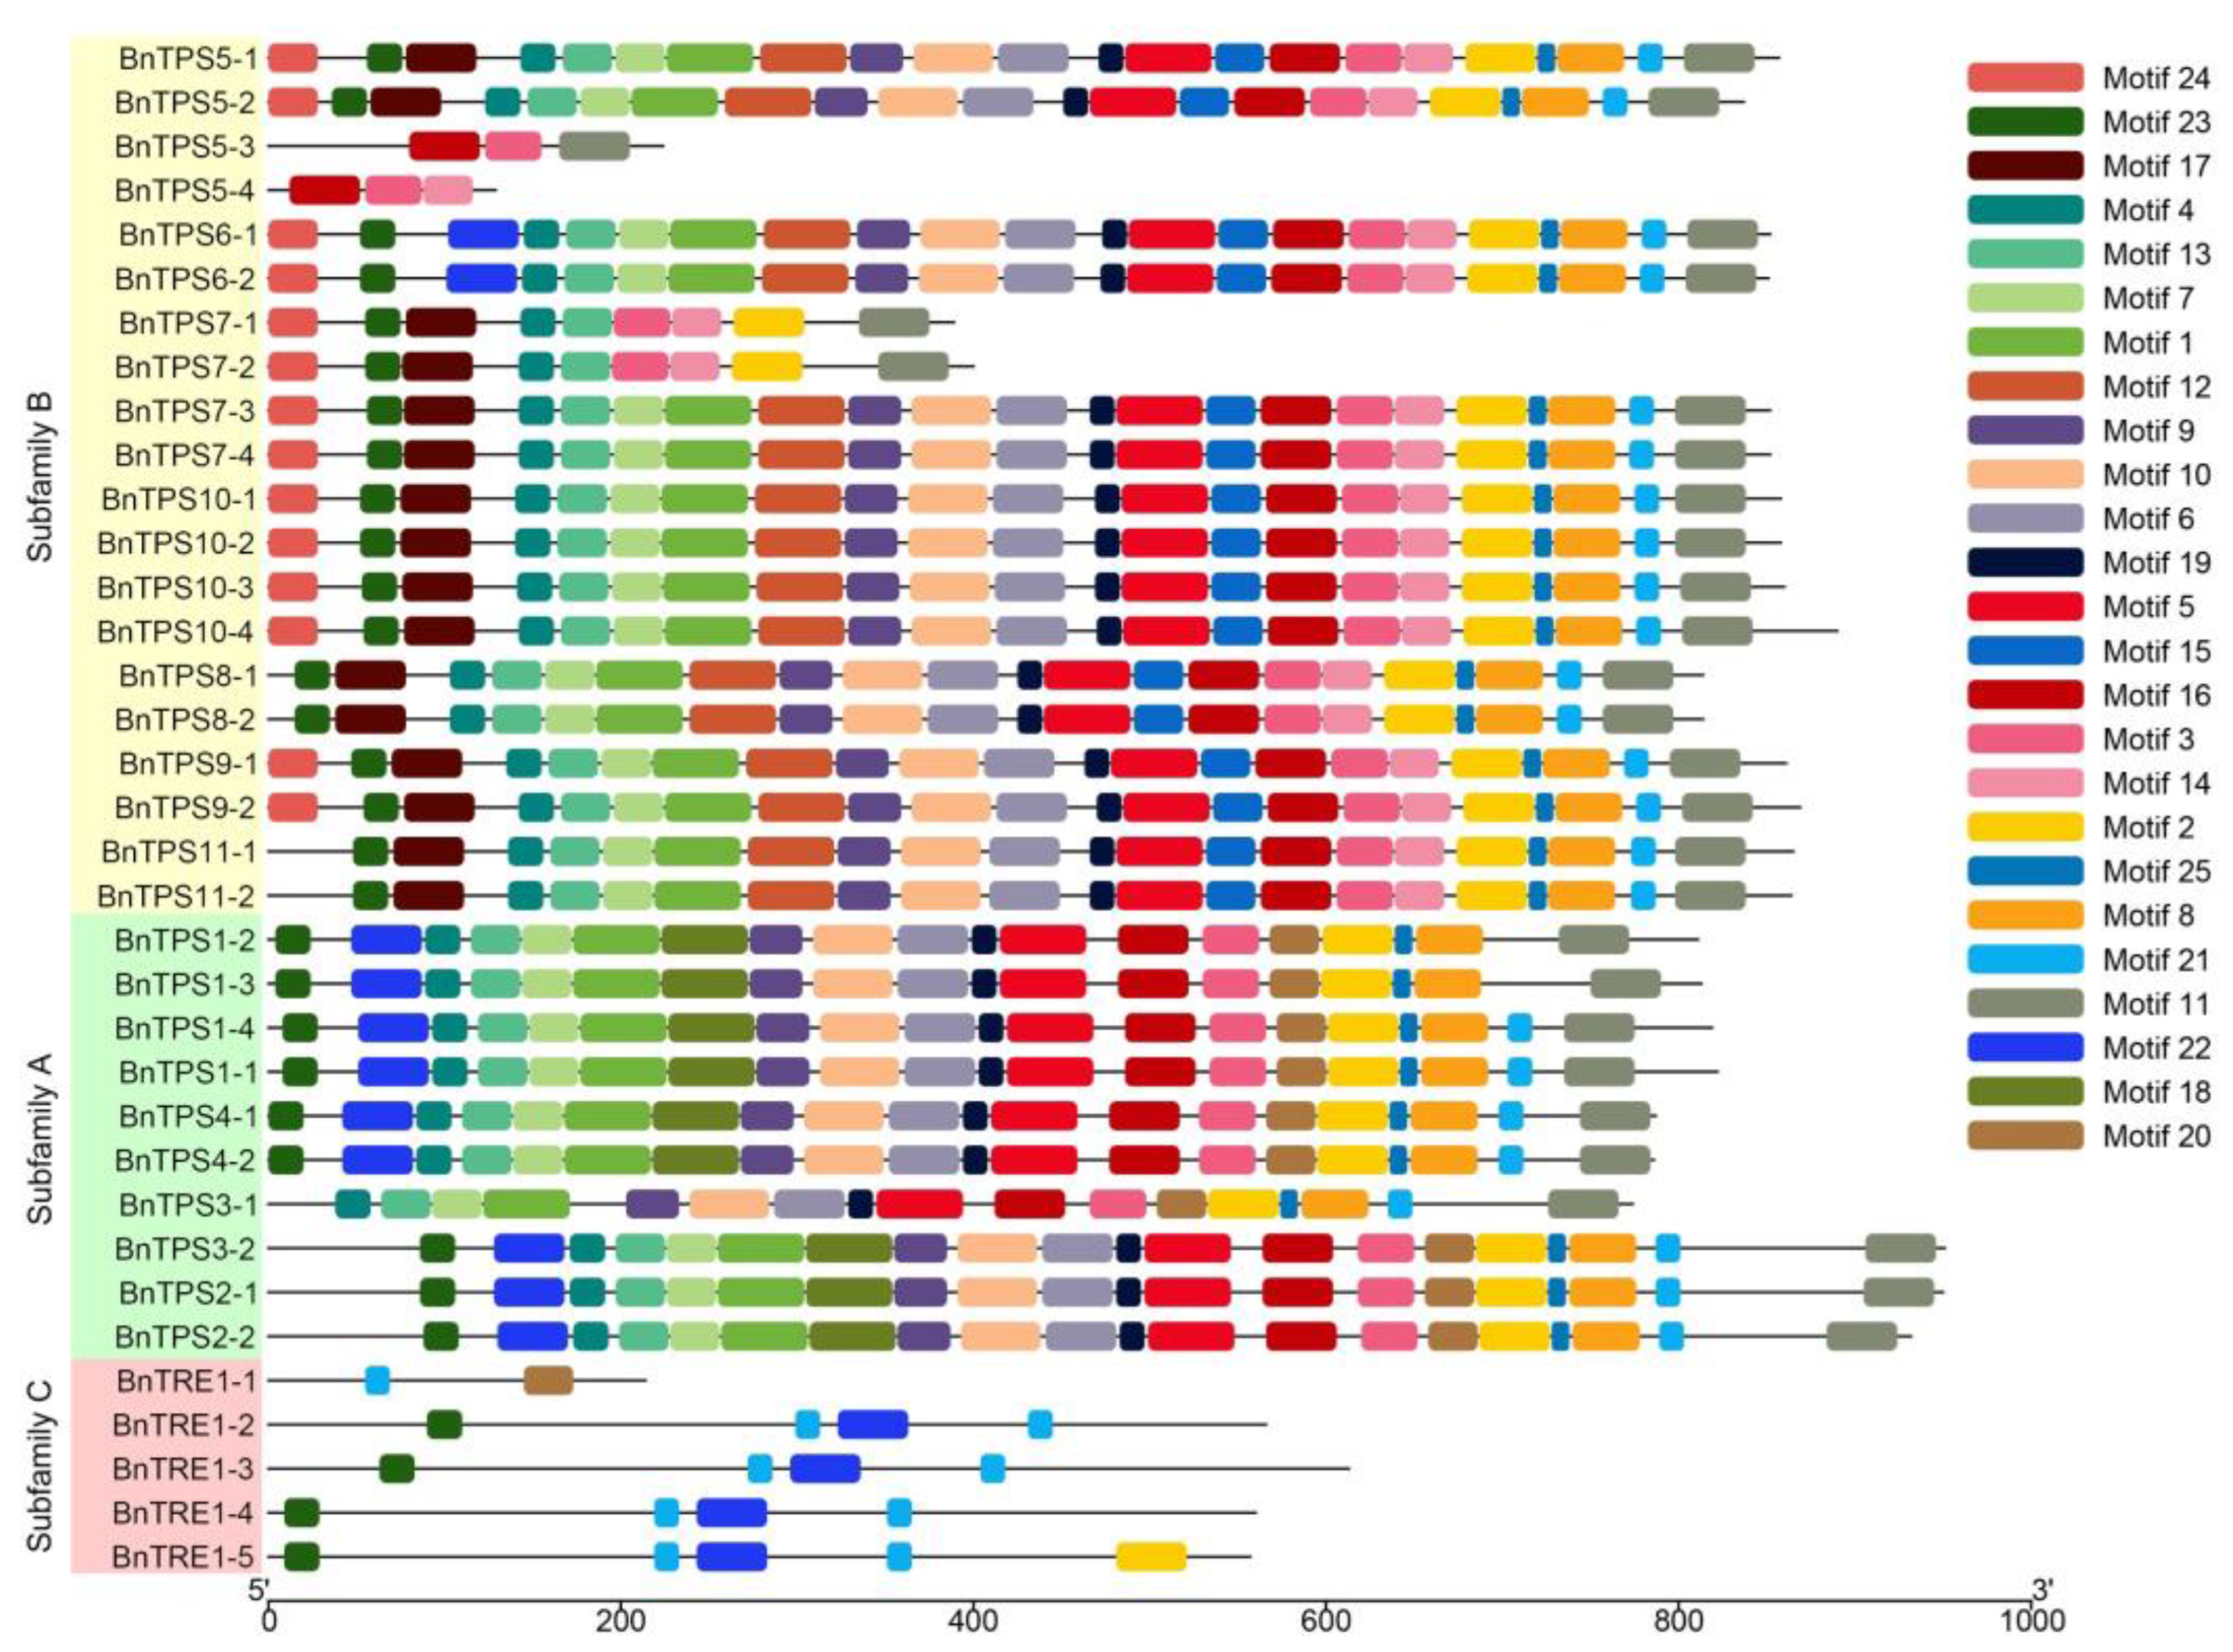
2.3. Chromosomal Localization, Gene Structures, and Protein Profiles of BnTPSs
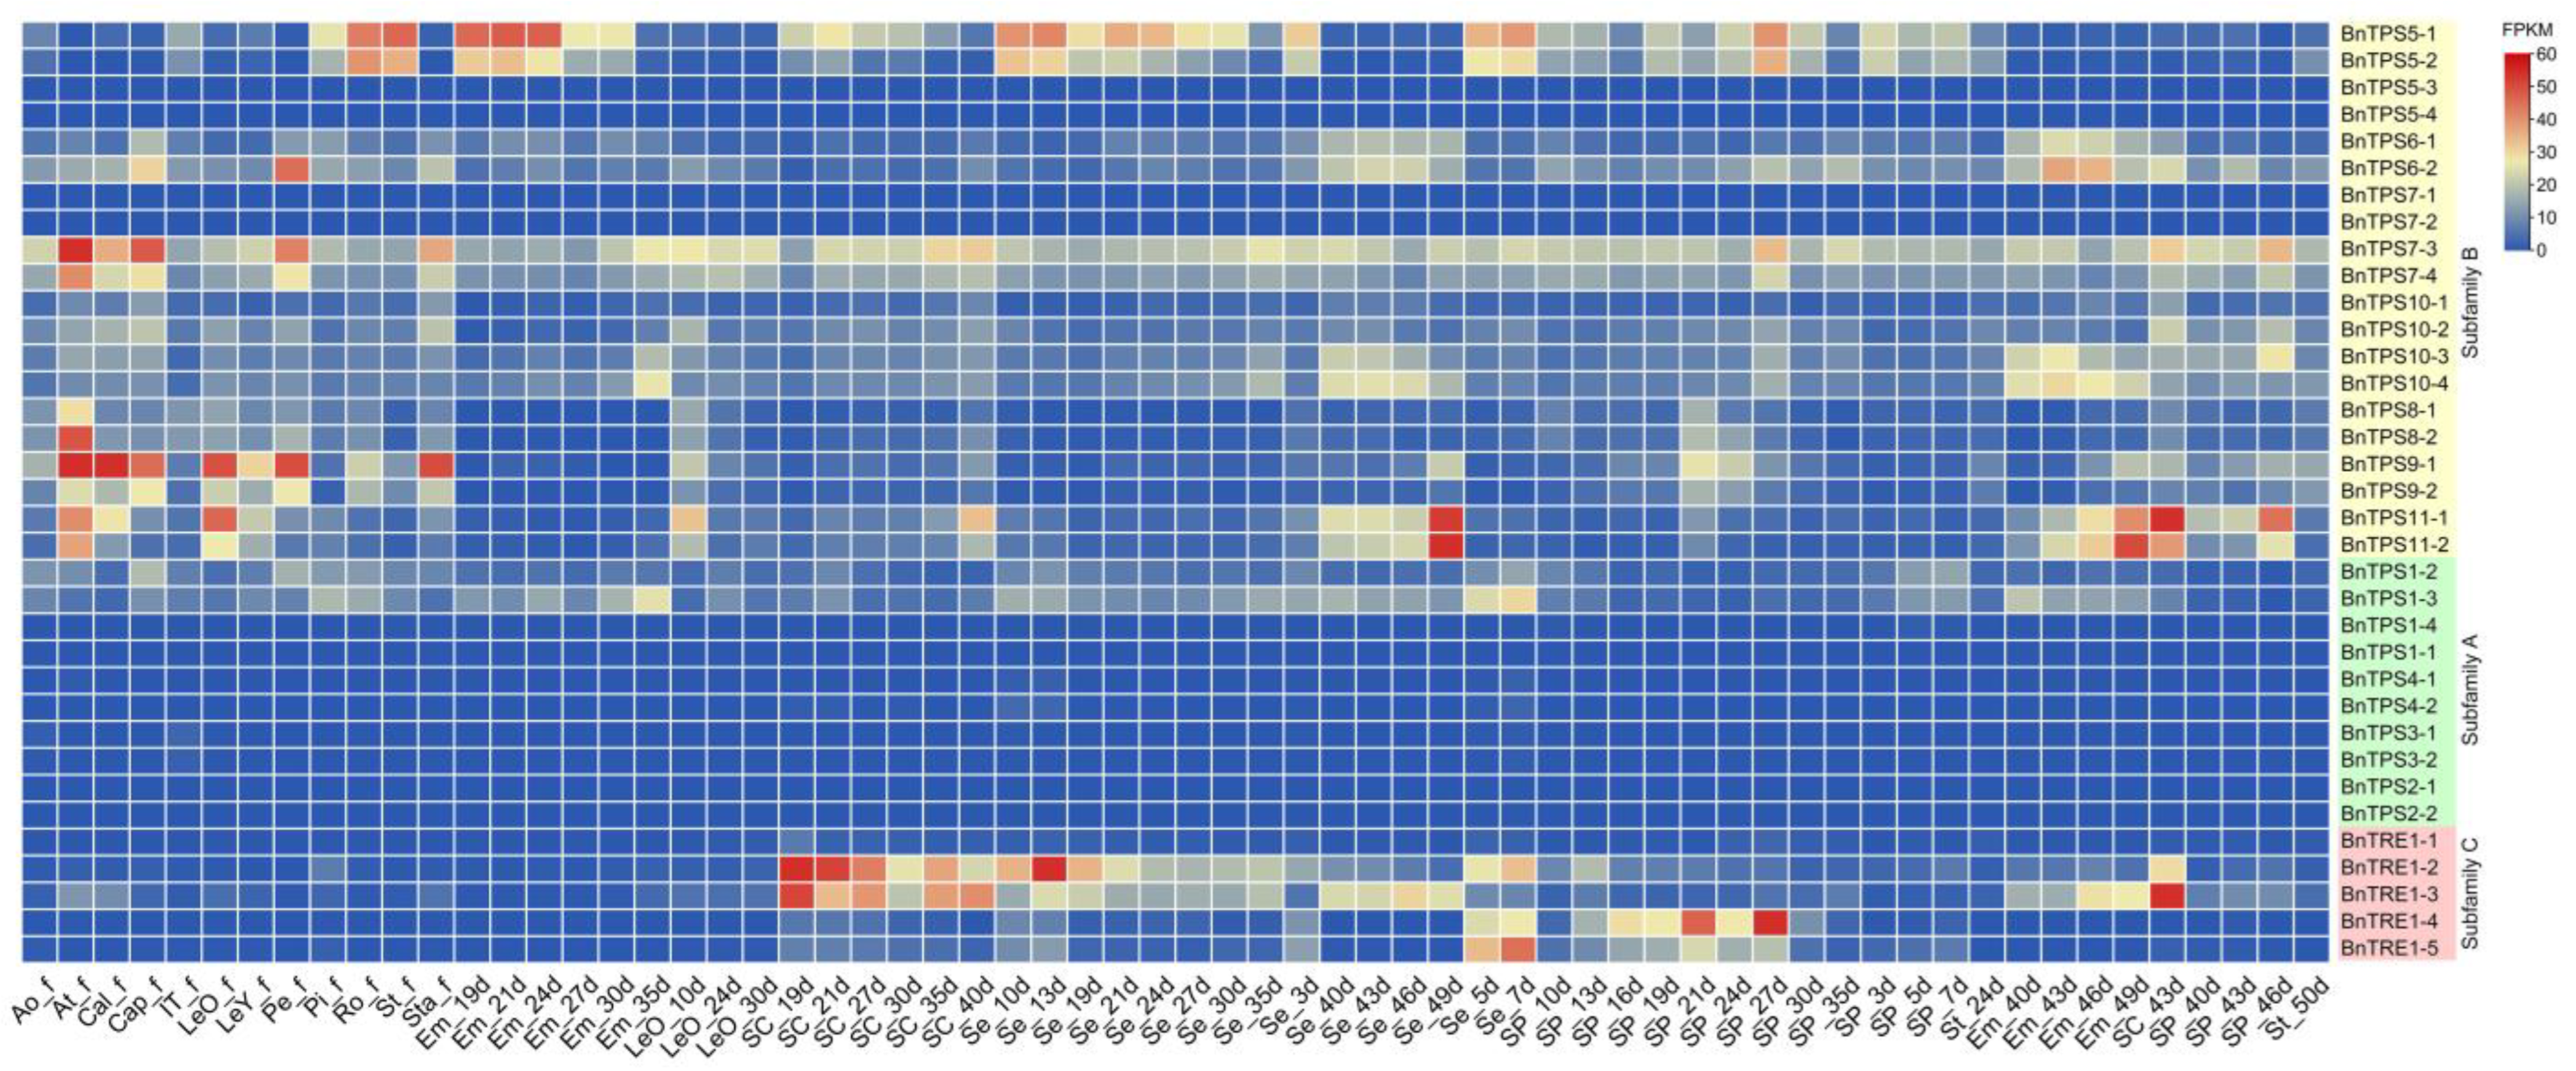
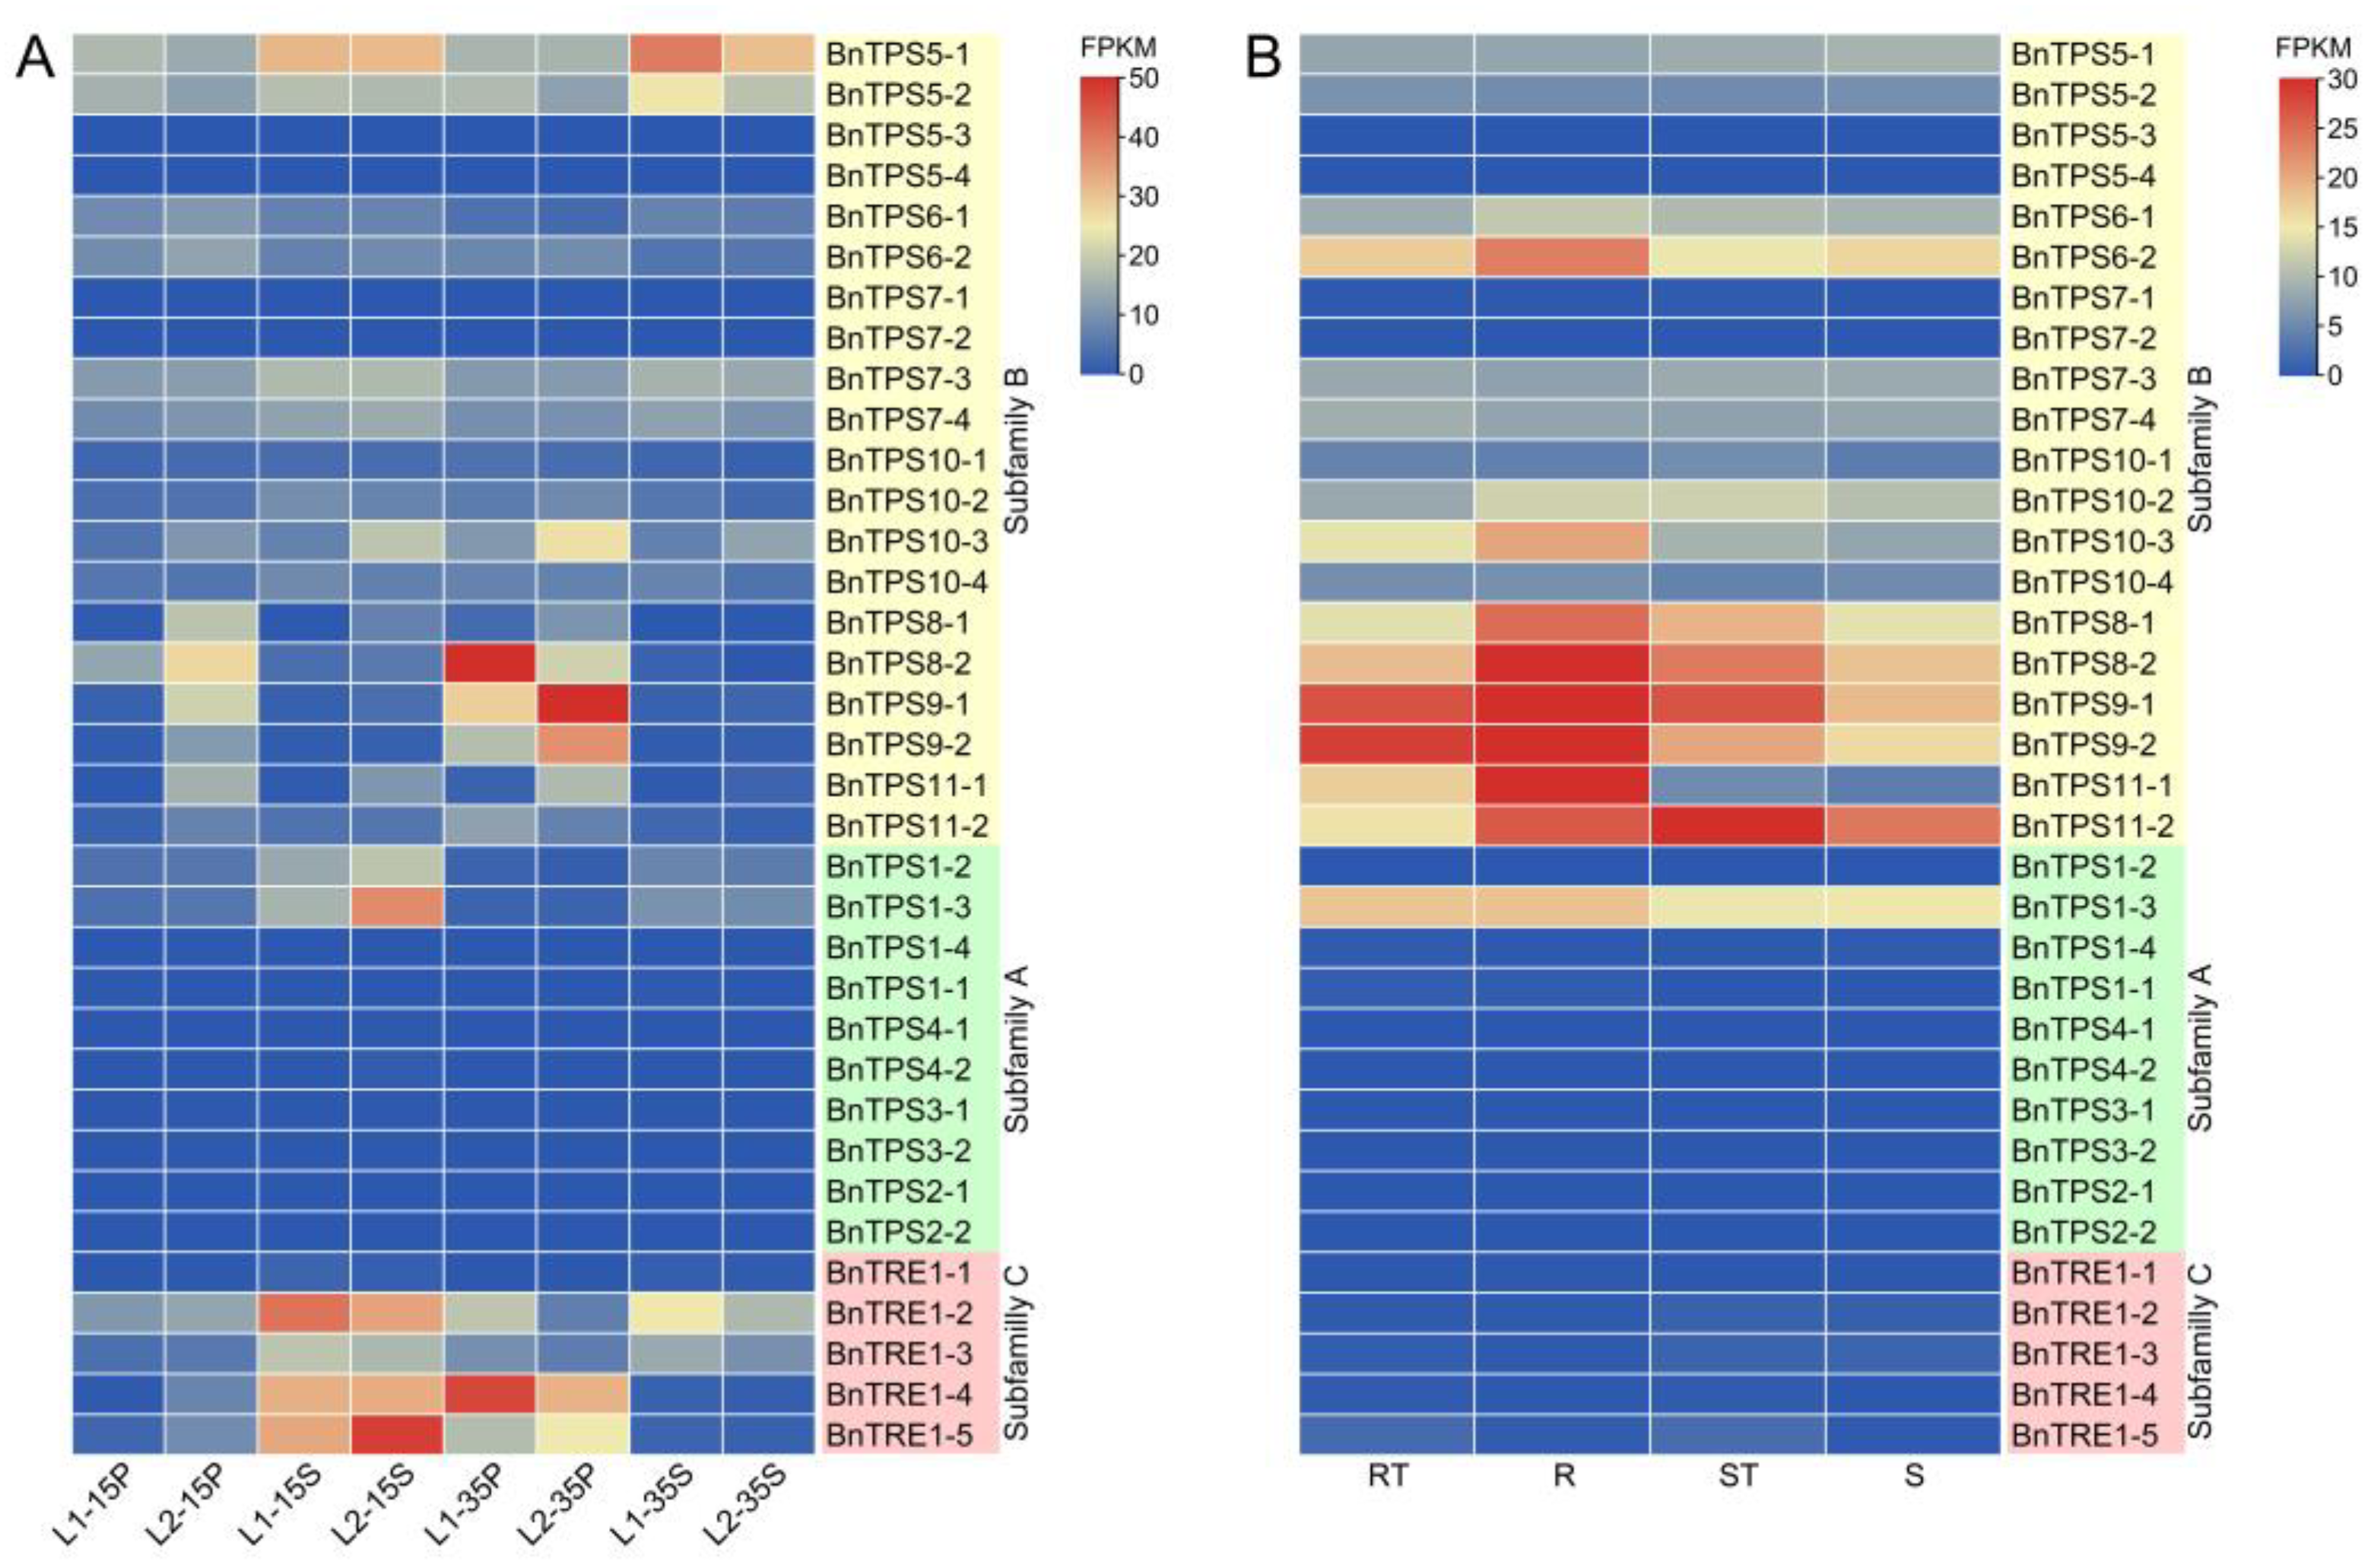
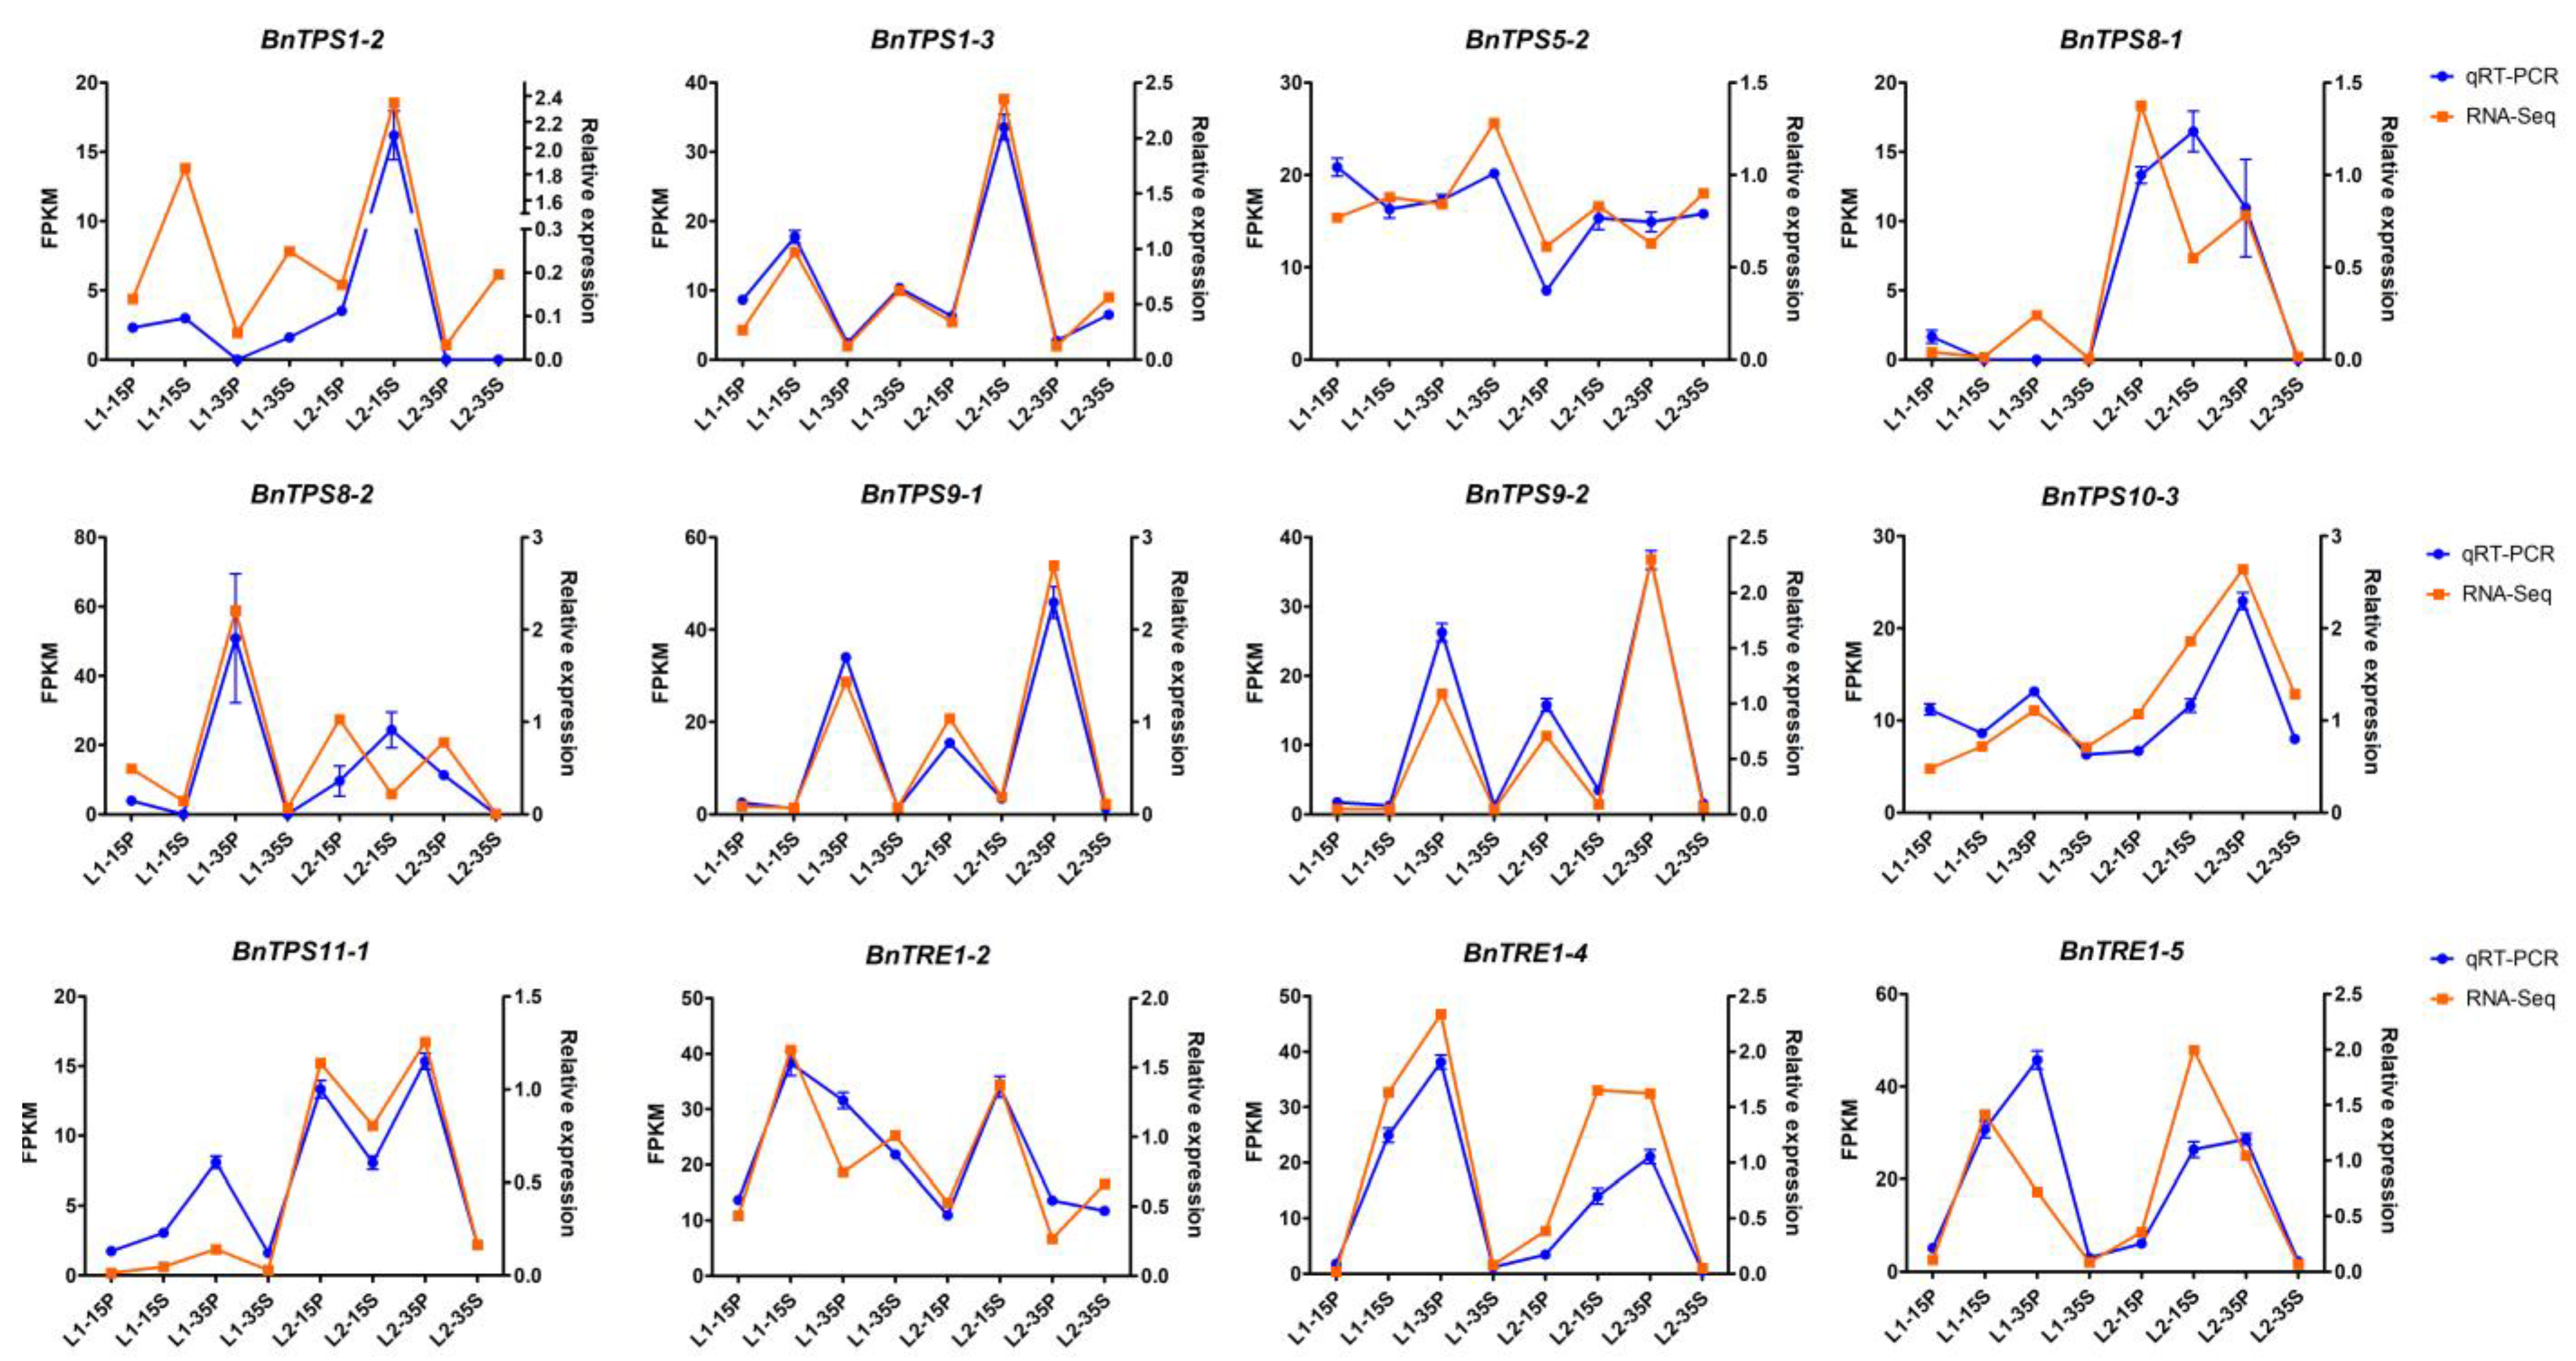
2.4. RNA-Seq Analysis and qRT-PCR Verification of the Major Candidate BnTPSs
3. Discussion
3.1. Genome-Wide Identification and Phylogenetic and Syntenic Analysis of TPSs
3.2. Expression Pattern Analysis and Functional Prediction of BnTPSs
4. Materials and Methods
4.1. Identification of TPSs in B. napus, B. rapa, and B. oleracea
4.2. Multiple Sequence Alignment and Phylogenetic and Syntenic Analysis
4.3. Chromosomal Locations, Gene Structures, and Conserved Motifs of BnTPSs
4.4. Plant Materials and Phenotyping
4.5. RNA-Seq Analysis and qRT-PCR Verification
5. Conclusions
Supplementary Materials
Author Contributions
Funding
Institutional Review Board Statement
Informed Consent Statement
Data Availability Statement
Conflicts of Interest
References
- Xu, Y.; Wang, Y.; Mattson, N.; Yang, L.; Jin, Q. Genome-wide analysis of the Solanum tuberosum (potato) trehalose-6-phosphate synthase (TPS) gene family: Evolution and differential expression during development and stress. BMC Genom. 2017, 18, 926. [Google Scholar] [CrossRef] [PubMed] [Green Version]
- Lunn, J.E.; Delorge, I.; Figueroa, C.M.; Van Dijck, P.; Stitt, M. Trehalose metabolism in plants. Plant J. 2014, 79, 544–567. [Google Scholar] [CrossRef] [PubMed]
- Elbein, A.D.; Pan, Y.T.; Pastuszak, I.; Carroll, D. New insights on trehalose: A multifunctional molecule. Glycobiology 2003, 13, 17R–27R. [Google Scholar] [CrossRef] [PubMed]
- Chary, S.N.; Hicks, G.R.; Choi, Y.G.; Carter, D.; Raikhel, N.V. Trehalose-6-phosphate synthase/phosphatase regulates cell shape and plant architecture in Arabidopsis. Plant Physiol. 2008, 146, 97–107. [Google Scholar] [CrossRef] [PubMed] [Green Version]
- Garg, A.K.; Kim, J.K.; Owens, T.G.; Ranwala, A.P.; Choi, Y.D.; Kochian, L.V.; Wu, R.J. Trehalose accumulation in rice plants confers high tolerance levels to different abiotic stresses. Proc. Natl. Acad. Sci. USA 2002, 99, 15898–15903. [Google Scholar] [CrossRef] [Green Version]
- Goddijn, O.J.; van Dun, K. Trehalose metabolism in plants. Trends Plant Sci. 1999, 4, 315–319. [Google Scholar] [CrossRef]
- Cai, Z.; Peng, G.; Cao, Y.; Liu, Y.; Jin, K.; Xia, Y. Trehalose-6-phosphate synthase 1 from Metarhizium anisopliae: Clone, expression and properties of the recombinant. J. Biosci. Bioeng. 2009, 107, 499–505. [Google Scholar] [CrossRef]
- Lopez, M.F.; Manner, P.; Willmann, A.; Hampp, R.; Nehls, U. Increased trehalose biosynthesis in Hartig net hyphae of ectomycorrhizas. New Phytol. 2007, 174, 389–398. [Google Scholar] [CrossRef]
- Gibson, R.P.; Tarling, C.A.; Roberts, S.; Withers, S.G.; Davies, G.J. The donor subsite of trehalose-6-phosphate synthase: Binary complexes with UDP-glucose and UDP-2-deoxy-2-fluoro-glucose at 2 A resolution. J. Biol. Chem. 2004, 279, 1950–1955. [Google Scholar] [CrossRef] [Green Version]
- van Dijken, A.J.H.; Schluepmann, H.; Smeekens, S.C.M. Arabidopsis trehalose-6-phosphate synthase 1 is essential for normal vegetative growth and transition to flowering. Plant Physiol. 2004, 135, 969–977. [Google Scholar] [CrossRef] [Green Version]
- Ramon, M.; De Smet, I.; Vandesteene, L.; Naudts, M.; Leyman, B.; Van Dijck, P.; Rolland, F.; Beeckman, T.; Thevelein, J.M. Extensive expression regulation and lack of heterologous enzymatic activity of the Class II trehalose metabolism proteins from Arabidopsis thaliana. Plant Cell. Environ. 2009, 32, 1015–1032. [Google Scholar] [CrossRef] [PubMed]
- Glinski, M.; Weckwerth, W. Differential multisite phosphorylation of the trehalose-6-phosphate synthase gene family in Arabidopsis thaliana: A mass spectrometry-based process for multiparallel peptide library phosphorylation analysis. Mol. Cell. Proteom. 2005, 4, 1614–1625. [Google Scholar] [CrossRef] [PubMed] [Green Version]
- Vandesteene, L.; Ramon, M.; Le Roy, K.; Van Dijck, P.; Rolland, F. A single active trehalose-6-P synthase (TPS) and a family of putative regulatory TPS-like proteins in Arabidopsis. Mol. Plant 2010, 3, 406–419. [Google Scholar] [CrossRef] [PubMed]
- Lunn, J.E. Gene families and evolution of trehalose metabolism in plants. Funct. Plant Biol. 2007, 34, 550–563. [Google Scholar] [CrossRef] [PubMed]
- Yang, H.L.; Liu, Y.J.; Wang, C.L.; Zeng, Q.Y. Molecular evolution of trehalose-6-phosphate synthase (TPS) gene family in Populus, Arabidopsis and Rice. PLoS ONE 2012, 7, e42438. [Google Scholar] [CrossRef] [PubMed]
- Zang, B.; Li, H.; Li, W.; Deng, X.W.; Wang, X. Analysis of trehalose-6-phosphate synthase (TPS) gene family suggests the formation of TPS complexes in rice. Plant Mol. Biol. 2011, 76, 507–522. [Google Scholar] [CrossRef]
- Du, L.; Qi, S.; Ma, J.; Xing, L.; Fan, S.; Zhang, S.; Li, Y.; Shen, Y.; Zhang, D.; Han, M. Identification of TPS family members in apple (Malus × domestica Borkh.) and the effect of sucrose sprays on TPS expression and floral induction. Plant Physiol. Biochem. 2017, 120, 10–23. [Google Scholar] [CrossRef]
- Mu, M.; Lu, X.K.; Wang, J.J.; Wang, D.L.; Yin, Z.J.; Wang, S.; Fan, W.L.; Ye, W.W. Genome-wide identification and analysis of the stress-resistance function of the TPS (Trehalose-6-Phosphate Synthase) gene family in cotton. BMC Genet. 2016, 17, 54. [Google Scholar]
- Xie, D.W.; Wang, X.N.; Fu, L.S.; Sun, J.; Zheng, W.; Li, Z.F. Identification of the trehalose-6-phosphate synthase gene family in winter wheat and expression analysis under conditions of freezing stress. J. Genet. 2015, 94, 55–65. [Google Scholar] [CrossRef]
- Blazquez, M.A.; Santos, E.; Flores, C.L.; Martinez-Zapater, J.M.; Salinas, J.; Gancedo, C. Isolation and molecular characterization of the Arabidopsis TPS1 gene, encoding trehalose-6-phosphate synthase. Plant J. 1998, 13, 685–689. [Google Scholar] [CrossRef]
- Satoh-Nagasawa, N.; Nagasawa, N.; Malcomber, S.; Sakai, H.; Jackson, D. A trehalose metabolic enzyme controls inflorescence architecture in maize. Nature 2006, 441, 227–230. [Google Scholar] [CrossRef]
- Paul, M.; Pellny, T.; Goddijn, O. Enhancing photosynthesis with sugar signals. Trends Plant Sci. 2001, 6, 197–200. [Google Scholar] [CrossRef] [PubMed]
- Romero, C.; Belles, J.M.; Vaya, J.L.; Serrano, R.; Culianez-Macia, F.A. Expression of the yeast trehalose-6-phosphate synthase gene in transgenic tobacco plants: Pleiotropic phenotypes include drought tolerance. Planta 1997, 201, 293–297. [Google Scholar] [CrossRef]
- Jang, I.C.; Oh, S.J.; Seo, J.S.; Choi, W.B.; Song, S.I.; Kim, C.H.; Kim, Y.S.; Seo, H.S.; Choi, Y.D.; Nahm, B.H.; et al. Expression of a bifunctional fusion of the Escherichia coli genes for trehalose-6-phosphate synthase and trehalose-6-phosphate phosphatase in transgenic rice plants increases trehalose accumulation and abiotic stress tolerance without stunting growth. Plant Physiol. 2003, 131, 516–524. [Google Scholar] [CrossRef] [PubMed] [Green Version]
- Avonce, N.; Leyman, B.; Mascorro-Gallardo, J.O.; Van Dijck, P.; Thevelein, J.M.; Iturriaga, G. The Arabidopsis trehalose-6-P synthase AtTPS1 gene is a regulator of glucose, abscisic acid, and stress signaling. Plant Physiol. 2004, 136, 3649–3659. [Google Scholar] [CrossRef] [PubMed] [Green Version]
- Gomez, L.D.; Baud, S.; Gilday, A.; Li, Y.; Graham, I.A. Delayed embryo development in the ARABIDOPSIS TREHALOSE-6-PHOSPHATE SYNTHASE 1 mutant is associated with altered cell wall structure, decreased cell division and starch accumulation. Plant J. 2006, 46, 69–84. [Google Scholar] [CrossRef] [PubMed]
- Gomez, L.D.; Gilday, A.; Feil, R.; Lunn, J.E.; Graham, I.A. AtTPS1-mediated trehalose 6-phosphate synthesis is essential for embryogenic and vegetative growth and responsiveness to ABA in germinating seeds and stomatal guard cells. Plant J. 2010, 64, 1–13. [Google Scholar] [CrossRef] [PubMed]
- Zentella, R.; Mascorro-Gallardo, J.O.; Van Dijck, P.; Folch-Mallol, J.; Bonini, B.; Van Vaeck, C.; Gaxiola, R.; Covarrubias, A.A.; Nieto-Sotelo, J.; Thevelein, J.M.; et al. A Selaginella lepidophylla trehalose-6-phosphate synthase complements growth and stress-tolerance defects in a yeast tps1 mutant. Plant Physiol. 1999, 119, 1473–1482. [Google Scholar] [CrossRef] [PubMed] [Green Version]
- Stiller, I.; Dulai, S.; Kondrak, M.; Tarnai, R.; Szabo, L.; Toldi, O.; Banfalvi, Z. Effects of drought on water content and photosynthetic parameters in potato plants expressing the trehalose-6-phosphate synthase gene of Saccharomyces cerevisiae. Planta 2008, 227, 299–308. [Google Scholar] [CrossRef]
- Jian, H.J.; Lu, K.; Yang, B.; Wang, T.Y.; Zhang, L.; Zhang, A.X.; Wang, J.; Liu, L.Z.; Qu, C.M.; Li, J.N. Genome-wide analysis and expression profiling of the SUC and SWEET gene families of sucrose transporters in oilseed rape (Brassica napus L.). Front. Plant Sci. 2016, 7, 1464. [Google Scholar] [CrossRef] [Green Version]
- Zhang, L.; Yang, B.; Zhang, C.; Chen, H.; Xu, J.; Qu, C.; Lu, K.; Li, J. Genome-wide identification and posttranscriptional regulation analyses elucidate roles of key argonautes and their miRNA triggers in regulating complex yield traits in rapeseed. Int. J. Mol. Sci. 2023, 24, 2543. [Google Scholar] [CrossRef] [PubMed]
- Cheng, F.; Wu, J.; Wang, X.W. Genome triplication drove the diversification of Brassica plants. Hortic. Res.-Engl. 2014, 1, 14024. [Google Scholar] [CrossRef] [PubMed] [Green Version]
- Zhang, L.Y.; Zhang, C.; Yang, B.; Xiao, Z.C.; Ma, J.Q.; Liu, J.S.; Jian, H.J.; Qu, C.M.; Lu, K.; Li, J.N. Genome-wide identification and expression profiling of monosaccharide transporter genes associated with high harvest index values in rapeseed (Brassica napus L.). Genes 2020, 11, 653. [Google Scholar] [CrossRef] [PubMed]
- Wang, X.W.; Wang, H.Z.; Wang, J.; Sun, R.F.; Wu, J.; Liu, S.Y.; Bai, Y.Q.; Mun, J.H.; Bancroft, I.; Cheng, F.; et al. The genome of the mesopolyploid crop species Brassica rapa. Nat. Genet. 2011, 43, U1035–U1157. [Google Scholar] [CrossRef] [PubMed] [Green Version]
- Arias, T.; Beilstein, M.A.; Tang, M.; McKain, M.R.; Pires, J.C. Diversification times among Brassica (Brassicaceae) crops suggest hybrid formation after 20 million years of divergence. Am. J. Bot. 2014, 101, 86–91. [Google Scholar] [CrossRef] [PubMed]
- Wei, L.; Yang, B.; Jian, H.; Zhang, A.; Liu, R.; Zhu, Y.; Ma, J.; Shi, X.; Wang, R.; Li, J.; et al. Genome-wide identification and characterization of Gretchen Hagen3 (GH3) family genes in Brassica napus. Genome 2019, 62, 597–608. [Google Scholar] [CrossRef]
- Liu, P.; Zhang, C.; Ma, J.Q.; Zhang, L.Y.; Yang, B.; Tang, X.Y.; Huang, L.; Zhou, X.T.; Lu, K.; Li, J.N. Genome-wide identification and expression profiling of cytokinin oxidase/dehydrogenase (CKX) genes reveal likely roles in pod development and stress responses in oilseed rape (Brassica napus L.). Genes 2018, 9, 168. [Google Scholar] [CrossRef] [Green Version]
- Xue, Y.F.; Chen, B.J.; Wang, R.; Win, A.N.; Li, J.N.; Chai, Y.R. Genome-wide survey and characterization of fatty acid desaturase gene family in Brassica napus and its parental species. Appl. Biochem. Biotech. 2018, 184, 582–598. [Google Scholar] [CrossRef]
- Wei, L.J.; Zhu, Y.; Liu, R.Y.; Zhang, A.X.; Zhu, M.C.; Xu, W.; Lin, A.; Lu, K.; Li, J.N. Genome wide identification and comparative analysis of glutathione transferases (GST) family genes in Brassica napus. Sci. Rep. 2019, 9, 9196. [Google Scholar] [CrossRef] [Green Version]
- Mun, J.H.; Kwon, S.J.; Yang, T.J.; Seol, Y.J.; Jin, M.; Kim, J.A.; Lim, M.H.; Kim, J.S.; Baek, S.; Choi, B.S.; et al. Genome-wide comparative analysis of the Brassica rapa gene space reveals genome shrinkage and differential loss of duplicated genes after whole genome triplication. Genome Biol. 2009, 10, R111. [Google Scholar] [CrossRef] [Green Version]
- Ma, J.Q.; Jian, H.J.; Yang, B.; Lu, K.; Zhang, A.X.; Liu, P.; Li, J.N. Genome-wide analysis and expression profiling of the GRF gene family in oilseed rape (Brassica napus L.). Gene 2017, 620, 36–45. [Google Scholar] [CrossRef]
- Moghe, G.D.; Hufnagel, D.E.; Tang, H.B.; Xiao, Y.L.; Dworkin, I.; Town, C.D.; Conner, J.K.; Shiu, S.H. Consequences of whole-genome triplication as revealed by comparative genomic analyses of the wild radish Raphanus raphanistrum and three other Brassicaceae species. Plant Cell. 2014, 26, 1925–1937. [Google Scholar] [CrossRef] [PubMed] [Green Version]
- Xu, G.; Guo, C.; Shan, H.; Kong, H. Divergence of duplicate genes in exon-intron structure. Proc. Natl. Acad. Sci. USA 2012, 109, 1187–1192. [Google Scholar] [CrossRef] [PubMed] [Green Version]
- Morabito, C.; Secchi, F.; Schubert, A. Grapevine TPS (trehalose-6-phosphate synthase) family genes are differentially regulated during development, upon sugar treatment and drought stress. Plant Physiol. Bioch. 2021, 164, 54–62. [Google Scholar] [CrossRef] [PubMed]
- Yang, Y.J.; Ma, K.F.; Zhang, T.X.; Li, L.L.; Wang, J.; Cheng, T.R.; Zhang, Q.X. Characteristics and expression analyses of trehalose-6-phosphate synthase family in Prunus mume reveal genes involved in trehalose biosynthesis and drought response. Biomolecules 2020, 10, 1358. [Google Scholar] [CrossRef] [PubMed]
- Chao, H.; Li, T.; Luo, C.; Huang, H.; Ruan, Y.; Li, X.; Niu, Y.; Fan, Y.; Sun, W.; Zhang, K.; et al. BrassicaEDB: A gene expression database for Brassica crops. Int. J. Mol. Sci. 2020, 21, 5831. [Google Scholar] [CrossRef]
- Wang, P.; Yang, C.; Chen, H.; Song, C.; Zhang, X.; Wang, D. Transcriptomic basis for drought-resistance in Brassica napus L. Sci. Rep. 2017, 7, 40532. [Google Scholar] [CrossRef] [Green Version]
- Paul, M.J.; Watson, A.; Griffiths, C.A. Trehalose 6-phosphate signalling and impact on crop yield. Biochem. Soc. Trans. 2020, 48, 2127–2137. [Google Scholar] [CrossRef]
- Lyra, D.H.; Griffiths, C.A.; Watson, A.; Joynson, R.; Molero, G.; Igna, A.A.; Hassani-Pak, K.; Reynolds, M.P.; Hall, A.; Paul, M.J. Gene-based mapping of trehalose biosynthetic pathway genes reveals association with source- and sink-related yield traits in a spring wheat panel. Food Energy Secur. 2021, 10, e292. [Google Scholar] [CrossRef]
- Yuan, G.P.; Liu, J.P.; An, G.L.; Li, W.H.; Si, W.J.; Sun, D.X.; Zhu, Y.C. Genome-wide identification and characterization of the trehalose-6-phosphate synthetase (TPS) gene family in watermelon (Citrullus lanatus) and their transcriptional responses to salt stress. Int. J. Mol. Sci. 2022, 23, 276. [Google Scholar] [CrossRef]
- Swarbreck, D.; Wilks, C.; Lamesch, P.; Berardini, T.Z.; Garcia-Hernandez, M.; Foerster, H.; Li, D.; Meyer, T.; Muller, R.; Ploetz, L.; et al. The Arabidopsis Information Resource (TAIR): Gene structure and function annotation. Nucleic Acids Res. 2008, 36, D10091014. [Google Scholar] [CrossRef]
- Lamesch, P.; Berardini, T.Z.; Li, D.; Swarbreck, D.; Wilks, C.; Sasidharan, R.; Muller, R.; Dreher, K.; Alexander, D.L.; Garcia-Hernandez, M.; et al. The Arabidopsis Information Resource (TAIR): Improved gene annotation and new tools. Nucleic Acids Res. 2012, 40, D1202–D1210. [Google Scholar] [CrossRef]
- Altschul, S.F.; Madden, T.L.; Schaffer, A.A.; Zhang, J.; Zhang, Z.; Miller, W.; Lipman, D.J. Gapped BLAST and PSI-BLAST: A new generation of protein database search programs. Nucleic Acids Res. 1997, 25, 3389–3402. [Google Scholar] [CrossRef] [Green Version]
- Paysan-Lafosse, T.; Blum, M.; Chuguransky, S.; Grego, T.; Pinto, B.L.; Salazar, G.A.; Bileschi, M.L.; Bork, P.; Bridge, A.; Colwell, L.; et al. InterPro in 2022. Nucleic Acids Res. 2023, 51, D418–D427. [Google Scholar] [CrossRef]
- Potter, S.C.; Luciani, A.; Eddy, S.R.; Park, Y.; Lopez, R.; Finn, R.D. HMMER web server: 2018 update. Nucleic Acids Res. 2018, 46, W200–W204. [Google Scholar] [CrossRef] [PubMed] [Green Version]
- Kumar, S.; Stecher, G.; Tamura, K. MEGA7: Molecular evolutionary genetics analysis version 7.0 for bigger datasets. Mol. Biol. Evol. 2016, 33, 1870–1874. [Google Scholar] [CrossRef] [Green Version]
- Chen, C.; Chen, H.; Zhang, Y.; Thomas, H.R.; Frank, M.H.; He, Y.; Xia, R. TBtools: An integrative toolkit developed for interactive analyses of big biological data. Mol. Plant 2020, 13, 1194–1202. [Google Scholar] [CrossRef]
- Chalhoub, B.; Denoeud, F.; Liu, S.; Parkin, I.A.; Tang, H.; Wang, X.; Chiquet, J.; Belcram, H.; Tong, C.; Samans, B.; et al. Plant genetics. Early allopolyploid evolution in the post-Neolithic Brassica napus oilseed genome. Science 2014, 345, 950–953. [Google Scholar] [CrossRef] [PubMed] [Green Version]
- Voorrips, R.E. MapChart: Software for the graphical presentation of linkage maps and QTLs. J. Hered. 2002, 93, 77–78. [Google Scholar] [CrossRef] [PubMed] [Green Version]
- Hu, B.; Jin, J.; Guo, A.Y.; Zhang, H.; Luo, J.; Gao, G. GSDS 2.0: An upgraded gene feature visualization server. Bioinformatics 2015, 31, 1296–1297. [Google Scholar] [CrossRef] [Green Version]
- Bailey, T.L.; Boden, M.; Buske, F.A.; Frith, M.; Grant, C.E.; Clementi, L.; Ren, J.; Li, W.W.; Noble, W.S. MEME SUITE: Tools for motif discovery and searching. Nucleic Acids Res. 2009, 37, W202–W208. [Google Scholar] [CrossRef] [PubMed]
- Bailey, T.L.; Williams, N.; Misleh, C.; Li, W.W. MEME: Discovering and analyzing DNA and protein sequence motifs. Nucleic Acids Res. 2006, 34, W369–W373. [Google Scholar] [CrossRef] [PubMed]
- Gasteiger, E.; Gattiker, A.; Hoogland, C.; Ivanyi, I.; Appel, R.D.; Bairoch, A. ExPASy: The proteomics server for in-depth protein knowledge and analysis. Nucleic Acids Res. 2003, 31, 3784–3788. [Google Scholar] [CrossRef] [Green Version]
- Hoglund, A.; Donnes, P.; Blum, T.; Adolph, H.W.; Kohlbacher, O. MultiLoc: Prediction of protein subcellular localization using N-terminal targeting sequences, sequence motifs and amino acid composition. Bioinformatics 2006, 22, 1158–1165. [Google Scholar] [CrossRef] [Green Version]
- Qu, C.; Fu, F.; Liu, M.; Zhao, H.; Liu, C.; Li, J.; Tang, Z.; Xu, X.; Qiu, X.; Wang, R.; et al. Comparative transcriptome analysis of recessive male sterility (RGMS) in sterile and fertile Brassica napus lines. PLoS ONE 2015, 10, e0144118. [Google Scholar] [CrossRef] [PubMed]
- Singh, V.K.; Mangalam, A.K.; Dwivedi, S.; Naik, S. Primer premier: Program for design of degenerate primers from a protein sequence. Biotechniques 1998, 24, 318–319. [Google Scholar] [CrossRef] [Green Version]
- Chen, H.; Wang, T.; He, X.; Cai, X.; Lin, R.; Liang, J.; Wu, J.; King, G.; Wang, X. BRAD V3.0: An upgraded Brassicaceae database. Nucleic Acids Res. 2022, 50, D1432–D1441. [Google Scholar] [CrossRef]
- Wu, G.; Zhang, L.; Wu, Y.; Cao, Y.; Lu, C. Comparison of five endogenous reference genes for specific PCR detection and quantification of Brassica napus. J. Agric. Food Chem. 2010, 58, 2812–2817. [Google Scholar] [CrossRef]
- Livak, K.J.; Schmittgen, T.D. Analysis of relative gene expression data using real-time quantitative PCR and the 2(T)(-Delta Delta C) method. Methods 2001, 25, 402–408. [Google Scholar] [CrossRef]
- Swift, M.L. GraphPad prism, data analysis, and scientific graphing. J. Chem. Inf. Comp. Sci. 1997, 37, 411–412. [Google Scholar] [CrossRef]


| Gene ID (At) | Gene Name (At) | Gene ID (Bra) | Gene ID (Bol) | Gene ID (BnaA) | Gene ID (BnaC) |
|---|---|---|---|---|---|
| AT1G78580 | AtTPS1 | Bra035049 | Bol027474 | BnaA02g18920D | BnaC06g39000D |
| Bra008366 | Bol018953 | BnaA07g34230D | BnaC02g25020D | ||
| AT1G16980 | AtTPS2 | Bra026011 | —— | BnaA06g11450D | BnaC05g13090D |
| AT1G17000 | AtTPS3 | Bra026010 | Bol038272 | BnaA06g11460D | BnaC05g13110D |
| AT4G27550 | AtTPS4 | Bra019043 | Bol042340 | BnaA03g48650D | BnaC07g50330D |
| AT4G17770 | AtTPS5 | Bra012642 | Bol037106 | BnaA03g43320D | BnaC07g34770D |
| Bra040180 | Bol019698 | BnaAnng13570D | —— | ||
| —— | —— | BnaA01g08660D | —— | ||
| AT1G68020 | AtTPS6 | Bra004054 | Bol027823 | BnaA07g24830D | BnaC06g26160D |
| AT1G06410 | AtTPS7 | Bra015497 | Bol041057 | BnaA10g04170D | BnaC05g04390D |
| Bra030651 | Bol023345 | BnaA08g28610D | BnaC08g01800D | ||
| AT1G70290 | AtTPS8 | Bra007906 | —— | BnaA02g14790D | BnaC02g19750D |
| AT1G23870 | AtTPS9 | Bra016328 | Bol008681 | BnaA08g20280D | BnaC08g06450D |
| AT1G60140 | AtTPS10 | Bra031526 | Bol036586 | BnaA01g22200D | BnaC01g43070D |
| Bra017888 | —— | BnaA03g54540D | BnaCnng41250D | ||
| AT2G18700 | AtTPS11 | Bra038548 | Bol038270 | BnaA09g09720D | BnaC09g51060D |
| AT4G24040 | AtTRE1 | Bra013756 | Bol009586 | BnaA01g35070D | BnaC03g56490D |
| Bra019249 | Bol042146 | BnaA03g46430D | BnaC01g15870D | ||
| —— | —— | —— | BnaC07g38690D |
| Gene Name | A. thaliana | B. rapa | B. oleracea | B. napus (A) | B. napus (C) |
|---|---|---|---|---|---|
| Two-Copy in B. napus | |||||
| TPS2 | 1 | 1 | 0 | 1 | 1 |
| TPS3 | 1 | 1 | 1 | 1 | 1 |
| TPS4 | 1 | 1 | 1 | 1 | 1 |
| TPS6 | 1 | 1 | 1 | 1 | 1 |
| TPS8 | 1 | 1 | 0 | 1 | 1 |
| TPS9 | 1 | 1 | 1 | 1 | 1 |
| TPS11 | 1 | 1 | 1 | 1 | 1 |
| Four-Copy in B. napus | |||||
| TPS1 | 1 | 2 | 2 | 2 | 2 |
| TPS5 | 1 | 2 | 2 | 3 | 1 |
| TPS7 | 1 | 2 | 2 | 2 | 2 |
| TPS10 | 1 | 2 | 1 | 2 | 2 |
| Five-Copy in B. napus | |||||
| TRE1 | 1 | 2 | 2 | 2 | 3 |
| TOTAL | 12 | 17 | 14 | 18 | 17 |
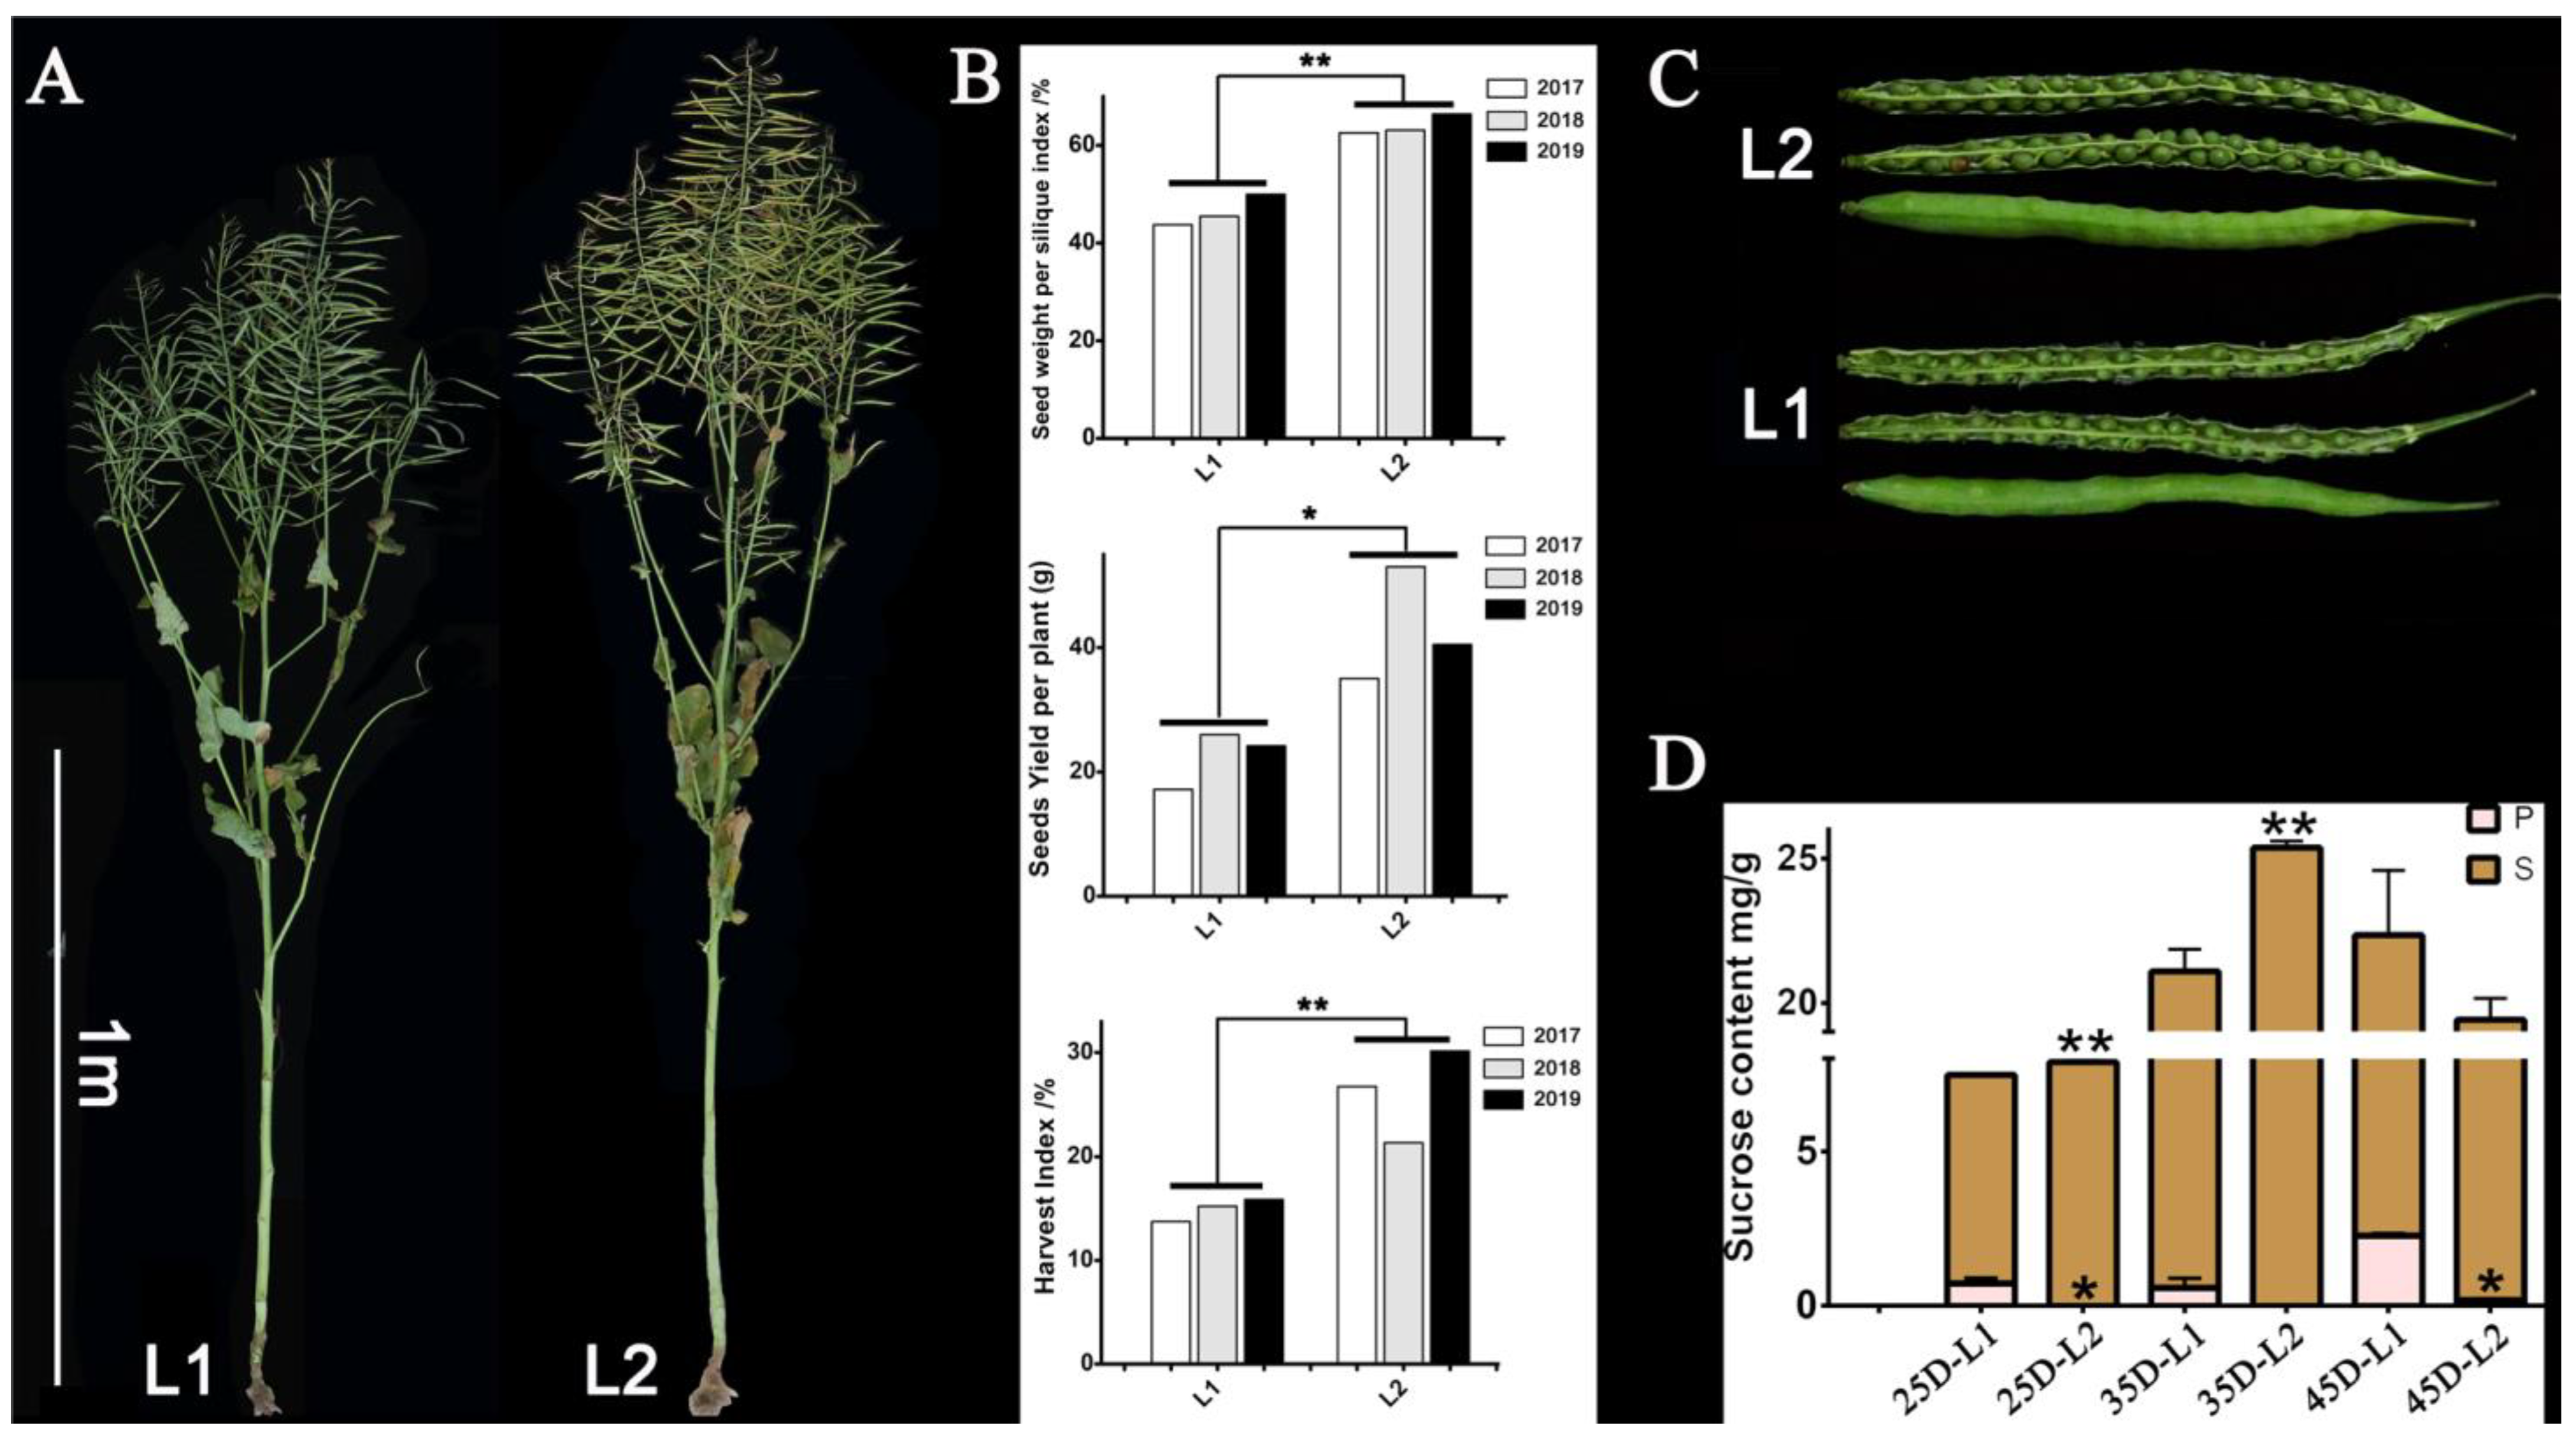
| Trait | Material | 2017 | 2018 | 2019 | Mean Value | SEM | p-Value |
|---|---|---|---|---|---|---|---|
| Seeds weight per silique index/% (SPSI) | L1 | 43.73 | 45.49 | 49.95 | 46.39 | 2.62 | 0.0013 |
| L2 | 62.57 | 63.10 | 66.38 | 64.02 | 1.68 | ||
| Seeds Yield per plant/g (SY) | L1 | 17.19 | 26.00 | 24.20 | 22.46 | 3.80 | 0.0267 |
| L2 | 35.04 | 53.00 | 40.50 | 42.85 | 7.52 | ||
| Harvest index/% (HI) | L1 | 13.75 | 15.24 | 15.89 | 14.96 | 0.90 | 0.0135 |
| L2 | 26.73 | 21.36 | 30.15 | 26.08 | 3.62 |
Disclaimer/Publisher’s Note: The statements, opinions and data contained in all publications are solely those of the individual author(s) and contributor(s) and not of MDPI and/or the editor(s). MDPI and/or the editor(s) disclaim responsibility for any injury to people or property resulting from any ideas, methods, instructions or products referred to in the content. |
© 2023 by the authors. Licensee MDPI, Basel, Switzerland. This article is an open access article distributed under the terms and conditions of the Creative Commons Attribution (CC BY) license (https://creativecommons.org/licenses/by/4.0/).
Share and Cite
Yang, B.; Zhang, L.; Xiang, S.; Chen, H.; Qu, C.; Lu, K.; Li, J. Identification of Trehalose-6-Phosphate Synthase (TPS) Genes Associated with Both Source-/Sink-Related Yield Traits and Drought Response in Rapeseed (Brassica napus L.). Plants 2023, 12, 981. https://doi.org/10.3390/plants12050981
Yang B, Zhang L, Xiang S, Chen H, Qu C, Lu K, Li J. Identification of Trehalose-6-Phosphate Synthase (TPS) Genes Associated with Both Source-/Sink-Related Yield Traits and Drought Response in Rapeseed (Brassica napus L.). Plants. 2023; 12(5):981. https://doi.org/10.3390/plants12050981
Chicago/Turabian StyleYang, Bo, Liyuan Zhang, Sirou Xiang, Huan Chen, Cunmin Qu, Kun Lu, and Jiana Li. 2023. "Identification of Trehalose-6-Phosphate Synthase (TPS) Genes Associated with Both Source-/Sink-Related Yield Traits and Drought Response in Rapeseed (Brassica napus L.)" Plants 12, no. 5: 981. https://doi.org/10.3390/plants12050981