
Eco-Geography and Phenology Are the Major Drivers of Reproductive Isolation in the Royal Irises, a Species Complex in the Course of Speciation

Abstract
:1. Introduction
2. Results
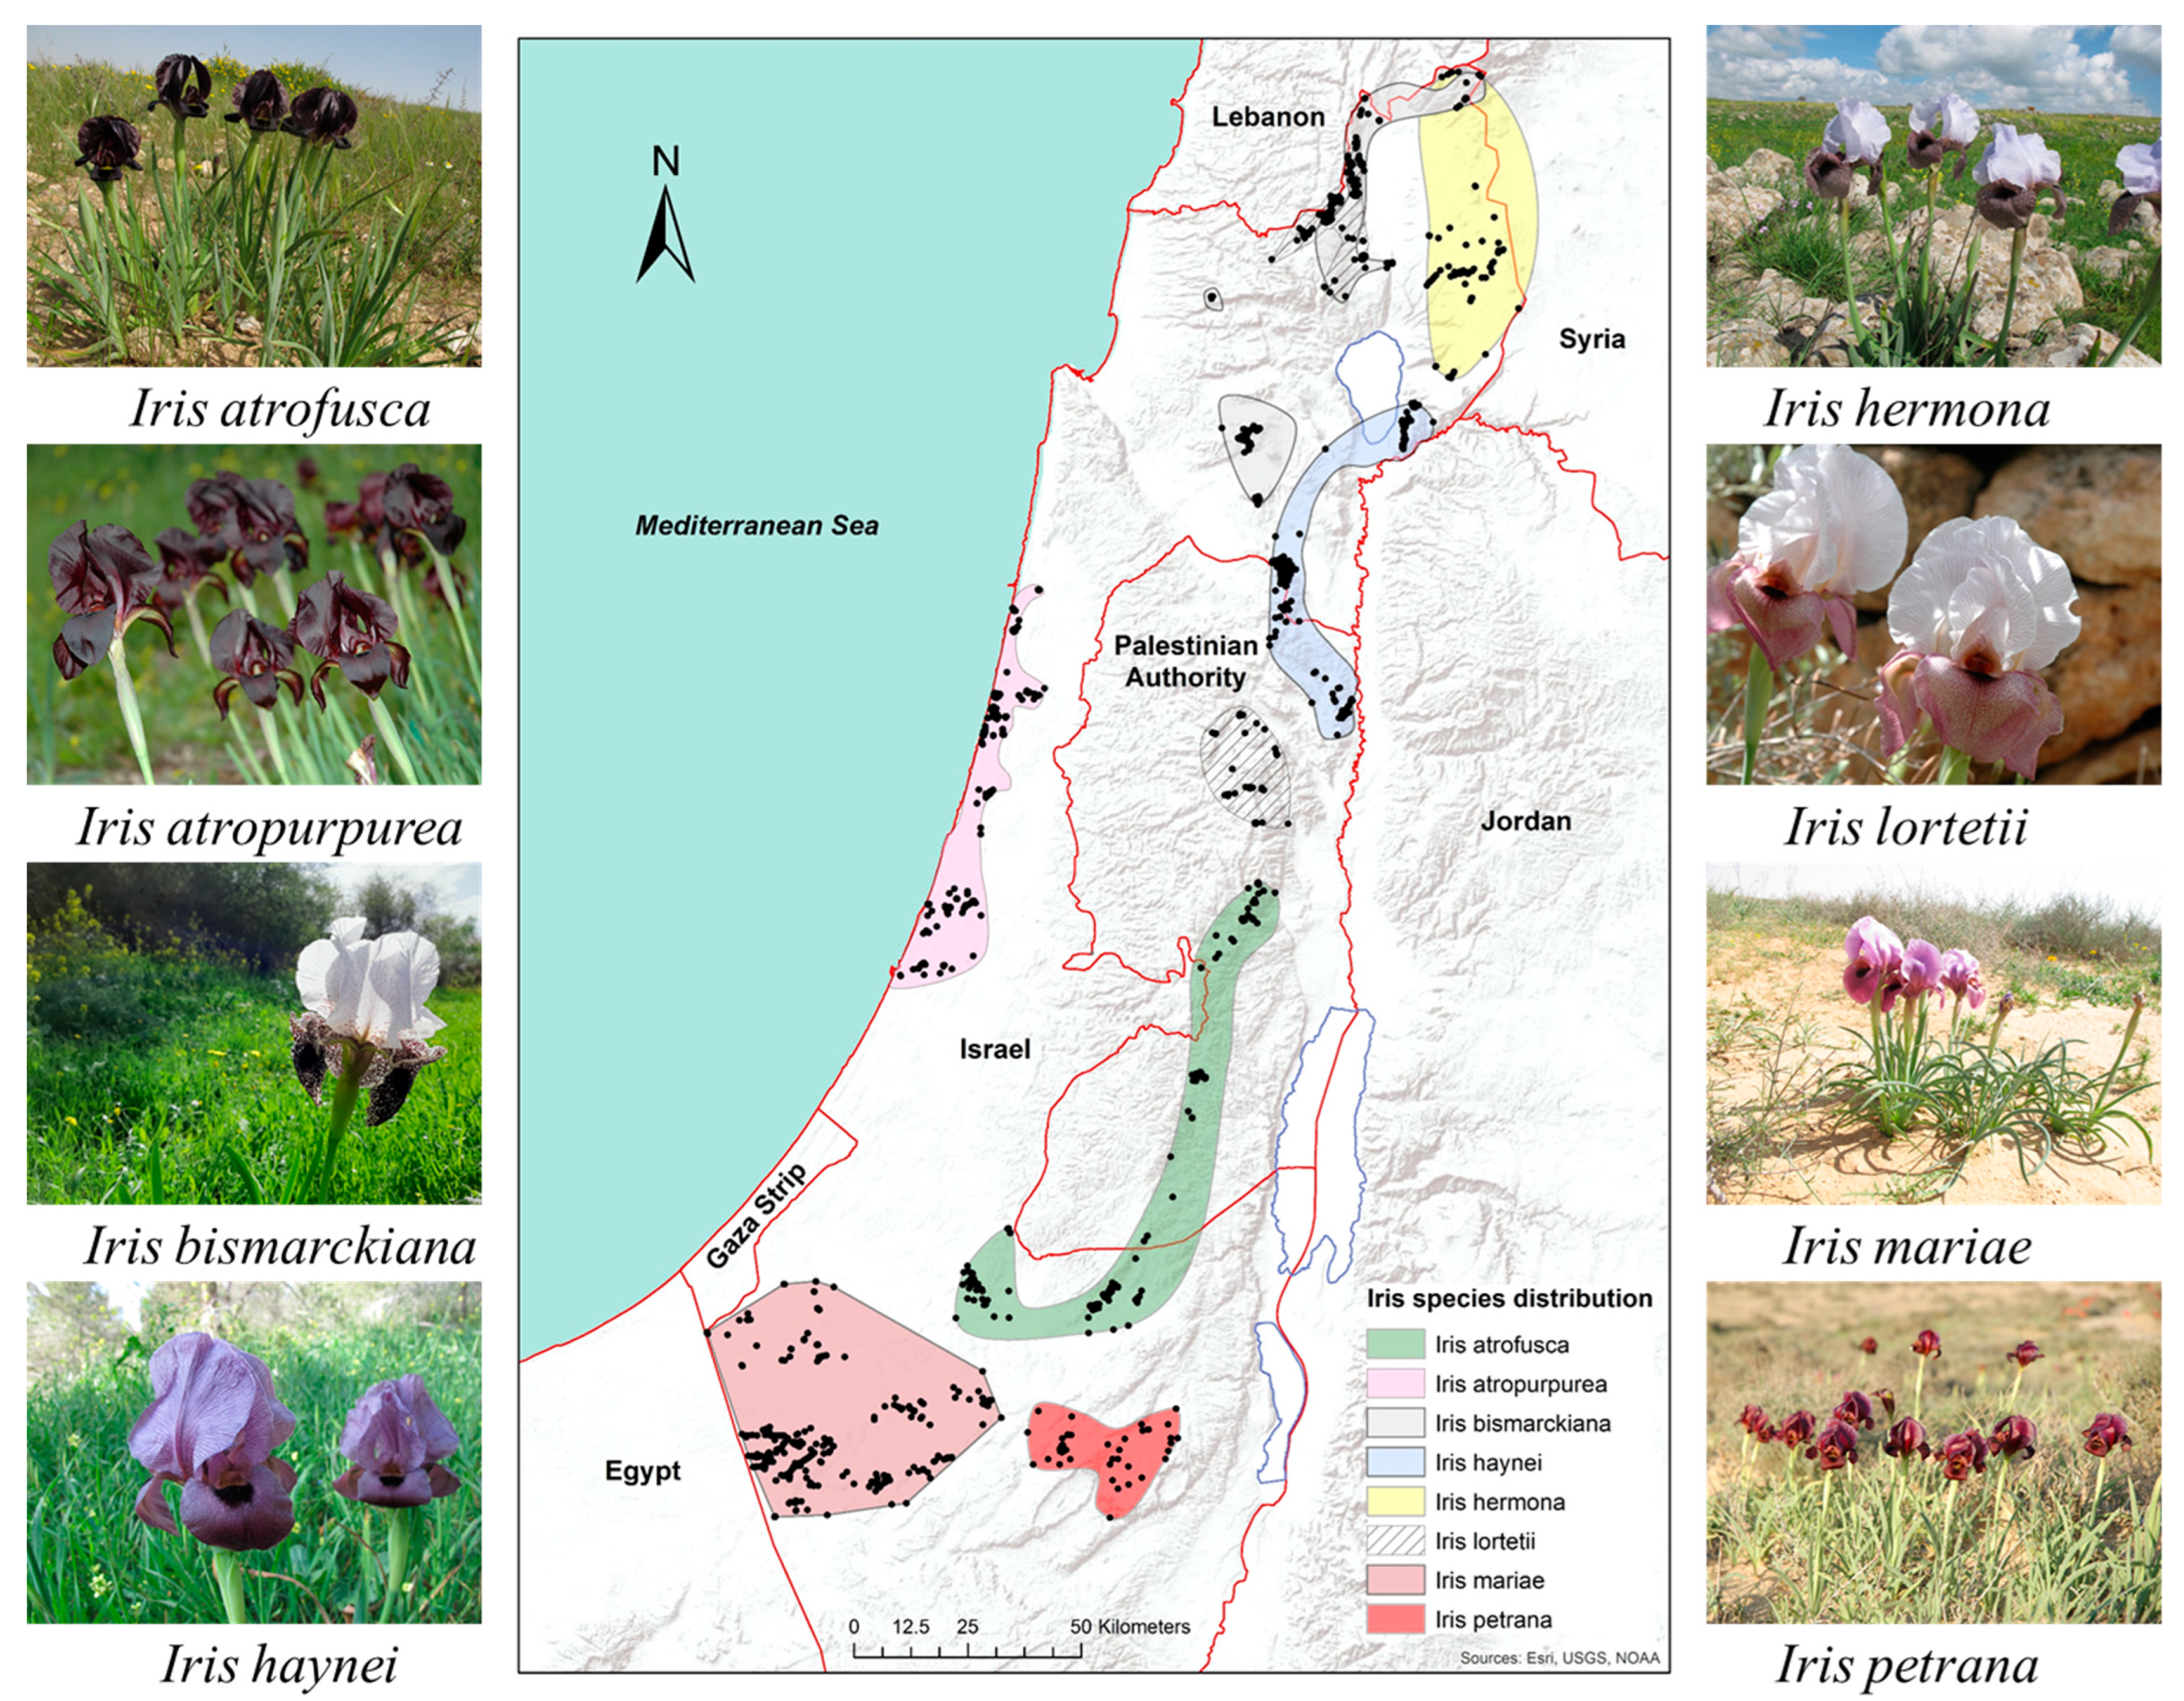
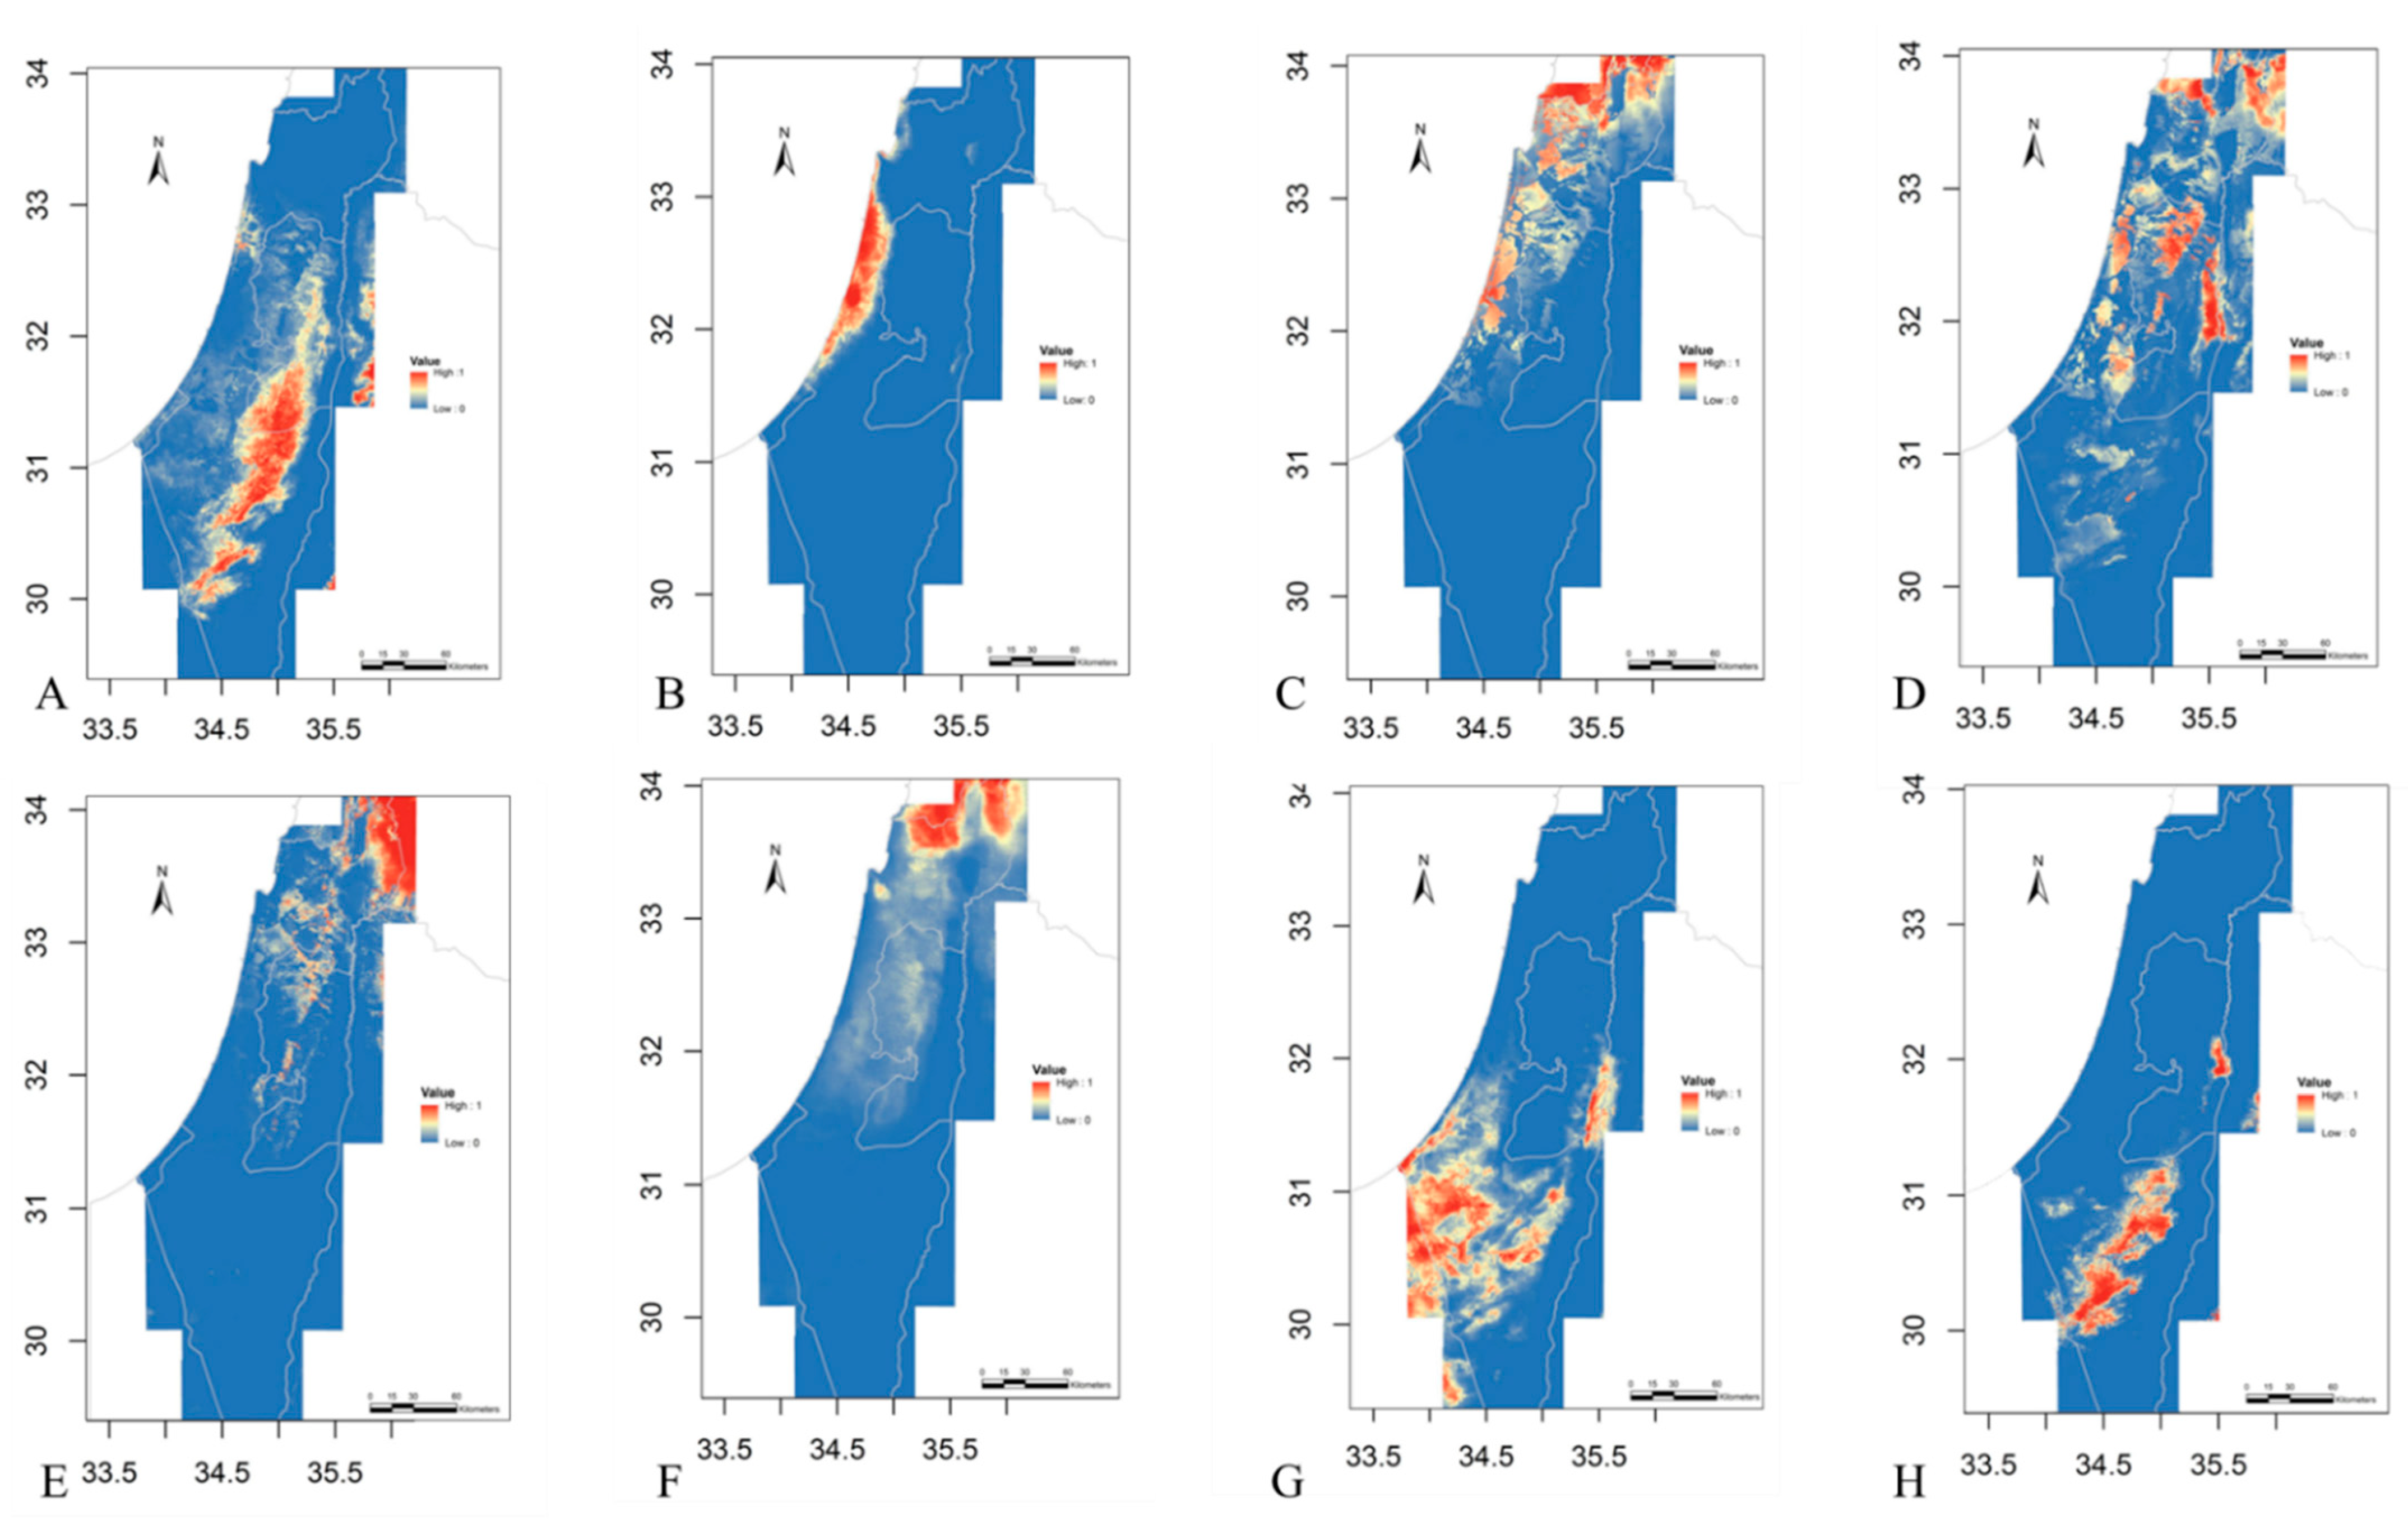
2.1. Eco-Geography
2.2. Phenology
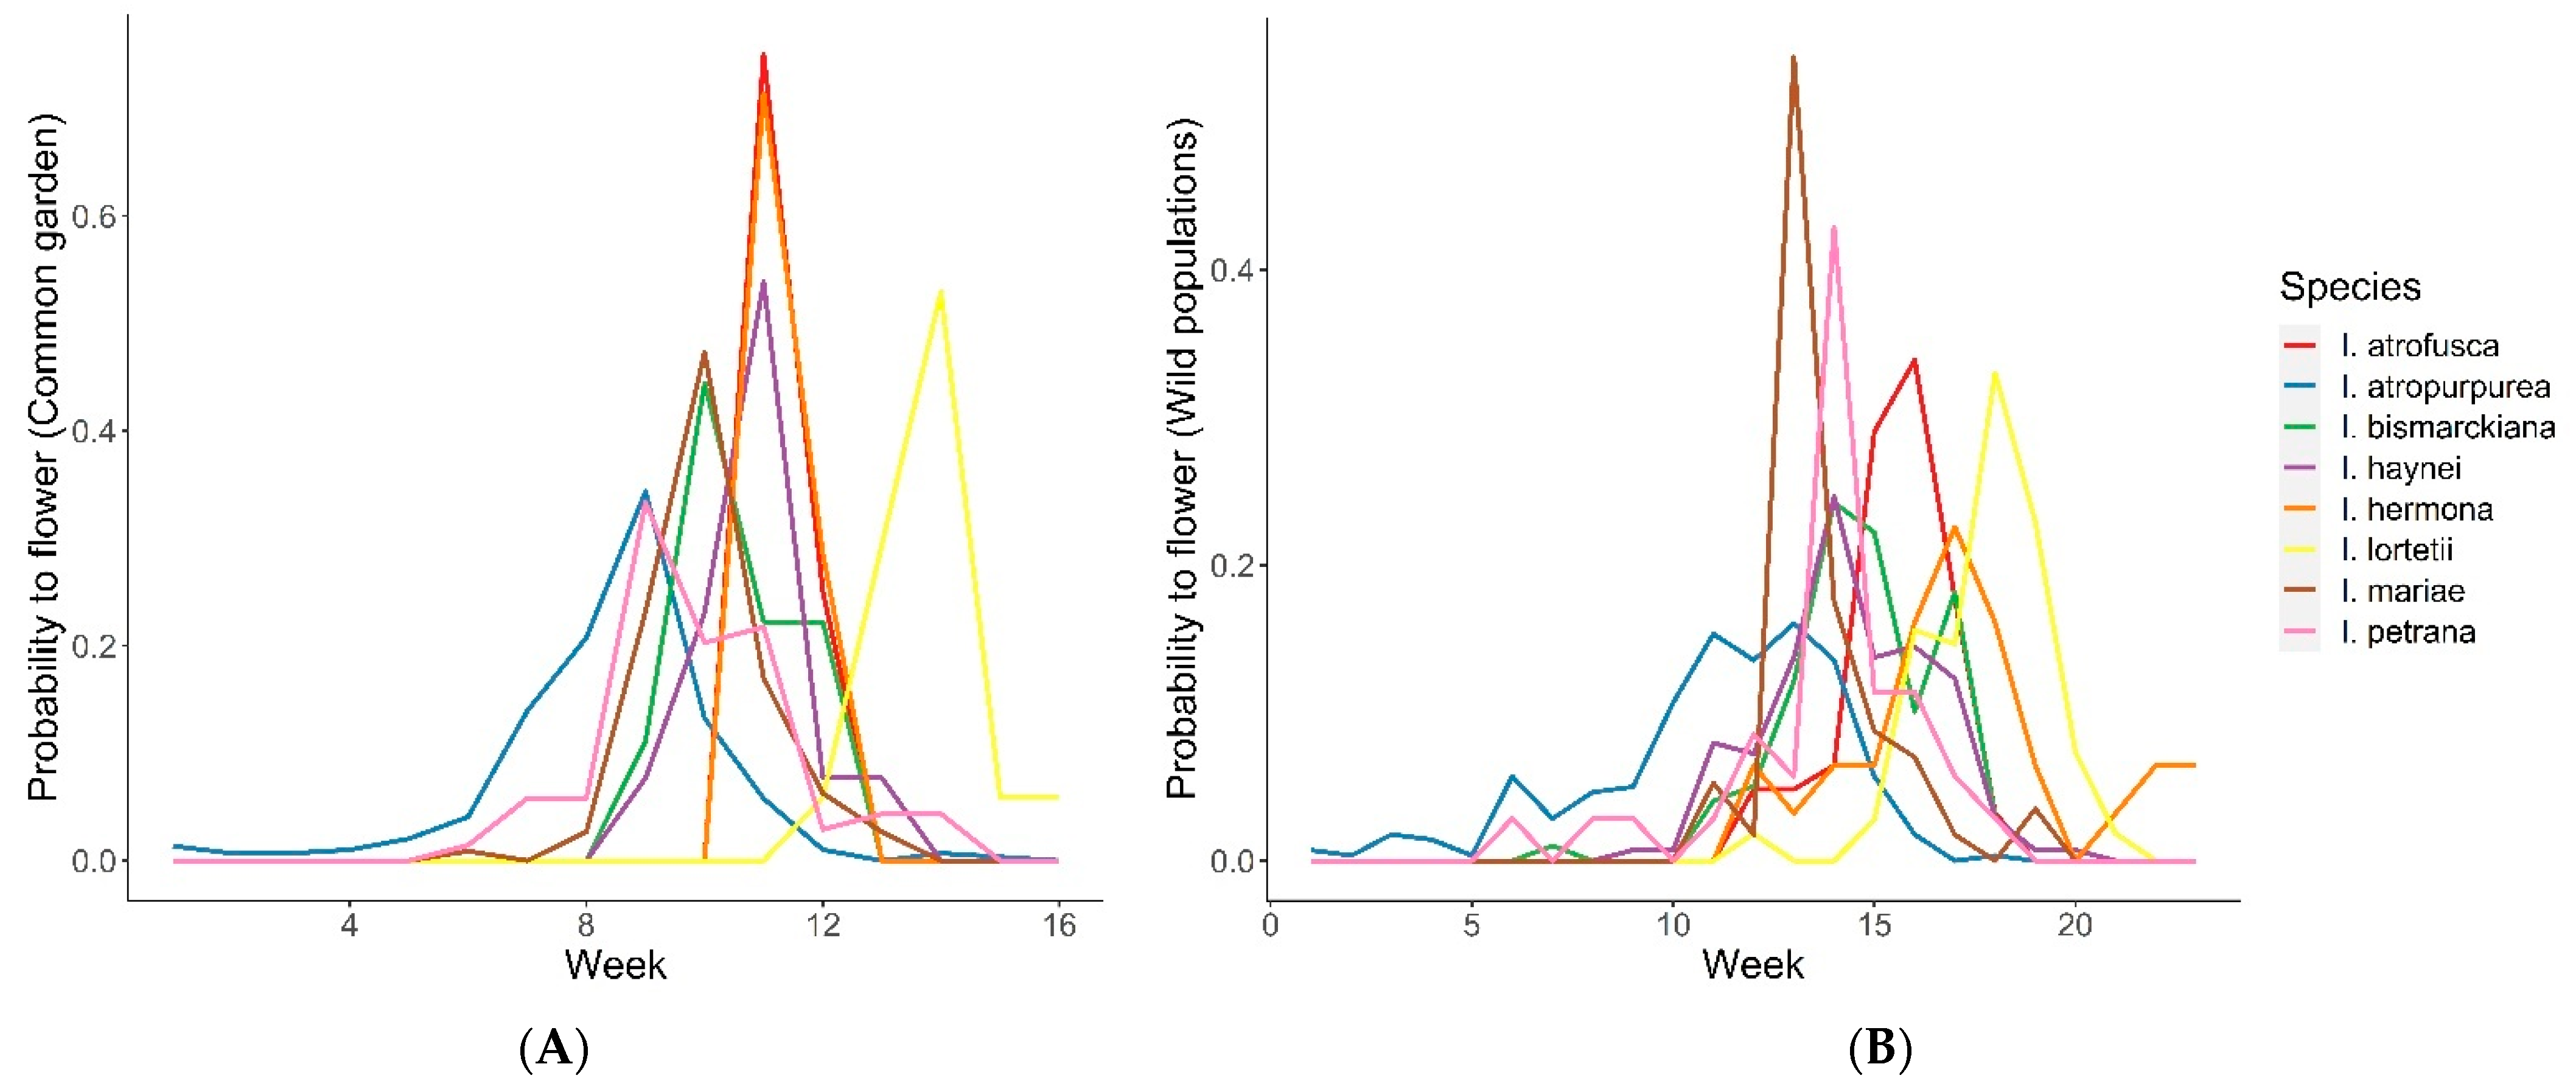
- Common garden: Flowering time overlap among the species in the net house varied, ranging from D = 0 between I. hermona and I. lortetii to D = 0.97 between I. hermona and I. petrana, with a median of 0.39. Most of the species growing under common garden conditions in TAUBG overlapped in their flowering time, except I. atropurpurea and I. lortetii, which flowered significantly earlier or later, respectively, compared to all the other species (time-to-event analysis: Z = 5.3, p < 0.001 and Z = −5.02, p < 0.001, respectively; Figure 3A). These differences were confirmed after controlling for the spatial location of the plants within the net house, which significantly affected flowering time (Z = 3.572, p < 0.001).
- Wild populations: D values of flowering time overlap among the species in the wild populations ranged between 0.067 (I. atropurpurea and I. lortetii) and 0.85 (I. bismarckiana and I. lortetii) with a median of 0.46. Comparison between the species observed in the wild populations revealed that I. atropurpurea, I. lortetii, and I. petrana significantly differed in flowering time from the other species (contrast analysis: Z = 11.351, p < 0.001; Z = −12.826, p < 0.001, and Z = −3.068, p = 0.002, respectively; Figure 3B). These differences were confirmed after controlling for the effect of the year of observations, which showed a significant effect (Z = 3.338, p < 0.001).
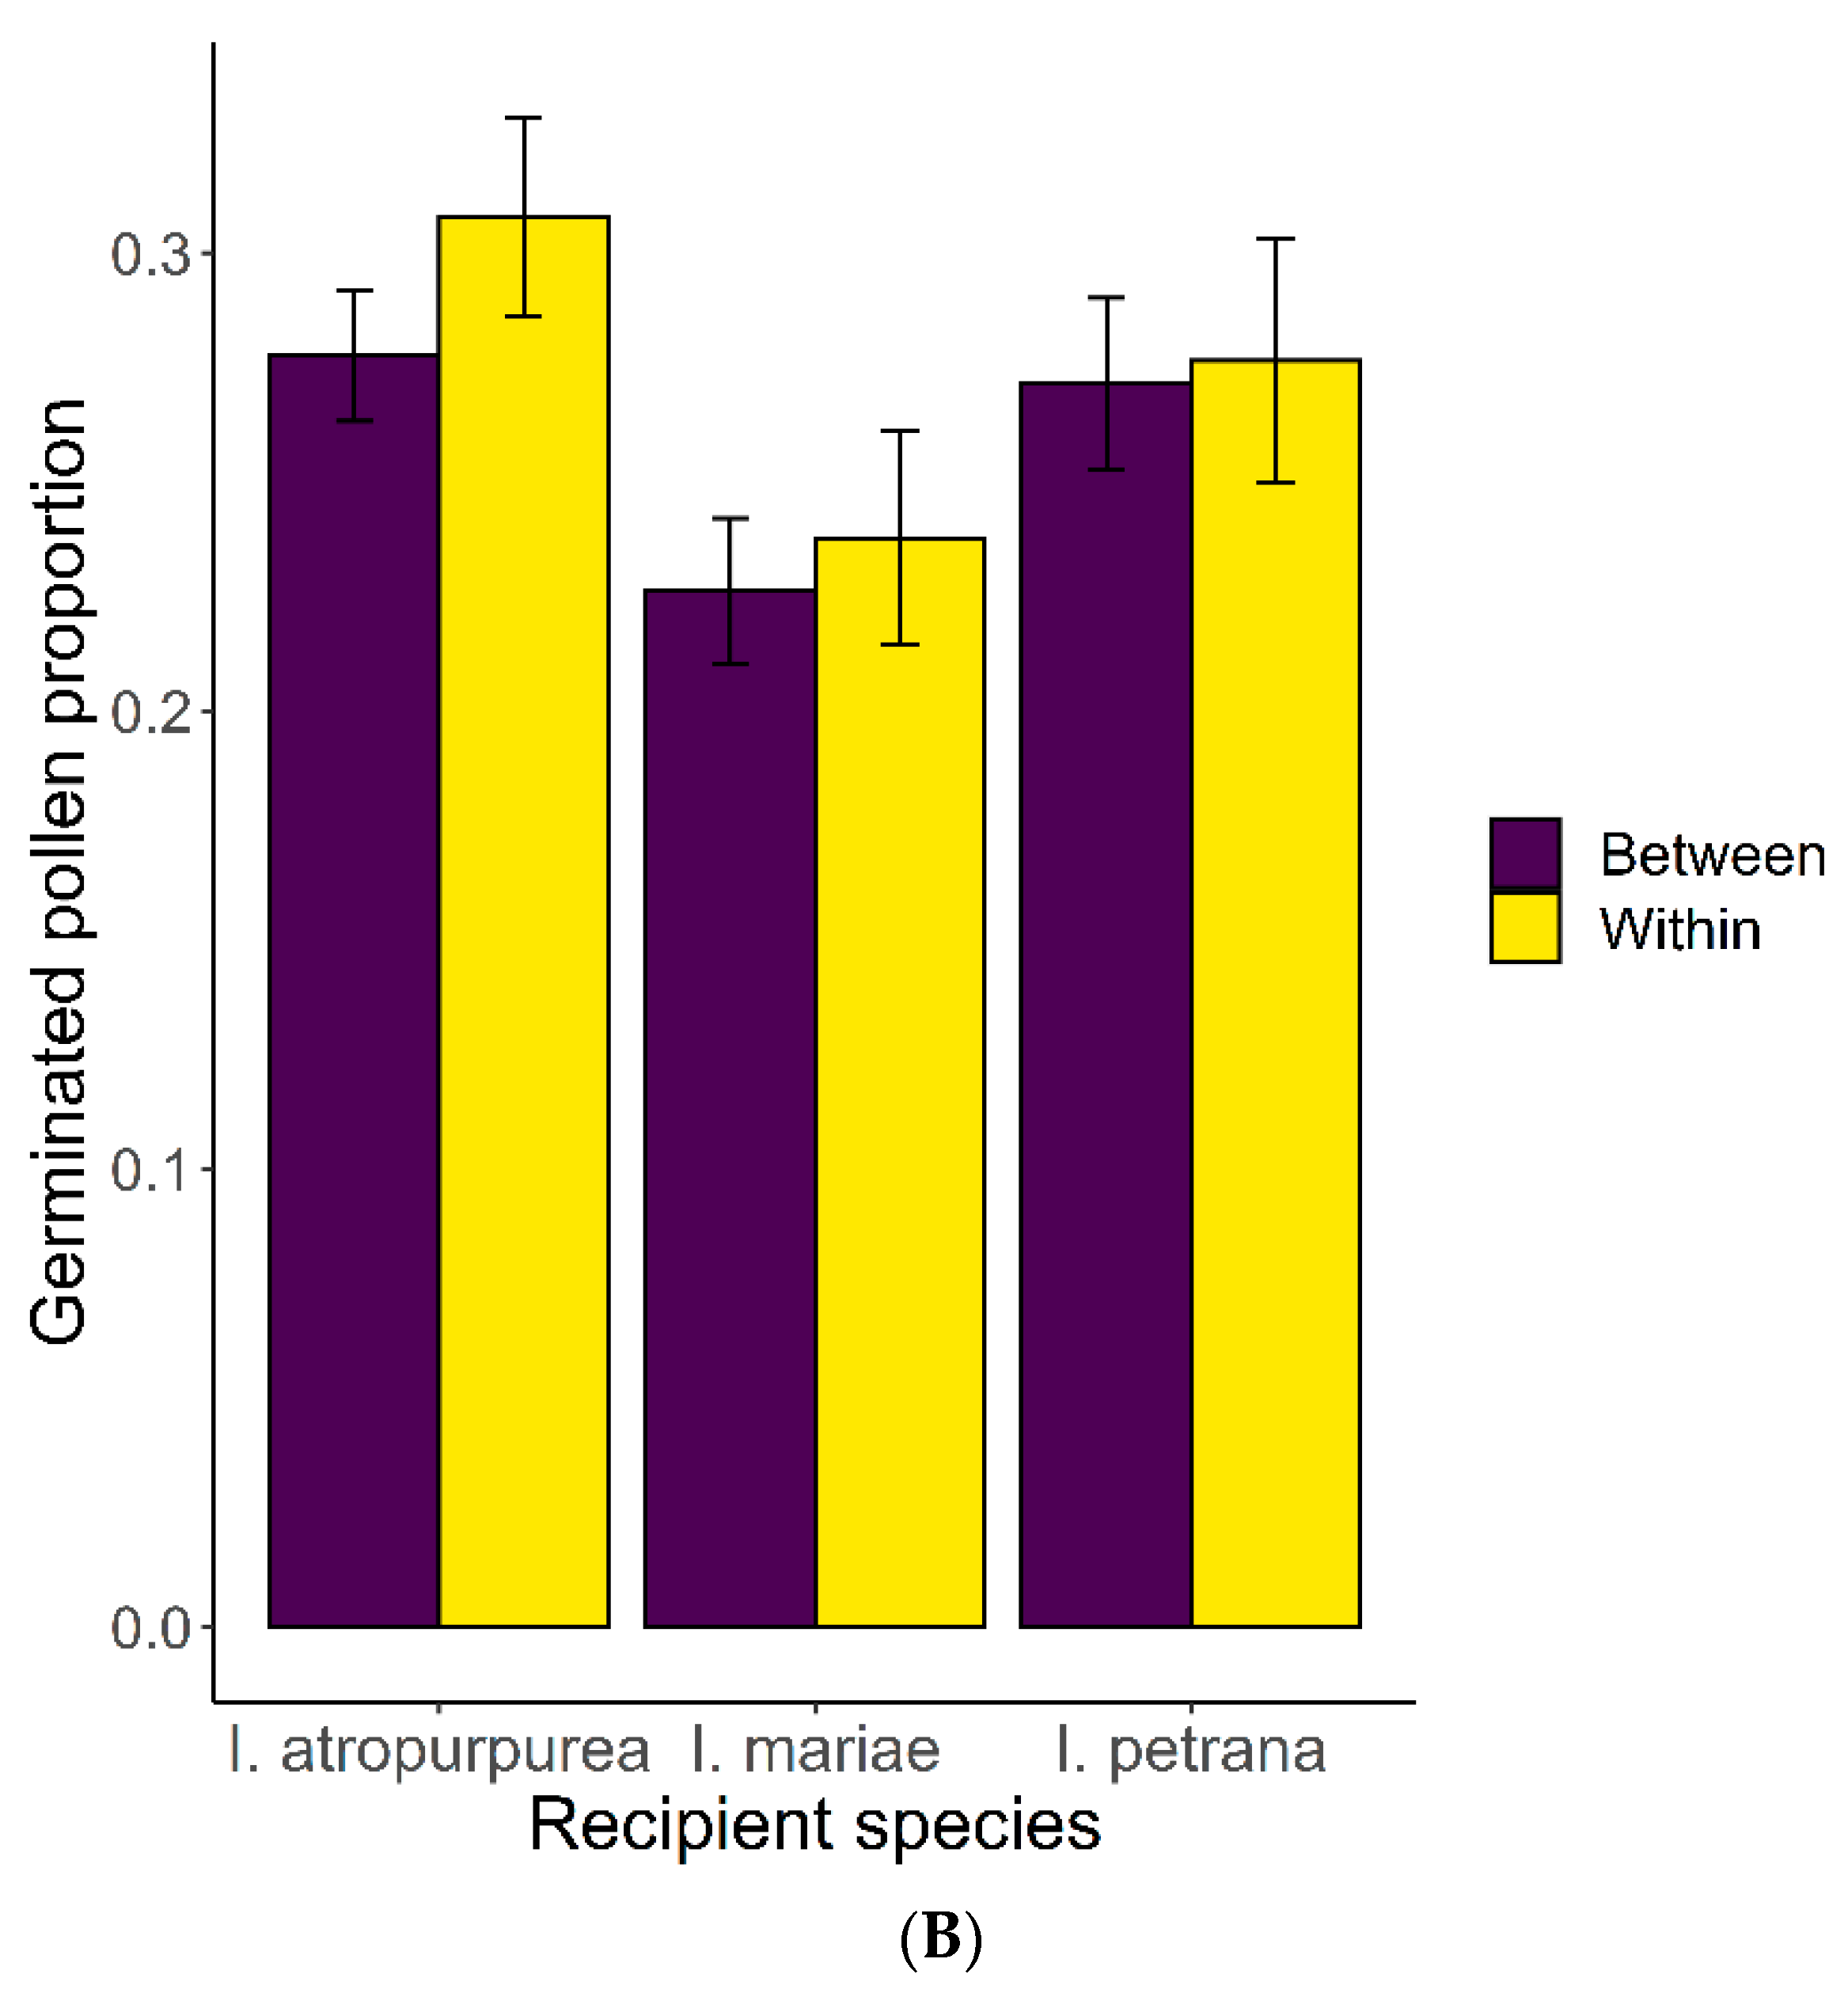
2.3. Pollen-Pistil Interactions
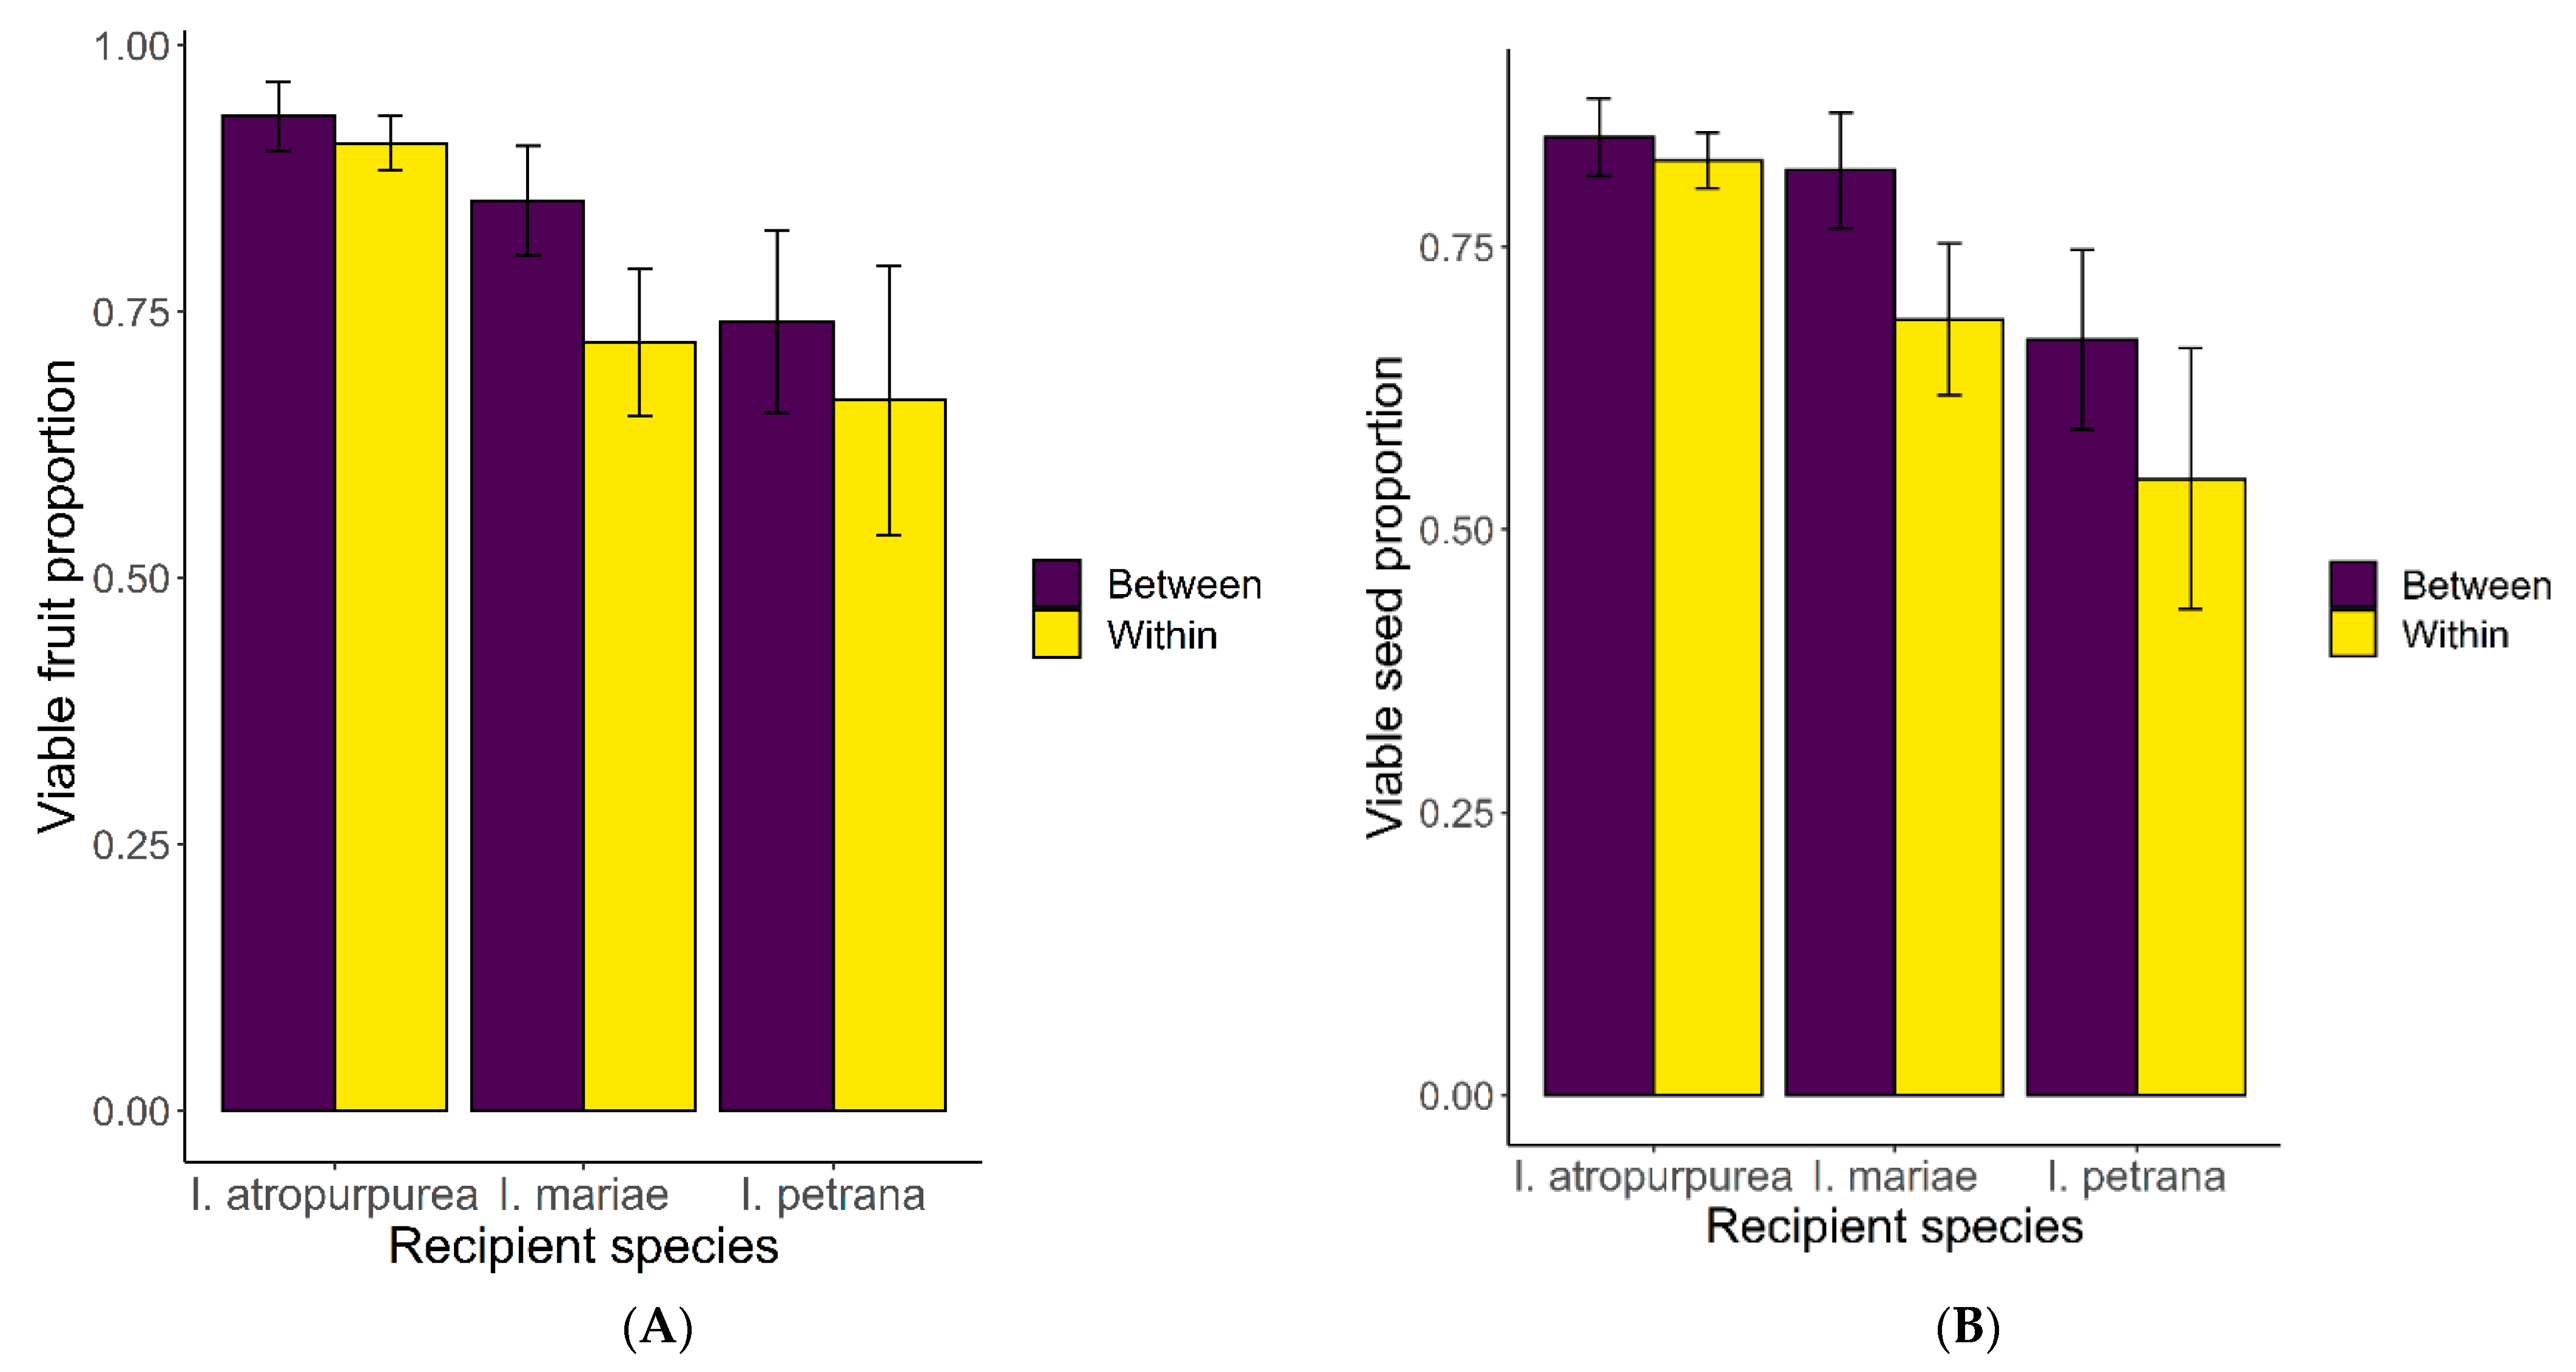
2.4. Post-Zygotic Reproductive Barriers—Cross Experiment
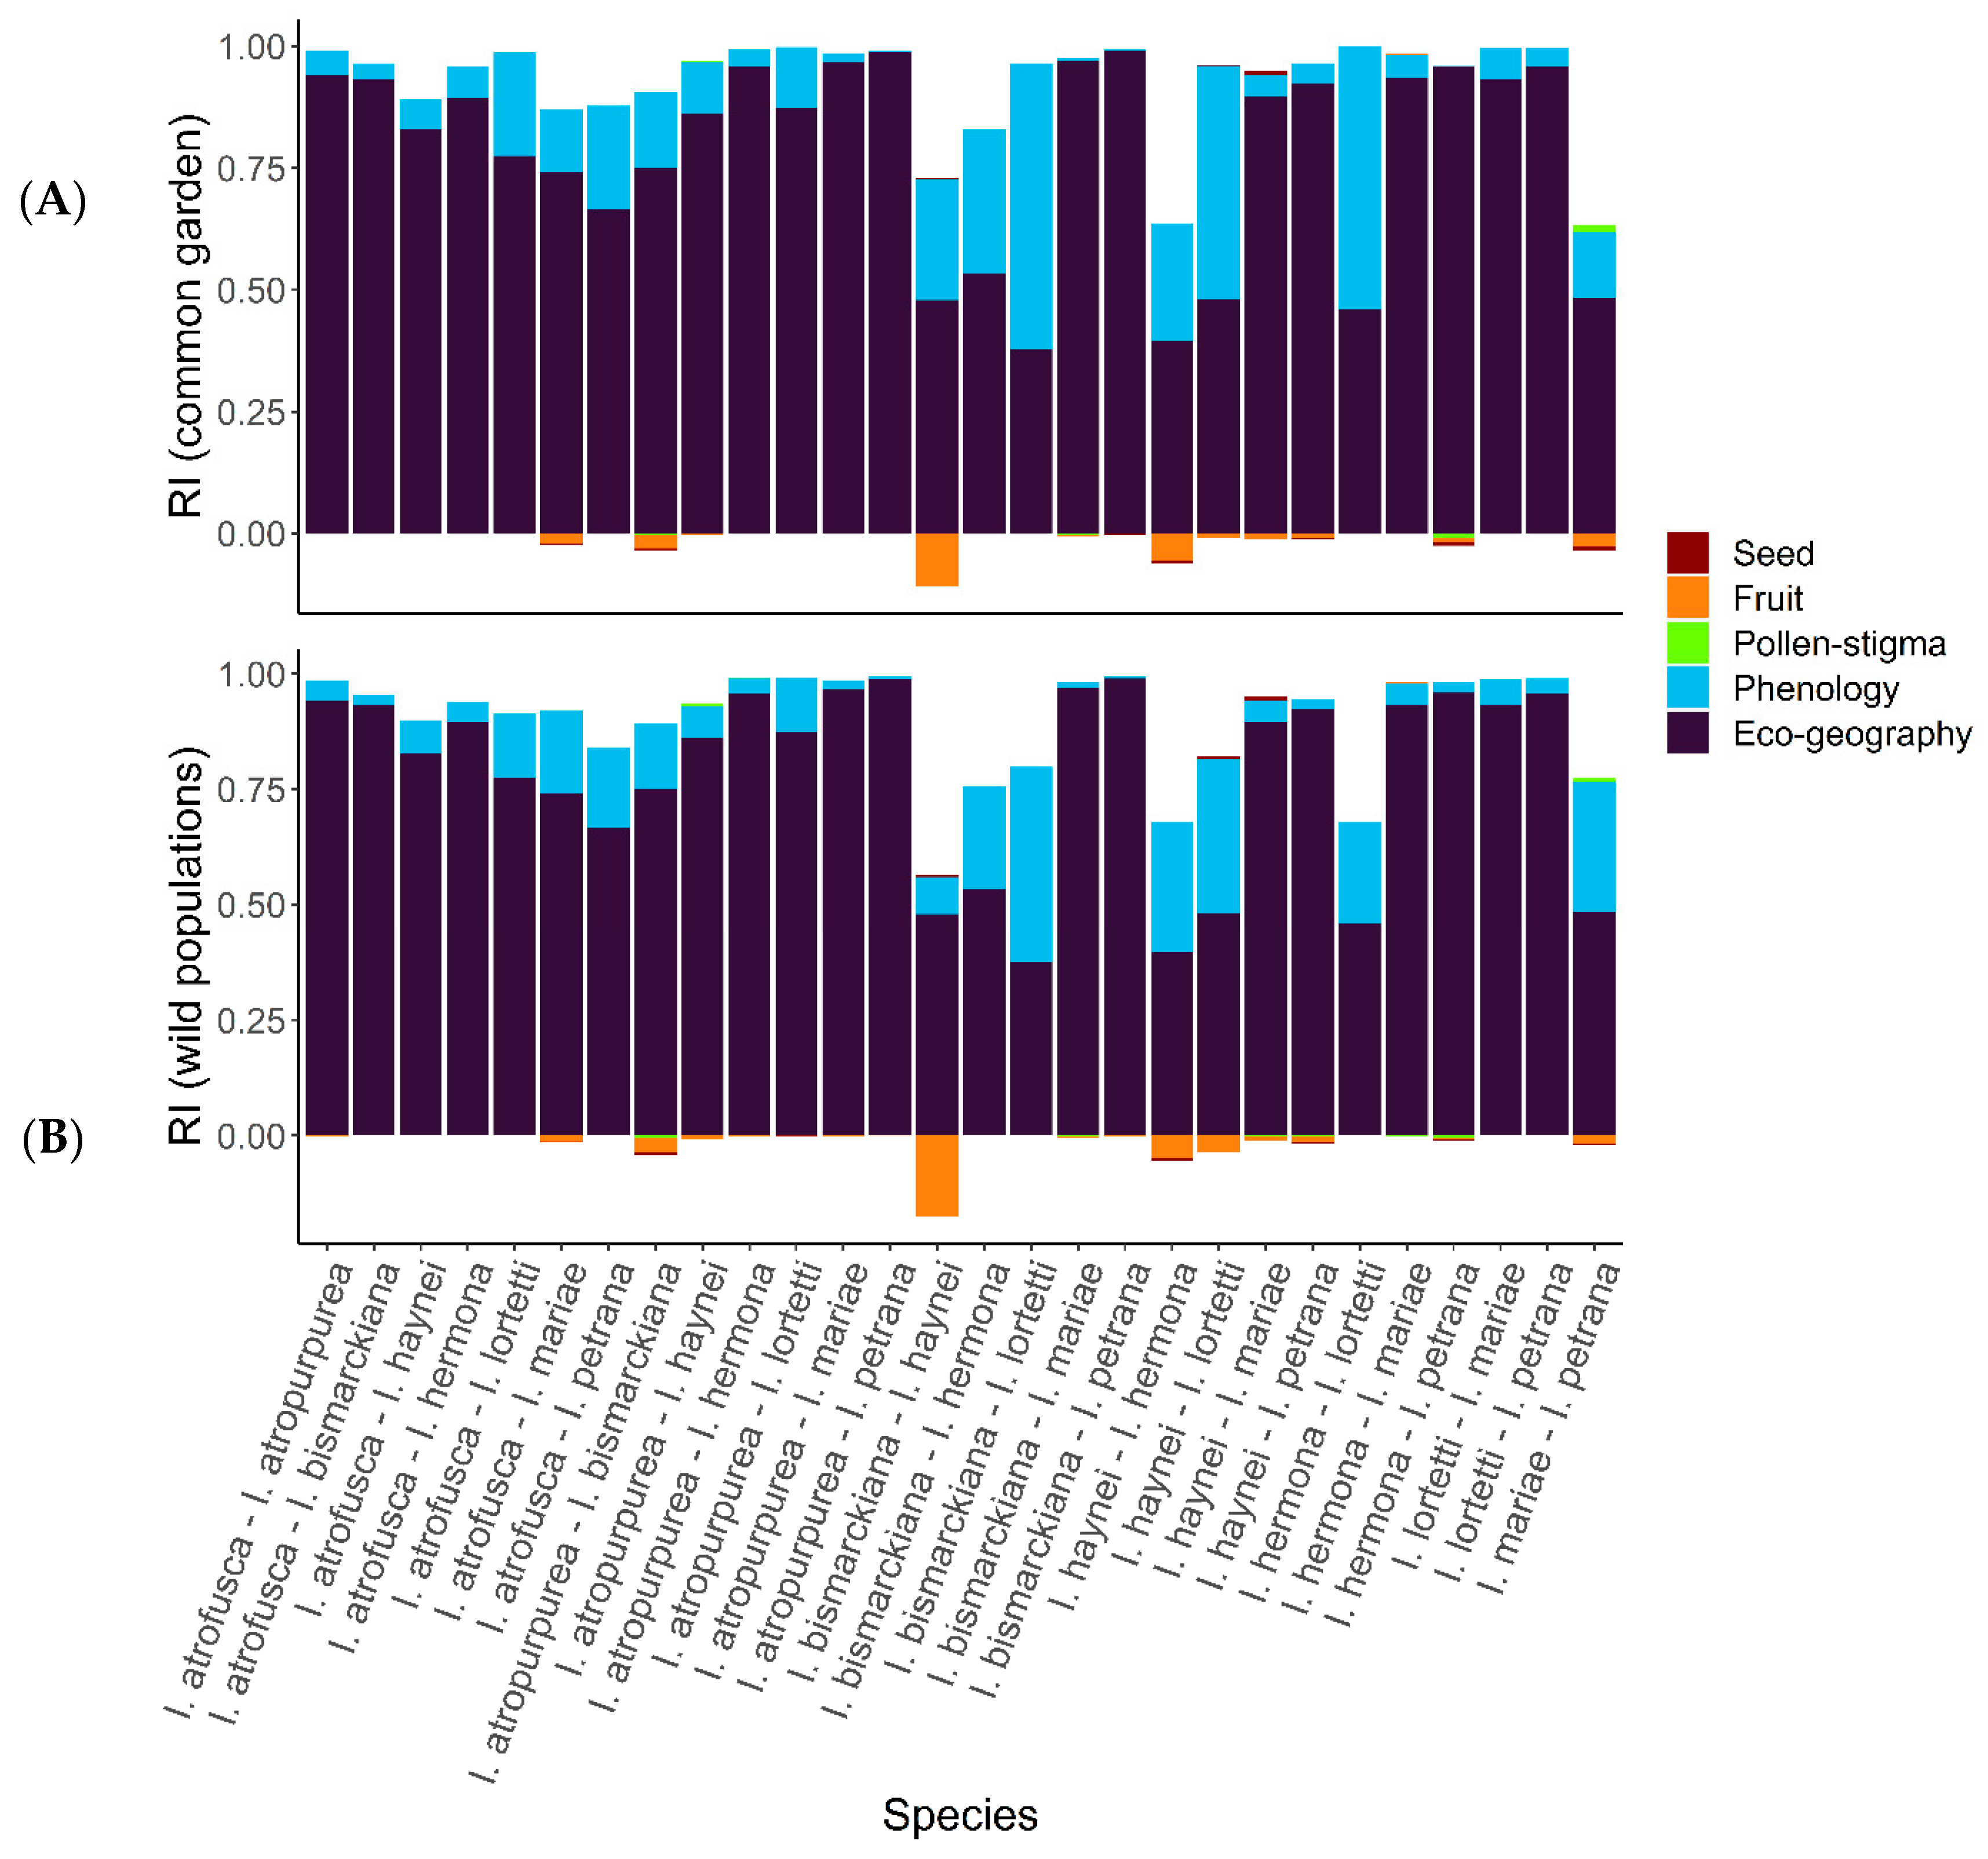
2.5. Reproductive Isolation
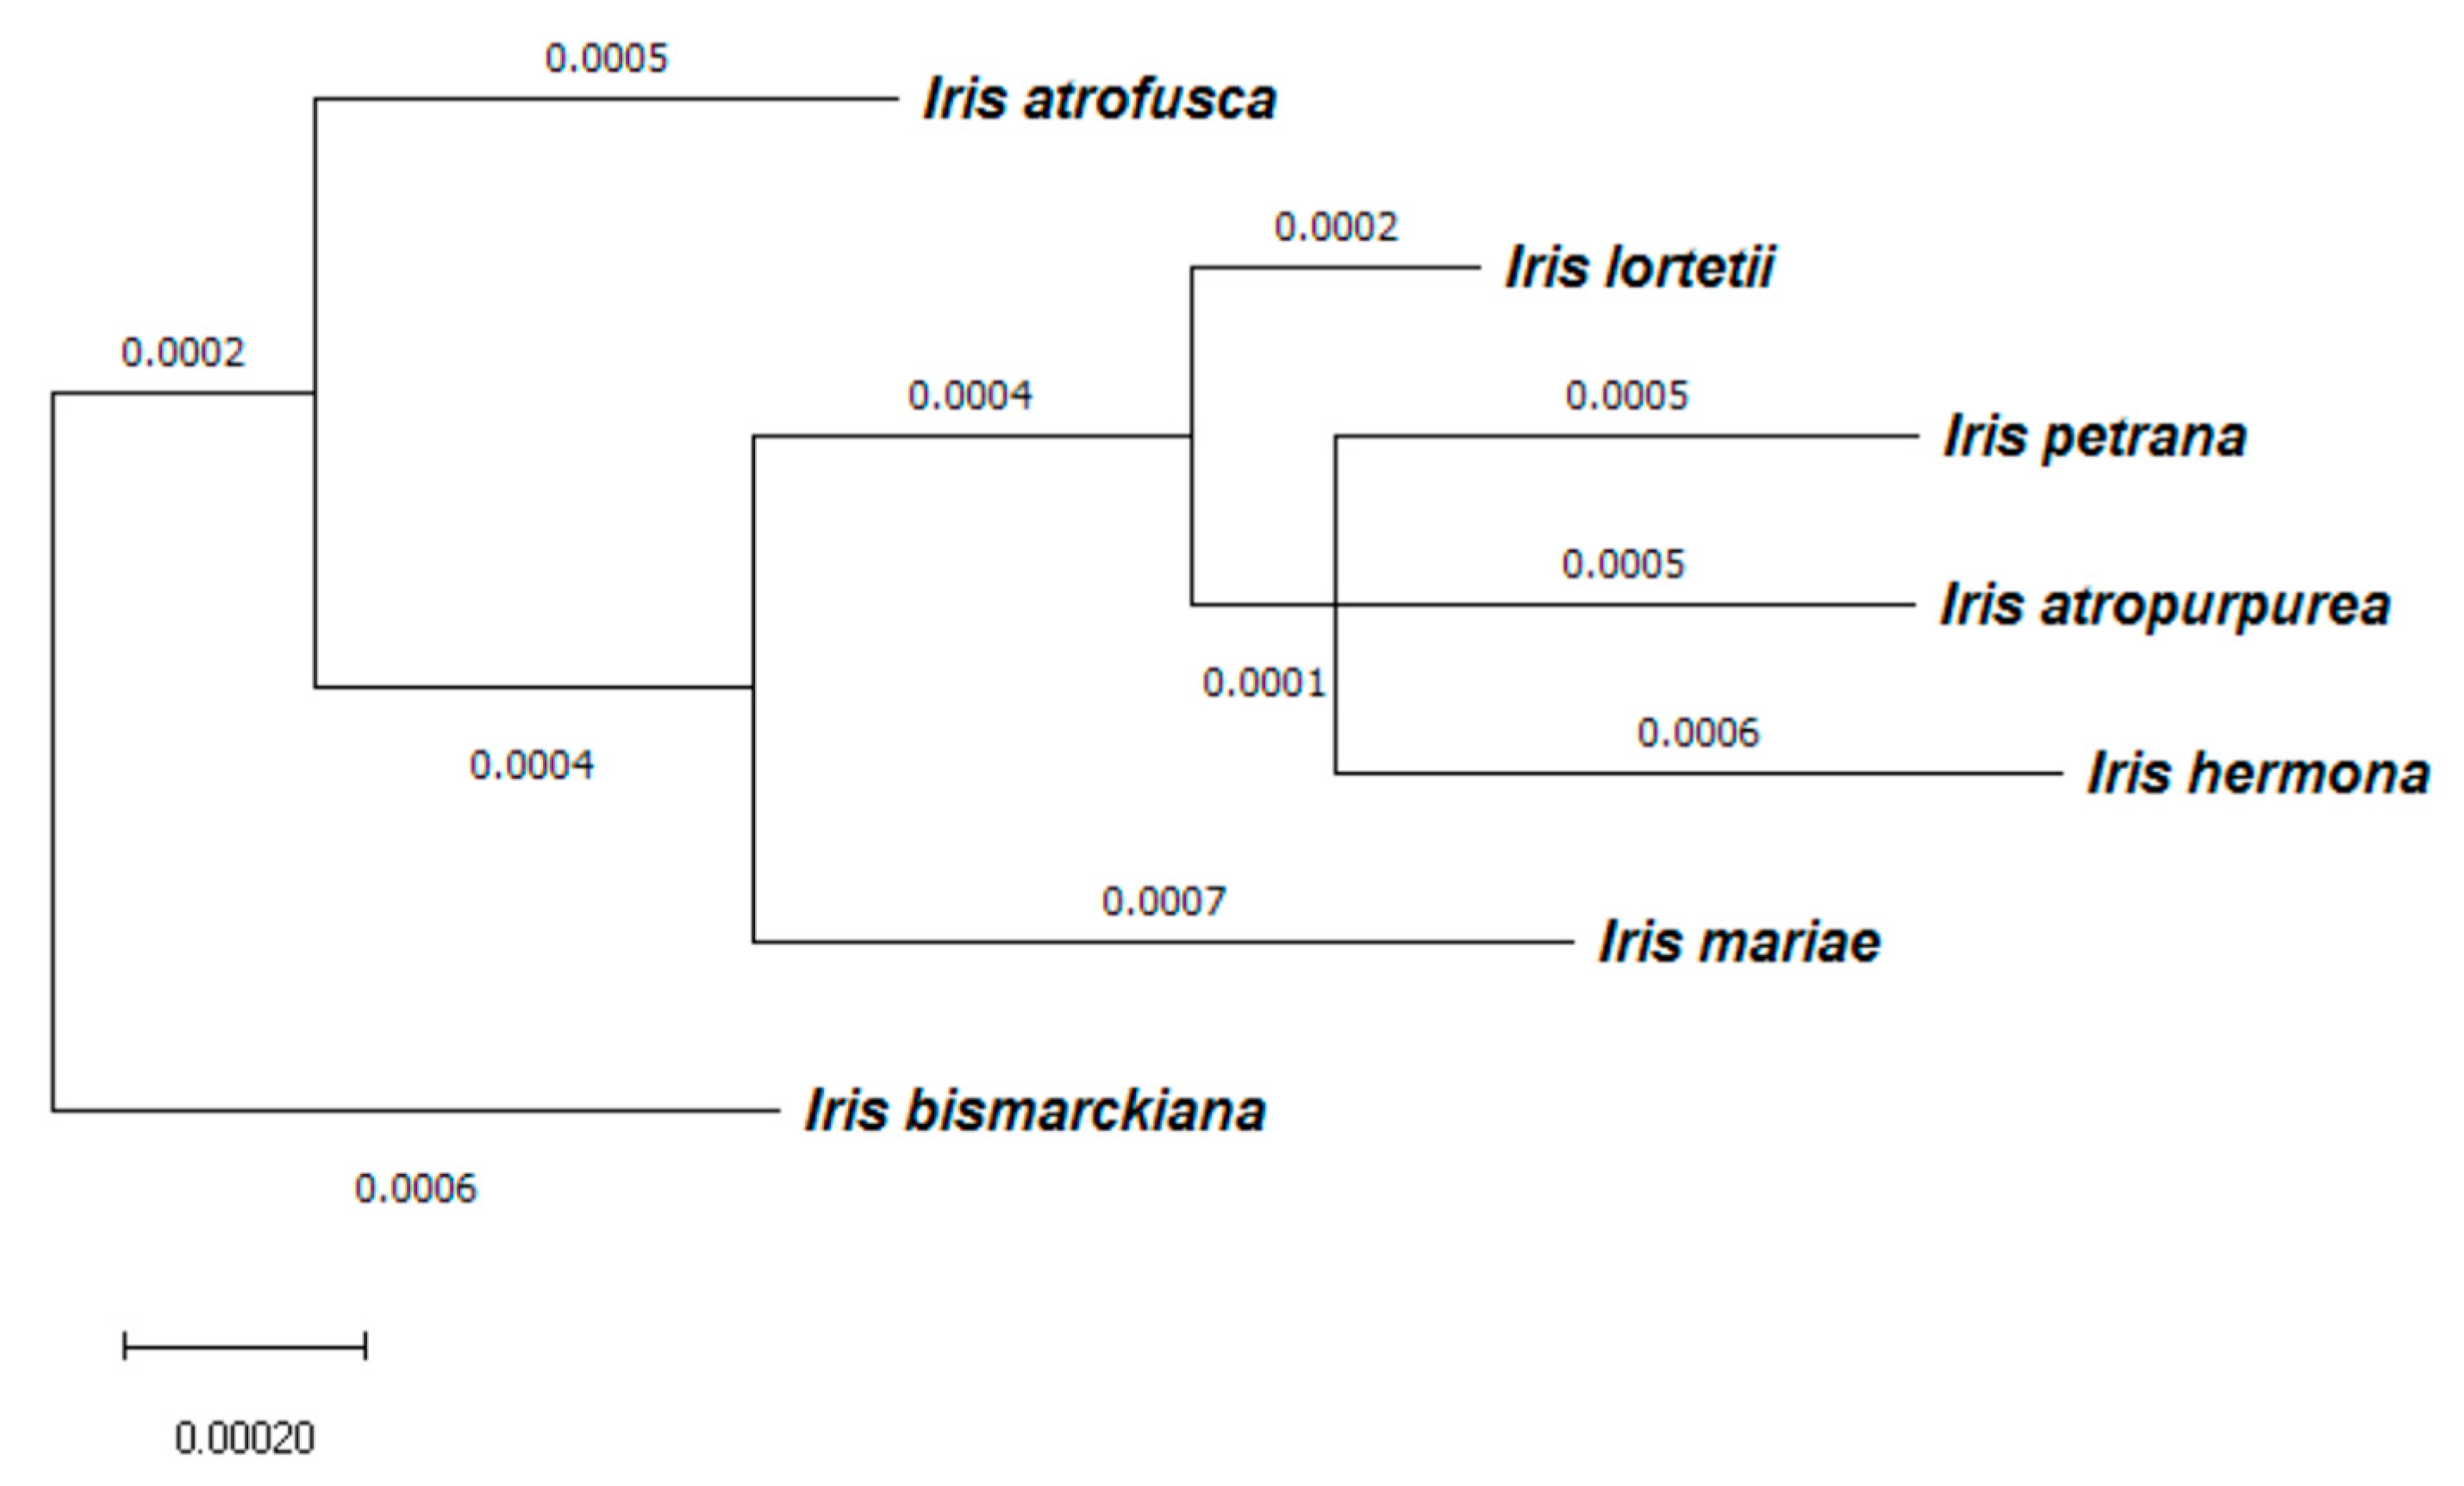
2.6. Correlation between Total RI and Genetic Distance
3. Discussion
4. Materials and Methods
4.1. Distribution and Environmental Data
4.2. Plant Material
4.3. Eco-Geography
4.4. Phenology
4.5. Pollen–Stigma Interactions
4.6. Post-Zygotic Reproductive Barriers—Cross Experiment
4.7. Reproductive Isolation
4.8. Correlation between Total RI and Genetic Distance
5. Conclusions
Supplementary Materials
Author Contributions
Funding
Data Availability Statement
Acknowledgments
Conflicts of Interest
References
- Darwin, C.R. On the Origin of Species by Means of Natural Selection, or the Preservation of Favoured Races in the Struggle for Life; John Murray: London, UK, 1859. [Google Scholar]
- Coyne, J.A.; Orr, H.A. Speciation; Sinauer Associates: Sunderland, MA, USA, 2004. [Google Scholar]
- Lowry, D.B.; Modliszewski, J.L.; Wright, K.M.; Wu, C.A.; Willis, J.H. The strength and genetic basis of reproductive isolating barriers in flowering plants. Philos. Trans. R. Soc. B Biol. Sci. 2008, 363, 3009–3021. [Google Scholar] [CrossRef] [PubMed] [Green Version]
- Sobel, J.M.; Chen, G.F.; Watt, L.R.; Schemske, D.W. The biology of speciation. Evolution 2010, 64, 295–315. [Google Scholar] [CrossRef] [PubMed]
- Baack, E.; Melo, M.C.; Rieseberg, L.H.; Ortiz-Barrientos, D. The origins of reproductive isolation in plants. New Phytol. 2015, 207, 968–984. [Google Scholar] [CrossRef]
- Mayr, E. Species, Classification, and Evolution: Biodiversity and Evolution; National Science Museum Foundation: Tokyo, Japan, 1995. [Google Scholar]
- Ehrlich, P.R.; Raven, P.H. Differentiation of populations. Science 1969, 165, 1228–1232. [Google Scholar] [CrossRef] [PubMed] [Green Version]
- Nosil, P. Ecological Speciation; Oxford University Press: Oxford, UK, 2012. [Google Scholar]
- Scopece, G.; Musacchio, A.; Widmer, A.; Cozzolino, S. Patterns of reproductive isolation in mediterranean deceptive orchids. Evolution 2007, 61, 2623–2642. [Google Scholar] [CrossRef] [Green Version]
- Dobzhansky, T. Speciation as a stage in evolutionary divergence. Am. Nat. 1940, 74, 312–321. [Google Scholar]
- Andrew, R.L.; Rieseberg, L.H. Divergence is focused on few genomic regions early in speciation: Incipient speciation of sunflower ecotypes. Evolution 2013, 67, 2468–2482. [Google Scholar] [CrossRef]
- Shafer, A.B.A.; Wolf, J.B.W. Widespread evidence for incipient ecological speciation: A meta-analysis of isolation-by-ecology. Ecol. Lett. 2013, 16, 940–950. [Google Scholar] [CrossRef]
- Tiffin, P.; Olson, S.; Moyle, L.C. Asymmetrical crossing barriers in angiosperms. Proc. R. Soc. London Ser. B Biol. Sci. 2001, 268, 861–867. [Google Scholar] [CrossRef] [Green Version]
- Ramsey, J.; Bradshaw, H.D.; Schemske, D.W. Components of reproductive isolation between the monkeyflowers Mimulus lewisii and M. cardinalis (Phrymaceae). Evolution 2003, 57, 1520–1534. [Google Scholar] [CrossRef]
- Sobel, J.M. Ecogeographic Isolation and Speciation in the Genus Mimulus. Am. Nat. 2014, 184, 565–579. [Google Scholar] [CrossRef]
- Rieseberg, L.H.; Willis, J.H. Plant Speciation. Science 2007, 317, 910–914. [Google Scholar] [CrossRef]
- Grant, B.R.; Grant, P.R. Watching speciation in action. Science 2017, 355, 910–911. [Google Scholar] [CrossRef]
- Rieseberg, L.H.; Wood, T.E.; Baack, E.J. The nature of plant species. Nature 2006, 440, 524–527. [Google Scholar] [CrossRef]
- Kay, K.M. Reproductive isolation between two closely related hummingbird pollinated neotropical gingers. Evolution 2006, 60, 538–552. [Google Scholar] [CrossRef]
- Sobel, J.M.; Streisfeld, M.A. Strong premating reproductive isolation drives incipient speciation in Mimulus aurantiacus. Evolution 2015, 69, 447–461. [Google Scholar] [CrossRef]
- Ostevik, K.L.; Andrew, R.L.; Otto, S.P.; Rieseberg, L.H. Multiple reproductive barriers separate recently diverged sunflower ecotypes. Evolution 2016, 70, 2322–2335. [Google Scholar] [CrossRef]
- Struck, T.H.; Feder, J.L.; Bendiksby, M.; Birkeland, S.; Cerca, J.; Gusarov, V.I.; Kistenich, S.; Larsson, K.-H.; Liow, L.H.; Nowak, M.D.; et al. Finding Evolutionary Processes Hidden in Cryptic Species. Trends Ecol. Evol. 2018, 33, 153–163. [Google Scholar] [CrossRef] [Green Version]
- Moyle, L.C.; Olson, M.S.; Tiffin, P. Patterns of reproductive isolation in three angiosperm genera. Evolution 2004, 58, 1195–1208. [Google Scholar] [CrossRef]
- Nosrati, H.; Price, A.H.; Wilcock, C.C. Relationship between genetic distances and postzygotic reproductive isolation in diploid Fragaria (Rosaceae). Biol. J. Linn. Soc. 2011, 104, 510–526. [Google Scholar] [CrossRef] [Green Version]
- Christie, K.; Strauss, S.Y. Along the speciation continuum: Quantifying intrinsic and extrinsic isolating barriers across five million years of evolutionary divergence in California jewelflowers. Evolution 2018, 72, 1063–1079. [Google Scholar] [CrossRef] [PubMed]
- Mathew, B. The Iris, 2nd ed.; Batsford: London, UK, 1989. [Google Scholar]
- Wilson, C.A. Phylogeny of Iris based on chloroplast matK gene and trnK intron sequence data. Mol. Phylogenet. Evol. 2004, 33, 402–412. [Google Scholar] [CrossRef] [PubMed]
- Wilson, C.A. Subgeneric classification in Iris re-examined using chloroplast sequence data. Taxon 2011, 60, 27–35. [Google Scholar] [CrossRef]
- Wilson, C.A.; Padiernos, J.; Sapir, Y. The royal irises (Iris subg. Iris sect. Oncocyclus): Plastid and low-copy nuclear data contribute to an understanding of their phylogenetic relationships. Taxon 2016, 65, 35–46. [Google Scholar] [CrossRef] [Green Version]
- Danin, A.; Fragman-Sapir, O. Flora of Israel Online. Available online: http://flora.org.il/plants/ (accessed on 18 July 2017).
- Arafeh, R.M.H.; Sapir, Y.; Shmida, A.; Iraki, N.; Fragman, O.; Comes, H.P. Patterns of genetic and phenotypic variation in Iris haynei and I. atrofusca (Iris sect. Oncocyclus = the Royal Irises) along an environmental gradient in Israel and the West Bank. Mol. Ecol. 2002, 11, 39–53. [Google Scholar] [CrossRef] [Green Version]
- Sapir, Y.; Shmida, A.; Fragman-Sapir, O.; Comes, H.P. Morphological variation of the Oncocyclus Irises (Iris: Iridaceae) in the Southern Levant. Bot. J. Linn. Soc. 2002, 139, 369–382. [Google Scholar] [CrossRef] [Green Version]
- Avishai, M.; Zohary, D. Genetic affinities among the Oncocyclus Irises. Bot. Gaz. 1980, 141, 107–115. [Google Scholar] [CrossRef]
- Yardeni, G.; Tessler, N.; Imbert, E.; Sapir, Y. Reproductive isolation between populations of Iris atropurpurea is associated with ecological differentiation. Ann. Bot. 2016, 118, 971–982. [Google Scholar] [CrossRef] [Green Version]
- Volis, S.; Zhang, Y.H.; Deng, T.; Dorman, M.; Blecher, M.; Abbott, R.J. Divergence and reproductive isolation between two closely related allopatric Iris species. Biol. J. Linn. Soc. 2019, 127, 377–389. [Google Scholar] [CrossRef]
- Volis, S.; Zhang, Y.H.; Dorman, M.; Abbott, R.J. Incipient speciation in Oncocyclus irises: Eco-geographic isolation and genetic divergence with no reproductive isolation? Flora 2021, 275, 151746. [Google Scholar] [CrossRef]
- Sapir, Y.; Shmida, A. Species concepts and ecogeographical divergence of Oncocyclus irises. Isr. J. Plant Sci. 2002, 50, S119–S127. [Google Scholar] [CrossRef]
- Sobel, J.M.; Chen, G.F. Unification of methods for estimating the strength of reproductive isolation. Evolution 2014, 68, 1511–1522. [Google Scholar] [CrossRef]
- Drori, M.; Rice, A.; Einhorn, M.; Chay, O.; Glick, L.; Mayrose, I. OneTwoTree: An online tool for phylogeny reconstruction. Mol. Ecol. Resour. 2018, 18, 1492–1499. [Google Scholar] [CrossRef]
- Dorman, M.; Melnikov, P.; Sapir, Y.; Volis, S. Factors affecting dormancy of Oncocyclus iris seeds. Isr. J. Plant Sci. 2009, 57, 329–333. [Google Scholar] [CrossRef]
- Bertel, C.; Hülber, K.; Frajman, B.; Schönswetter, P. No evidence of intrinsic reproductive isolation between two reciprocally non-monophyletic, ecologically differentiated mountain plants at an early stage of speciation. Evol. Ecol. 2016, 30, 1031–1042. [Google Scholar] [CrossRef] [Green Version]
- López-Pujol, J.; López-Vinyallonga, S.; Susanna, A.; Ertuğrul, K.; Uysal, T.; Tugay, O.; Guetat, A.; Garcia-Jacas, N. Speciation and genetic diversity in Centaurea subsect. Phalolepis in Anatolia. Sci. Rep. 2016, 6, 37818. [Google Scholar] [CrossRef] [Green Version]
- Weber, M.G.; Cacho, N.I.; Phan, M.J.Q.; Disbrow, C.; Ramírez, S.R.; Strauss, S.Y. The evolution of floral signals in relation to range overlap in a clade of California Jewelflowers (Streptanthus s.l.). Evolution 2018, 72, 798–807. [Google Scholar] [CrossRef]
- Suni, S.S.; Hopkins, R. The relationship between postmating reproductive isolation and reinforcement in Phlox. Evolution 2018, 72, 1387–1398. [Google Scholar] [CrossRef]
- Servedio, M.R.; Noor, M.A.F. The role of reinforcement in speciation: Theory and data. Annu. Rev. Ecol. Evol. Syst. 2003, 34, 339–364. [Google Scholar] [CrossRef]
- Hopkins, R. Reinforcement in plants. New Phytol. 2013, 197, 1095–1103. [Google Scholar] [CrossRef]
- Hall, M.C.; Willis, J.H. Divergent selection on flowering time contributes to local adaptation in Mimulus guttatus populations. Evolution 2006, 60, 2466–2477. [Google Scholar] [CrossRef] [PubMed]
- Runquist, R.D.B.; Chu, E.; Iverson, J.L.; Kopp, J.C.; Moeller, D.A. Rapid evolution of reproductive isolation between incipient outcrossing and selfing Clarkia species. Evolution 2014, 68, 2885–2900. [Google Scholar] [CrossRef] [PubMed]
- Savolainen, V.; Anstett, M.-C.; Lexer, C.; Hutton, I.; Clarkson, J.J.; Norup, M.V.; Powell, M.P.; Springate, D.; Salamin, N.; Baker, W.J. Sympatric speciation in palms on an oceanic island. Nature 2006, 441, 210–213. [Google Scholar] [CrossRef] [PubMed]
- Papadopulos, A.S.T.; Kaye, M.; Devaux, C.; Hipperson, H.; Lighten, J.; Dunning, L.T.; Hutton, I.; Baker, W.J.; Butlin, R.K.; Savolainen, V. Evaluation of genetic isolation within an island flora reveals unusually widespread local adaptation and supports sympatric speciation. Philos. Trans. R. Soc. B Biol. Sci. 2014, 369, 20130342. [Google Scholar] [CrossRef] [PubMed] [Green Version]
- Wolf, J.B.W.; Ellegren, H. Making sense of genomic islands of differentiation in light of speciation. Nat. Rev. Genet. 2017, 18, 87–100. [Google Scholar] [CrossRef]
- Vukics, A.; Asboth, J.; Meszena, G. Speciation in multidimensional evolutionary space. Phys. Rev. E 2003, 68, 041903. [Google Scholar] [CrossRef] [Green Version]
- Fick, S.E.; Hijmans, R.J. WorldClim 2: New 1-km spatial resolution climate surfaces for global land areas. Int. J. Climatol. 2017, 37, 4302–4315. [Google Scholar] [CrossRef]
- Hijmans, R.J. Raster Geographic Data Analysis and Modeling. 2016. Available online: https://cran.r-project.org/web/packages/raster/index.html (accessed on 4 June 2017).
- Guisan, A.; Edwards, T.C.; Hastie, T. Generalized linear and generalized additive models in studies of species distributions: Setting the scene. Ecol. Model. 2002, 157, 89–100. [Google Scholar] [CrossRef] [Green Version]
- Thuiller, W.; Georges, D.; Engler, R.; Engler, R.; Breiner, F.; Lafourcade, B.; Patin, R. BIOMOD: Ensemble Platform for Species Distribution Modeling, R-CRAN. 2012. Available online: https://rdrr.io/cran/biomod2/ (accessed on 9 October 2022).
- Barbet-Massin, M.; Jiguet, F.; Albert, C.H.; Thuiller, W. Selecting pseudo-absences for species distribution models: How, where and how many? Methods Ecol. Evol. 2012, 3, 327–338. [Google Scholar] [CrossRef]
- Naimi, B.; Araújo, M.B. sdm: A reproducible and extensible R platform for species distribution modelling. Ecography 2016, 39, 368–375. [Google Scholar] [CrossRef] [Green Version]
- Elith, J.; Phillips, S.J.; Hastie, T.; Dudík, M.; Chee, Y.E.; Yates, C.J. A statistical explanation of MaxEnt for ecologists. Divers. Distrib. 2011, 17, 43–57. [Google Scholar] [CrossRef]
- Lobo, J.M.; Jiménez-Valverde, A.; Hortal, J. The uncertain nature of absences and their importance in species distribution modelling. Ecography 2010, 33, 103–114. [Google Scholar] [CrossRef]
- Allouche, O.; Tsoar, A.; Kadmon, R. Assessing the accuracy of species distribution models: Prevalence, kappa and the true skill statistic (TSS). J. Appl. Ecol. 2006, 43, 1223–1232. [Google Scholar] [CrossRef]
- Hanley, J.A.; McNeil, B.J. The meaning and use of the area under a receiver operating characteristic (ROC) curve. Radiology 1982, 143, 29–36. [Google Scholar] [CrossRef] [Green Version]
- Warren, D.L.; Glor, R.E.; Turelli, M. Environmental niche equivalency versus conservatism: Quantitative approach to niche evolution. Evolution 2008, 62, 2868–2883. [Google Scholar] [CrossRef]
- Heibl, C.; Calenge, C. Phyloclim: Integrating Phylogenetics and Climatic Niche Modeling, R-CRAN. 2018. Available online: https://cran.r-project.org/web/packages/phyloclim/index.html (accessed on 9 October 2022).
- Dante, S.K.; Schamp, B.S.; Aarssen, L.W. Evidence of deterministic assembly according to flowering time in an old-field plant community. Funct. Ecol. 2013, 27, 555–564. [Google Scholar] [CrossRef]
- McNair, J.N.; Sunkara, A.; Frobish, D. How to analyse seed germination data using statistical time-to-event analysis: Non-parametric and semi-parametric methods. Seed Sci. Res. 2012, 22, 77–95. [Google Scholar] [CrossRef]
- Prendeville, H.R.; Barnard-Kubow, K.; Dai, C.; Barringer, B.C.; Galloway, L.F. Clinal variation for only some phenological traits across a species range. Oecologia 2013, 173, 421–430. [Google Scholar] [CrossRef]
- Therneau, T.M.; Grambsch, P.M. Modeling Survival Data: Extending the Cox Model; Springer: New York, NY, USA, 2000. [Google Scholar]
- Higashiyama, T. Peptide Signaling in Pollen–Pistil Interactions. Plant Cell Physiol. 2010, 51, 177–189. [Google Scholar] [CrossRef] [Green Version]
- Heslop-Harrison, Y. Control Gates and Micro-ecology: The Pollen–Stigma Interaction in Perspective. Ann. Bot. 2000, 85, 5–13. [Google Scholar] [CrossRef]
- Dafni, A.; Kevan, P.G.; Husband, B.C. (Eds.) Practical Pollination Biology; Enviroquest: Cambridge, ON, Canada, 2005. [Google Scholar]


| I. atrofusca | I. atropurpurea | I. bismarckiana | I. haynei | I. hermona | I. lortetii | I. mariae | |
| I. atropurpurea | 0.02 | 1.00 | |||||
| I. bismarckiana | 0.06 | 0.06 | 1.00 | ||||
| I. haynei | 0.15 | 0.03 | 0.36 | 1.00 | |||
| I. hermona | 0.16 | 0.04 | 0.47 | 0.46 | 1.00 | ||
| I. lortetii | 0.20 | 0.04 | 0.66 | 0.37 | 0.45 | 1.00 | |
| I. mariae | 0.12 | 0.01 | 0.02 | 0.03 | 0.05 | 0.04 | 1.00 |
| I. petrana | 0.22 | 0.00 | 0.01 | 0.04 | 0.05 | 0.06 | 0.34 |
| I. atrofusca | I. atropurpurea | I. bismarckiana | I. haynei | I. hermona | I. lortetii | I. mariae | I. petrana | |
| I. atrofusca | 0.99 | 0.96 | 0.89 | 0.96 | 0.99 | 0.85 | 0.88 | |
| I. atropurpurea | 0.99 | 0.87 | 0.97 | 0.99 | 1.00 | 0.99 | 0.99 | |
| I. bismarckiana | 0.95 | 0.85 | 0.62 | 0.83 | 0.96 | 0.97 | 0.99 | |
| I. haynei | 0.90 | 0.93 | 0.39 | 0.57 | 0.95 | 0.94 | 0.95 | |
| I. hermona | 0.94 | 0.99 | 0.75 | 0.63 | 1.00 | 0.98 | 0.94 | |
| I. lortetii | 0.91 | 0.99 | 0.80 | 0.78 | 0.68 | 1.00 | 1.00 | |
| I. mariae | 0.91 | 0.99 | 0.98 | 0.94 | 0.98 | 0.99 | 0.60 | |
| I. petrana | 0.84 | 0.99 | 0.99 | 0.93 | 0.97 | 0.99 | 0.75 |
Publisher’s Note: MDPI stays neutral with regard to jurisdictional claims in published maps and institutional affiliations. |
© 2022 by the authors. Licensee MDPI, Basel, Switzerland. This article is an open access article distributed under the terms and conditions of the Creative Commons Attribution (CC BY) license (https://creativecommons.org/licenses/by/4.0/).
Share and Cite
Osmolovsky, I.; Shifrin, M.; Gamliel, I.; Belmaker, J.; Sapir, Y. Eco-Geography and Phenology Are the Major Drivers of Reproductive Isolation in the Royal Irises, a Species Complex in the Course of Speciation. Plants 2022, 11, 3306. https://doi.org/10.3390/plants11233306
Osmolovsky I, Shifrin M, Gamliel I, Belmaker J, Sapir Y. Eco-Geography and Phenology Are the Major Drivers of Reproductive Isolation in the Royal Irises, a Species Complex in the Course of Speciation. Plants. 2022; 11(23):3306. https://doi.org/10.3390/plants11233306
Chicago/Turabian StyleOsmolovsky, Inna, Mariana Shifrin, Inbal Gamliel, Jonathan Belmaker, and Yuval Sapir. 2022. "Eco-Geography and Phenology Are the Major Drivers of Reproductive Isolation in the Royal Irises, a Species Complex in the Course of Speciation" Plants 11, no. 23: 3306. https://doi.org/10.3390/plants11233306