
Genome-Wide Transcriptomic and Proteomic Exploration of Molecular Regulations in Quinoa Responses to Ethylene and Salt Stress

Shandong Province Key Laboratory of Applied Mycology College of Life Science, Qingdao Agricultural University, Qingdao 266109, China
*
Authors to whom correspondence should be addressed.
Plants 2021, 10(11), 2281; https://doi.org/10.3390/plants10112281
Submission received: 16 September 2021
/
Revised: 20 October 2021
/
Accepted: 21 October 2021
/
Published: 25 October 2021
(This article belongs to the Special Issue Ethylene Signaling in Plants)
Abstract
:Quinoa (Chenopodium quinoa Willd.), originated from the Andean region of South America, shows more significant salt tolerance than other crops. To reveal how the plant hormone ethylene is involved in the quinoa responses to salt stress, 4-week-old quinoa seedlings of ‘NL-6′ treated with water, sodium chloride (NaCl), and NaCl with ethylene precursor 1-aminocyclopropane-1-carboxylic acid (ACC) were collected and analyzed by transcriptional sequencing and tandem mass tag-based (TMT) quantitative proteomics. A total of 9672 proteins and 60,602 genes was identified. Among them, the genes encoding glutathione S-transferase (GST), peroxidase (POD), phosphate transporter (PT), glucan endonuclease (GLU), beta-galactosidase (BGAL), cellulose synthase (CES), trichome birefringence-like protein (TBL), glycine-rich cell wall structural protein (GRP), glucosyltransferase (GT), GDSL esterase/lipase (GELP), cytochrome P450 (CYP), and jasmonate-induced protein (JIP) were significantly differentially expressed. Further analysis suggested that the genes may mediate through osmotic adjustment, cell wall organization, reactive oxygen species (ROS) scavenging, and plant hormone signaling to take a part in the regulation of quinoa responses to ethylene and salt stress. Our results provide a strong foundation for exploration of the molecular mechanisms of quinoa responses to ethylene and salt stress.
1. Introduction
Quinoa (Chenopodium quinoa Willd.), a dicotyledonous plant in the Chenopodiaceae family, originated from the Andean region of South America and has been cultivated for about 7000 years [1]. Quinoa is an allotetraploid plant (2n = 4X = 36), deriving from the genome fusion of two related parent species in the same genus [2]. Quinoa has five major ecotypes depending on its origin centers, including Highlands originating from Peru and Bolivia; Inter-Andean valleys originating from Bolivia, Colombia, Ecuador, and Peru; Salares originating from Bolivia, Chile and Argentina; Yungas originating from Bolivia; and Lowlands originating from Chile [3].
Quinoa has been considered as a pseudo-cereal because of its grain characteristics [4]. Consumption of seeds is the most common use of quinoa. In recent years, quinoa seeds have been reported to have an exceptional balance between oil, protein, and carbohydrate [4,5]. The absence of gluten in its starch allows the development of specific foods for celiac patients [1]. Quinoa seeds are also good sources of vitamins, oil with high linoleate and linolenate content, natural antioxidants, dietary fiber, and minerals [6]. As a result, consumption of quinoa in human diet leads to lower weight gain, improved lipid profile, decreased blood glucose, and increased antioxidant intake [7,8].
In addition to nutritional value in its seeds, quinoa also has resistance to multiple abiotic stresses, including drought, cold and salinity, which allows quinoa to be cultivated in non-native areas [9,10]. As a result, the United Nations Food and Agricultural Organization (FAO) declared quinoa as a major crop for global food security and sustainability under the current climate change conditions and also announced 2013 as the International Year of Quinoa, which is one of only three plants that have received such a designation [9].
Soil salinity is a major abiotic stress, and about 6.5% of the total land area of the world is affected by salt stress [11]. Soil salinization is expected to be amplified, with environmental pollution aggravating, urbanization accelerating, and global warming intensifying it. High salinity in soil causes many damages to plants, including photosynthesis reduction, membrane denaturalization, nutrient imbalance, osmotic imbalance, ion toxicity, stomatal closure, metabolism disruption, reactive oxygen species (ROS) accumulation, and oxidative stress aggravation [12,13].
Plants have evolved various mechanisms to survive high soil salinity. For instance, plants improve their salt tolerance by efficiently controlling Na+ sequestration in vacuoles, low cytosolic Na+ maintenance, better K+ retention, and a high rate of H+ pumping to keep an optimal K+/Na+ ratio in leaves or roots [14]. Organic solutes including proline, soluble sugar, glycine betaine, and polyamines are accumulated to maintain cell turgor under stress [15,16]. In addition, salt stress is able to activate antioxidant enzymes including superoxide dismutase (SOD), peroxidase (POD), and catalase (CAT) to scavenge ROS in responses to soil salinity [17,18].
Plant hormones including abscisic acid (ABA), ethylene, jasmonic acid (JA), and gibberellic acid (GA) play important roles in plant responses to salt stress. ABA was reported to play key roles in plant salt responses [19]. The negative regulator PP2Cs in ABA signaling were proved to confer resistance to salt stress [20]. Several PP2Cs were found significantly up-regulated under salt stress in quinoa [21]. Ethylene also functions in plant responses to salt stress. For example, the Arabidopsis ethylene insensitive mutants ethylene response1-1 (etr1-1), etr2-1, ethylene insensitive2-1 (ein2-1), ein2-5, ein3-1, and ein4-1 showed reduced salt tolerance [22,23,24], while the tobacco and wheat mutants with reduced ethylene sensitivity exhibited increased salt resistance [25,26]. It was reported that ethylene was important for salt responses of Arabidopsis, grapevines, maize, and tomato, and ethylene-regulated salt responses in plants mainly by maintaining the homeostasis of Na+/K+ ratio, nutrients, and ROS, and the assimilation of nitrates and sulfates [27].
Quinoa can survive in moderate to high concentrations of salt, ranging from 150 mM to 750 mM sodium chloride (NaCl), so it is more salt tolerant than wheat, corn, barley, rice, and peas, which show decreased yields when the soil solution exceeds 40 mM NaCl [28]. However, the optimal NaCl concentration for quinoa is between 100 mM to 200 mM [28,29]. Although quinoa shows more salt tolerance than other crops, the molecular mechanism of salt responses in quinoa is largely unknown.
High-throughput genomic transcriptomic analysis provides a way to excavate molecular mechanisms of salt responses in quinoa in the genomic scale [10,21,30,31]. The genome sequence of a quinoa inbred line with an estimated 967 Mb size was fully sequenced in 2017, which provided a reference genome for later transcriptomic analysis [32]. In 2007, the salt tolerance related transmembrane protein coding genes were identified in quinoa by integrating physiological data, RNA-seq, and single nucleotide polymorphism (SNP) analyses [31]. The molecular mechanisms of salt tolerance in epidermal bladder cells of quinoa were also uncovered by RNA-seq [10]. Salt-induced genes were also identified in quinoa treated with 300 mM NaCl for 1 h and 5 d [30]. The differentially expressed genes (DEGs) compared between a salt-tolerant genotype and salt-sensitive genotype were analyzed after treatment with 300 mM NaCl for 0, 0.5, 2, and 24 h in the roots of quinoa seedlings [21]. Considering the importance of the stress-regulated proteins, detection of the differentially expressed changes in protein levels of quinoa is more valuable and practical. However, there have still been no reports about the molecular regulation of salt responses detected by proteomics in quinoa.
To study the molecular mechanism of ethylene-regulated salt responses in quinoa, 4-week-old quinoa seedlings of ‘NL-6′ treated with water, NaCl, and NaCl with 1-aminocyclopropane-1-carboxylic acid (ACC) were collected and analyzed by transcriptional sequencing and tandem mass tag-based (TMT) quantitative proteomics in this research. The DEGs and differentially expressed proteins (DEPs) were analyzed by Gene Ontology (GO) enrichment analysis, Kyoto Encyclopedia of Genes and Genomes (KEGG) enrichment analysis, and their correlation analysis. The molecular regulations of quinoa responses to ethylene and salt stress were analyzed in this research.
2. Materials and Methods
2.1. Plant Material Treatment and Sample Collection
Seeds of a highland ecotype quinoa, ‘NL-6′, were obtained from Dr. Feng Li of BellaGen (Jinan, China). In this research, 4-week-old quinoa seedlings of ‘NL-6′ treated with water, 300 mM NaCl, and 300 mM NaCl with 100 μM ACC for 0, 3, 6, 9, 12, 24, and 36 h, respectively [21,30,33]. The solutions were directly irrigated to the seedling roots until soil was fully saturated, and then the excess solutions were poured out. The treated plants were collected and frozen in liquid nitrogen. The samples treated for 24 h were used for transcriptional sequencing and TMT quantitative proteomics [33]. The abbreviations of materials used in the transcriptome and proteome are presented in Table 1. The whole seedlings treated for 0, 3, 6, 9, 12, 24, and 36 h were used for later qRT-PCR verification.
2.2. Transcriptome Sequencing and Data Analysis
In this research, three independent biological replicates were used, and at least three whole quinoa seedlings were mixed in each replicate. Total RNA was extracted and purified using poly-T oligo-attached magnetic beads. cDNA was synthesized, and adaptors with hairpin loop structures were ligated to prepare for hybridization. The samples were then clustered on a cBot cluster generation system using TruSeq PE Cluster Kit v3-cBot-HS (Illumia). After cluster generation, the library preparations were sequenced on an Illumina Novaseq platform by Novogene Bioinformatics Technology Co. Ltd. (Beijing), and 150 bp paired-end reads were generated. The raw data of FASTQ format were uploaded to the NCBI Sequence Read Archive (SRA), and the SRA accession number is PRJNA726352.
The reference genome was downloaded from the website https://www.ncbi.nlm.nih.gov/genome/?term=quinoa (accessed on 30 June 2022), and the paired-end clean reads were aligned to the reference genome using Hisat2 v2.0.5. Fragments per kilobase of transcript sequence per million (FPKM) of each gene were calculated to estimate gene expression levels based on the length of the gene and reads count mapped to the gene. The genes with corrected p-value < 0.05 and absolute fold change ≥2 were considered as significant DEGs. The DEGs were then analyzed by GO enrichment analysis and KEGG enrichment analysis to predict their functions.
2.3. Protein Extraction, TMT Labeling, and Proteomics Analysis
In this research, three independent biological replicates were used for protein analysis, and at least three whole quinoa seedlings were mixed in each replicate. The proteomics analyses were performed by Novogene Bioinformatics Technology Co. Ltd. (Beijing, China). In detail, total proteins were extracted by the cold acetone method, labeled by TMT tags, and fractionated using a C18 column on a Rigol L3000 HPLC system. Shotgun proteomics analyses were then performed using an EASY-nLCTM 1200 UHPLC system (Thermo Fisher, Waltham, MA, USA) coupled with a Q ExactiveTM HF-X mass spectrometer (Thermo Fisher) operating in the data-dependent acquisition (DDA) mode.
The resulting spectra from each run were searched separately against the 733788-X101SC20124467-Z02-Chenopodium quinoa Willd.-NCBI.fasta database by Proteome Discoverer 2.4 (PD 2.4, Thermo). Peptide spectrum matches (PSMs), with credibility of more than 99%, were identified, and the identified PSMs and proteins were retained and performed with FDR no more than 1.0%. Proteins with fold changes in a comparison >1.2 or <0.83 and unadjusted significance level p < 0.05 were considered as DEPs. The DEPs were then analyzed by GO and KEGG enrichment analyses. The mass spectrometry proteomics data were deposited to the ProteomeXchange Consortium (http://proteomecentral.proteomexchange.org (accessed on 24 May 2021)) via the iProX partner repository [34] with the dataset identifier PXD026210.
2.4. Correlation Analysis between Proteomic and Transcriptomic Results
The DEGs and the DEPs were separately counted, and the Venn diagrams were plotted according to the counted results. Correlation analysis was performed for the differential multiples of DEGs or DEPs identified in both transcriptomic analysis and proteomic analysis by R (version 3.5.1).
2.5. Quantitative Real Time PCR (qRT-PCR) Analysis
In this research, 12 DEGs were selected randomly for qRT-PCR verification, and the coding sequence (CDS) of these selected 12 DEGs are listed in the Supplementary Material Table S1. CqACTIN was used as the endogenous control. The primers were designed using Primer Premier 5.0 (Premier) and are listed in Supplementary Material Table S2. Total RNA was extracted by the CTAB method and subjected to DNase treatment (Takara, Japan). The first-strand cDNA was synthesized using M-MLV reverse transcriptase (Takara, Japan) with oligo d(T)18 primer. The qRT-PCR program contains a preliminary step of 2 min at 50 °C, 10 min at 95 °C, followed by 40 cycles of 95 °C for 60 s, 56 °C for 20 s, and 72 °C for 15 s. Three independent biological replicates and three technical replicates were used. The primer efficiency was tested by generating standard curves, and the data were analyzed by the comparative ΔΔCT method.
2.6. Physiological Indexes Detection
In this research, 4-week-old quinoa seedlings of ‘NL-6′ treated with water, 300 mM NaCl, or 300 mM NaCl with 100 μM ACC for 2–3 d were used for examination of physiological indexes. The nitrogen content and relative level of total chlorophyll were measured by PJ-4N plant nutrition analyzer, and the relative permeability of cell membrane, damage rate of leaves, malondialdehyde (MDA) content, soluble sugar level, and SOD activity were analyzed as previously described [35]. Three independent biological replicates and three technical replicates were used in the experiments.
2.7. Statistical Analyses
Statistical analyses were performed by SAS, and the statistical significance of the difference was evaluated by ANOVA. Means followed by the same letter were not significantly different at the α = 0.05 level.
3. Results
3.1. Gene Identification and DEGs Analysis in Transcriptome
To investigate ethylene-regulated salt responses in quinoa, the 4-week-old H2Or, SALTr, and ACCr samples were used for transcriptomic analysis. The principal component analysis (PCA) showed the differences among different treatments and confirmed the reliability of the sequencing results (Supplementary Material Figure S1A). A total of 60,602 genes were identified, and the genes with corrected p-value < 0.05 and absolute fold change ≥2 were considered as significant DEGs. The DEGs between SALTr and H2Or were recognized as the components in salt responses of quinoa. The DEGs between SALTr and ACCr were recognized as functioning in ethylene-regulated salt responses of quinoa, and the DEGs between ACCr and H2Or were thought to be involved in ethylene responses or salt responses of quinoa. The DEGs in these three comparisons are presented in the Supplementary Material Excel S1. The heat maps with hierarchical clustering, which show relative expression of the DEGs in these comparisons, are presented in Supplementary Material Figures S2–S4.
3.2. DEGs Detection in Ethylene and Salt Responses of Quinoa
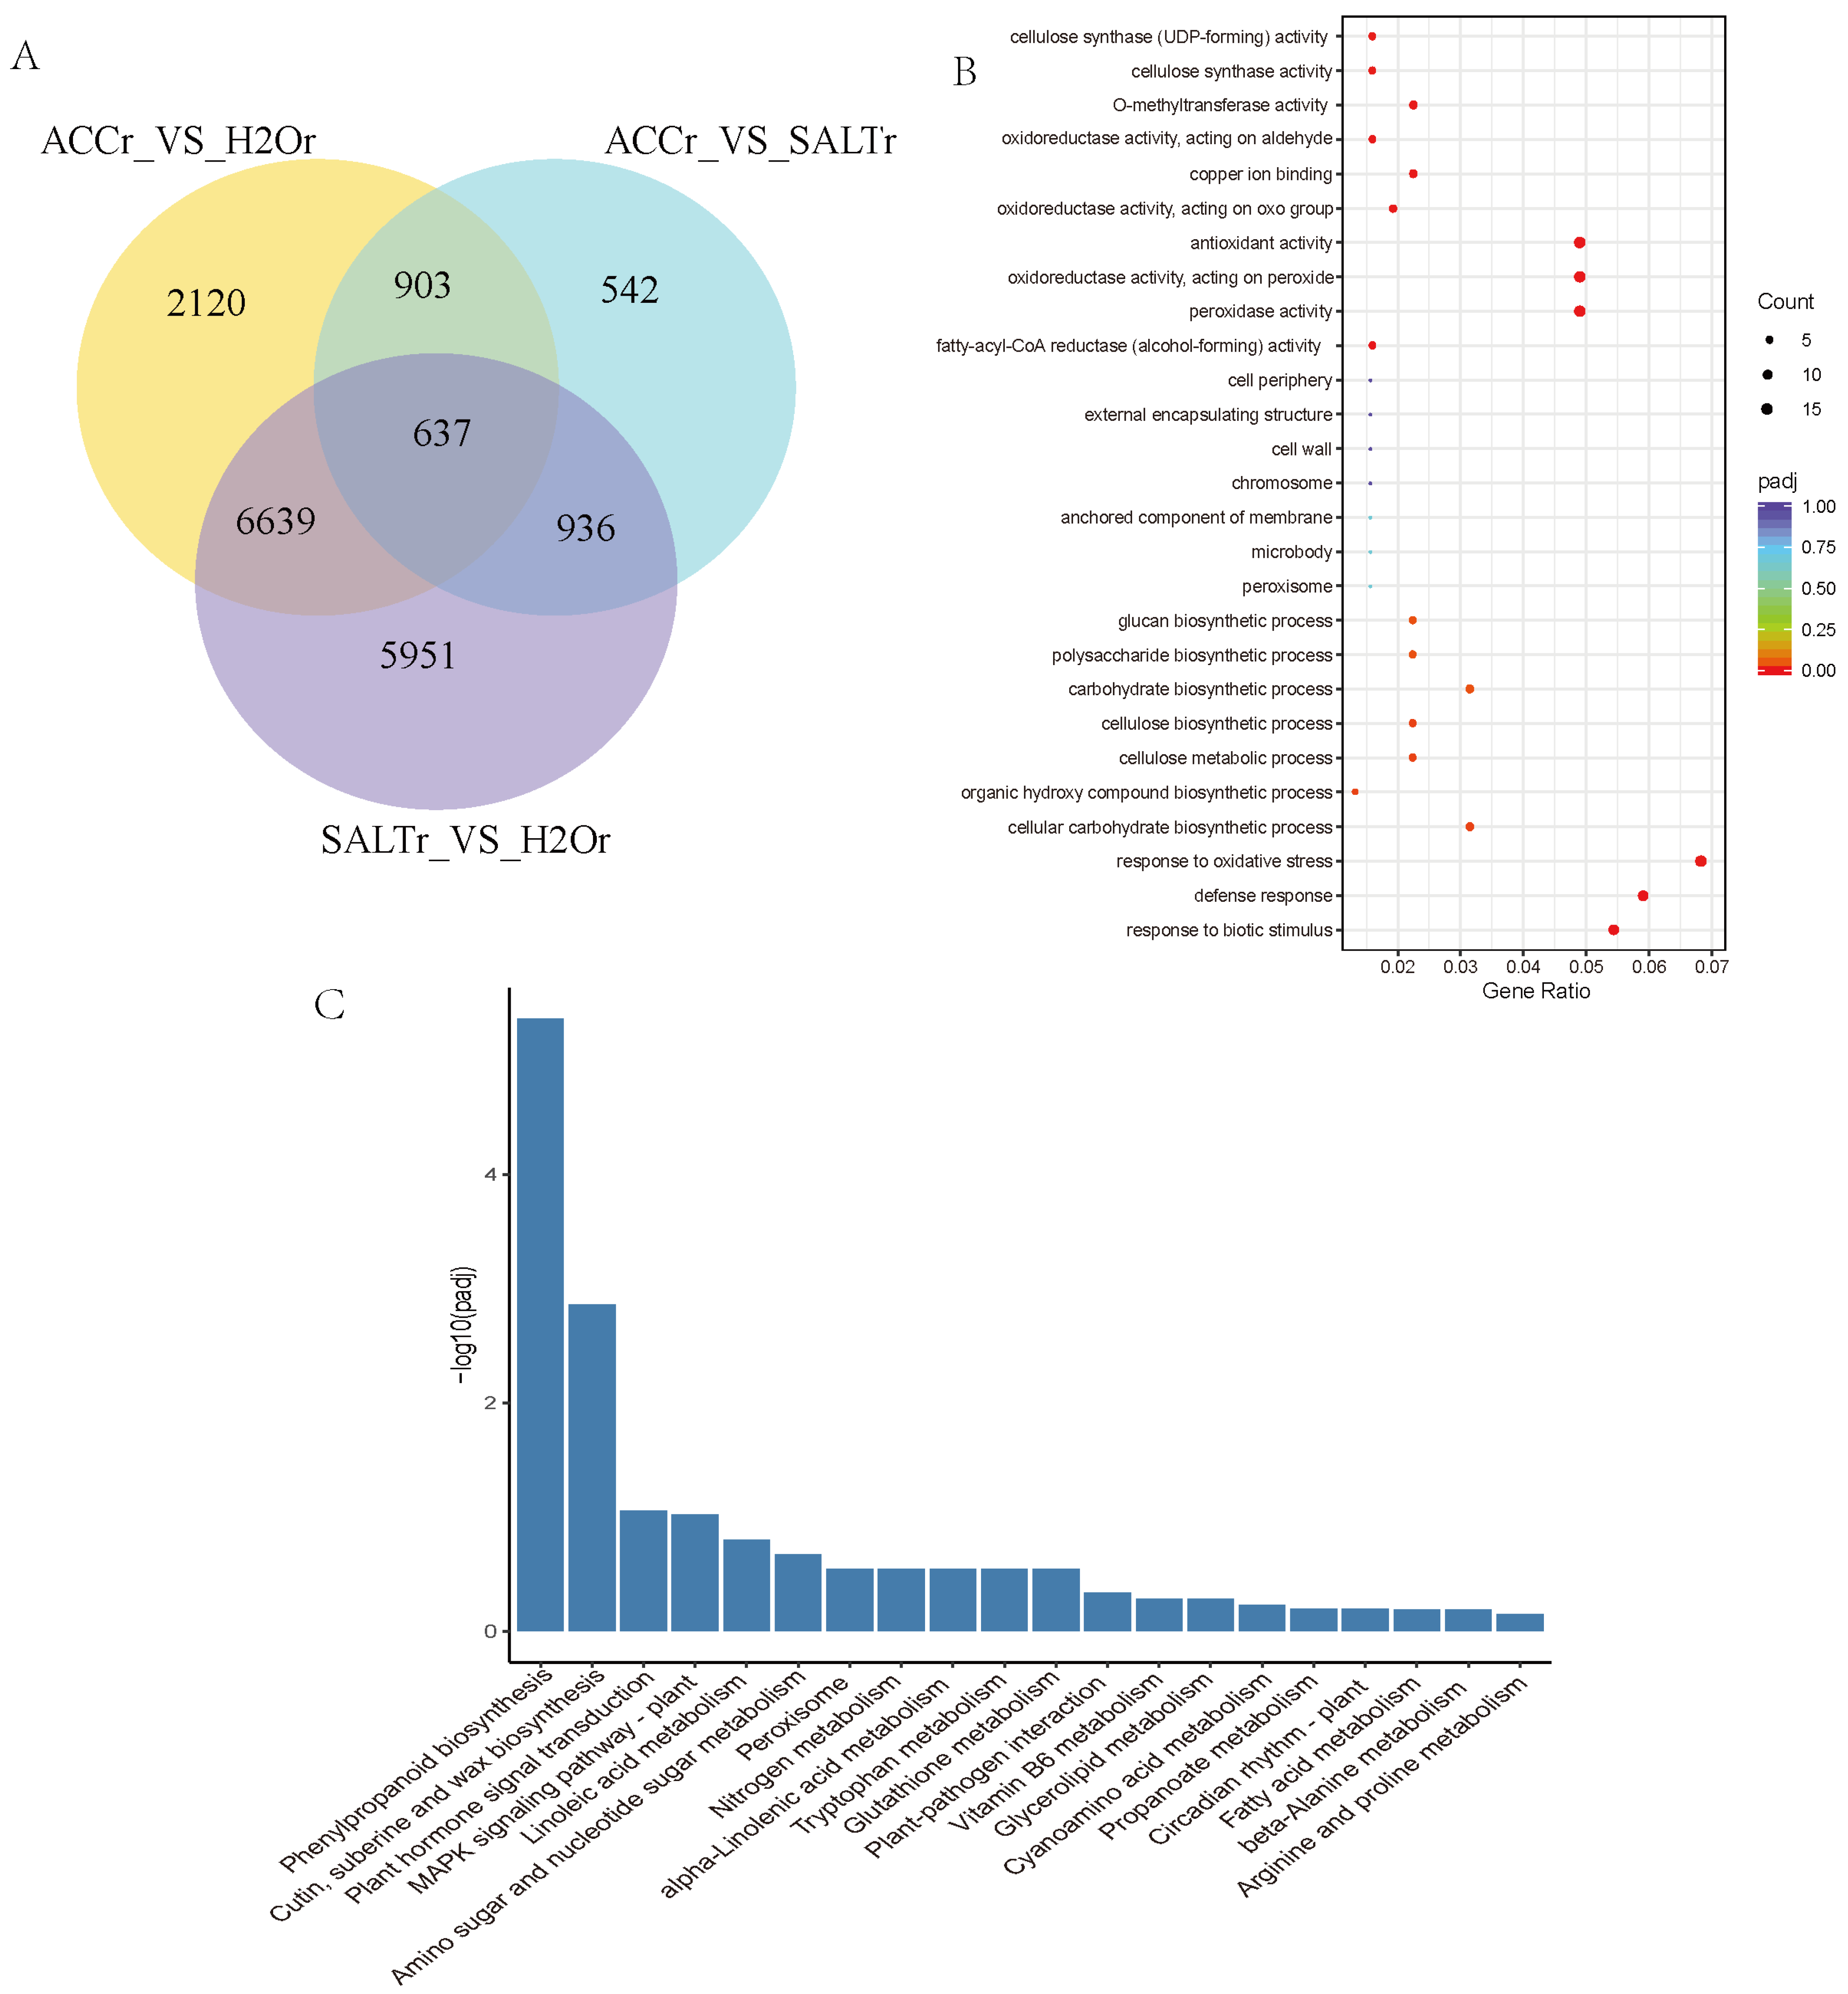
In order to confirm the DEGs in ethylene and salt responses in quinoa, multiple comparisons of DEGs among SALTr-vs-H2Or, SALTr-vs-ACCr, and ACCr-vs-H2Or were conducted, and 637 DEGs were detected in the overlapping region, which was thought to be playing a role in ethylene-regulated salt responses of quinoa (Figure 1A, Supplementary Material Excel S2). GO and KEGG enrichment analysis of these 637 DEGs suggested that most DEGs are involved in antioxidant activity, peroxidase activity, cellulose synthase activity, cellular carbohydrate biosynthesis in phenylpropanoid biosynthesis, cutin, suberine and wax biosynthesis, hormone signal transduction, and the MAPK signaling pathway (Figure 1B,C). Annotations of the DEGs including alcohol-forming fatty acyl-CoA reductases (FARs), glucosyltransferases (GTs), glycerol-3-phosphate acyltransferases (GPATs), chalcone synthases (CHSs), beta-glucosidases (BGLUs), beta-galactosidases (BGALs), cellulose synthases (CESs), trichome birefringence-like proteins (TBLs), cytochrome P450s (CYPs), glutathione S-transferases (GSTs), lipoxygenases (LOXs), pathogenesis-related proteins (PRs), GDSL esterase/lipases (GELPs), and ATP-binding cassette (ABC) transporters are listed in Table 2 and Supplementary Material Excel S2. The heat map, which shows relative expression of the DEGs in ethylene and salt responses of quinoa, is presented in Supplementary Material Figure S5.
3.3. Protein Identification and DEPs Analysis
The H2Op, SALTp, and ACCp samples were analyzed by proteomics. The PCA analysis showed the differences among different treatments and confirmed the reliability of the proteomic analysis results (Supplementary Material Figure S1B). A total of 9672 proteins were identified, and the proteins with fold change >1.2 or <0.83 and unadjusted significance level p < 0.05 were considered as DEPs. Similar to the analysis of DEGs, the DEPs between SALTp and H2Op were recognized as the components of quinoa salt responses, and the DEPs between SALTp and ACCp were recognized as functioning in ethylene-regulated salt responses of quinoa, and the DEPs between ACCp and H2Op were thought to be involved in ethylene responses or salt responses of quinoa. The DEPs in these three comparisons are presented in Supplementary Material Excel S3. The heat maps with hierarchical clustering, which show relative expression of the DEPs in these comparisons, are presented in Supplementary Materials Figures S6–S8.
3.4. DEPs Analysis in Ethylene Regulated Salt Responses
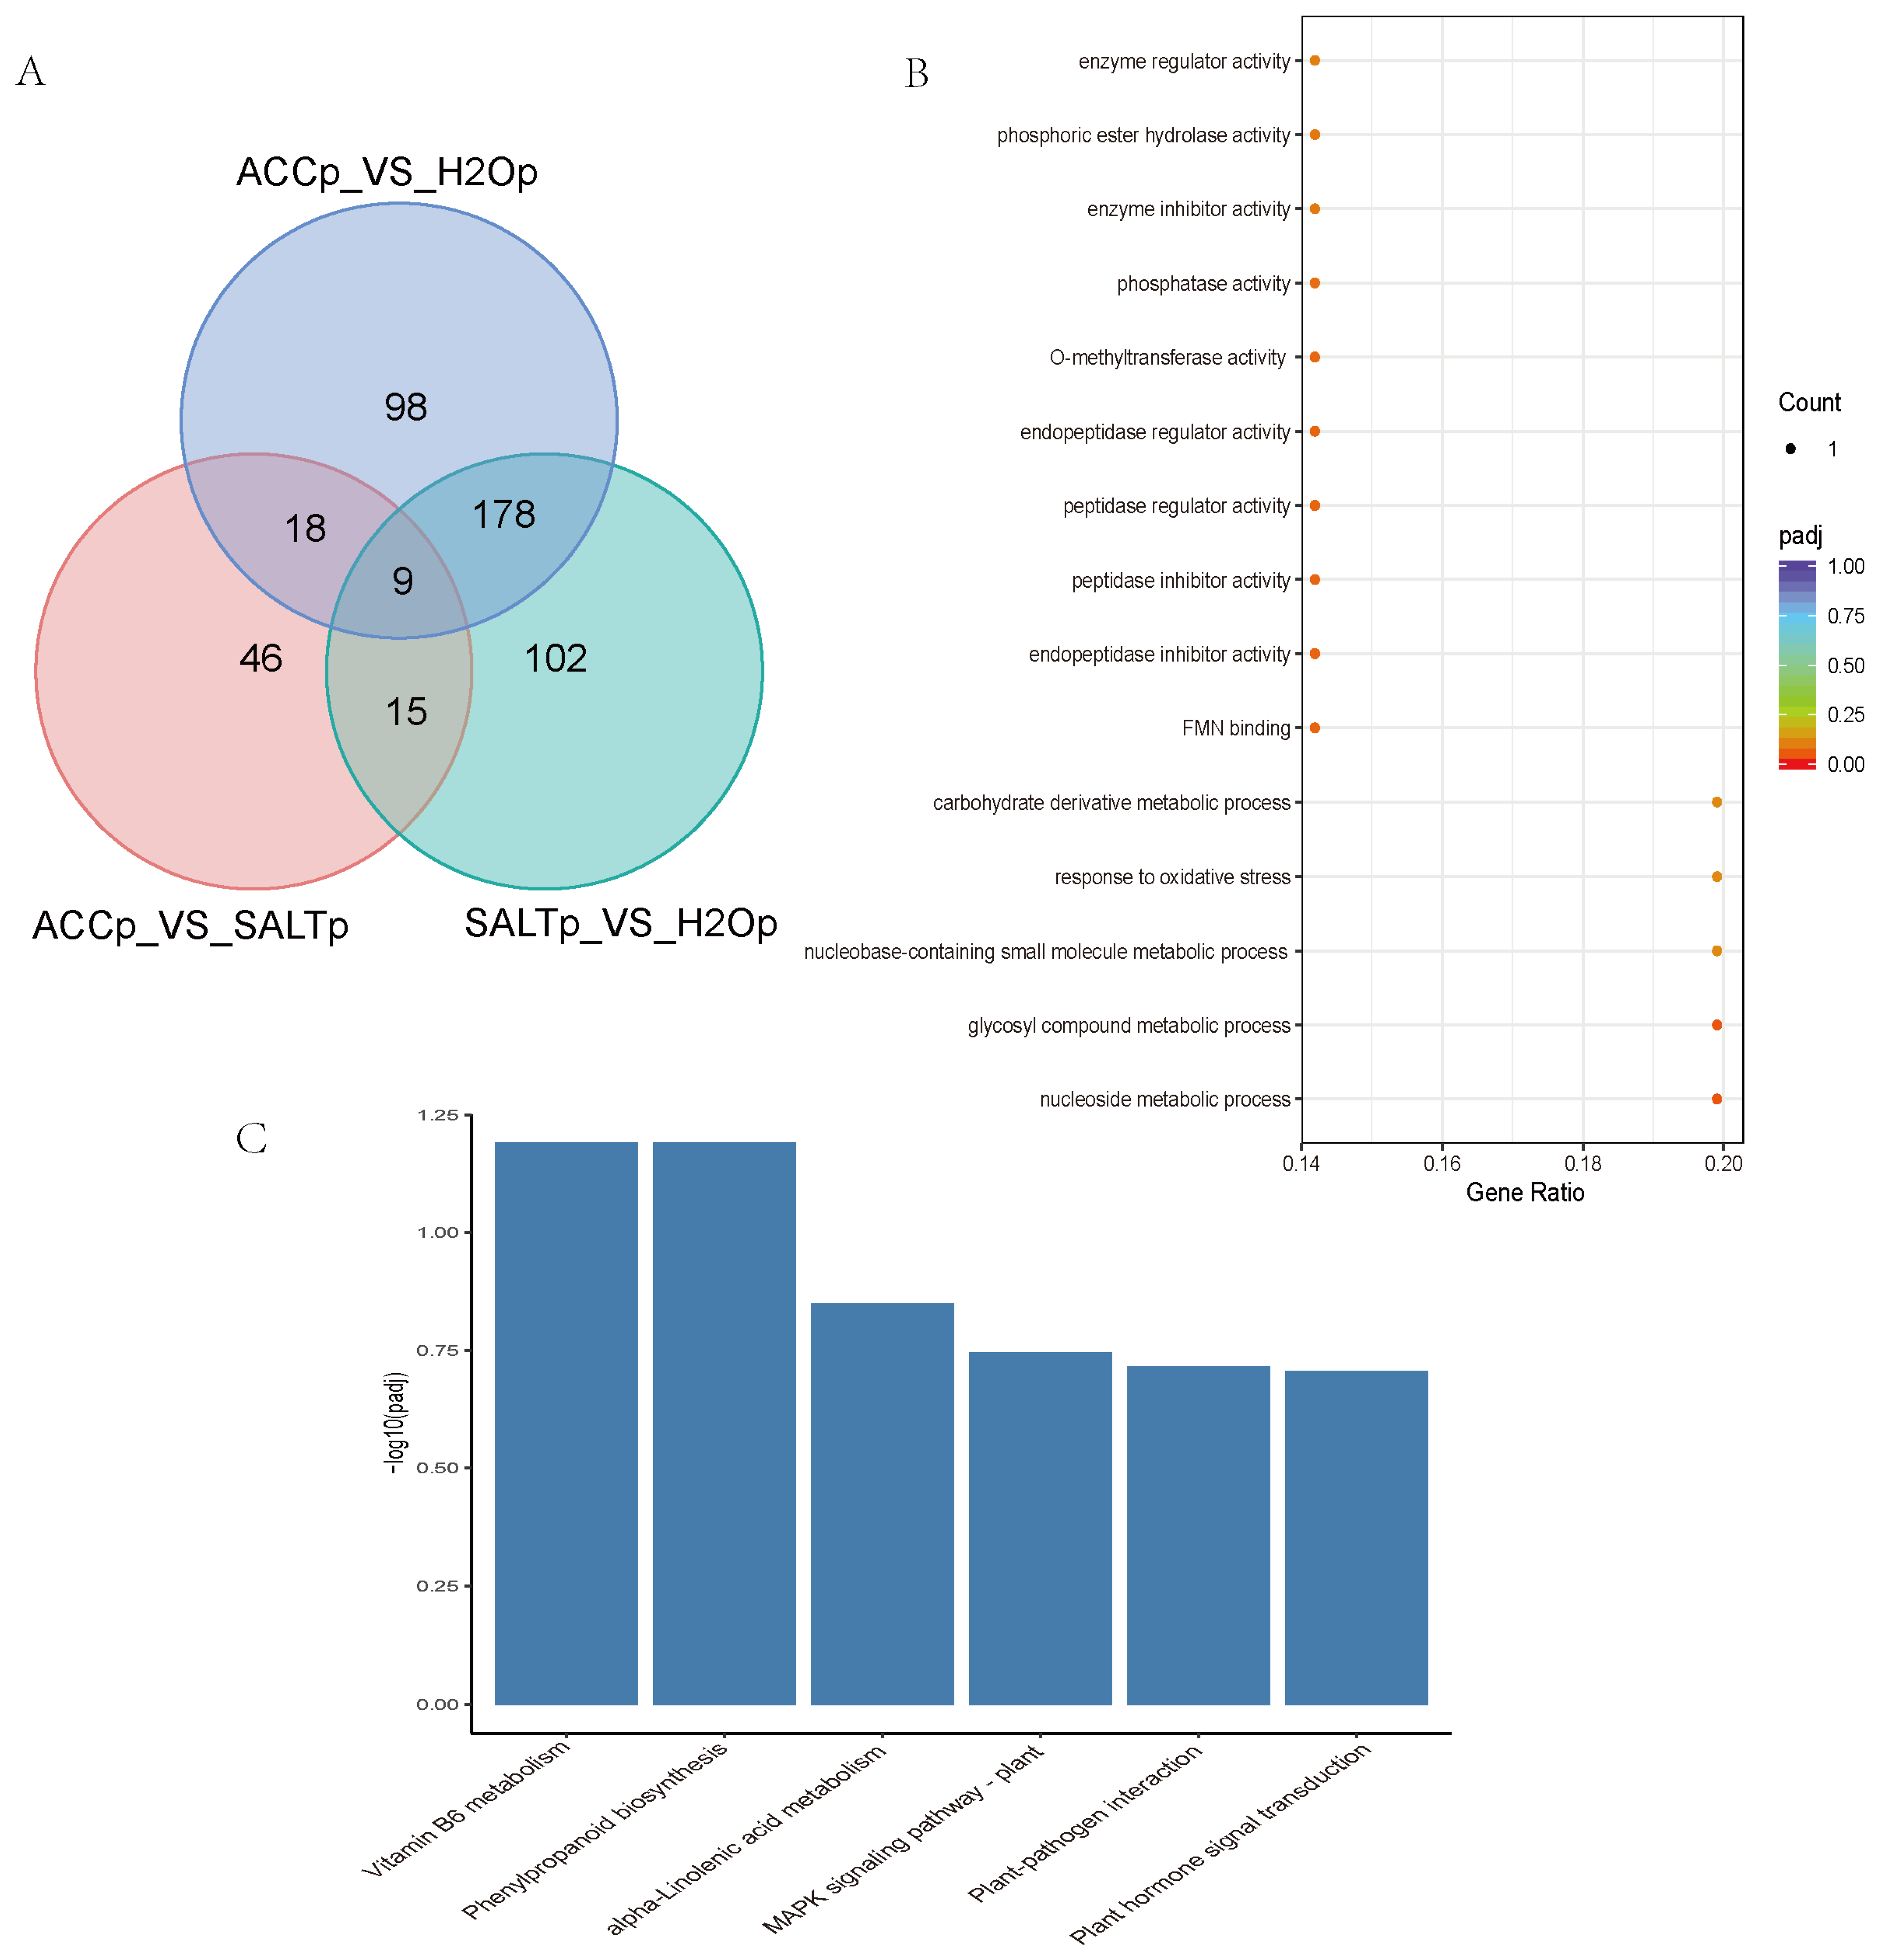
In order to study the DEPs in ethylene-regulated salt responses in quinoa, multiple comparisons of DEPs among SALTp-vs-H2Op, SALTp-vs-ACCp, and ACCp-vs-H2Op were conducted, and nine DEPs were overlapped in the comparisons and may play roles in ethylene-regulated salt responses of quinoa (Figure 2A, Supplementary Material Excel S4). These nine DEPs were annotated as POD, 12-oxophytodienoate reductase (OPR), PR, aquaporin, pyrophosphatase (PPase), Kunitz-type trypsin inhibitor (KTI), bark storage protein (BSP), and O-methyltransferase (OMT), respectively (Table 2, Supplementary Material Excel S4). The heat map, which shows relative expression of the DEPs in ethylene-regulated salt responses of quinoa, is presented in Supplementary Material Figure S5. GO and KEGG enrichment analysis suggested that the DEPs may mostly function in oxidative stress and diverse metabolic processes in vitamin B6 metabolism, phenylpropanoid biosynthesis, linolenic acid metabolism, plant–pathogen interactions, hormone signal transduction, and the MAPK signaling pathway (Figure 2B,C).
3.5. Correlation between the Proteomic and Transcriptomic Results
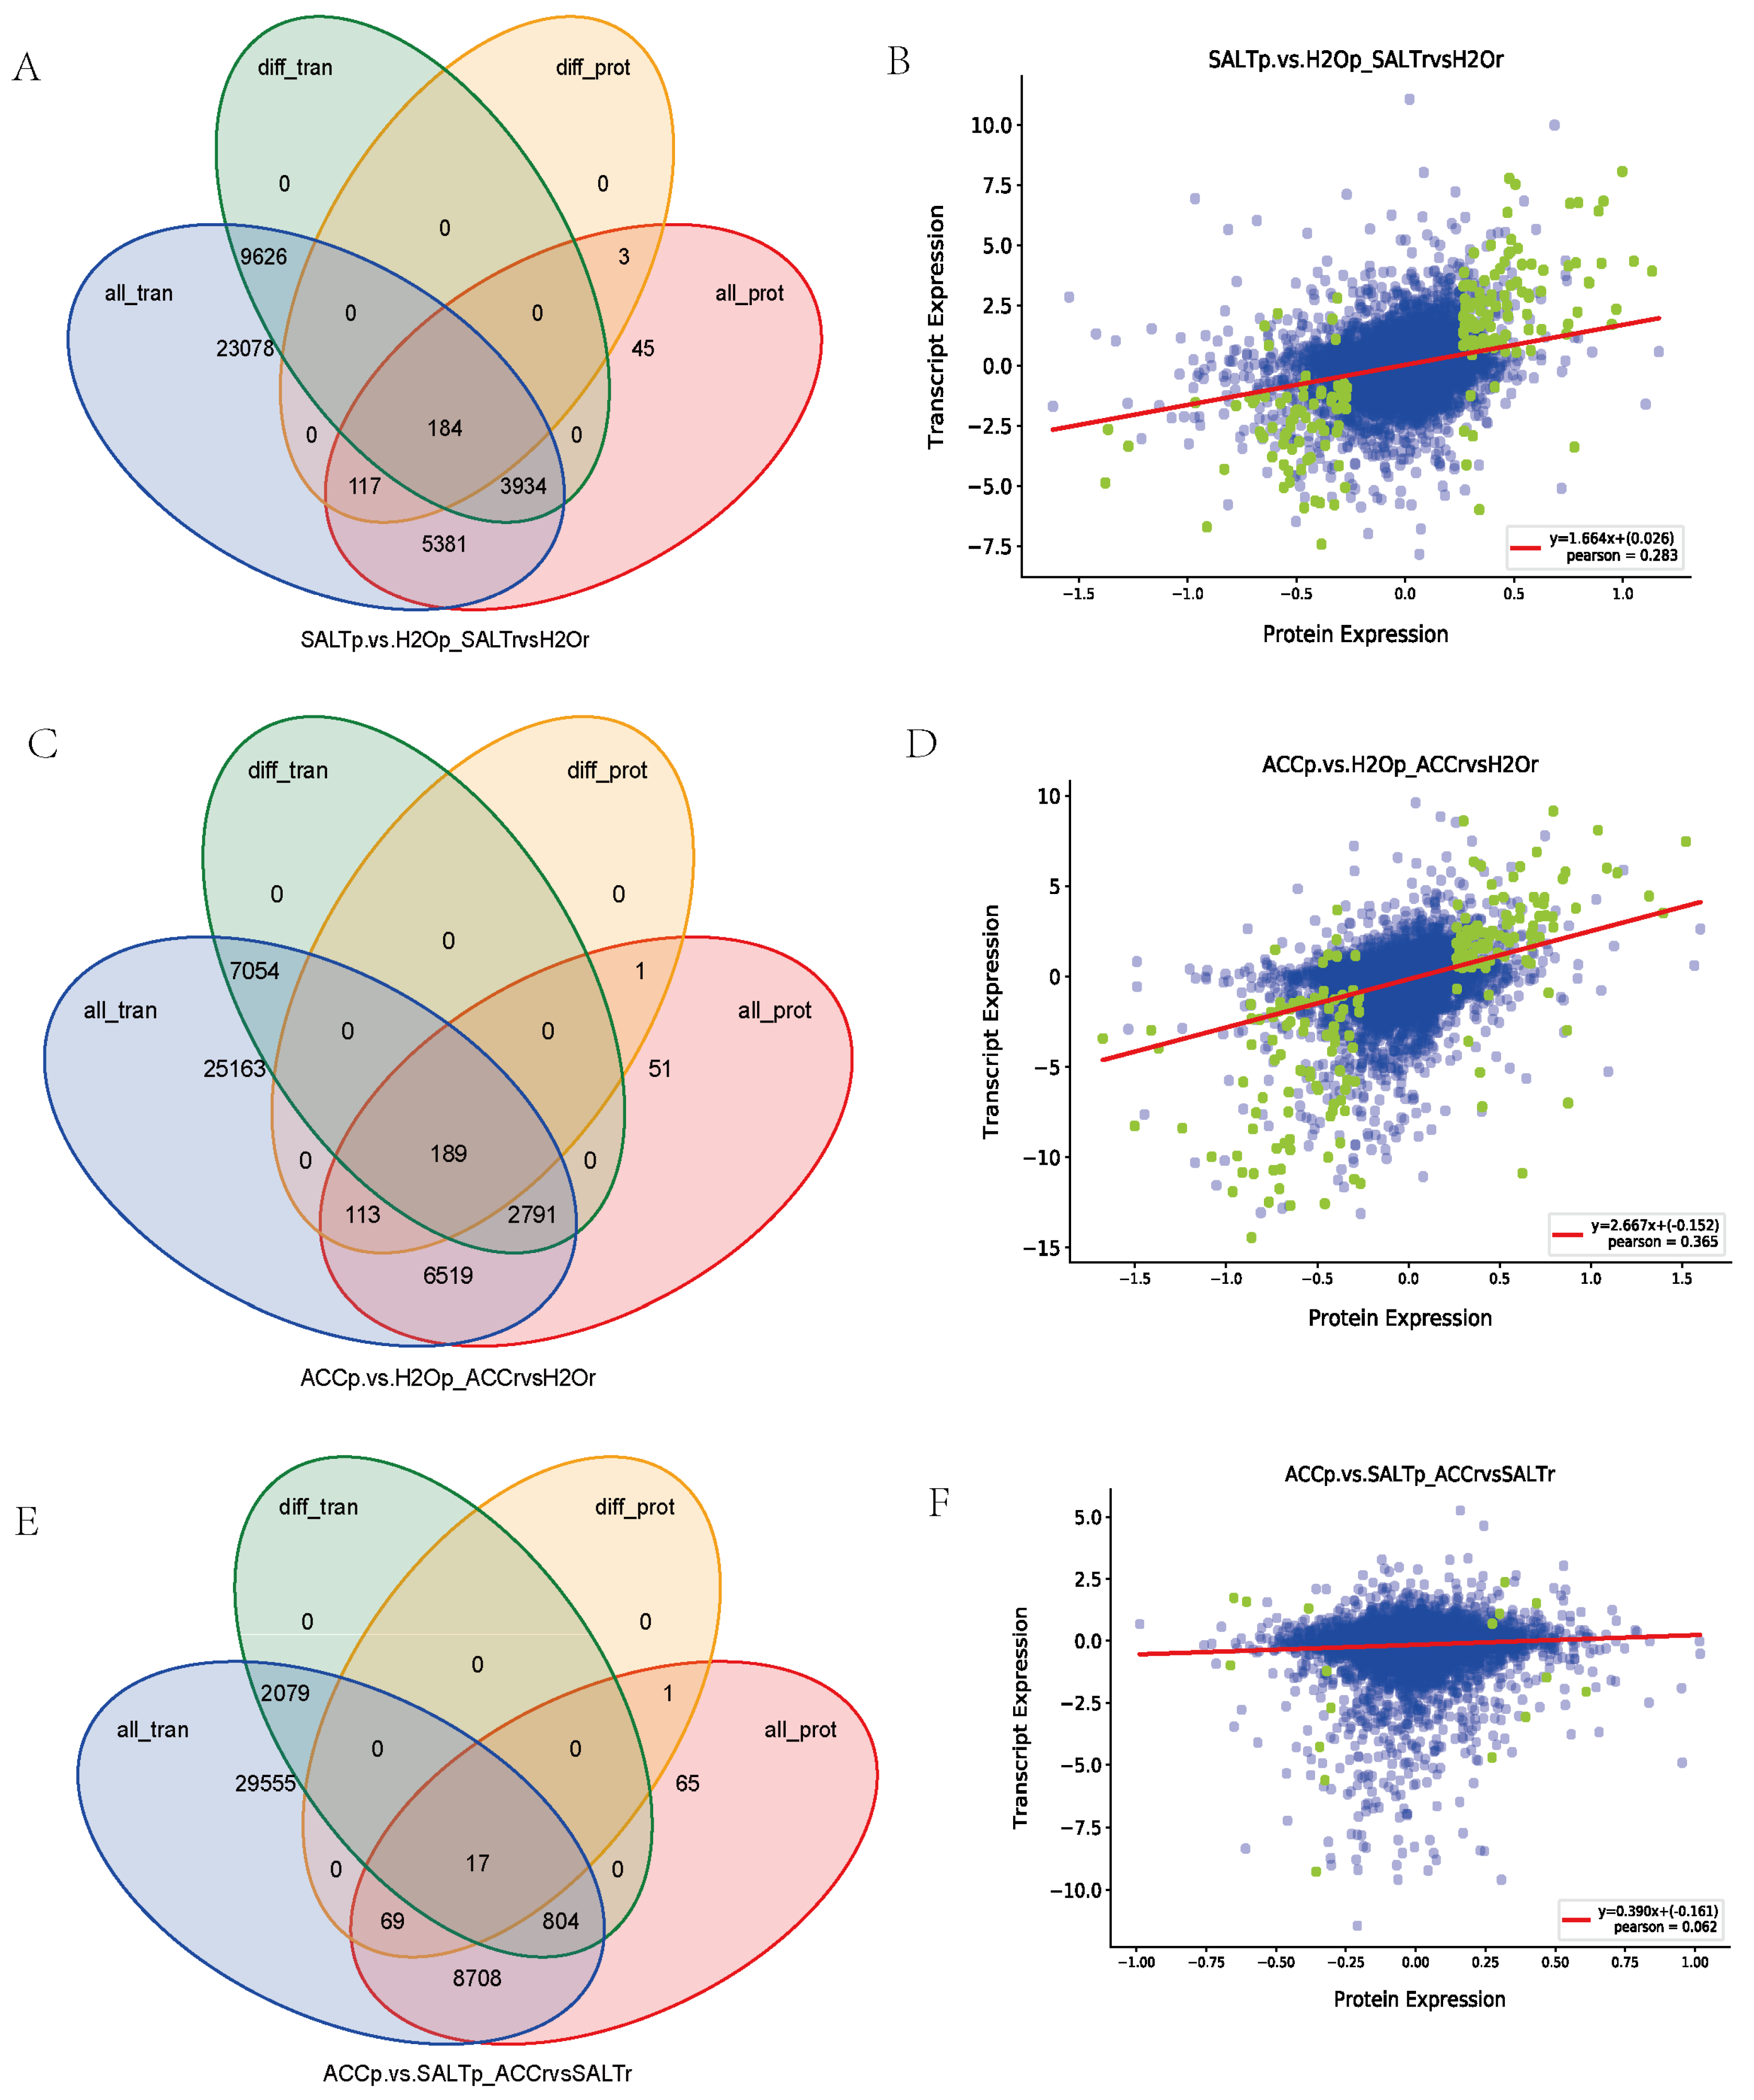
Correlation analysis between the transcriptomic data and the proteomic result identified 184 genes/proteins, which were differentially expressed when treated with salt in quinoa (Figure 3, Supplementary Material Excel S5). A total of 189 genes/proteins were detected in salt responses or ethylene responses of quinoa (Figure 3, Supplementary Material Excel S5). Among them, 17 genes/proteins may function in quinoa responses to ethylene and salt stress (Figure 3, Supplementary Material Excel S5).
The correlation analysis between the transcriptome and proteome also detected 117, 113, and 69 proteins differentially expressed in the comparisons between SALT and H2O samples, between ACC and H2O samples, and between ACC and SALT samples, respectively, but no expression difference was detected in their transcript levels, suggesting a possible presence of post-transcriptional modification in the proteins (Figure 3, Supplementary Material Excel S5).
In contrast, it was found that 3934, 2791, and 804 genes were detected differentially expressed at the transcript level but not at the protein level in the comparisons between SALT and H2O samples, between ACC and H2O samples, and between ACC and SALT samples, respectively (Figure 3, Supplementary Material Excel S5), suggesting that stress-regulated molecules are more likely altered at the transcript level when challenged.
3.6. Verification of RNA-seq Results by qRT-PCR
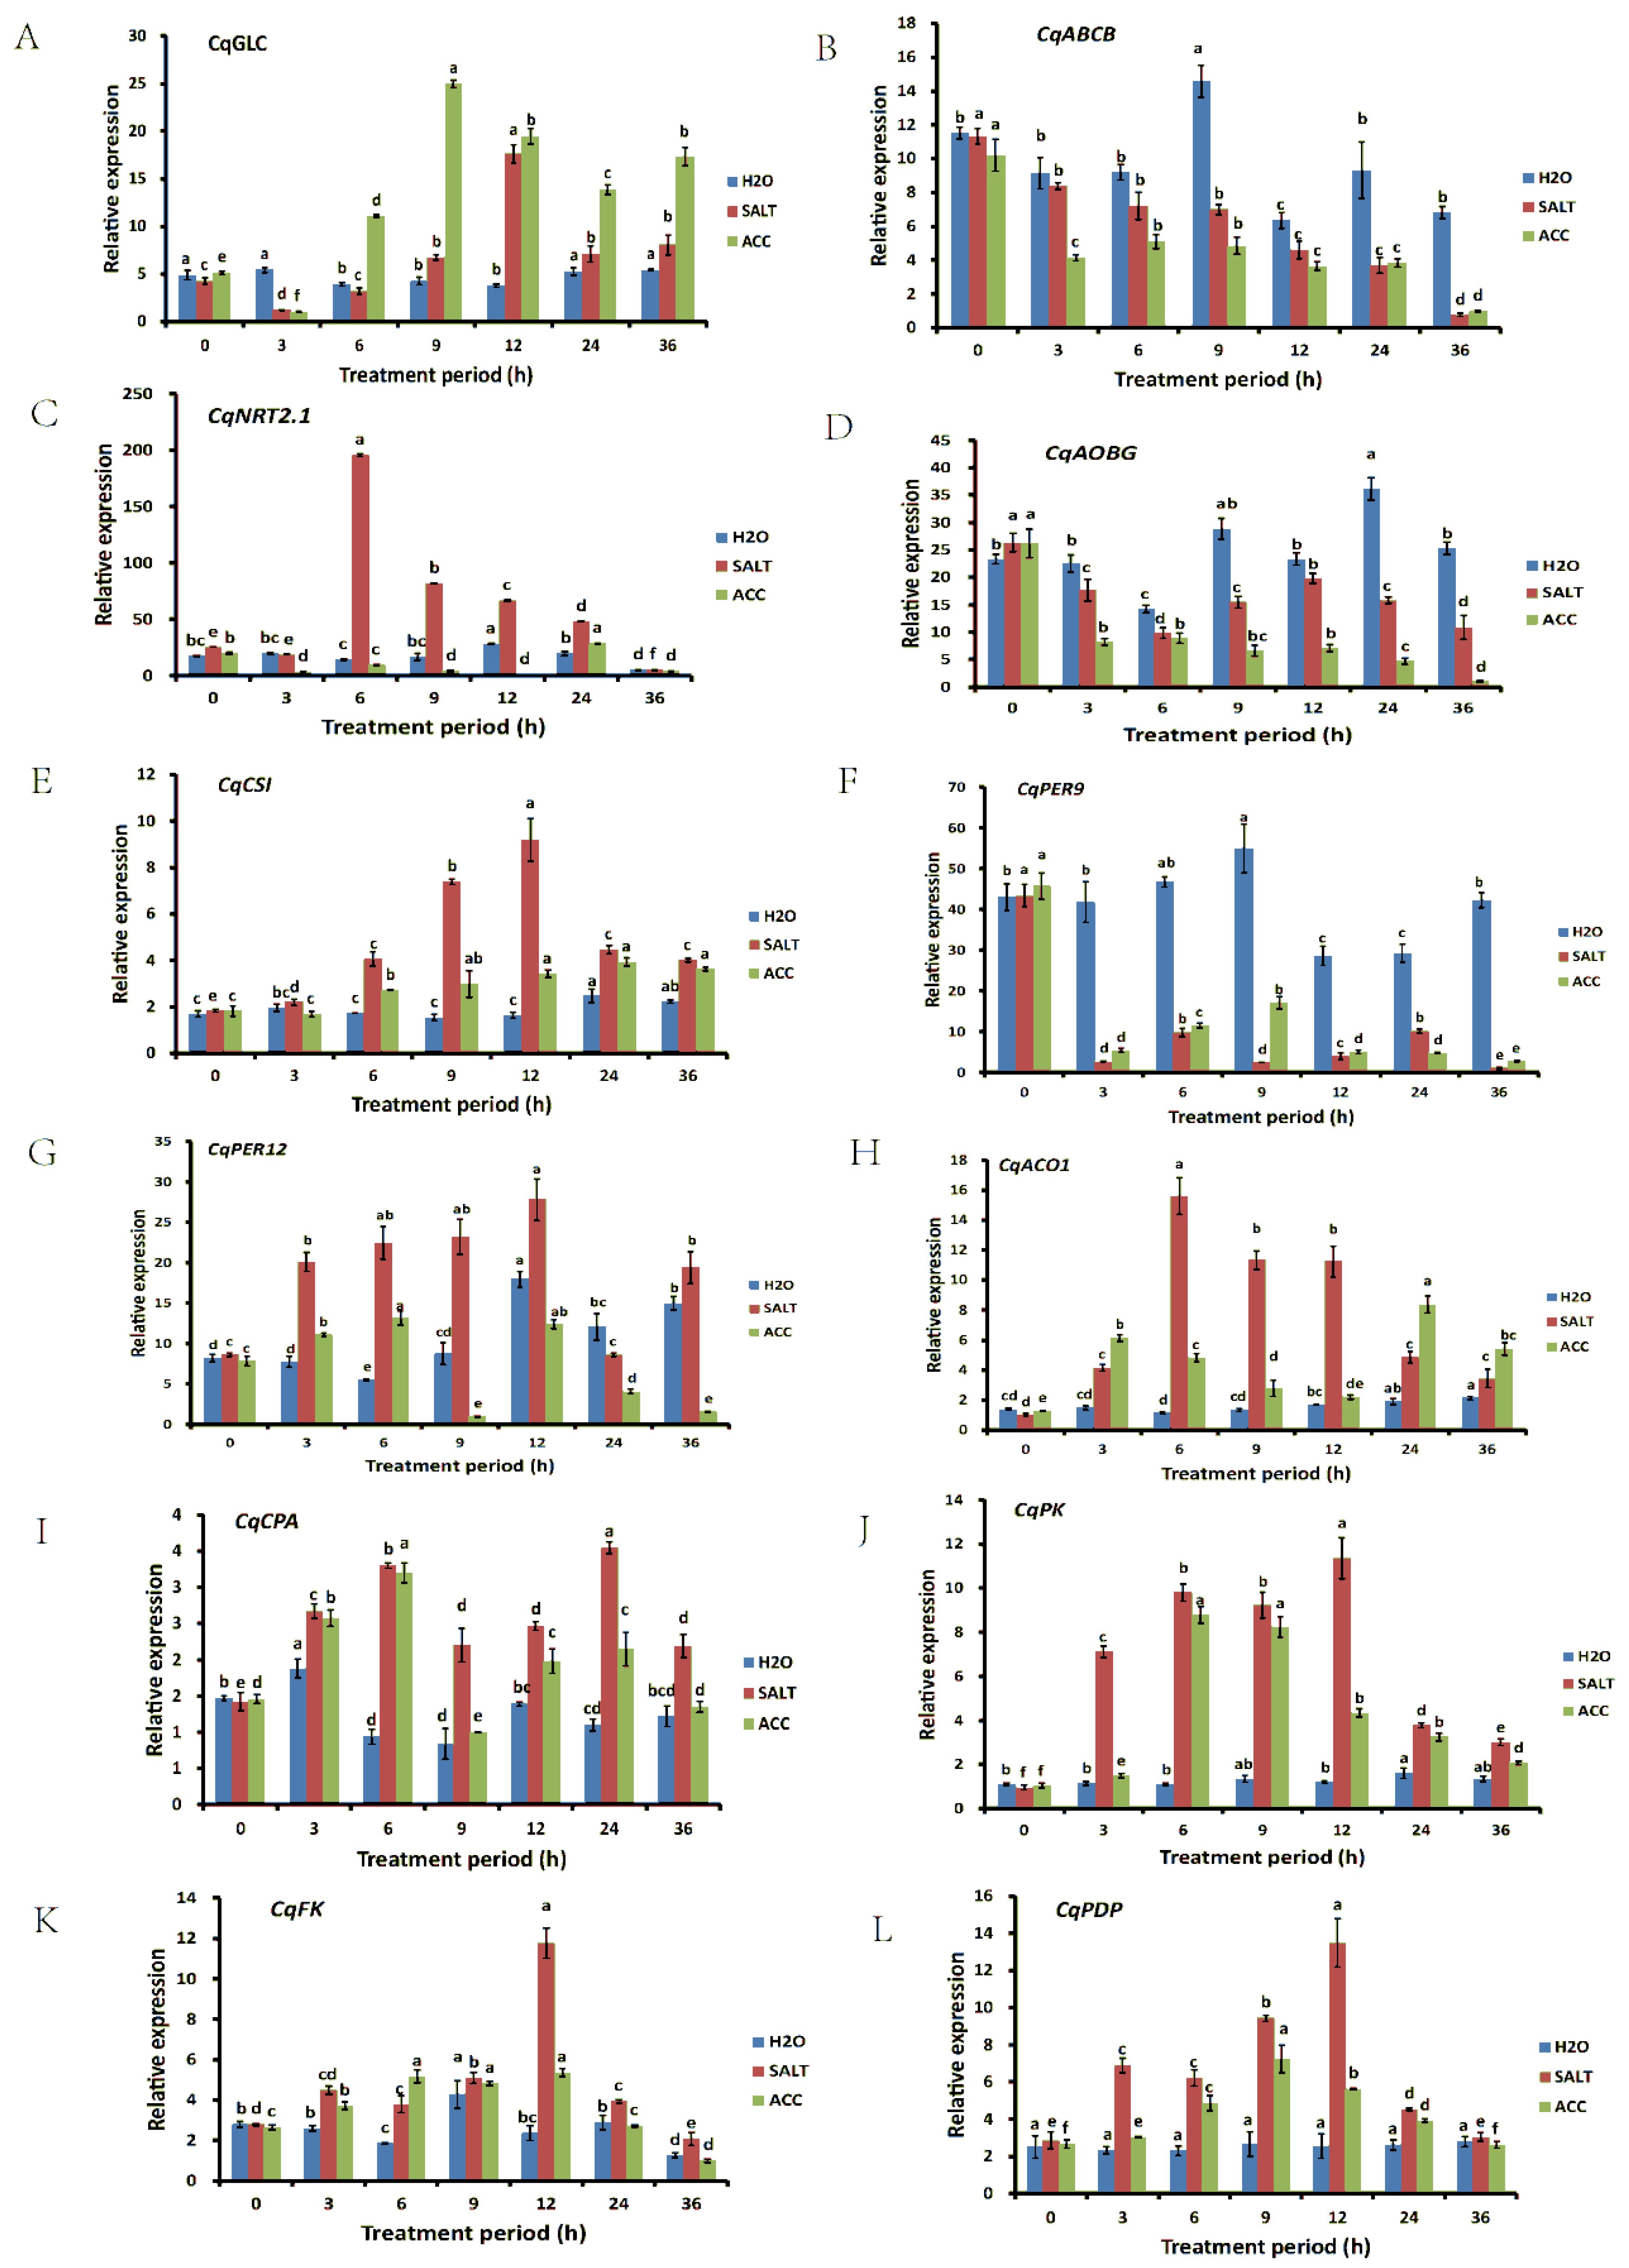
In order to verify the results obtained from the quinoa transcriptomic and proteomic analysis in ethylene-regulated salt responses, 12 DEGs were randomly selected, and their relative expression levels were examined in the quinoa seedlings treated with water, NaCl, and NaCl with ACC for 0, 3, 6, 9, 12, 24, and 36 h. The expressions of the reference genes under the different treatments are shown in Supplementary Material Excel S6. The results showed that the expressions of CqNRT2.1 and CqACO1 were increased to a peak after 6 h of salt treatment and then began to decrease, while the expressions of CqCSI, CqPER12, CqFK, and CqPDP were increased to a peak after 12 h of salt treatment and then began to decrease (Figure 4). The expression of CqABCB kept decreasing in SALT and ACC samples (Figure 4). Together, the expressions of these 12 DEGs were obviously affected by salt and ethylene, suggesting that they may play important roles i.
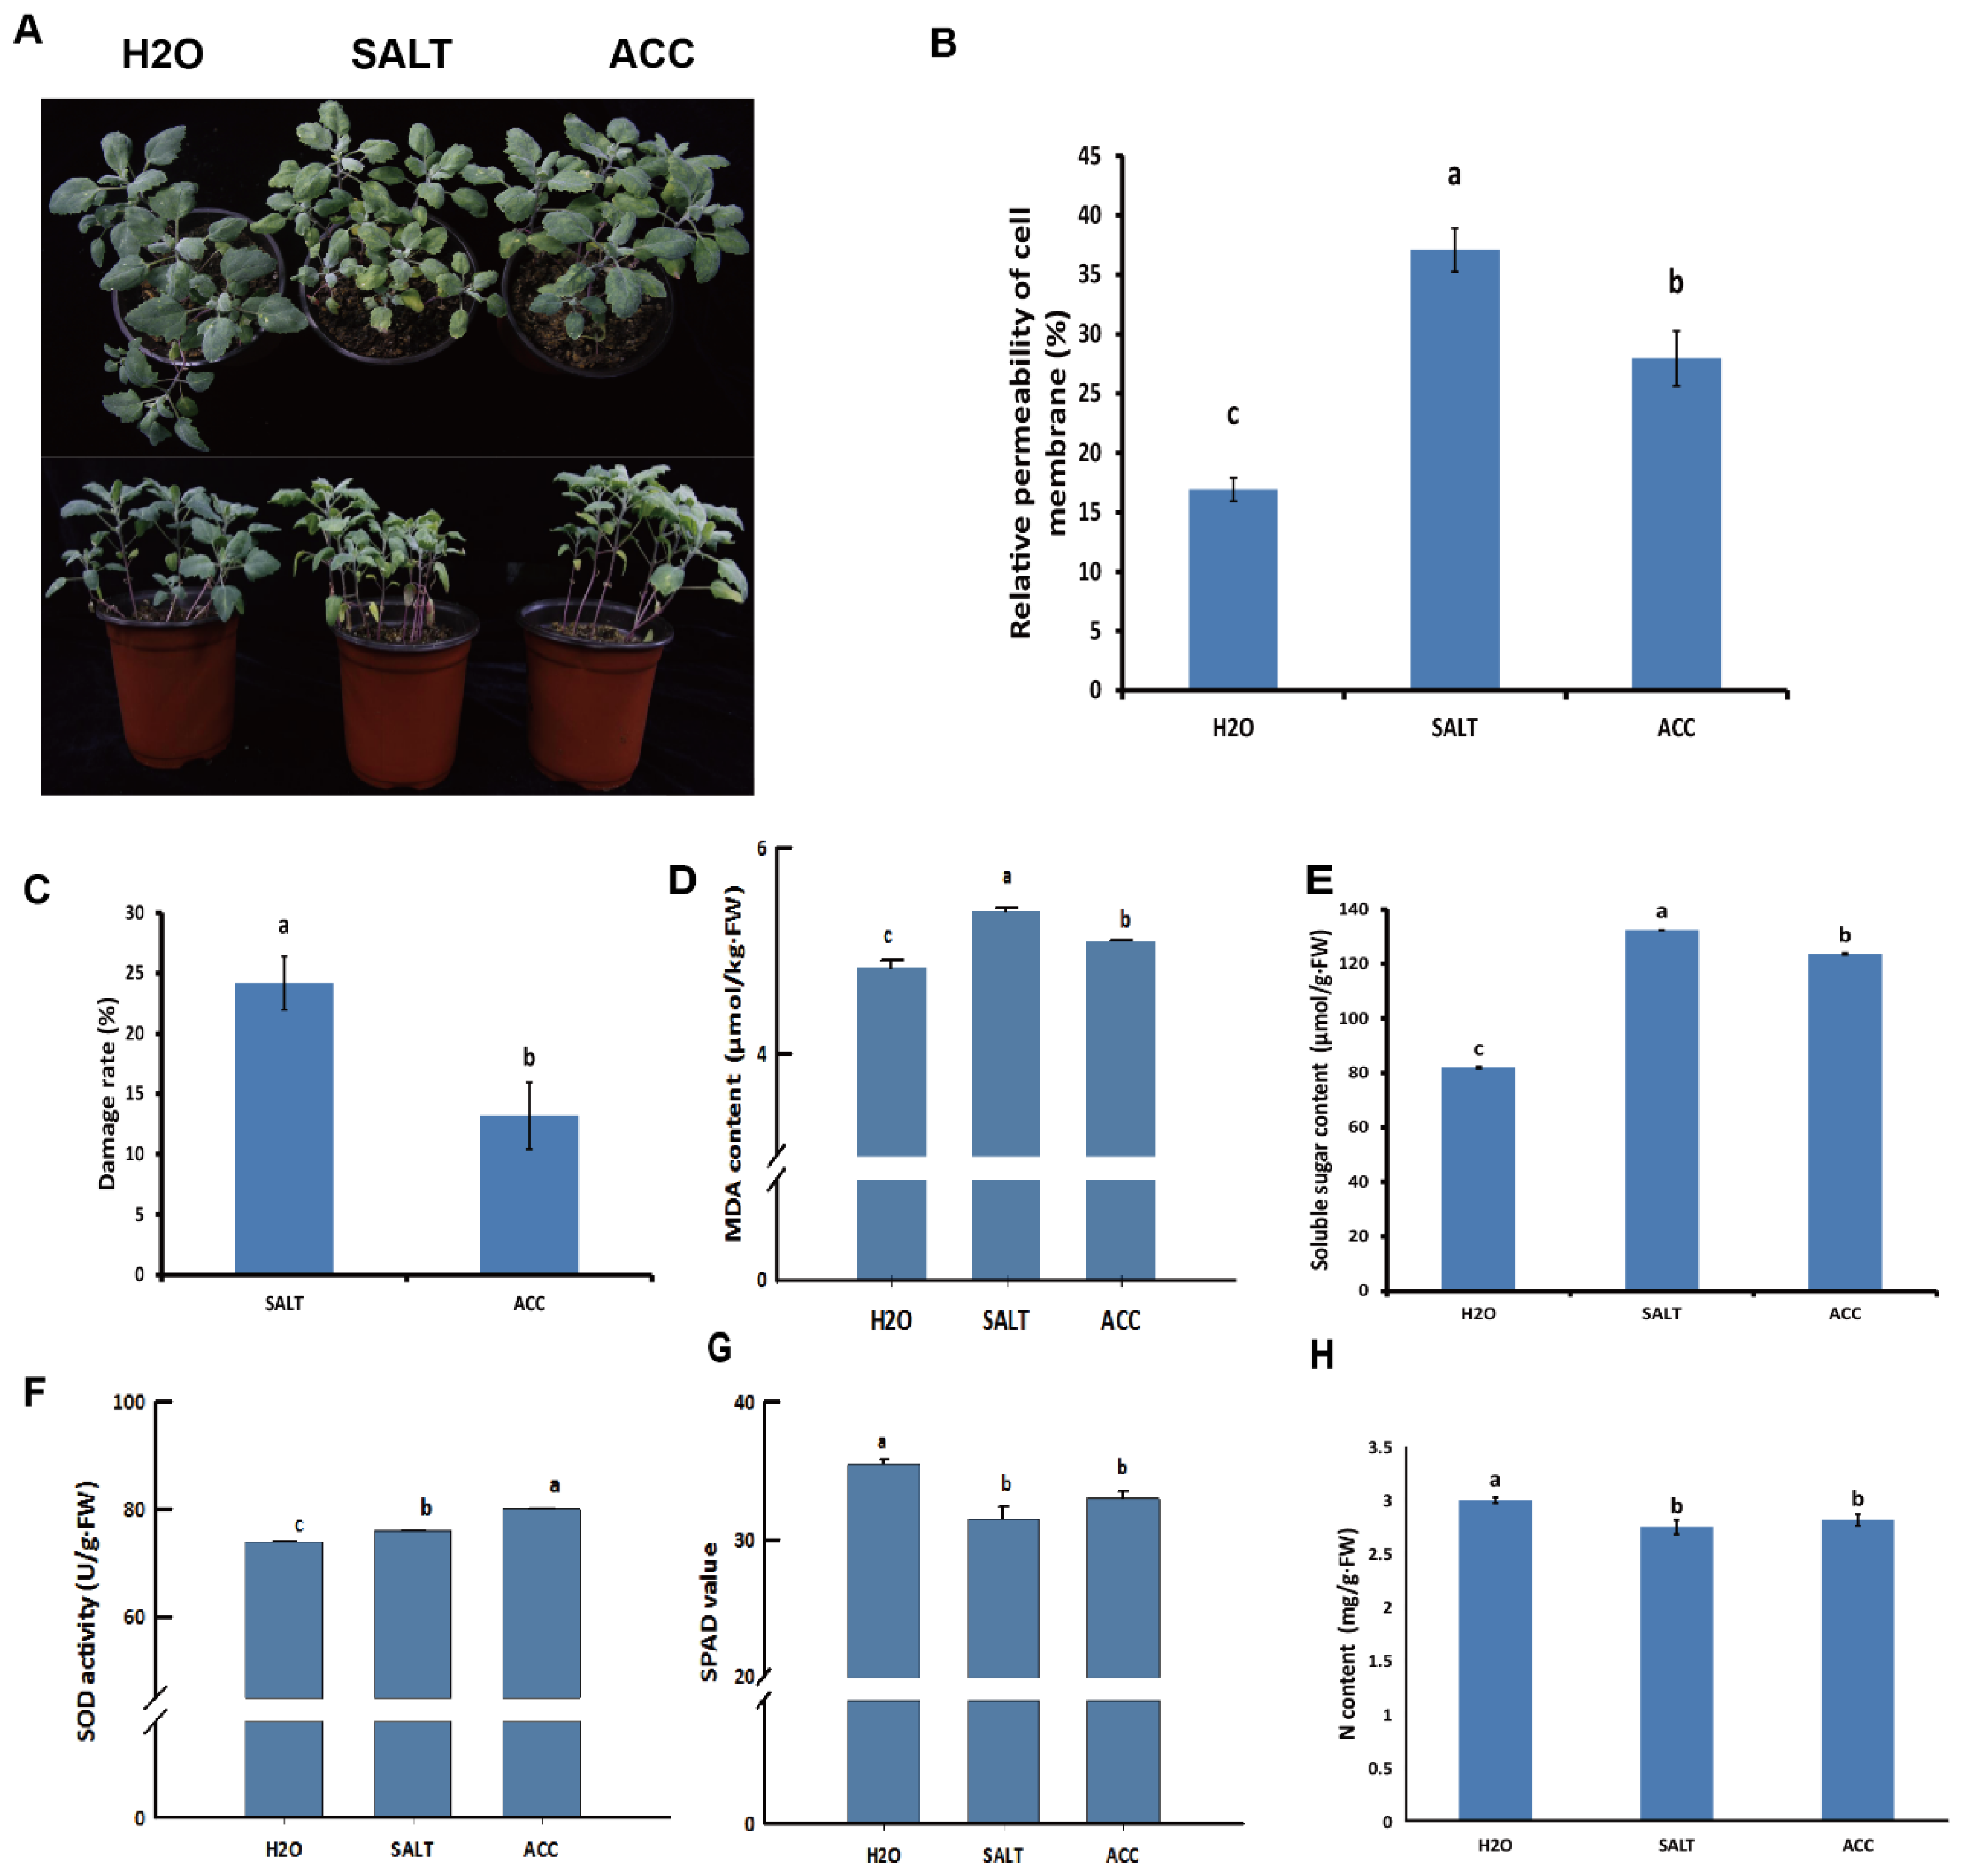
3.7. Physiological Alterations by Ethylene and Salt Stress
In order to examine the physiological changes in the H2O-, SALT-, and ACC-treated samples (Figure 5A), the nitrogen content, SPAD value, relative permeability of cell membrane, damage rate of leaves, MDA content, soluble sugar level, and SOD activity were detected in these samples. The results indicated that salt treatment rendered higher relative permeability of cell membranes, damage rate of leaves, MDA, and soluble sugar levels, while ethylene treatment reduced them (Figure 5B–E). The SOD activity was activated by salt treatment, which was enhanced by ethylene (Figure 5F). However, the relative content of total chlorophyll denoted by the SPAD value, and the N content were reduced due to salt treatment (Figure 5G). The effects of salt on the SPAD value and N content were alleviated by ethylene treatment, although their contents in the ACC sample were still lower than in the untreated sample (Figure 5G). Taken together, it was concluded that ethylene may regulate salt responses in different ways in quinoa.
4. Discussion
Quinoa, an ancient crop native to South America, has high nutritional value and health-promoting phytochemicals in seeds and has received increasing world-wide attention in the past decade [8,9,36]. Quinoa is resistant to multiple abiotic stresses including drought, cold, and salinity [9,10]. Salt stress is a major abiotic stress and affects ~6.5% of the total land of the world [9]. The effects of salt stress on plants are mainly divided into two components, the nonspecific osmotic stress that causes water deficit, and the specific ion effects that provoke the accumulation of toxic ions. Quinoa plants shows significant salt tolerance, but the research on quinoa responses to salt stress is still limited. High-throughput transcriptomic analysis provides a way to excavate molecular mechanism of the quinoa salt responses at the genomic scale [10,21,30,31]. Considering the importance of differentially expressed proteins in most biological processes, examination of the protein level change is more valuable and practical. Unfortunately, little is known about the molecular regulation of quinoa at the proteomic scale. In this research, 4-week-old quinoa seedlings treated with water, NaCl, and NaCl with ACC were analyzed by transcriptional sequencing and proteomics. The identified DEGs and DEPs were analyzed by GO and KEGG, and their correlation analyses was conducted. The study provides a strong foundation for further research on the molecular regulation of quinoa to ethylene and salt stress.
4.1. Plant Hormones Play Regulatory Roles in Quinoa Responses to Ethylene and Salt Stress
Plant hormones play important roles in various stress responses. For instance, ABA is thought to be essential for plant responses to abiotic stresses in many plant species including wheat, rice, and Magnolia wufengensis [19,25,37]. For example, it was reported that the rice Osnced5 mutant reduced the ABA level and decreased salt tolerance, while OsNCED5 overexpression increased the ABA level and enhanced salt tolerance, indicating the importance of ABA to the salt tolerance of rice [37]. In quinoa, the gene encoding for 9-cis-epoxycarotenoid dioxygenase (NCED) in ABA biosynthesis was strongly induced after salt treatment [30,38]. Several PP2Cs in ABA signaling were detected highly up-regulated in quinoa under salt stress by transcriptional sequencing [21]. In the present study, only one abscisic acid receptor, PYL4 (LOC110710755), was detected functioning in ethylene-regulated salt responses, one abscisic acid receptor PYL4 (LOC110714604) detected playing roles in non-ethylene-regulated salt responses, and one abscisic acid receptor PYL4 (LOC110715607) detected playing roles in ethylene responses but not in salt tolerance of quinoa (Table 2, Supplementary Materials Figure S5, Excels S2–S4, S7 and S8), suggesting that crosstalk between ABA and ethylene may exist in the quinoa stress responses.
Other hormones were also reported to be involved in quinoa stress responses. TIFY 10A, a JA response repressor, was strongly induced in responses to salt, while the GA 3-betadioxygenase (GA3OX4) in gibberellin biosynthesis was strongly inhibited under salt treatment [21]. In this study, three jasmonate-induced proteins (JIPs; LOC110715081, LOC110711071, and LOC110733576) were detected. In addition, it was reported that one ethylene receptor, ETR1, and one ethylene responsive factor (ERF) were strongly induced by salt treatment in quinoa [21,30]. In the present study, three ERFs (LOC110729845, LOC110730331, and LOC110719638) were detected in ethylene-regulated salt responses of quinoa (Table 2, Supplementary Materials Figure S5, Excels S2–S4). These findings broaden our understanding of the phytohormone-mediated regulations in the quinoa stress responses.
In the present study, we also found the other novel genes/proteins responding to salt and ethylene in quinoa. For instance, one auxin response factor (ARF; LOC110719716), one auxin binding protein (ABP; LOC110715799), and one cytokinin riboside 5’-monophosphate phosphoribohydrolase (LOG; LOC110738584) were detected (Table 2, Supplementary Materials Figure S5, Excels S2–S4). ARF and ABP function in the auxin signaling pathway, and LOG functions in the release of a ribose 5’-monophosphate from a cytokinin nucleotide to form a biologically active cytokinin [39]. Our results indicated that auxin and cytokinin may play roles in ethylene-regulated salt responses of quinoa, and these genes/proteins may be important for the crosstalk of plant hormones.
The auxin efflux carrier (LOC110691454 and LOC110736434), auxin transporter (LOC110706251), ARF (LOC110736906, LOC110715765, and LOC110714183), and ABP (LOC110691560) were detected from this study, and they may be involved in non-ethylene-regulated salt responses (Supplementary Material Excel S7). In contrast, the detected auxin response factor (LOC110714183), auxin efflux carrier (LOC110691454 and LOC110736434), auxin transporter (LOC110706251), and ARF (LOC110736906 and LOC110715765) may be involved in ethylene responses but not in salt tolerance of quinoa (Supplementary Material Excel S8). Taken together, these results suggest that the plant hormone auxin may play diverse roles in quinoa.
4.2. ROS Scavenging Enzymes Function in Quinoa Responses to Ethylene and Salt Stress
Salt stress causes ROS accumulation and oxidative stress aggravation [11]. ROS damage nucleic acids, oxidize proteins, and cause lipid peroxidation, while the antioxidant enzymes including GST, SOD, POD, and CAT neutralize the salt-induced ROS accumulation to protect plants from destructive oxidative reactions [12,17,18]. In detail, SOD dismutates O2− into H2O2, which is decomposed into water and oxygen by CAT in the peroxisomes. POD mainly catalyzes substrate oxidation with H2O2 as an electron acceptor in vacuoles and cell walls in plants [40,41,42]. In plants, GSTs are multifunctional enzymes existed in different classes (Phi, Tau, Zeta, Theta, and others) and play important roles in cellular detoxification of xenobiotic protection against oxidative stress as well as diverse ligand-binding activities [43].
In this research, 9 GSTs (LOC110724460, LOC110696392, LOC110724461, LOC110728060, LOC110711174, LOC110711174, LOC110739278, LOC110713696, and LOC110727188) and 16 PODs (LOC110682117, LOC110682546, LOC110685850, LOC110692926, LOC110699378, LOC110724764, LOC110735668, LOC110694635, LOC110735670, LOC110681844, LOC110687369, LOC110690635, LOC110727528, LOC110699380, LOC110684661, and LOC110704239) were detected in the quinoa responses to ethylene and salt stress (Table 2, Supplementary Materials Figure S5, Excels S2–S4). The ROS scavenging enzymes, POD5, had been reported to be functioning in salt responses of quinoa by RNA-seq [21]. In this study, two POD5 including LOC110692926 and LOC110727528 were detected in ethylene-regulated salt responses of quinoa. On the other hand, 16 PODs including LOC110683143, LOC110729735, and LOC110699379 may play roles in non-ethylene-regulated salt responses (Supplementary Material Excel S7), and 23 PODs including LOC110685846, LOC110704240, LOC110707569, LOC110711884, and LOC110704238 are probably involved in ethylene responses but not in salt responses in quinoa (Supplementary Material Excel S8). The PODs were also detected as core salt-responsive genes in both salt-tolerant quinoa and salt-sensitive quinoa by a previous RNA-seq research [21]. In this study, the SOD activity was also detected and activated by salt treatment in quinoa (Figure 5F). In addition, it was shown that ethylene enhances the SOD activity in salt responses of quinoa (Figure 5F), providing evidence that ethylene may mediate ROS to regulate salt tolerance of quinoa.
4.3. Osmotic Adjustment Is Important for Quinoa Responses to Ethylene and Salt Stress
High concentrations of NaCl in salt stress generate K+ and H+ fluxes in quinoa roots to the apoplast, so leaf osmoregulation, K+ retention, Na+ exclusion, and ion homeostasis confer quinoa salt tolerance [44]. In addition to these inorganic ions, the accumulation of organic substances including protein, sugars, proline, and total phenolics is also attributed to improve the quinoa salt tolerance [15,16]. The high affinity K+ transporters (HKT1.2) play a key role in Na+ load into bladder cells in quinoa, and the Na+ in bladder cells is then collected in the bladder hairs and washed off by rain [45]. Quinoa plants were reported to accumulate more Na+ than K+ under salinity stress, because the K+/Na+ ratio was detected to be decreased with increasing of salt concentration [44]. The cell anion channel (SLAH), nitrate transporter (NRT), and chloride channel protein (C1C) were also activated by salt stress, indicating their possible functions in salt responses of quinoa [10].
In this research, one HKT (LOC110710365), four phosphate transporters (PTs) (LOC110689438, LOC110720352, LOC110689401, and LOC110717783), 1 Na+/metabolite cotransporter (SMT) (LOC110727554), four NRTs (LOC110688100, LOC110684366, LOC110715529, and LOC110684367), one cation/H+ antiporter (CAH) (LOC110699138), one Na+/Ca2+ exchanger (NCL) (LOC110709231), and one aquaporin (LOC110697673) were detected in the quinoa responses to ethylene and salt stress (Table 2, Supplementary Material Figure S5, Excel S2–S4). However, three Na+/H+ exchangers (LOC110702071, LOC110692001 and LOC110737010), one H+/Ca2+ exchanger (LOC110738999), one CAH (LOC110682708), and two cation/Ca2+ exchangers (LOC110688074 and LOC110708567) were detected only in salt responses but not in ethylene responses, indicating these genes/proteins may function in non-ethylene-regulated salt responses (Supplementary Materials Excels S7 and S8). No iron transporter genes/proteins were detected in the ethylene responses of quinoa (Supplementary Materials Excels S7 and S8). These results provide useful information for possible assimilation and transportation of the inorganic ions in quinoa stress responses.
In addition to inorganic ions, the accumulation of organic solutes, including soluble sugars and proline, also decreases osmotic potential under salt stress [46]. In quinoa, the total sugar is increased due to salt treatment [47]. In this research, one organic cation/carnitine transporter (OCTN) (LOC110737811), one aluminum-activated malate transporter (ALMT) (LOC110688161), three bidirectional sugar transporters (SWEETs) (LOC110725786, LOC110735791, and LOC110732264), one polyol transporter (POT) (LOC110722677), one amino acid transporter (AAT) (LOC110733528), one nucleobase-ascorbate transporter (NAT) (LOC110708068), six ABC transporters (LOC110712440, LOC110707705, LOC110729523, LOC110695413, LOC110721597, and LOC110722212), six glucan endonucleases (GLUs) (LOC110717180, LOC110717177, LOC110699037, LOC110717159, LOC110699174, and LOC110736258), and two sucrose synthases (SSs) (LOC110727927 and LOC110689796) were detected in the quinoa responses to ethylene and salt stress (Table 2, Supplementary Materials Figure S5, Excels S2–S4). Although the genes encoding GLUs and SSs in carbohydrate metabolic process were previously detected in the salt responses of quinoa [21], the functions of the OCTN, ALMT, SWEETs, POT, AAT, NAT, and ABC transporters in salt responses of quinoa had not been reported in quinoa. The regulation mechanisms definitely need to be explored in future studies.
4.4. Cell Wall Structural Proteins Respond to Ethylene and Salt Stress in Quinoa
The levels of principal structural component of the plant cell wall such as lignins, pectins, celluloses, and hemicelluloses are affected by salt stress, which induce the alteration of cell wall elasticity [48,49]. Previously, it was reported that transcriptional changes of the genes involved in cell wall organization could been detected by RNA-seq after salt treatment of quinoa seedlings [30]. The genes involved in suberin and cutin biosynthesis, photosynthesis, and chloroplast were also reported to be significantly changed due to salt treatment in the bladder cells of quinoa [10]. TBLs encode the cell wall polysaccharide specific O-acetyltransferases and are probably involved in maintaining esterification of pectins [50]. In Arabidopsis, the functional study of the cellulose synthesis in salt tolerance had been previously reported [51]. In this research, 2 TBLs (LOC110715157 and LOC110685228) were detected differentially expressed (Table 2, Supplementary Materials Figure S5, Excels S2–S4), and 5 CESs (LOC110715976, LOC110717430, LOC110689768, LOC110689717, and LOC110721870) in cellulose synthesis were detected. In addition, two BGLUs (LOC110739769 and LOC110724275), two BGALs (LOC110682558 and LOC110685863), and four glycine-rich cell wall structural proteins (GRPs) (LOC110732550, LOC110730178, LOC110730179, and LOC110732549), which may be involved in cell wall structure and elasticity in quinoa, were detected (Table 2, Supplementary Material Figure S5, Excels S2–S4). All these findings strongly support the importance of cell wall structure and elasticity in the quinoa stress responses.
4.5. Secondary Metabolism-Associated Proteins Respond to Ethylene and Salt Stress in Quinoa
Betalain is a tyrosine-derived, red–violet, and yellow pigment in quinoa with antioxidant activity, which plays important roles in salt responses [52]. For example, CqCYP76AD1-1 was reported in the betalain biosynthesis process in quinoa [53,54]. In this research, one CqCYP76AD1 (LOC110731693) was detected in the ethylene-regulated salt responses, although its molecular mechanism in the responses is unclear. The methyltransferases (MTs), GTs, and GPATs are transferases that transfer methyl, glucosyl, and acyl groups from one compound to another, respectively. The CHSs condense a phenylpropanoid CoA ester with three acetate units from malonyl-CoA molecules and cyclize the resulting intermediate to produce a chalcone, which is the precursor of diverse flavonoids [55]. The GELPs have high potential to be used in the hydrolysis and synthesis of important ester compounds [56]. It was reported that ectopic expression of Arabidopsis glycosyltransferase UGT85A5 enhances salt tolerance in tobacco, but knock down of the corresponding genes decreases salt tolerance at seedling and reproductive stages of rice [57,58].
In this study, 10 GTs (LOC110714725, LOC110729660, LOC110706607, LOC110739778, LOC110683464, LOC110722666, LOC110711362, LOC110738265, LOC110735480, and LOC110718641), 4 GPATs (LOC110691783, LOC110722317, LOC110733316, and LOC110714505), 3 CHSs (LOC110691992, LOC110691988, and LOC110702060), 5 GELPs (LOC110735138, LOC110712448, LOC110709557, LOC110717860, and LOC110703315), 6 CYPs (LOC110731693, LOC110739776, LOC110718248, LOC110727125, LOC110681912, and LOC110724693), and 2 MTs (LOC110703261 and LOC110728006) were detected in the quinoa responses to ethylene and salt stress (Table 2, Supplementary Materials Figure S5, Excels S2–S4), suggesting that these gene/protein-mediated diverse metabolisms may be involved in the quinoa ethylene and salt responses.
In addition, 33 CYPs including LOC110711004, LOC110684386, LOC110707034, LOC110711698, LOC110715344, and LOC110732720 were detected only in salt responses, suggesting their possible functions in salt responses but not ethylene responses (Supplementary Material Excel S7). In contrast, one CHS (LOC110691988) and nine GELPs (LOC110700001, LOC110719694, LOC110728839, LOC110731812, LOC110693712, LOC110730528, LOC110700478, LOC110695766, and LOC110709613) were activated by ethylene but not salt stress (Supplementary Material Excel S8). All these results indicate a complication of the molecular regulations by secondary metabolism-associated proteins in quinoa.
4.6. Early Response Genes and Late Response Genes in Quinoa
It was reported that many genes are divided into two categories, namely early response genes and late response genes, depending on their different activation patterns in response to stimuli. The early response genes, which are also called primary response genes, are induced without de novo protein synthesis, while the late response genes, which are also called secondary response genes, require de novo protein synthesis and are induced more slowly because that synthesis needs signaling molecules or cytokines [59,60].
In this research, the correlation between proteome and transcriptome was analyzed, and the results are shown in Figure 3, Table 2, and Supplementary Materials Figure S5, Excels S2, S4 and S5. For example, the genes/proteins (GST (LOC110739278) and GLU1 (LOC110717177)) differentially expressed in both transcript and protein levels, belong to early response genes, and their proteins had already been synthesized and could be detected at early times.
The genes/proteins that were differentially expressed in transcript levels but not protein levels belonged to late response genes. Their protein levels did not accumulate within 24 h of treatment. It was suggested that their protein levels could be changed in later hours. In this research, the genes/proteins including JIPs (LOC110715081, LOC110711071, and LOC110733576), GSTs (LOC110724460, LOC110696392, LOC110724461, LOC110728060, and LOC110711174), and PODs (LOC110682546, LOC110685850, LOC110692926, LOC110699378, LOC110724764, LOC110735668, LOC110694635, LOC110735670, LOC110681844, LOC110687369, LOC110690635, LOC110727528, LOC110699380, and LOC110684661) were differentially expressed in transcript levels but not in protein levels, suggesting that these genes may belong to the late response genes.
The genes/proteins including GSTs (LOC110713696 and LOC110727188), POD64 (LOC110682117), POD12 (LOC110704239), PIP2-5 (LOC110697673), GLU1 (LOC110717180), SSs (LOC110727927 and LOC110689796), GT (LOC110718641), GELP (LOC110703315), and MTs (LOC110703261 and LOC110728006) were differentially expressed in protein levels but not in transcript levels, suggesting that post-transcriptional modifications may occur in the genes/proteins.
5. Conclusions
The proposed molecular mechanism of ethylene-regulated salt responses in quinoa is complex. Under salt stress, ROS scavenging enzymes including GSTs and PODs; transporters and solutes in osmotic adjustment including HKT, PT, Na+/metabolite cotransporter, high-affinity Na+ transporters, cation/H+ antiporter, Na+/Ca2+ exchanger, aquaporin, bidirectional sugar transporters, polyol transporter, and sucrose synthases; cell wall structural proteins including GLCs, β-GALs, CESs, TBLs, and GRPs; and secondary metabolism-associated proteins including GTs, GPATs, CHSs, GELPs, CYPs, and MTs are activated in responses to ethylene and salt stress in quinoa. Plant hormones, including AUX, ABA, JA, and CK, also play important roles in the responses. Considering the large number of transporters in osmotic adjustment identified in the ethylene-regulated salt responses in quinoa, it is concluded that osmotic adjustment is probably one of the main regulations for quinoa when challenged by salt stress.
Supplementary Materials
The following are available online at https://www.mdpi.com/article/10.3390/plants10112281/s1. Figure S1: The PCA analysis in transcriptomic (A) and proteomic analysis (B), Figure S2: The heat map with hierarchical clustering of DEGs in comparisons between SALTr and H2Or, Figure S3: Supplementary Material S6: The heat map with hierarchical clustering of DEGs in comparisons between SALTr and ACCr, Figure S4: The heat map with hierarchical clustering of DEGs in comparisons between ACCr and H2Or, Figure S5: The heat map of candidate proteins/genes in ethylene and salt responses of quinoa, Figure S6: Supplementary Material S11: The heat map with hierarchical clustering of DEPs in comparisons between SALTp and H2Op., Figure S7: The heat map with hierarchical clustering of DEPs in comparisons between SALTp and ACCp, Figure S8: The heat map with hierarchical clustering of DEPs in comparisons between ACCp and H2Op, Table S1: The sequence templates of randomly selected DEGs in qRT-PCR confirmation, Table S2: Oligonucleotide primers used in qRT-PCR confirmation, Excel S1: The summary of DEGs in single comparisons, Excel S2: The DEGs annotation in the ethylene and salt responses of quinoa, Excel S3: The summary of DEPs in single comparisons, Excel S4: The DEPs annotation in ethylene and salt responses of quinoa, Excel S5: The genes/proteins annotation in correlation analysis, Excel S6: The expression of the reference gene CqACTIN under the different treatments in this research, Excel S7: The genes/proteins playing roles in non-ethylene-regulated salt responses, Excel S8: The genes/proteins playing roles in ethylene responses but not related with salt tolerance in quinoa.
Author Contributions
Q.M. analyzed the data and wrote the manuscript; C.S. finished qRT-PCR and physiological detections; C.-H.D. collected plant materials and revised the manuscript. All authors have read and agreed to the published version of the manuscript.
Funding
This research was funded by the National Natural Science Foundation of China (31900247, 31870255) and the Shandong Agricultural Variety Project (2019LZGC015).
Institutional Review Board Statement
Seeds of quinoa ‘NL-6′ used in this study were provided kindly by Feng Li of BellaGen (Jinan, China).
Informed Consent Statement
Not applicable.
Data Availability Statement
The mass spectrometry proteomics data have been deposited to the ProteomeXchange Consortium (http://proteomecentral.proteomexchange.org (accessed on 24 May 2021)) via the iProX partner repository with the dataset identifier PXD026210. The FASTQ files of raw data were uploaded to the NCBI Sequence Read Archive (SRA), and the SRA study accession is PRJNA726352 (accessed on 30 June 2022).
Acknowledgments
Critical reading by Guoqing Song from Michigan State University, and Xiaomin Hou and Yanchong Yu from Qingdao Agricultural University is greatly appreciated.
Conflicts of Interest
The authors declare no conflict of interest.
References
- Jacobsen, S.E.; Mujica, A.; Jensen, C.R. The resistance of quinoa (Chenopodium quinoa Willd.) to adverse abiotic factors. Food Rev. Int. 2003, 19, 99–109. [Google Scholar] [CrossRef]
- Kolano, B.; McCann, J.; Orzechowska, M.; Siwinska, D.; Temsch, E.; Weiss-Schneeweiss, H. Molecular and cytogenetic evidence for an allotetraploid origin of Chenopodium quinoa and C. berlandieri (Amaranthaceae). Mol. Phylogenet. Evol. 2016, 100, 109–123. [Google Scholar] [CrossRef] [PubMed]
- Zurita-Silva, A.; Fuentes, F.; Zamora, P.; Jacobsen, S.E.; Schwember, A.R. Breeding quinoa (Chenopodium quinoa Willd.): Potential and perspectives. Mol. Breed. 2014, 34, 13–30. [Google Scholar] [CrossRef]
- Vega-Galvez, A.; Miranda, M.; Vergara, J.; Uribe, E.; Puente, L.; Martinez, E.A. Nutrition facts and functional potential of quinoa (Chenopodium quinoa willd.) an ancient Andean grain: A review. J. Sci. Food Agric. 2010, 90, 2541–2547. [Google Scholar] [CrossRef]
- Bhargava, A.; Shukla, S.; Ohri, D. Chenopodium quinoa. An indian perspective. Ind. Crops Prod. 2006, 23, 73–87. [Google Scholar] [CrossRef]
- Ruiz, K.B.; Biondi, S.; Oses, R.; Acuna-Rodriguez, I.S.; Antognoni, F.; Martinez-Mosqueira, E.A.; Coulibaly, A.; Canahua-Murillo, A.; Pinto, M.; Zurita-Silva, A.; et al. Quinoa biodiversity and sustainability for food security under climate change. Agron. Sustain. Dev. 2014, 34, 349–359. [Google Scholar] [CrossRef] [Green Version]
- Simnadis, T.G.; Tapsell, L.C.; Beck, E.J. Physiological effects associated with quinoa consumption and implications for research involving humans: A review. Plant Foods Hum. Nutr. 2015, 70, 238–249. [Google Scholar] [CrossRef] [PubMed]
- Angeli, V.; Silva, P.M.; Massuela, D.C.; Khan, M.W.; Hamar, A.; Khajehei, F.; Graeff-Honninger, S.; Piatti, C. Quinoa (Chenopodium quinoa Willd.): An overview of the potentials of the "golden grain" and socio-economic and environmental aspects of its cultivation and marketization. Foods 2020, 9, 216. [Google Scholar] [CrossRef] [PubMed] [Green Version]
- Bazile, D.; Jacobsen, S.E.; Verniau, A. The global expansion of quinoa: Trends and limits. Front. Plant Sci. 2016, 7, 622. [Google Scholar] [CrossRef] [PubMed] [Green Version]
- Zou, C.; Chen, A.; Xiao, L.; Muller, H.M.; Ache, P.; Haberer, G.; Zhang, M.; Jia, W.; Deng, P.; Huang, R.; et al. A high-quality genome assembly of quinoa provides insights into the molecular basis of salt bladder-based salinity tolerance and the exceptional nutritional value. Cell Res. 2017, 27, 1327–1340. [Google Scholar] [CrossRef]
- Rozema, J.; Flowers, T. Ecology. Crops for a salinized world. Science 2008, 322, 1478–1480. [Google Scholar] [CrossRef]
- Munns, R.; Gilliham, M. Salinity tolerance of crops—What is the cost? New Phytol. 2015, 208, 668–673. [Google Scholar] [CrossRef] [Green Version]
- van Zelm, E.; Zhang, Y.X.; Testerink, C. Salt tolerance mechanisms of plants. Annu. Rev. Plant Biol. 2020, 71, 403–433. [Google Scholar] [CrossRef] [Green Version]
- Ruiz, K.B.; Aloisi, I.; Del Duca, S.; Canelo, V.; Torrigiani, P.; Silva, H.; Biondi, S. Salares versus coastal ecotypes of quinoa: Salinity responses in Chilean landraces from contrasting habitats. Plant Physiol. Biochem. 2016, 101, 1–13. [Google Scholar] [CrossRef]
- Iqbal, S.; Basra, S.M.A.; Afzal, I.; Wahid, A. Exploring potential of well adapted quinoa lines for salt tolerance. Int. J. Agric. Biol. 2017, 19, 933–940. [Google Scholar] [CrossRef]
- Saleem, M.A.; Basra, S.M.A.; Afzal, I.; Hafeez-ur-Rehman; Iqbal, S.; Saddiq, M.S.; Naz, S. Exploring the potential of quinoa accessions for salt tolerance in soilless culture. Int. J. Agric. Biol. 2017, 19, 233–240. [Google Scholar] [CrossRef]
- Panuccio, M.R.; Jacobsen, S.E.; Akhtar, S.S.; Muscolo, A. Effect of saline water on seed germination and early seedling growth of the halophyte quinoa. AoB Plants 2014, 6, plu047. [Google Scholar] [CrossRef] [PubMed]
- Cai, Z.Q.; Gao, Q. Comparative physiological and biochemical mechanisms of salt tolerance in five contrasting highland quinoa cultivars. BMC Plant Biol. 2020, 20, 70. [Google Scholar] [CrossRef] [PubMed] [Green Version]
- Deng, S.; Ma, J.; Zhang, L.; Chen, F.; Sang, Z.; Jia, Z.; Ma, L. De novo transcriptome sequencing and gene expression profiling of Magnolia wufengensis in response to cold stress. BMC Plant Biol. 2019, 19, 321. [Google Scholar] [CrossRef] [Green Version]
- Hu, W.; Yan, Y.; Hou, X.; He, Y.; Wei, Y.; Yang, G.; He, G.; Peng, M. TaPP2C1, a group F2 protein phosphatase 2C gene, confers resistance to salt stress in transgenic tobacco. PLoS ONE 2015, 10, e0129589. [Google Scholar] [CrossRef] [PubMed] [Green Version]
- Shi, P.; Gu, M. Transcriptome analysis and differential gene expression profiling of two contrasting quinoa genotypes in response to salt stress. BMC Plant Biol. 2020, 20, 568. [Google Scholar] [CrossRef]
- Achard, P.; Cheng, H.; De Grauwe, L.; Decat, J.; Schoutteten, H.; Moritz, T.; Van Der Straeten, D.; Peng, J.; Harberd, N.P. Integration of plant responses to environmentally activated phytohormonal signals. Science 2006, 311, 91–94. [Google Scholar] [CrossRef] [PubMed]
- Cao, Y.R.; Chen, S.Y.; Zhang, J.S. Ethylene signaling regulates salt stress response: An overview. Plant Signal. Behav. 2008, 3, 761–763. [Google Scholar] [CrossRef] [PubMed] [Green Version]
- Wang, Y.; Wang, T.; Li, K.; Li, X. Genetic analysis of involvement of ETR1 in plant response to salt and osmotic stress. Plant Growth Regul. 2008, 54, 261–269. [Google Scholar] [CrossRef]
- Ma, Q.; Zhou, H.; Sui, X.; Su, C.; Yu, Y.; Yang, Y.; Dong, C. Generation of new salt-tolerant wheat lines and transcriptomic exploration of the responsive genes to ethylene and salt stress. Plant Growth Regul. 2021, 94, 33–48. [Google Scholar] [CrossRef]
- Wang, H.; Wang, F.; Zheng, F.; Wang, L.; Pei, H.; Dong, C. Ethylene-insensitive mutants of Nicotiana tabacum exhibit drought stress resistance. Plant Growth Regul. 2016, 79, 107–117. [Google Scholar] [CrossRef]
- Riyazuddin, R.; Verma, R.; Singh, K.; Nisha, N.; Keisham, M.; Bhati, K.K.; Kim, S.T.; Gupta, R. Ethylene: A master regulator of salinity stress tolerance in plants. Biomolecules 2020, 10, 959. [Google Scholar] [CrossRef]
- Sun, Y.; Lindberg, S.; Shabala, L.; Morgan, S.; Shabala, S.; Jacobsen, S.E. A comparative analysis of cytosolic Na+ changes under salinity between halophyte quinoa (Chenopodium quinoa) and glycophyte pea (Piswn sativwn). Environ. Exp. Bot. 2017, 141, 154–160. [Google Scholar] [CrossRef]
- Eisa, S.S.; Eid, M.A.; Abd, E.S.; Hussin, S.A.; Abdel-Ati, A.A.; El-Bordeny, N.E.; Ali, S.H.; Al-Sayed, H.M.A.; Lotfy, M.E.; Masoud, A.M.; et al. Chenopodium quinoa Willd. A new cash crop halophyte for saline regions of Egypt. Aust. J. Crop. Sci. 2017, 11, 343–351. [Google Scholar] [CrossRef]
- Ruiz, K.B.; Maldonado, J.; Biondi, S.; Silva, H. RNA-seq analysis of salt-stressed versus non salt-sressed transcriptomes of Chenopodium quinoa Landrace R49. Genes 2019, 10, 1042. [Google Scholar] [CrossRef] [Green Version]
- Schmockel, S.M.; Lightfoot, D.J.; Razali, R.; Tester, M.; Jarvis, D.E. Identification of putative transmembrane proteins involved in salinity tolerance in Chenopodium quinoa by integrating physiological data, RNAseq, and SNP analyses. Front. Plant Sci. 2017, 8, 1023. [Google Scholar] [CrossRef] [Green Version]
- Jarvis, D.E.; Ho, Y.S.; Lightfoot, D.J.; Schmockel, S.M.; Li, B.; Borm, T.J.; Ohyanagi, H.; Mineta, K.; Michell, C.T.; Saber, N.; et al. The genome of Chenopodium quinoa. Nature 2017, 542, 307–312. [Google Scholar] [CrossRef] [Green Version]
- Ma, Q.; Shi, C.H.; Su, C.X.; Liu, Y.G. Complementary analyses of the transcriptome and iTRAQ proteome revealed mechanism of ethylene dependent salt response in bread wheat (Triticum aestivum L.). Food Chem. 2020, 325, 126866. [Google Scholar] [CrossRef]
- Ma, J.; Chen, T.; Wu, S.; Yang, C.; Bai, M.; Shu, K.; Li, K.; Zhang, G.; Jin, Z.; He, F.; et al. iProX: An integrated proteome resource. Nucleic Acids Res. 2019, 47, D1211–D1217. [Google Scholar] [CrossRef] [Green Version]
- Xu, J.P.; Yu, Y.C.; Zhang, T.; Ma, Q.; Yang, H.B. Effects of ozone water irrigation and spraying on physiological characteristics and gene expression of tomato seedlings. Hortic. Res. 2021, 8, 180. [Google Scholar] [CrossRef] [PubMed]
- Graf, B.L.; Rojas-Silva, P.; Rojo, L.E.; Delatorre-Herrera, J.; Baldeon, M.E.; Raskin, I. Innovations in health value and functional food development of quinoa (Chenopodium quinoa Willd.). Compr. Rev. Food Sci. Food Saf. 2015, 14, 431–445. [Google Scholar] [CrossRef] [PubMed] [Green Version]
- Huang, Y.; Jiao, Y.; Xie, N.K.; Guo, Y.M.; Zhang, F.; Xiang, Z.P.; Wang, R.; Wang, F.; Gao, Q.M.; Tian, L.F.; et al. OsNCED5, a 9-cis-epoxycarotenoid dioxygenase gene, regulates salt and water stress tolerance and leaf senescence in rice. Plant Sci. 2019, 287, 110188. [Google Scholar] [CrossRef] [PubMed]
- Ruiz, K.B.; Rapparini, F.; Bertazza, G.; Silva, H.; Torrigiani, P.; Biondi, S. Comparing salt-induced responses at the transcript level in a salares and coastal-lowlands landrace of quinoa (Chenopodium quinoa Willd.). Environ. Exp. Bot. 2017, 140, 150. [Google Scholar] [CrossRef]
- Mortier, V.; Wasson, A.; Jaworek, P.; De Keyser, A.; Decroos, M.; Holsters, M.; Tarkowski, P.; Mathesius, U.; Goormachtig, S. Role of LONELY GUY genes in indeterminate nodulation on Medicago truncatula. New Phytol. 2014, 202, 582–593. [Google Scholar] [CrossRef]
- Almagro, L.; Gomez Ros, L.V.; Belchi-Navarro, S.; Bru, R.; Ros Barcelo, A.; Pedreno, M.A. Class III peroxidases in plant defence reactions. J. Exp. Bot. 2009, 60, 377–390. [Google Scholar] [CrossRef] [Green Version]
- Passardi, F.; Cosio, C.; Penel, C.; Dunand, C. Peroxidases have more functions than a Swiss army knife. Plant Cell Rep. 2005, 24, 255–265. [Google Scholar] [CrossRef]
- Shigeto, J.; Tsutsumi, Y. Diverse functions and reactions of class III peroxidases. New Phytol. 2016, 209, 1395–1402. [Google Scholar] [CrossRef] [Green Version]
- Liu, Y.J.; Han, X.M.; Ren, L.L.; Yang, H.L.; Zeng, Q.Y. Functional divergence of the glutathione S-transferase supergene family in Physcomitrella patens reveals complex patterns of large gene family evolution in land plants. Plant Physiol. 2013, 161, 773–786. [Google Scholar] [CrossRef] [Green Version]
- Pereira, E.; Cadavez, V.; Barros, L.; Encina-Zelada, C.; Stojkovic, D.; Sokovic, M.; Calhelha, R.C.; Gonzales-Barron, U.; Ferreira, I. Chenopodium quinoa Willd. (quinoa) grains: A good source of phenolic compounds. Food Res. Int. 2020, 137, 109574. [Google Scholar] [CrossRef]
- Bohm, J.; Messerer, M.; Muller, H.M.; Scholz-Starke, J.; Gradogna, A.; Scherzer, S.; Maierhofer, T.; Bazihizina, N.; Zhang, H.; Stigloher, C.; et al. Understanding the molecular basis of salt sequestration in epidermal bladder cells of Chenopodium quinoa. Curr. Biol. 2018, 28, 3075–3085. [Google Scholar] [CrossRef] [PubMed] [Green Version]
- Sarabi, B.; Bolandnazar, S.; Ghaderi, N.; Ghashghaie, J. Genotypic differences in physiological and biochemical responses to salinity stress in melon (Cucumis melo L.) plants: Prospects for selection of salt tolerant landraces. Plant Physiol. Biochem. 2017, 119, 294–311. [Google Scholar] [CrossRef] [PubMed]
- Ruffino, A.; Rosa, M.; Hilal, M.; Gonzalez, J.; Prado, F. The role of cotyledon metabolism in the establishment of quinoa (Chenopodium quinoa) seedlings growing under salinity. Plant Soil 2010, 326, 213–224. [Google Scholar] [CrossRef]
- Touchette, B.W. Seagrass-salinity interactions: Physiological mechanisms used by submersed marine angiosperms for a life at sea. J. Exp. Mar. Boil. Ecol. 2007, 350, 194–215. [Google Scholar] [CrossRef]
- Wang, G.L.; Ren, X.Q.; Liu, J.X.; Yang, F.; Wang, Y.P.; Xiong, A.S. Transcript profiling reveals an important role of cell wall remodeling and hormone signaling under salt stress in garlic. Plant Physiol. Biochem. 2019, 135, 87–98. [Google Scholar] [CrossRef] [PubMed]
- Bischoff, V.; Selbig, J.; Scheible, W.R. Involvement of TBL/DUF231 proteins into cell wall biology. Plant Signal. Behav. 2010, 5, 1057–1059. [Google Scholar] [CrossRef] [Green Version]
- Endler, A.; Kesten, C.; Schneider, R.; Zhang, Y.; Ivakov, A.; Froehlich, A.; Funke, N.; Persson, S. A mechanism for sustained cellulose synthesis during salt stress. Cell 2015, 162, 1353–1364. [Google Scholar] [CrossRef] [Green Version]
- Li, N.; Zhang, Z.; Chen, Z.; Cao, B.; Xu, K. Comparative transcriptome analysis of two contrasting Chinese cabbage (Brassica rapa L.) genotypes reveals that ion homeostasis is a crucial biological pathway involved in the rapid adaptive response to salt stress. Front. Plant Sci. 2021, 12, 683891. [Google Scholar] [CrossRef]
- Imamura, T.; Takagi, H.; Miyazato, A.; Ohki, S.; Mizukoshi, H.; Mori, M. Isolation and characterization of the betalain biosynthesis gene involved in hypocotyl pigmentation of the allotetraploid Chenopodium quinoa. Biochem. Biophys. Res. Commun. 2018, 496, 280–286. [Google Scholar] [CrossRef]
- Jain, G.; Schwinn, K.E.; Gould, K.S. Betalain induction by l-DOPA application confers photoprotection to saline-exposed leaves of Disphyma australe. New Phytol 2015, 207, 1075–1083. [Google Scholar] [CrossRef] [PubMed]
- Koduri, P.K.; Gordon, G.S.; Barker, E.I.; Colpitts, C.C.; Ashton, N.W.; Suh, D.Y. Genome-wide analysis of the chalcone synthase superfamily genes of Physcomitrella patens. Plant Mol. Biol. 2010, 72, 247–263. [Google Scholar] [CrossRef] [PubMed]
- Lai, C.P.; Huang, L.M.; Chen, L.O.; Chan, M.T.; Shaw, J.F. Genome-wide analysis of GDSL-type esterases/lipases in Arabidopsis. Plant Mol. Biol. 2017, 95, 181–197. [Google Scholar] [CrossRef]
- Qin, H.; Wang, Y.Y.; Wang, J.; Liu, H.; Zhao, H.; Deng, Z.A.; Zhang, Z.L.; Huang, R.F.; Zhang, Z.J. Knocking down the expression of GMPase gene OsVTC1-1 decreases salt tolerance of rice at seedling and reproductive stages. PLoS ONE 2016, 11, e0168650. [Google Scholar] [CrossRef] [PubMed]
- Sun, Y.G.; Wang, B.; Jin, S.H.; Qu, X.X.; Li, Y.J.; Hou, B.K. Ectopic expression of Arabidopsis glycosyltransferase UGT85A5 enhances salt stress tolerance in tobacco. PLoS ONE 2013, 8, e59924. [Google Scholar] [CrossRef] [Green Version]
- Ramirez-Carrozzi, V.R.; Nazarian, A.A.; Li, C.C.; Gore, S.L.; Sridharan, R.; Imbalzano, A.N.; Smale, S.T. Selective and antagonistic functions of SWI/SNF and Mi-2beta nucleosome remodeling complexes during an inflammatory response. Genes Dev. 2006, 20, 282–296. [Google Scholar] [CrossRef] [Green Version]
- Smale, S.T. Selective transcription in response to an inflammatory stimulus. Cell 2010, 140, 833–844. [Google Scholar] [CrossRef] [Green Version]
Figure 1.
Multiple comparison of H2Or-vs-SALTr, H2Or-vs-ACCr, and SALTr-vs-ACCr. (A) Venn diagrams of DEGs in multiple comparisons. (B) GO enriched scatter plot of DEGs in ethylene and salt responses of quinoa. Rich factor refers to the ratio of the gene number enriched in the pathway to the number of annotated genes. The bigger the Rich factor, the more significant the enrichment is. The padj value is the corrected p-value after multiple hypotheses testing, which ranges from 0 to 1. The closer to zero, the more significant the enrichment is. (C) The top 20 KEGG enrichment analyses of DEGs in ethylene and salt responses of quinoa. The y-axis indicates the number of DEGs, and the x-axis shows the processes/components in different functions.

Figure 2.
Multiple comparison of H2Op-vs-SALTp, H2Op-vs-ACCp, and SALTp-vs-ACCp. (A) Venn diagrams of DEPs in multiple comparison. (B) GO enriched scatter plot of DEPs in ethylene and salt responses of quinoa. Rich factor refers to the ratio of the gene number enriched in the pathway to the number of annotated genes. The bigger the Rich factor, the more significant the enrichment is. The padj value is the corrected p-value after multiple hypotheses testing, which ranges from 0 to 1. The closer to zero, the more significant the enrichment is. (C) The top 20 KEGG enrichment analysis of DEPs in ethylene and salt responses of quinoa. The Y-axis indicates the number of DEPs, and the X-axis shows the processes/components in different functions.

Figure 3.
The correlation analysis between proteome and transcriptome by Venn diagrams and scatter plot of expression correlation. (A,C,E) tVenn diagrams of genes, proteins, DEGs, and DEPs between SALT and H2O samples (A), between ACC and H2O samples (C), and between ACC and SALT samples (E), respectively; all_tran represents all the genes obtained from the transcriptome, diff_tran represents the DEGs identified by transcriptome, all_prot represents all the proteins identified by proteome, and diff_prot represents the DEPs identified by proteome. (B,D,F) Scatter plots of expression correlation between SALT and H2O samples (B) between ACC and H2O samples (D) and between ACC and SALT samples (F), respectively. The abscissa is the differential multiple of proteins, the ordinate is the differential multiple of corresponding genes, and the correlation coefficient and p value of the transcriptome and proteome are also shown in the figures. The points represent proteins/genes: the blue points represent non-differential proteins/genes, and the green points represent DEPs/DEGs.

Figure 4.
Gene expression verification by qRT-PCR. The expressions of CqGLC (A), CqABCB (B), CqNRT2.1 (C), CqAOBG (D), CqCSI (E), CqPER9 (F), CqPER12 (G), CqACO1 (H), CqCPA (I), CqPK (J), CqFK (K), and CqPDP (L) were detected under different treatments with different treatment periods. The differences between samples at different treatment periods were analyzed, and the statistical significance of the difference was confirmed by ANOVA at α = 0.05 level.

Figure 5.
Detection of physiological changes of quinoa seedlings with different treatments. The treated quinoa seedlings were photographed (A), and the relative permeability of cell membrane (B), damage rate of leaves (C), MDA content (D), soluble sugar level (E), SOD activity (F), SPAD value (G), and nitrogen level (H) of quinoa seedlings were detected. The statistical significance of the difference was analyzed by ANOVA at α = 0.05 level.


Table 1.
The abbreviations of quinoa samples used in this research.
| Abbreviations | Detailed Information | Omics Used in |
|---|---|---|
| H2Op | Water-treated seedlings | proteomics |
| SALTp | Salt-treated seedlings | proteomics |
| ACCp | Salt- and ACC-treated seedlings | proteomics |
| H2Or | Water-treated seedlings | transcriptomics |
| SALTr | Salt-treated seedlings | transcriptomics |
| ACCr | Salt- and ACC-treated seedlings | transcriptomics |
Table 2.
A summary of candidate proteins/genes in ethylene and salt responses of quinoa.
| Gene ID | Symbol | Description | Function Category | Classification |
|---|---|---|---|---|
| LOC110729845 | ERF | ethylene-responsive transcription factor | plant hormone signaling | late response gene |
| LOC110730331 | ERF104 | ethylene-responsive transcription factor 104 | plant hormone signaling | late response gene |
| LOC110719638 | ERF2 | ethylene-responsive transcription factor 2 | plant hormone signaling | late response gene |
| LOC110719716 | ARF9 | auxin response factor 9 | plant hormone signaling | late response gene |
| LOC110715799 | ABP19a | auxin-binding protein 19a | plant hormone signaling | late response gene |
| LOC110710755 | PYL4 | abscisic acid receptor PYL4 | plant hormone signaling | late response gene |
| LOC110715081 | JIP | jasmonate-induced protein | plant hormone signaling | late response gene |
| LOC110711071 | JIP | jasmonate-induced protein | plant hormone signaling | late response gene |
| LOC110733576 | JIP | jasmonate-induced protein | plant hormone signaling | late response gene |
| LOC110738584 | LOG5 | cytokinin riboside 5′-monophosphate phosphoribohydrolase | plant hormone biosynthesis | late response gene |
| LOC110724460 | GST | glutathione S-transferase | ROS scavenging | late response gene |
| LOC110696392 | GST | glutathione S-transferase | ROS scavenging | late response gene |
| LOC110724461 | GST | glutathione S-transferase | ROS scavenging | late response gene |
| LOC110728060 | GST | glutathione S-transferase | ROS scavenging | late response gene |
| LOC110711174 | GST3 | microsomal glutathione S-transferase 3 | ROS scavenging | late response gene |
| LOC110739278 | GST | glutathione S-transferase | ROS scavenging | early response gene |
| LOC110713696 | GST | glutathione S-transferase | ROS scavenging | post-transcriptional modification |
| LOC110727188 | GST | glutathione S-transferase | ROS scavenging | post-transcriptional modification |
| LOC110682117 | POD64 | peroxidase 64 | ROS scavenging | post-transcriptional modification |
| LOC110682546 | POD72 | peroxidase 72 | ROS scavenging | late response gene |
| LOC110685850 | POD72 | peroxidase 72 | ROS scavenging | late response gene |
| LOC110692926 | POD5 | peroxidase 5 | ROS scavenging | late response gene |
| LOC110699378 | POD4 | peroxidase 4 | ROS scavenging | late response gene |
| LOC110724764 | POD9 | peroxidase 9 | ROS scavenging | late response gene |
| LOC110735668 | POD12 | peroxidase 12 | ROS scavenging | late response gene |
| LOC110694635 | POD55 | peroxidase 55 | ROS scavenging | late response gene |
| LOC110735670 | POD12 | peroxidase 12 | ROS scavenging | late response gene |
| LOC110681844 | POD55 | peroxidase 55 | ROS scavenging | late response gene |
| LOC110687369 | POD42 | peroxidase 42 | ROS scavenging | late response gene |
| LOC110690635 | POD1 | cationic peroxidase 1 | ROS scavenging | late response gene |
| LOC110727528 | POD5 | peroxidase 5 | ROS scavenging | late response gene |
| LOC110699380 | POD4 | peroxidase 4 | ROS scavenging | late response gene |
| LOC110684661 | POD1 | cationic peroxidase 1 | ROS scavenging | late response gene |
| LOC110704239 | POD12 | peroxidase 12 | ROS scavenging | post-transcriptional modification |
| LOC110710365 | HKT5 | potassium transporter 5 | osmotic adjustment | late response gene |
| LOC110689438 | PT1-3 | phosphate transporter 1-3 | osmotic adjustment | late response gene |
| LOC110720352 | PHO1 | phosphate transporter PHO1 | osmotic adjustment | late response gene |
| LOC110689401 | PHO1 | phosphate transporter PHO1 | osmotic adjustment | late response gene |
| LOC110717783 | PT1-3 | phosphate transporter 1-3 | osmotic adjustment | late response gene |
| LOC110727554 | SMT | sodium/metabolite cotransporter | osmotic adjustment | late response gene |
| LOC110688100 | NRT2.1 | high-affinity nitrate transporter 2.1 | osmotic adjustment | late response gene |
| LOC110684366 | NRT2.1 | high-affinity nitrate transporter 2.1 | osmotic adjustment | late response gene |
| LOC110715529 | NRT3.2 | high-affinity nitrate transporter 3.2 | osmotic adjustment | late response gene |
| LOC110684367 | NRT2.4 | high-affinity nitrate transporter 2.4 | osmotic adjustment | late response gene |
| LOC110699138 | CAH20 | cation/H+ antiporter 20 | osmotic adjustment | late response gene |
| LOC110709231 | NCL | sodium/calcium exchanger NCL | osmotic adjustment | late response gene |
| LOC110697673 | PIP2-5 | aquaporin PIP2-5 | osmotic adjustment | post-transcriptional modification |
| LOC110737811 | OCTN7 | organic cation/carnitine transporter 7 | osmotic adjustment | late response gene |
| LOC110688161 | ALMT2 | aluminum-activated malate transporter 2 | osmotic adjustment | late response gene |
| LOC110725786 | SWEET1 | bidirectional sugar transporter SWEET1 | osmotic adjustment | late response gene |
| LOC110735791 | SWEET1 | bidirectional sugar transporter SWEET1 | osmotic adjustment | late response gene |
| LOC110732264 | SWEET7 | bidirectional sugar transporter SWEET7 | osmotic adjustment | late response gene |
| LOC110722677 | POT | polyol transporter | osmotic adjustment | late response gene |
| LOC110733528 | AAT | amino acid transporter | osmotic adjustment | late response gene |
| LOC110708068 | NAT7 | nucleobase-ascorbate transporter 7 | osmotic adjustment | late response gene |
| LOC110712440 | ABCC15 | ABC transporter C family member 15 | osmotic adjustment | late response gene |
| LOC110707705 | ABCB8 | ABC transporter B family member 8 | osmotic adjustment | late response gene |
| LOC110729523 | ABCC10 | ABC transporter C family member 10 | osmotic adjustment | late response gene |
| LOC110695413 | ABCA2 | ABC transporter A family member 2 | osmotic adjustment | late response gene |
| LOC110721597 | ABCC15 | ABC transporter C family member 15 | osmotic adjustment | late response gene |
| LOC110722212 | ABCB25 | ABC transporter B family member 25 | osmotic adjustment | late response gene |
| LOC110717180 | GLU1 | glucan endonucleases-1 | osmotic adjustment | post-transcriptional modification |
| LOC110717177 | GLU1 | lucan endonucleases-1 | osmotic adjustment | early response gene |
| LOC110699037 | GLU1 | glucan endonucleases-1 | osmotic adjustment | late response gene |
| LOC110717159 | GLU1 | glucan endonucleases-1 | osmotic adjustment | late response gene |
| LOC110699174 | GLU1 | glucan endonucleases-1 | osmotic adjustment | late response gene |
| LOC110736258 | GLU1 | glucan endonucleases-1 | osmotic adjustment | late response gene |
| LOC110727927 | SS | sucrose synthase | osmotic adjustment | post-transcriptional modification |
| LOC110689796 | SS | sucrose synthase | osmotic adjustment | post-transcriptional modification |
| LOC110739769 | BGLU13 | beta-glucosidase 13 | cell wall construction | late response gene |
| LOC110724275 | BGLU12 | beta-glucosidase 12 | cell wall construction | late response gene |
| LOC110682558 | BGAL3 | beta-galactosidase 3 | cell wall construction | late response gene |
| LOC110685863 | BGAL3 | beta-galactosidase 3 | cell wall construction | late response gene |
| LOC110715976 | CESA | cellulose synthase A | cell wall construction | late response gene |
| LOC110717430 | CESG2 | cellulose synthase G2 | cell wall construction | late response gene |
| LOC110689768 | CESD5 | cellulose synthase D5 | cell wall construction | late response gene |
| LOC110689717 | CESA | cellulose synthase A | cell wall construction | late response gene |
| LOC110721870 | CESA | cellulose synthase A | cell wall construction | late response gene |
| LOC110715157 | TBL38 | trichome birefringence-like protein 38 | cell wall construction | late response gene |
| LOC110685228 | TBL39 | trichome birefringence-like protein 39 | cell wall construction | late response gene |
| LOC110732550 | GRP1.8 | glycine-rich cell wall structural protein 1.8 | cell wall construction | late response gene |
| LOC110730178 | GRP1.8 | glycine-rich cell wall structural protein 1.8 | cell wall construction | late response gene |
| LOC110730179 | GRP1.8 | glycine-rich cell wall structural protein 1.8 | cell wall construction | late response gene |
| LOC110732549 | GRP1.8 | glycine-rich cell wall structural protein 1.8 | cell wall construction | late response gene |
| LOC110714725 | CGT | crocetin glucosyltransferase | secondary metabolism | late response gene |
| LOC110729660 | OGT | O-glucosyltransferase | secondary metabolism | late response gene |
| LOC110706607 | 7DGT | 7-deoxyloganetin glucosyltransferase | secondary metabolism | late response gene |
| LOC110739778 | 7DGT | 7-deoxyloganetic acid glucosyltransferase | secondary metabolism | late response gene |
| LOC110683464 | OGT | O-glucosyltransferase | secondary metabolism | late response gene |
| LOC110722666 | GT | hydroquinone glucosyltransferase | secondary metabolism | late response gene |
| LOC110711362 | ABGT | anthocyanin 3′-O-beta-glucosyltransferase | secondary metabolism | late response gene |
| LOC110738265 | ABGT | anthocyanin 3′-O-beta-glucosyltransferase | secondary metabolism | late response gene |
| LOC110735480 | UDPGT | UDP-glycosyltransferase 90A1 | secondary metabolism | late response gene |
| LOC110718641 | 7DGT | 7-deoxyloganetin glucosyltransferase | secondary metabolism | post-transcriptional modification |
| LOC110691783 | GPAT | glycerol-3-phosphate acyltransferase | secondary metabolism | late response gene |
| LOC110722317 | GPAT7 | glycerol-3-phosphate acyltransferase 7 | secondary metabolism | late response gene |
| LOC110733316 | GPAT5 | glycerol-3-phosphate acyltransferase 5 | secondary metabolism | late response gene |
| LOC110714505 | WSD1 | O-acyltransferase WSD1 | secondary metabolism | late response gene |
| LOC110691992 | CHS3 | chalcone synthase 3 | secondary metabolism | late response gene |
| LOC110691988 | CHS3 | chalcone synthase 3 | secondary metabolism | late response gene |
| LOC110702060 | CHS3 | chalcone synthase 3 | secondary metabolism | late response gene |
| LOC110735138 | GELP | GDSL esterase/lipase | secondary metabolism | late response gene |
| LOC110712448 | GELP | GDSL esterase/lipase | secondary metabolism | late response gene |
| LOC110709557 | GELP | GDSL esterase/lipase | secondary metabolism | late response gene |
| LOC110717860 | GELP | GDSL esterase/lipase | secondary metabolism | late response gene |
| LOC110703315 | GELP | GDSL esterase/lipase | secondary metabolism | post-transcriptional modification |
| LOC110731693 | CYP76AD1 | cytochrome P450 76AD1 | secondary metabolism | late response gene |
| LOC110739776 | CYP72A219 | cytochrome P450 72A219 | secondary metabolism | late response gene |
| LOC110718248 | CYP71A6 | cytochrome P450 71A6 | secondary metabolism | late response gene |
| LOC110727125 | CYP71A6 | cytochrome P450 71A6 | secondary metabolism | late response gene |
| LOC110681912 | CYP89A2 | cytochrome P450 89A2 | secondary metabolism | late response gene |
| LOC110724693 | CYP83B1 | cytochrome P450 83B1 | secondary metabolism | late response gene |
| LOC110703261 | OMT | O-methyltransferase | secondary metabolism | post-transcriptional modification |
| LOC110728006 | NMT | N-methyltransferase | secondary metabolism | post-transcriptional modification |
Publisher’s Note: MDPI stays neutral with regard to jurisdictional claims in published maps and institutional affiliations. |
© 2021 by the authors. Licensee MDPI, Basel, Switzerland. This article is an open access article distributed under the terms and conditions of the Creative Commons Attribution (CC BY) license (https://creativecommons.org/licenses/by/4.0/).
Share and Cite
MDPI and ACS Style
Ma, Q.; Su, C.; Dong, C.-H. Genome-Wide Transcriptomic and Proteomic Exploration of Molecular Regulations in Quinoa Responses to Ethylene and Salt Stress. Plants 2021, 10, 2281. https://doi.org/10.3390/plants10112281
AMA Style
Ma Q, Su C, Dong C-H. Genome-Wide Transcriptomic and Proteomic Exploration of Molecular Regulations in Quinoa Responses to Ethylene and Salt Stress. Plants. 2021; 10(11):2281. https://doi.org/10.3390/plants10112281
Chicago/Turabian StyleMa, Qian, Chunxue Su, and Chun-Hai Dong. 2021. "Genome-Wide Transcriptomic and Proteomic Exploration of Molecular Regulations in Quinoa Responses to Ethylene and Salt Stress" Plants 10, no. 11: 2281. https://doi.org/10.3390/plants10112281
Note that from the first issue of 2016, this journal uses article numbers instead of page numbers. See further details here.