
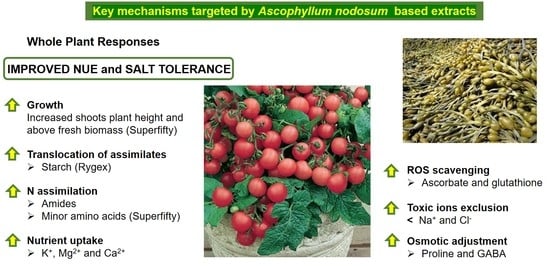
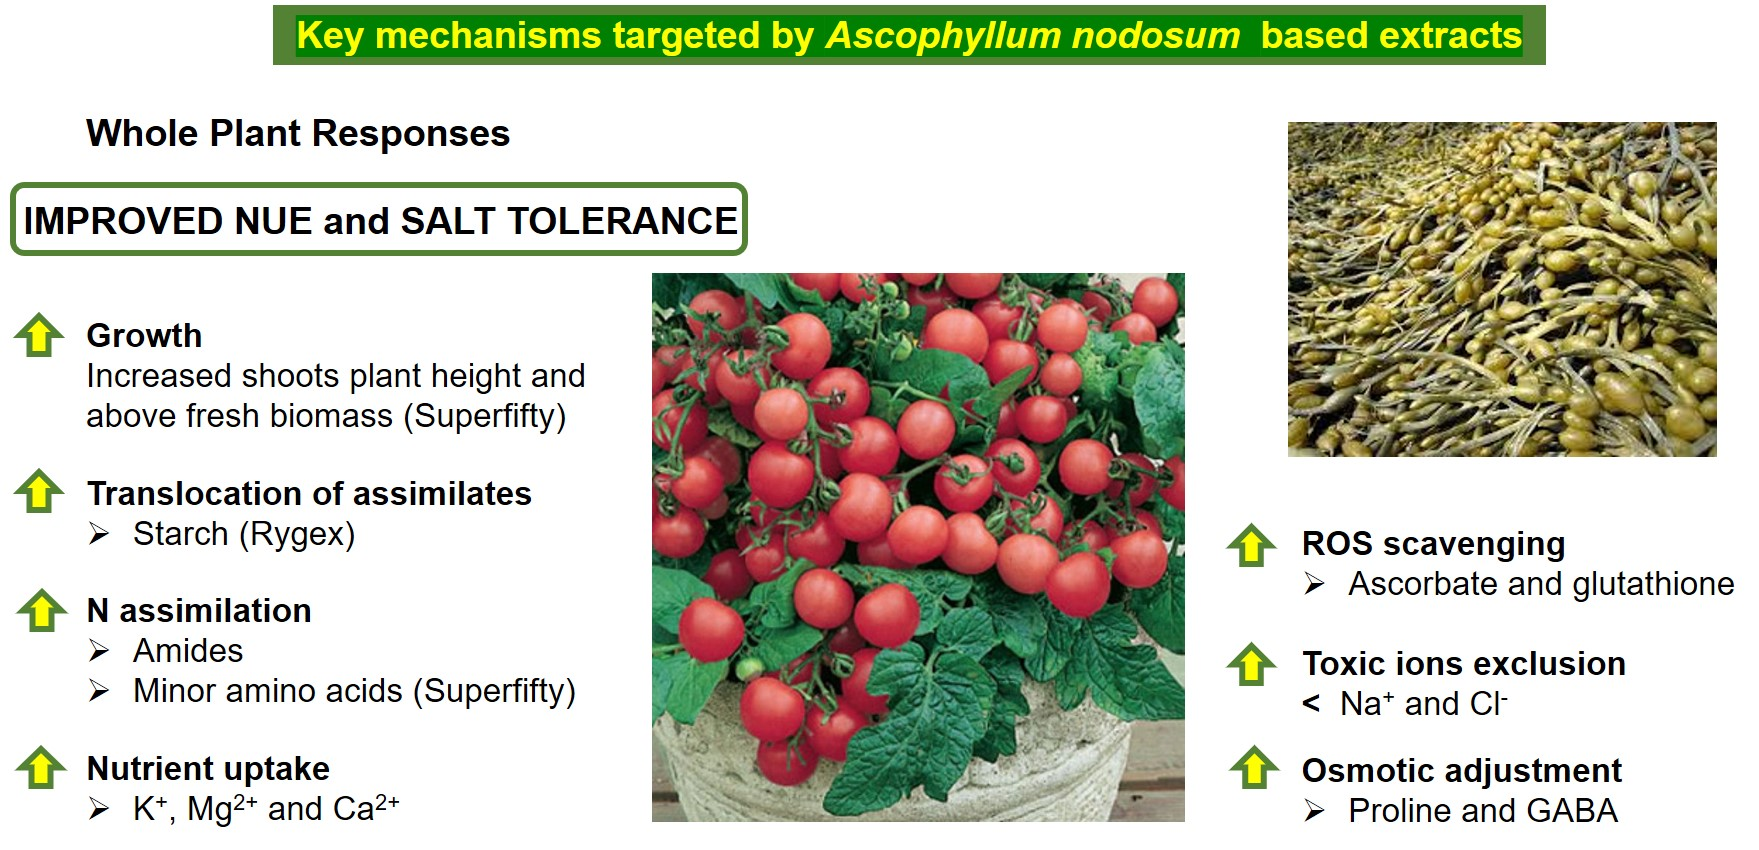
Ascophyllum nodosum Based Extracts Counteract Salinity Stress in Tomato by Remodeling Leaf Nitrogen Metabolism

 , , , , and
Abstract
:
1. Introduction
2. Results
2.1. Biometric Traits
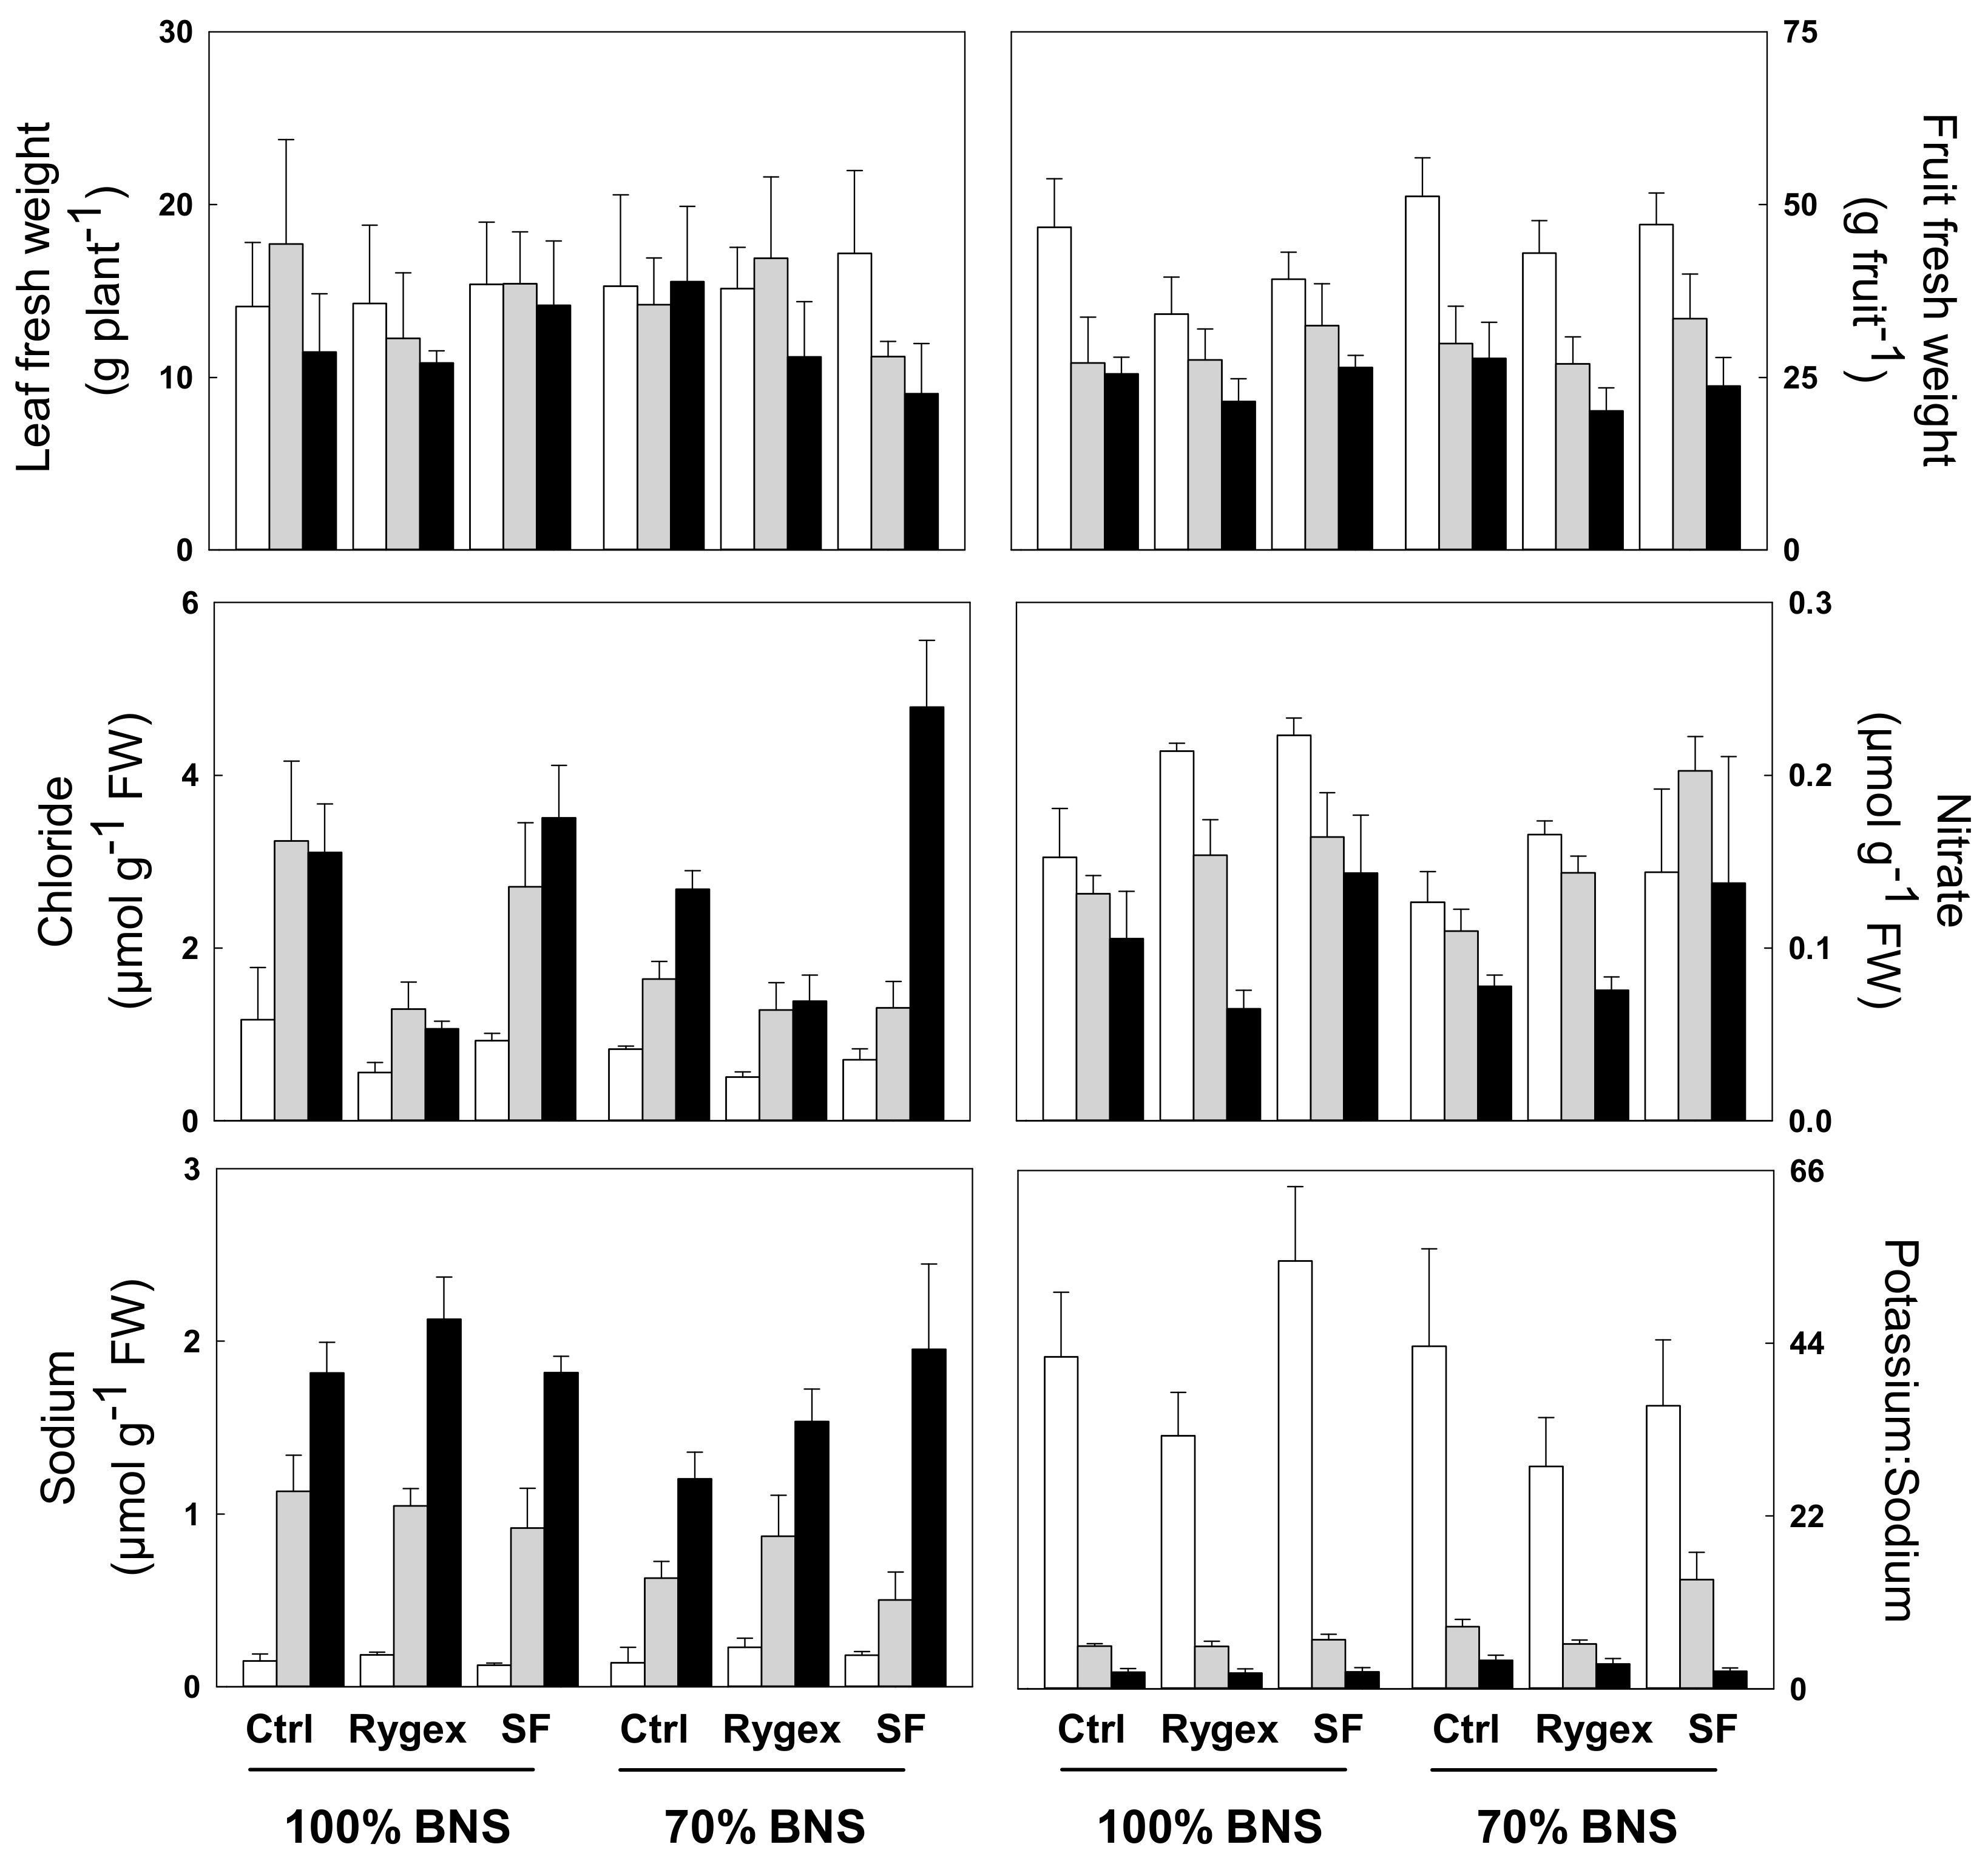
2.2. Leaf Mineral Profile
2.3. Antioxidant Metabolites
2.4. Carbohydrates and Soluble Proteins
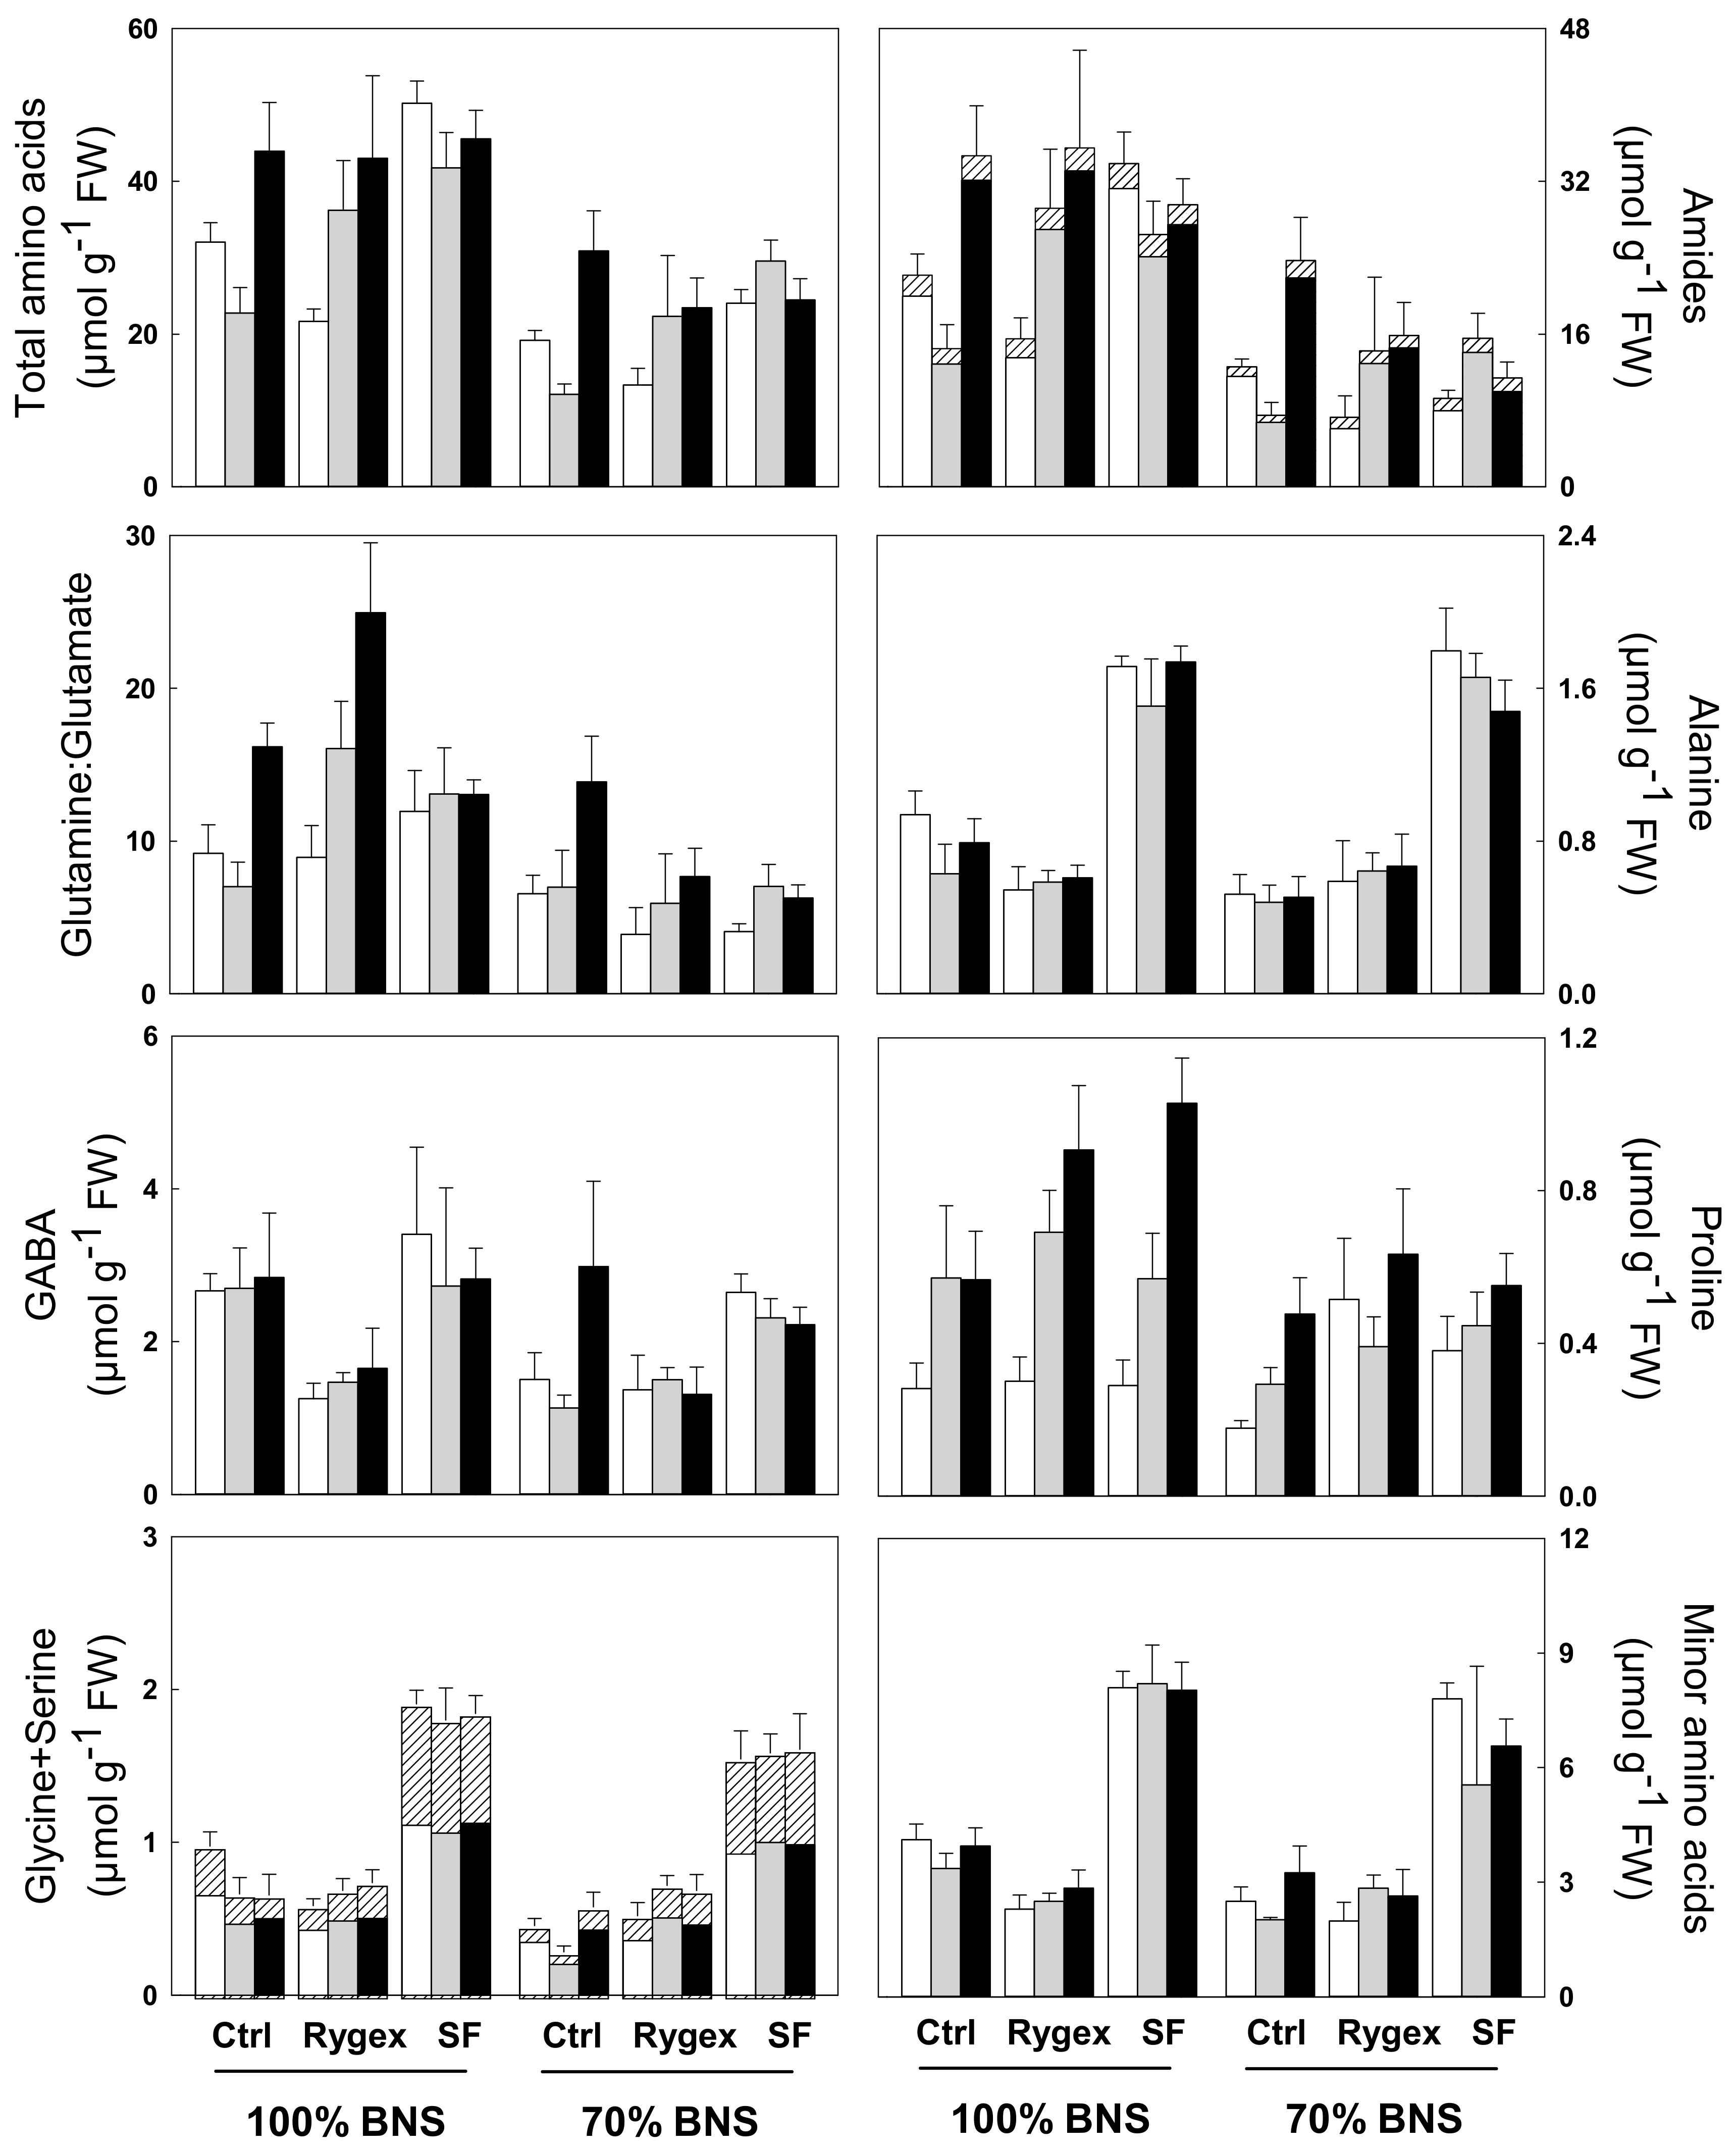
2.5. Total Free Amino Acids Content
2.6. Leaf Osmolality
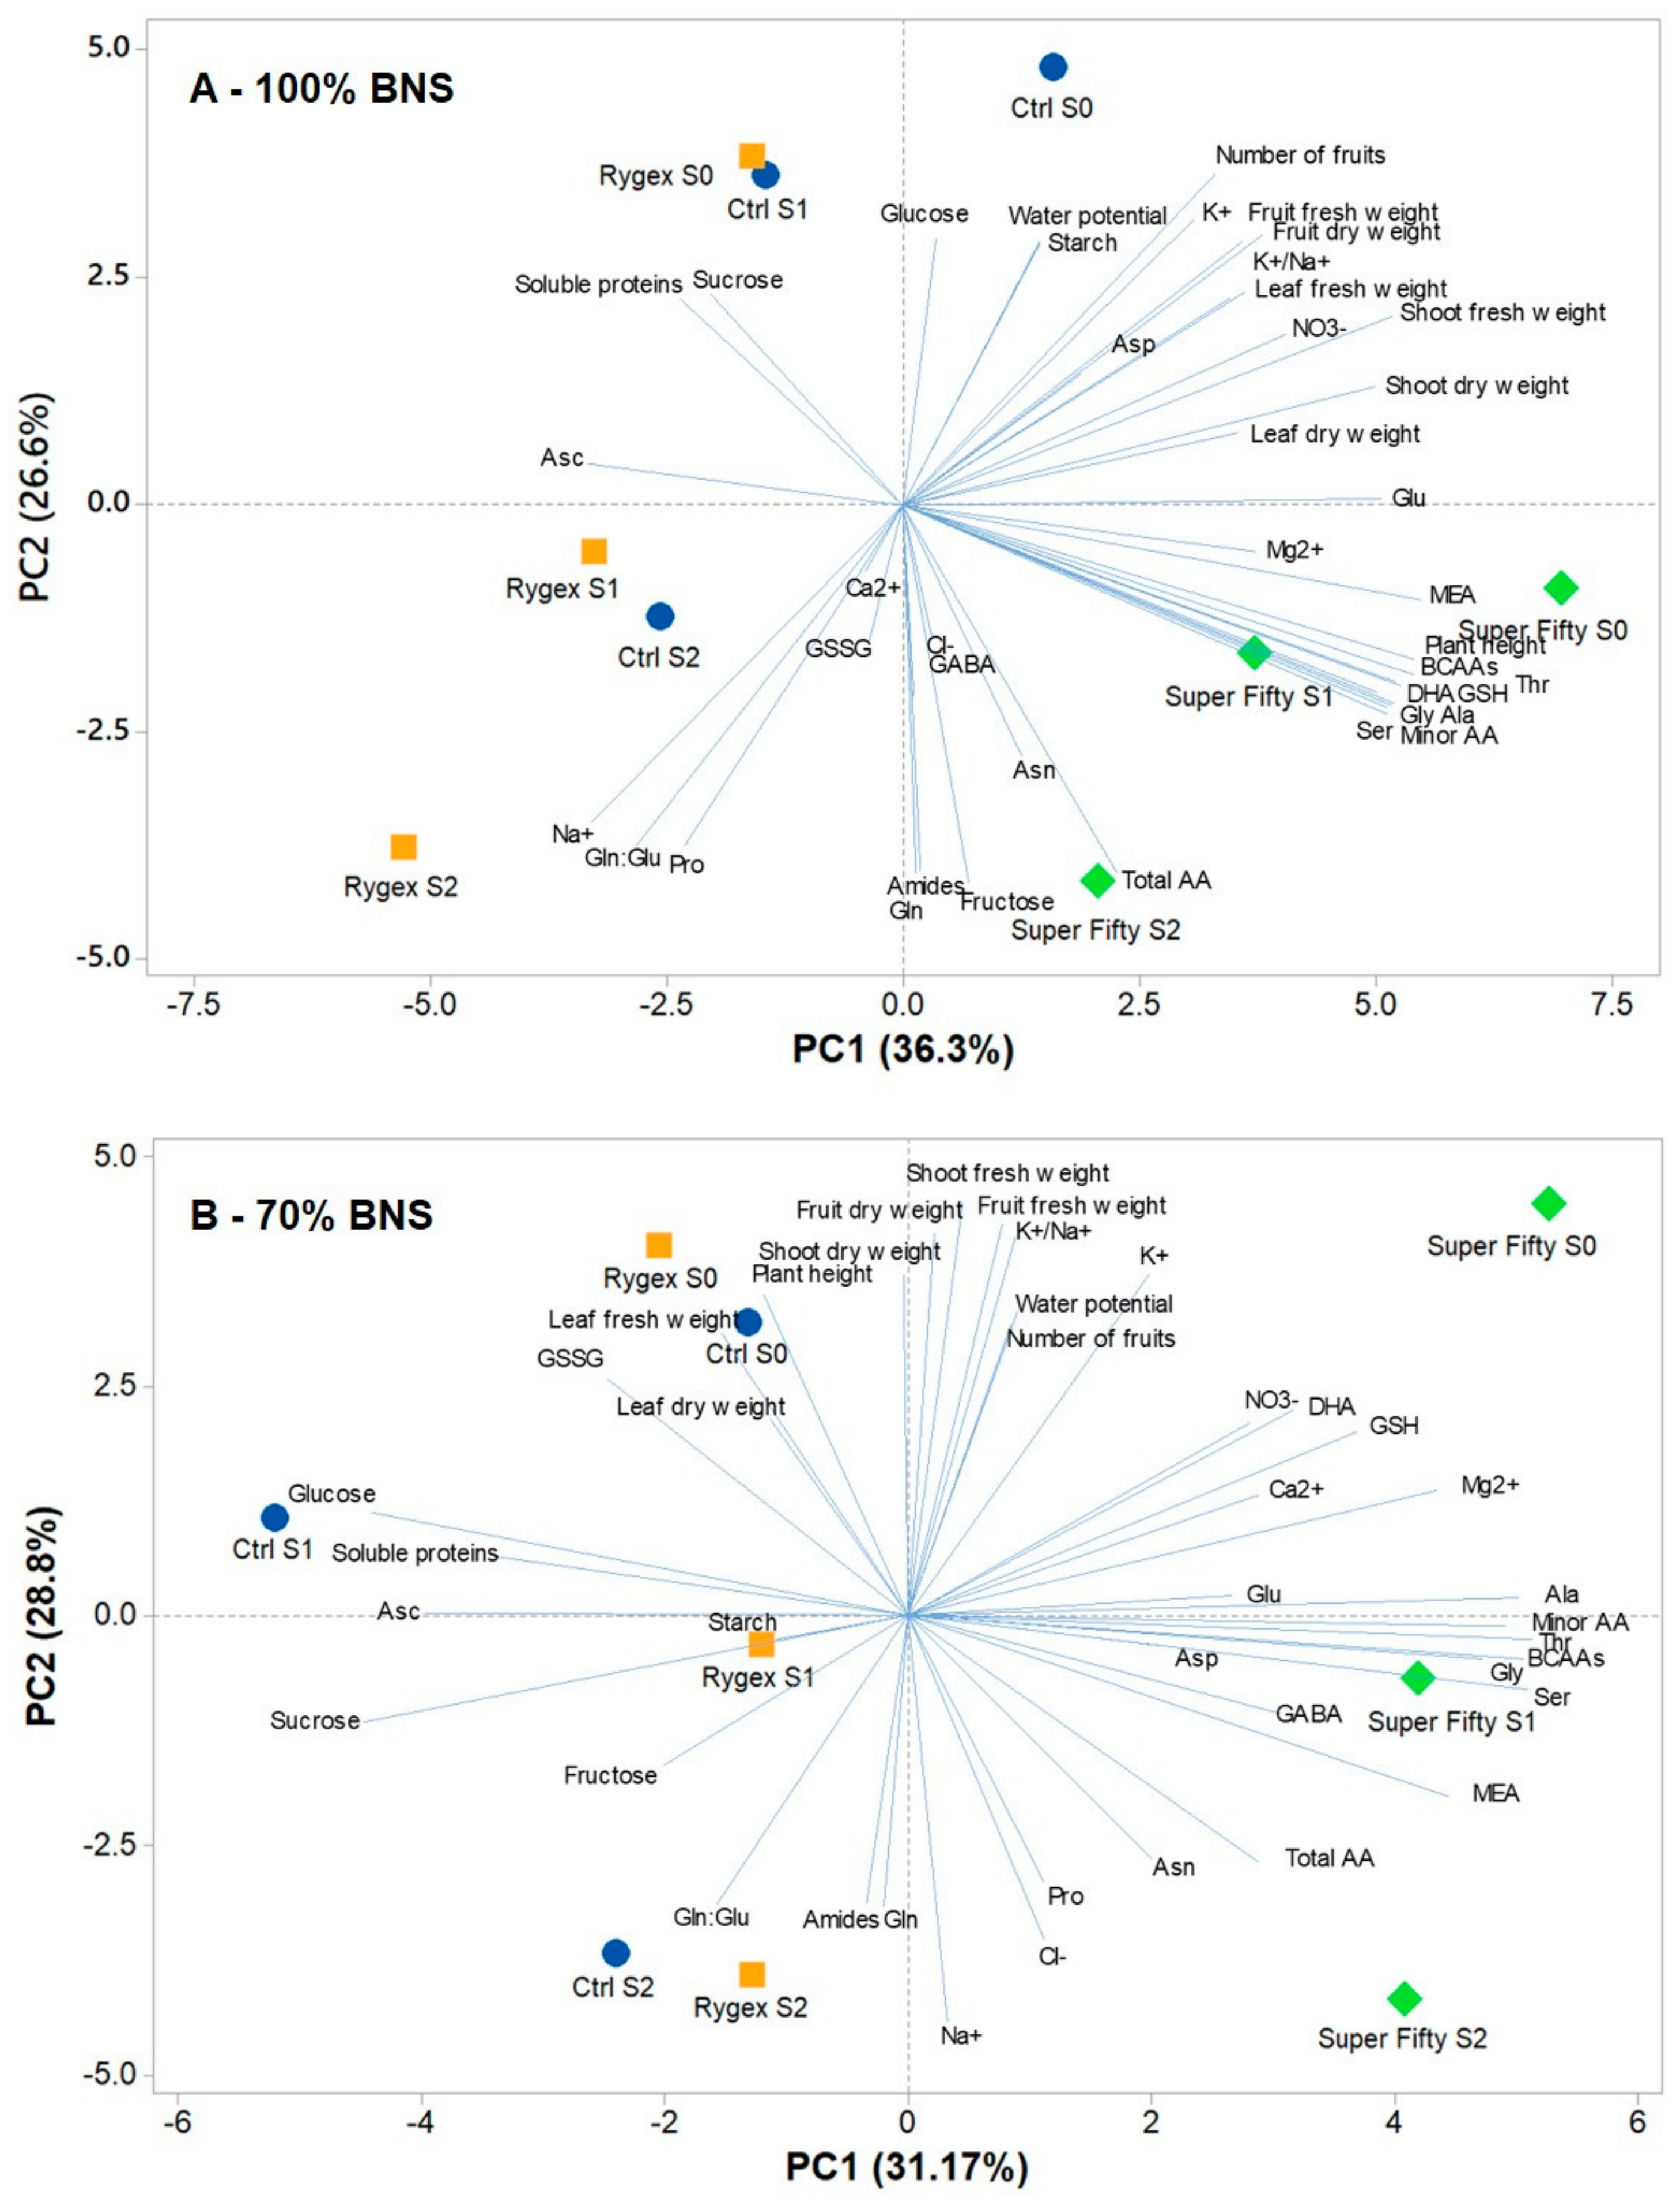
2.7. Principal Component Analysis
3. Discussion
4. Materials and Methods
4.1. Greenhouse Conditions, Plant Material and Experimental Design
4.2. Ions, Metabolites and Antioxidants Analysis
4.3. Statistics, Heat Map and Principal Component Analysis
5. Conclusions
Supplementary Materials
Author Contributions
Funding
Institutional Review Board Statement
Informed Consent Statement
Data Availability Statement
Conflicts of Interest
References
- Searchinger, T.; Waite, R.; Hanson, C.; Ranganathan, J.; Dumas, P.; Matthews, E. World Resources Report: Creating a Sustainable Food Future; UNEP: Nairobi, Kenya, 2018. [Google Scholar]
- Berry, E.M.; Dernini, S.; Burlingame, B.; Meybeck, A.; Conforti, P. Food security and sustainability: Can one exist without the other? Public Health Nutr. 2015, 18, 2293–2302. [Google Scholar] [CrossRef]
- Hirel, B.; Le Gouis, J.; Ney, B.; Gallais, A. The challenge of improving nitrogen use efficiency in crop plants: Towards a more central role for genetic variability and quantitative genetics within integrated approaches. J. Exp. Bot. 2007, 58, 2369–2387. [Google Scholar] [CrossRef] [PubMed]
- Lassaletta, L.; Billen, G.; Garnier, J.; Bouwman, L.; Velazquez, E.; Mueller, N.D.; Gerber, J.S. Nitrogen use in the global food system: Past trends and future trajectories of agronomic performance, pollution, trade, and dietary demand. Environ. Res. Lett. 2016, 11, 095007. [Google Scholar] [CrossRef]
- Carillo, P.; Colla, G.; De Pascale, S.; Rouphael, Y.; El-Nakhel, C.; Bonini, P.; D’Amelia, L.; Dell’Aversana, E.; Pannico, A.; Giordano, M.; et al. Biostimulant Application with a Tropical Plant Extract Enhances Corchorus olitorius Adaptation to Sub-Optimal Nutrient Regimens by Improving Physiological Parameters. Agronomy 2019, 9, 249. [Google Scholar] [CrossRef] [Green Version]
- Sánchez, J.A.; Reca, J.; Martínez, J. Water Productivity in a Mediterranean Semi-Arid Greenhouse District. Water Resour. Manag. 2015, 29, 5395–5411. [Google Scholar] [CrossRef] [Green Version]
- Colla, G.; Rouphael, Y.; Mirabelli, C.; Cardarelli, M. Nitrogen-use efficiency traits of mini-watermelon in response to grafting and nitrogen-fertilization doses. J. Plant Nutr. Soil Sci. 2011, 174, 933–941. [Google Scholar] [CrossRef]
- Lassaletta, L.; Billen, G.; Grizzetti, B.; Anglade, J.; Garnier, J. 50 year trends in nitrogen use efficiency of world cropping systems: The relationship between yield and nitrogen input to cropland. Environ. Res. Lett. 2014, 9, 105011. [Google Scholar] [CrossRef]
- Gupta, S.K.; Gupta, A.B.; Gupta, R. 28—Pathophysiology of Nitrate Toxicity in Humans in View of the Changing Trends of the Global Nitrogen Cycle with Special Reference to India. In The Indian Nitrogen Assessment; Abrol, Y.P., Adhya, T.K., Aneja, V.P., Raghuram, N., Pathak, H., Kulshrestha, U., Sharma, C., Singh, B., Eds.; Elsevier: Amsterdam, The Netherlands, 2017; pp. 459–468. [Google Scholar] [CrossRef]
- Aires, A.; Carvalho, R.; Rosa, E.A.S.; Saavedra, M.J. Effects of agriculture production systems on nitrate and nitrite accumulation on baby-leaf salads. Food Sci. Nutr. 2012, 1, 3–7. [Google Scholar] [CrossRef]
- Santamaria, P. Nitrate in vegetables: Toxicity, content, intake and EC regulation. J. Sci. Food Agric. 2005, 86, 10–17. [Google Scholar] [CrossRef]
- Loh, Y.H.; Jakszyn, P.; Luben, R.N.; Mulligan, A.; Mitrou, P.N.; Khaw, K.-T. N-nitroso compounds and cancer incidence: The European Prospective Investigation into Cancer and Nutrition (EPIC)–Norfolk Study. Am. J. Clin. Nutr. 2011, 93, 1053–1061. [Google Scholar] [CrossRef] [Green Version]
- Hirel, B.; Tétu, T.; Lea, P.J.; Dubois, F. Improving Nitrogen Use Efficiency in Crops for Sustainable Agriculture. Sustainability 2011, 3, 1452–1485. [Google Scholar] [CrossRef]
- De Wit, C. Resource use efficiency in agriculture. Agric. Syst. 1992, 40, 125–151. [Google Scholar] [CrossRef]
- Masclaux-Daubresse, C.; Daniel-Vedele, F.; Dechorgnat, J.; Chardon, F.; Gaufichon, L.; Suzuki, A. Nitrogen uptake, assimilation and remobilization in plants: Challenges for sustainable and productive agriculture. Ann. Bot. 2010, 105, 1141–1157. [Google Scholar] [CrossRef] [PubMed] [Green Version]
- Tilman, D.; Balzer, C.; Hill, J.; Befort, B.L. Global food demand and the sustainable intensification of agriculture. Proc. Natl. Acad. Sci. USA 2011, 108, 20260–20264. [Google Scholar] [CrossRef] [Green Version]
- Carillo, P. GABA Shunt in Durum Wheat. Front. Plant Sci. 2018, 9, 100. [Google Scholar] [CrossRef]
- Carillo, P.; Annunziata, M.G.; Pontecorvo, G.; Fuggi, A.; Woodrow, P. Salinity Stress and Salt Tolerance. In Abiotic Stress in Plants—Mechanisms and Adaptations; Shanker, A., Venkateswarlu, B., Eds.; IntechOpen: London, UK, 2011; Available online: https://www.intechopen.com/books/abiotic-stress-in-plants-mechanisms-and-adaptations/salinity-stress-and-salt-tolerance (accessed on 20 May 2021). [CrossRef] [Green Version]
- Van Oosten, M.J.; Pepe, O.; De Pascale, S.; Silletti, S.; Maggio, A. The role of biostimulants and bioeffectors as alleviators of abiotic stress in crop plants. Chem. Biol. Technol. Agric. 2017, 4, 5. [Google Scholar] [CrossRef] [Green Version]
- Rouphael, Y.; Colla, G. Synergistic Biostimulatory Action: Designing the Next Generation of Plant Biostimulants for Sustainable Agriculture. Front. Plant Sci. 2018, 9, 1655. [Google Scholar] [CrossRef] [Green Version]
- Van Oosten, M.J.; Dell’Aversana, E.; Ruggiero, A.; Cirillo, V.; Gibon, Y.; Woodrow, P.; Maggio, A.; Carillo, P. Omeprazole Treatment Enhances Nitrogen Use Efficiency Through Increased Nitrogen Uptake and Assimilation in Corn. Front. Plant Sci. 2019, 10, 1507. [Google Scholar] [CrossRef] [Green Version]
- Rouphael, Y.; Carillo, P.; Cristofano, F.; Cardarelli, M.; Colla, G. Effects of vegetal-versus animal-derived protein hydrolysate on sweet basil morpho-physiological and metabolic traits. Sci. Hortic. 2021, 284, 110123. [Google Scholar] [CrossRef]
- du Jardin, P. Plant biostimulants: Definition, concept, main categories and regulation. Sci. Hortic. 2015, 196, 3–14. [Google Scholar] [CrossRef] [Green Version]
- Calvo, P.; Nelson, L.; Kloepper, J.W. Agricultural uses of plant biostimulants. Plant Soil 2014, 383, 3–41. [Google Scholar] [CrossRef] [Green Version]
- Hong, D.D.; Hien, H.M.; Son, P.N. Seaweeds from Vietnam used for functional food, medicine and biofertilizer. Environ. Biol. Fishes 2007, 19, 817–826. [Google Scholar] [CrossRef]
- Zodape, S.T. Seaweeds as a Biofertilizer. J. Sci. Ind. Res. 2001, 60, 378–382. [Google Scholar]
- Di Stasio, E.; Van Oosten, M.J.; Silletti, S.; Raimondi, G.; Dell’Aversana, E.; Carillo, P.; Maggio, A. Ascophyllum nodosum-based algal extracts act as enhancers of growth, fruit quality, and adaptation to stress in salinized tomato plants. J. Appl. Phycol. 2018, 30, 2675–2686. [Google Scholar] [CrossRef]
- Beckett, R.P.; Van Staden, J. The effect of seaweed concentrate on the growth and yield of potassium stressed wheat. Plant Soil 1989, 116, 29–36. [Google Scholar] [CrossRef]
- Tay, S.A.B.; Palni, L.M.S.; MacLeod, J.K. Identification of cytokinin glucosides in a seaweed extract. J. Plant Growth Regul. 1987, 5, 133–138. [Google Scholar] [CrossRef]
- Crouch, I.J.; van Staden, J. Evidence for the presence of plant growth regulators in commercial seaweed products. Plant Growth Regul. 1993, 13, 21–29. [Google Scholar] [CrossRef]
- Khan, W.; Rayirath, U.P.; Subramanian, S.; Jithesh, M.N.; Rayorath, P.; Hodges, D.M.; Critchley, A.T.; Craigie, J.S.; Norrie, J.; Prithiviraj, B. Seaweed Extracts as Biostimulants of Plant Growth and Development. J. Plant Growth Regul. 2009, 28, 386–399. [Google Scholar] [CrossRef]
- Stirk, W.A.; Van Staden, J. Chapter Five—Plant Growth Regulators in Seaweeds: Occurrence, Regulation and Functions. In Advances in Botanical Research; Bourgougnon, N., Ed.; Academic Press: Cambridge, MA, USA, 2014; Volume 71, pp. 125–159. [Google Scholar]
- Kurepin, L.V.; Zaman, M.; Pharis, R.P. Phytohormonal basis for the plant growth promoting action of naturally occurring biostimulators. J. Sci. Food Agric. 2014, 94, 1715–1722. [Google Scholar] [CrossRef]
- González, A.; Castro, J.; Vera, J.; Moenne, A. Seaweed Oligosaccharides Stimulate Plant Growth by Enhancing Carbon and Nitrogen Assimilation, Basal Metabolism, and Cell Division. J. Plant Growth Regul. 2012, 32, 443–448. [Google Scholar] [CrossRef] [Green Version]
- Di Stasio, E.; Rouphael, Y.; Colla, G.; Raimondi, G.; Giordano, M.; Pannico, A.; El-Nakhel, C.; De Pascale, S. The influence of Ecklonia maxima seaweed extract on growth, photosynthetic activity and mineral composition of Brassica rapa L. subsp. sylvestris under nutrient stress conditions. Eur. J. Hortic. Sci. 2018, 82, 286–293. [Google Scholar] [CrossRef]
- Carillo, P.; Ciarmiello, L.F.; Woodrow, P.; Corrado, G.; Chiaiese, P.; Rouphael, Y. Enhancing Sustainability by Improving Plant Salt Tolerance through Macro-and Micro-Algal Biostimulants. Biology 2020, 9, 253. [Google Scholar] [CrossRef]
- Carillo, P.; Cirillo, C.; De Micco, V.; Arena, C.; De Pascale, S.; Rouphael, Y. Morpho-anatomical, physiological and biochemical adaptive responses to saline water of Bougainvillea spectabilis Willd. trained to different canopy shapes. Agric. Water Manag. 2019, 212, 12–22. [Google Scholar] [CrossRef]
- Dell’Aversana, E.; Hessini, K.; Ferchichi, S.; Fusco, G.; Woodrow, P.; Ciarmiello, L.; Abdelly, C.; Carillo, P. Salinity Duration Differently Modulates Physiological Parameters and Metabolites Profile in Roots of Two Contrasting Barley Genotypes. Plants 2021, 10, 307. [Google Scholar] [CrossRef] [PubMed]
- Acosta-Motos, J.R.; Álvarez, S.; Barba-Espín, G.; Hernández, J.A.; Sánchez-Blanco, M.J. Salts and nutrients present in regenerated waters induce changes in water relations, antioxidative metabolism, ion accumulation and restricted ion uptake in Myrtus communis L. plants. Plant Physiol. Biochem. 2014, 85, 41–50. [Google Scholar] [CrossRef] [Green Version]
- Annunziata, M.G.; Ciarmiello, L.F.; Woodrow, P.; Dell’Aversana, E.; Carillo, P. Spatial and Temporal Profile of Glycine Betaine Accumulation in Plants Under Abiotic Stresses. Front. Plant Sci. 2019, 10, 230. [Google Scholar] [CrossRef] [Green Version]
- Shukla, P.S.; Mantin, E.G.; Adil, M.; Bajpai, S.; Critchley, A.T.; Prithiviraj, B. Ascophyllum nodosum-based biostimulants: Sustainable applications in agriculture for the stimulation of plant growth, stress tolerance, and disease management. Front. Plant Sci. 2019, 10, 655. [Google Scholar] [CrossRef] [Green Version]
- Jithesh, M.N.; Wally, O.S.; Manfield, I.; Critchley, A.T.; Hiltz, D.; Prithiviraj, B. Analysis of Seaweed Extract-induced Transcriptome Leads to Identification of a Negative Regulator of Salt Tolerance in Arabidopsis. HortScience 2012, 47, 704–709. [Google Scholar] [CrossRef] [Green Version]
- Sassi, S.; Aydi, S.; Hessini, K.; Gonzalez, E.M.; Arrese-Igor, C.; Abdelly, C. Long-term mannitol-induced osmotic stress leads to stomatal closure, carbohydrate accumulation and changes in leaf elasticity in Phaseolus vulgaris leaves. Afr. J. Biotechnol. 2010, 9, 6061–6069. [Google Scholar]
- Vreugdenhil, D. Uptake of mannitol from the media by in vitro grown plants. Plant Cell Tissue Organ Cult. 1996, 45, 103–107. [Google Scholar] [CrossRef]
- Battacharyya, D.; Babgohari, M.Z.; Rathor, P.; Prithiviraj, B. Seaweed extracts as biostimulants in horticulture. Sci. Hortic. 2015, 196, 39–48. [Google Scholar] [CrossRef]
- Bonomelli, C.; Celis, V.; Lombardi, G.; Mártiz, J. Salt Stress Effects on Avocado (Persea americana Mill.) Plants with and without Seaweed Extract (Ascophyllum nodosum) Application. Agronomy 2018, 8, 64. [Google Scholar] [CrossRef] [Green Version]
- Colla, G.; Cardarelli, M.; Bonini, P.; Rouphael, Y. Foliar Applications of Protein Hydrolysate, Plant and Seaweed Extracts Increase Yield but Differentially Modulate Fruit Quality of Greenhouse Tomato. HortScience 2017, 52, 1214–1220. [Google Scholar] [CrossRef]
- Rouphael, Y.; Giordano, M.; Cardarelli, M.; Cozzolino, E.; Mori, M.; Kyriacou, M.C.; Bonini, P.; Colla, G. Plant-and Seaweed-Based Extracts Increase Yield but Differentially Modulate Nutritional Quality of Greenhouse Spinach through Biostimulant Action. Agronomy 2018, 8, 126. [Google Scholar] [CrossRef] [Green Version]
- De Saeger, J.; Van Praet, S.; Vereecke, D.; Park, J.; Jacques, S.; Han, T.; Depuydt, S. Toward the molecular understanding of the action mechanism of Ascophyllum nodosum extracts on plants. Environ. Boil. Fishes 2019, 32, 573–597. [Google Scholar] [CrossRef] [Green Version]
- Puniran-Hartley, N.; Hartley, J.; Shabala, L.; Shabala, S. Salinity-induced accumulation of organic osmolytes in barley and wheat leaves correlates with increased oxidative stress tolerance: In planta evidence for cross-tolerance. Plant Physiol. Biochem. 2014, 83, 32–39. [Google Scholar] [CrossRef]
- Dell’Aversana, E. Use of Biostimulants to Increase Yield and Quality of Crop Plants; Università degli Studi della Campania “Luigi Vanvitelli”: Caserta, Italy, 2019. [Google Scholar]
- Flores, P.; Hernández, V.; Hellín, P.; Fenoll, J.; Cava, J.; Mestre, T.; Martinez, V. Metabolite profile of the tomato dwarf cultivar Micro-Tom and comparative response to saline and nutritional stresses with regard to a commercial cultivar. J. Sci. Food Agric. 2015, 96, 1562–1570. [Google Scholar] [CrossRef]
- Yin, Y.-G.; Kobayashi, Y.; Sanuki, A.; Kondo, S.; Fukuda, N.; Ezura, H.; Sugaya, S.; Matsukura, C. Salinity induces carbohydrate accumulation and sugar-regulated starch biosynthetic genes in tomato (Solanum lycopersicum L. cv. ‘Micro-Tom’) fruits in an ABA- and osmotic stress-independent manner. J. Exp. Bot. 2009, 61, 563–574. [Google Scholar] [CrossRef]
- Obiadalla-Ali, H.; Fernie, A.R.; Kossmann, J.; Lloyd, J.R. Developmental analysis of carbohydrate metabolism in tomato (Lycopersicon esculentum cv. Micro-Tom) fruits. Physiol. Plant. 2004, 120, 196–204. [Google Scholar] [CrossRef]
- Li, Y.; Chen, Y.; Zhou, L.; You, S.; Deng, H.; Chen, Y.; Alseekh, S.; Yuan, Y.; Fu, R.; Zhang, Z.; et al. MicroTom Metabolic Network: Rewiring Tomato Metabolic Regulatory Network throughout the Growth Cycle. Mol. Plant 2020, 13, 1203–1218. [Google Scholar] [CrossRef]
- Sharma, H.S.S.; Selby, C.; Carmichael, E.; McRoberts, C.; Rao, J.R.; Ambrosino, P.; Chiurazzi, M.; Pucci, M.; Martin, T. Physicochemical analyses of plant biostimulant formulations and characterisation of commercial products by instrumental techniques. Chem. Biol. Technol. Agric. 2016, 3, 3. [Google Scholar] [CrossRef] [Green Version]
- Noctor, G.; Foyer, C.H. Ascorbate and Glutathione: Keeping Active Oxygen Under Control. Annu. Rev. Plant Biol. 1998, 49, 249–279. [Google Scholar] [CrossRef] [PubMed]
- El-Samad, H.; Shaddad, M.; Barakat, N. The role of amino acids in improvement in salt tolerance of crop plants. J. Stress Physiol. Biochem. 2010, 6, 25–37. [Google Scholar]
- Araújo, W.L.; Ishizaki, K.; Nunes-Nesi, A.; Larson, T.R.; Tohge, T.; Krahnert, I.; Witt, S.; Obata, T.; Schauer, N.; Graham, I.A.; et al. Identification of the 2-Hydroxyglutarate and Isovaleryl-CoA Dehydrogenases as Alternative Electron Donors Linking Lysine Catabolism to the Electron Transport Chain of Arabidopsis Mitochondria. Plant Cell 2010, 22, 1549–1563. [Google Scholar] [CrossRef] [Green Version]
- Peng, C.; Uygun, S.; Shiu, S.-H.; Robert, L.L. The Impact of the Branched-Chain Ketoacid Dehydrogenase Complex on Amino Acid Homeostasis in Arabidopsis. Plant Physiol. 2015, 169, 1807–1820. [Google Scholar] [CrossRef] [Green Version]
- Iwasa, M.; Kobayashi, Y.; Mifuji-Moroka, R.; Hara, N.; Miyachi, H.; Sugimoto, R.; Tanaka, H.; Fujita, N.; Gabazza, E.C.; Takei, Y. Branched-Chain Amino Acid Supplementation Reduces Oxidative Stress and Prolongs Survival in Rats with Advanced Liver Cirrhosis. PLoS ONE 2013, 8, e70309. [Google Scholar] [CrossRef] [Green Version]
- Noctor, G.; Novitskaya, L.; Lea, P.J.; Foyer, C.H. Co-ordination of leaf minor amino acid contents in crop species: Significance and interpretation. J. Exp. Bot. 2002, 53, 939–945. [Google Scholar] [CrossRef] [Green Version]
- Fritz, C.; Palacios-Rojas, N.; Feil, R.; Stitt, M. Regulation of secondary metabolism by the carbon-nitrogen status in tobacco: Nitrate inhibits large sectors of phenylpropanoid metabolism. Plant J. 2006, 46, 533–548. [Google Scholar] [CrossRef]
- Foyer, C.H.; Parry, M.; Noctor, G. Markers and signals associated with nitrogen assimilation in higher plants. J. Exp. Bot. 2003, 54, 585–593. [Google Scholar] [CrossRef]
- Morcuende, R.; Krapp, A.; Hurry, V.; Stitt, M. Sucrose-feeding leads to increased rates of nitrate assimilation, increased rates of α-oxoglutarate synthesis, and increased synthesis of a wide spectrum of amino acids in tobacco leaves. Planta 1998, 206, 394–409. [Google Scholar] [CrossRef]
- Araújo, W.L.; Tohge, T.; Ishizaki, K.; Leaver, C.J.; Fernie, A.R. Protein degradation—An alternative respiratory substrate for stressed plants. Trends Plant Sci. 2011, 16, 489–498. [Google Scholar] [CrossRef]
- Woodrow, P.; Ciarmiello, L.F.; Annunziata, M.G.; Pacifico, S.; Iannuzzi, F.; Mirto, A.; D’Amelia, L.; Dell’Aversana, E.; Piccolella, S.; Fuggi, A.; et al. Durum wheat seedling responses to simultaneous high light and salinity involve a fine reconfiguration of amino acids and carbohydrate metabolism. Physiol. Plant. 2017, 159, 290–312. [Google Scholar] [CrossRef]
- Carillo, P.; Kyriacou, M.C.; El-Nakhel, C.; Pannico, A.; Dell’Aversana, E.; D’Amelia, L.; Colla, G.; Caruso, G.; De Pascale, S.; Rouphael, Y. Sensory and functional quality characterization of protected designation of origin ‘Piennolo del Vesuvio’ cherry tomato landraces from Campania-Italy. Food Chem. 2019, 292, 166–175. [Google Scholar] [CrossRef]
- Limami, A.M.; Glévarec, G.; Ricoult, C.; Cliquet, J.-B.; Planchet, E. Concerted modulation of alanine and glutamate metabolism in young Medicago truncatula seedlings under hypoxic stress. J. Exp. Bot. 2008, 59, 2325–2335. [Google Scholar] [CrossRef] [Green Version]
- Diab, H.; Limami, A.M. Reconfiguration of N Metabolism upon Hypoxia Stress and Recovery: Roles of Alanine Aminotransferase (AlaAT) and Glutamate Dehydrogenase (GDH). Plants 2016, 5, 25. [Google Scholar] [CrossRef] [Green Version]
- Carillo, P.; Colla, G.; Kyriacou, M.C.; Cardarelli, M.; Rouphael, Y.; Fusco, G.M.; Dell’Aversana, E.; El-Nakhel, C.; Giordano, M.; Pannico, A.; et al. Morphological and Physiological Responses Induced by Protein Hydrolysate-Based Biostimulant and Nitrogen Rates in Greenhouse Spinach. Agronomy 2019, 9, 450. [Google Scholar] [CrossRef] [Green Version]
- Li, Z.; Yu, J.; Peng, Y.; Huang, B. Metabolic pathways regulated by γ-aminobutyric acid (GABA) contributing to heat tolerance in creeping bentgrass (Agrostis stolonifera). Sci. Rep. 2016, 6, 30338. [Google Scholar] [CrossRef] [Green Version]
- Hare, P.; Cress, W. Metabolic implications of stress-induced proline accumulation in plants. Plant Growth Regul. 1997, 21, 79–102. [Google Scholar] [CrossRef]
- Carillo, P.; Mastrolonardo, G.; Nacca, F.; Parisi, D.; Verlotta, A.; Fuggi, A. Nitrogen metabolism in durum wheat under salinity: Accumulation of proline and glycine betaine. Funct. Plant Biol. 2008, 35, 412–426. [Google Scholar] [CrossRef]
- Greenway, H.; Munns, R. Mechanisms of Salt Tolerance in Nonhalophytes. Annu. Rev. Plant Physiol. 1980, 31, 149–190. [Google Scholar] [CrossRef]
- Wang, M.; Zheng, Q.; Shen, Q.; Guo, S. The Critical Role of Potassium in Plant Stress Response. Int. J. Mol. Sci. 2013, 14, 7370–7390. [Google Scholar] [CrossRef] [PubMed] [Green Version]
- Koffler, B.E.; Bloem, E.; Zellnig, G.; Zechmann, B. High resolution imaging of subcellular glutathione concentrations by quantitative immunoelectron microscopy in different leaf areas of Arabidopsis. Micron 2013, 45, 119–128. [Google Scholar] [CrossRef] [PubMed]
- Scott, J.W.; Harbaugh, B.K. Micro-Tom. A Miniature Dwarf Tomato. Circular; University of Florida, Agricultural Experiment Station: Gainesville, FL, USA, 1989; Volume S-370, pp. 1–6. [Google Scholar]
- Carillo, P.; Dell’Aversana, E.; Modarelli, G.C.; Fusco, G.M.; De Pascale, S.; Paradiso, R. Metabolic profile and performance responses of Ranunculus asiaticus L. hybrids as affected by light quality of photoperiodic lighting. Front. Plant Sci. 2020, 11, 597823. [Google Scholar] [CrossRef]
- Carillo, P.; Parisi, D.; Woodrow, P.; Pontecorvo, G.; Massaro, G.; Annunziata, M.G.; Fuggi, A.; Sulpice, R. Salt-induced accumulation of glycine betaine is inhibited by high light in durum wheat. Funct. Plant Biol. 2011, 38, 139–150. [Google Scholar] [CrossRef] [PubMed]
- Annunziata, M.G.; Attico, A.; Woodrow, P.; Oliva, M.A.; Fuggi, A.; Carillo, P. An improved fluorimetric HPLC method for quantifying tocopherols in Brassica rapa L. subsp. sylvestris after harvest. J. Food Compos. Anal. 2012, 27, 145–150. [Google Scholar] [CrossRef]
- Woodrow, P.; Fuggi, A.; Pontecorvo, G.; Kafantaris, I.; Annunziata, M.G.; Massaro, G.; Carillo, P. cDNA cloning and differential expression patterns of ascorbate peroxidase during post-harvest in Brassica rapa L. Mol. Biol. Rep. 2012, 39, 7843–7853. [Google Scholar] [CrossRef] [PubMed]
- Queval, G.; Noctor, G. A plate reader method for the measurement of NAD, NADP, glutathione, and ascorbate in tissue extracts: Application to redox profiling during Arabidopsis rosette development. Anal. Biochem. 2007, 363, 58–69. [Google Scholar] [CrossRef] [PubMed]
- Annunziata, M.G.; Ciarmiello, L.F.; Woodrow, P.; Maximova, E.; Fuggi, A.; Carillo, P. Durum Wheat Roots Adapt to Salinity Remodeling the Cellular Content of Nitrogen Metabolites and Sucrose. Front. Plant Sci. 2017, 7, 2035. [Google Scholar] [CrossRef] [Green Version]
- Cuin, T.A.; Tian, Y.; Betts, S.A.; Chalmandrier, R.; Shabala, S. Ionic relations and osmotic adjustment in durum and bread wheat under saline conditions. Funct. Plant Biol. 2009, 36, 1110–1119. [Google Scholar] [CrossRef]
- Ciarmiello, L.F.; Piccirillo, P.; Carillo, P.; De Luca, A.; Woodrow, P. Determination of the genetic relatedness of fig (Ficus carica L.) accessions using RAPD fingerprint and their agro-morphological characterization. S. Afr. J. Bot. 2015, 97, 40–47. [Google Scholar] [CrossRef]


| Leaves FW | Leaves DW | Fruit FW | Fruit DW | Number of Fruits | |
|---|---|---|---|---|---|
| g | g | g | g | ||
| Nutrient solution (N) | ns | ns | ns | ns | ns |
| 100% BNS | 13.96 | 1.94 | 31.19 | 2.66 | 15.64 |
| 70% BNS | 13.98 | 1.80 | 33.63 | 2.81 | 15.80 |
| Biostimulant (B) | ns | ns | ** | ns | ns |
| Control | 14.75 | 2.00 | 34.69 a | 2.90 | 16.30 |
| Rygex | 13.43 | 1.73 | 28.78 b | 2.48 | 14.60 |
| Superfifty | 13.74 | 1.89 | 33.76 a | 2.82 | 16.27 |
| Salinity (S) | * | ns | *** | *** | *** |
| S0 | 15.23 a | 1.95 | 43.57 a | 3.22 a | 17.73 a |
| S1 | 14.62 ab | 1.93 | 29.57 b | 2.63 b | 16.23 a |
| S2 | 12.08 b | 1.74 | 24.09 c | 2.35 b | 13.20 b |
| NxB | ns | ns | ns | ns | ns |
| NxS | ns | ns | ns | ns | ns |
| BxS | ns | ns | ns | ns | ns |
| NxBxS | ns | ns | ns | ns | ns |
| 100% Control S0 | 14.10 | 1.86 | 46.72 | 3.35 | 18.60 |
| 100% Control S1 | 17.72 | 2.32 | 27.07 | 2.15 | 16.00 |
| 100% Control S2 | 11.47 | 2.03 | 25.52 | 2.69 | 15.20 |
| 100% Rygex S0 | 14.28 | 1.81 | 34.14 | 2.68 | 17.00 |
| 100% Rygex S1 | 12.26 | 1.57 | 27.51 | 2.58 | 14.80 |
| 100% Rygex S2 | 10.84 | 1.52 | 21.54 | 2.17 | 11.60 |
| 100% Superfifty S0 | 15.39 | 2.10 | 39.25 | 3.03 | 16.40 |
| 100% Superfifty S1 | 15.43 | 2.33 | 32.47 | 2.56 | 17.00 |
| 100% Superfifty S2 | 14.19 | 1.96 | 26.45 | 2.72 | 14.20 |
| 70% Control S0 | 15.27 | 1.95 | 51.19 | 3.58 | 16.60 |
| 70% Control S1 | 14.21 | 1.67 | 29.92 | 2.99 | 16.40 |
| 70% Control S2 | 15.74 | 2.18 | 27.73 | 2.65 | 15.00 |
| 70% Rygex S0 | 15.14 | 1.83 | 42.99 | 3.27 | 19.80 |
| 70% Rygex S1 | 16.90 | 2.15 | 26.95 | 2.58 | 15.40 |
| 70% Rygex S2 | 11.19 | 1.51 | 19.53 | 1.62 | 9.00 |
| 70% Superfifty S0 | 17.17 | 2.14 | 47.12 | 3.42 | 18.00 |
| 70% Superfifty S1 | 11.20 | 1.53 | 33.49 | 2.94 | 17.80 |
| 70% Superfifty S2 | 9.06 | 1.25 | 23.75 | 2.23 | 14.20 |
| Calcium | Chloride | Potassium | Magnesium | Nitrate | Sodium | K+:Na+ | |
|---|---|---|---|---|---|---|---|
| mg g−1 FW | mg g−1 FW | mg g−1 FW | mg g−1 FW | mg g−1 FW | mg g−1 FW | ||
| Nutrient solution (N) | ns | ns | ns | *** | * | *** | ns |
| 100% BNS | 1.64 | 1.95 | 5.37 | 0.39 b | 0.15 a | 1.03 a | 16.92 |
| 70% BNS | 1.68 | 1.68 | 5.43 | 0.47 a | 0.13 b | 0.80 b | 16.04 |
| Biostimulant (B) | ns | *** | ns | ** | *** | * | ** |
| Control | 1.57 | 2.11 a | 5.24 | 0.39 b | 0.12 b | 0.85 b | 17.48 a |
| Rygex | 1.65 | 1.02 b | 5.29 | 0.42 ab | 0.14 b | 1.00 a | 12.79 b |
| Superfifty | 1.76 | 2.33 a | 5.66 | 0.47 a | 0.17 a | 0.92 ab | 19.16 a |
| Salinity (S) | ns | *** | *** | ns | *** | *** | *** |
| S0 | 1.63 | 0.78 c | 6.29 a | 0.45 | 0.17 a | 0.17 c | 39.47 a |
| S1 | 1.68 | 1.91 b | 5.66 a | 0.43 | 0.15 b | 0.85 b | 7.41 b |
| S2 | 1.67 | 2.76 a | 4.25 b | 0.41 | 0.10 c | 1.74 a | 2.54 c |
| NxB | ** | ns | ns | ns | ns | ns | ns |
| NxS | ns | * | ns | ns | * | ** | * |
| BxS | ns | ** | ns | ns | ** | * | ** |
| NxBxS | ns | ns | ns | ns | ns | * | * |
| 100% Control S0 | 1.93 | 1.17 | 6.18 | 0.46 | 0.15 | 0.15 g | 42.26 ab |
| 100% Control S1 | 1.88 | 3.24 | 6.07 | 0.34 | 0.13 | 1.13 cde | 5.40 d |
| 100% Control S2 | 1.77 | 3.11 | 3.84 | 0.30 | 0.11 | 1.82 ab | 2.13 d |
| 100% Rygex S0 | 0.96 | 0.56 | 5.91 | 0.33 | 0.21 | 0.19 g | 32.22 b |
| 100% Rygex S1 | 1.65 | 1.30 | 5.60 | 0.43 | 0.15 | 1.05 cdef | 5.39 d |
| 100% Rygex S2 | 1.72 | 1.07 | 4.17 | 0.38 | 0.06 | 2.13 ab | 2.00 d |
| 100% Superfifty S0 | 1.43 | 0.93 | 6.80 | 0.42 | 0.22 | 0.13 g | 54.47 ab |
| 100% Superfifty S1 | 1.70 | 2.71 | 5.82 | 0.43 | 0.16 | 0.92 def | 6.24 d |
| 100% Superfifty S2 | 1.74 | 3.51 | 3.91 | 0.40 | 0.14 | 1.82 ab | 2.15 d |
| 70% Control S0 | 1.26 | 0.83 | 6.06 | 0.44 | 0.13 | 0.14 g | 43.60 ab |
| 70% Control S1 | 1.38 | 1.64 | 4.97 | 0.42 | 0.11 | 0.63 efg | 7.87 d |
| 70% Control S2 | 1.19 | 2.68 | 4.34 | 0.40 | 0.08 | 1.20 cd | 3.62 d |
| 70% Rygex S0 | 1.81 | 0.51 | 6.32 | 0.47 | 0.17 | 0.23 g | 28.30 bc |
| 70% Rygex S1 | 1.76 | 1.28 | 4.89 | 0.46 | 0.14 | 0.87 def | 5.68 d |
| 70% Rygex S2 | 2.01 | 1.39 | 4.84 | 0.48 | 0.08 | 1.53 bc | 3.15 d |
| 70% Superfifty S0 | 2.39 | 0.71 | 6.45 | 0.61 | 0.14 | 0.18 g | 36.00 b |
| 70% Superfifty S1 | 1.71 | 1.31 | 6.59 | 0.48 | 0.20 | 0.50 fg | 13.88 cd |
| 70% Superfifty S2 | 1.58 | 4.79 | 4.42 | 0.50 | 0.14 | 1.95 ab | 2.21 d |
| Asc | DHA | DHA/Asc | Glut Rid | GSSG | GSSG:GSH | |
|---|---|---|---|---|---|---|
| nmol g−1 FW | nmol g−1 FW | nmol g−1 FW | nmol g−1 FW | |||
| Nutrient solution (N) | ns | ** | *** | * | ns | ns |
| 100% BNS | 9.30 | 2.68 a | 0.31 a | 242.91 a | 148.01 | 0.66 |
| 70% BNS | 10.10 | 2.13 b | 0.22 b | 223.87 b | 140.41 | 0.67 |
| Biostimulant (B) | * | *** | *** | *** | ns | *** |
| Control | 9.95 ab | 1.60 b | 0.17 b | 204.19 b | 152.78 | 0.75 a |
| Rygex | 10.53 a | 1.72 b | 0.17 b | 175.87 c | 138.71 | 0.79 a |
| Superfifty | 8.62 b | 3.90 a | 0.45 a | 320.11 a | 141.14 | 0.44 b |
| Salinity (S) | ns | *** | *** | ** | ns | * |
| S0 | 9.04 | 3.02 a | 0.35 a | 257.69 a | 147.71 | 0.62 b |
| S1 | 10.54 | 2.06 b | 0.21 b | 225.02 b | 141.15 | 0.67 ab |
| S2 | 9.52 | 2.12 b | 0.23 b | 217.45 b | 143.78 | 0.70 a |
| NxB | ns | *** | *** | * | ns | ns |
| NxS | ns | ns | ns | ns | ns | ns |
| BxS | ns | *** | *** | ns | * | ns |
| NxBxS | ns | ns | ns | ns | ns | ns |
| 100% Control S0 | 8.08 | 1.62 | 0.20 | 207.9 | 146.4 | 0.70 |
| 100% Control S1 | 11.05 | 1.55 | 0.15 | 211.2 | 158.6 | 0.75 |
| 100% Control S2 | 9.71 | 1.56 | 0.17 | 178.7 | 131.9 | 0.74 |
| 100% Rygex S0 | 8.91 | 1.59 | 0.18 | 180.6 | 133.7 | 0.74 |
| 100% Rygex S1 | 11.57 | 1.63 | 0.15 | 193.6 | 154.7 | 0.81 |
| 100% Rygex S2 | 8.93 | 1.55 | 0.18 | 172.0 | 148.7 | 0.84 |
| 100% Superfifty S0 | 8.47 | 6.27 | 0.74 | 386.1 | 136.5 | 0.35 |
| 100% Superfifty S1 | 8.05 | 4.27 | 0.52 | 295.1 | 131.3 | 0.46 |
| 100% Superfifty S2 | 8.91 | 4.04 | 0.45 | 361.0 | 190.3 | 0.53 |
| 70% Control S0 | 9.12 | 1.61 | 0.18 | 227.2 | 161.9 | 0.71 |
| 70% Control S1 | 12.42 | 1.64 | 0.13 | 230.7 | 182.2 | 0.79 |
| 70% Control S2 | 9.32 | 1.58 | 0.17 | 169.4 | 135.7 | 0.80 |
| 70% Rygex S0 | 10.78 | 2.18 | 0.22 | 216.6 | 157.4 | 0.74 |
| 70% Rygex S1 | 11.32 | 1.71 | 0.16 | 137.2 | 117.9 | 0.86 |
| 70% Rygex S2 | 11.65 | 1.64 | 0.14 | 155.1 | 119.9 | 0.77 |
| 70% Superfifty S0 | 8.90 | 4.88 | 0.55 | 327.7 | 150.4 | 0.46 |
| 70% Superfifty S1 | 8.86 | 1.57 | 0.18 | 282.3 | 102.2 | 0.35 |
| 70% Superfifty S2 | 8.57 | 2.36 | 0.27 | 268.5 | 136.2 | 0.51 |
| Glucose | Fructose | Hexoses | Sucrose | Starch | Soluble Proteins | |
|---|---|---|---|---|---|---|
| µmol g−1 FW | µmol g−1 FW | µmol g−1 FW | µmol g−1 FW | µmol g−1 Glueq FW | mg g−1 FW | |
| Nutrient solution (N) | ns | * | ns | ns | ns | ns |
| 100% BNS | 10.17 | 2.56 a | 12.73 | 2.05 | 2.76 | 12.24 |
| 70% BNS | 10.70 | 2.25 b | 12.47 | 2.26 | 2.76 | 12.21 |
| Biostimulant (B) | *** | ns | *** | *** | *** | ** |
| Control | 13.73 a | 2.38 | 16.11 a | 3.04 a | 3.22 a | 13.42 a |
| Rygex | 9.46 b | 2.38 | 11.85 b | 1.82 b | 2.26 c | 12.32 a |
| Superfifty | 7.95 c | 2.47 | 9.84 c | 1.57 b | 2.80 b | 10.89 b |
| Salinity (S) | ** | ** | ** | * | ** | ns |
| S0 | 10.71 a | 2.05 b | 12.75 b | 1.92 b | 2.53 b | 12.22 |
| S1 | 11.60 a | 2.68 a | 13.49 a | 2.22 ab | 3.11 a | 12.31 |
| S2 | 9.05 b | 2.51 a | 11.55 b | 2.33 a | 2.65 b | 12.14 |
| NxB | *** | ns | *** | * | ns | ns |
| NxS | ns | ns | ns | * | * | ns |
| BxS | * | ns | ns | ns | *** | ns |
| NxBxS | *** | ns | *** | *** | *** | ** |
| 100% Control S0 | 17.68 a | 2.19 | 19.87 a | 3.54 ab | 3.61 ab | 14.40 ab |
| 100% Control S1 | 16.87 ab | 2.43 | 19.30 a | 2.66 bcd | 3.42 b | 13.46 ab |
| 100% Control S2 | 9.60 cde | 2.76 | 12.35 bcd | 2.44 bcde | 3.07 b | 12.23 ab |
| 100% Rygex S0 | 6.46 e | 1.85 | 8.31 d | 1.15 e | 2.47 bc | 11.19 ab |
| 100% Rygex S1 | 7.17 e | 2.66 | 9.83 cd | 1.58 de | 2.22 bc | 12.39 ab |
| 100% Rygex S2 | 8.15 de | 2.73 | 10.88 bcd | 1.93 de | 2.03 bc | 12.71 ab |
| 100% Superfifty S0 | 8.20 de | 2.60 | 10.80 bcd | 1.45 de | 2.46 bc | 10.87 ab |
| 100% Superfifty S1 | 8.54 de | 2.93 | 11.48 bcd | 1.86 de | 2.91 b | 11.27 ab |
| 100% Superfifty S2 | 8.86 de | 2.87 | 11.73 bcd | 1.84 de | 2.67 bc | 11.64 ab |
| 70% Control S0 | 9.45 cde | 2.06 | 11.51 bcd | 1.96 cde | 1.16 c | 10.61 ab |
| 70% Control S1 | 15.72 ab | 2.69 | 18.41 a | 3.33 abc | 5.18 a | 13.92 ab |
| 70% Control S2 | 13.08 abcd | 2.12 | 15.20 abc | 4.29 a | 2.87 b | 15.90 a |
| 70% Rygex S0 | 14.98 abc | 1.71 | 16.69 ab | 2.21 bcde | 2.33 bc | 14.52 ab |
| 70% Rygex S1 | 11.93 bcde | 2.59 | 14.51 abc | 2.16 bcde | 2.05 bc | 12.05 ab |
| 70% Rygex S2 | 8.10 de | 2.75 | 10.85 bcd | 1.90 de | 2.49 bc | 11.08 ab |
| 70% Superfifty S0 | 7.46 de | 1.89 | 9.35 cd | 1.20 e | 3.15 b | 11.74 ab |
| 70% Superfifty S1 | 8.26 de | 2.81 | 11.07 bcd | 1.50 de | 2.79 bc | 10.41 ab |
| 70% Superfifty S2 | 6.49 e | 1.81 | 8.30 d | 1.57 de | 2.80 bc | 9.29 b |
| Alanine | Asparagine | GABA | Glutamine | Glutamate | Glycine | Proline | Serine | Threonine | Minor AA | Total AA | Gln:Glu | |
|---|---|---|---|---|---|---|---|---|---|---|---|---|
| µmol g−1 FW | µmol g−1 FW | µmol g−1 FW | µmol g−1 FW | µmol g−1 FW | µmol g−1 FW | µmol g−1 FW | µmol g−1 FW | µmol g−1 FW | µmol g−1 FW | µmol g−1 FW | ||
| Nutrient solution (N) | * | *** | *** | *** | * | *** | *** | *** | *** | *** | *** | *** |
| 100% BNS | 1.01 a | 0.88 a | 2.39 a | 24.64 a | 1.94 a | 0.39 a | 0.58 a | 0.71 a | 0.34 a | 4.82 a | 37.47 a | 13.38 a |
| 70% BNS | 0.91 b | 0.76 b | 1.88 b | 11.74 b | 1.76 b | 0.30 b | 0.43 b | 0.57 b | 0.27 b | 3.90 b | 21.99 b | 6.93 b |
| Biostimulant (B) | *** | ns | *** | ns | ** | *** | *** | *** | *** | *** | *** | ns |
| Control | 0.64 b | 0.85 | 2.30 b | 17.57 | 1.76 b | 0.17 b | 0.39 b | 0.43 b | 0.19 b | 3.20 b | 26.82 b | 9.97 |
| Rygex | 0.61 b | 0.78 | 1.42 c | 17.90 | 1.76 b | 0.20 a | 0.57 a | 0.46 b | 0.19 b | 2.52 c | 26.67 b | 11.24 |
| Superfifty | 1.65 a | 0.83 | 2.70 a | 19.35 | 2.06 a | 0.68 a | 0.55 a | 1.04 a | 0.54 a | 7.37 a | 36.16 a | 9.33 |
| Salinity (S) | * | ns | ns | *** | * | ns | *** | ns | * | ns | *** | *** |
| S0 | 1.02 a | 0.86 | 2.14 | 15.11 b | 1.99 a | 0.36 | 0.32 a | 0.64 | 0.33 a | 4.46 | 26.76 b | 7.44 c |
| S1 | 0.89 b | 0.79 | 1.96 | 16.39 b | 1.79 b | 0.32 | 0.50 b | 0.61 | 0.28 b | 4.08 | 27.38 b | 9.43 b |
| S2 | 0.97 a | 0.81 | 2.30 | 23.22 a | 1.78 b | 0.35 | 0.69 c | 0.67 | 0.30 b | 4.54 | 35.22 a | 13.67 a |
| NxB | *** | *** | * | ** | *** | *** | ns | * | ns | *** | ** | *** |
| NxS | ns | ns | ns | ns | ns | * | *** | ns | ns | ns | ns | ns |
| BxS | * | *** | ** | *** | *** | ** | ns | * | * | *** | *** | ** |
| NxBxS | * | *** | * | ** | * | ns | *** | ns | ns | * | * | * |
| 100% Control S0 | 0.94 b | 1.04 abc | 2.67 abcde | 20.03 cdef | 2.22 ab | 0.32 | 0.28 fg | 0.65 | 0.31 | 4.12 d | 32.05 cde | 9.21 bcd |
| 100% Control S1 | 0.63 bc | 1.02 abcd | 2.70 abcd | 12.91 efg | 1.87 bc | 0.19 | 0.57 cd | 0.47 | 0.20 | 3.36 def | 22.77 efgh | 7.01 cd |
| 100% Control S2 | 0.79 bc | 1.10 a | 2.84 abc | 32.16 a | 2.02 abc | 0.15 | 0.57 cd | 0.50 | 0.17 | 3.95 de | 43.93 ab | 16.18 b |
| 100% Rygex S0 | 0.54 c | 0.69 efg | 1.26 f | 13.59 efg | 1.56 bcd | 0.16 | 0.30 efg | 0.43 | 0.20 | 2.30 fg | 21.67 efgh | 8.93 bcd |
| 100% Rygex S1 | 0.59 c | 0.72 defg | 1.47 cdef | 26.99 abc | 1.67 bcd | 0.20 | 0.69 bc | 0.49 | 0.19 | 2.50 fg | 36.22 bcd | 16.07 b |
| 100% Rygex S2 | 0.61 c | 0.74 cdef | 1.65 bcdef | 33.13 a | 1.44 cd | 0.23 | 0.91 ab | 0.51 | 0.20 | 2.84 efg | 42.99 ab | 24.95 a |
| 100% Superfifty S0 | 1.71 a | 1.08 ab | 3.40 a | 31.29 ab | 2.67 a | 0.79 | 0.29 gf | 1.12 | 0.64 | 8.09 ab | 50.23 a | 11.95 bcd |
| 100% Superfifty S1 | 1.51 a | 0.75 cdef | 2.73 abcd | 24.13 abcd | 1.92 abc | 0.74 | 0.57 cd | 1.06 | 0.57 | 8.20 a | 41.74 abc | 13.09 bc |
| 100% Superfifty S2 | 1.74 a | 0.75 cdef | 2.82 abc | 27.49 abc | 2.11 abc | 0.71 | 1.03 a | 1.13 | 0.55 | 8.02 ab | 45.59 ab | 13.06 bc |
| 70% Control S0 | 0.52 c | 0.94 abcde | 1.50 cdef | 11.61 fg | 1.81 bc | 0.11 | 0.18 g | 0.35 | 0.18 | 2.50 fg | 19.18 fgh | 6.56 cd |
| 70% Control S1 | 0.48 c | 0.42 g | 1.13 f | 6.81 g | 1.02 d | 0.08 | 0.29 efg | 0.20 | 0.08 | 2.02 g | 12.10 h | 6.99 cd |
| 70% Control S2 | 0.51 c | 0.60 fg | 2.98 ab | 21.91 bcde | 1.60 bcd | 0.15 | 0.48 cdef | 0.43 | 0.19 | 3.25 def | 30.89 cde | 13.88 bc |
| 70% Rygex S0 | 0.59 c | 0.61 fg | 1.37 def | 6.14 g | 1.70 bcd | 0.16 | 0.51 cdef | 0.36 | 0.16 | 1.98 g | 13.35 gh | 3.90 d |
| 70% Rygex S1 | 0.64 bc | 1.01 abcd | 1.50 cdef | 12.95 efg | 2.28 ab | 0.21 | 0.39 defg | 0.51 | 0.21 | 2.84 efg | 22.33 efgh | 5.93 cd |
| 70% Rygex S2 | 0.67 bc | 0.90 abcdef | 1.31 ef | 14.61 defg | 1.90 bc | 0.22 | 0.63 cd | 0.46 | 0.16 | 2.64 fg | 23.46 efg | 7.69 cd |
| 70% Superfifty S0 | 1.80 a | 0.78 bcdef | 2.65 abcde | 8.02 g | 1.99 abc | 0.62 | 0.38 defg | 0.93 | 0.50 | 7.80 ab | 24.05 efg | 4.09 d |
| 70% Superfifty S1 | 1.66 a | 0.84 abcdef | 2.31 abcdef | 14.11 efg | 2.03 abc | 0.58 | 0.45 cdef | 1.00 | 0.50 | 5.55 bc | 29.55 def | 7.05 cd |
| 70% Superfifty S2 | 1.48 a | 0.75 cdef | 2.22 abcdef | 10.03 g | 1.61 bcd | 0.62 | 0.55 cde | 0.99 | 0.49 | 6.56 c | 24.45 ef | 6.29 cd |
| A. 100% BNS | Control | Rygex | Superfifty | ||||||
|---|---|---|---|---|---|---|---|---|---|
| S0 | S1 | S2 | S0 | S1 | S2 | S0 | S1 | S2 | |
| Osmolality (mosmol/kg) | 349 | 495 | 497 | 300 | 361 | 504 | 323 | 448 | 576 |
| Chloride | 9.5 | 18.5 | 17.6 | 5.3 | 10.1 | 6 | 8.1 | 17.1 | 17.2 |
| Potassium | 45.3 | 31.4 | 19.7 | 50.5 | 39.7 | 21.1 | 53.8 | 33.2 | 17.4 |
| Sodium | 1.9 | 10 | 15.9 | 2.7 | 12.6 | 18.4 | 1.7 | 8.9 | 13.7 |
| Measured ions | 56.7 | 59.8 | 53.2 | 58.4 | 62.4 | 45.5 | 63.6 | 59.2 | 48.2 |
| Glucose | 17.7 | 16.9 | 9.6 | 6.5 | 7.2 | 8.1 | 8.2 | 8.5 | 8.9 |
| Fructose | 2.2 | 2.4 | 2.8 | 1.8 | 2.7 | 2.7 | 2.6 | 2.9 | 2.9 |
| Sucrose | 3.5 | 2.7 | 2.4 | 1.1 | 1.6 | 1.9 | 1.5 | 1.9 | 1.8 |
| Sum of soluble sugars | 23.4 | 22 | 14.8 | 9.5 | 11.4 | 12.8 | 12.2 | 13.3 | 13.6 |
| Ala | 0.3 | 0.1 | 0.2 | 0.2 | 0.2 | 0.1 | 0.5 | 0.3 | 0.3 |
| Asn | 0.6 | 0.3 | 0.5 | 0.6 | 0.6 | 0.5 | 0.8 | 0.5 | 0.4 |
| Asp | 0.3 | 0.2 | 0.2 | 0.2 | 0.2 | 0.1 | 0.3 | 0.2 | 0.1 |
| GABA | 0.4 | 0.3 | 0.3 | 1.1 | 0.8 | 0.6 | 0.8 | 0.6 | 0.5 |
| Gln | 5.7 | 2.6 | 6.5 | 4.5 | 7.5 | 6.6 | 9.7 | 5.4 | 4.8 |
| Glu | 0.6 | 0.4 | 0.4 | 0.5 | 0.5 | 0.3 | 0.8 | 0.4 | 0.4 |
| Pro | 0.1 | 0.1 | 0.1 | 0.1 | 0.2 | 0.2 | 0.1 | 0.1 | 0.2 |
| Minor AA | 1.2 | 0.7 | 0.8 | 0.8 | 0.7 | 0.6 | 2.5 | 1.8 | 1.4 |
| Total amino acids | 9.2 | 4.6 | 8.8 | 7.2 | 10 | 8.5 | 15.6 | 9.3 | 7.9 |
| Measured organic osmolytes | 32.6 | 26.6 | 23.6 | 16.7 | 21.4 | 21.3 | 27.8 | 22.7 | 21.5 |
| Other metabolites | 10.7 | 13.6 | 23.2 | 24.9 | 16.1 | 33.2 | 8.6 | 18.1 | 30.3 |
| B. 70% BNS | Control | Rygex | Superfifty | ||||||
| S0 | S1 | S2 | S0 | S1 | S2 | S0 | S1 | S2 | |
| Osmolality (mosmol/kg) | 418 | 551 | 655 | 289 | 373 | 439 | 360 | 435 | 572 |
| Chloride | 5.6 | 8.4 | 11.5 | 5 | 9.7 | 8.9 | 5.6 | 8.5 | 23.6 |
| Potassium | 37 | 23.1 | 16.9 | 55.9 | 33.5 | 28.2 | 45.8 | 38.7 | 19.8 |
| Sodium | 1.5 | 5 | 8 | 3.4 | 10.1 | 15.2 | 2.2 | 5 | 14.8 |
| Measured ions | 44.1 | 36.5 | 36.5 | 64.4 | 53.3 | 52.3 | 53.6 | 52.3 | 58.2 |
| Glucose | 9.5 | 15.7 | 13.1 | 15 | 11.9 | 8.1 | 7.5 | 8.3 | 6.5 |
| Fructose | 2.1 | 2.7 | 2.1 | 1.7 | 2.6 | 2.8 | 1.9 | 2.8 | 1.8 |
| Sucrose | 2 | 3.3 | 4.3 | 2.2 | 2.2 | 1.9 | 1.2 | 1.5 | 1.6 |
| Sum of soluble sugars | 13.5 | 21.7 | 19.5 | 18.9 | 16.7 | 12.8 | 10.6 | 12.6 | 9.9 |
| Ala | 0.1 | 0.1 | 0.1 | 0.2 | 0.2 | 0.2 | 0.5 | 0.4 | 0.3 |
| Asn | 0.2 | 0.1 | 0.3 | 0.4 | 0.3 | 0.3 | 0.3 | 0.3 | 0.2 |
| Asp | 0.2 | 0.1 | 0.1 | 0.2 | 0.3 | 0.2 | 0.2 | 0.2 | 0.1 |
| GABA | 0.4 | 0.2 | 0.5 | 0.5 | 0.4 | 0.3 | 0.7 | 0.5 | 0.4 |
| Gln | 2.8 | 1.2 | 3.3 | 2.1 | 3.5 | 3.3 | 2.2 | 3.2 | 1.8 |
| Glu | 0.4 | 0.2 | 0.2 | 0.6 | 0.6 | 0.4 | 0.6 | 0.5 | 0.3 |
| Pro | 0 | 0.1 | 0.1 | 0.2 | 0.1 | 0.1 | 0.1 | 0.1 | 0.1 |
| Minor AA | 0.6 | 0.4 | 0.5 | 0.7 | 0.8 | 0.6 | 2.2 | 1.3 | 1.1 |
| Total amino acids | 4.6 | 2.2 | 4.7 | 4.6 | 6 | 5.3 | 6.7 | 6.8 | 4.3 |
| Measured organic osmolytes | 18.1 | 23.9 | 24.2 | 23.5 | 22.7 | 18.1 | 17.2 | 19.4 | 14.1 |
| Other metabolites | 37.8 | 39.6 | 39.3 | 12.1 | 24 | 29.6 | 29.2 | 28.4 | 27.6 |
Publisher’s Note: MDPI stays neutral with regard to jurisdictional claims in published maps and institutional affiliations. |
© 2021 by the authors. Licensee MDPI, Basel, Switzerland. This article is an open access article distributed under the terms and conditions of the Creative Commons Attribution (CC BY) license (https://creativecommons.org/licenses/by/4.0/).
Share and Cite
Dell’Aversana, E.; Cirillo, V.; Van Oosten, M.J.; Di Stasio, E.; Saiano, K.; Woodrow, P.; Ciarmiello, L.F.; Maggio, A.; Carillo, P. Ascophyllum nodosum Based Extracts Counteract Salinity Stress in Tomato by Remodeling Leaf Nitrogen Metabolism. Plants 2021, 10, 1044. https://doi.org/10.3390/plants10061044
Dell’Aversana E, Cirillo V, Van Oosten MJ, Di Stasio E, Saiano K, Woodrow P, Ciarmiello LF, Maggio A, Carillo P. Ascophyllum nodosum Based Extracts Counteract Salinity Stress in Tomato by Remodeling Leaf Nitrogen Metabolism. Plants. 2021; 10(6):1044. https://doi.org/10.3390/plants10061044
Chicago/Turabian StyleDell’Aversana, Emilia, Valerio Cirillo, Michael James Van Oosten, Emilio Di Stasio, Katya Saiano, Pasqualina Woodrow, Loredana Filomena Ciarmiello, Albino Maggio, and Petronia Carillo. 2021. "Ascophyllum nodosum Based Extracts Counteract Salinity Stress in Tomato by Remodeling Leaf Nitrogen Metabolism" Plants 10, no. 6: 1044. https://doi.org/10.3390/plants10061044