
Freeze-Dried Mesenchymal Stem Cell-Secretome Pharmaceuticalization: Optimization of Formulation and Manufacturing Process Robustness

 ,
,  ,
,  , , , , ,
  and
and
Abstract
: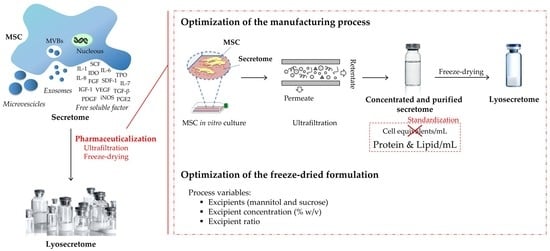
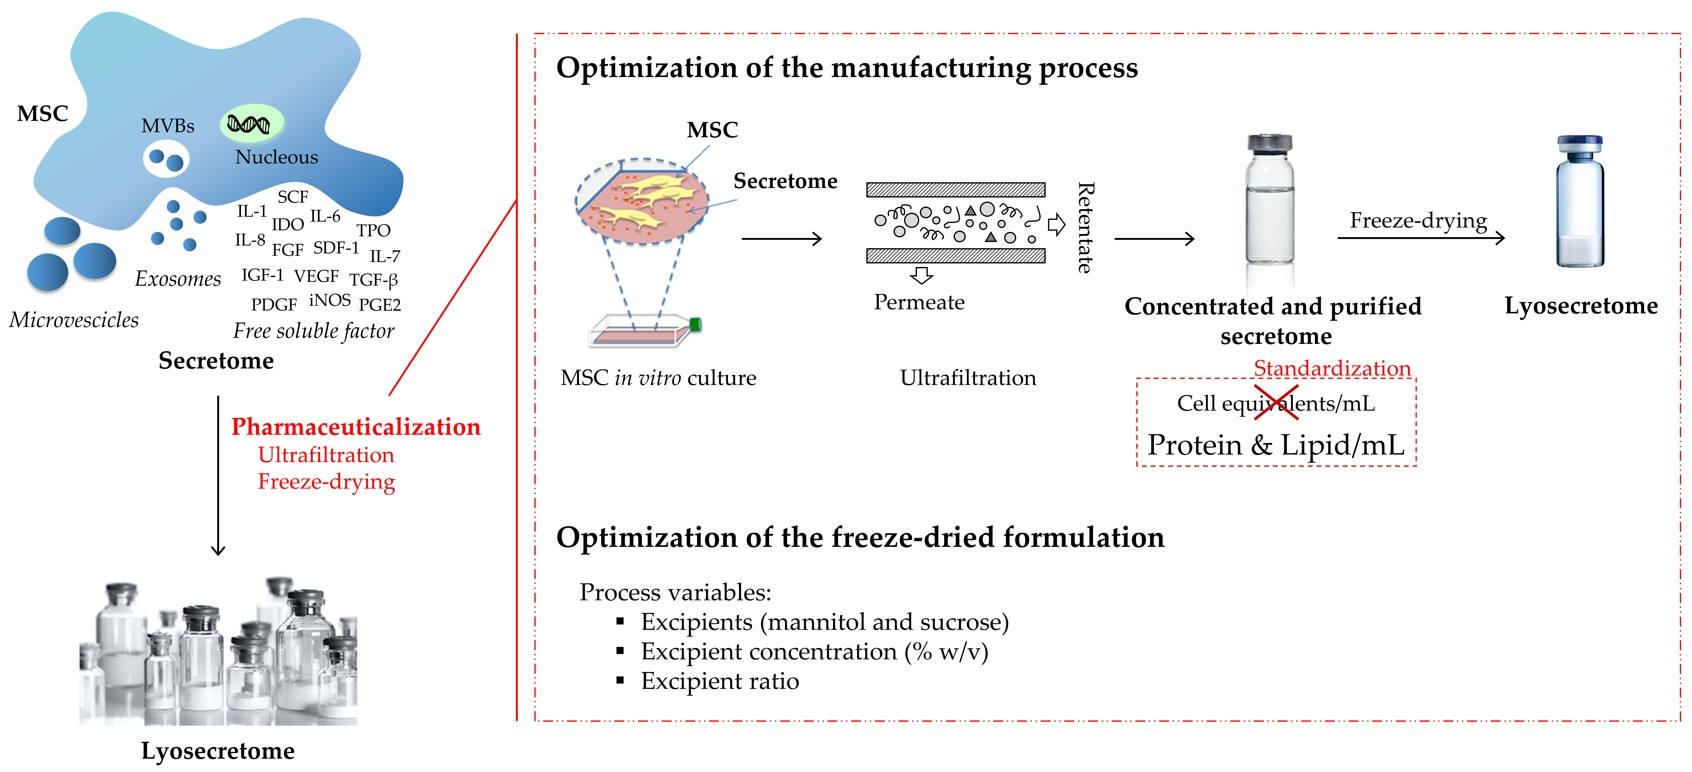
1. Introduction
2. Materials and Methods
2.1. Materials
2.2. Design of Experiments
2.3. Sample Preparation
2.3.1. Isolation and Expansion of Human Adipose-Derived MSCs (AD-MSCs)
2.3.2. MSC-Secretome Ultrafiltration
2.3.3. Freeze-Drying
2.4. Sample Characterization
2.4.1. Residual Moisture
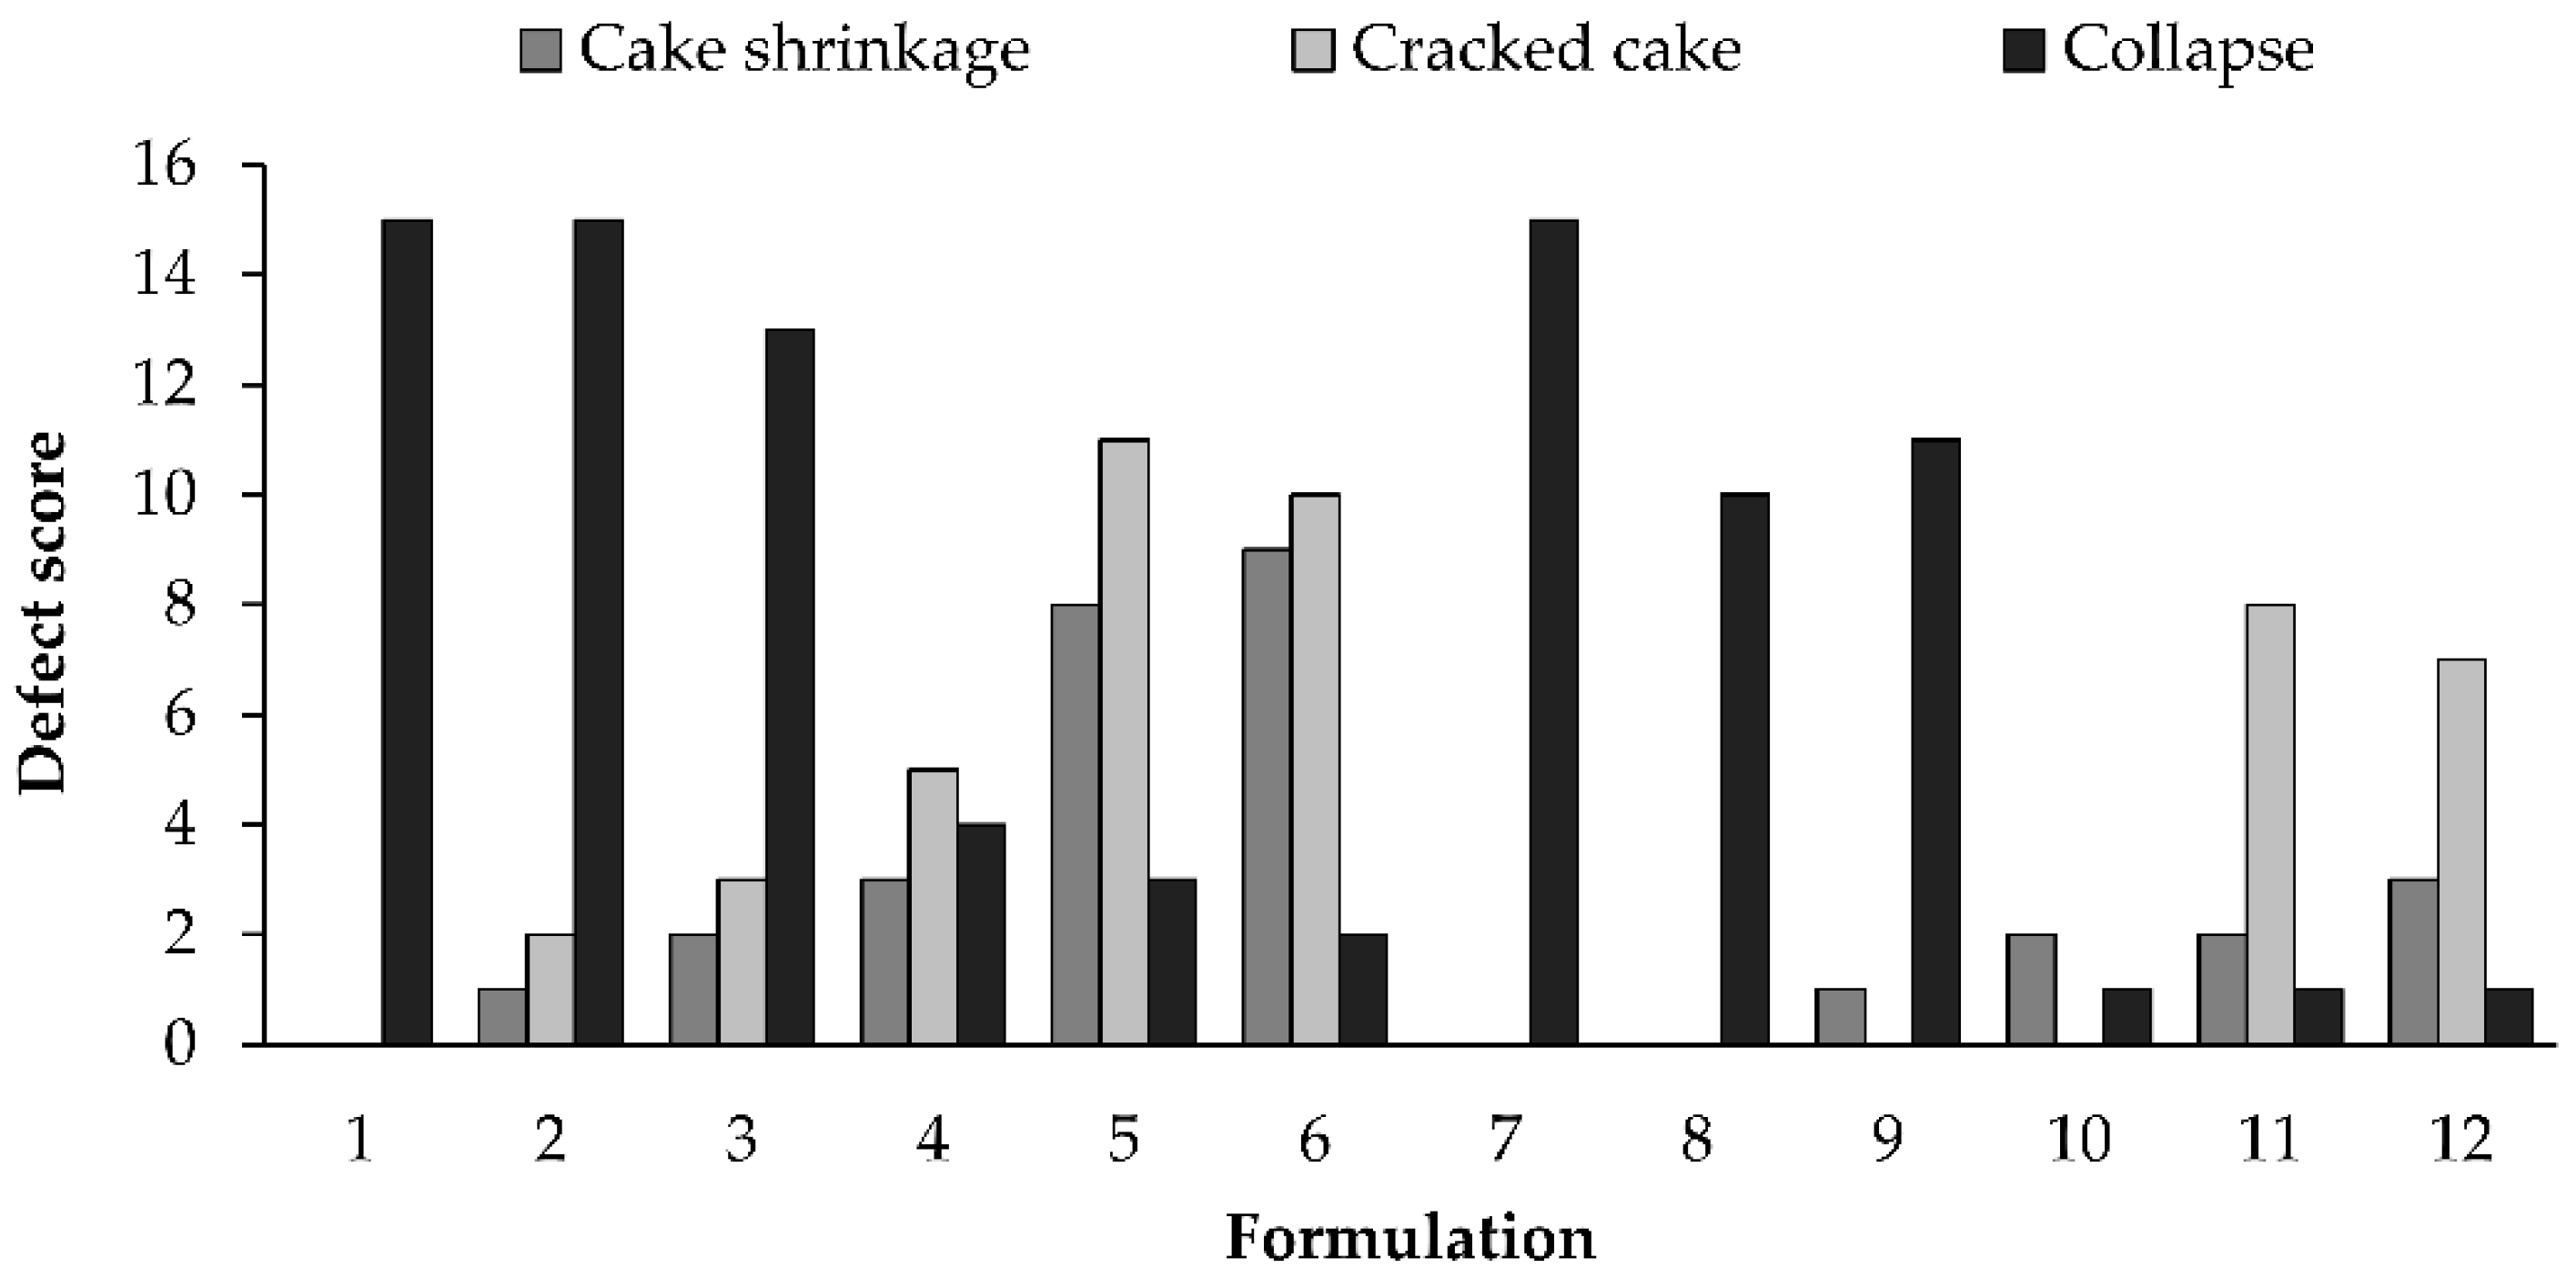
2.4.2. Cake Aspect
2.4.3. Total Protein Content
2.4.4. Phospholipid Quantification by Nile Red Assay
2.4.5. EV Particle Size Determination
2.4.6. Anti-Elastase Activity
2.5. D-Optimal Design
2.6. Optimization and Validation of the Manufacturing Process
3. Results and Discussion
3.1. Model for the “Protein Content” Response, YP
3.2. Model for the “Lipid Content” Response, YL
3.3. Model for the “EV Particle Size” Response, YNTA
3.4. Model for the “In Vitro Anti-Elastase Activity” Response, YA
3.5. Optimization and Validation of the Manufacturing Process
4. Conclusions
Supplementary Materials
Author Contributions
Funding
Institutional Review Board Statement
Informed Consent Statement
Data Availability Statement
Conflicts of Interest
References
- Fujita, Y.; Kadota, T.; Araya, J.; Ochiya, T.; Kuwano, K. Clinical Application of Mesenchymal Stem Cell-Derived Extracellular Vesicle-Based Therapeutics for Inflammatory Lung Diseases. J. Clin. Med. 2018, 7, 355. [Google Scholar] [CrossRef] [Green Version]
- Caplan, A.I. What’s in a Name? Tissue Eng. Part A 2010, 16, 2415–2417. [Google Scholar] [CrossRef] [PubMed] [Green Version]
- Caplan, A.I. Mesenchymal Stem Cells: Time to Change the Name! Stem Cells Transl. Med. 2017, 6, 1445–1451. [Google Scholar] [CrossRef] [Green Version]
- Gnecchi, M.; He, H.M.; Liang, O.D.; Melo, L.G.; Morello, F.; Mu, H.; Noiseux, N.; Zhang, L.N.; Pratt, R.E.; Ingwall, J.S.; et al. Paracrine action accounts for marked protection of ischemic heart by Akt-modified mesenchymal stem cells. Nat. Med. 2005, 11, 367–368. [Google Scholar] [CrossRef]
- Hocking, A.M.; Gibran, N.S. Mesenchymal stem cells: Paracrine signaling and differentiation during cutaneous wound repair. Exp. Cell Res. 2010, 316, 2213–2219. [Google Scholar] [CrossRef] [Green Version]
- Spees, J.L.; Lee, R.H.; Gregory, C.A. Mechanisms of mesenchymal stem/stromal cell function. Stem Cell Res. Ther. 2016, 7, 125. [Google Scholar] [CrossRef] [Green Version]
- Bari, E.; Ferrarotti, I.; Torre, M.L.; Corsico, A.G.; Perteghella, S. Mesenchymal stem/stromal cell secretome for lung regeneration: The long way through “pharmaceuticalization” for the best formulation. J. Control. Release 2019, 309, 11–24. [Google Scholar] [CrossRef] [PubMed]
- Eleuteri, S.; Fierabracci, A. Insights into the Secretome of Mesenchymal Stem Cells and Its Potential Applications. Int. J. Mol. Sci. 2019, 20, 4597. [Google Scholar] [CrossRef] [PubMed] [Green Version]
- Nagelkerke, A.; Ojansivu, M.; van der Koog, L.; Whittaker, T.E.; Cunnane, E.M.; Silva, A.M.; Dekker, N.; Stevens, M.M. Extracellular vesicles for tissue repair and regeneration: Evidence, challenges and opportunities. Adv. Drug Deliv. Rev. 2021, 175, 113775. [Google Scholar] [CrossRef]
- Gimona, M.; Pachler, K.; Laner-Plamberger, S.; Schallmoser, K.; Rohde, E. Manufacturing of Human Extracellular Vesicle-Based Therapeutics for Clinical Use. Int. J. Mol. Sci. 2017, 18, 1190. [Google Scholar] [CrossRef] [PubMed]
- Reiner, A.T.; Witwer, K.W.; van Balkom, B.W.M.; de Beer, J.; Brodie, C.; Corteling, R.L.; Gabrielsson, S.; Gimona, M.; Ibrahim, A.G.; de Kleijn, D.; et al. Concise Review: Developing Best-Practice Models for the Therapeutic Use of Extracellular Vesicles. Stem Cells Transl. Med. 2017, 6, 1730–1739. [Google Scholar] [CrossRef] [Green Version]
- Manandhar, S.; Kothandan, V.K.; Oh, J.; Yoo, S.H.; Hwang, J.; Rim, S. A pharmaceutical investigation into exosomes. J. Pharm. Investig. 2018, 48, 617–626. [Google Scholar] [CrossRef]
- Bari, E.; Perteghella, S.; Di Silvestre, D.; Sorlini, M.; Catenacci, L.; Sorrenti, M.; Marrubini, G.; Rossi, R.; Tripodo, G.; Mauri, P.; et al. Pilot Production of Mesenchymal Stem/Stromal Freeze-Dried Secretome for Cell-Free Regenerative Nanomedicine: A Validated GMP-Compliant Process. Cells 2018, 7, 190. [Google Scholar] [CrossRef] [PubMed] [Green Version]
- Bari, E.; Ferrarotti, I.; Di Silvestre, D.; Grisoli, P.; Barzon, V.; Balderacchi, A.; Torre, M.L.; Rossi, R.; Mauri, P.; Corsico, A.G.; et al. Adipose Mesenchymal Extracellular Vesicles as Alpha-1-Antitrypsin Physiological Delivery Systems for Lung Regeneration. Cells 2019, 8, 965. [Google Scholar] [CrossRef] [Green Version]
- Mocchi, M.; Grolli, S.; Dotti, S.; Di Silvestre, D.; Villa, R.; Berni, P.; Conti, V.; Passignani, G.; Brambilla, F.; Bue, M.D.; et al. Equine Mesenchymal Stem/Stromal Cells Freeze-Dried Secretome (Lyosecretome) for the Treatment of Musculoskeletal Diseases: Production Process Validation and Batch Release Test for Clinical Use. Pharmaceuticals 2021, 14, 553. [Google Scholar] [CrossRef] [PubMed]
- Kumar, K.N.; Mallik, S.; Sarkar, K. Role of freeze-drying in the presence of mannitol on the echogenicity of echogenic liposomes. J. Acoust. Soc. Am. 2017, 142, 3670–3676. [Google Scholar] [CrossRef] [PubMed]
- Ohtake, S.; Kita, Y.; Arakawa, T. Interactions of formulation excipients with proteins in solution and in the dried state. Adv. Drug Deliv. Rev. 2011, 63, 1053–1073. [Google Scholar] [CrossRef] [PubMed]
- Franze, S.; Selmin, F.; Samaritani, E.; Minghetti, P.; Cilurzo, F. Lyophilization of Liposomal Formulations: Still Necessary, Still Challenging. Pharmaceutics 2018, 10, 139. [Google Scholar] [CrossRef] [Green Version]
- Faustini, M.; Bucco, M.; Chlapanidas, T.; Lucconi, G.; Marazzi, M.; Tosca, M.C.; Gaetani, P.; Klinger, M.; Villani, S.; Ferretti, V.V.; et al. Nonexpanded Mesenchymal Stem Cells for Regenerative Medicine: Yield in Stromal Vascular Fraction from Adipose Tissues. Tissue Eng. Part C Methods 2010, 16, 1515–1521. [Google Scholar] [CrossRef] [PubMed]
- Gaetani, P.; Torre, M.L.; Klinger, M.; Faustini, M.; Crovato, F.; Bucco, M.; Marazzi, M.; Chlapanidas, T.; Levi, D.; Tancioni, F.; et al. Adipose-derived stem cell therapy for intervertebral disc regeneration: An in vitro reconstructed tissue in alginate capsules. Tissue Eng. Part A 2008, 14, 1415–1423. [Google Scholar] [CrossRef] [PubMed]
- Dominici, M.; Le Blanc, K.; Mueller, I.; Slaper-Cortenbach, I.; Marini, F.C.; Krause, D.S.; Deans, R.J.; Keating, A.; Prockop, D.J.; Horwitz, E.M. Minimal criteria for defining multipotent mesenchymal stromal cells. The International Society for Cellular Therapy position statement. Cytotherapy 2006, 8, 315–317. [Google Scholar] [CrossRef] [PubMed]
- Patel, S.M.; Nail, S.L.; Pikal, M.J.; Geidobler, R.; Winter, G.; Hawe, A.; Davagnino, J.; Gupta, S.R. Lyophilized Drug Product Cake Appearance: What Is Acceptable? J. Pharm. Sci. 2017, 106, 1706–1721. [Google Scholar] [CrossRef] [PubMed]
- Available online: http://gruppochemiometria.it/index.php/software (accessed on 17 May 2021).
- Johnson, K.A.; Goody, R.S. The Original Michaelis Constant: Translation of the 1913 Michaelis-Menten Paper. Biochemistry 2011, 50, 8264–8269. [Google Scholar] [CrossRef] [PubMed] [Green Version]
- Coccè, V.; La Monica, S.; Bonelli, M.; Alessandri, G.; Alfieri, R.; Lagrasta, C.A.; Madeddu, D.; Frati, C.; Flammini, L.; Lisini, D.; et al. Inhibition of Human Malignant Pleural Mesothelioma Growth by Mesenchymal Stromal Cells. Cells 2021, 10, 1427. [Google Scholar] [CrossRef] [PubMed]
- Bari, E.; Di Silvestre, D.; Mastracci, L.; Grillo, F.; Grisoli, P.; Marrubini, G.; Nardini, M.; Mastrogiacomo, M.; Sorlini, M.; Rossi, R.; et al. GMP-compliant sponge-like dressing containing MSC lyo-secretome: Proteomic network of healing in a murine wound model. Eur. J. Pharm. Biopharm. Off. J. Arb. Fur Pharm. Verfahr. E.V 2020, 155, 37–48. [Google Scholar] [CrossRef] [PubMed]


| Formulation | V1 | V2 | V1 = Mannitol % | % w/v |
|---|---|---|---|---|
| 1 | −1.0 | −1.0 | 25 | 0.5 |
| 2 | −0.5 | −1.0 | 45 | 0.5 |
| 3 | 0.0 | −1.0 | 65 | 0.5 |
| 4 | 0.6 | −1.0 | 85 | 0.5 |
| 5 | 1.0 | −1.0 | 100 | 0.5 |
| 6 | −1.0 | +1.0 | 25 | 1.5 |
| 7 | −0.5 | +1.0 | 45 | 1.5 |
| 8 | 0.0 | +1.0 | 65 | 1.5 |
| 9 | 0.6 | +1.0 | 85 | 1.5 |
| 10 | 1.0 | +1.0 | 100 | 1.5 |
| Phase | Section | Time (h:min) | Shelf’s Temperature (°C) | Pressure (mbar) |
|---|---|---|---|---|
| Loading | 1 | - | 25 | 1000 |
| Freezing | 2-ramp | 0:20 | 5 | |
| 3-hold | 0:40 | 5 | ||
| 4-ramp | 0:10 | −5 | ||
| 5-hold | 1:00 | −5 | ||
| 6-ramp | 0:45 | −45 | ||
| 7-hold | 4:30 | −45 | ||
| Primary drying | 8 | 0:20 | −45 | 0.08 |
| 9 | 0:30 | −40 | ||
| 10 | 79:09 | −40 | ||
| Secondary drying | 11 | 2:30 | 22 | |
| 12 | 8:00 | 22 |
| Factors | Levels | Encoding |
|---|---|---|
| Secretome batch (S) | 1 | S1 = 1, S2 = 0 |
| 2 | S1 = 0, S2 = 1 | |
| 3 | S1 = S2 = 0 | |
| Lyophilization (L) | Pre | 1 |
| Post | +1 | |
| Total concentration of excipients (% w/v) | 0.5 | −1 |
| 1.5 | +1 | |
| Mannitol/sucrose concentration ratio (% w/w) | 25/75 | −1 |
| 100/0 | +1 |
Publisher’s Note: MDPI stays neutral with regard to jurisdictional claims in published maps and institutional affiliations. |
© 2021 by the authors. Licensee MDPI, Basel, Switzerland. This article is an open access article distributed under the terms and conditions of the Creative Commons Attribution (CC BY) license (https://creativecommons.org/licenses/by/4.0/).
Share and Cite
Mocchi, M.; Bari, E.; Marrubini, G.; Bonda, A.F.; Perteghella, S.; Tartara, F.; Cofano, F.; Perna, G.d.; Giovannelli, L.; Mandracchia, D.; et al. Freeze-Dried Mesenchymal Stem Cell-Secretome Pharmaceuticalization: Optimization of Formulation and Manufacturing Process Robustness. Pharmaceutics 2021, 13, 1129. https://doi.org/10.3390/pharmaceutics13081129
Mocchi M, Bari E, Marrubini G, Bonda AF, Perteghella S, Tartara F, Cofano F, Perna Gd, Giovannelli L, Mandracchia D, et al. Freeze-Dried Mesenchymal Stem Cell-Secretome Pharmaceuticalization: Optimization of Formulation and Manufacturing Process Robustness. Pharmaceutics. 2021; 13(8):1129. https://doi.org/10.3390/pharmaceutics13081129
Chicago/Turabian StyleMocchi, Michela, Elia Bari, Giorgio Marrubini, Andrea Foglio Bonda, Sara Perteghella, Fulvio Tartara, Fabio Cofano, Giuseppe di Perna, Lorella Giovannelli, Delia Mandracchia, and et al. 2021. "Freeze-Dried Mesenchymal Stem Cell-Secretome Pharmaceuticalization: Optimization of Formulation and Manufacturing Process Robustness" Pharmaceutics 13, no. 8: 1129. https://doi.org/10.3390/pharmaceutics13081129