
Can Pharmacological Conditioning as an Add-On Treatment Optimize Standard Pharmacological Treatment in Patients with Recent-Onset Rheumatoid Arthritis? A Proof-of-Principle Randomized Clinical Trial
 , ,
, ,
Abstract
:
1. Introduction
2. Results
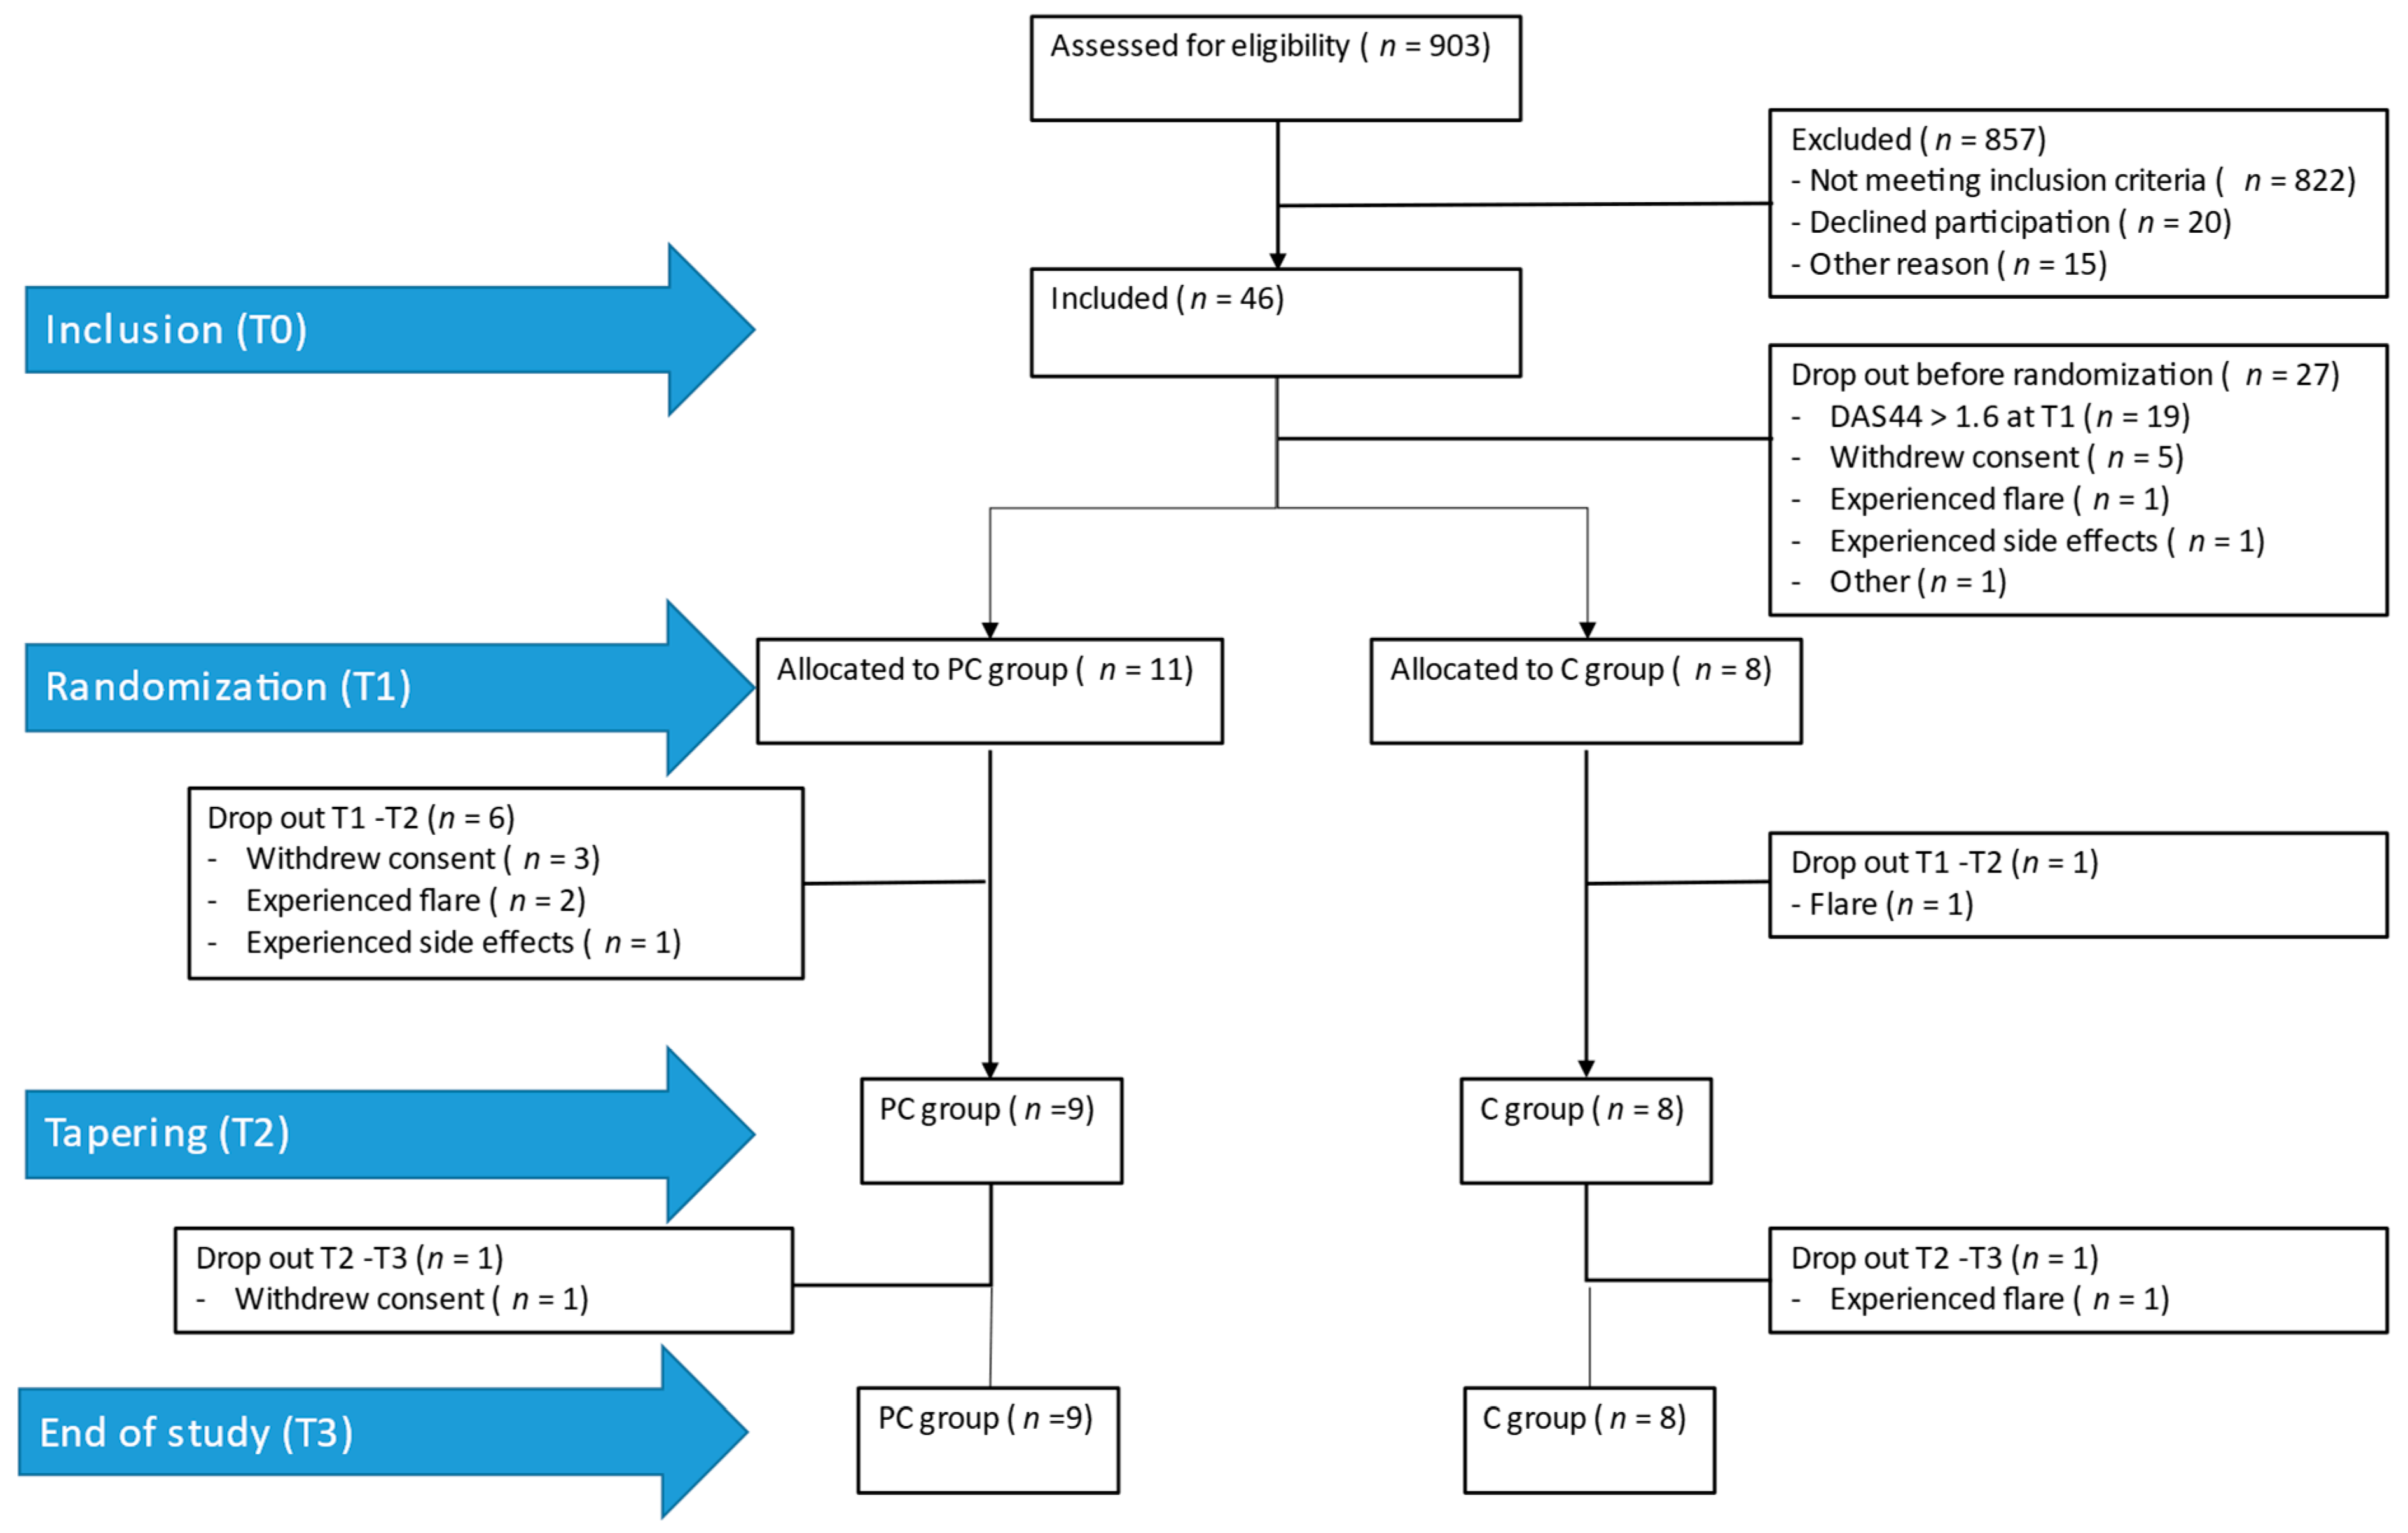
2.1. Participants
2.2. Primary Analysis: Percentage of Drug-Free Clinical Remission at T3
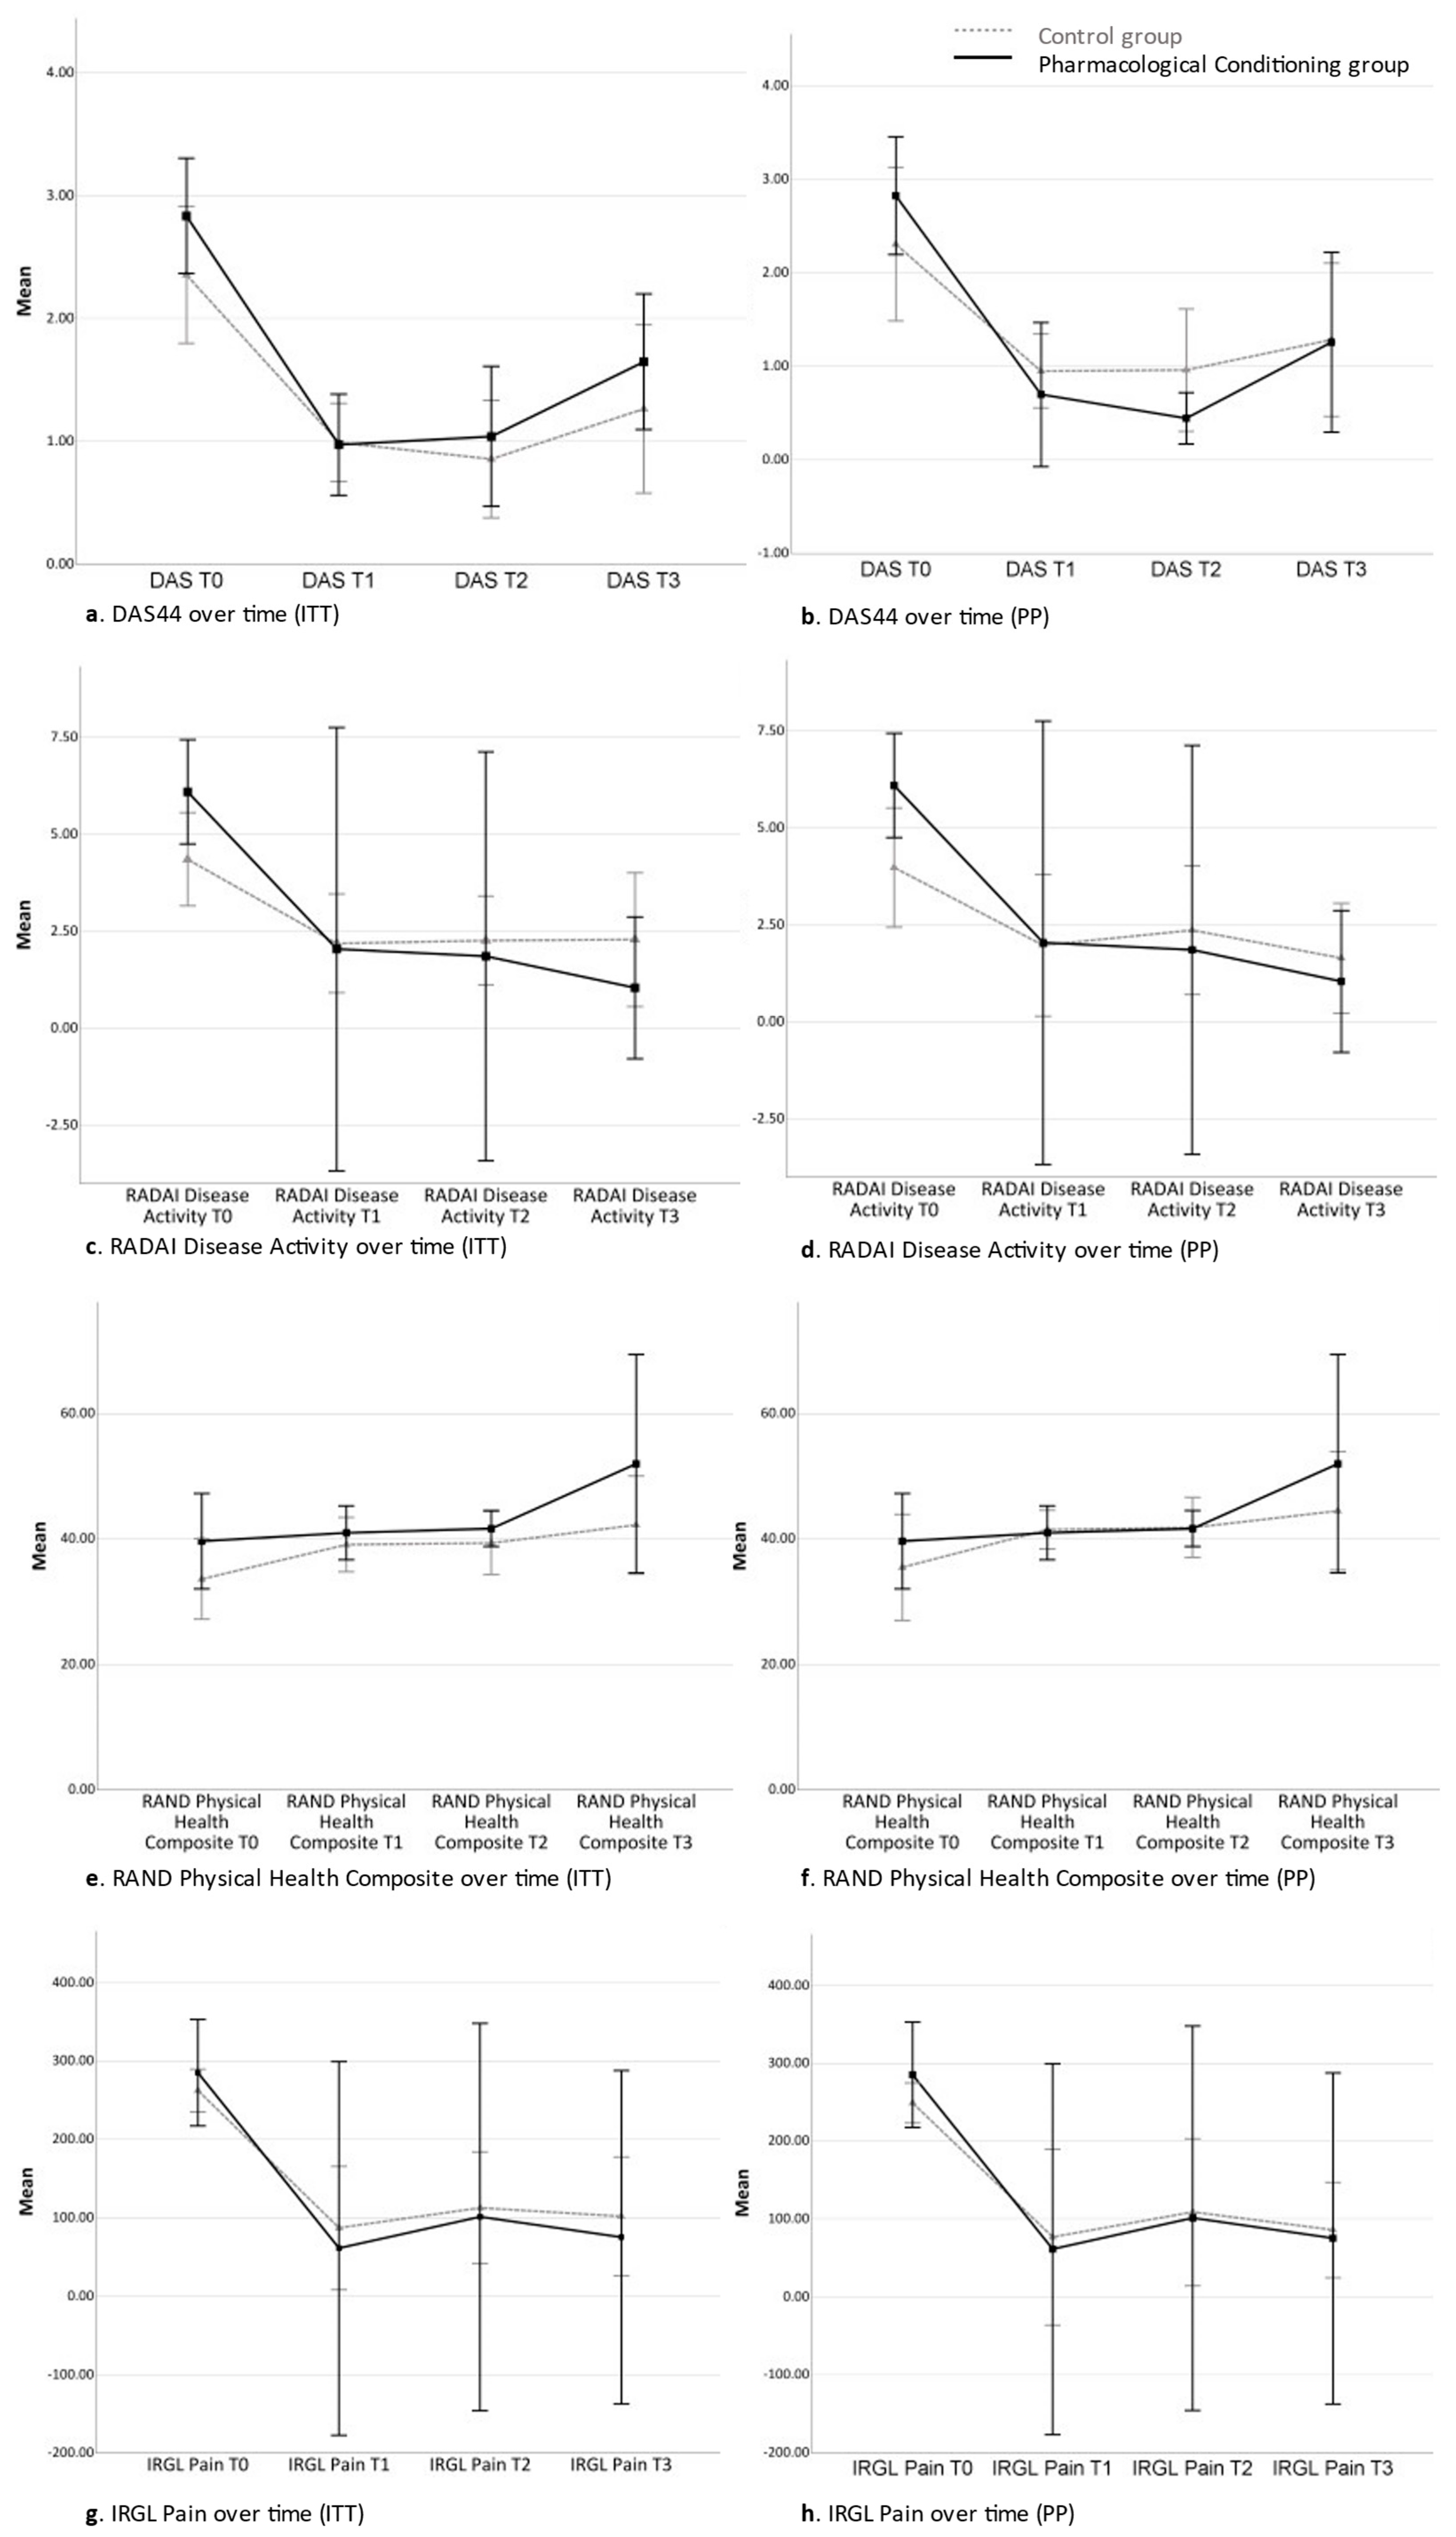
2.3. Secondary Analyses
2.3.1. Time Contrast between Time Point 0 and Time Point 3 (Total Study Period)
2.3.2. Time Contrast between Time Point 0 and Time Point 1 (Acquisition Phase)
2.3.3. Time Contrast between Time Point 1 and Time Point 2 (Conditioning Phase)
2.3.4. Time Contrast between Time Point 2 and Time Point 3 (Tapering Phase)
3. Discussion
3.1. Limitations
3.2. Future Perspectives
4. Materials and Methods
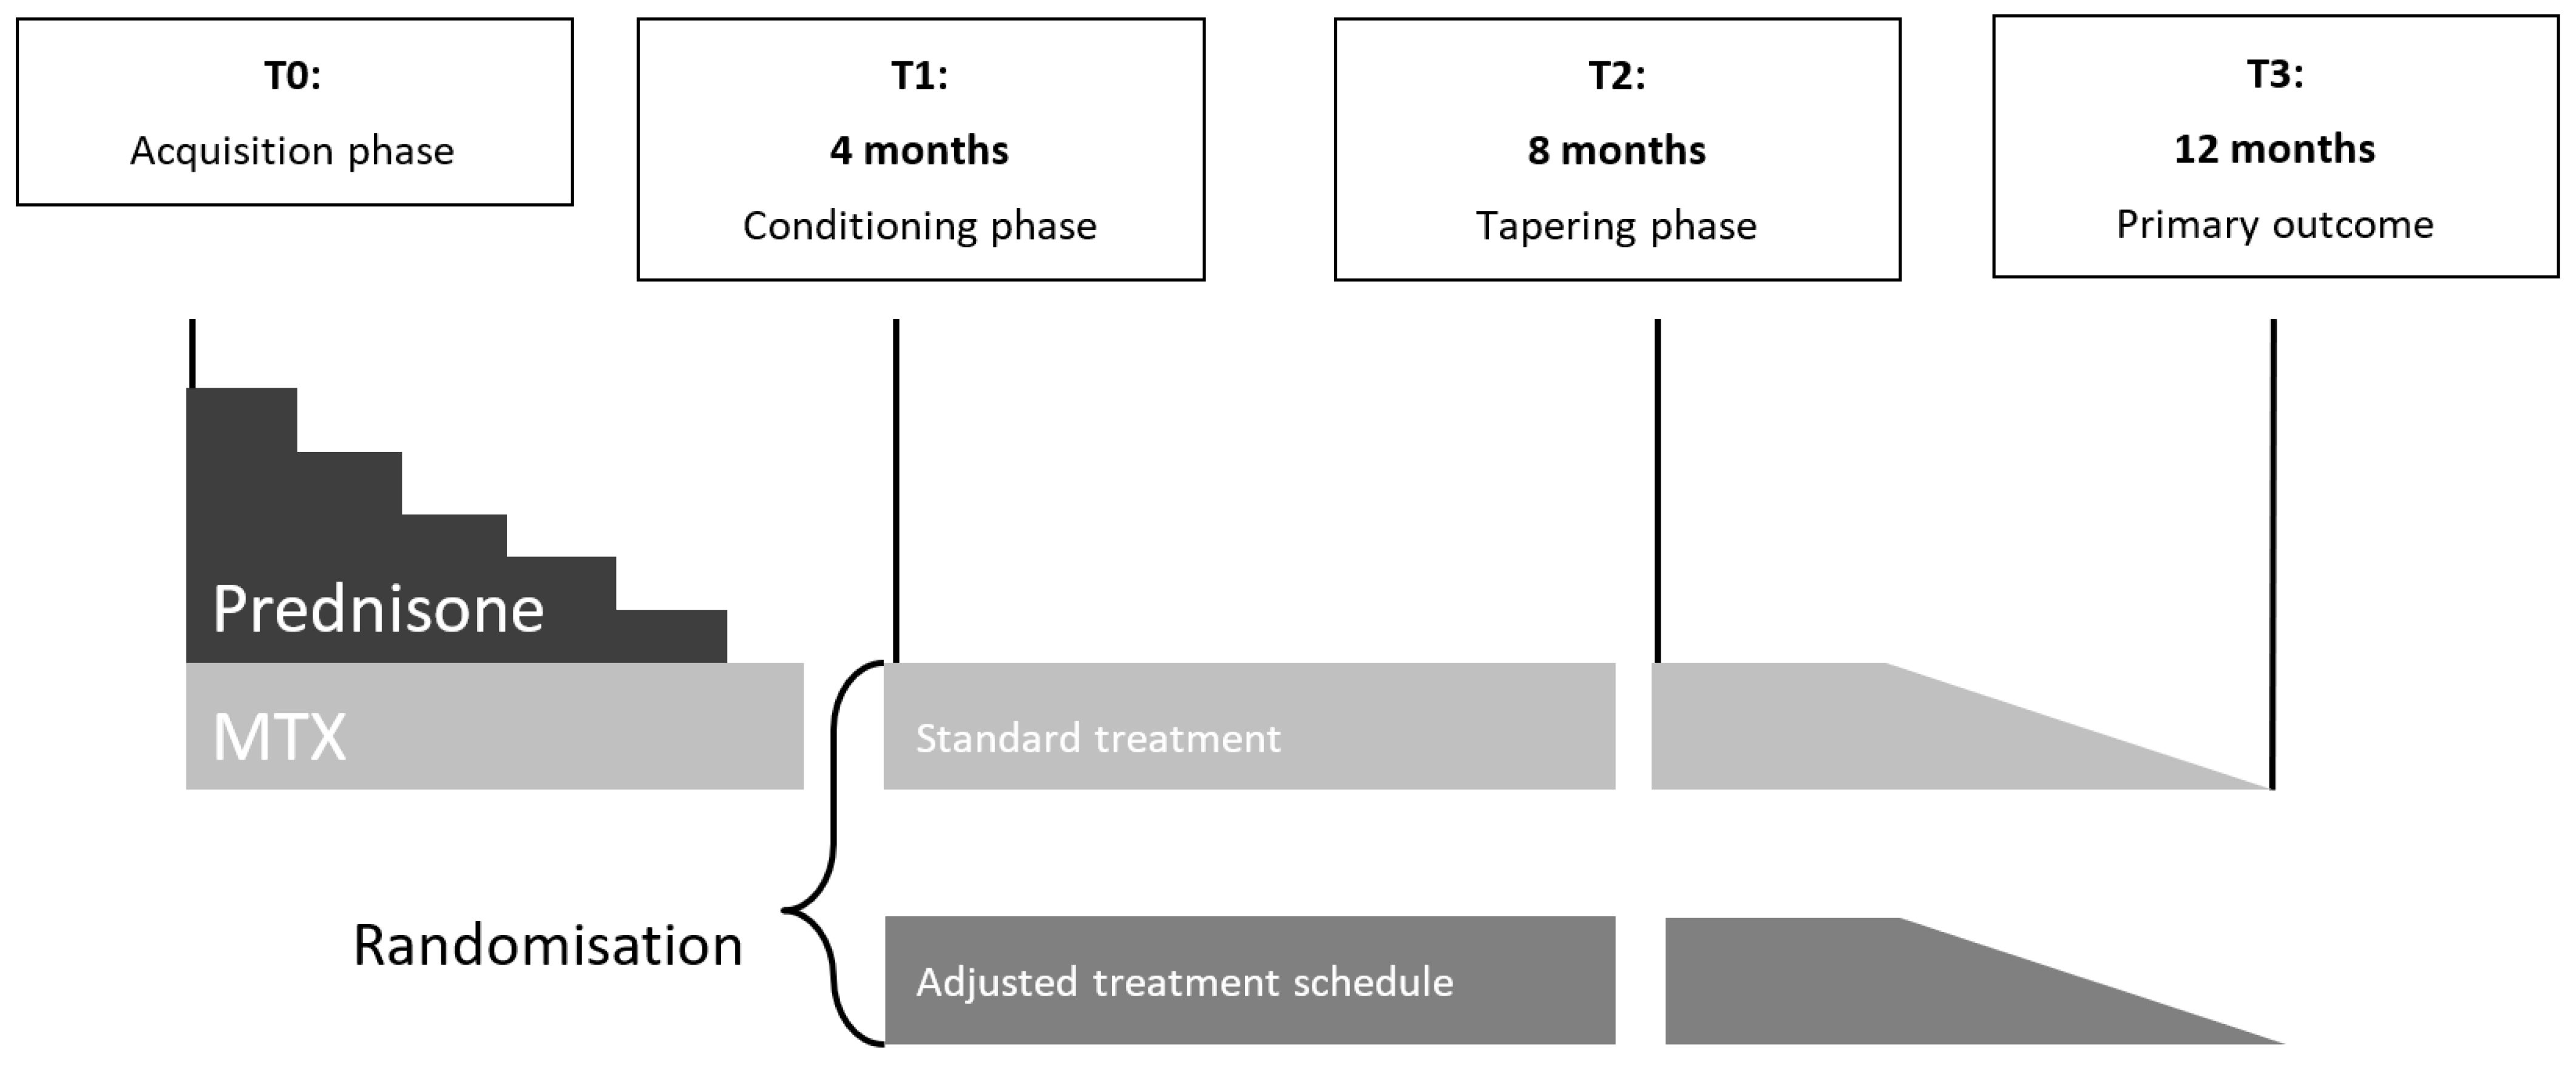
4.1. Study Design
4.2. Study Population
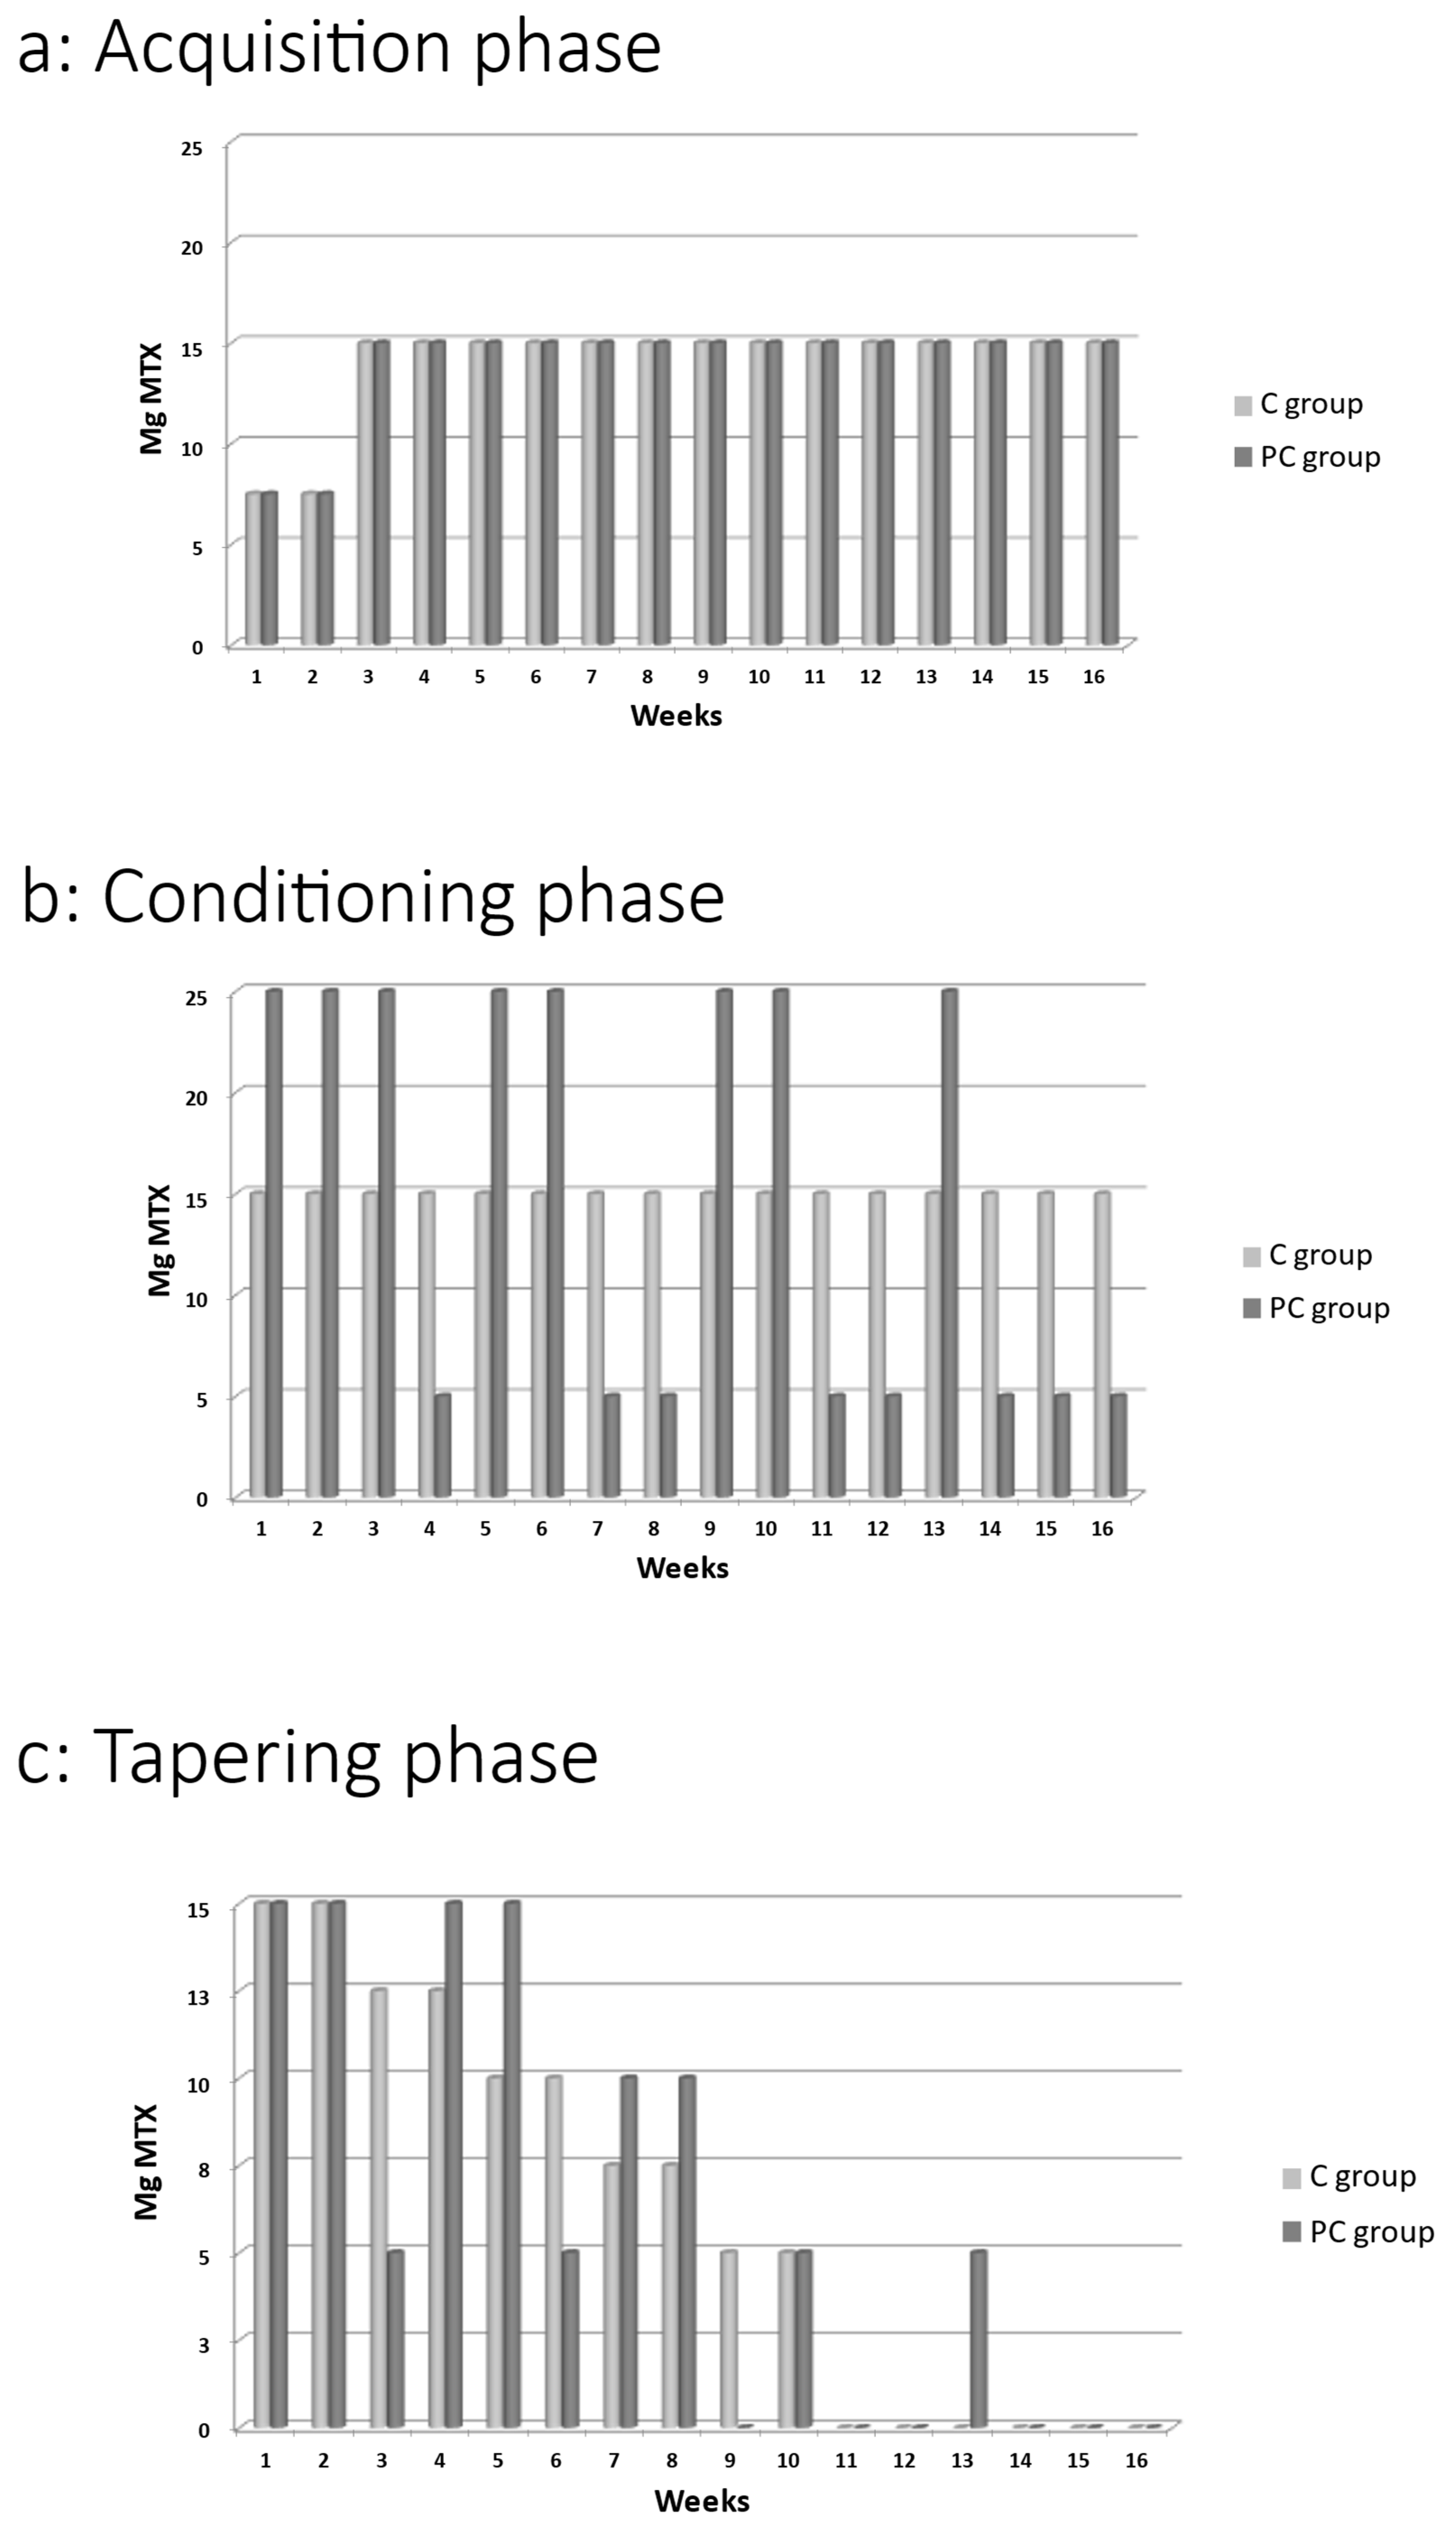
4.3. Procedures
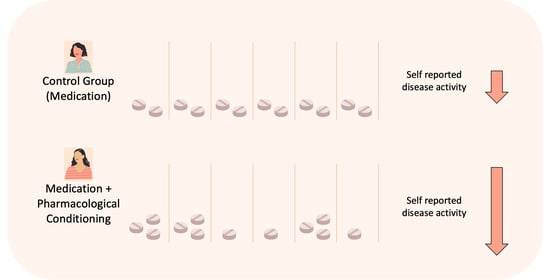
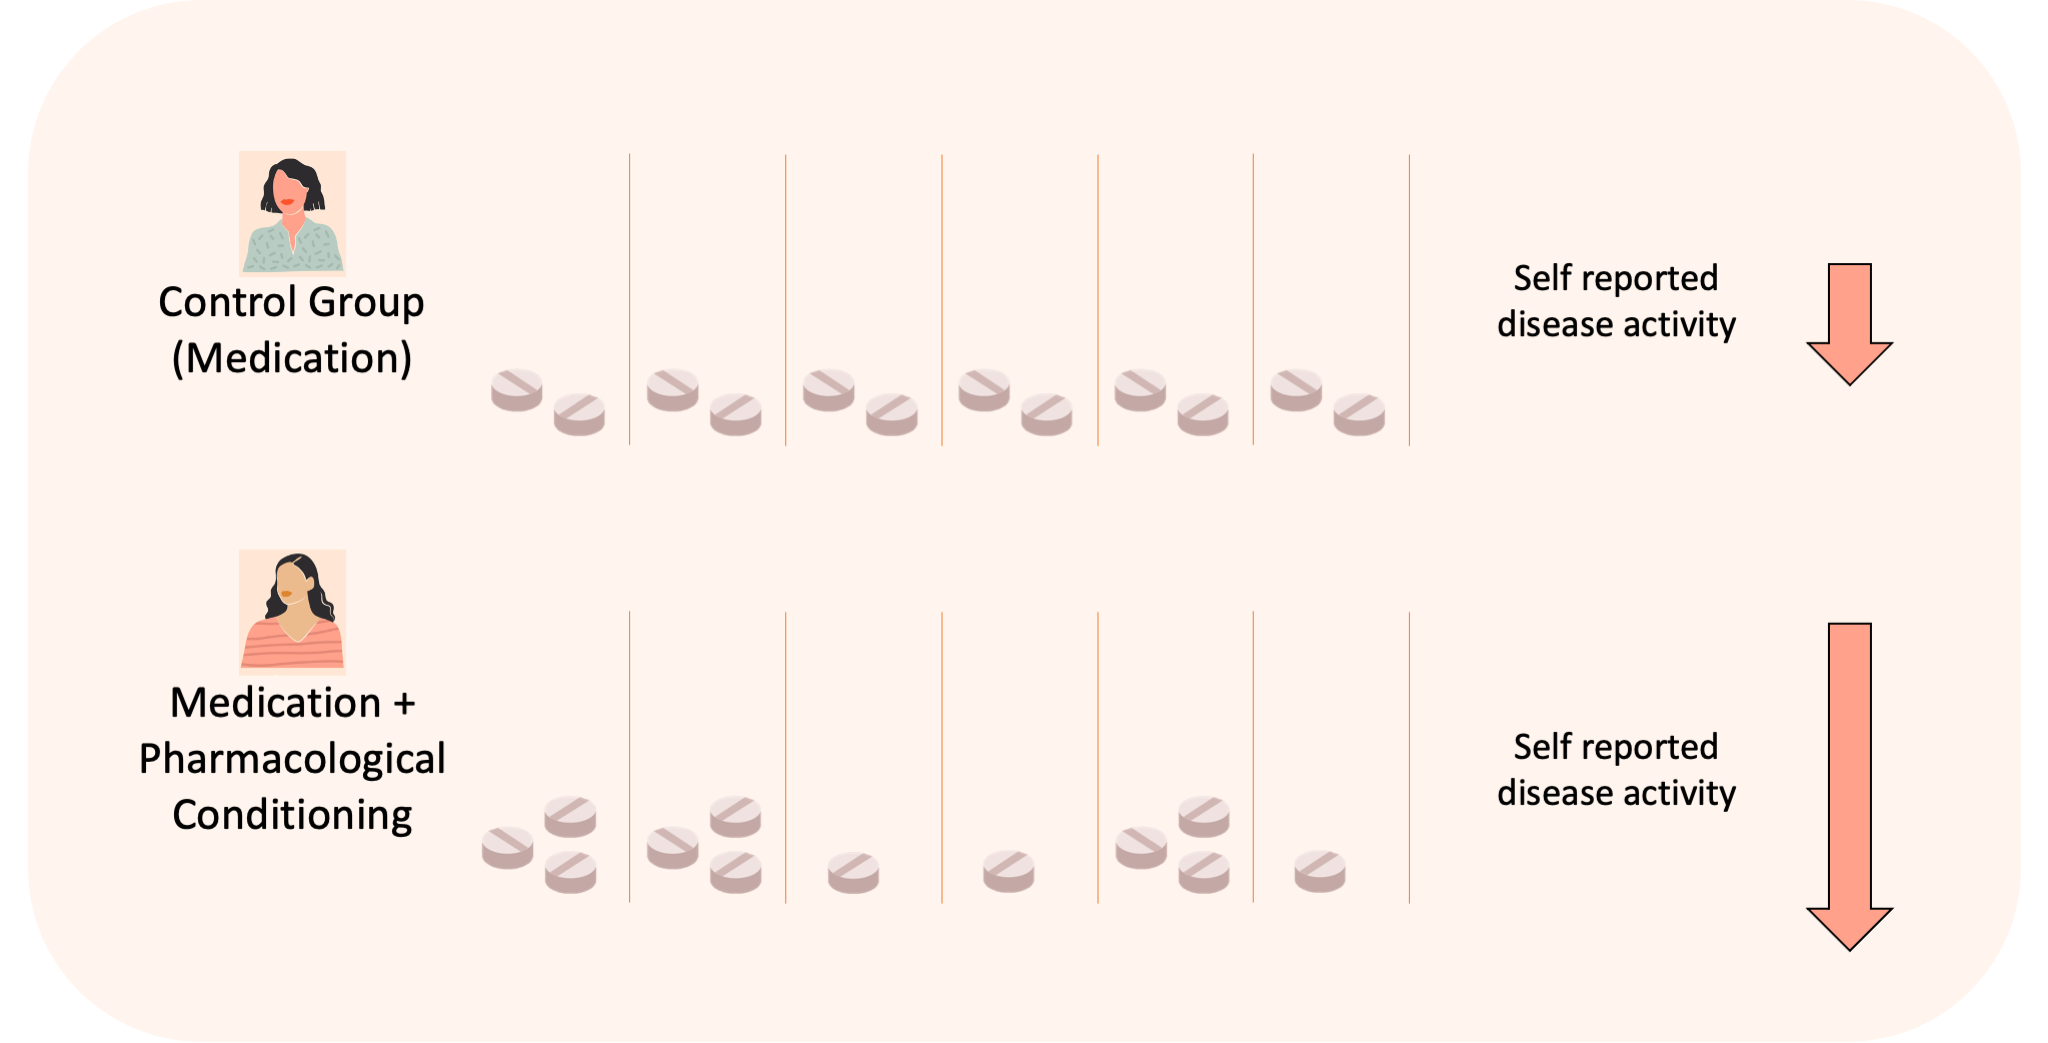
4.4. Intervention
4.5. Assessments
4.6. Primary Outcome
4.7. Secondary Outcomes
4.7.1. Disease Activity
4.7.2. Self-Reported Disease Activity
4.7.3. Physical Health-Related Quality of Life
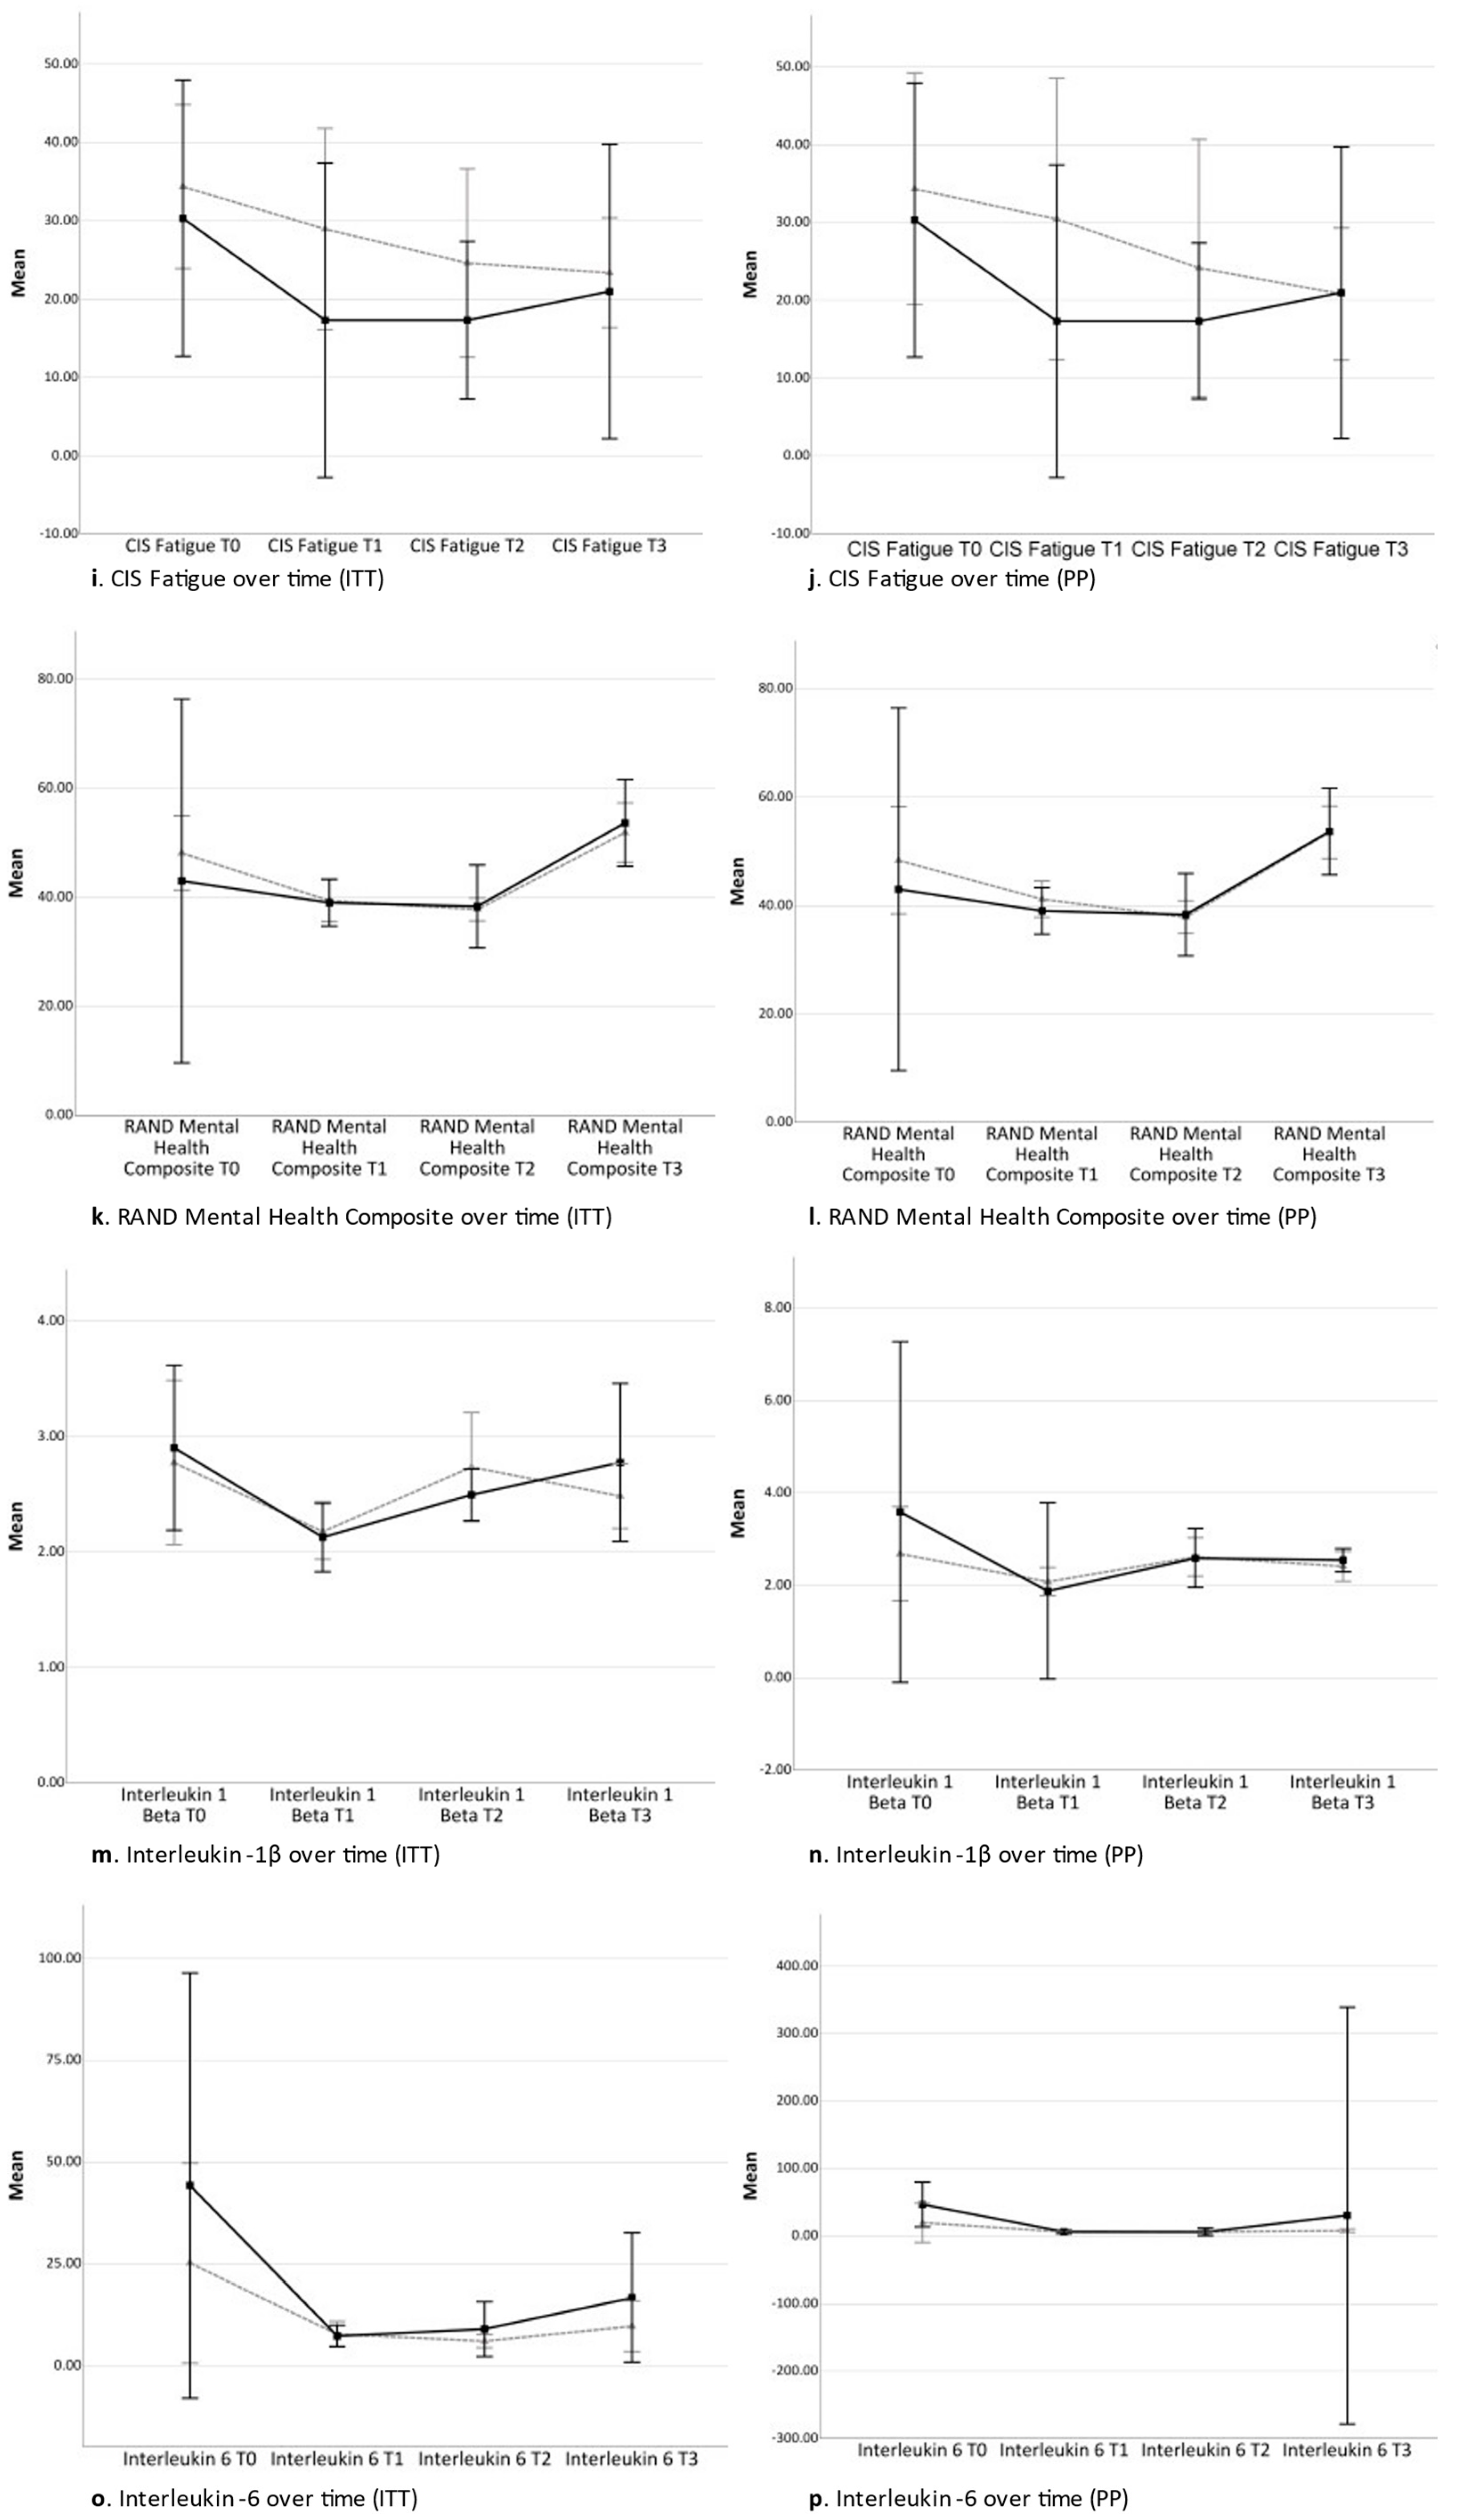
4.7.4. Mental Health-Related Quality of Life
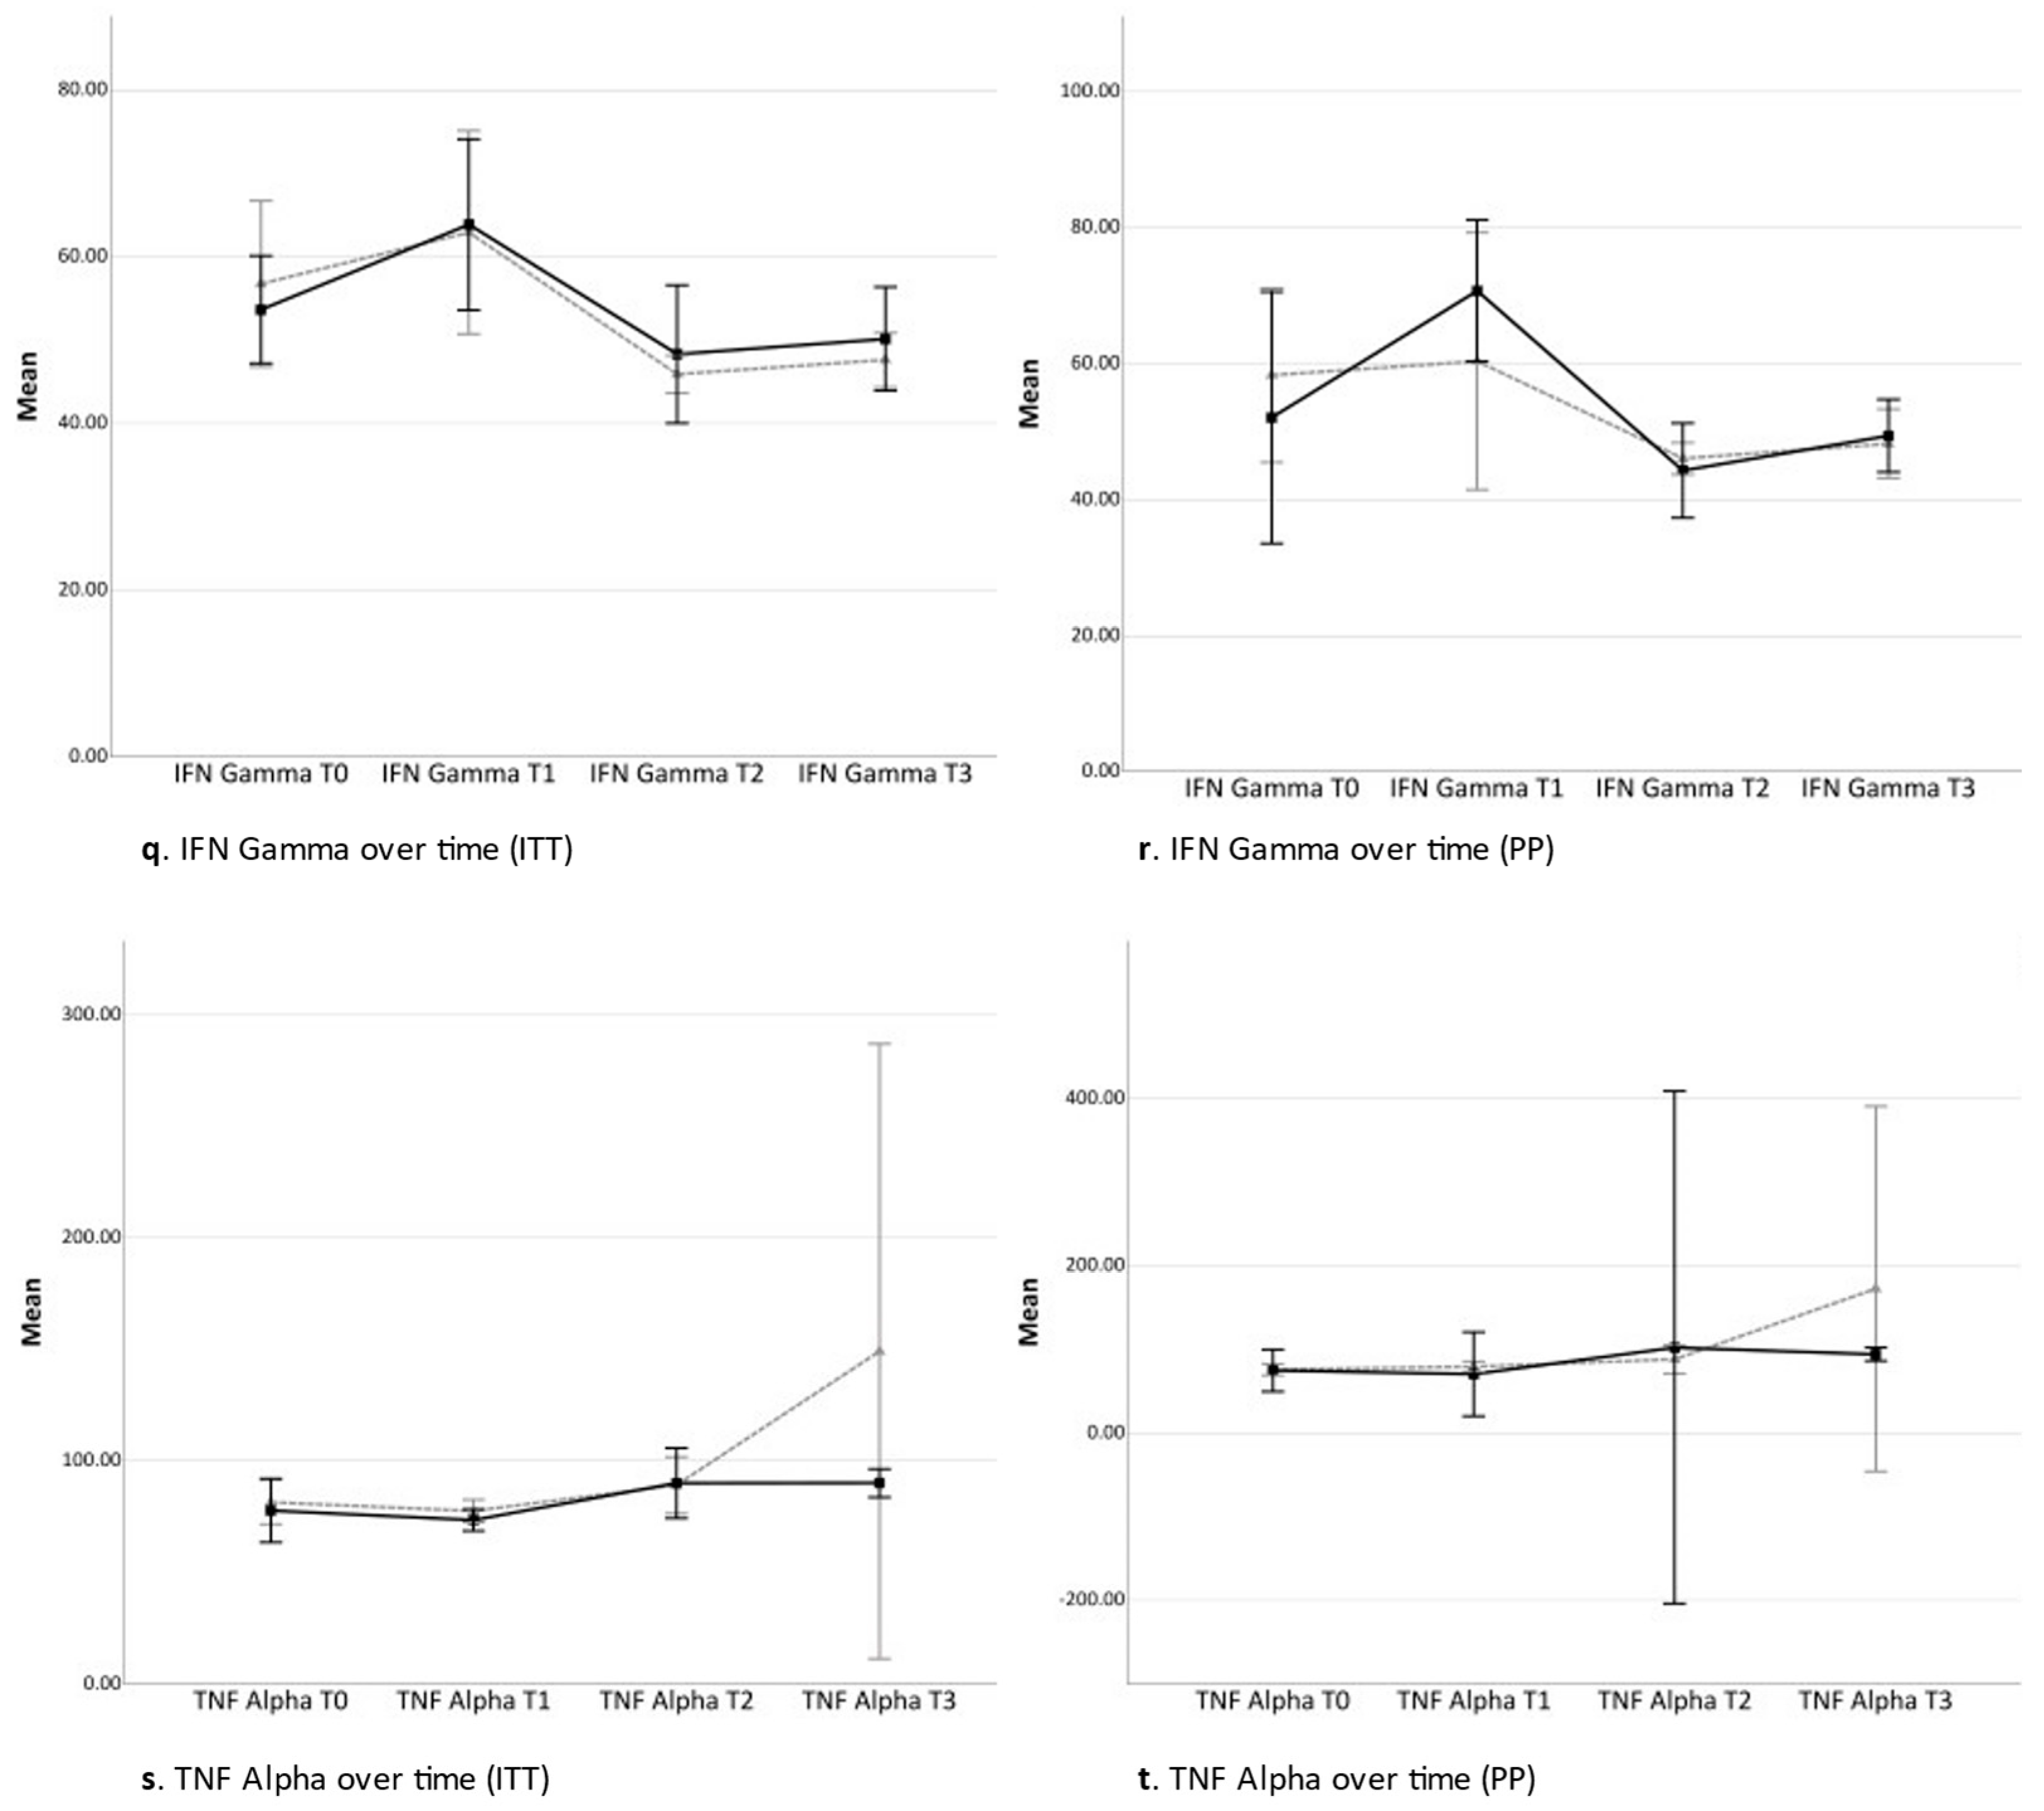
4.7.5. Cytokines
4.8. Statistical Analyses
5. Conclusions
Author Contributions
Funding
Institutional Review Board Statement
Informed Consent Statement
Data Availability Statement
Conflicts of Interest
References
- Aletaha, D.; Neogi, T.; Silman, A.J.; Funovits, J.; Felson, D.T.; Bingham, C.O., 3rd; Birnbaum, N.S.; Burmester, G.R.; Bykerk, V.P.; Cohen, M.D.; et al. 2010 rheumatoid arthritis classification criteria: An American College of Rheumatology/European League Against Rheumatism collaborative initiative. Ann. Rheum. Dis. 2010, 62, 2569–2581. [Google Scholar] [CrossRef]
- Heimans, L.; Boer, K.V.C.W.-D.; Visser, K.; Goekoop, R.J.; van Oosterhout, M.; Harbers, J.B.; Bijkerk, C.; Speyer, I.; de Buck, M.P.D.M.; de Sonnaville, P.B.J.; et al. A two-step treatment strategy trial in patients with early arthritis aimed at achieving remission: The IMPROVED study. Ann. Rheum. Dis. 2014, 73, 1356–1361. [Google Scholar] [CrossRef] [PubMed]
- Welsing, P.M.J.; Landewé, R.B.M.; Van Riel, P.L.C.M.; Boers, M.; Van Gestel, A.M.; Van Der Linden, S.; Swinkels, H.L.; Van Der Heijde, D.M.F.M. The relationship between disease activity and radiologic progression in patients with rheumatoid arthritis: A longitudinal analysis. Arthritis Rheum. 2004, 50, 2082–2093. [Google Scholar] [CrossRef] [PubMed]
- Wolfe, F.; Michaud, K. Resistance of rheumatoid arthritis patients to changing therapy: Discordance between disease activity and patients’ treatment choices. Arthritis Rheum. 2007, 56, 2135–2142. [Google Scholar] [CrossRef] [PubMed]
- Boers, M.; Verhoeven, A.C.; Markusse, H.M.; van de Laar, M.A.; Westhovens, R.; van Denderen, J.C.; van Zeben, D.; Dijkmans, B.A.; Peeters, A.J.; Jacobs, P.; et al. Randomised comparison of combined step-down prednisolone, methotrexate and sulphasalazine with sulphasalazine alone in early rheumatoid arthritis. Lancet 1997, 350, 309–318. [Google Scholar] [CrossRef]
- Goekoop-Ruiterman, Y.P.M.; De Vries-Bouwstra, J.K.; Allaart, C.F.; Van Zeben, D.; Kerstens, P.J.S.M.; Hazes, J.M.W.; Zwinderman, A.H.; Ronday, H.K.; Han, K.H.; Westedt, M.L.; et al. Clinical and radiographic outcomes of four different treatment strategies in patients with early rheumatoid arthritis (the BeSt study): A randomized, controlled trial. Arthritis Rheum. 2008, 58 (Suppl. S2), S126–S135. [Google Scholar] [CrossRef]
- Scott, D.L.; Wolfe, F.; Huizinga, T.W. Rheumatoid arthritis. Lancet 2010, 376, 1094–1108. [Google Scholar] [CrossRef]
- Kirchhof, J.; Petrakova, L.; Brinkhoff, A.; Benson, S.; Schmidt, J.; Unteroberdörster, M.; Wilde, B.; Kaptchuk, T.J.; Witzke, O.; Schedlowski, M. Learned immunosuppressive placebo responses in renal transplant patients. Proc. Natl. Acad. Sci. USA 2018, 115, 4223–4227. [Google Scholar] [CrossRef]
- van den Hoogen, F.H.; Benraad, B.; Hekster, Y.A.; van Lankveld, W.I.M. Adherence rates and associations with nonadherence in patients with rheumatoid arthritis using disease modifying antirheumatic drugs. J. Rheumatol. 2009, 36, 2164–2170. [Google Scholar] [CrossRef]
- van der Kooij, S.M.; de Vries-Bouwstra, J.K.; Goekoop-Ruiterman, Y.P.M.; Ewals, J.A.P.M.; Han, K.H.; Hazes, J.M.W.; Kerstens, P.J.S.M.; Peeters, A.J.; van Zeben, D.; Breedveld, F.C.; et al. Patient-reported outcomes in a randomized trial comparing four different treatment strategies in recent-onset rheumatoid arthritis. Arthritis Care Res. 2009, 61, 4–12. [Google Scholar] [CrossRef]
- Ader, R. Conditioned responses in pharmacotherapy research. Psychol. Med. 1993, 23, 297–299. [Google Scholar] [CrossRef]
- Doering, B.K.; Rief, W. Utilizing placebo mechanisms for dose reduction in pharmacotherapy. Trends Pharmacol. Sci. 2012, 33, 165–172. [Google Scholar] [CrossRef]
- Flaten, M.A. Drug effects: Agonistic and antagonistic processes. Scand. J. Psychol. 2009, 50, 652–659. [Google Scholar] [CrossRef] [PubMed]
- Kirsch, I. Response expectancy as a determinant of experience and behavior. Am. Psychol. 1985, 40, 1189. [Google Scholar] [CrossRef]
- Pacheco-López, G.; Engler, H.; Niemi, M.-B.; Schedlowski, M. Expectations and associations that heal: Immunomodulatory placebo effects and its neurobiology. Brain Behav. Immun. 2006, 20, 430–446. [Google Scholar] [CrossRef]
- Siegel, S. Pavlovian conditioning and drug overdose: When tolerance fails. Addict. Res. Theory 2001, 9, 503–513. [Google Scholar] [CrossRef]
- Manaï, M.; van Middendorp, H.; Veldhuijzen, D.S.; van der Pol, J.A.; Huizinga, T.W.J.; Evers, A.W.M. Pharmacological conditioning in the treatment of recent-onset rheumatoid arthritis: A randomized controlled trial study protocol. Trials 2020, 21, 15. [Google Scholar] [CrossRef] [PubMed]
- Ader, R.; Mercurio, M.G.; Walton, J.B.; James, D.; Davis, M.; Ojha, V.; Kimball, A.B.; Fiorentino, D. Conditioned pharmacotherapeutic effects: A preliminary study. Psychosom. Med. 2010, 72, 192–197. [Google Scholar] [CrossRef]
- Benedetti, F.; Amanzio, M.; Baldi, S.; Casadio, C.; Maggi, G. Inducing placebo respiratory depressant responses in humans via opioid receptors. Eur. J. Neurosci. 1999, 11, 625–631. [Google Scholar] [CrossRef]
- Colloca, L.; Miller, F.G. How placebo responses are formed: A learning perspective. Philos. Trans. R. Soc. Lond. B Biol. Sci. 2011, 366, 1859–1869. [Google Scholar] [CrossRef]
- Schedlowski, M.; Enck, P.; Rief, W.; Bingel, U. Neuro-bio-behavioral mechanisms of placebo and nocebo responses: Implications for clinical trials and clinical practice. Pharmacol. Rev. 2015, 67, 697–730. [Google Scholar] [CrossRef]
- Giang, D.W.; Goodman, A.D.; Schiffer, R.B.; Mattson, D.H.; Petrie, M.; Cohen, N.; Ader, R. Conditioning of cyclophosphamide-induced leukopenia in humans. J. Neuropsychiatry Clin. Neurosci. 1996, 8, 194–201. [Google Scholar] [CrossRef] [PubMed]
- Kaptchuk, T.J.; Friedlander, E.; Kelley, J.M.; Sanchez, M.N.; Kokkotou, E.; Singer, J.P.; Kowalczykowski, M.; Miller, F.G.; Kirsch, I.; Lembo, A.J. Placebos without Deception: A Randomized Controlled Trial in Irritable Bowel Syndrome. PLoS ONE 2010, 5, e15591. [Google Scholar] [CrossRef]
- Lidstone, S.C.; Schulzer, M.; Dinelle, K.; Mak, E.; Sossi, V.; Ruth, T.J.; de la Fuente-Fernández, R.; Phillips, A.G.; Stoessl, A.J. Effects of expectation on placebo-induced dopamine release in Parkinson disease. Arch. Gen. Psychiatry 2010, 67, 857–865. [Google Scholar] [CrossRef]
- Sandler, A.; Glesne, C.; Geller, G. Children’s and parents’ perspectives on open-label use of placebos in the treatment of ADHD. Child. Care Health Dev. 2008, 34, 111–120. [Google Scholar] [CrossRef] [PubMed]
- Sandler, A.D.; Glesne, C.E.; Bodfish, J.W. Conditioned placebo dose reduction: A new treatment in attention-deficit hyperactivity disorder? J. Dev. Behav. Pediatr. 2010, 31, 369–375. [Google Scholar] [CrossRef] [PubMed]
- Yeung, S.T.A.; Colagiuri, B.; Lovibond, P.F.; Colloca, L. Partial reinforcement, extinction, and placebo analgesia. Pain 2014, 155, 1110–1117. [Google Scholar] [CrossRef] [PubMed]
- Ferster, C.B.; Skinner, B.F. Schedules of Reinforcement; B. F. Skinner Foundation: Cambridge, MA, USA, 1957. [Google Scholar]
- Skinner, B.F. Contingencies of Reinforcement: A Theoretical Analysis; B. F. Skinner Foundation: Cambridge, MA, USA, 2014; Volume 3. [Google Scholar]
- Hall, K.T.; Tolkin, B.R.; Chinn, G.M.; Kirsch, I.; Kelley, J.M.; Lembo, A.J.; Kaptchuk, T.J.; Kokkotou, E.; Davis, R.B.; Conboy, L.A. Conscientiousness is modified by genetic variation in catechol-O-methyltransferase to reduce symptom complaints in IBS patients. Brain Behav. 2015, 5, e00294. [Google Scholar] [CrossRef]
- Lachman, H.M.; Papolos, D.F.; Saito, T.; Yu, Y.-M.; Szumlanski, C.L.; Weinshilboum, R.M. Human catechol-O-methyltransferase pharmacogenetics: Description of a functional polymorphism and its potential application to neuropsychiatric disorders. Pharmacogenetics 1996, 6, 243–250. [Google Scholar] [CrossRef]
- Wendt, L.; Albring, A.; Benson, S.; Engler, H.; Engler, A.; Hinney, A.; Rief, W.; Witzke, O.; Schedlowski, M. Catechol-O-methyltransferase Val158met polymorphism is associated with somatosensory amplification and nocebo responses. PLoS ONE 2014, 9, e107665. [Google Scholar] [CrossRef]
- Corsi, N.; Colloca, L. Placebo and nocebo effects: The advantage of measuring expectations and psychological factors. Front. Psychol. 2017, 8, 308. [Google Scholar] [CrossRef] [PubMed]
- Geers, A.L.; Kosbab, K.; Helfer, S.G.; Weiland, P.E.; Wellman, J.A. Further evidence for individual differences in placebo responding: An interactionist perspective. J. Psychosom. Res. 2007, 62, 563–570. [Google Scholar] [CrossRef] [PubMed]
- Bier, V.M.; Connell, B.L. Ambiguity seeking in multi-attribute decisions: Effects of optimism and message framing. J. Behav. Decis. Mak. 1994, 7, 169–182. [Google Scholar] [CrossRef]
- Hughes, C.D.; on behalf of TITRATE Programme Investigators; Scott, D.L.; Ibrahim, F. Intensive therapy and remissions in rheumatoid arthritis: A systematic review. BMC Musculoskelet. Disord. 2018, 19, 389. [Google Scholar] [CrossRef]
- Gullick, N.J.; On behalf of TITRATE Programme Investigators; Ibrahim, F.; Scott, I.C.; Vincent, A.; Cope, A.P.; Garrood, T.; Panayi, G.S.; Scott, D.L.; Kirkham, B.W. Real world long-term impact of intensive treatment on disease activity, disability and health-related quality of life in rheumatoid arthritis. BMC Rheumatol. 2019, 3, 6. [Google Scholar] [CrossRef]
- Espiritu, M.J.; Collier, A.C.; Bingham, J.-P. A 21st-century approach to age-old problems: The ascension of biologics in clinical therapeutics. Drug Discov. Today 2014, 19, 1109–1113. [Google Scholar] [CrossRef] [PubMed]
- Lagassé, H.D.; Alexaki, A.; Simhadri, V.L.; Katagiri, N.H.; Jankowski, W.; Sauna, Z.E.; Kimchi-Sarfaty, C. Recent advances in (therapeutic protein) drug development. F1000Research 2017, 6, 113. [Google Scholar] [CrossRef]
- Kavanaugh, A.; Keystone, E.; Greenberg, J.D.; Reed, G.W.; Griffith, J.M.; Friedman, A.W.; Saunders, K.C.; Ganguli, A. Benefit of biologics initiation in moderate versus severe rheumatoid arthritis: Evidence from a United States registry. Rheumatology 2017, 56, 1095–1101. [Google Scholar] [CrossRef]
- Cipriani, P.; Ruscitti, P.; Carubbi, F.; Liakouli, V.; Giacomelli, R. Methotrexate: An old new drug in autoimmune disease. Expert Rev. Clin. Immunol. 2014, 10, 1519–1530. [Google Scholar] [CrossRef]
- Benedetti, F. Mechanisms of placebo and placebo-related effects across diseases and treatments. Annu. Rev. Pharmacol. Toxicol. 2008, 48, 33–60. [Google Scholar] [CrossRef]
- Price, D.D.; Chung, S.K.; Robinson, M.E. Conditioning, expectation, and desire for relief in placebo analgesia. Semin Pain Med. 2005, 3, 15–21. [Google Scholar] [CrossRef]
- Price, D.D.; Finniss, D.G.; Benedetti, F. A comprehensive review of the placebo effect: Recent advances and current thought. Annu. Rev. Psychol. 2008, 59, 565–590. [Google Scholar] [CrossRef] [PubMed]
- Stewart-Williams, S.; Podd, J. The placebo effect: Dissolving the expectancy versus conditioning debate. Psychol. Bull. 2004, 130, 324–340. [Google Scholar] [CrossRef] [PubMed]
- Thompson, W.G. Placebos: A review of the placebo response. Am. J. Gastroenterol. 2000, 95, 1637–1643. [Google Scholar] [CrossRef]
- Ritchie, D.M.; Boyle, J.A.; Mcinnes, J.M.; Jasani, M.K.; Dalakos, T.G.; Grieveson, P.; Buchanan, W.W. Clinical studies with an articular index for the assessment of joint tenderness in patients with rheumatoid arthritis. Q. J. Med. 1968, 37, 393–406. [Google Scholar] [CrossRef] [PubMed]
- Salaffi, F.; Ciapetti, A. Clinical disease activity assessments in rheumatoid arthritis. Int. J. Clin. Rheumatol. 2013, 8, 347. [Google Scholar] [CrossRef]
- Fransen, J.; Langenegger, T.; Michel, B.A.; Stucki, G. Feasibility and validity of the RADAI, a self-administered rheumatoid arthritis disease activity index. Rheumatology 2000, 39, 321–327. [Google Scholar] [CrossRef]
- Hays, R.D.; Sherbourne, C.D.; Mazel, R.M. The rand 36-item health survey 1.0. Health Econ. 1993, 2, 217–227. [Google Scholar] [CrossRef]
- Evers, A.W.; Taal, E.; Kraaimaat, F.W.; Jacobs, J.W.; Abdel-Nasser, A.; Rasker, J.J.; Bijlsma, J.W. A comparison of two recently developed health status instruments for patients with arthritis: Dutch-AIMS2 and IRGL. Arthritis Impact Measurement Scales. Impact of Rheumatic diseases on General health and Lifestyle. Rheumatology 1998, 37, 157–164. [Google Scholar] [CrossRef]
- Huiskes, C.; Kraaimaat, F.; Bijlsma, J. Development of a self-report questionnaire to assess the impact of rheumatic diseases on health and lifestyle. J. Rehabil. Sci. 1990, 3, 65–70. [Google Scholar]
- Vercoulen, J.H.M.M.; Swanink, C.M.A.; Fennis, J.F.M.; Galama, J.M.D.; van der Meer, J.W.M.; Bleijenberg, G. Dimensional assessment of chronic fatigue syndrome. J. Psychosom. Res. 1994, 38, 383–392. [Google Scholar] [CrossRef] [PubMed]
- Sullivan, G.M.; Feinn, R. Using effect size—Or why the P value is not enough. J. Grad. Med. Educ. 2012, 4, 279–282. [Google Scholar] [CrossRef] [PubMed]
- Cohen, J. The Effect Size Index: D. Statistical Power Analysis for the Behavioral Sciences; Routledge Academic: Abingdon-on-Thames, UK, 1988. [Google Scholar]
- de Zeeuw, E.L.; Tak, E.C.; Dusseldorp, E.; Hendriksen, I.J. Workplace exercise intervention to prevent depression: A pilot randomized controlled trial. Ment. Health Phys. Act. 2010, 3, 72–77. [Google Scholar] [CrossRef]


| Control Group (ITT: n = 8; PP: n = 6) | Pharmacological Conditioning Group (ITT: n = 11 (10 for TNF-α); PP: n = 4) | Pairwise Comparison | |
|---|---|---|---|
| Sex, n female (%) | |||
| ITT | 3 (37.5) | 6 (54.5) | X2 = 0.54, p = 0.463, φ = 0.24 |
| PP | 3 (50.0) | 1 (25.0) | X2 = 0.63, p = 0.429, φ = 0.40 |
| Mean (SD); Median (IQR) | |||
| Age | |||
| ITT | 57.8 (11.6); 59.1 (16.93) | 61.5 (10.4); 56.7 (19.71) | U = 47.00, p = 0.840, d = 0.34 |
| PP | 55.6 (12.4); 58.9 (21.2) | 67.8 (9.8); 68.7 (18.8) | U = 18.00, p = 0.257, d = 1.09 |
| DAS44 | |||
| ITT | 2.4 (0.7); 2.5 (1.1) | 2.8 (0.6); 2.7 (0.8) | U = 59.50, p = 0.206, d = 0.73 |
| PP | 2.3 (0.8)2.5 (1.5) | 2.8 (0.4); 2.8 (0.8) | U = 17.50, p = 0.257, d = 0.84 |
| RADAI Disease Activity | |||
| ITT | 4.4 (1.4); 4.9 (1.9) | 4.7 (1.9); 5.6 (3.6) | U = 57.00, p = 0.310, d = 0.18 |
| PP | 4.0 (1.5); 4.7 (2.5) | 5.2 (1.9); 5.8 (3.3) | U = 19.00, p = 0.171, d = 0.70 |
| IRGL Pain | |||
| ITT | 262.5 (32.5); 260.0 (60.0) | 268.5 (60.7); 280.0 (95.0) | U = 49.50, p = 0.657, d = 0.12 |
| PP | 249.2 (24.6); 245.0 (46.3) | 267.8 (41.6); 273.0 (79.8) | U = 16.00, p = 0.476, d = 0.54 |
| RAND36 Physical Health Composite | |||
| ITT | 33.6 (7.7); 30.5 (14.3) | 37.0 (7.0); 37.0 (13.0) | U = 60.00, p = 0.206, d = 0.46 |
| PP | 35.5 (8.1); 32.5 (16.0) | 41.5 (4.4); 41.0 (8.5) | U = 18.00, p = 0.257, d = 0.93 |
| RAND36 Mental Health Composite | |||
| ITT | 48.1 (8.2); 49.5 (8.5) | 44.7 (10.1); 46.0 (17.0 | U = 35.50, p = 0.492, d = −0.37 |
| PP | 48.3 (9.4); 49.5 (13.8) | 47.5 (14.2); 50.5 (26.5) | U = 12.50, p = 1.000, d = −0.15 |
| CIS Fatigue Severity | |||
| ITT | 34.4 (12.5); 36.0 (20.5) | 32.9 (10.6); 34.0 (14.0) | U = 41.00, p = 0.840, d = −0.13 |
| PP | 34.3 (14.2); 36.0 (26.5) | 26.3 (10.0); 26.5 (19.3) | U = 7.00, p = 0.352, d = −0.66 |
| IFN-γ | |||
| ITT | 56.8 (10.0); 59.2 (18.4) | 57.8 (10.1); 58.2 (18.3) | U = 46.00, p = 0.904, d = 0.10 |
| PP | 58.1 (9.2); 59.2 (12.3) | 62.3 (12.1); 61.5 (22.6) | U = 14.00, p = 0.762, d = 0.39 |
| TNF-α | |||
| ITT | 80.1 (10.7); 78.1 (18.1) | 78.0 (12.9); 73.6 (10.4) | U = 35.00, p = 0.696, d = −0.18 |
| PP | 75.1 (5.5); 74.0 (9.5) | 78.6 (4.8); 78.7 (9.3) | U = 17.00, p = 0.352, d = 0.70 |
| Interleukin-1β | |||
| ITT | 2.6 (0.8); 2.3 (1.6) | 2.6 (0.8); 2.38 (1.3) | U = 41.00, p = 0.840, d = −0.08 |
| PP | 2.5 (0.8); 2.15 (1.6) | 2.7 (1.1); 2.8 (2.2) | U = 14.00, p = 0.762, d = 0.18 |
| Interleukin-6 | |||
| ITT | 23.9 (24.8); 13.5 (45.0) | 33.5 (47.0); 15.76 (38.01) | U = 45.00, p = 1.000, d = 0.25 |
| PP | 18.9 (21.2); 10.7 (27.5) | 34.5 (19.1); 41.0 (33.3) | U = 18.00, p = 0.257, d = 0.77 |
| Analyses T0–T3 | ||||||||
|---|---|---|---|---|---|---|---|---|
| Variable | Observed Mean (SD); Median (IQR); n | Observed Change Score (SD; n) | Effect Size (SE) | Pair-Wise Comparison | ||||
| C Group | PC Group | C Group | PC Group | |||||
| T0 | T3 | T0 | T3 | T0–T3 | ||||
| DAS44 | ||||||||
| ITT | 2.36 (0.67); 2.50 (1.09); 8 | 1.27 (0.82); 1.20 (1.43); 8 | 2.81 (0.55); 2.70 (0.83); 11 | 1.65 (0.72); 1.96 (1.25); 9 | 1.09 (0.89; 8) | 1.19 (0.71; 9) | 0.12 | p = 0.767 |
| PP | 2.31 (0.78); 2.50 (1.49); 6 | 1.29 (0.78); 1.19 (0.83); 6 | 2.83 (0.40); 2.82 (0.77); 4 | 1.26 (0.60); 1.00 (0.97); 4 | 1.02 (0.88; 6) | 1.57 (0.64; 4) | 0.09 | p = 0.214 |
| RADAI Disease Activity | ||||||||
| ITT | 4.36 (1.43); 4.88 (1.93); 8 | 2.29 (2.07); 1.85 (2.78); 8 | 4.66 (1.88); 5.59 (3.55); 11 | 1.20 (0.68); 1.34 (1.27); 4 | 2.07 (1.99; 8) | 3.97 (2.21; 4) | 0.92 | p = 0.249 |
| PP | 3.98 (1.47); 4.67 (2.51); 6 | 1.65 (1.35); 1.46 (2.11); 6 | 5.17 (1.91); 5.80 (3.31); 4 | 1.20 (0.68); 1.34 (1.27); 4 | 2.34 (1.49; 6) | 3.96 (2.21; 4) | 0.91 | p = 0.195 |
| RAND Physical Health Composite | ||||||||
| ITT | 33.63 (7.65); 30.50 (14.25); 8 | 42.25 (9.33); 41.00 (17.00); 8 | 37.00 (6.99); 37.00 (13.00); 11 | 51.75 (5.74); 53.00 (10.75); 4 | −8.63 (7.71; 8) | −10.25 (9.03; 4) | −0.20 | p = 0.231 |
| PP | 35.50 (8.07); 32.50 (16.00); 6 | 44.50 (8.98); 44.50 (18.50); 6 | 41.50 (4.43); 41.00 (8.50); 4 | 51.75 (5.74); 53.00 (10.75); 4 | −9.00 (8.10; 6) | −10.25 (9.03; 4) | −0.15 | p = 0.764 |
| IRGL Pain | ||||||||
| ITT | 262.50 (32.51); 260.00 (60); 8 | 102.00 (90.19); 97.00 (129.50); 8 | 268.45 (60.67); 280.00 (95.00);11 | 83.00 (71.55); 77.50 (138.00); 4 | 160.50 (87.21; 8) | 184.75 (90.79; 4) | 0.27 | p = 0.658 |
| PP | 249.17 (24.58); 245.00 (46.25); 6 | 86.00 (58.31); 97.00 (102.00); 6 | 267.75 (41.64); 273.00 (79.75); 4 | 83.00 (71.55); 77.50 (138.00); 4 | 163.17 (55.24; 6) | 184.75 (90.88; 4) | 0.31 | p = 0.702 |
| CIS Fatigue Severity | ||||||||
| ITT | 34.38 (12.49); 36.00 (20.50); 8 | 23.38 (8.38); 23.00 (14.75); 8 | 32.91 (10.58); 34.00 (14.00); 11 | 18.00 (8.60); 17.50 (16.50); 4 | 11.00 (14.92; 8) | 8.25 (12.15; 4) | −0.19 | p = 0.762 |
| PP | 34.33 (14.19); 36.00 (26.50); 6 | 20.83 (8.11); 21.00 (12.75); 6 | 26.25 (10.01); 26.50 (19.25); 4 | 18.00 (8.60); 17.50 (16.50); 4 | 13.50 (16.54; 6) | 8.25 (12.14; 4) | −0.35 | p = 0.612 |
| RAND Mental Health Composite | ||||||||
| ITT | 48.13 (8.18); 49.50 (8.50); 8 | 51.88 (6.51); 54.50 (9.75); 8 | 44.73 (10.11); 46.00 (17.00); 11 | 55.25 (4.11); 55.50 (7.75); 4 | −3.75 (10.40; 8) | −7.75 (10.44; 4) | −0.38 | p = 0.197 |
| PP | 48.33 (9.42); 49.50 (13.75); 6 | 53.50 (4.59); 54.50 (9.50); 6 | 47.50 (14.20); 50.50 (26.50); 4 | 55.25 (4.11); 55.50 (7.75); 4 | −5.17 (9.43; 6) | −7.75 (10.44; 4) | −0.26 | p = 0.635 |
| IFN-γ | ||||||||
| ITT | 56.76 (9.99); 59.25 (18.37); 8 | 47.10 (3.62); 46.23 (4.82); 8 | 57.79 (10.08); 58.16 (18.29); 11 | 50.32 (7.01); 48.98 (3.65); 9 | 9.67 (9.48; 8) | 5.75 (9.49; 9) | −0.41 | p = 0.719 |
| PP | 58.05 (9.23); 59.25 (12.32); 6 | 47.39 (4.19); 46.65 (6.59); 6 | 62.25 (12.06); 61.49 (22.58); 4 | 50.17 (1.39); 49.82 (NA); 3 | 10.66 (9.06; 6) | 9.69 (12.19; 3) | −0.10 | p = 0.866 |
| TNF-α | ||||||||
| ITT | 80.12 (10.68); 78.08 (18.07); 8 | 211.57 (223.92); 97.61 (305.54); 8 | 78.01 (12.94); 73.58 (10.40); 10 | 91.20 (7.00); 93.68 (12.25); 8 | −131.45 (227.73; 8) | −12.63 (13.47; 8) | 0.74 | p= 0.030 |
| PP | 75.11 (5.52); 74.00 (9.52); 6 | 251.91 (249.76); 104.48 (442.27); 6 | 78.63 (4.78); 78.68 (9.27); 4 | 95.63 (2.52); 94.81 (NA); 3 | −176.80 (250.42; 6) | −17.59 (3.19; 3) | 0.75 | p = 0.123 |
| Interleukin-1β | ||||||||
| ITT | 2.65 (0.80); 2.29 (1.56); 8 | 2.45 (0.30); 2.34 (0.52); 8 | 2.59 (0.79); 2.38 (1.34); 11 | 2.72 (0.70); 2.55 (0.51); 8 | 0.20 (0.95; 8) | −0.02 (0.89; 8) | −0.24 | p = 0.376 |
| PP | 2.53 (0.82); 2.15 (1.61); 6 | 2.38 (0.25); 2.30 (0.31); 6 | 2.71 (1.13); 2.83 (2.17); 4 | 2.48 (0.12); 2.53 (NA); 3 | 0.15 (0.95; 6) | 0.34 (1.24; 3) | 0.18 | p = 0.889 |
| Interleukin-6 | ||||||||
| ITT | 23.92 (24.82); 13.48 (44.97); 8 | 9.30 (6.36); 7.33 (4.63); 8 | 33.47 (47.00); 15.76 (38.01); 11 | 15.57 (16.19); 9.53 (8.29); 8 | 14.61 (27.28; 8) | 23.96 (56.64; 8) | 0.21 | p = 0.824 |
| PP | 18.91 (21.16); 10.70 (27.51); 6 | 7.52 (1.89); 7.33 (3.12); 6 | 34.46 (19.06); 41.00 (33.32); 4 | 22.84 (27.60); 7.69 (NA); 3 | 11.39 (21.19; 6) | 10.42 (28.65; 3) | −0.04 | p = 0.993 |
| Analyses T0–T1 | ||||||||
| Variable | Observed Mean (SD); Median (IQR); n | Observed Change Score (SD; n) | Effect Size (SE) | Pair-Wise Comparison | ||||
| C Group | PC Group | C Group | PC Group | |||||
| T0 | T1 | T0 | T1 | T0–T1 | ||||
| DAS44 | ||||||||
| ITT | 2.36 (0.67); 2.50 (1.09); 8 | 0.99 (0.38); 0.89 (0.66); 8 | 2.81 (0.55); 2.70 (0.83); 11 | 0.92 (0.49); 0.86 (0.61); 11 | 1.37 (0.61; 8) | 1.88 (0.40; 11) | 1.04 | p = 0.083 |
| PP | 2.31 (0.78); 2.50 (1.49); 6 | 0.95 (0.38); 0.89 (0.70); 6 | 2.83 (0.40); 2.82 (0.77); 4 | 0.70 (0.48); 0.62 (0.89); 4 | 1.36 (0.68; 6) | 2.13 (0.36; 4) | 1.32 | p = 0.085 |
| RADAI Disease Activity | ||||||||
| ITT | 4.36 (1.43); 4.88 (1.93); 8 | 2.19 (1.52); 1.92 (1.97); 8 | 4.66 (1.88); 5.59 (3.55); 11 | 2.22 (2.09); 1.31 (3.70); 9 | 2.10 (1.96; 8) | 3.16 (2.53; 4) | 0.50 | p = 0.724 |
| PP | 3.98 (1.47); 4.67 (2.51); 6 | 1.98 (1.74); 1.41 (2.03); 6 | 5.17 (1.91); 5.80 (3.31); 4 | 2.04 (2.30); 1.60 (NA); 3 | 2.01 (1.78; 6) | 4.05 (1.89; 3) | 1.13 | p = 0.323 |
| RAND Physical Health Composite | ||||||||
| ITT | 33.63 (7.65); 30.50 (14.25); 8 | 39.13 (5.17); 41.50 (9.00); 8 | 37.00 (6.99); 37.00 (13.00); 11 | 41.44 (2.51); 42.00 (2.50); 9 | −5.50 (5.32; 8) | −6.89 (5.84; 9) | −0.25 | p = 0.987 |
| PP | 35.50 (8.07); 32.50 (16.00); 6 | 41.50 (2.95); 42.00 (4.25); 6 | 41.50 (4.43); 41.00 (8.50); 4 | 41.00 (1.73); 42.00 (NA); 3 | −6.00 (6.07; 6) | −1.33 (4.73; 3) | 0.82 | p = 0.180 |
| IRGL Pain | ||||||||
| ITT | 262.50 (32.51); 260.00 (60); 8 | 87.25 (93.83); 62.50 (112.25); 8 | 268.45 (60.67); 280.00 (95.00); 11 | 70.56 (77.92); 50.00 (147.50); 9 | 175.25 (79.67; 8) | 203.67 (120.33; 9) | 0.27 | p = 0.609 |
| PP | 249.17 (24.58); 245.00 (46.25); 6 | 76.83 (107.25); 36.50 (110.00); 6 | 267.75 (41.64); 273.00 (79.75); 4 | 61.33 (95.84); 6.00 (NA); 3 | 172.33 (93.19; 6) | 224.00 (95.69; 3) | 0.55 | p = 0.541 |
| CIS Fatigue Severity | ||||||||
| ITT | 34.38 (12.49); 36.00 (20.50); 8 | 28.97 (15.34);28.33 (27.25); 8 | 32.91 (10.58); 34.00 (14.00); 11 | 20.98 (9.92); 22.86 (18.00); 9 | 5.41 (18.41; 8) | 15.13 (14.38; 9) | 0.59 | p = 0.336 |
| PP | 34.33 (14.19); 36.00 (26.50); 6 | 30.45 (17.22);28.33 (33.59); 6 | 26.25 (10.01); 26.50 (19.25); 4 | 17.33 (8.08); 16.00 (NA); 4 | 3.88 (21.51; 6) | 13.00 (13.23; 3) | 0.47 | p = 0.566 |
| RAND Mental Health Composite | ||||||||
| ITT | 48.13 (8.18); 49.50 (8.50); 8 | 39.38 (4.57); 39.00 (6.00); 8 | 44.73 (10.11); 46.00 (17.00); 11 | 38.33 (3.54); 39.00 (3.50); 9 | 8.75 (7.61; 8) | 3.56 (10.09; 9) | −0.58 | p = 0.461 |
| PP | 48.33 (9.42); 49.50 (13.75); 6 | 41.17 (3.19);40.00 (5.75); 6 | 47.50 (14.20); 50.50 (26.50); 4 | 39.00 (1.73); 40.00 (NA); 3 | 7.17 (7.22; 6) | 4.00 (14.73; 3) | −0.32 | p = 0.972 |
| IFN-γ | ||||||||
| ITT | 56.76 (9.99); 59.25 (18.37); 8 | 60.55 (13.95); 68.46 (27.07); 8 | 57.79 (10.08); 58.16 (18.29); 11 | 64.06 (13.07); 68.54 (24.78); 11 | −3.78 (19.18; 8) | −6.27 (15.83; 11) | −0.14 | p = 0.670 |
| PP | 58.05 (9.23);59.25 (12.32); 6 | 57.60 (15.19); 55.99 (28.59); 6 | 62.25 (12.06); 61.49 (22.58); 4 | 72.56 (5.29); 70.71 (9.21); 4 | −0.46 (19.58; 6) | −10.31 (9.91; 4) | −0.65 | p = 0.187 |
| TNF-α | ||||||||
| ITT | 80.12 (10.68); 78.08 (18.07); 8 | 78.08 (5.32); 77.81 (9.02); 8 | 78.01 (12.94); 73.58 (10.40); 10 | 74.95 (6.72); 74.96 (13.46); 10 | 2.04 (14.61; 8) | 3.07 (13.74; 10) | 0.07 | p = 0.984 |
| PP | 75.11 (5.52); 74.00 (9.52); 6 | 79.81 (4.50); 80.37 (9.29); 6 | 78.63 (4.78); 78.68 (9.27); 4 | 73.33 (8.65); 70.82 (15.76); 4 | −4.70 (8.95; 6) | 5.30 (6.08; 4) | 1.25 | p = 0.917 |
| Interleukin-1β | ||||||||
| ITT | 2.65 (0.80); 2.29 (1.56); 8 | 2.19 (0.24); 2.29 (0.35); 8 | 2.59 (0.79); 2.38 (1.34); 11 | 2.23 (0.33); 2.17 (0.58); 11 | 0.45 (0.84; 8) | 0.35 (1.04; 11) | −0.10 | p = 0.781 |
| PP | 2.53 (0.82); 2.15 (1.61); 6 | 2.12 (0.24); 2.20 (0.40); 6 | 2.71 (1.13); 2.83 (2.17); 4 | 2.04 (0.24); 2.06 (0.20); 4 | 0.41 (1.05; 6) | 0.67 (1.31; 4) | 0.22 | p = 0.604 |
| Interleukin-6 | ||||||||
| ITT | 23.92 (24.82); 13.48 (44.97); 8 | 7.54 (3.19); 6.32 (5.50); 8 | 33.47 (47.00); 15.76 (38.01); 11 | 6.67 (2.38); 5.94 (0.72); 11 | 16.38 (23.49; 8) | 26.81 (46.33; 11) | 0.27 | p = 0.466 |
| PP | 18.91 (21.16); 10.70 (27.51); 6 | 5.90 (1.09); 5.91 (1.83); 6 | 34.46 (19.06); 41.00 (33.32); 4 | 6.15 (0.23); 6.14 (0.41); 4 | 13.02 (20.42; 6) | 28.32 (18.92; 4) | 0.77 | p = 0.189 |
| Analyses T1–T2 | ||||||||
|---|---|---|---|---|---|---|---|---|
| Variable | Observed Mean (SD); Median (IQR); n | Observed Change Score (SD) | Effect Size (SE) | Pair-Wise Comparison | ||||
| C Group | PC Group | C Group | PC Group | |||||
| T1 | T2 | T1 | T2 | T1–T2 | ||||
| DAS44 | ||||||||
| ITT | 0.99 (0.38); 0.89 (0.66); 8 | 0.86 (0.57); 0.65 (0.82); 8 | 0.92 (0.49); 0.86 (0.61); 11 | 1.04 (0.70); 0.90 (1.01); 10 | 0.14 (0.53; 8) | −0.10 (0.53; 10) | −0.43 | p = 0.427 |
| PP | 0.95 (0.38); 0.89 (0.70); 6 | 0.96 (0.62); 0.77 (0.99); 6 | 0.70 (0.48); 0.62 (0.89); 4 | 0.45 (0.17); 0.48 (0.32); 4 | −0.01 (0.52; 6) | 0.26 (0.63; 4) | 0.47 | p = 0.539 |
| RADAI Disease Activity | ||||||||
| ITT | 2.19 (1.52); 1.92 (1.97); 8 | 2.26 (1.36); 2.11 (2.10); 8 | 2.22 (2.09); 1.31 (3.70); 9 | 1.98 (1.75); 1.62 (3.29); 4 | −0.07 (1.60; 8) | −0.31 (1.09; 4) | −0.16 | p = 0.881 |
| PP | 1.98 (1.74); 1.41 (2.03); 6 | 2.37 (1.58); 2.66 (2.64); 6 | 2.04 (2.30); 1.60 (NA); 3 | 1.86 (2.12); 0.88 (0.48); 3 | −0.39 (1.75; 6) | 0.19 (0.56; 3) | 0.38 | p = 0.671 |
| RAND Physical Health Composite | ||||||||
| ITT | 39.13 (5.17); 41.50 (9.00); 8 | 39.38 (6.00); 42.00 (11.75); 8 | 41.44 (2.51); 42.00 (2.50); 9 | 40.00 (3.46); 41.00 (6.00); 4 | −0.25 (2.43; 8) | 1.25 (4.03; 4) | 0.50 | p = 0.360 |
| PP | 41.50 (2.95); 42.00 (4.25); 6 | 41.83 (4.58); 43.50 (6.00); 6 | 41.00 (1.73); 42.00 (NA); 3 | 41.67 (1.15); 41.00 (NA); 3 | −0.33 (2.16; 6) | −0.67 (1.53; 3) | −0.17 | p = 0.942 |
| IRGL Pain | ||||||||
| ITT | 87.25 (93.83); 62.50 (112.25); 8 | 112.75 (84.98); 106.50 (142.75); 8 | 70.56 (77.92); 50.00 (147.50); 9 | 96.50 (81.76); 65.50 (141.00); 4 | −25.50 (114.46; 8) | −37.00 (7.79; 4) | −0.12 | p = 0.898 |
| PP | 76.83 (107.25); 36.50 (110.00); 6 | 109.00 (89.59); 106.50 (143.75); 6 | 61.33 (95.84); 6.00 (NA); 3 | 101.33 (99.43); 49.00 (NA); 3 | −32.17 (119.36; 6) | −40.00 (6.08; 3) | 0.08 | p = 0.899 |
| CIS Fatigue Severity | ||||||||
| ITT | 28.97 (15.34); 28.33 (27.25); 8 | 24.63 (14.39); 17.00 (24.75); 8 | 20.98 (9.92); 22.86 (18.00); 9 | 20.00 (6.27); 19.50 (12.00); 4 | 4.34 (11.70; 8) | 1.00 (6.06; 4) | −0.32 | p = 0.651 |
| PP | 30.45 (17.22); 28.33 (33.59); 6 | 24.17 (15.78); 16.50 (29.00); 6 | 17.33 (8.08); 16.00 (NA); 4 | 17.33 (4.04); 18.00 (NA); 3 | 6.29 (7.13; 6) | 0.00 (7.00; 3) | −0.89 | p = 0.579 |
| RAND Mental Health Composite | ||||||||
| ITT | 39.38 (4.57); 39.00 (6.00); 8 | 37.75 (2.55); 37.50 (3.75); 8 | 38.33 (3.54); 39.00 (3.50); 9 | 36.75 (4.03); 37.00 (7.75); 4 | 1.63 (5.50; 8) | 0.50 (3.11; 4) | −0.23 | p = 0.993 |
| PP | 41.17 (3.19); 40.00 (5.75); 6 | 37.83 (2.86); 37.50 (5.00); 6 | 39.00 (1.73); 40.00 (NA); 3 | 38.33 (3.06); 39.00 (NA); 3 | 3.33 (5.24; 6) | 0.67 (3.79; 3) | −0.55 | p = 0.655 |
| IFN-γ | ||||||||
| ITT | 60.55 (13.95); 68.46 (27.07); 8 | 45.93 (2.46); 46.94 (4.01); 7) | 64.06 (13.07); 68.54 (24.78); 11 | 48.03 (8.93); 45.16 (5.85); 10 | 17.00 (14.55; 7) | 14.41 (14.18; 10) | −0.18 | p = 0.921 |
| PP | 57.60 (15.19); 55.99 (28.59); 6 | 46.07 (1.88); 46.94 (3.61); 5 | 72.56 (5.29); 70.71 (9.21); 4 | 43.85 (0.94); 43.74 (NA); 3 | 14.28 (16.71; 5) | 26.14 (1.46; 3) | 0.87 | p = 0.053 |
| TNF-α | ||||||||
| ITT | 78.08 (5.32); 77.81 (9.02); 8 | 89.21 (13.69); 84.61 (27.84); 7 | 74.95 (6.72); 74.96 (13.46); 10 | 89.20 (14.93); 83.18 (11.92); 9 | −11.63 (11.65; 7) | −15.38 (14.75; 9) | −0.28 | p = 0.954 |
| PP | 79.81 (4.50); 80.37 (9.29); 6 | 88.26 (13.43); 84.61 (21.26); 5 | 73.33 (8.65); 70.82 (15.76); 4 | 95.89 (26.51); 83.18 (NA); 3 | −8.80 (10.71; 5) | −26.50 (22.13; 3) | −1.14 | p = 0.894 |
| Interleukin-1β | ||||||||
| ITT | 2.19 (0.24); 2.29 (0.35); 8 | 2.74 (0.51); 2.52 (0.68); 7 | 2.23 (0.33); 2.17 (0.58); 11 | 2.56 (0.38); 2.54 (0.43); 9 | −0.56 (0.60; 7) | −0.39 (0.36; 9) | 0.36 | p = 0.579 |
| PP | 2.12 (0.24); 2.20 (0.40); 6 | 2.62 (0.34); 2.52 (0.67); 5 | 2.04 (0.24); 2.06 (0.20); 4 | 2.47 (0.21); 2.54 (NA); 3 | −0.54 (0.56; 5) | −0.52 (0.34; 3) | 0.03 | p = 0.899 |
| Interleukin-6 | ||||||||
| ITT | 7.54 (3.19); 6.32 (5.50); 8 | 6.07 (1.07); 5.90 (1.34); 7 | 6.67 (2.38); 5.94 (0.72); 11 | 8.69 (6.42); 6.29 (3.52); 9 | 1.70 (3.45; 7) | −1.67 (4.43, 9) | −0.83 | p = 0.814 |
| PP | 5.90 (1.09); 5.91 (1.83); 6 | 6.02 (2.12); 4.89 (3.01); 5 | 6.15 (0.23); 6.14 (0.41); 4 | 5.61 (0.61); 5.43 (NA); 3 | −0.13 (1.79; 5) | 0.60 (0.82; 3) | 0.48 | p = 0.887 |
| Analyses T2–T3 | ||||||||
|---|---|---|---|---|---|---|---|---|
| Variable | Observed Mean (SD); Median (IQR); n | Observed Change Score (SD) | Effect Size (SE) | Pair-Wise Comparison | ||||
| C Group | PC Group | C Group | PC Group | |||||
| T2 | T3 | T2 | T3 | T2–T3 | ||||
| DAS44 | ||||||||
| ITT | 0.86 (0.57); 0.65 (0.82); 8 | 1.27 (0.82); 1.20 (1.43); 8 | 1.04 (0.70); 0.90 (1.01); 10 | 1.65 (0.72); 1.96 (1.25); 9 | −0.41 (0.54; 8) | −0.61 (0.52; 9) | −0.38 | p = 0.533 |
| PP | 0.96 (0.62); 0.77 (0.99); 6 | 1.29 (0.78); 1.19 (0.83); 6) | 0.45 (0.17); 0.48 (0.32); 4 | 1.26 (0.60); 1.00 (0.97); 4 | −0.32 (0.40; 6) | −0.81 (0.54; 4) | −1.06 | p = 0.264 |
| RADAI Disease Activity | ||||||||
| ITT | 2.26 (1.36); 2.11 (2.10); 8 | 2.29 (2.07); 1.85 (2.78); 8 | 1.98 (1.75); 1.62 (3.29); 4 | 1.20 (0.68); 1.34 (1.27); 4 | −0.03 (2.49; 8) | 0.81 (1.46; 3) | 0.37 | p = 0.529 |
| PP | 2.37 (1.58); 2.66 (2.64); 6 | 1.65 (1.35); 1.46 (2.11); 6 | 1.86 (2.12); 0.88 (0.48); 3 | 1.20 (0.68); 1.34 (1.27); 4 | 0.72 (2.12; 6) | 0.81 (1.46; 3) | 0.05 | p = 0.846 |
| RAND Physical Health Composite | ||||||||
| ITT | 39.38 (6.00); 42.00 (11.75); 8 | 42.25 (9.33); 41.00 (17.00); 8 | 40.00 (3.46); 41.00 (6.00); 4 | 51.75 (5.74); 53.00 (10.75); 4 | −2.88 (6.44; 8) | −10.33 (6.66; 3) | −1.15 | p = 0.061 |
| PP | 41.83 (4.58); 43.50 (6.00); 6 | 44.50 (8.98); 44.50 (18.50); 6 | 41.67 (1.15); 41.00 (NA); 3 | 51.75 (5.74); 53.00 (10.75); 4 | −2.67 (6.77; 6) | −10.33 (6.66; 3) | −1.14 | p = 0.125 |
| IRGL Pain | ||||||||
| ITT | 112.75 (84.98); 106.50 (142.75); 8 | 102.00 (90.19); 97.00 (129.50); 8 | 96.50 (81.76); 65.50 (141.00); 4 | 83.00 (71.55); 77.50 (138.00); 4 | 10.75 (80.20; 8) | 26.00 (23.30; 3) | 0.21 | p = 0.905 |
| PP | 109.00 (89.59); 106.50 (143.75); 6 | 86.00 (58.31); 97.00 (102.00); 6 | 101.33 (99.43); 49.00 (NA); 3 | 83.00 (71.55); 77.50 (138.00); 4 | 23.00 (83.03; 6) | 26.00 (23.30; 3) | 0.04 | p = 0.903 |
| CIS Fatigue Severity | ||||||||
| ITT | 24.63 (14.39); 17.00 (24.75); 8 | 23.38 (8.38); 23.00 (14.75); 8 | 20.00 (6.27); 19.50 (12.00); 4 | 18.00 (8.60); 17.50 (16.50); 4 | 1.25 (17.59; 8) | −3.67 (10.26; 3) | −0.30 | p = 0.948 |
| PP | 24.17 (15.78); 16.50 (29.00); 6 | 20.83 (8.11); 21.00 (12.75); 6 | 17.33 (4.04); 18.00 (NA); 3 | 18.00 (8.60); 17.50 (16.50); 4 | 3.33 (18.83; 6) | −3.67 (10.26; 3) | −0.42 | p = 0.631 |
| RAND Mental Health Composite | ||||||||
| ITT | 37.75 (2.55); 37.50 (3.75); 8 | 51.88 (6.51); 54.50 (9.75); 8 | 36.75 (4.03); 37.00 (7.75); 4 | 55.25 (4.11); 55.50 (7.75); 4 | −14.13 (5.79; 8) | −15.33 (0.58; 3) | −0.24 | p = 0.547 |
| PP | 37.83 (2.86); 37.50 (5.00); 6 | 53.50 (4.59); 54.50 (9.50); 6 | 38.33 (3.06); 39.00 (NA); 3 | 55.25 (4.11); 55.50 (7.75); 4 | −15.67 (4.32; 6) | −15.33 (0.58; 3) | 0.09 | p = 0.983 |
| IFN-γ | ||||||||
| ITT | 45.93 (2.46); 46.94 (4.01); 7 | 47.10 (3.62); 46.23 (4.82); 8 | 48.03 (8.93); 45.16 (5.85); 10 | 50.32 (7.01); 48.98 (3.65); 9 | −1.72 (4.45; 7) | −1.81 (4.55; 8) | −0.02 | p = 0.965 |
| PP | 46.07 (1.88); 46.94 (3.61); 5 | 47.39 (4.19); 46.65 (6.59); 6 | 43.85 (0.94); 43.74 (NA); 3 | 50.17 (1.39); 49.82 (0.84); 3 | −2.15 (4.48; 5) | −5.11 (1.37; 2) | −0.73 | p = 0.577 |
| TNF-α | ||||||||
| ITT | 89.21 (13.69); 84.61 (27.84); 7 | 211.57 (223.92); 97.61 (305.54); 8 | 89.20 (14.93); 83.18 (11.92); 9 | 91.20 (7.00); 93.68 (12.25); 8 | −59.99 (149.96; 7) | −0.09 (17.76; 7) | 0.56 | p= 0.032 |
| PP | 88.26 (13.43); 84.61 (21.26); 5 | 251.91 (249.76); 104.48 (442.27); 6 | 95.89 (26.51); 83.18 (NA); 3 | 95.63 (2.52); 94.81 (1.19); 3 | −84.40 (176.04; 5) | 8.04 (33.27; 2) | 0.58 | p = 0.135 |
| Interleukin-1β | ||||||||
| ITT | 2.74 (0.51); 2.52 (0.68); 7 | 2.45 (0.30); 2.34 (0.52); 8 | 2.56 (0.38); 2.54 (0.43); 9 | 2.72 (0.70); 2.55 (0.51); 8 | 0.25 (0.50; 7) | −0.28 (0.84; 7) | −0.77 | p = 0.259 |
| PP | 2.62 (0.34); 2.52 (0.67); 5 | 2.38 (0.25); 2.30 (0.31); 6 | 2.47 (0.21); 2.54 (NA); 3 | 2.48 (0.12); 2.53 (0.03); 3 | 0.20 (0.55; 5) | 0.04 (0.04; 2) | −0.33 | p = 0.648 |
| Interleukin-6 | ||||||||
| ITT | 6.07 (1.07); 5.90 (1.34); 7 | 9.30 (6.36); 7.33 (4.63); 8 | 8.69 (6.42); 6.29 (3.52); 9 | 15.57 (16.19); 9.53 (8.29); 8 | −3.64 (6.94; 7) | −7.66 (19.44; 7) | −0.27 | p = 0.813 |
| PP | 6.02 (2.12); 4.89 (3.01); 5 | 7.52 (1.89); 7.33 (3.12); 6 | 5.61 (0.61); 5.43 (NA); 3 | 22.84 (27.60); 7.69 (1.55); 3 | −1.72 (3.01; 5) | −24.56 (33.73; 2) | −1.49 | p = 0.195 |
Disclaimer/Publisher’s Note: The statements, opinions and data contained in all publications are solely those of the individual author(s) and contributor(s) and not of MDPI and/or the editor(s). MDPI and/or the editor(s) disclaim responsibility for any injury to people or property resulting from any ideas, methods, instructions or products referred to in the content. |
© 2024 by the authors. Licensee MDPI, Basel, Switzerland. This article is an open access article distributed under the terms and conditions of the Creative Commons Attribution (CC BY) license (https://creativecommons.org/licenses/by/4.0/).
Share and Cite
Manaï, M.; van Middendorp, H.; van der Pol, J.A.; Allaart, C.F.; Dusseldorp, E.; Veldhuijzen, D.S.; Huizinga, T.W.J.; Evers, A.W.M. Can Pharmacological Conditioning as an Add-On Treatment Optimize Standard Pharmacological Treatment in Patients with Recent-Onset Rheumatoid Arthritis? A Proof-of-Principle Randomized Clinical Trial. Pharmaceuticals 2024, 17, 110. https://doi.org/10.3390/ph17010110
Manaï M, van Middendorp H, van der Pol JA, Allaart CF, Dusseldorp E, Veldhuijzen DS, Huizinga TWJ, Evers AWM. Can Pharmacological Conditioning as an Add-On Treatment Optimize Standard Pharmacological Treatment in Patients with Recent-Onset Rheumatoid Arthritis? A Proof-of-Principle Randomized Clinical Trial. Pharmaceuticals. 2024; 17(1):110. https://doi.org/10.3390/ph17010110
Chicago/Turabian StyleManaï, Meriem, Henriët van Middendorp, Joy A. van der Pol, Cornelia F. Allaart, Elise Dusseldorp, Dieuwke S. Veldhuijzen, Tom W. J. Huizinga, and Andrea W. M. Evers. 2024. "Can Pharmacological Conditioning as an Add-On Treatment Optimize Standard Pharmacological Treatment in Patients with Recent-Onset Rheumatoid Arthritis? A Proof-of-Principle Randomized Clinical Trial" Pharmaceuticals 17, no. 1: 110. https://doi.org/10.3390/ph17010110