
Perceiving the Concealed and Unreported Pharmacophoric Features of the 5-Hydroxytryptamine Receptor Using Balanced QSAR Analysis

 ,
,  ,
,  ,
,  ,
,  , and
, and
Abstract
:
1. Introduction
2. Results
3. Discussion
4. Materials and Methods
4.1. Selection of Dataset
4.2. Calculation of Molecular Descriptors and Objective Feature Selection (OFS)
4.3. Splitting the Dataset and Subjective Feature Selection (SFS)
4.4. Building Regression Model and Its Validation
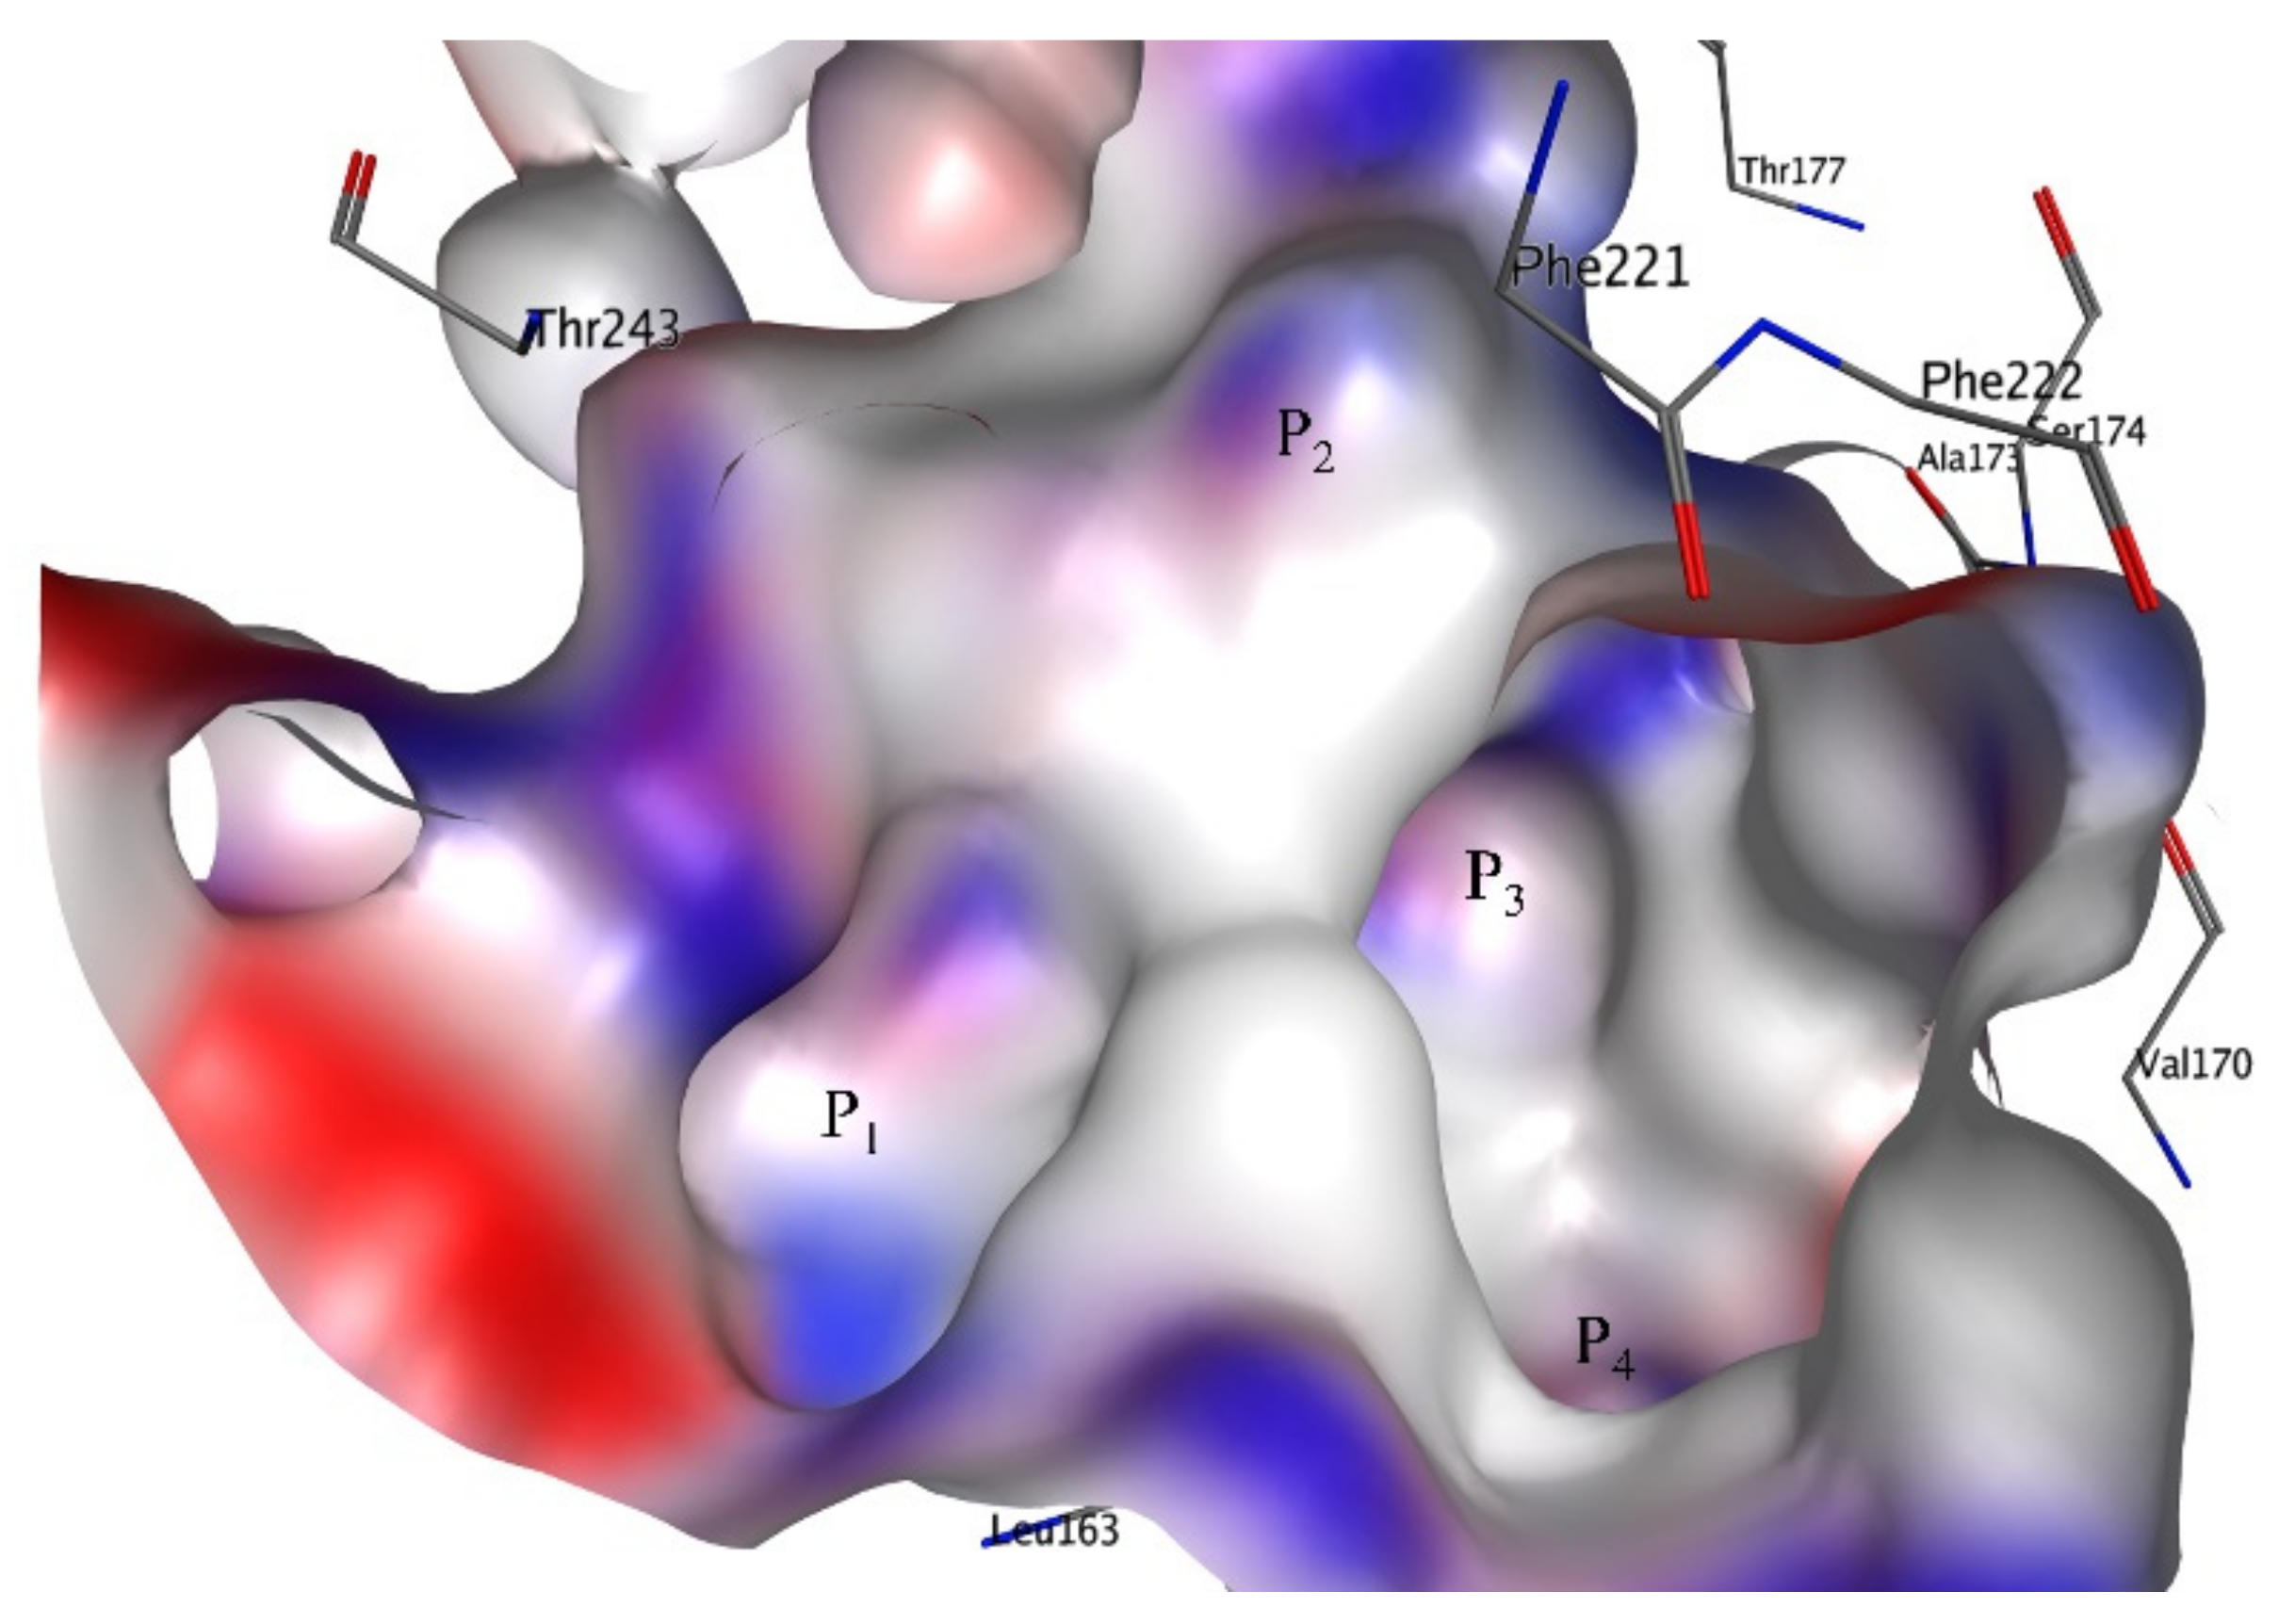
4.5. Molecular Docking
5. Conclusions
Supplementary Materials
Author Contributions
Funding
Institutional Review Board Statement
Informed Consent Statement
Data Availability Statement
Acknowledgments
Conflicts of Interest
Abbreviations
| SMILES | Simplified molecular-input line-entry system |
| GA | Genetic algorithm |
| MLR | Multiple linear regression |
| QSAR | Quantitative structure−activity relationship |
| WHO | World Health Organization |
| ADMET | Absorption, distribution, metabolism, excretion, and toxicity |
| OLS | Ordinary least square |
| QSARINS | QSAR Insubria |
| OECD | Organisation for Economic Co-operation and Development |
References
- Doddareddy, M.R.; Cho, Y.S.; Koh, H.Y.; Pae, A.N. CoMFA and CoMSIA 3D QSAR analysis on N1-arylsulfonylindole compounds as 5-HT6 antagonists. Bioorganic Med. Chem. 2004, 12, 3977–3985. [Google Scholar] [CrossRef] [PubMed]
- Codony, X.; Burgueño, J.; Ramírez, M.J.; Vela, J.M. 5-HT6 Receptor Signal Transduction. In Pharmacology of 5-HT6 Receptors—Part 1; Academic Press: Cambridge, MA, USA, 2010; pp. 89–110. [Google Scholar]
- Hao, M.; Li, Y.; Li, H.; Zhang, S. Investigation of the Structure Requirement for 5-HT6 Binding Affinity of Arylsulfonyl Derivatives: A Computational Study. Int. J. Mol. Sci. 2011, 12, 5011–5030. [Google Scholar] [CrossRef] [PubMed] [Green Version]
- Benhamú, B.; Martín-Fontecha, M.; Vázquez-Villa, H.; Pardo, L.; López-Rodríguez, M.L. Serotonin 5-HT6 Receptor Antagonists for the Treatment of Cognitive Deficiency in Alzheimer’s Disease. J. Med. Chem. 2014, 57, 7160–7181. [Google Scholar] [CrossRef]
- Karila, D.; Freret, T.; Bouet, V.; Boulouard, M.; Dallemagne, P.; Rochais, C. Therapeutic Potential of 5-HT6 Receptor Agonists. J. Med. Chem. 2015, 58, 7901–7912. [Google Scholar] [CrossRef] [PubMed]
- Łażewska, D.; Kurczab, R.; Więcek, M.; Kamińska, K.; Satała, G.; Jastrzębska-Więsek, M.; Partyka, A.; Bojarski, A.J.; Wesołowska, A.; Kieć-Kononowicz, K.; et al. The computer-aided discovery of novel family of the 5-HT 6 serotonin receptor ligands among derivatives of 4-benzyl-1,3,5-triazine. Eur. J. Med. Chem. 2017, 135, 117–124. [Google Scholar] [CrossRef] [PubMed]
- Kucwaj-Brysz, K.; Baltrukevich, H.; Czarnota, K.; Handzlik, J. Chemical update on the potential for serotonin 5-HT6 and 5-HT7 receptor agents in the treatment of Alzheimer’s disease. Bioorganic Med. Chem. Lett. 2021, 49, 128275. [Google Scholar] [CrossRef] [PubMed]
- Vanda, D.; Canale, V.; Chaumont-Dubel, S.; Kurczab, R.; Satała, G.; Koczurkiewicz-Adamczyk, P.; Krawczyk, M.; Pietruś, W.; Blicharz, K.; Pękala, E.; et al. Imidazopyridine-Based 5-HT6 Receptor Neutral Antagonists: Impact of N1-Benzyl and N1-Phenylsulfonyl Fragments on Different Receptor Conformational States. J. Med. Chem. 2021, 64, 1180–1196. [Google Scholar] [CrossRef] [PubMed]
- Zajdel, P.; Grychowska, K.; Mogilski, S.; Kurczab, R.; Satała, G.; Bugno, R.; Kos, T.; Gołębiowska, J.; Malikowska-Racia, N.; Nikiforuk, A.; et al. Structure-Based Design and Optimization of FPPQ, a Dual-Acting 5-HT3 and 5-HT6 Receptor Antagonist with Antipsychotic and Procognitive Properties. J. Med. Chem. 2021, 64, 13279–13298. [Google Scholar] [CrossRef]
- Staroń, J.; Kurczab, R.; Warszycki, D.; Satała, G.; Krawczyk, M.; Bugno, R.; Lenda, T.; Popik, P.; Hogendorf, A.S.; Hogendorf, A.; et al. Virtual screening-driven discovery of dual 5-HT6/5-HT2A receptor ligands with pro-cognitive properties. Eur. J. Med. Chem. 2020, 185, 111857. [Google Scholar] [CrossRef]
- Heal, D.J.; Smith, S.L.; Fisas, A.; Codony, X.; Buschmann, H. Selective 5-HT6 receptor ligands: Progress in the development of a novel pharmacological approach to the treatment of obesity and related metabolic disorders. Pharmacol. Ther. 2008, 117, 207–231. [Google Scholar] [CrossRef]
- Da Silva, A.P.; de Angelo, R.M.; de Paula, H.; Honório, K.M.; da Silva, A.B.F. Drug design of new 5-HT6 antagonists: A QSAR study of arylsulfonamide derivatives. Struct. Chem. 2020, 31, 1585–1597. [Google Scholar] [CrossRef]
- Imam, S.S.; Gilani, S.J. Computer Aided Drug Design: A Novel Loom to Drug Discovery. Org. Med. Chem. 2017, 1, 113–118. [Google Scholar] [CrossRef]
- Baig, M.H.; Ahmad, K.; Roy, S.; Ashraf, J.M.; Adil, M.; Siddiqui, M.H.; Khan, S.; Kamal, M.A.; Provaznik, I.; Choi, I. Computer Aided Drug Design: Success and Limitations. Curr. Pharm. Des. 2016, 22, 572–581. [Google Scholar] [CrossRef]
- Gramatica, P. Principles of QSAR Modeling. Int. J. Quant. Struct. Prop. Relatsh. 2020, 5, 61–97. [Google Scholar] [CrossRef]
- Gramatica, P. On the development and validation of QSAR models. Methods Mol. Biol. 2013, 930, 499–526. [Google Scholar] [CrossRef]
- Gramatica, P.; Cassani, S.; Roy, P.P.; Kovarich, S.; Yap, C.W.; Papa, E. QSAR Modeling is not Push a Button and Find a Correlation: A Case Study of Toxicity of (Benzo-)triazoles on Algae. Mol. Inform. 2012, 31, 817–835. [Google Scholar] [CrossRef]
- Huang, J.; Fan, X. Why QSAR fails: An empirical evaluation using conventional computational approach. Mol. Pharm. 2011, 8, 600–608. [Google Scholar] [CrossRef]
- López-Rodríguez, M.L.; Benhamú, B.; de la Fuente, T.; Sanz, A.; Pardo, L.; Campillo, M. A Three-Dimensional Pharmacophore Model for 5-Hydroxytryptamine6 (5-HT6) Receptor Antagonists. J. Med. Chem. 2005, 48, 4216–4219. [Google Scholar] [CrossRef]
- Masand, V.H.; Patil, M.K.; El-Sayed, N.N.E.; Zaki, M.E.A.; Almarhoon, Z.; Al-Hussain, S.A. Balanced QSAR analysis to identify the structural requirements of ABBV-075 (Mivebresib) analogues as bromodomain and extraterminal domain (BET) family bromodomain inhibitor. J. Mol. Struct. 2021, 1229, 129597. [Google Scholar] [CrossRef]
- Fujita, T.; Winkler, D.A. Understanding the Roles of the “Two QSARs”. J. Chem. Inf. Model. 2016, 56, 269–274. [Google Scholar] [CrossRef]
- Krstajic, D.; Buturovic, L.J.; Leahy, D.E.; Thomas, S. Cross-validation pitfalls when selecting and assessing regression and classification models. J. Cheminform. 2014, 6, 10. [Google Scholar] [CrossRef] [Green Version]
- Chirico, N.; Gramatica, P. Real external predictivity of QSAR models. Part 2. New intercomparable thresholds for different validation criteria and the need for scatter plot inspection. J. Chem. Inf. Model. 2012, 52, 2044–2058. [Google Scholar] [CrossRef]
- Chirico, N.; Gramatica, P. Real external predictivity of QSAR models: How to evaluate it? Comparison of different validation criteria and proposal of using the concordance correlation coefficient. J. Chem. Inf. Model. 2011, 51, 2320–2335. [Google Scholar] [CrossRef]
- Consonni, V.; Ballabio, D.; Todeschini, R. Comments on the definition of the Q2 parameter for QSAR validation. J. Chem. Inf. Model. 2009, 49, 1669–1678. [Google Scholar] [CrossRef]
- Rao, R.B.; Fung, G.; Rosales, R. On the Dangers of Cross-Validation. An Experimental Evaluation. In Proceedings of the 2008 SIAM International Conference on Data Mining (SDM), Atlanta, GA, USA, 24–26 April 2008; pp. 588–596, ISBN 978-0-89871-654-2. [Google Scholar] [CrossRef] [Green Version]
- Gramatica, P.; Giani, E.; Papa, E. Statistical external validation and consensus modeling: A QSPR case study for Koc prediction. J. Mol. Graph. Model. 2007, 25, 755–766. [Google Scholar] [CrossRef]
- Tropsha, A.; Gramatica, P.; Gombar, V.K. The Importance of Being Earnest Validation is the Absolute Essential for Successful Application and Interpretation of QSPR Models. QSAR Comb. Sci. 2003, 22, 69–77. [Google Scholar] [CrossRef]
- Cherkasov, A.; Muratov, E.N.; Fourches, D.; Varnek, A.; Baskin, I.I.; Cronin, M.; Dearden, J.; Gramatica, P.; Martin, Y.C.; Todeschini, R.; et al. QSAR modeling: Where have you been? Where are you going to? J. Med. Chem. 2014, 57, 4977–5010. [Google Scholar] [CrossRef] [Green Version]
- Todeschini, R.; Consonni, V. Molecular Descriptors for Chemoinformatics; Wiley-VCH: Weinheim, Germany, 2009; Volumes I and II. [Google Scholar]
- Huang, S.-Y. Comprehensive assessment of flexible-ligand docking algorithms: Current effectiveness and challenges. Brief. Bioinform. 2018, 19, 982–994. [Google Scholar] [CrossRef]
- Masand, V.H.; Mahajan, D.T.; Nazeruddin, G.M.; Hadda, T.B.; Rastija, V.; Alfeefy, A.M. Effect of information leakage and method of splitting (rational and random) on external predictive ability and behavior of different statistical parameters of QSAR model. Med. Chem. Res. 2015, 24, 1241–1264. [Google Scholar] [CrossRef]
- Polishchuk, P. Interpretation of Quantitative Structure–Activity Relationship Models: Past, Present, and Future. J. Chem. Inf. Model. 2017, 57, 2618–2639. [Google Scholar] [CrossRef]
- Golbraikh, A.; Muratov, E.; Fourches, D.; Tropsha, A. Data set modelability by QSAR. J. Chem. Inf. Model. 2014, 54, 1–4. [Google Scholar] [CrossRef] [PubMed] [Green Version]
- Li, J.; Gramatica, P. The importance of molecular structures, endpoints’ values, and predictivity parameters in QSAR research: QSAR analysis of a series of estrogen receptor binders. Mol. Divers 2010, 14, 687–696. [Google Scholar] [CrossRef] [PubMed]
- Zaki, M.E.A.; Al-Hussain, S.A.; Masand, V.H.; Akasapu, S.; Lewaa, I. QSAR and Pharmacophore Modeling of Nitrogen Heterocycles as Potent Human N-Myristoyltransferase (Hs-NMT) Inhibitors. Molecules 2021, 26, 1834. [Google Scholar] [CrossRef] [PubMed]
- Zaki, M.E.A.; Al-Hussain, S.A.; Masand, V.H.; Akasapu, S.; Bajaj, S.O.; El-Sayed, N.N.E.; Ghosh, A.; Lewaa, I. Identification of Anti-SARS-CoV-2 Compounds from Food Using QSAR-Based Virtual Screening, Molecular Docking, and Molecular Dynamics Simulation Analysis. Pharmaceuticals 2021, 14, 357. [Google Scholar] [CrossRef]
- Masand, V.H.; Mahajan, D.T.; Hadda, T.B.; Jawarkar, R.D.; Alafeefy, A.M.; Rastija, V.; Ali, M.A. Does tautomerism influence the outcome of QSAR modeling? Med. Chem. Res. 2014, 23, 1742–1757. [Google Scholar] [CrossRef]
- Masand, V.H.; Mahajan, D.T.; Gramatica, P.; Barlow, J. Tautomerism and multiple modelling enhance the efficacy of QSAR: Antimalarial activity of phosphoramidate and phosphorothioamidate analogues of amiprophos methyl. Med. Chem. Res. 2014, 23, 4825–4835. [Google Scholar] [CrossRef]
- Gramatica, P. External Evaluation of QSAR Models, in Addition to Cross-Validation Verification of Predictive Capability on Totally New Chemicals. Mol. Inform. 2014, 33, 311–314. [Google Scholar] [CrossRef]
- Tropsha, A. Recent trends in statistical QSAR modeling of environmental chemical toxicity. In Molecular, Clinical and Environmental Toxicology; Springer: Berlin/Heidelberg, Germany, 2012; Volume 101, pp. 381–411. [Google Scholar] [CrossRef]
- Fourches, D.; Muratov, E.; Tropsha, A. Trust, but verify: On the importance of chemical structure curation in cheminformatics and QSAR modeling research. J. Chem. Inf. Model. 2010, 50, 1189–1204. [Google Scholar] [CrossRef]
- O’Boyle, N.M.; Banck, M.; James, C.A.; Morley, C.; Vandermeersch, T.; Hutchison, G.R. Open Babel: An open chemical toolbox. J. Cheminform. 2011, 3, 33. [Google Scholar] [CrossRef] [Green Version]
- Stewart, J.J.P. MOPAC: A semiempirical molecular orbital program. J. Comput. Aided Mol. Des. 1990, 4, 1–103. [Google Scholar] [CrossRef]
- Masand, V.H.; Rastija, V. PyDescriptor: A new PyMOL plugin for calculating thousands of easily understandable molecular descriptors. Chemom. Intell. Lab. Syst. 2017, 169, 12–18. [Google Scholar] [CrossRef]
- Yap, C.W. PaDEL-descriptor: An open source software to calculate molecular descriptors and fingerprints. J. Comput. Chem. 2011, 32, 1466–1474. [Google Scholar] [CrossRef]
- Gramatica, P.; Chirico, N.; Papa, E.; Cassani, S.; Kovarich, S. QSARINS: A new software for the development, analysis, and validation of QSAR MLR models. J. Comput. Chem. 2013, 34, 2121–2132. [Google Scholar] [CrossRef]
- Martin, T.M.; Harten, P.; Young, D.M.; Muratov, E.N.; Golbraikh, A.; Zhu, H.; Tropsha, A. Does rational selection of training and test sets improve the outcome of QSAR modeling? J. Chem. Inf. Model. 2012, 52, 2570–2578. [Google Scholar] [CrossRef]
- Kar, S.; Roy, K.; Leszczynski, J. Applicability Domain: A Step Toward Confident Predictions and Decidability for QSAR Modeling. In Computational Toxicology; Humana Press: New York, NY, USA, 2018; pp. 141–169. [Google Scholar]
- Netzeva, T.I.; Worth, A.; Aldenberg, T.; Benigni, R.; Cronin, M.T.; Gramatica, P.; Jaworska, J.S.; Kahn, S.; Klopman, G.; Marchant, C.A.; et al. Current status of methods for defining the applicability domain of (quantitative) structure-activity relationships. The report and recommendations of ECVAM Workshop 52. Altern. Lab. Anim. ATLA 2005, 33, 155–173. [Google Scholar] [CrossRef]
- Trott, O.; Olson, A.J. AutoDock Vina: Improving the speed and accuracy of docking with a new scoring function, efficient optimization, and multithreading. J. Comput. Chem. 2009, 31, 455–461. [Google Scholar] [CrossRef] [Green Version]
- Di Muzio, E.; Toti, D.; Polticelli, F. DockingApp: A user friendly interface for facilitated docking simulations with AutoDock Vina. J. Comput. Aided Mol. Des. 2017, 31, 213–218. [Google Scholar] [CrossRef]


| Molecular Descriptor | Description | Software Used for Calculation | Correlation with pKi |
|---|---|---|---|
| com_Hhyd_3A | Total number of hydrogen atoms with partial charge in the range of ±0.2 within 3 Å from center of mass of molecule | PyDescriptor | −0.625 |
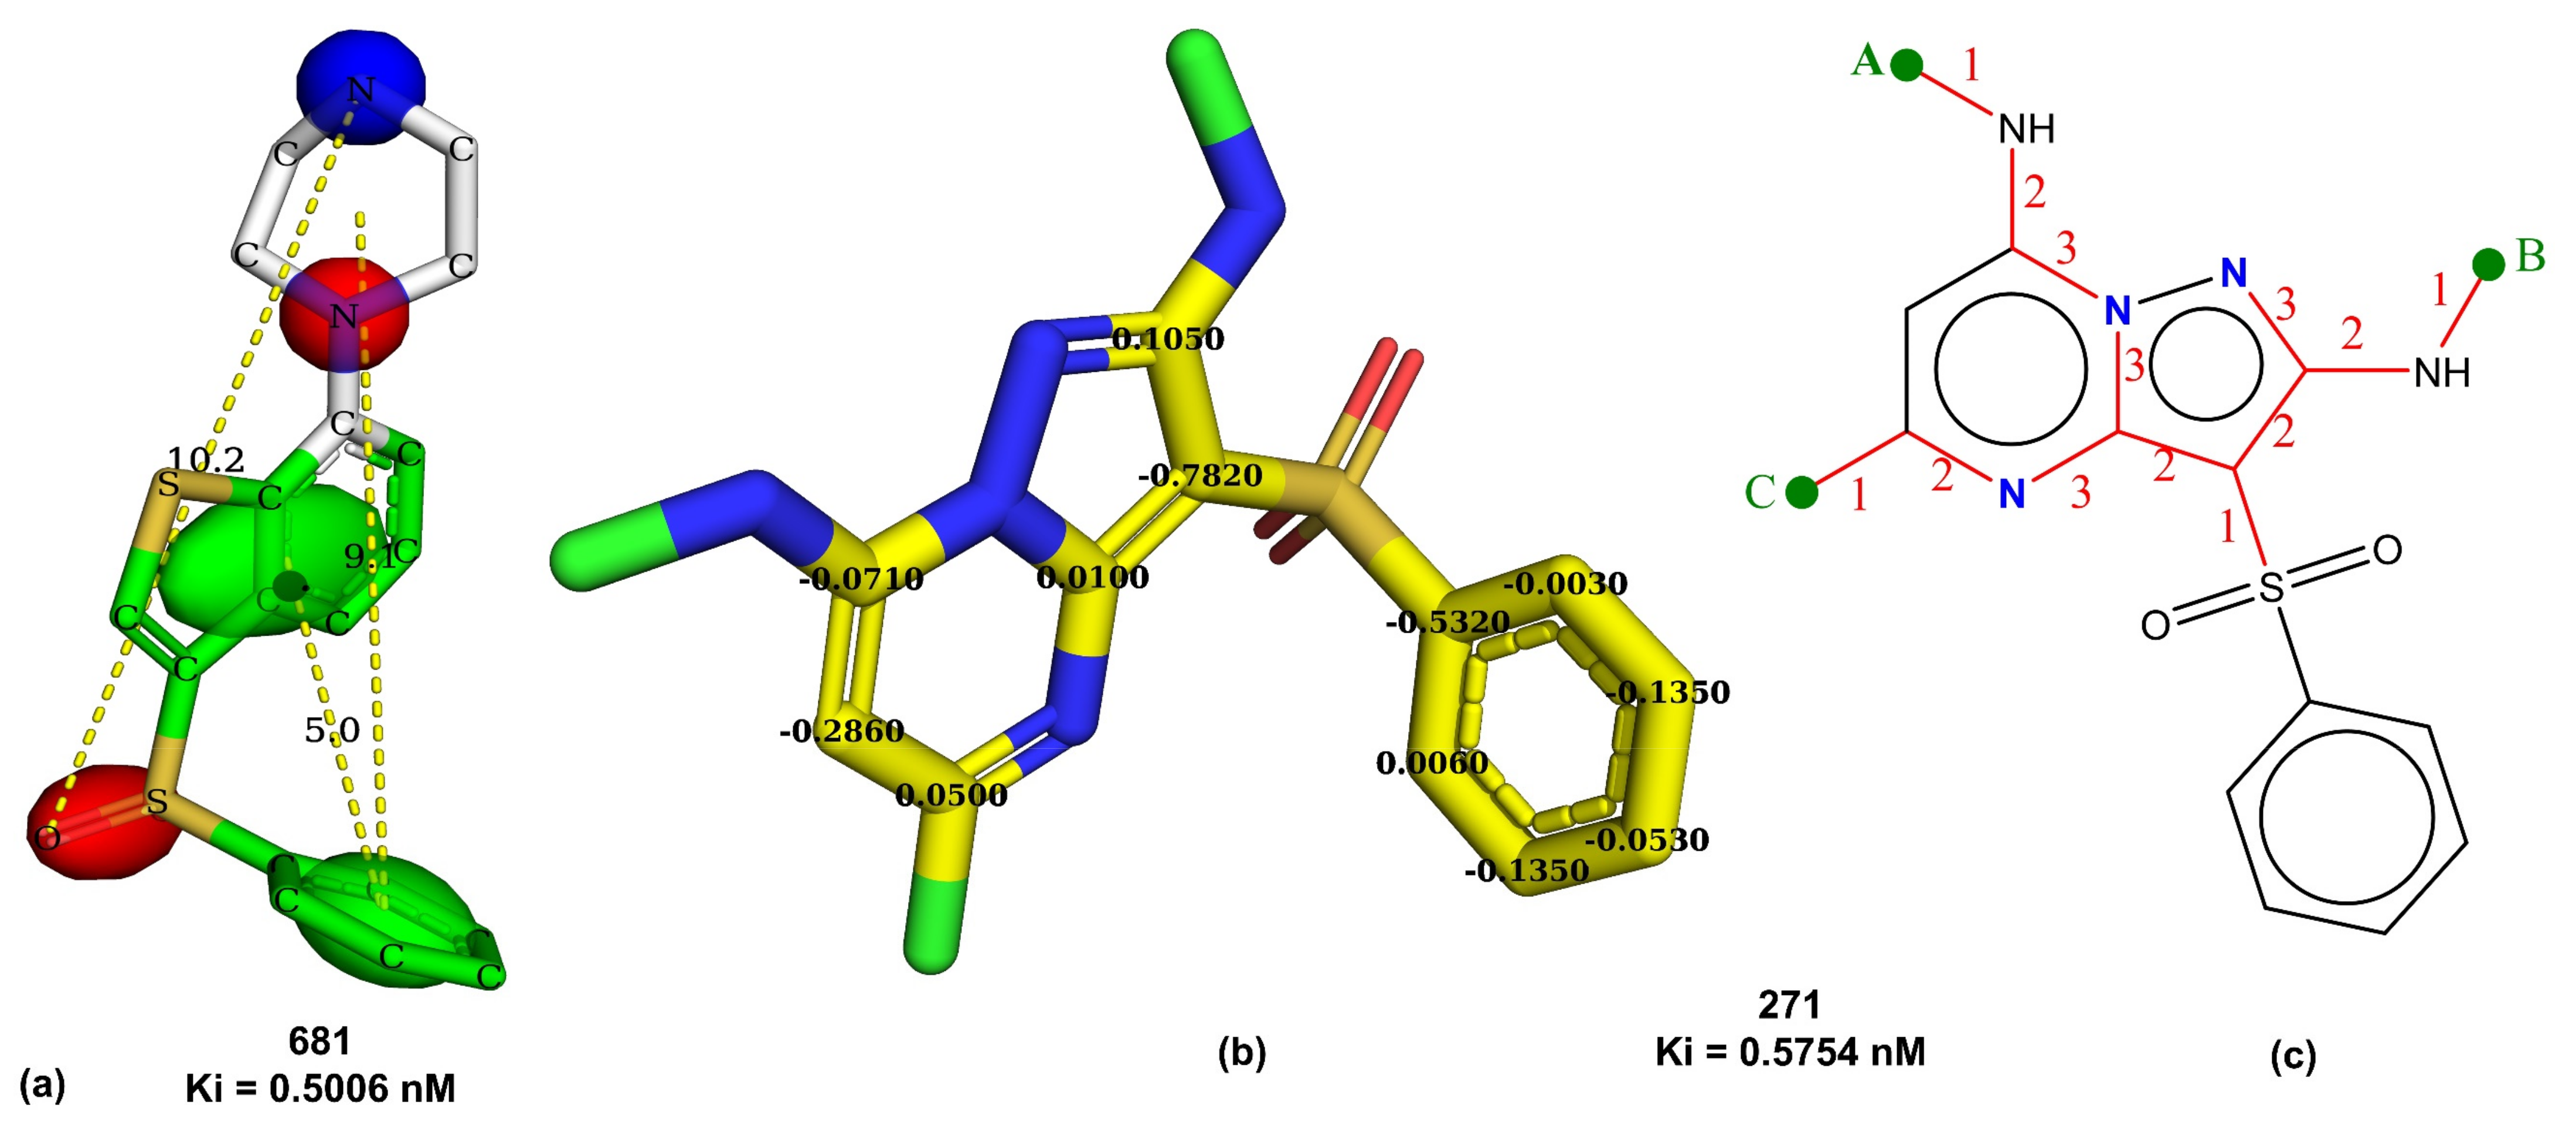
| ringC_S_4Bc | Sum of partial charges on ring carbon atoms present within four bonds from sulfur atom | PyDescriptor | −0.696 |
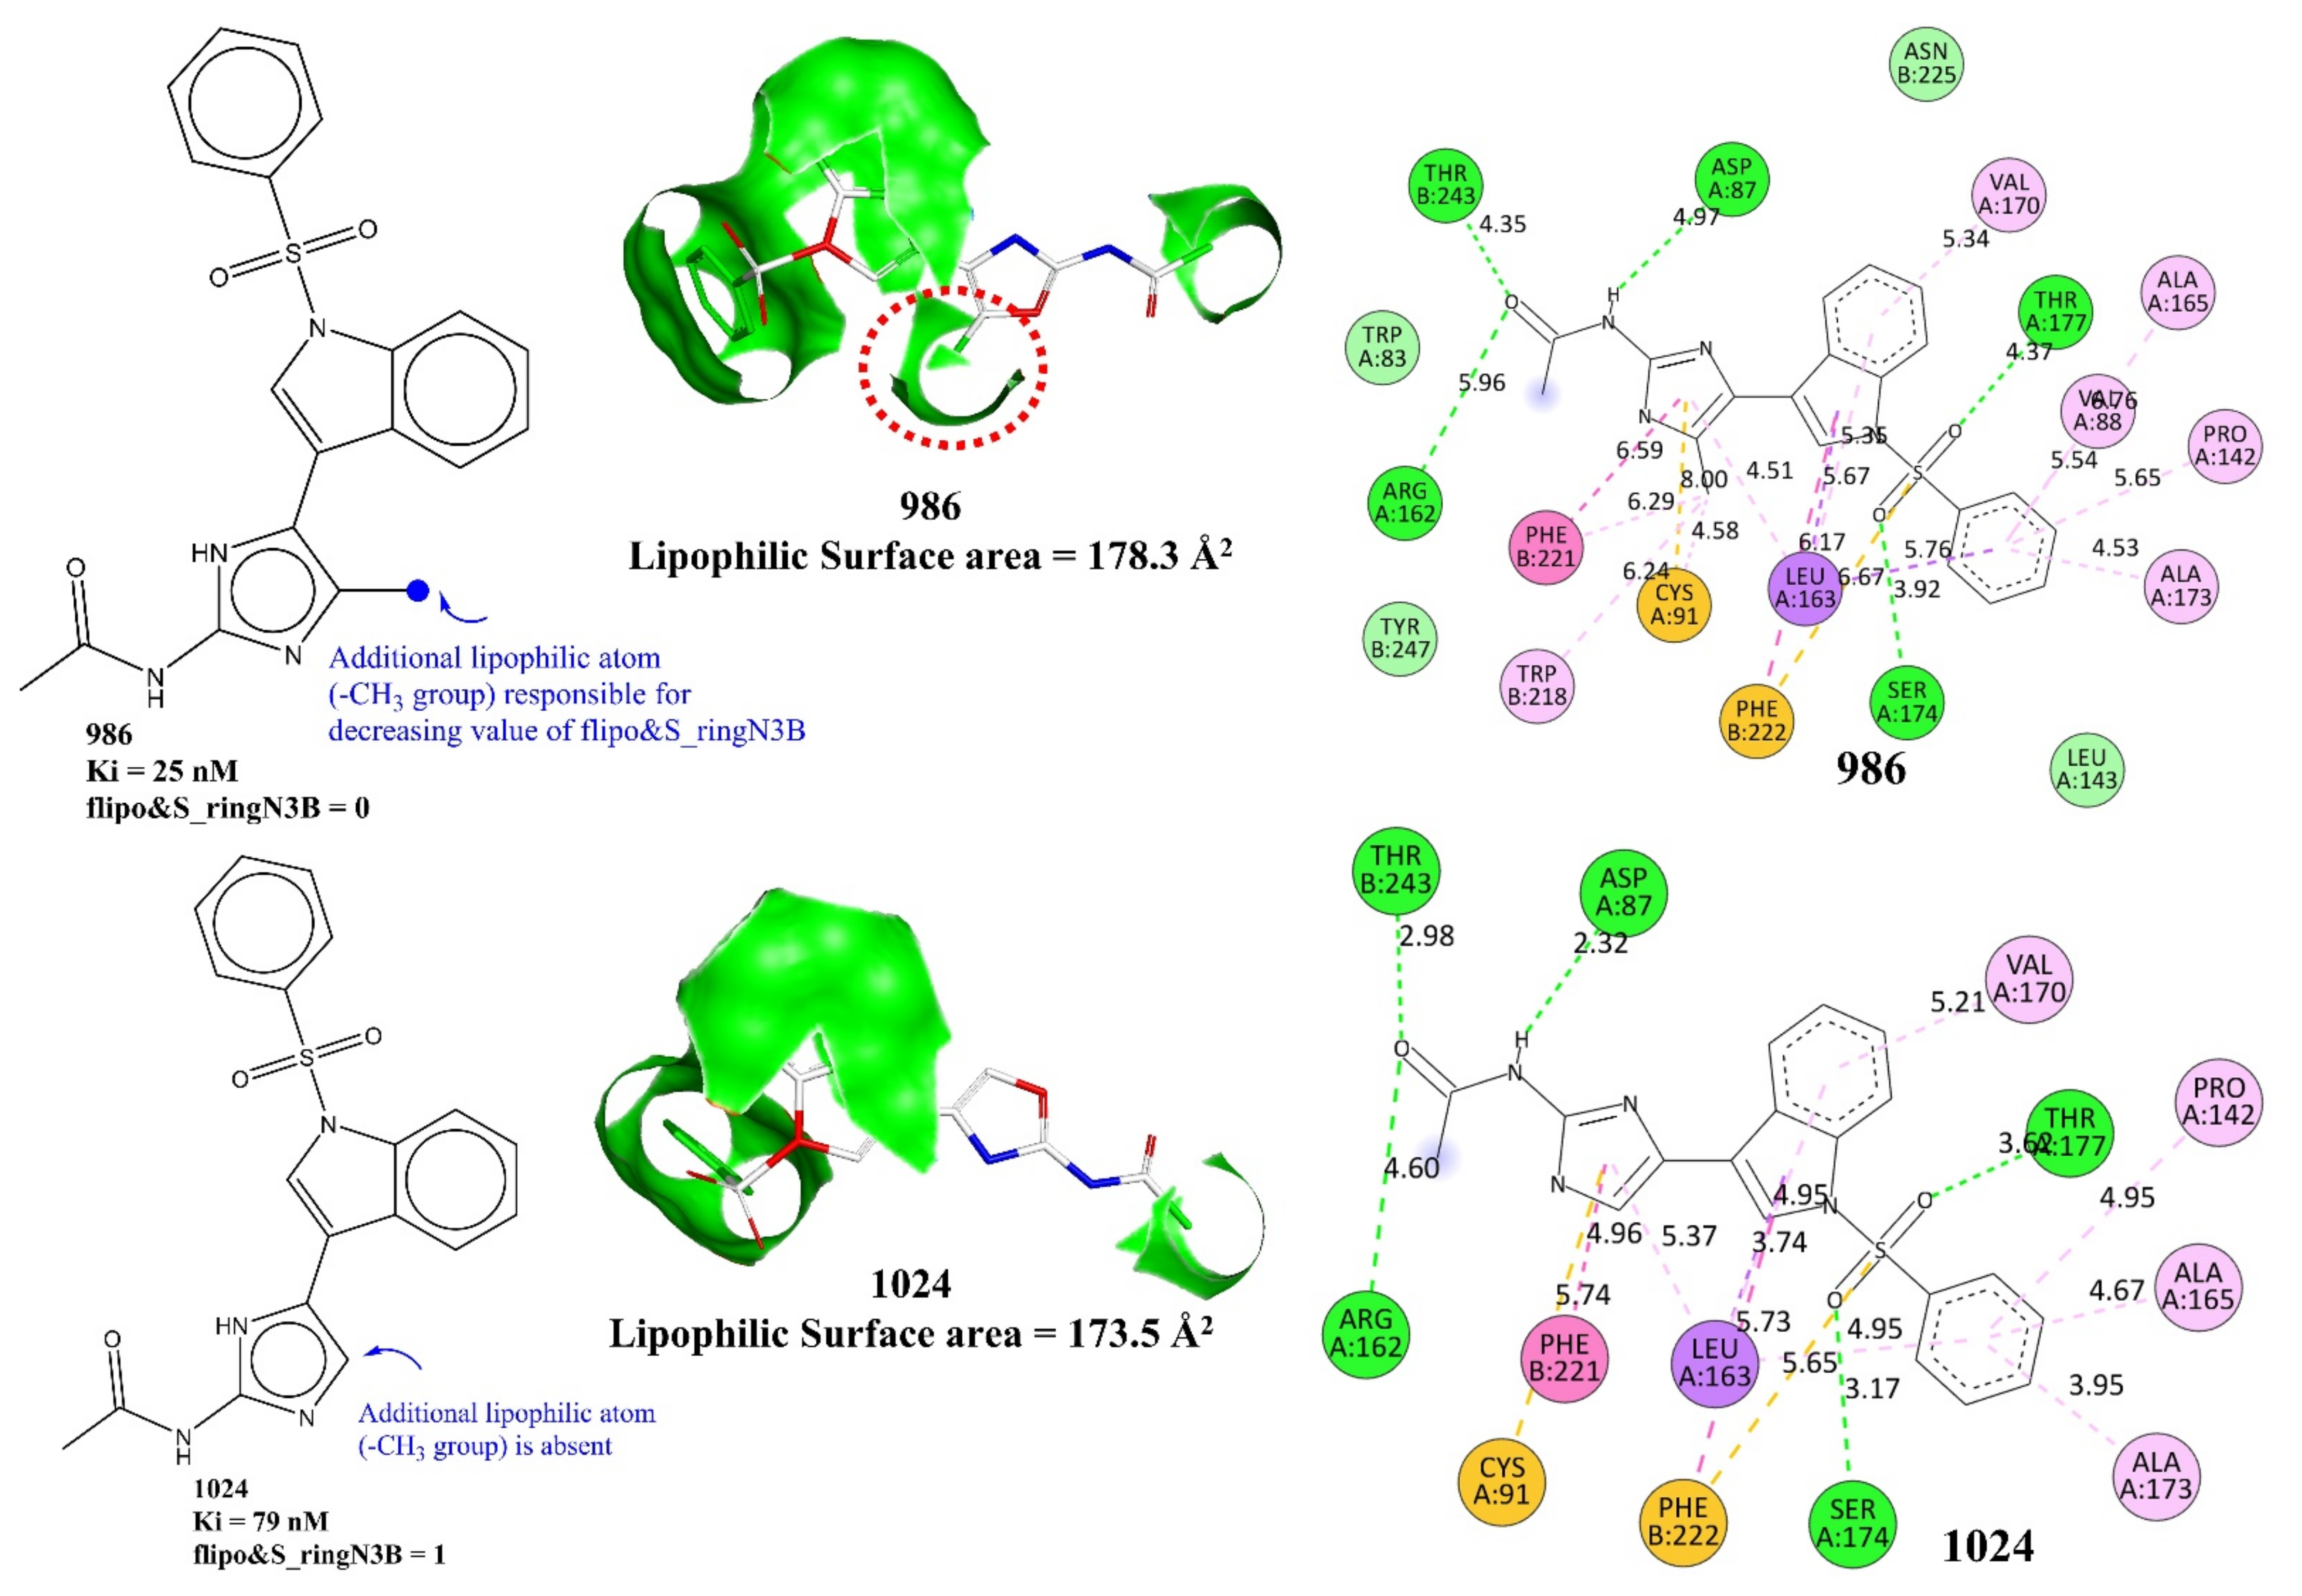
| flipo&S_ringN3B | Frequency of occurrence of ring nitrogen atom present exactly at three bonds from lipophilic atom | PyDescriptor | −0.248 |
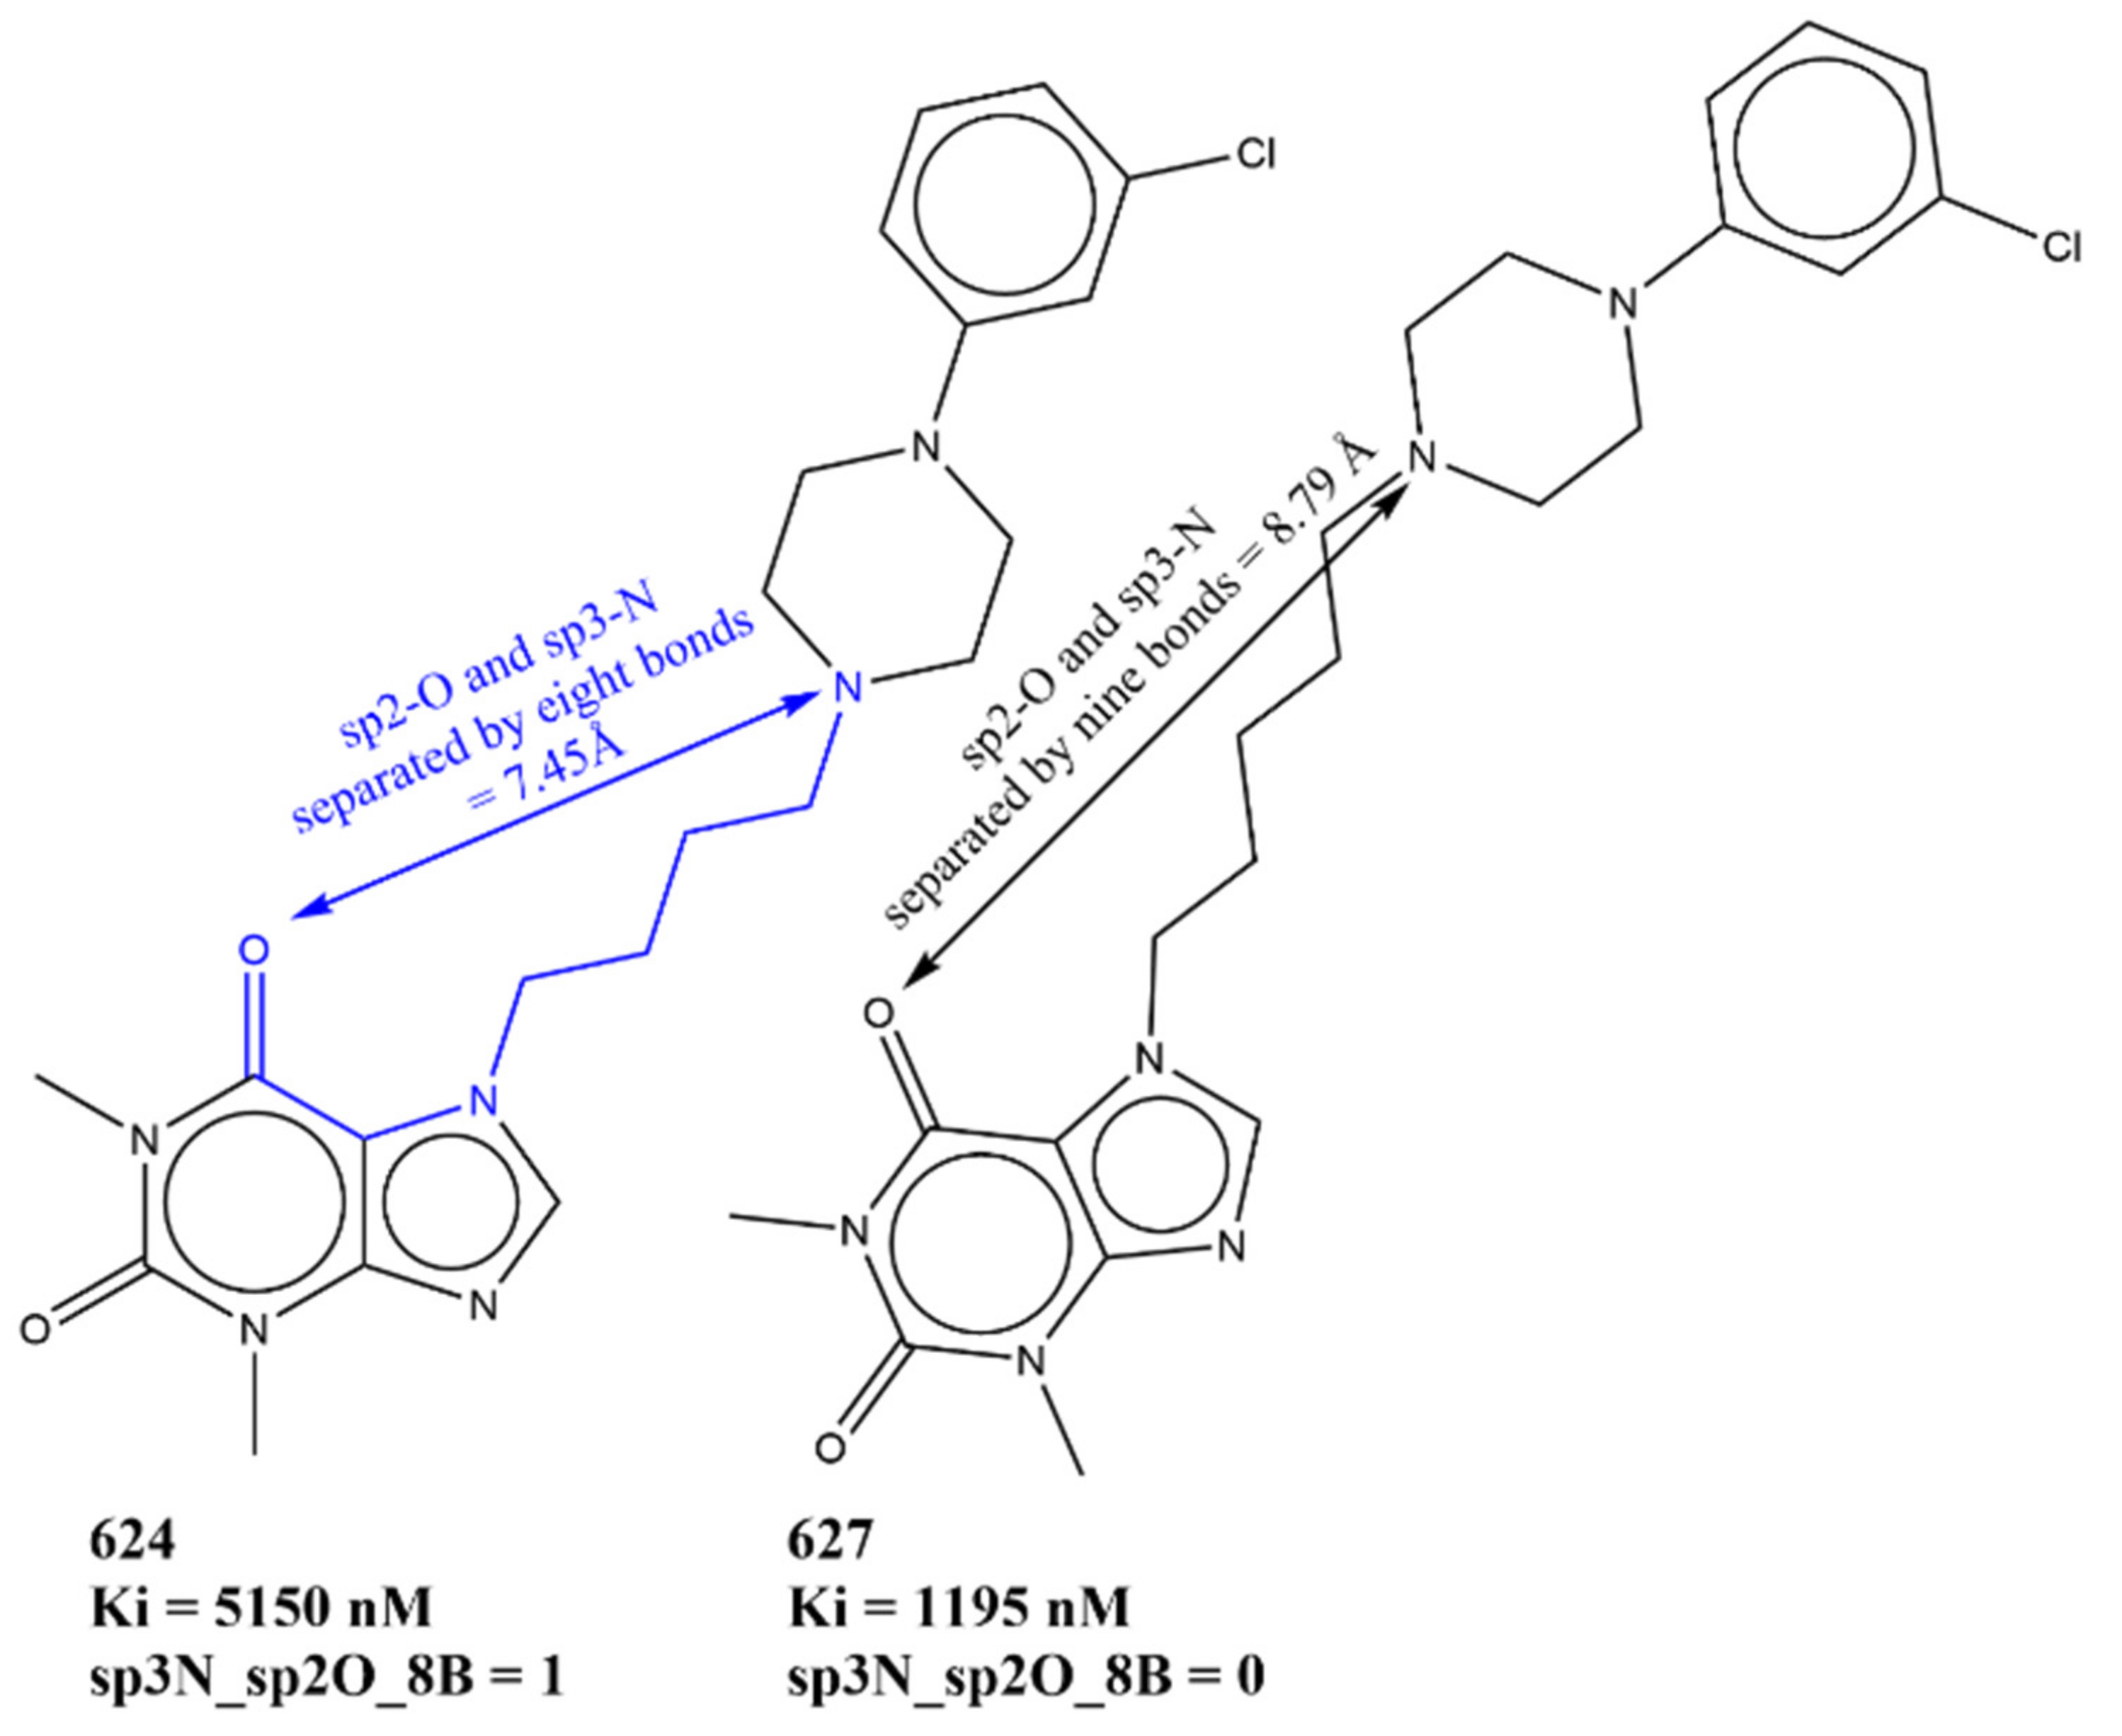
| sp3N_sp2O_8B | Total number of sp3-hybridized nitrogen atoms present within eight bonds from sp2-hybridized oxygen atoms | PyDescriptor | −0.133 |
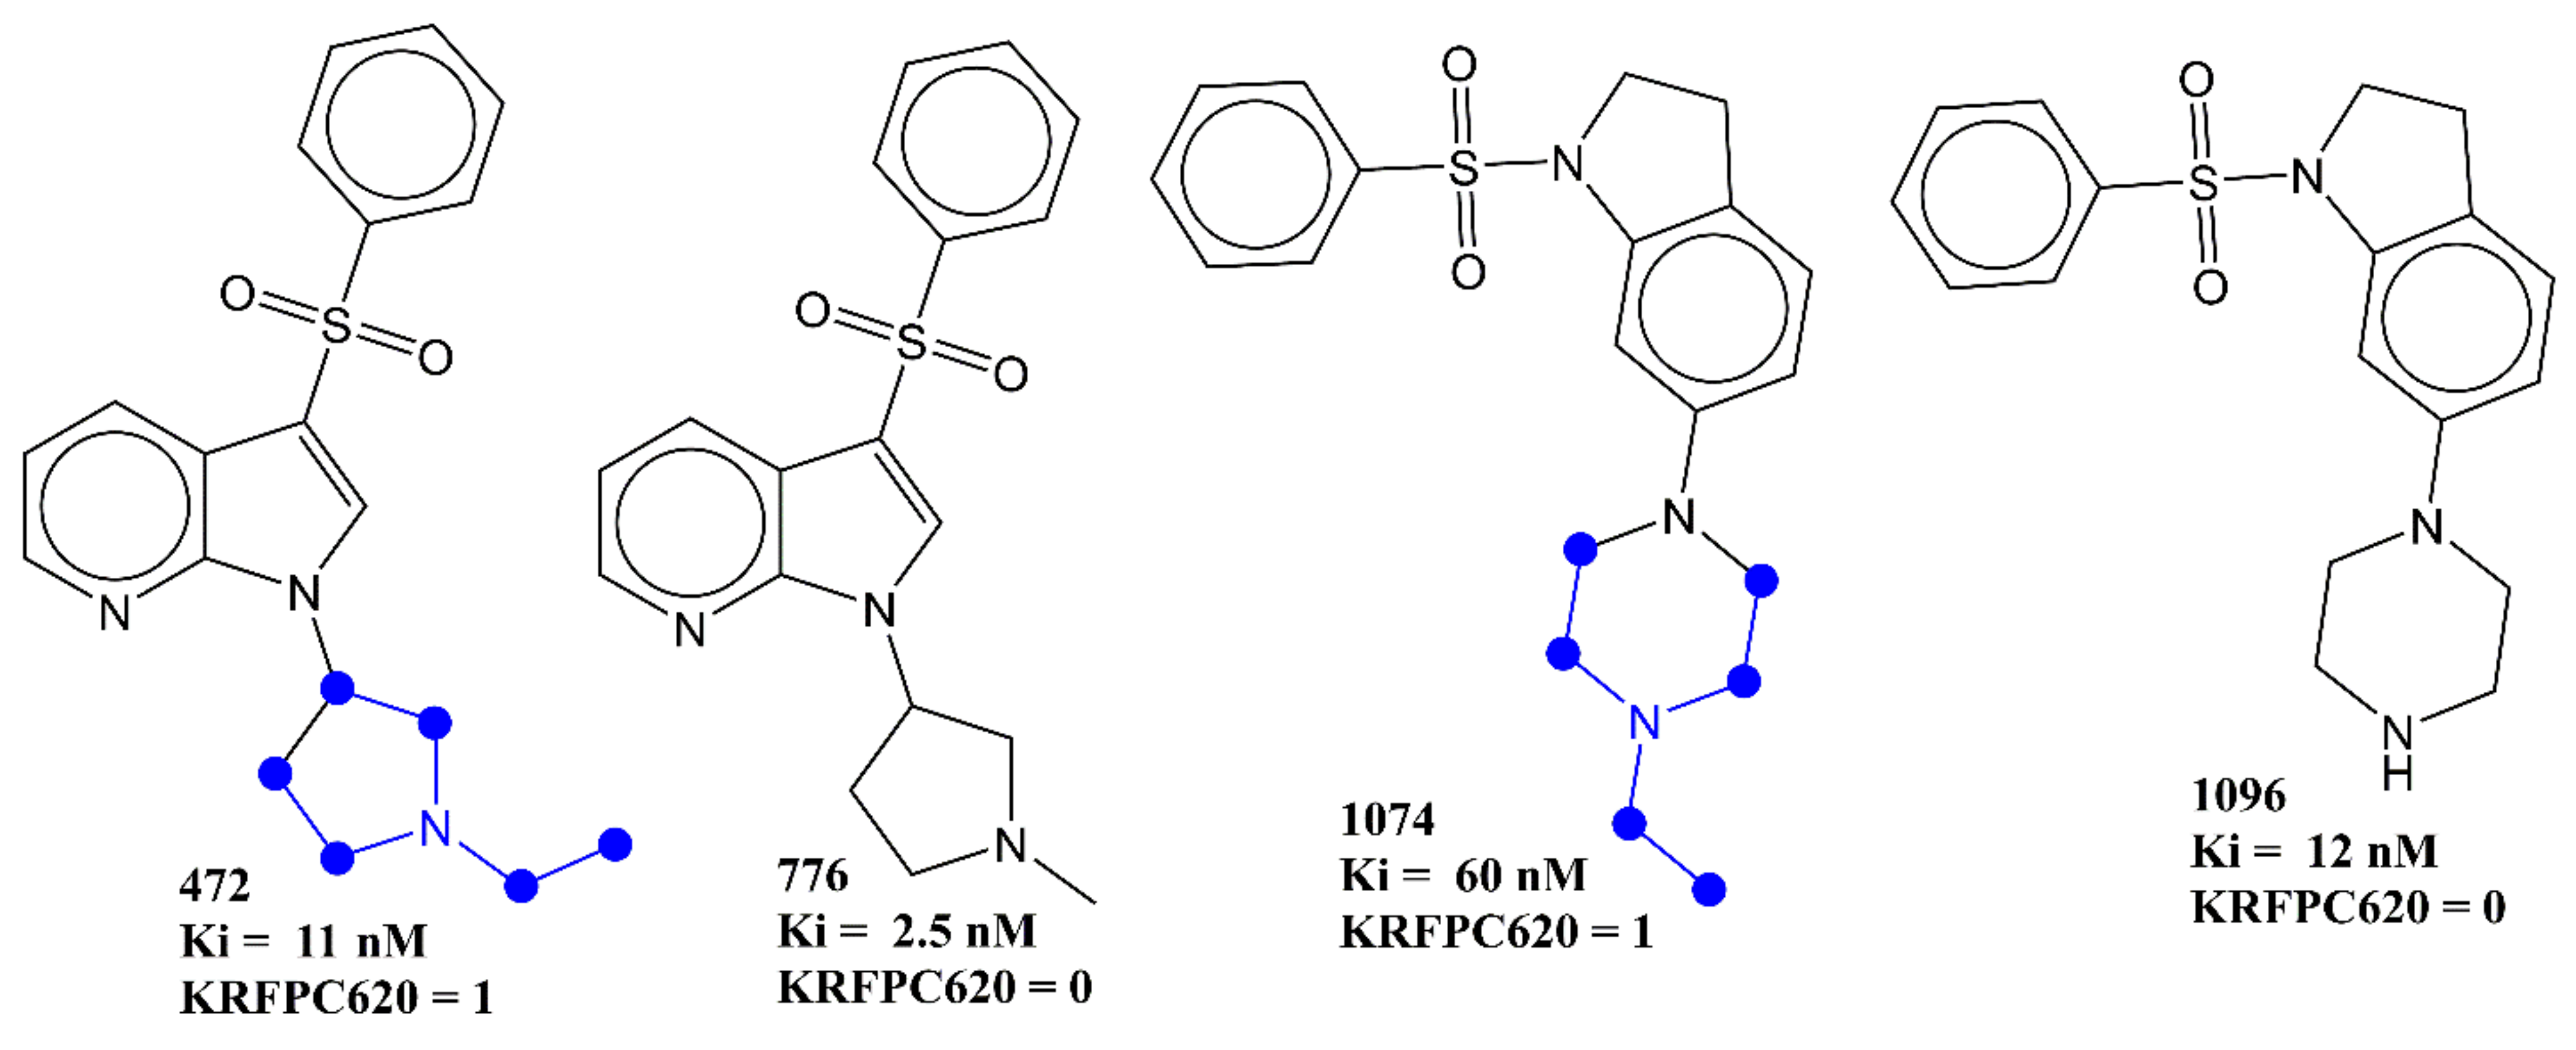
| KRFPC620 | Nitrogen attached to three CH3CH2- groups | PaDEL | −0.444 |
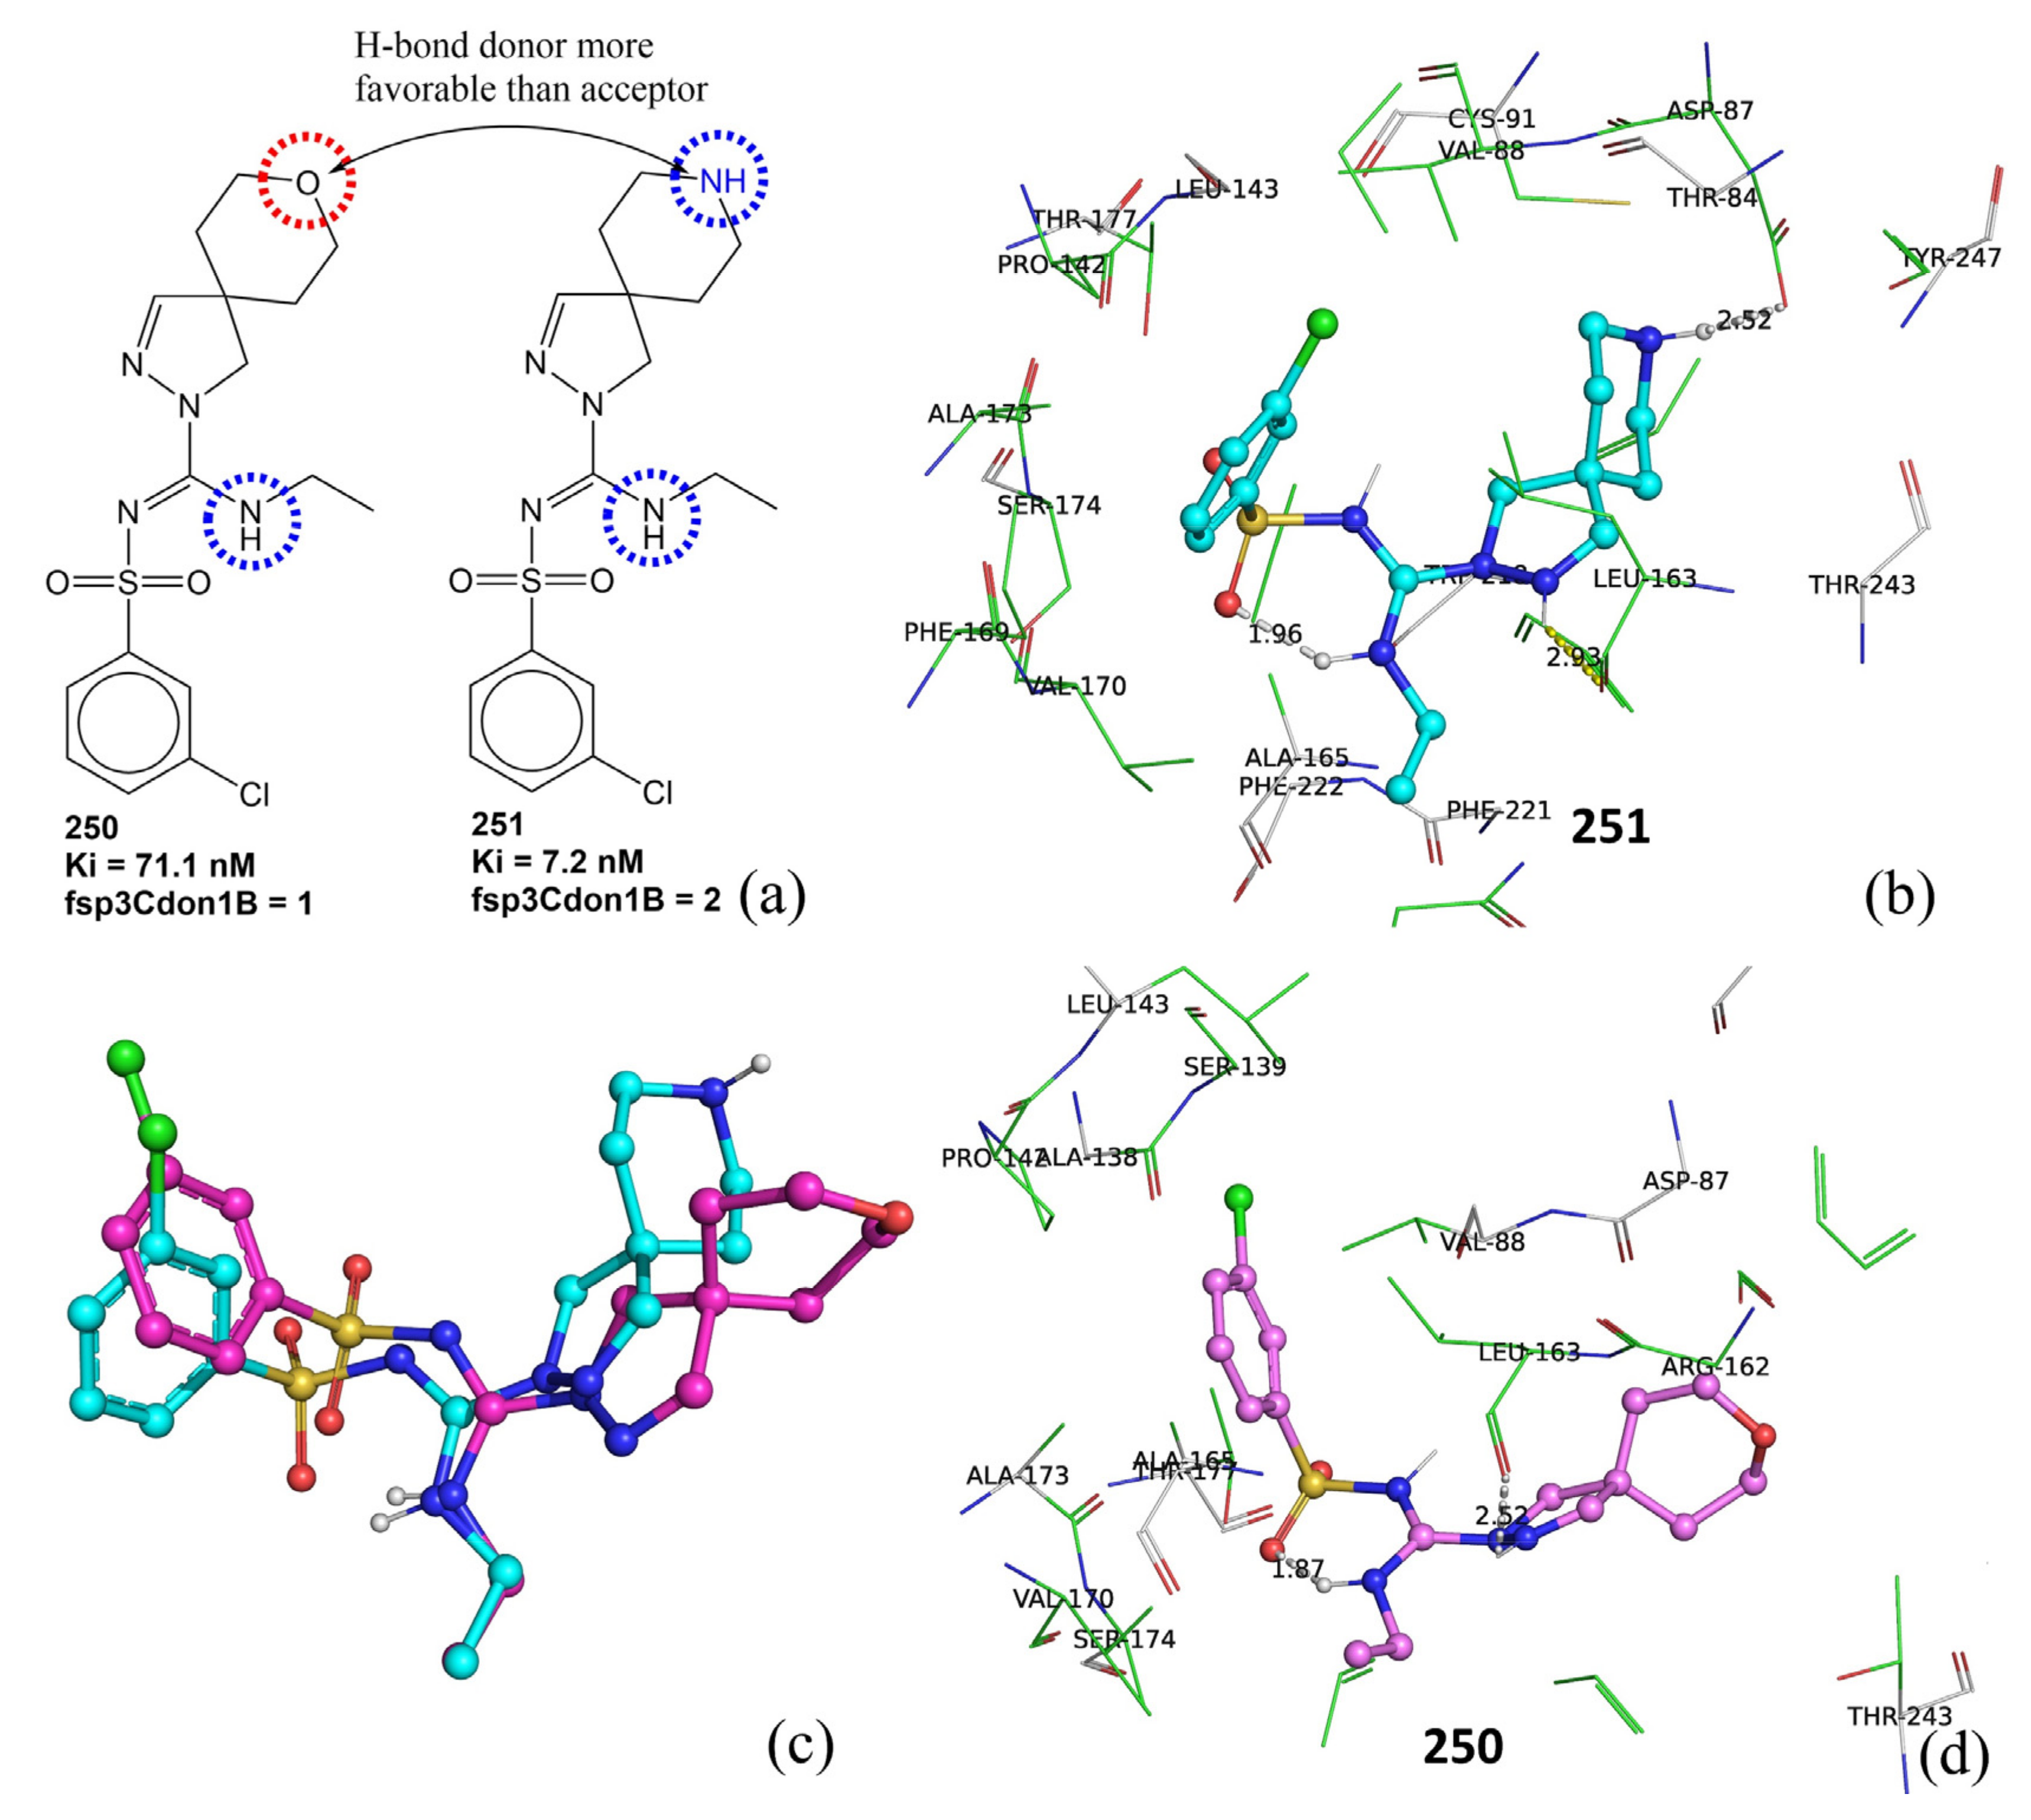
| fsp3Cdon1B | Frequency of occurrence of H-bond donor atom bonded with sp3-hybridized carbon atom | PyDescriptor | 0.026 |
| Parameter | Value | Parameter | Value |
|---|---|---|---|
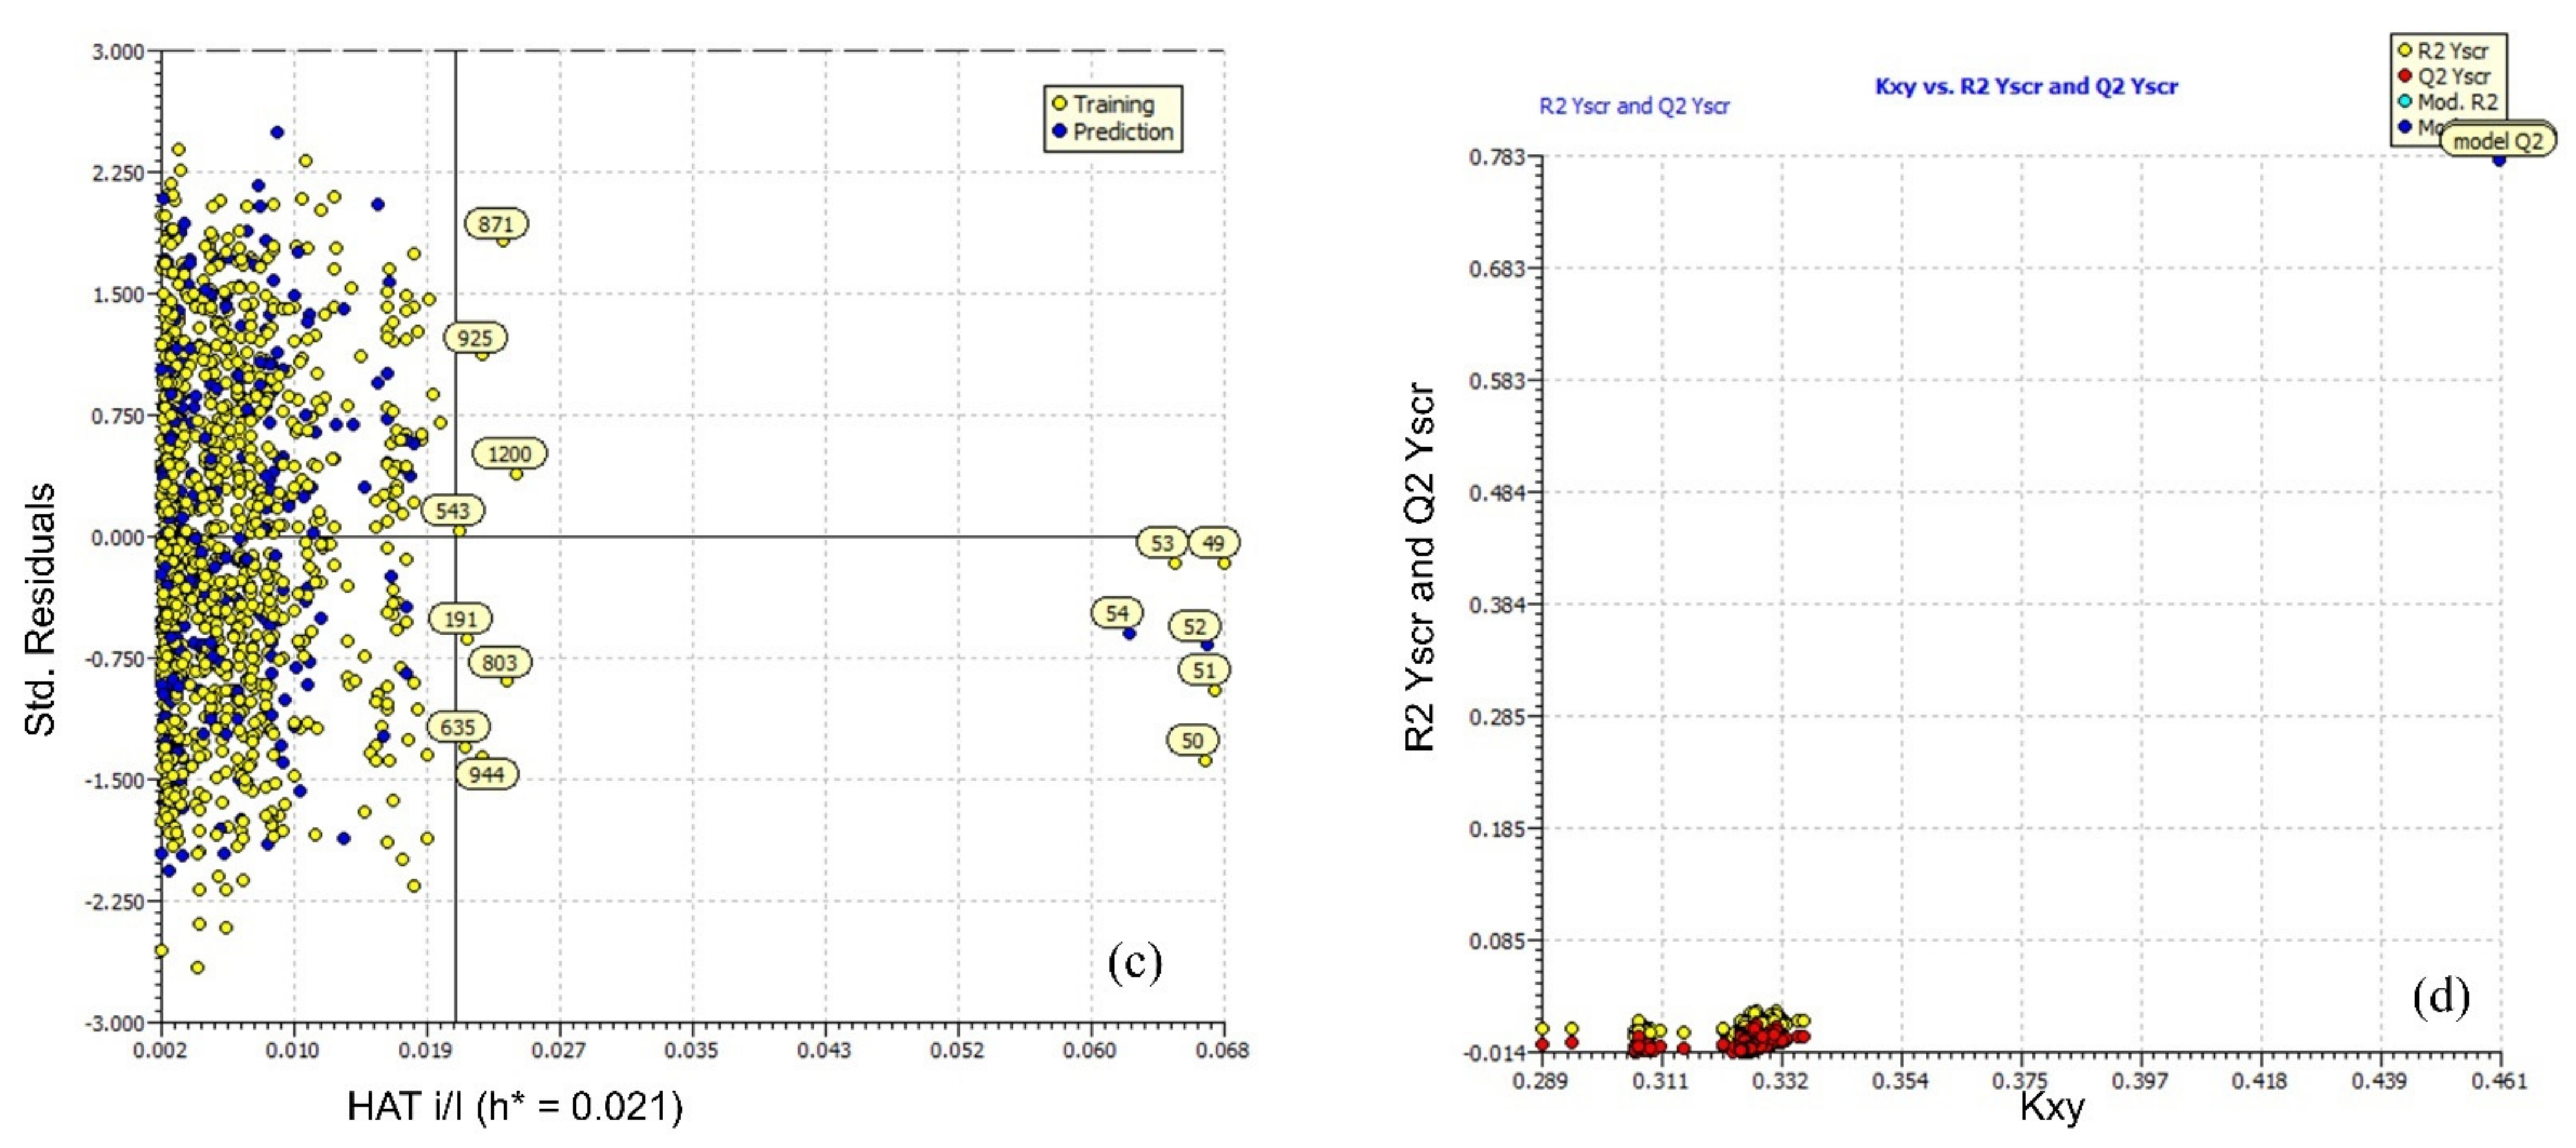
| R2tr | 0.783 | Q2LMO | 0.779 |
| R2adj. | 0.781 | R2Yscr | 0.006 |
| RMSEtr | 0.419 | RMSEex | 0.425 |
| MAEtr | 0.350 | MAEex | 0.357 |
| CCCtr | 0.878 | R2ex | 0.772 |
| R2cv (Q2loo) | 0.780 | Q2-F1 | 0.768 |
| RMSEcv | 0.422 | Q2-F2 | 0.768 |
| MAEcv | 0.352 | Q2-F3 | 0.777 |
| CCCcv | 0.876 | CCCex | 0.871 |
| Molecule Number | SMILES | Ki (nM) | Affinity- Docking Score (Kcal/mol) |
|---|---|---|---|
| 741 | CC(=O)Nc(cc1)ccc1CCNICC2Cc(c23)ccc4c3ccn4S(=O)(=O)c5ccccc5 | 79.43 | −12.2 |
| 134 | C1NCCCC1C(=O)Nc(ccc2)c(c23)[nH]nc3S(=O)(=O)c4cccc(c45)cccc5 | 9.8 | −12 |
| 489 | c1cccc(c12)[nH]cc2C(C3=O)CC(=O)N3CCCN(CC4)CCC4c5c[nH]c(c56)ccc(c6)OC | 264 | −11.9 |
| 490 | c1cccc(c12)[nH]cc2C(C3=O)CC(=O)N3CCN(CC4)CCC4c5c[nH]c(c56)ccc(F)c6 | 1146 | −11.8 |
| 1093 | CC(=O)Nc(n1)[nH]c(c1C)-c2cn(c(c23)cccc3)S(=O)(=O)c4cccc(c45)cccc5 | 13 | −11.7 |
| 668 | CI(C)CCC1c2c[nH]c(c23)ccc(c3)NS(=O)(=O)c(ccc4)c(c45)nccc5 | 21.2 | −11.7 |
| 133 | C1CCCCN1CCC(=O)Nc(ccc2)c(c23)[nH]nc3S(=O)(=O)c4cccc(c45)cccc5 | 24 | −11.7 |
| 381 | FC(F)(F)c1cc(ccc1)S(=O)(=O)n(c(c2c34)CCC(C2)N)c3ccc(c4)OC | 39.1 | −11.7 |
| 805 | c1cccc(c12)ccc(c2)S(=O)(=O)NCCN(CC3)CC=C3c4c[nH]c(c45)ccc(F)c5 | 67 | −11.7 |
| 628 | c1cccc(c12)CN([C@@H](C2)C(=O)N)C(=O)CCCCN3CCN(CC3)c(cccc4)c4-c5ccccc5 | 594 | −11.7 |
| 1086 | CCn1cncc1-c2c[nH]c(c23)ccc(Br)c3 | 1349 | −7.3 |
| 1016 | CCn1cncc1-c2c[nH]c(c23)cccc3 | 3020 | −7.3 |
| 1203 | N1CCC[C@@H]1Cc2c[nH]c(c23)cccc3 | 60 | −7.2 |
| 1202 | c1cccc(c12)n(cc2)C[C@H]3CCCN3C | 550 | −7.2 |
| 339 | NCCc1cc(ccc1)Sc2ccccc2 | 115 | −7.1 |
| 93 | CCN(CC)CCc1c[nH]c(c12)cccc2 | 575 | −6.4 |
| 738 | NCCc1c[nH]c(c12)ccc(c2)O | 42.333 | −6.2 |
| 534 | CC(N)Cc1c[nH]c(c12)cccc2 | 910.505 | −6.2 |
| 444 | NCCc1c[nH]c(c12)ccnc2 | 64 | −5.7 |
| 445 | CN(C)CCc1c[nH]c(c12)ccnc2 | 100 | −5.7 |
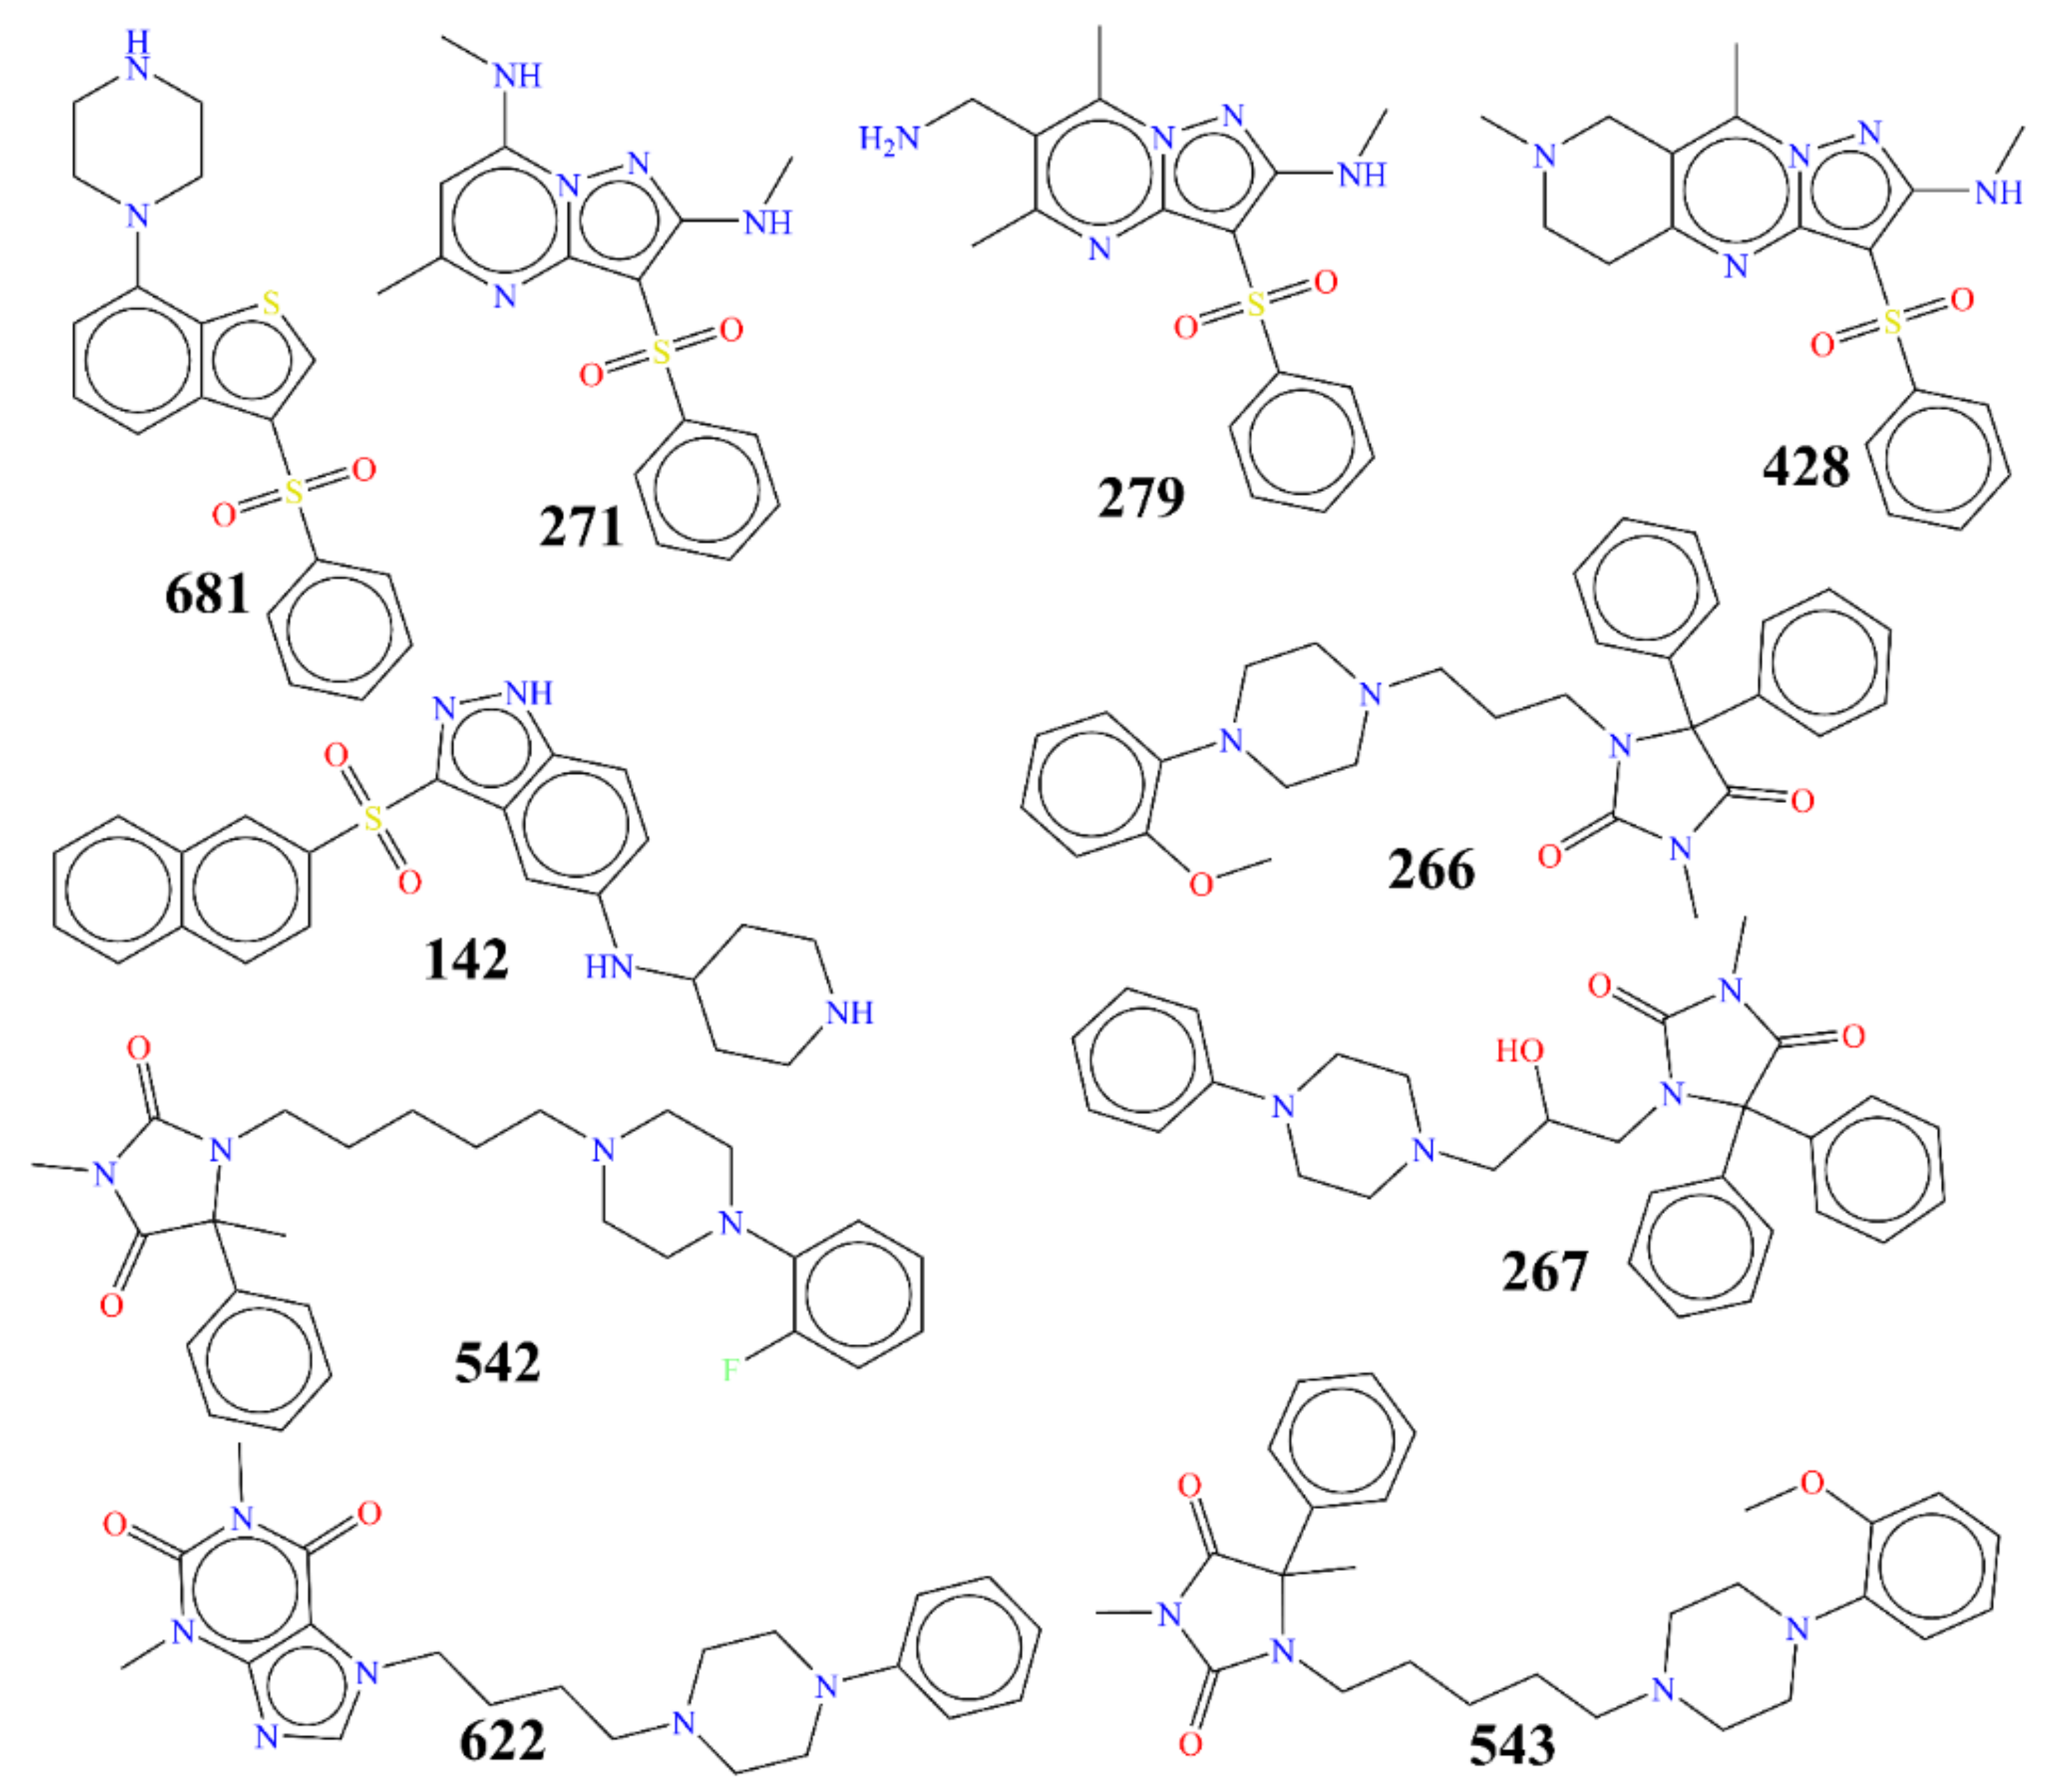
| Molecule Number | SMILES (Simplified Molecular Input Line Entry System) Notation | Ki(nM) | pKi(M) | Docking Score (Kcal/mol) |
|---|---|---|---|---|
| 681 | C1CNCCN1c(ccc2)c(c23)scc3S(=O)(=O)c4ccccc4 | 0.5006 | 9.301 | −9 |
| 271 | Cc(n1)cc(NC)n(c12)nc(NC)c2S(=O)(=O)c3ccccc3 | 0.5754 | 9.24 | −8.3 |
| 142 | C1CNCCC1Nc(c2)ccc(c23)[nH]nc3S(=O)(=O)c(c4)ccc(c45)cccc5 | 0.6 | 9.222 | −10.8 |
| 279 | Cc(n1)IN)c(C)n(c12)nc(NC)c2S(=O)(=O)c3ccccc3 | 0.6457 | 9.19 | −8.4 |
| 428 | CN(C1)CIn2)c1c(C)n(c23)nc(NC)c3S(=O)(=O)c4ccccc4 | 0.66 | 9.18 | −9.1 |
| 622 | O=I(C)c(=O)n(C)c(c12)ncn2CCCCN3CCN(CC3)c4ccccc4 | 14210 | 4.847 | −9.6 |
| 543 | c1cccc(OC)c1N(CC2)CCICCCCI(=O)N(C)C(=O)C3(C)c4ccccc4 | 14650 | 4.834 | −10.1 |
| 267 | c1ccccc1N(CICCN2CC(O)CN3C(=O)N(C)C(=O)C3(c4ccccc4)c5ccccc5 | 20410 | 4.69 | −9.7 |
| 542 | c1cccc(F)cICC2)I2CCCCCN3C(=O)N(C)C(=O)C3(C)c4ccccc4 | 25520 | 4.593 | −10.1 |
| 266 | c1cI(OC)c1N(CC2)CCN2CCCN3C(=O)N(C)C(=O)C3(c4ccccc4)c5ccccc5 | 29070 | 4.537 | −10.8 |
Publisher’s Note: MDPI stays neutral with regard to jurisdictional claims in published maps and institutional affiliations. |
© 2022 by the authors. Licensee MDPI, Basel, Switzerland. This article is an open access article distributed under the terms and conditions of the Creative Commons Attribution (CC BY) license (https://creativecommons.org/licenses/by/4.0/).
Share and Cite
Bukhari, S.N.A.; Elsherif, M.A.; Junaid, K.; Ejaz, H.; Alam, P.; Samad, A.; Jawarkar, R.D.; Masand, V.H. Perceiving the Concealed and Unreported Pharmacophoric Features of the 5-Hydroxytryptamine Receptor Using Balanced QSAR Analysis. Pharmaceuticals 2022, 15, 834. https://doi.org/10.3390/ph15070834
Bukhari SNA, Elsherif MA, Junaid K, Ejaz H, Alam P, Samad A, Jawarkar RD, Masand VH. Perceiving the Concealed and Unreported Pharmacophoric Features of the 5-Hydroxytryptamine Receptor Using Balanced QSAR Analysis. Pharmaceuticals. 2022; 15(7):834. https://doi.org/10.3390/ph15070834
Chicago/Turabian StyleBukhari, Syed Nasir Abbas, Mervat Abdelaziz Elsherif, Kashaf Junaid, Hasan Ejaz, Pravej Alam, Abdul Samad, Rahul D. Jawarkar, and Vijay H. Masand. 2022. "Perceiving the Concealed and Unreported Pharmacophoric Features of the 5-Hydroxytryptamine Receptor Using Balanced QSAR Analysis" Pharmaceuticals 15, no. 7: 834. https://doi.org/10.3390/ph15070834