
Fluorine-18 Labeled Urea-Based Ligands Targeting Prostate-Specific Membrane Antigen (PSMA) with Increased Tumor and Decreased Renal Uptake

Abstract
:
1. Introduction
2. Results
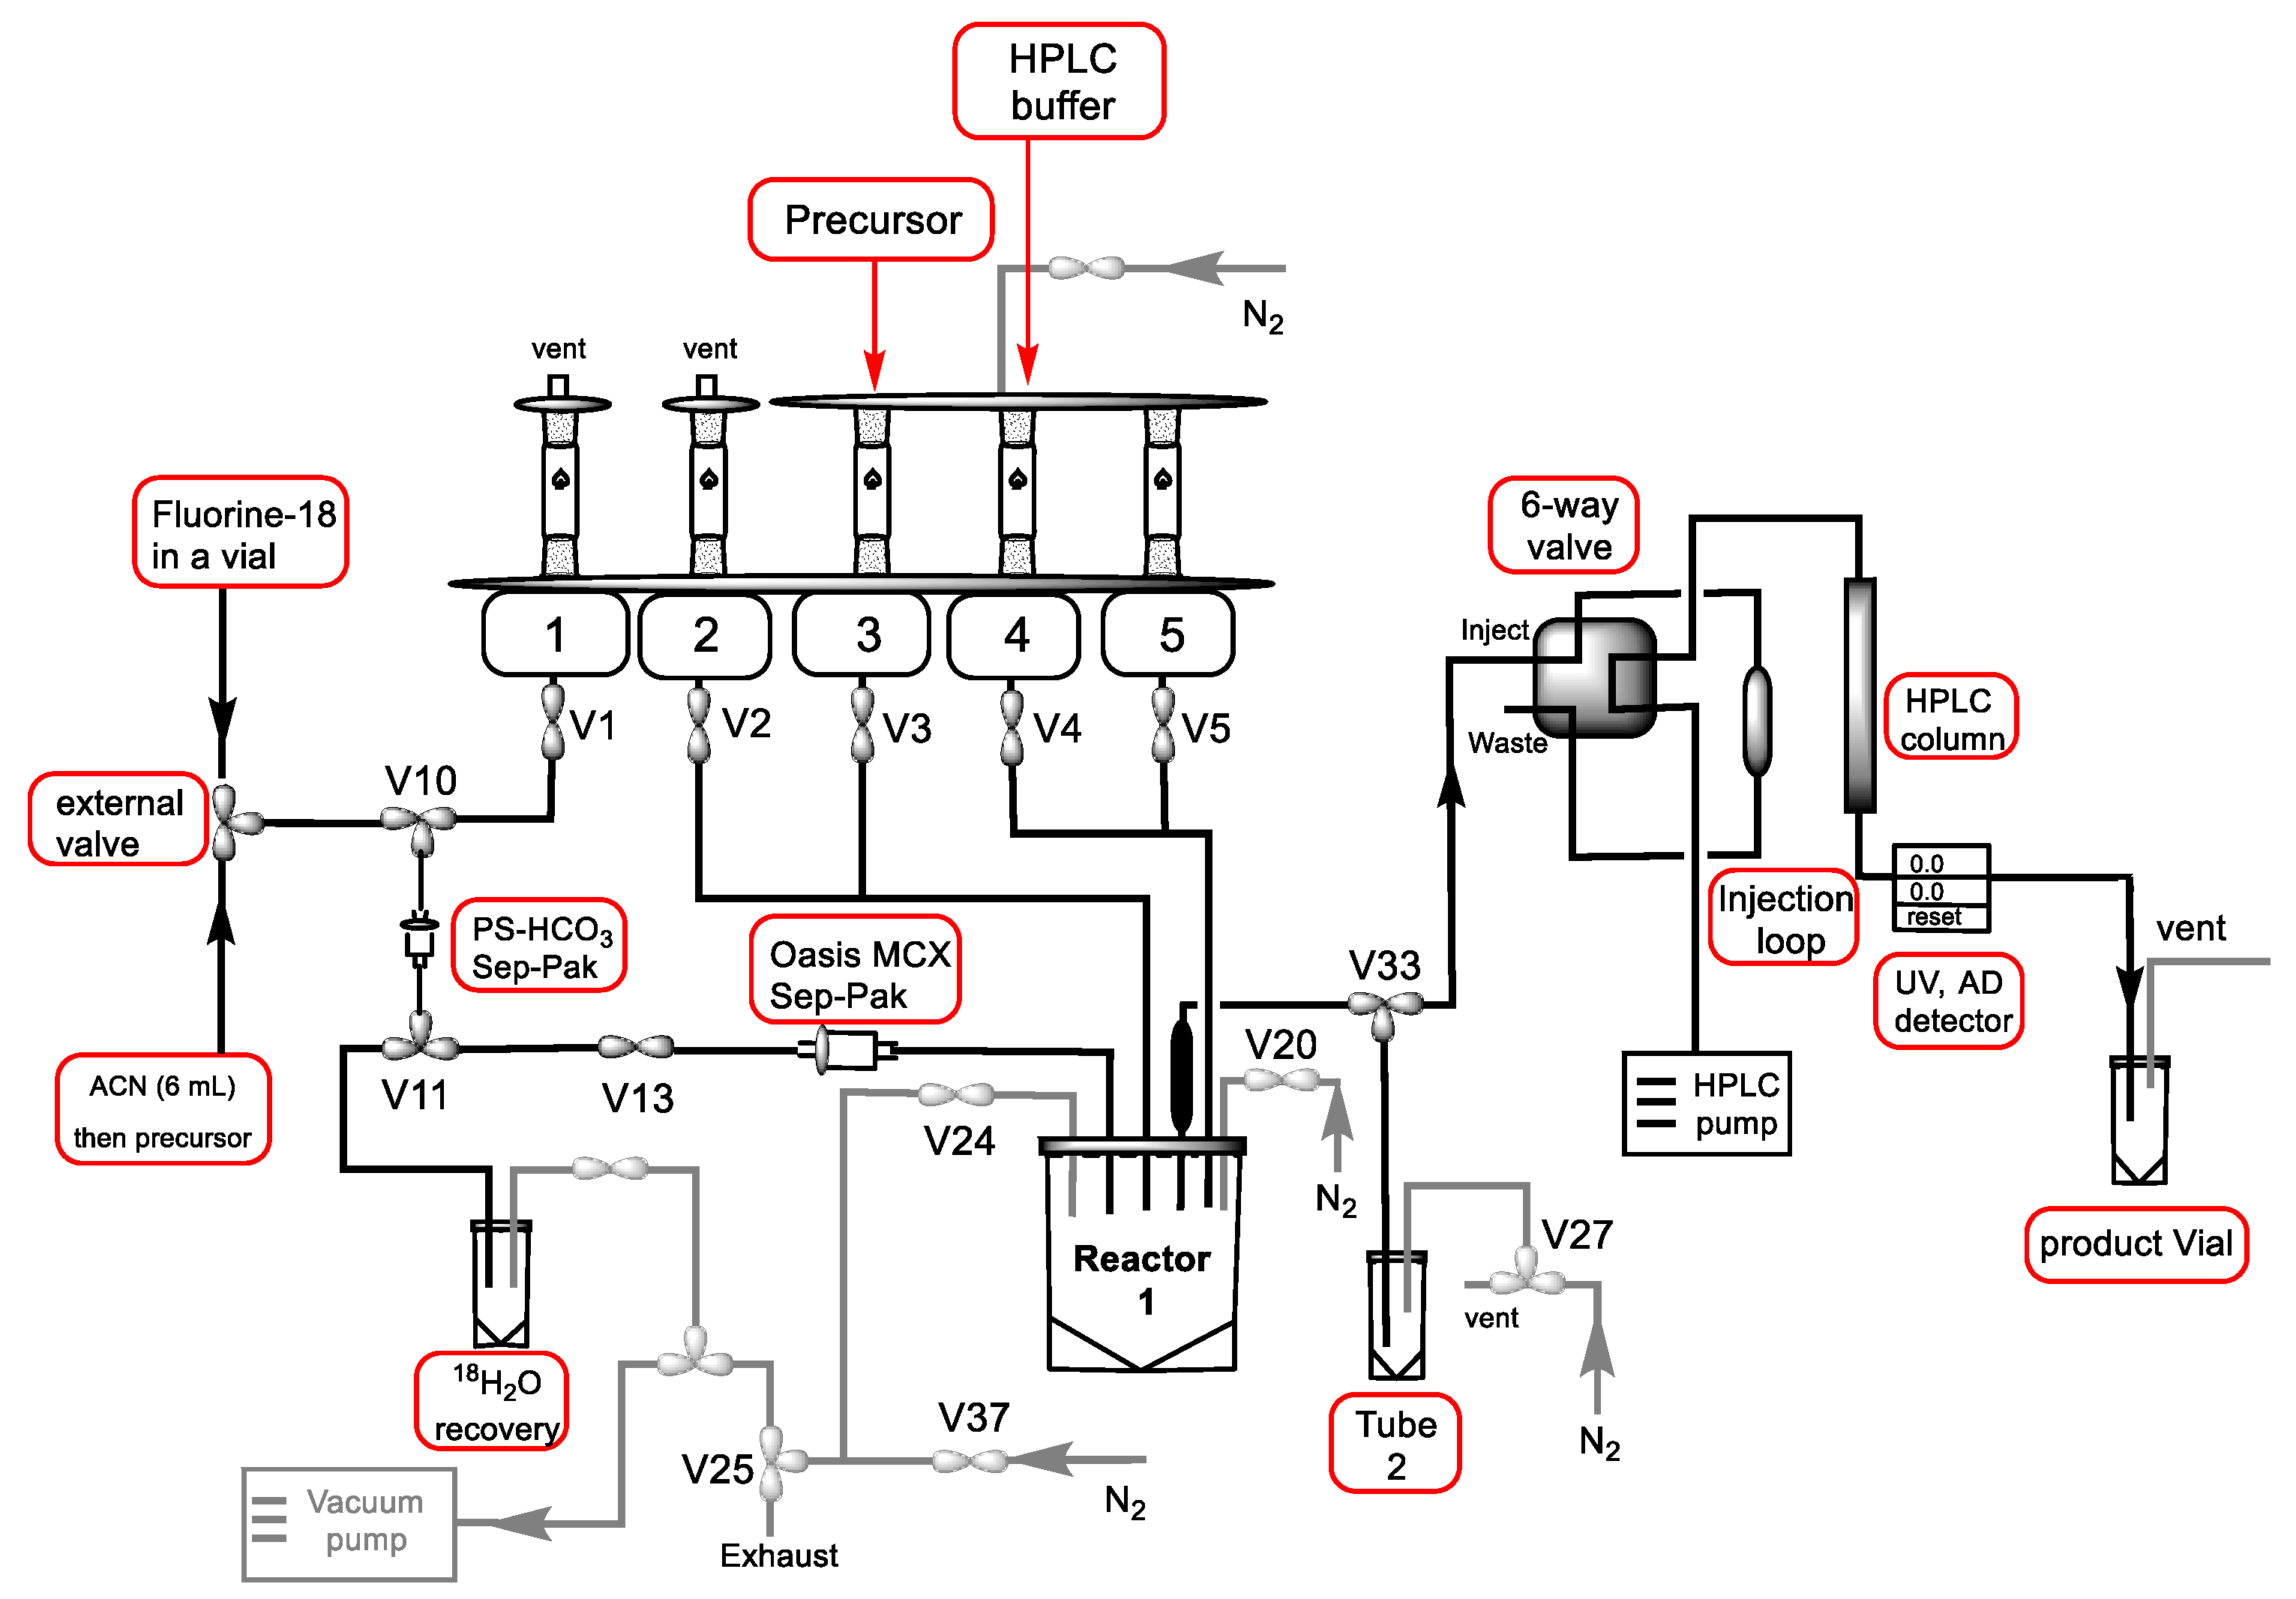
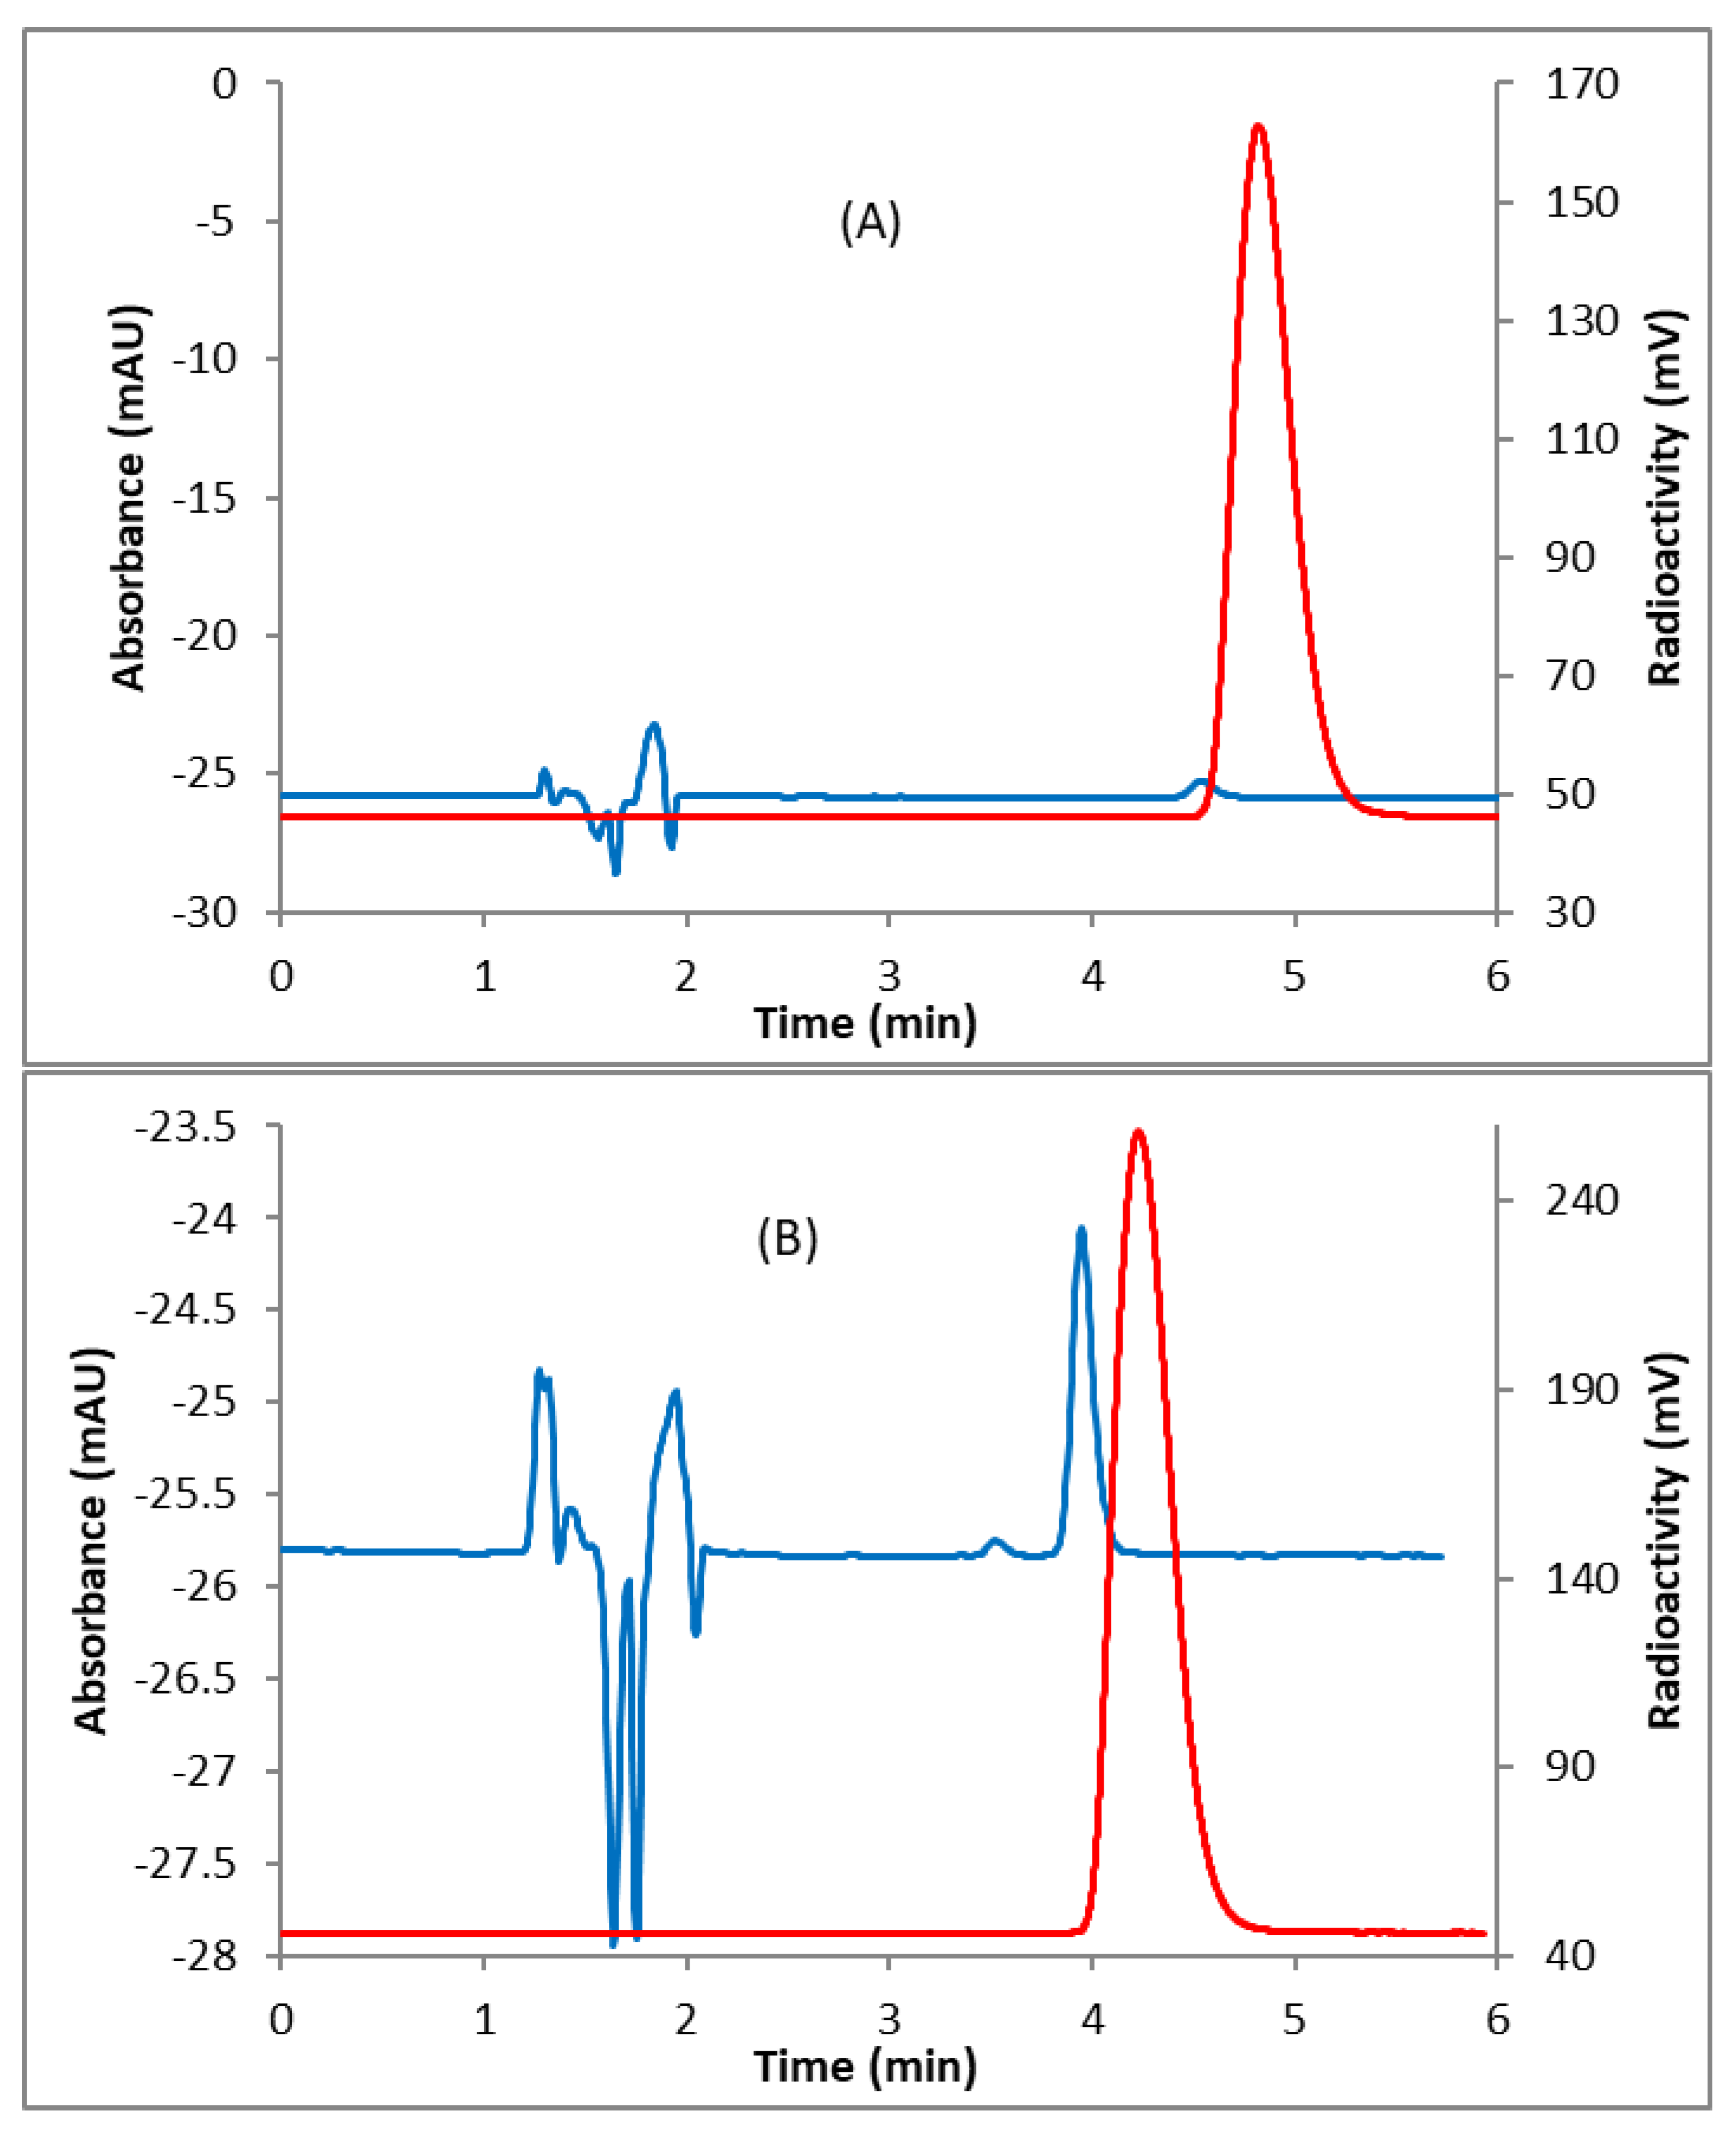
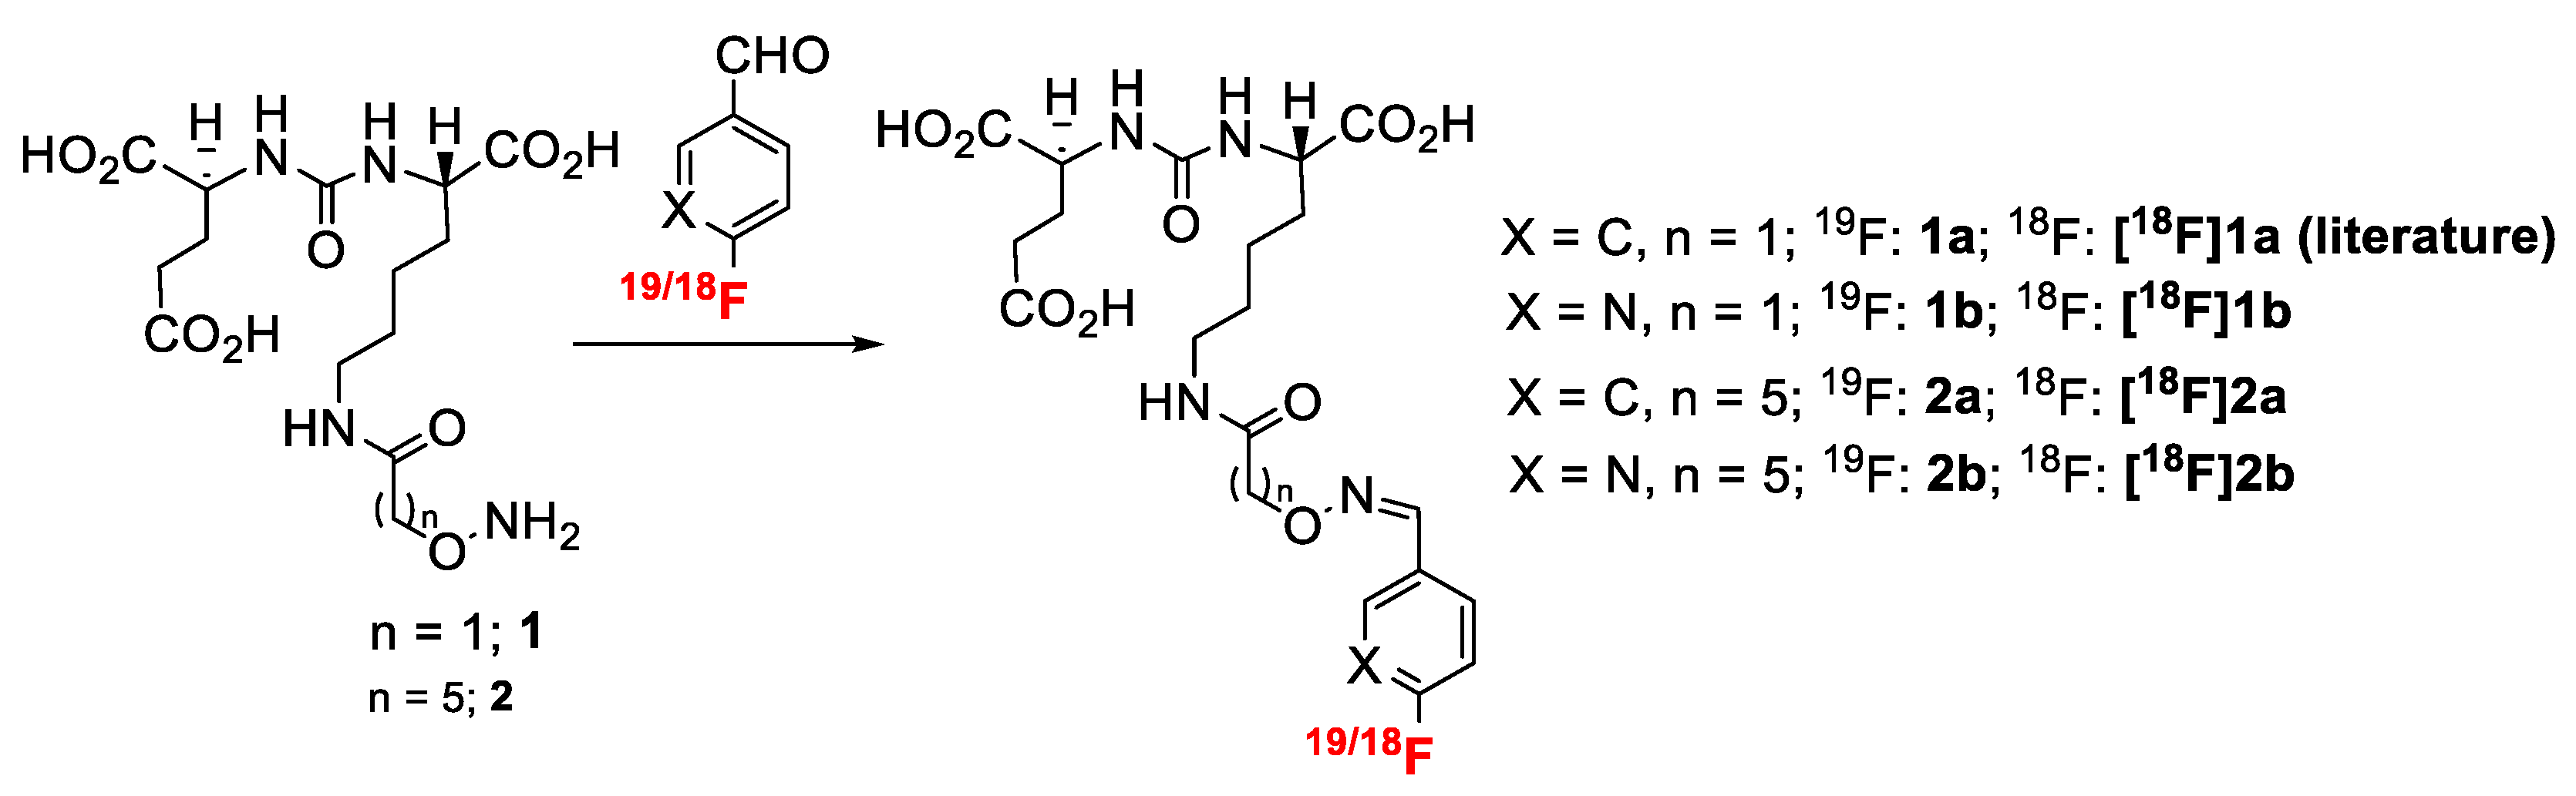
2.1. Radiochemistry
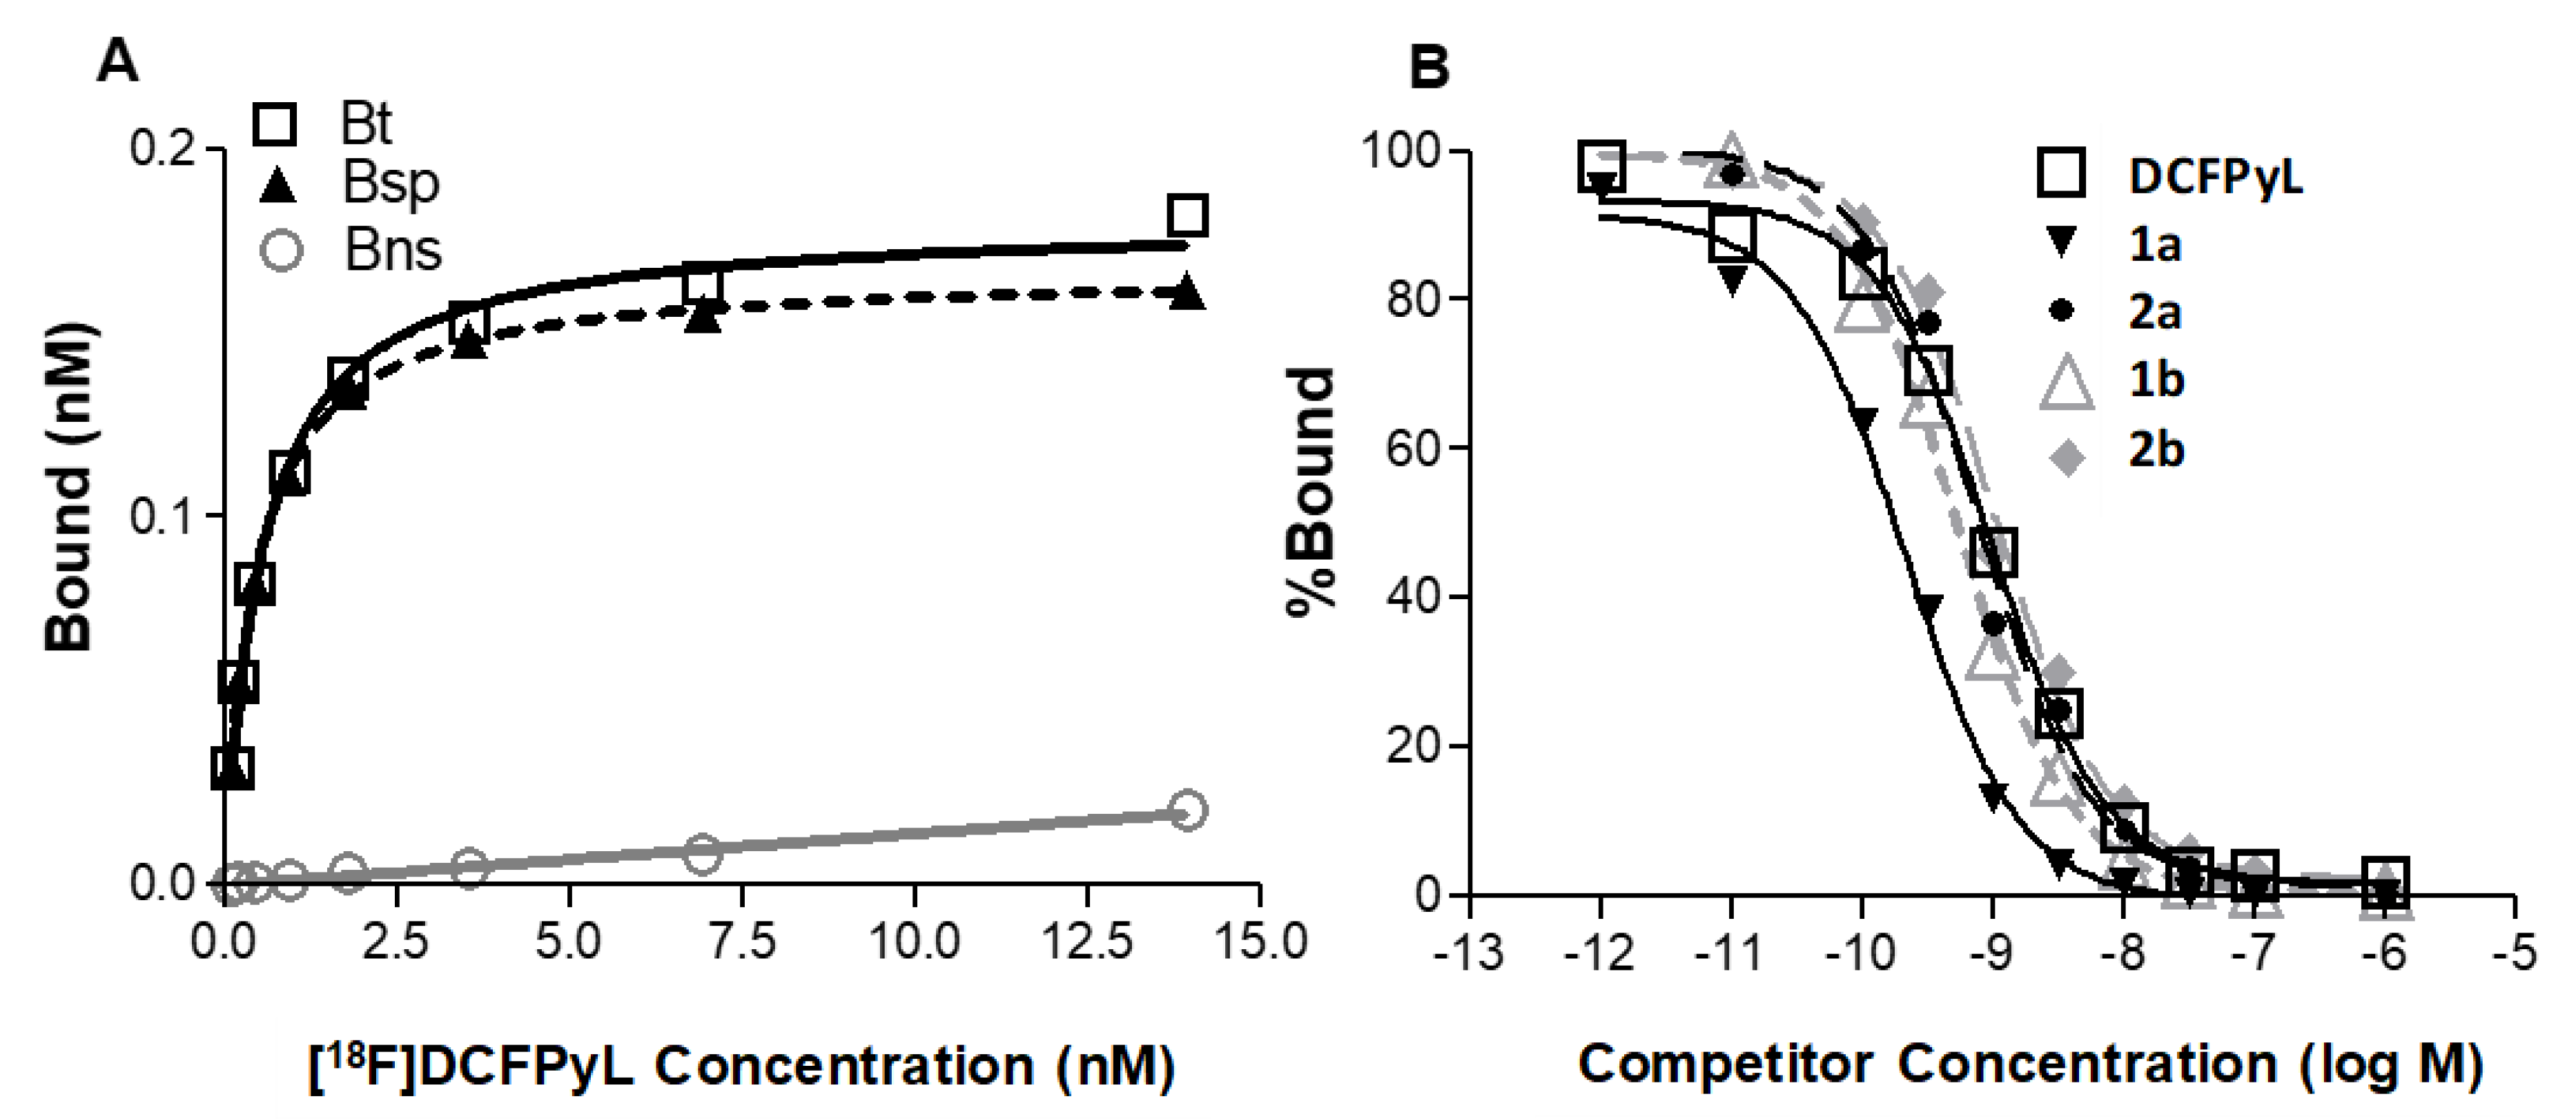
2.2. In Vitro Cell Binding Studies
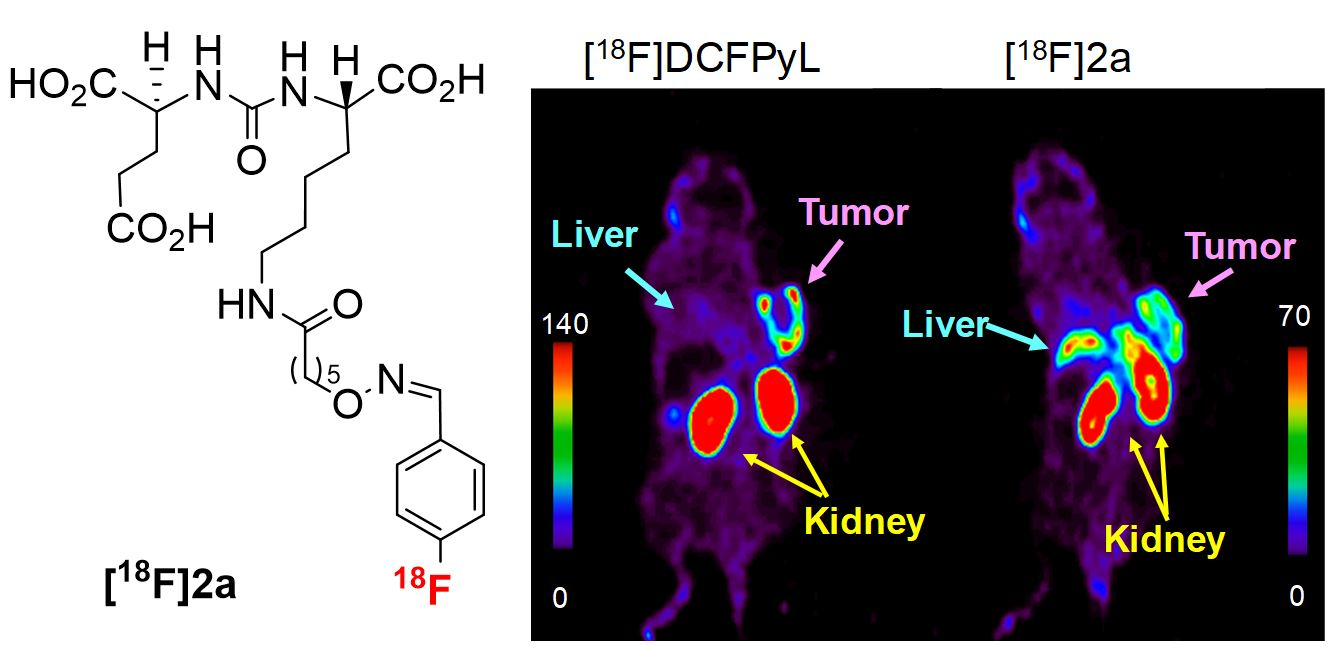
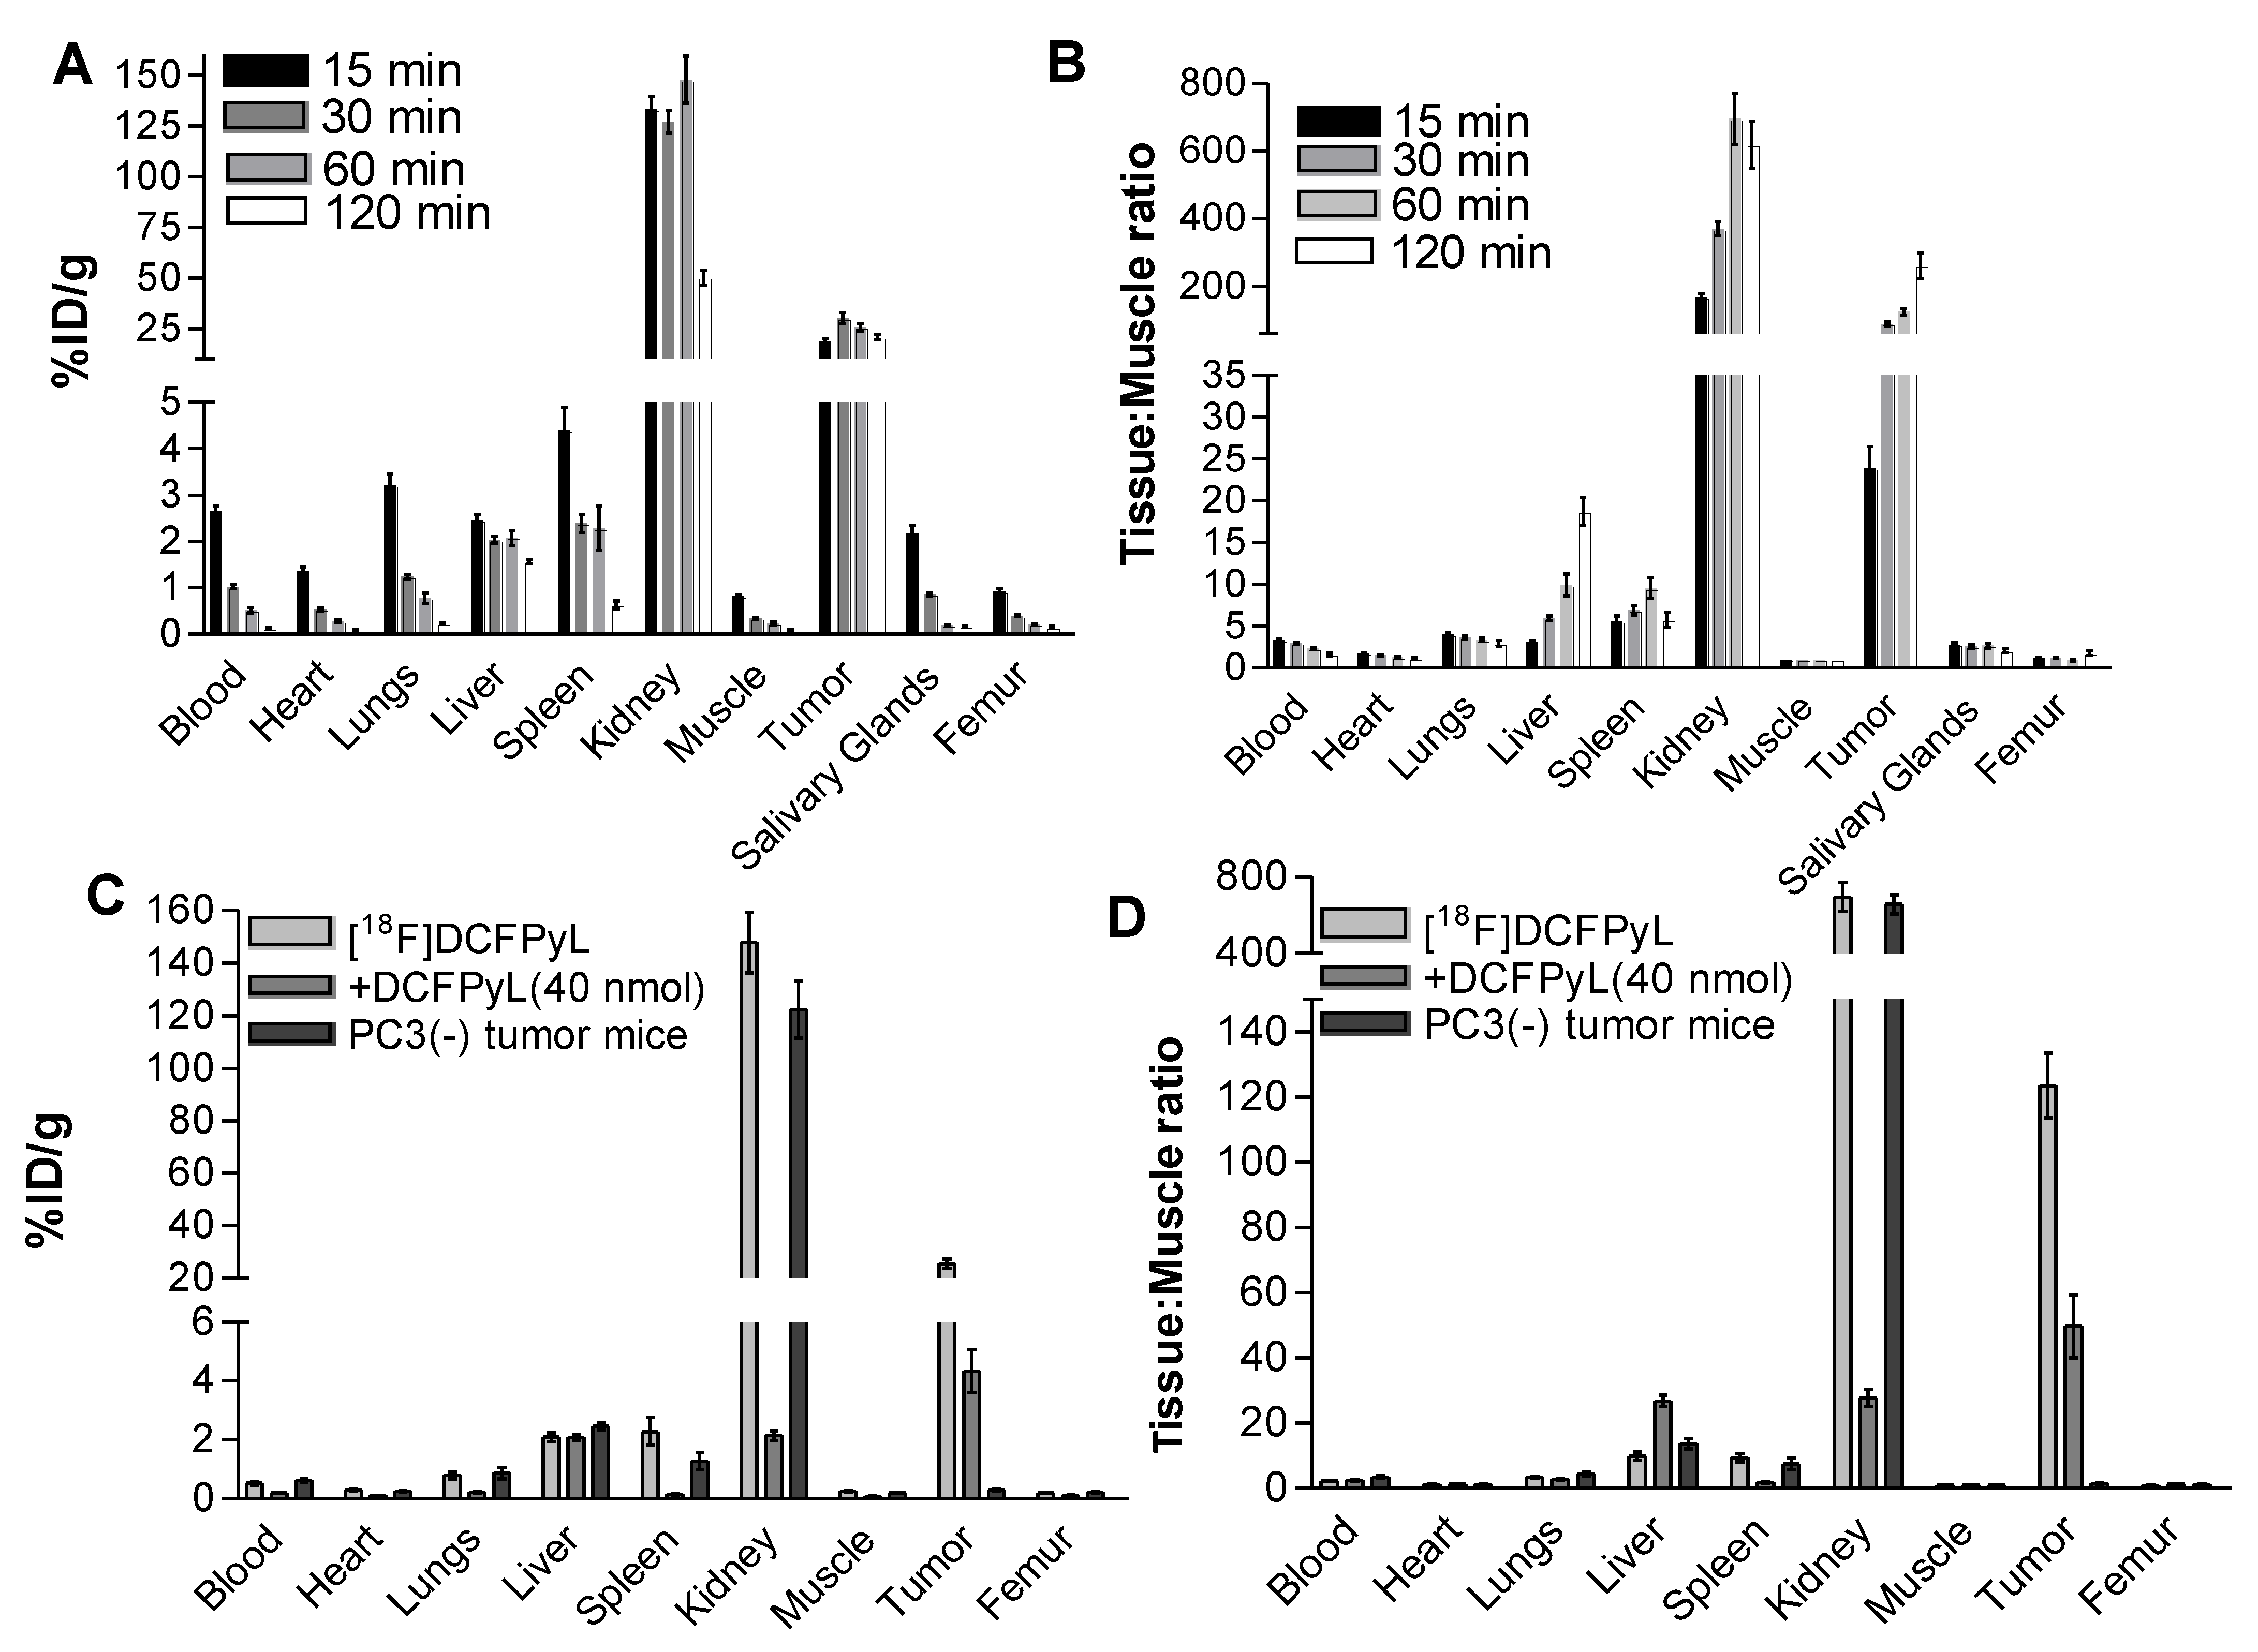
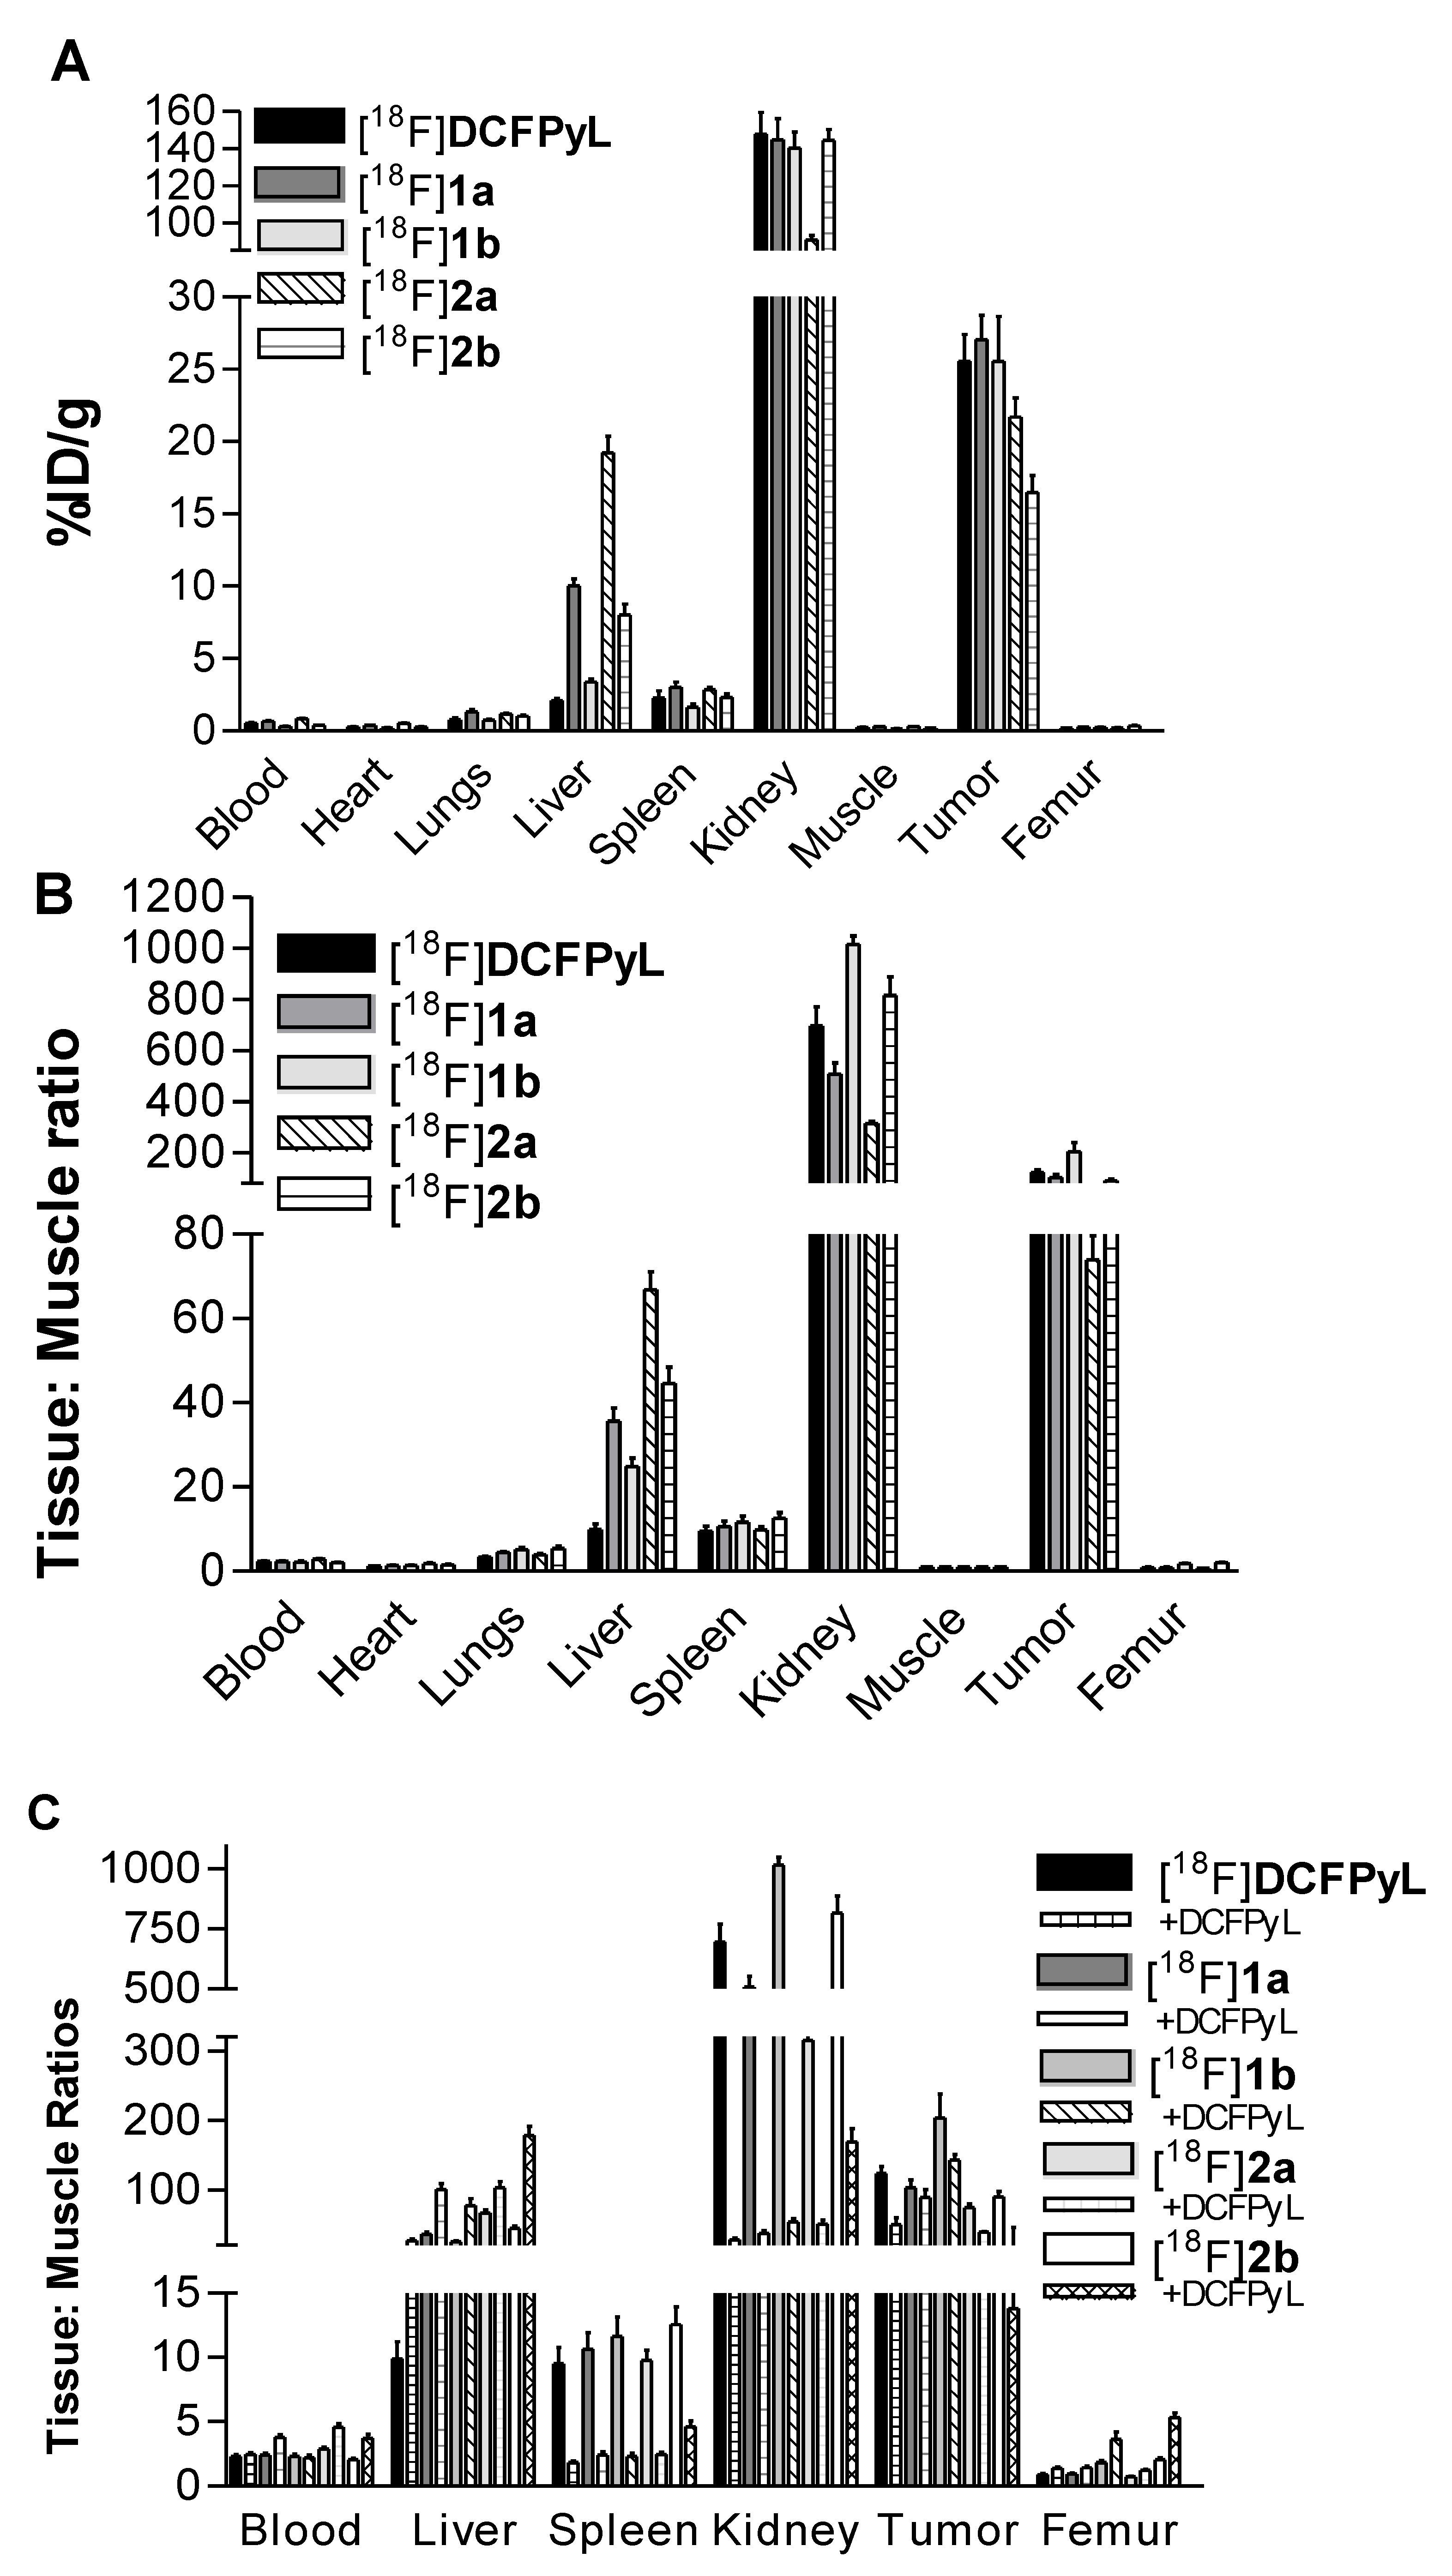
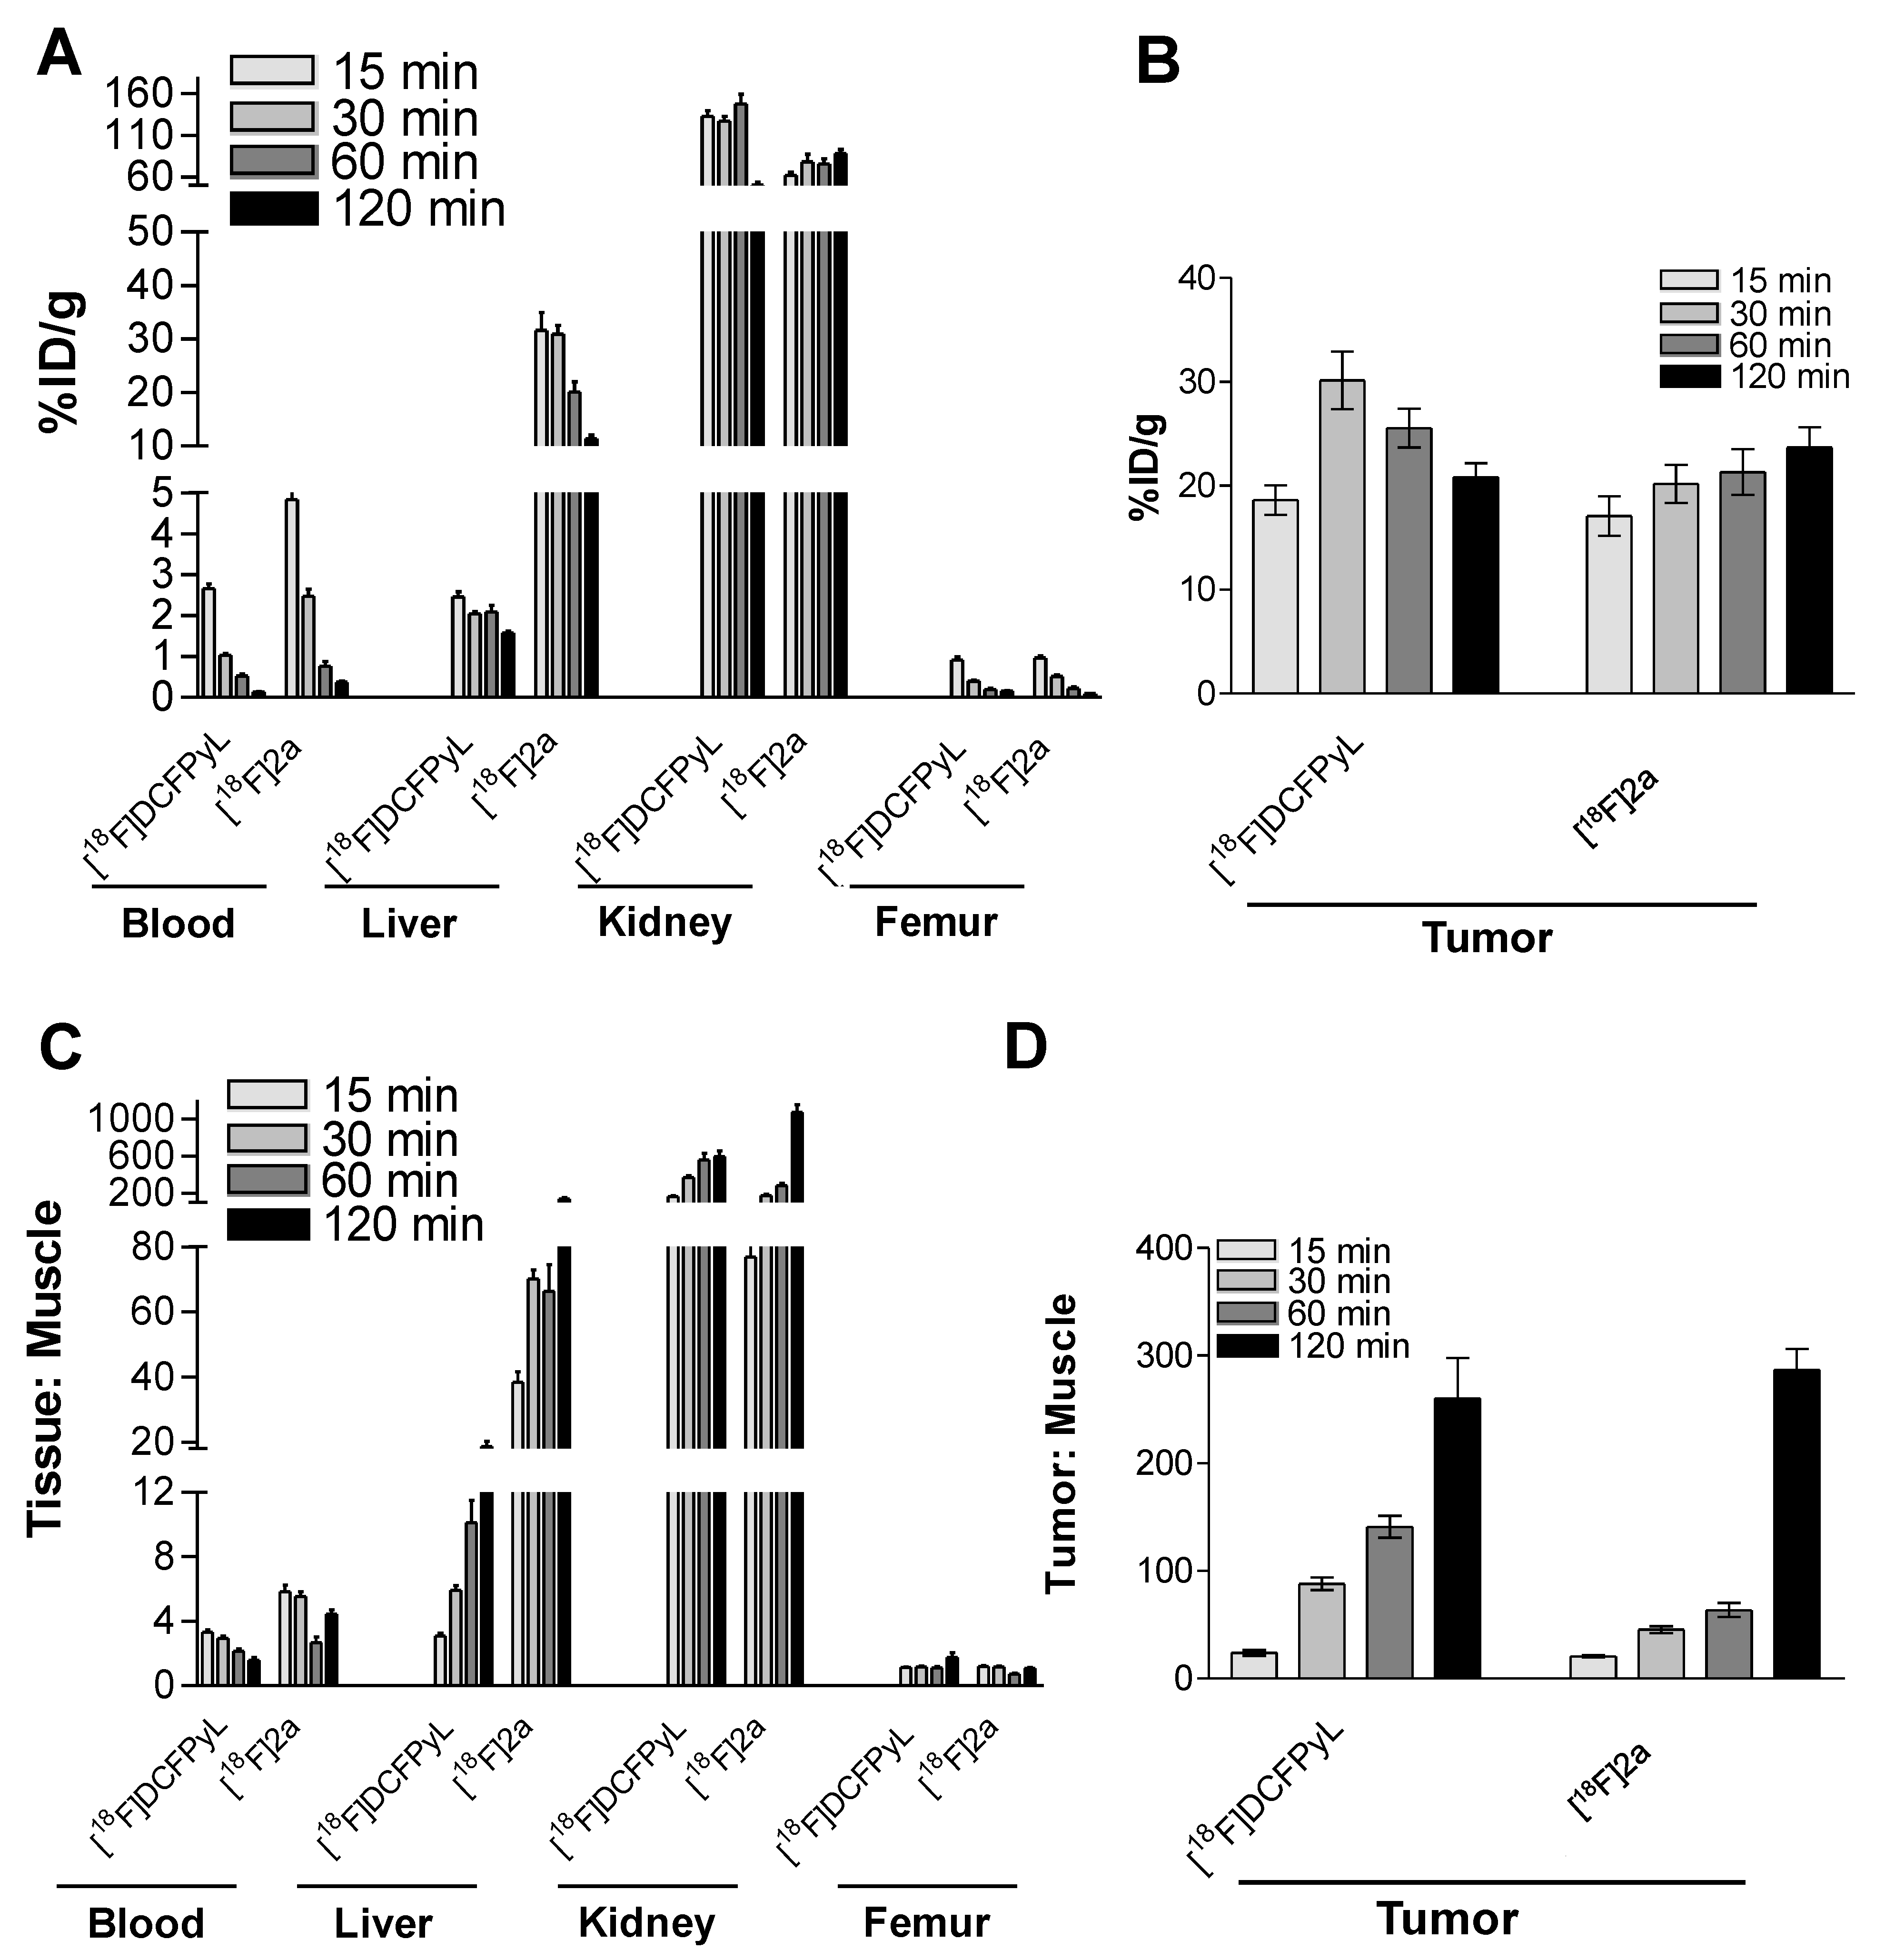
2.3. In Vivo Biodistribution
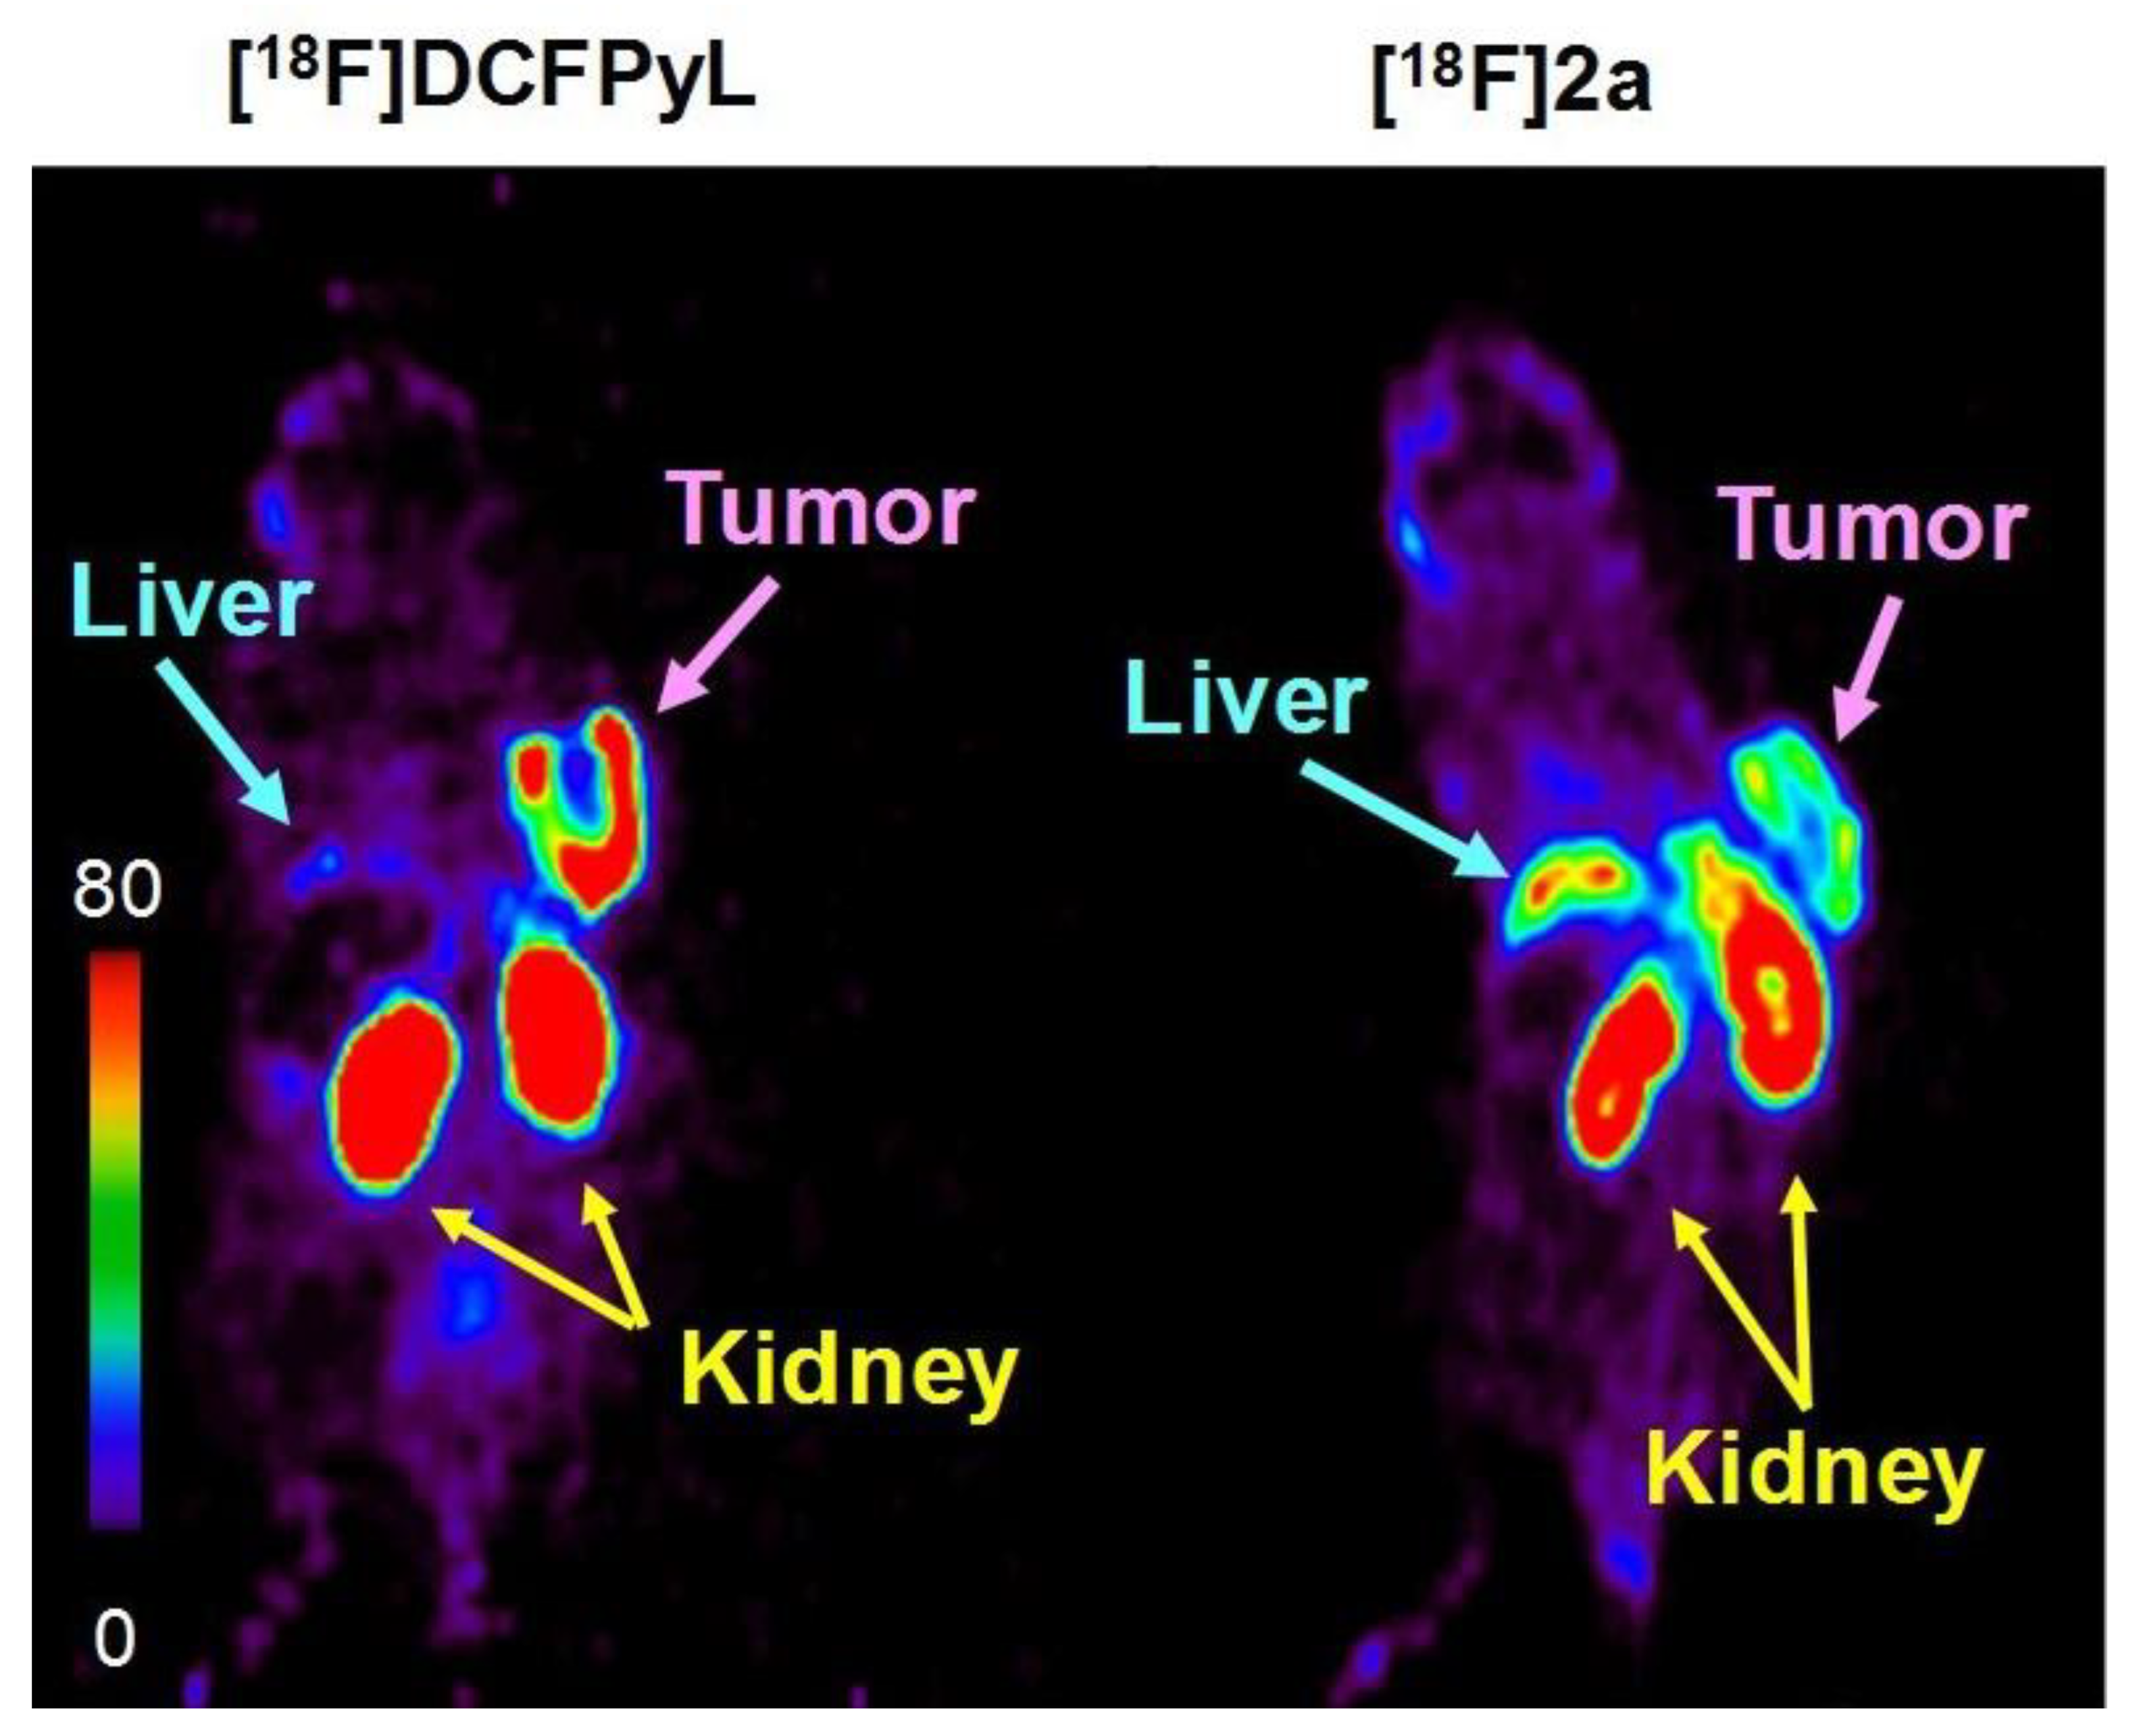
2.4. PET Imaging Studies
3. Discussion
4. Materials and Methods
4.1. Precursor and Non-Radioactive Standard
4.1.1. (((. S)-5-(6-(Aminooxy)hexanamido)-1-carboxypentyl)carbamoyl)-L-glutamic acid (2)
4.1.2. (((. S)-5-(6-(Aminooxy)hexanamido)-1-carboxypentyl)carbamoyl)-L-glutamic acid 4-fluorobenzaldehyde oxime (2a)
4.1.3. (((. S)-5-(6-(Aminooxy)hexanamido)-1-carboxypentyl)carbamoyl)-L-glutamic acid 6-fluoronicotinaldehyde oxime (2b)
4.2. Radiochemical Syntheses
General Method
4.3. Lipophilicity
4.4. Cell Lines and Human Tumor Xenograft Mouse Models
4.5. In Vitro Binding Studies
4.6. Biodistributions
4.7. PET Imaging Studies
5. Conclusions
Author Contributions
Funding
Institutional Review Board Statement
Informed Consent Statement
Data Availability Statement
Conflicts of Interest
References
- Rawla, P. Epidemiology of Prostate Cancer. World J. Oncol. 2019, 10, 63–89. [Google Scholar] [CrossRef] [PubMed] [Green Version]
- Mirzaei-Alavijeh, M.; Ahmadi-Jouybari, T.; Vaezi, M.; Jalilian, F. Prevalence, Cognitive and Socio-Demographic Determinants of Prostate Cancer Screening. Asian Pac. J. Cancer Prev. 2018, 19, 1041–1046. [Google Scholar] [CrossRef] [PubMed]
- Vellky, J.E.; Ricke, W.A. Development and prevalence of castration-resistant prostate cancer subtypes. Neoplasia 2020, 22, 566–575. [Google Scholar] [CrossRef] [PubMed]
- Jadvar, H. Molecular imaging of prostate cancer with 18F-fluorodeoxyglucose PET. Nat. Rev. Urol. 2009, 6, 317–323. [Google Scholar] [CrossRef] [Green Version]
- Minamimoto, R.; Senda, M.; Jinnouchi, S.; Terauchi, T.; Yoshida, T.; Murano, T.; Fukuda, H.; Iinuma, T.; Uno, K.; Nishizawa, S.; et al. The current status of an FDG-PET cancer screening program in Japan, based on a 4-year (2006–2009) nationwide survey. Ann. Nucl. Med. 2013, 27, 46–57. [Google Scholar] [CrossRef] [Green Version]
- Mapelli, P.; Incerti, E.; Ceci, F.; Castellucci, P.; Fanti, S.; Picchio, M. 11C- or 18F-Choline PET/CT for Imaging Evaluation of Biochemical Recurrence of Prostate Cancer. J. Nucl. Med. 2016, 57, 43s–48s. [Google Scholar] [CrossRef] [Green Version]
- Ceci, F.; Fanti, S. PSMA-PET/CT imaging in prostate cancer: Why and when. Clin. Transl. Imaging 2019, 7, 377–379. [Google Scholar] [CrossRef] [Green Version]
- Hupe, M.C.; Philippi, C.; Roth, D.; Kümpers, C.; Ribbat-Idel, J.; Becker, F.; Joerg, V.; Duensing, S.; Lubczyk, V.H.; Kirfel, J.; et al. Expression of Prostate-Specific Membrane Antigen (PSMA) on Biopsies Is an Independent Risk Stratifier of Prostate Cancer Patients at Time of Initial Diagnosis. Front. Oncol. 2018, 8, 623. [Google Scholar] [CrossRef]
- Queisser, A.; Hagedorn, S.A.; Braun, M.; Vogel, W.; Duensing, S.; Perner, S. Comparison of different prostatic markers in lymph node and distant metastases of prostate cancer. Mod. Pathol. 2015, 28, 138–145. [Google Scholar] [CrossRef]
- Wang, F.; Li, Z.; Feng, X.; Yang, D.; Lin, M. Advances in PSMA-targeted therapy for prostate cancer. Prostate Cancer Prostatic Dis. 2022, 25, 11–26. [Google Scholar] [CrossRef]
- Awenat, S.; Piccardo, A.; Carvoeiras, P.; Signore, G.; Giovanella, L.; Prior, J.O.; Treglia, G. Diagnostic Role of 18F-PSMA-1007 PET/CT in Prostate Cancer Staging: A Systematic Review. Diagnostics 2021, 11, 552. [Google Scholar] [CrossRef] [PubMed]
- Farolfi, A.; Calderoni, L.; Mattana, F.; Mei, R.; Telo, S.; Fanti, S.; Castellucci, P. Current and Emerging Clinical Applications of PSMA PET Diagnostic Imaging for Prostate Cancer. J. Nucl. Med. 2021, 62, 596–604. [Google Scholar] [CrossRef] [PubMed]
- Afshar-Oromieh, A.; Malcher, A.; Eder, M.; Eisenhut, M.; Linhart, H.G.; Hadaschik, B.A.; Holland-Letz, T.; Giesel, F.L.; Kratochwil, C.; Haufe, S.; et al. PET imaging with a [68Ga]gallium-labelled PSMA ligand for the diagnosis of prostate cancer: Biodistribution in humans and first evaluation of tumour lesions. Eur. J. Nucl. Med. Mol. Imaging 2013, 40, 486–495. [Google Scholar] [CrossRef] [PubMed]
- Perera, M.; Papa, N.; Christidis, D.; Wetherell, D.; Hofman, M.S.; Murphy, D.G.; Bolton, D.; Lawrentschuk, N. Sensitivity, Specificity, and Predictors of Positive (68)Ga-Prostate-specific Membrane Antigen Positron Emission Tomography in Advanced Prostate Cancer: A Systematic Review and Meta-analysis. Eur. Urol. 2016, 70, 926–937. [Google Scholar] [CrossRef]
- Einspieler, I.; Rauscher, I.; Düwel, C.; Krönke, M.; Rischpler, C.; Habl, G.; Dewes, S.; Ott, A.; Wester, H.-J.; Schwaiger, M.; et al. Detection Efficacy of Hybrid68 Ga-PSMA Ligand PET/CT in Prostate Cancer Patients with Biochemical Recurrence After Primary Radiation Therapy Defined by Phoenix Criteria. J. Nucl. Med. 2017, 58, 1081–1087. [Google Scholar] [CrossRef] [Green Version]
- Schwarzenboeck, S.M.; Rauscher, I.; Bluemel, C.; Fendler, W.P.; Rowe, S.P.; Pomper, M.G.; Afshar-Oromieh, A.; Herrmann, K.; Eiber, M. PSMA Ligands for PET Imaging of Prostate Cancer. J. Nucl. Med. 2017, 58, 1545–1552. [Google Scholar] [CrossRef] [Green Version]
- Hofman, M.S.; Hicks, R.J.; Maurer, T.; Eiber, M. Prostate-specific Membrane Antigen PET: Clinical Utility in Prostate Cancer, Normal Patterns, Pearls, and Pitfalls. Radiographics 2018, 38, 200–217. [Google Scholar] [CrossRef] [Green Version]
- Eder, M.; Schäfer, M.; Bauder-Wüst, U.; Hull, W.-E.; Wängler, C.; Mier, W.; Haberkorn, U.; Eisenhut, M. 68Ga-Complex Lipophilicity and the Targeting Property of a Urea-Based PSMA Inhibitor for PET Imaging. Bioconjugate Chem. 2012, 23, 688–697. [Google Scholar] [CrossRef]
- Hennrich, U.; Eder, M. [68Ga]Ga-PSMA-11: The First FDA-Approved 68Ga-Radiopharmaceutical for PET Imaging of Prostate Cancer. Pharmaceuticals 2021, 14, 713. [Google Scholar] [CrossRef]
- Hohberg, M.; Kobe, C.; Täger, P.; Hammes, J.; Schmidt, M.; Dietlein, F.; Wild, M.; Heidenreich, A.; Drzezga, A.; Dietlein, M. Combined Early and Late [(68)Ga]PSMA-HBED-CC PET Scans Improve Lesion Detectability in Biochemical Recurrence of Prostate Cancer with Low PSA Levels. Mol. Imaging Biol. 2019, 21, 558–566. [Google Scholar] [CrossRef]
- Schmuck, S.; Nordlohne, S.; von Klot, C.A.; Henkenberens, C.; Sohns, J.M.; Christiansen, H.; Wester, H.J.; Ross, T.L.; Bengel, F.M.; Derlin, T. Comparison of standard and delayed imaging to improve the detection rate of [(68)Ga]PSMA I&T PET/CT in patients with biochemical recurrence or prostate-specific antigen persistence after primary therapy for prostate cancer. Eur. J. Nucl. Med. Mol. Imaging 2017, 44, 960–968. [Google Scholar] [CrossRef] [PubMed]
- Dietlein, F.; Kobe, C.; Neubauer, S.; Schmidt, M.; Stockter, S.; Fischer, T.; Schomäcker, K.; Heidenreich, A.; Zlatopolskiy, B.D.; Neumaier, B.; et al. PSA-Stratified Performance of (18)F- and (68)Ga-PSMA PET in Patients with Biochemical Recurrence of Prostate Cancer. J. Nucl. Med. 2017, 58, 947–952. [Google Scholar] [CrossRef] [PubMed] [Green Version]
- Ferreira, G.; Iravani, A.; Hofman, M.S.; Hicks, R.J. Intra-individual comparison of (68)Ga-PSMA-11 and (18)F-DCFPyL normal-organ biodistribution. Cancer Imaging 2019, 19, 23. [Google Scholar] [CrossRef] [PubMed]
- Baecker, D.; Obermoser, V.; Kirchner, E.A.; Hupfauf, A.; Kircher, B.; Gust, R. Fluorination as tool to improve bioanalytical sensitivity and COX-2-selective antitumor activity of cobalt alkyne complexes. Dalton Trans. 2019, 48, 15856–15868. [Google Scholar] [CrossRef] [PubMed]
- Maurer, T.; Eiber, M.; Schwaiger, M.; Gschwend, J.E. Current use of PSMA-PET in prostate cancer management. Nat. Rev. Urol. 2016, 13, 226–235. [Google Scholar] [CrossRef]
- Werner, R.A.; Derlin, T.; Lapa, C.; Sheikbahaei, S.; Higuchi, T.; Giesel, F.L.; Behr, S.; Drzezga, A.; Kimura, H.; Buck, A.K.; et al. (18)F-Labeled, PSMA-Targeted Radiotracers: Leveraging the Advantages of Radiofluorination for Prostate Cancer Molecular Imaging. Theranostics 2020, 10, 1–16. [Google Scholar] [CrossRef]
- Zimmerman, M.E.; Meyer, A.R.; Rowe, S.P.; Gorin, M.A. Imaging of prostate cancer with positron emission tomography. Clin. Adv. Hematol. Oncol. 2019, 17, 455–463. [Google Scholar]
- Hillier, S.M.; Maresca, K.P.; Femia, F.J.; Marquis, J.C.; Foss, C.A.; Nguyen, N.; Zimmerman, C.N.; Barrett, J.A.; Eckelman, W.C.; Pomper, M.G.; et al. Preclinical evaluation of novel glutamate-urea-lysine analogues that target prostate-specific membrane antigen as molecular imaging pharmaceuticals for prostate cancer. Cancer Res. 2009, 69, 6932–6940. [Google Scholar] [CrossRef] [Green Version]
- Chen, Y.; Foss, C.A.; Byun, Y.; Nimmagadda, S.; Pullambhatla, M.; Fox, J.J.; Castanares, M.; Lupold, S.E.; Babich, J.W.; Mease, R.C.; et al. Radiohalogenated prostate-specific membrane antigen (PSMA)-based ureas as imaging agents for prostate cancer. J. Med. Chem. 2008, 51, 7933–7943. [Google Scholar] [CrossRef] [Green Version]
- Mease, R.C.; Dusich, C.L.; Foss, C.A.; Ravert, H.T.; Dannals, R.F.; Seidel, J.; Prideaux, A.; Fox, J.J.; Sgouros, G.; Kozikowski, A.P.; et al. N-[N-[(S)-1,3-Dicarboxypropyl]carbamoyl]-4-[18F]fluorobenzyl-L-cysteine, [18F]DCFBC: A new imaging probe for prostate cancer. Clin. Cancer Res. 2008, 14, 3036–3043. [Google Scholar] [CrossRef] [Green Version]
- Chen, Y.; Pullambhatla, M.; Foss, C.A.; Byun, Y.; Nimmagadda, S.; Senthamizhchelvan, S.; Sgouros, G.; Mease, R.C.; Pomper, M.G. 2-(3-{1-Carboxy-5-[(6-[18F]fluoro-pyridine-3-carbonyl)-amino]-pentyl}-ureido)-pentanedioic acid, [18F]DCFPyL, a PSMA-based PET imaging agent for prostate cancer. Clin. Cancer Res. 2011, 17, 7645–7653. [Google Scholar] [CrossRef] [PubMed] [Green Version]
- Malik, N.; Baur, B.; Winter, G.; Reske, S.N.; Beer, A.J.; Solbach, C. Radiofluorination of PSMA-HBED via Al(18)F(2+) Chelation and Biological Evaluations In Vitro. Mol. Imaging Biol. 2015, 17, 777–785. [Google Scholar] [CrossRef] [PubMed]
- Cardinale, J.; Schäfer, M.; Benešová, M.; Bauder-Wüst, U.; Leotta, K.; Eder, M.; Neels, O.C.; Haberkorn, U.; Giesel, F.L.; Kopka, K. Preclinical Evaluation of (18)F-PSMA-1007, a New Prostate-Specific Membrane Antigen Ligand for Prostate Cancer Imaging. J. Nucl. Med. 2017, 58, 425–431. [Google Scholar] [CrossRef] [PubMed] [Green Version]
- Wester, H.J.; Schottelius, M. PSMA-Targeted Radiopharmaceuticals for Imaging and Therapy. Semin. Nucl. Med. 2019, 49, 302–312. [Google Scholar] [CrossRef]
- Szabo, Z.; Mena, E.; Rowe, S.P.; Plyku, D.; Nidal, R.; Eisenberger, M.A.; Antonarakis, E.S.; Fan, H.; Dannals, R.F.; Chen, Y.; et al. Initial Evaluation of [(18)F]DCFPyL for Prostate-Specific Membrane Antigen (PSMA)-Targeted PET Imaging of Prostate Cancer. Mol. Imaging Biol. 2015, 17, 565–574. [Google Scholar] [CrossRef]
- Dietlein, M.; Kobe, C.; Kuhnert, G.; Stockter, S.; Fischer, T.; Schomäcker, K.; Schmidt, M.; Dietlein, F.; Zlatopolskiy, B.D.; Krapf, P.; et al. Comparison of [(18)F]DCFPyL and [ (68)Ga]Ga-PSMA-HBED-CC for PSMA-PET Imaging in Patients with Relapsed Prostate Cancer. Mol. Imaging Biol. 2015, 17, 575–584. [Google Scholar] [CrossRef] [Green Version]
- Giesel, F.L.; Knorr, K.; Spohn, F.; Will, L.; Maurer, T.; Flechsig, P.; Neels, O.; Schiller, K.; Amaral, H.; Weber, W.A.; et al. Detection Efficacy of (18)F-PSMA-1007 PET/CT in 251 Patients with Biochemical Recurrence of Prostate Cancer After Radical Prostatectomy. J. Nucl. Med. 2019, 60, 362–368. [Google Scholar] [CrossRef] [Green Version]
- Giesel, F.L.; Will, L.; Lawal, I.; Lengana, T.; Kratochwil, C.; Vorster, M.; Neels, O.; Reyneke, F.; Haberkon, U.; Kopka, K.; et al. Intraindividual Comparison of (18)F-PSMA-1007 and (18)F-DCFPyL PET/CT in the Prospective Evaluation of Patients with Newly Diagnosed Prostate Carcinoma: A Pilot Study. J. Nucl. Med. 2018, 59, 1076–1080. [Google Scholar] [CrossRef] [Green Version]
- Keam, S.J. Piflufolastat F 18: Diagnostic First Approval. Mol. Diagn. Ther. 2021, 25, 647–656. [Google Scholar] [CrossRef]
- Zlatopolskiy, B.D.; Endepols, H.; Krapf, P.; Guliyev, M.; Urusova, E.A.; Richarz, R.; Hohberg, M.; Dietlein, M.; Drzezga, A.; Neumaier, B. Discovery of (18)F-JK-PSMA-7, a PET Probe for the Detection of Small PSMA-Positive Lesions. J. Nucl. Med. 2019, 60, 817–823. [Google Scholar] [CrossRef] [Green Version]
- Bouvet, V.; Wuest, M.; Bailey, J.J.; Bergman, C.; Janzen, N.; Valliant, J.F.; Wuest, F. Targeting Prostate-Specific Membrane Antigen (PSMA) with F-18-Labeled Compounds: The Influence of Prosthetic Groups on Tumor Uptake and Clearance Profile. Mol. Imaging Biol. 2017, 19, 923–932. [Google Scholar] [CrossRef] [PubMed]
- Dannoon, S.; Ganguly, T.; Cahaya, H.; Geruntho, J.J.; Galliher, M.S.; Beyer, S.K.; Choy, C.J.; Hopkins, M.R.; Regan, M.; Blecha, J.E.; et al. Structure-Activity Relationship of (18)F-Labeled Phosphoramidate Peptidomimetic Prostate-Specific Membrane Antigen (PSMA)-Targeted Inhibitor Analogues for PET Imaging of Prostate Cancer. J. Med. Chem. 2016, 59, 5684–5694. [Google Scholar] [CrossRef] [PubMed]
- Kularatne, S.A.; Zhou, Z.; Yang, J.; Post, C.B.; Low, P.S. Design, Synthesis, and Preclinical Evaluation of Prostate-Specific Membrane Antigen Targeted 99mTc-Radioimaging Agents. Mol. Pharm. 2009, 6, 790–800. [Google Scholar] [CrossRef] [PubMed]
- Bařinka, C.; Rojas, C.; Slusher, B.; Pomper, M. Glutamate carboxypeptidase II in diagnosis and treatment of neurologic disorders and prostate cancer. Curr. Med. Chem. 2012, 19, 856–870. [Google Scholar] [CrossRef] [PubMed] [Green Version]
- Rowe, S.P.; Macura, K.J.; Mena, E.; Blackford, A.L.; Nadal, R.; Antonarakis, E.S.; Eisenberger, M.; Carducci, M.; Fan, H.; Dannals, R.F.; et al. PSMA-Based [(18)F]DCFPyL PET/CT Is Superior to Conventional Imaging for Lesion Detection in Patients with Metastatic Prostate Cancer. Mol. Imaging Biol. 2016, 18, 411–419. [Google Scholar] [CrossRef] [Green Version]
- Chakravarty, R.; Siamof, C.M.; Dash, A.; Cai, W. Targeted α-therapy of prostate cancer using radiolabeled PSMA inhibitors: A game changer in nuclear medicine. Am. J. Nucl. Med. Mol. Imaging 2018, 8, 247–267. [Google Scholar]
- Barber, T.W.; Singh, A.; Kulkarni, H.R.; Niepsch, K.; Billah, B.; Baum, R.P. Clinical Outcomes of (177)Lu-PSMA Radioligand Therapy in Earlier and Later Phases of Metastatic Castration-Resistant Prostate Cancer Grouped by Previous Taxane Chemotherapy. J. Nucl. Med. 2019, 60, 955–962. [Google Scholar] [CrossRef] [Green Version]
- Seitzer, K.E.; Seifert, R.; Kessel, K.; Roll, W.; Schlack, K.; Boegemann, M.; Rahbar, K. Lutetium-177 Labelled PSMA Targeted Therapy in Advanced Prostate Cancer: Current Status and Future Perspectives. Cancers 2021, 13, 3715. [Google Scholar] [CrossRef]
- Mullard, A. FDA approves first PSMA-targeted radiopharmaceutical. Nat. Rev. Drug Discov. 2022, 21, 327. [Google Scholar] [CrossRef]
- Heck, M.M.; Tauber, R.; Schwaiger, S.; Retz, M.; D’Alessandria, C.; Maurer, T.; Gafita, A.; Wester, H.-J.; Gschwend, J.E.; Weber, W.A.; et al. Treatment Outcome, Toxicity, and Predictive Factors for Radioligand Therapy with 177Lu-PSMA-I&T in Metastatic Castration-resistant Prostate Cancer. Eur. Urol. 2019, 75, 920–926. [Google Scholar]
- Roy, J.; Warner, B.M.; Basuli, F.; Zhang, X.; Wong, K.; Pranzatelli, T.; Ton, A.T.; Chiorini, J.A.; Choyke, P.L.; Lin, F.I.; et al. Comparison of Prostate-Specific Membrane Antigen Expression Levels in Human Salivary Glands to Non-Human Primates and Rodents. Cancer Biother. Radiopharm. 2020, 35, 284–291. [Google Scholar] [CrossRef] [PubMed]
- O’Keefe, D.S.; Bacich, D.J.; Molloy, P.L.; Heston, W.D.W. Prostate Specific Membrane Antigen; Humana Press: Totowa, Nj, USA, 2008. [Google Scholar]
- Mhawech-Fauceglia, P.; Zhang, S.; Terracciano, L.; Sauter, G.; Chadhuri, A.; Herrmann, F.R.; Penetrante, R. Prostate-specific membrane antigen (PSMA) protein expression in normal and neoplastic tissues and its sensitivity and specificity in prostate adenocarcinoma: An immunohistochemical study using mutiple tumour tissue microarray technique. Histopathology 2007, 50, 472–483. [Google Scholar] [CrossRef] [PubMed]
- Basuli, F.; Zhang, X.; Woodroofe, C.C.; Jagoda, E.M.; Choyke, P.L.; Swenson, R.E. Fast indirect fluorine-18 labeling of protein/peptide using the useful 6-fluoronicotinic acid-2,3,5,6-tetrafluorophenyl prosthetic group: A method comparable to direct fluorination. J. Label. Comp. Radiopharm. 2017, 60, 168–175. [Google Scholar] [CrossRef] [PubMed] [Green Version]
- Basuli, F.; Zhang, X.; Jagoda, E.M.; Choyke, P.L.; Swenson, R.E. Rapid synthesis of maleimide functionalized fluorine-18 labeled prosthetic group using “radio-fluorination on the Sep-Pak” method. J. Label. Comp. Radiopharm. 2018, 61, 599–605. [Google Scholar] [CrossRef] [PubMed]
- Jones, D.S.; Branks, M.J.; Campbell, M.A.; Cockerill, K.A.; Hammaker, J.R.; Kessler, C.A.; Smith, E.M.; Tao, A.; Ton-Nu, H.T.; Xu, T. Multivalent poly(ethylene glycol)-containing conjugates for in vivo antibody suppression. Bioconjug. Chem. 2003, 14, 1067–1076. [Google Scholar] [CrossRef] [PubMed]
- Nakajima, T.; Mitsunaga, M.; Bander, N.H.; Heston, W.D.; Choyke, P.L.; Kobayashi, H. Targeted, activatable, in vivo fluorescence imaging of prostate-specific membrane antigen (PSMA) positive tumors using the quenched humanized J591 antibody-indocyanine green (ICG) conjugate. Bioconjug. Chem. 2011, 22, 1700–1705. [Google Scholar] [CrossRef] [PubMed] [Green Version]
- Roy, J.; White, M.E.; Basuli, F.; Opina, A.C.L.; Wong, K.; Riba, M.; Ton, A.T.; Zhang, X.; Jansson, K.H.; Edmondson, E.; et al. Monitoring PSMA Responses to ADT in Prostate Cancer Patient-Derived Xenograft Mouse Models Using [(18)F]DCFPyL PET Imaging. Mol. Imaging Biol. 2021, 23, 745–755. [Google Scholar] [CrossRef]


| Radioligand | [18F]DCFPyL | [18F]1a | [18F]1b | [18F]2a | [18F]2b |
| 1 Kd (nM) | 0.402 (0.121) | 0.238 (0.075) | 0.458 (0.065) | 0.362 (0.077) | 0.489 (0.106) |
| Ligand | DCFPyL | 1a | 1b | 2a | 2b |
| 2 Ki (nM) | 0.398 (0.055) | 0.101 * (0.007) | 0.312 (0.073) | 0.621 (0.159) | 0.901 (0.267) |
| T:M 1 | [18F]DCFPyL | [18F]1a | [18F]1b | [18F]2a | [18F]2b |
|---|---|---|---|---|---|
| PC3(+) Tumor | 123. 6 ± 10.0 | 103.0 ± 10.9 | 203.7 ± 34.5 | 73.9 ± 5.8 | 89.9 ± 7.6 |
| PC3(−) Tumor | 1.50 ± 0.17 | 1.07 ± 0.08 | 1.43 ± 0.29 | 1.42 ± 0.13 | 1.65 ± 0.20 |
| Blood | 2.29 ± 0.15 | 2.39 ± 0.14 | 2.26 ± 0.22 | 2.85 ± 0.15 | 2.04 ± 0.11 |
| Kidney | 695.1 ± 76.0 | 507.8 ± 44.0 | 1013 ± 34 | 314.8 ± 8.3 | 814.2 ± 71.9 |
| Liver | 9.88 ± 7.4 | 35.7 ± 3.1 | 24.9 ± 2.0 | 66.9 ± 4.2 | 44.6 ± 3.8 |
| Femur | 0.90 ± 0.09 | 0.92 ± 0.09 | 1.80 ± 0.17 | 0.73 ± 0.04 | 2.00 ± 0.18 |
| %Parent compound in blood (TLC analysis)2 | 49.9 ± 10.7 | 50.2 ± 1.4 | 74.4 ± 7.6 | 84.8 ± 0.6 | 78.8 ± 2.6 |
| Uptake (%ID/g) | Time Post-Injection (min) | ||||
|---|---|---|---|---|---|
| 15 | 30 | 60 | 120 | ||
| Blood | [18F]DCFPyL Total radioactivity | 2.66 ± 0.12 | 1.03 ± 0.05 | 0.52 ± 0.06 | 0.13 ± 0.01 |
| Parent | 1.06 ± 0.05 | 0.40 ± 0.02 | 0.26 ± 0.02 | 0.045 ± 0.003 | |
| [18F]2a Total radioactivity | 4.83 ± 0.57 | 2.47 ± 0.18 | 0.77 ± 0.10 | 0.37 ± 0.03 | |
| Parent | 4.10 ± 0.49 | 2.08 ± 0.15 | 0.65 ± 0.87 | 0.31 ± 0.03 | |
| Kidney | [18F]DCFPyL Total radioactivity | 132.9 ± 6.6 | 126.9 ± 5.6 | 147.7 ± 11.6 | 50.2 ± 3.6 |
| Parent | 17.05 ± 0.84 | 20.18 ± 0.72 | 17.58 ± 1.48 | 3.41 ± 0.46 | |
| [18F]2a Total radioactivity | 62.2 ± 3.4 | 78.4 ± 9.1 | 75.8 ± 6.3 | 87.8 ± 5.1 | |
| Parent | 11.84 ± 0.64 | 22.66 ± 1.73 | 15.63 ± 1.19 | 13.04 ± 0.98 | |
Publisher’s Note: MDPI stays neutral with regard to jurisdictional claims in published maps and institutional affiliations. |
© 2022 by the authors. Licensee MDPI, Basel, Switzerland. This article is an open access article distributed under the terms and conditions of the Creative Commons Attribution (CC BY) license (https://creativecommons.org/licenses/by/4.0/).
Share and Cite
Basuli, F.; Phelps, T.E.; Zhang, X.; Woodroofe, C.C.; Roy, J.; Choyke, P.L.; Swenson, R.E.; Jagoda, E.M. Fluorine-18 Labeled Urea-Based Ligands Targeting Prostate-Specific Membrane Antigen (PSMA) with Increased Tumor and Decreased Renal Uptake. Pharmaceuticals 2022, 15, 597. https://doi.org/10.3390/ph15050597
Basuli F, Phelps TE, Zhang X, Woodroofe CC, Roy J, Choyke PL, Swenson RE, Jagoda EM. Fluorine-18 Labeled Urea-Based Ligands Targeting Prostate-Specific Membrane Antigen (PSMA) with Increased Tumor and Decreased Renal Uptake. Pharmaceuticals. 2022; 15(5):597. https://doi.org/10.3390/ph15050597
Chicago/Turabian StyleBasuli, Falguni, Tim E. Phelps, Xiang Zhang, Carolyn C. Woodroofe, Jyoti Roy, Peter L. Choyke, Rolf E. Swenson, and Elaine M. Jagoda. 2022. "Fluorine-18 Labeled Urea-Based Ligands Targeting Prostate-Specific Membrane Antigen (PSMA) with Increased Tumor and Decreased Renal Uptake" Pharmaceuticals 15, no. 5: 597. https://doi.org/10.3390/ph15050597