Article

Resistance Sources to Brown Blotch Disease (Pseudomonas tolaasii) in a Diverse Collection of Pleurotus Mushroom Strains

1
International Cooperation Research Center of China for New Germplasm and Breeding of Edible Mushrooms, Jilin Agricultural University, Changchun 130118, China
2
Department of Plant Pathology, Jilin Agricultural University, Changchun 130118, China
3
Department of Plant Pathology, Washington State University, Pullman, WA 99164-6430, USA
*
Authors to whom correspondence should be addressed.
Pathogens 2019, 8(4), 227; https://doi.org/10.3390/pathogens8040227
Submission received: 11 October 2019 / Revised: 6 November 2019 / Accepted: 7 November 2019 / Published: 9 November 2019
(This article belongs to the Section Plant Pathogens)

Abstract

:
Brown blotch disease (BBD) caused by Pseudomonas tolaasii is one of the most devastating diseases of Pleurotus spp. worldwide. Breeding for resistant strains is the most effective method for controlling BBD. To identify resistant germplasm for BBD management, 97 strains comprising 21 P. cf. floridanus, 20 P. ostreatus, and 56 P. pulmonarius were screened by two different methods; namely, inoculation of the pathogen on the mushroom pileus (IMP) and on the spawned substrate (IMSS) under controlled conditions. Out of the 97 strains screened, 22 P. pulmonarius, and four P. cf. floridanus were moderately resistant to BBD using the IMP method. Eleven P. pulmonarius, six P. cf. florida, and one P. ostreatus strains were highly resistant to BBD using the IMSS method. All of the 97 strains showed varying degrees of susceptibility using the IMP method, but eight strains were completely resistant using the IMSS method. Combining these two methods, five strains were highly resistant (four P. pulmonarius and one P. cf. floridanus) and 11 were moderately resistant (eight P. pulmonarius and three P. cf. floridanus). The resistance sources to P. tolaasii identified in P. pulmonarius and P. cf. floridanus could be used for further breeding of Pleurotus spp.

1. Introduction

The Pleurotus genus consists of approximately 50 recognized species, including more than 10 important species that are highly nutritious and among the most commercially cultivated edible fungi in the world [1,2]. In China, Pleurotus ostreatus (oyster mushroom), Pleurotus pulmonarius (phoenix mushroom), and Pleurotus cf. floridanus (Florida oyster mushroom) are among the most commonly cultivated species with considerable economic value. Their production exceeds 500 million tons annually for both domestic consumption and export purposes [3].
However, one of the important diseases that threatens Pleurotus mushroom production is brown blotch disease (BBD), caused by Pseudomonas tolaasii. The bacterium can also infect other economically important mushrooms, such as Agaricus bisporus, Lentinus edodes, and Flammulina velutipes [4,5,6,7]. P. tolaasii can infect all the stages of Pleurotus spp. fruiting body [8] by secreting tolaasin, a core toxin used to cause BBD on the mushroom [9]. Tolaasin causes lysis of hyphal cell membranes and induces an increase in the amount of active tyrosinase, leading to melanin synthesis at the site of infection [
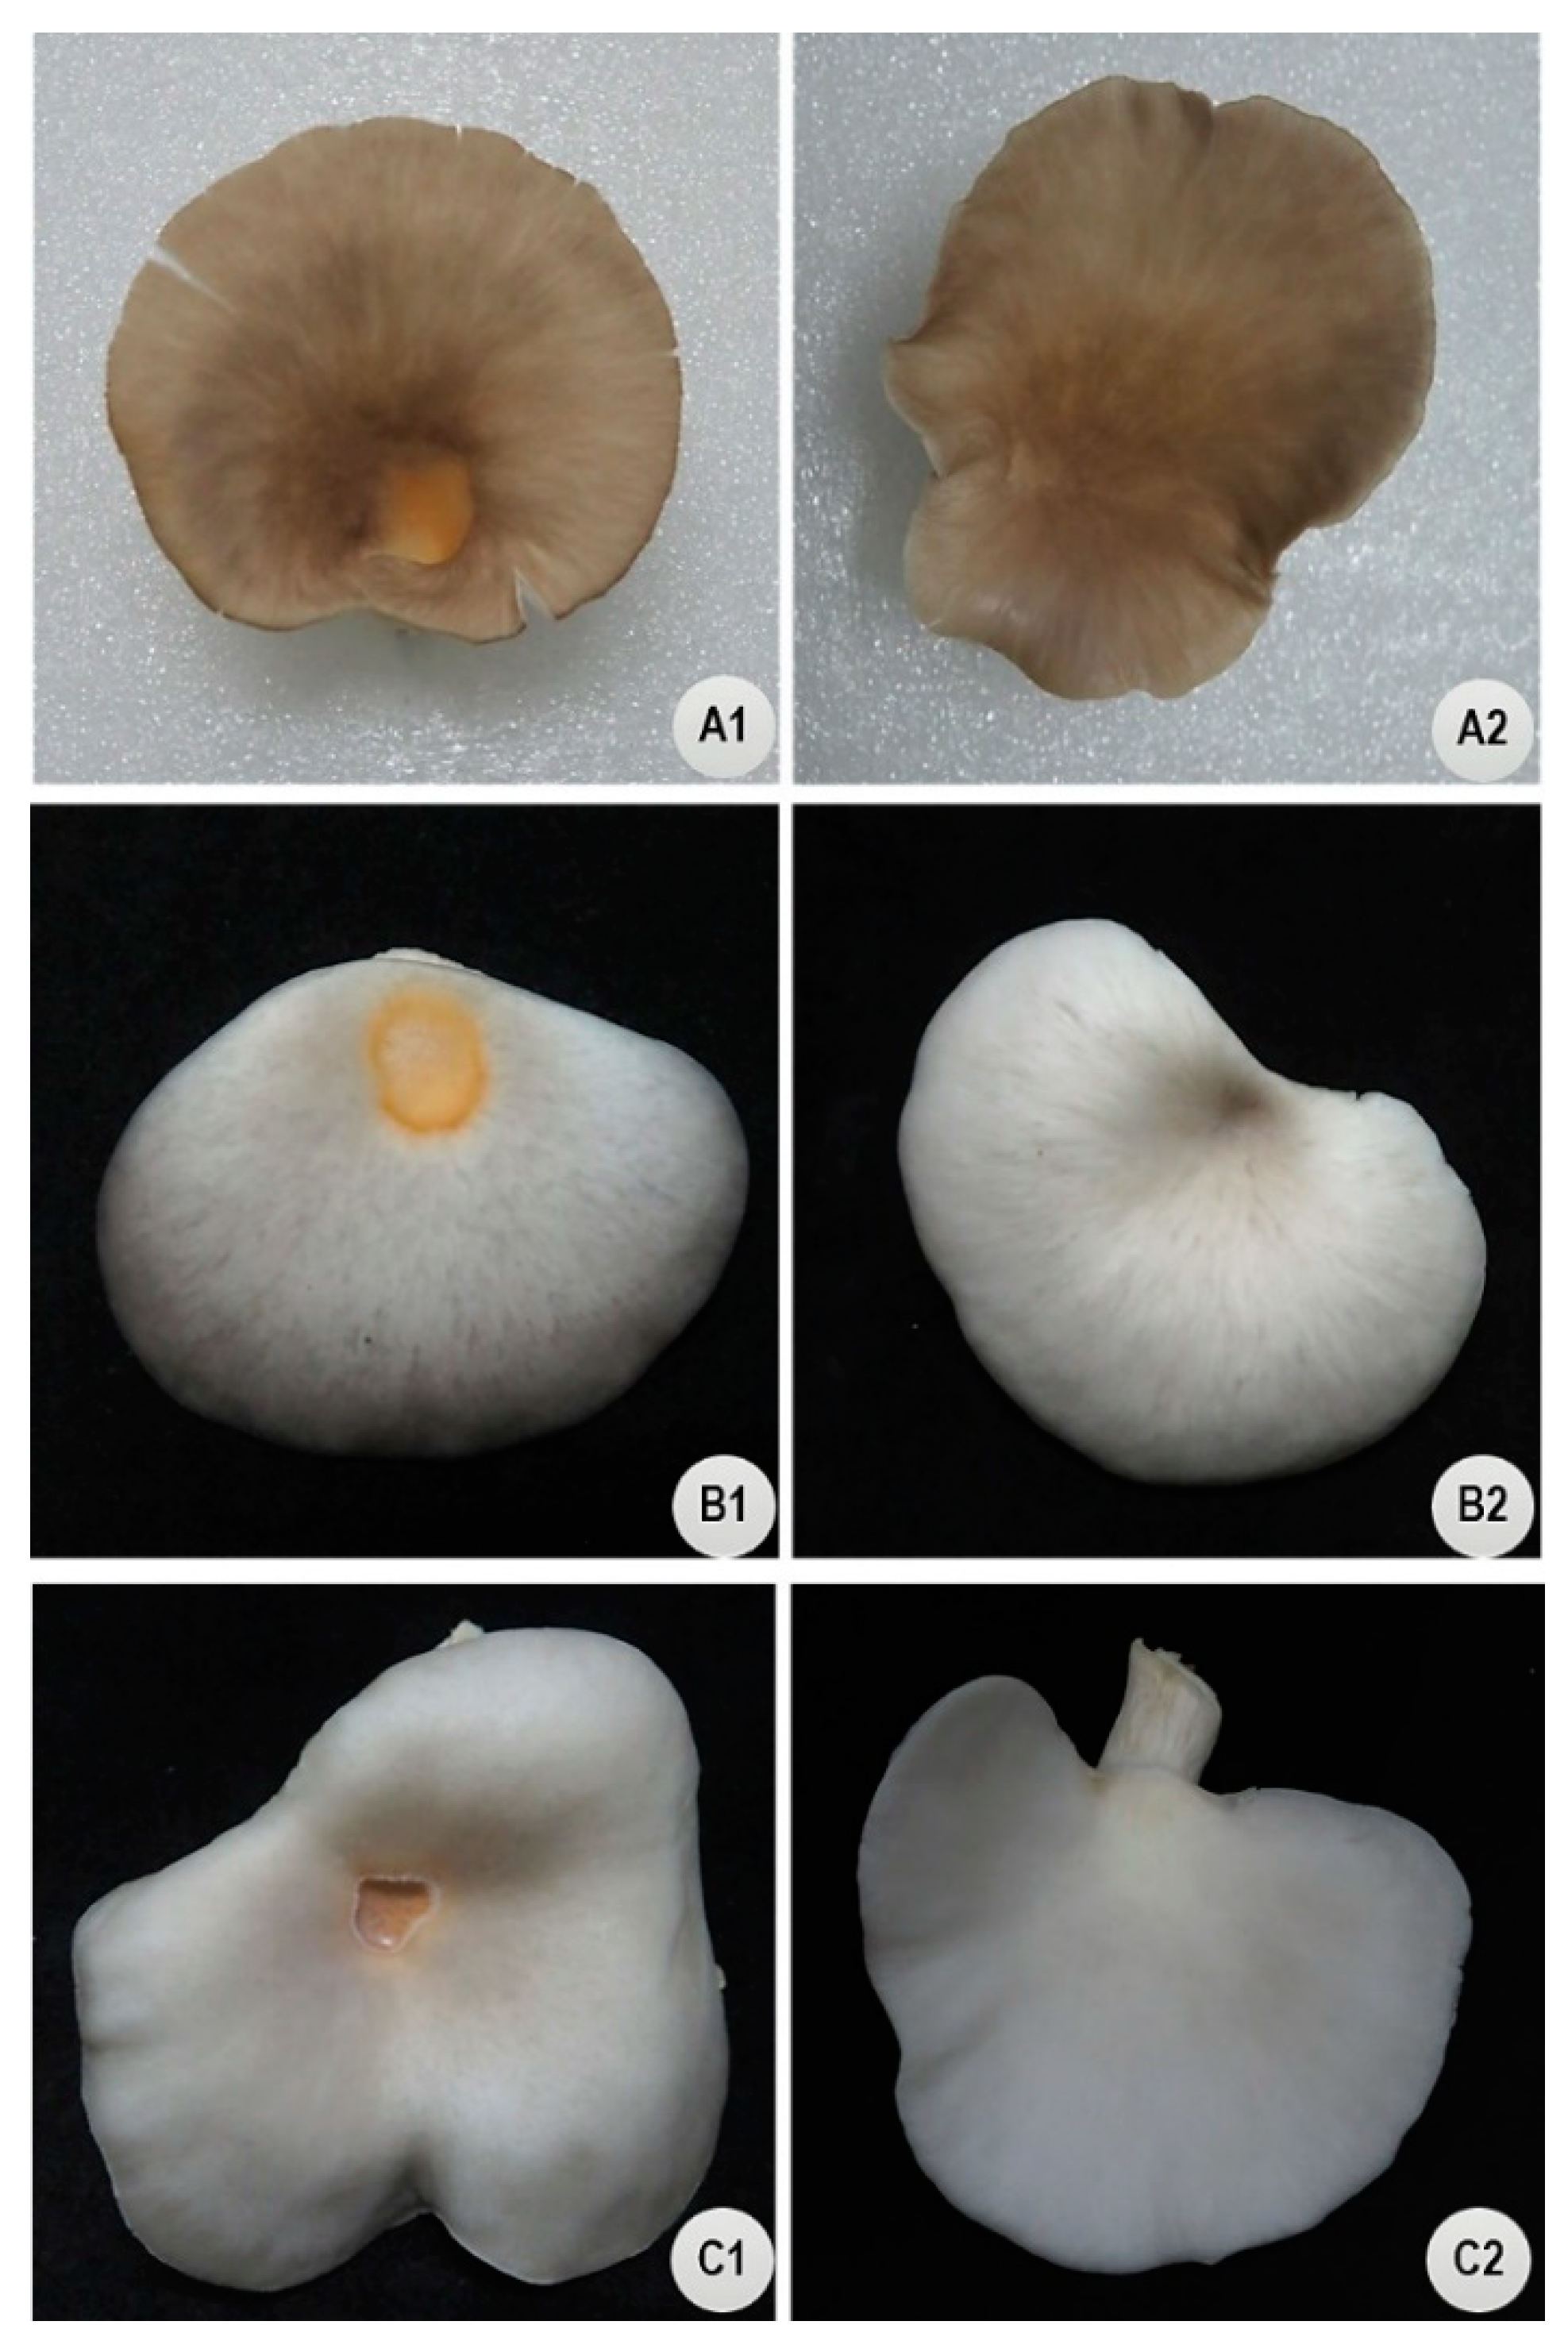
10]. The characteristic symptoms of BBD include initially small, separated pale brown discolorations, which then spread all over the pileus surface. When BBD is severe, blotches become darker and sunken, ultimately rendering the pileus unappealing for human consumption [11]. These symptoms lead to reduced quality [12,13], which can cause a significant economic loss of up to 25% [14,15].
Over the past years, strategies to control BBD and interrupt pathogen spread have included the use of chemicals (antibiotics, hydrogen peroxide, and chlorinated compounds), management of host environment, and biocontrol agents (plant extracts and antagonistic microbes) [16,17,18,19,20,21,22]; however, none of these strategies appear to be fully efficient in managing the disease. There is even an increased concern about the effects of these chemicals on consumers. Further, the ability of P. tolaasii to tolerate adverse environmental conditions through phenotypic plasticity makes BBD control difficult [23,24,25], thereby resulting in huge crop losses during severe epidemics.
At present, the use of resistant strains is the most efficient and long-term method for BBD control [26,27,28], since it not only reduces the loss of the mushroom quality, but also the cost associated with measures undertaken to control the disease. Therefore, resistance sources in Pleurotus germplasm are needed for the sustainable management of BBD. Several studies have described partial resistance to BBD in A. bisporus strains [26,27,29,30]. However, only one has reported partial resistance of P. ostreatus strains to P. tolaasii [31].
The Pleurotus genus contains many species with genetically diverse strains in the wild, and many are also maintained by various mycological germplasm repositories [32,33]. Additionally, interspecific hybridization can occur between species [34]. Therefore, developing BBD-resistant strains may rely on characterization and incorporation of resistance genes contributed from wild strains or closely related species. Despite the large collection of Pleurotus species in many germplasm repositories, little is known about their resistance to BBD. Thus, searching for novel sources of resistance to BBD is of high priority.
In screening for disease resistance in mushrooms, several studies have recommended the artificial inoculation of the pathogen and assessment of the host response under a controlled environment. Oliver et al. [27] described the use of the direct inoculation of the pathogen on the mushroom pileus/cap (IMP) method to screen for BBD resistance in A. bisporus. However, Zhang et al. [31] could not clearly distinguish between the host responses from P. ostreatus and proposed the inoculation of the pathogen on the mushroom spawned substrate (IMSS) as the effective method for successful evaluation of BBD resistance in P. ostreatus. The objectives of this study were to (1) evaluate the efficacy of the IMP screening method on Pleurotus species; (2) determine the influence of inoculum dose, temperature and disease assessment time on the resistance test; and (3) identify possible resistance sources from a collection of 97 Pleurotus strains.

2. Results

2.1. Pathogenicity of P. tolaasii Strain Pt011W

Morphological and molecular analyses were used to confirm the identity of bacterial strain Pt011W in this study. Results from BLASTn alignments of the 16S rRNA, rpoβ, and tolaasin biosynthesis gene sequences showed 98–100% homology to the known sequences of P. tolaasii strains deposited in GenBank (MN630174, MN630175, and MN630176, respectively). A neighbor-joining phylogenetic tree confirmed strain Pt011W as P. tolaasii with 100% branch support based on the concatenated 16S rRNA and rpoβ sequence data of Pt011W and other published sequences of Pseudomonas spp. (Supplementary Figure S1).
Artificial inoculation of P. tolaasii Pt011W on the mushroom pileus surface induced typical brown blotch symptoms on strain P0 (P. ostreatus), P282 (P. cf. floridanus), and PPU (P. pulmonarius) 24 hours after inoculation (HAI). The symptoms were yellow, brown, slight to extensively sunken, and were localized to the portion of the cap on which inoculum was applied (Figure 1). Caps treated with sterile water as controls remained asymptomatic. Re-isolation of the causal agent consistently yielded the same pathogen (P. tolaasii) to confirm Koch’s postulates.

2.2. Efficacy of the IMP Method for Resistance Evaluation.

Evaluation of BBD symptom severity using a 0–5 scale ensured the consistent discrimination of strains regarding resistance to P. tolaasii Pt011W (Table 1). The 3-way interactive effects of strains (S), temperatures (T), and inoculum dosages (D) (S × T × D), and all other effects involving T did not significantly affect disease severity (DS) for the length of HAI. In other words, though different incubation temperatures (21 °C and 18 °C) were used to induce the fruiting of different species it did not have an effect on DS. In contrast, DS was significantly affected by the interaction of S × D, 24 to 72 HAI. Examination of the main effects showed increasing inoculum dosage corresponded with severe blotch symptoms, regardless of assessment time (Figure 2a–c). At 24 HAI, the overall average DS of the three strains treated with 1.3 × 10⁷ CFU/mL inoculum suspension (providing ≈2.6 × 10⁵ CFU/20 µL on the cap surface) was not significantly different from the control, except at 48 HAI, where it was difficult to distinguish the symptoms on the cap visually (Figure 2a–c). The inoculation on mushroom caps using 20 µL of 1.3 × 10⁸ CFU/mL inoculum suspension gave the most severe symptoms for the three strains (Figure 2d). In order to prevent the escape of strains from infection during the resistance test, a high dosage of the inoculum was required. Therefore, the 1.3 × 10⁸ CFU/mL inoculum suspension, providing ≈ 2.6 × 10⁶ CFU/20 µL on the cap surface, was selected as the optimum inoculum dosage for infection and was used in the subsequent trial.

2.3. Determination of the Best Time for Disease Assessment

The BBD progression curves for the three strains inoculated with the optimum inoculum dosage are shown in Figure 2d. BBD severity differed significantly (p < 0.05) among the strains as the infection progressed from 24 to 48 and to 72 HAI (Table 1). Strain P0 recorded the highest DS compared to P282 and PPU. Similarly, the variance component attributed to strain increased from 2.44 to 4.74%, indicating the difference between the strains as the period of incubation increased. However, the magnitude of increase in DS slowed down from 48 to 72 HAI. Hence, the most meaningful time point to carry out disease assessment with low variability between replicates (error = 8.47%) was 48 HAI.
At this time point, and with the selected optimum inoculum, the mean DS scores of the strains under the two different incubation environments (at 21 °C and 18 °C) were reproducible, since the interactions between temperature and all other terms in the model were absent. The disease response of the strains between the two environments was positively correlated (r = 0.97, p < 0.05).

2.4. Screening for Resistance to BBD Based on the IMP Method

In 2017, all 97 strains (56 P. pulmonarius, 21 P. cf. floridanus, and 20 P. ostreatus) examined by the IMP method produced fruiting bodies with varied cap colors (Table 2, Table 3 and Table 4). After 48 hours of inoculation, blotch symptoms appeared on the fruiting bodies of all the strains, but varied in lesion morphology. The average DS1 ± standard deviation was 1.95 ± 0.70, 2.23 ± 0.61, and 2.86 ± 0.77 for P. pulmonarius (Table 2), P. cf. floridanus (Table 3), and P. ostreatus (Table 4), respectively. None of the strains were immune or completely resistant to P. tolaasii; however, significant (p < 0.05) variations in DS among the strains in each species group were obtained. Based on the average DS, the strains were rated as highly resistant (HR) (DS1 ≤ 0.5), moderately resistant (MR) (DS1 ≤ 1.5), moderately susceptible (MS) (DS1 ≤ 2.5), susceptible (S) (DS1 ≤ 3.5), or highly susceptible (HS) (DS1 > 3.5) (Table 2, Table 3 and Table 4).
None of the 97 strains were rated as HR. Twenty-two P. pulmonarius and four P. cf. floridanus strains (P290, P287, P301, and P328) were MR (Table 2 and Table 3). None of the 20 P. ostreatus strains were HR or MR. Four P. ostreatus strains (P173, P40, P0, and P167) were rated HS. Mushroom cap colors showed no relationship with the varying susceptibility levels among the strains. For example, the brown-colored P. pulmonarius strains recorded both low and high DS scores (Table 2).

2.5. Screening for Resistance to BBD Based on the IMSS Method

To mimic the primary route of infection in mushroom farms, the same 97 strains were assessed by artificial inoculation of the pathogen on the mushroom spawned substrate (IMSS) in the succeeding trial in 2018. Throughout the fruiting period, the blotch lesions were observed on the primordial and open pileus fruiting bodies (Figure 3). The blotch lesion number and size increased with growth and expansion of mushroom fruiting bodies. Similar symptoms were observed on the second flush of fruiting bodies. The average DS2 ± standard deviation was 1.18 ± 0.76, 1.23 ± 0.95, and 1.92 ± 0.77 for P. pulmonarius (Table 2), P. cf. floridanus (Table 3), and P. ostreatus (Table 4), respectively. The mean DS2 varied significantly (p < 0.05) among the strains in each species group. Based on the average DS from the two flushes, the strains were rated as HR (DS2 ≤ 0.5), MR (DS2 ≤ 1.0), MS (DS2 ≤ 1.5), S (DS2 ≤ 2.0), or HS (DS2 > 2.0) (Table 2, Table 3 and Table 4).
Fifty-eight strains had many blotches covering >1% of cap surface (DS2 > 1) and were rated MS, S, or HS (Table 2, Table 3 and Table 4). In contrast, 26 strains of P. pulmonarius (Table 2), 10 of P. cf. floridanus (Table 3), and three of P. ostreatus (P346, P317, P176) (Table 4) showed few spotty blotches covering <1% of the mushroom cap surface area and were rated either HR or MR. Among the 18 HR strains (11 P. pulmonarius, six P. cf. floridanus, and one P. ostreatus), three of P. pulmonarius (F122, F324, F334), four of P. cf. floridanus (P287, P289, P334, P335), and one of P. ostreatus (P346) consistently showed asymptomatic fruiting bodies in the two flushes of mushroom fruiting (Table 2, Table 3 and Table 4, respectively). Their responses suggest complete resistance to BBD. However, previous screening by the direct IMP method revealed the susceptibility of their caps to P. tolaasii Pt011W. For instance, P346 of P. ostreatus and P334 of P. cf. floridanus recorded high DS1 > 2.5 on the IMP disease rating scale.

2.6. Comparison of Variation in Susceptibility to BBD due to Species and Strains

In both screening methods, the nested method (ANOVA) applied for strains within species revealed significant differences in BBD severity among the species groups (Table 5). However, a large broad-sense genetic variation denotes that level in the Pleurotus taxa is of interest for further research and optimal resource allocation. The variance component analysis revealed that little variation in disease response occurred between species (25.4% and 14.96% when using the IMP and IMSS, respectively), and also between replicates within strains. Most of the detected variations in disease response occurred between strains (60.76% and 72.35% when using the IMP and IMSS, respectively), which indicates that regardless of the method used, the individual strains in the Pleurotus taxa determined resistance to P. tolaasii, even more than species.

2.7. Pleurotus Strains with Less Susceptibility to BBD Using Both IMP and IMSS Methods

Based on the IMP DS scale, 26 of the 97 strains were classified MR (DSI ≤ 1.5). With the IMSS DS scale, 18 and 21 strains were classified HR and MR, respectively (DS2 ≤ 1). We also found some strains with lower DS ratings on both the IMP and IMSS method DS scales. These strains showed less intense brown discolorations and had few spotty blotches affecting <1% of the mushroom cap surface area. For the strains which showed complete resistance to P. tolaasii in the IMSS method, an overall disease severity index (DI) integrated the disease severity scales of both the IMP and IMSS methods by a simple formula required to give an accurate measure of their resistance. Further, the formula was applied to all strains to enhance the selection of resistant strains and to pyramid different resistance mechanisms against P. tolaasii. Based on the DI of each strain, 16 strains (12 P. pulmonarius and four P. cf. floridanus) had less susceptibility on the integrated scale (DI ≤ 25%) (Table 6) (details are reported in Table 2, Table 3 and Table 4). Among them, P. pulmonarius F122, F324, F344, F9, and P. cf. floridanus P287 were HR (DI ≤ 15%), while the remaining 11 strains were MR (DI = 15–25%). The remaining 81 strains, including all the 20 strains of P. ostreatus, were in the MS, S, or HS class.
We further found a significant positive correlation between the two screening methods for strains of P. pulmonarius (r = 0.28 and p < 0.05), yet weakly correlated magnitude and rank changes in disease response were observed. In contrast, there was no linear relationship for strains of P. cf. floridanus (r = 0.24 and p > 0.05) and P. ostreatus (r = 0.01 and p > 0.05) between the two methods.

2.8. Bacterial Detection and Numbers in Substrate Bags

After the first flush harvest, P. tolaasii was re-isolated from 10 g of the mycelia colonized substrates onto Pseudomonas Agar for detection of fluorescein (PAF agar). The bacteria colonies grew after incubation at 25 °C for 48 h. Their cultural characteristics were consistent with previous descriptions of P. tolaasii [35]. Based on PCR amplification of the tolaasin biosynthesis gene, these colonies were confirmed as P. tolaasii (Figure 4). The isolation and recovery of the bacterium from brown blotch symptomatic caps and from spawned substrates in the experiments show P. tolaasii was the pathogenic agent causing BBD on the mushroom fruiting bodies. The population of P. tolaasii recovered from the spawn substrate varied significantly among the sampled strains of P. pulmonarius and of P. cf. floridanus, with an exception for those of P. ostreatus (Table 7). Strains rated as resistant (F359, P176, P334) in the IMSS method showed low population levels of P. tolaasii.

3. Discussion

Pleurotus species are among the important cultivated mushrooms that are susceptible to BBD. To help minimize economic losses in commercial production of Pleurotus mushroom, the use of resistant strains is considered the most effective and desirable solution for BBD management. Among Pleurotus species, only P. ostreatus strains have been evaluated for BBD resistance [31]. Therefore, it is imperative to find and develop resistant strains of other Pleurotus species to control BBD. In this study, we screened 97 strains from three major cultivated Pleurotus species (P. pulmonarius, P. cf. floridanus, and P. ostreatus) to identify germplasm resistant to BBD using the IMP and IMSS methods.
We first found the IMP screening method could be used to assess the response of the three species in the Pleurotus genus to the pathogen P. tolaasii, which is consistent with previous studies that used this method on other kinds of mushrooms [27,29,37,38,39]. However, Zhang et al. [31] reported that it was difficult using the IMP method to distinguish between the host response or symptoms in P. ostreatus. This might be due to the selected disease scale and the length of the disease incubation period used for symptom evaluation. The main advantage of the IMP method is the application of a uniform inoculum directly on the host pileus for resistance evaluation. The high inoculum concentration (1 × 10⁸ CFU/mL) applied on the pileus was a complete resistance detection assay [40], which minimized the chance of disease escape to make immunity detection easy. Also, the IMP depicted all sources of inoculum that may land on the mushroom pileus, especially secondary infections that occur during the cultivation of the mushroom in farms, transportation, storage, and marketing [12].
The three Pleurotus species had a different incubating temperature for fruiting. However, it was not surprising to find that temperature had no significant influence on BBD severity. This was consistent with Wong and Preece [41], who noted changes in temperature and relative humidity during cultivation had no effects on BBD severity in A. bisporus. Thus, it was possible to compare and select resistant strains under the two different incubation temperatures.
Based on the IMP method, all of the 97 Pleurotus strains were susceptible to P. tolaasii infection, but the degrees of susceptibility varied among the strains. For example, among the P. pulmonarius strains, F65, F365, and F18 had significantly different means for disease severity, ranging from 1.07–3.30 (Table 2). Oliver et al. [27] also obtained a wide variation in response to BBD among Agaricus strains. The variations in susceptibility among the strains may be attributed to differences in genotype [33], fruiting body nutrient composition, texture, and quality [10,42]. Murata [43] noticed the activity of tolaasin, the core virulence factor, was triggered by the host and the signal strength may be influenced by the chemical composition of the mushroom fruiting body. Estrada et al. [37] also found differences in blotch symptom severity between two strains of P. eryngii, which contained varied inherent levels of copper that is a cofactor for tyrosinase in melanin synthesis or the browning of the diseased portions on the pileus [44,45].
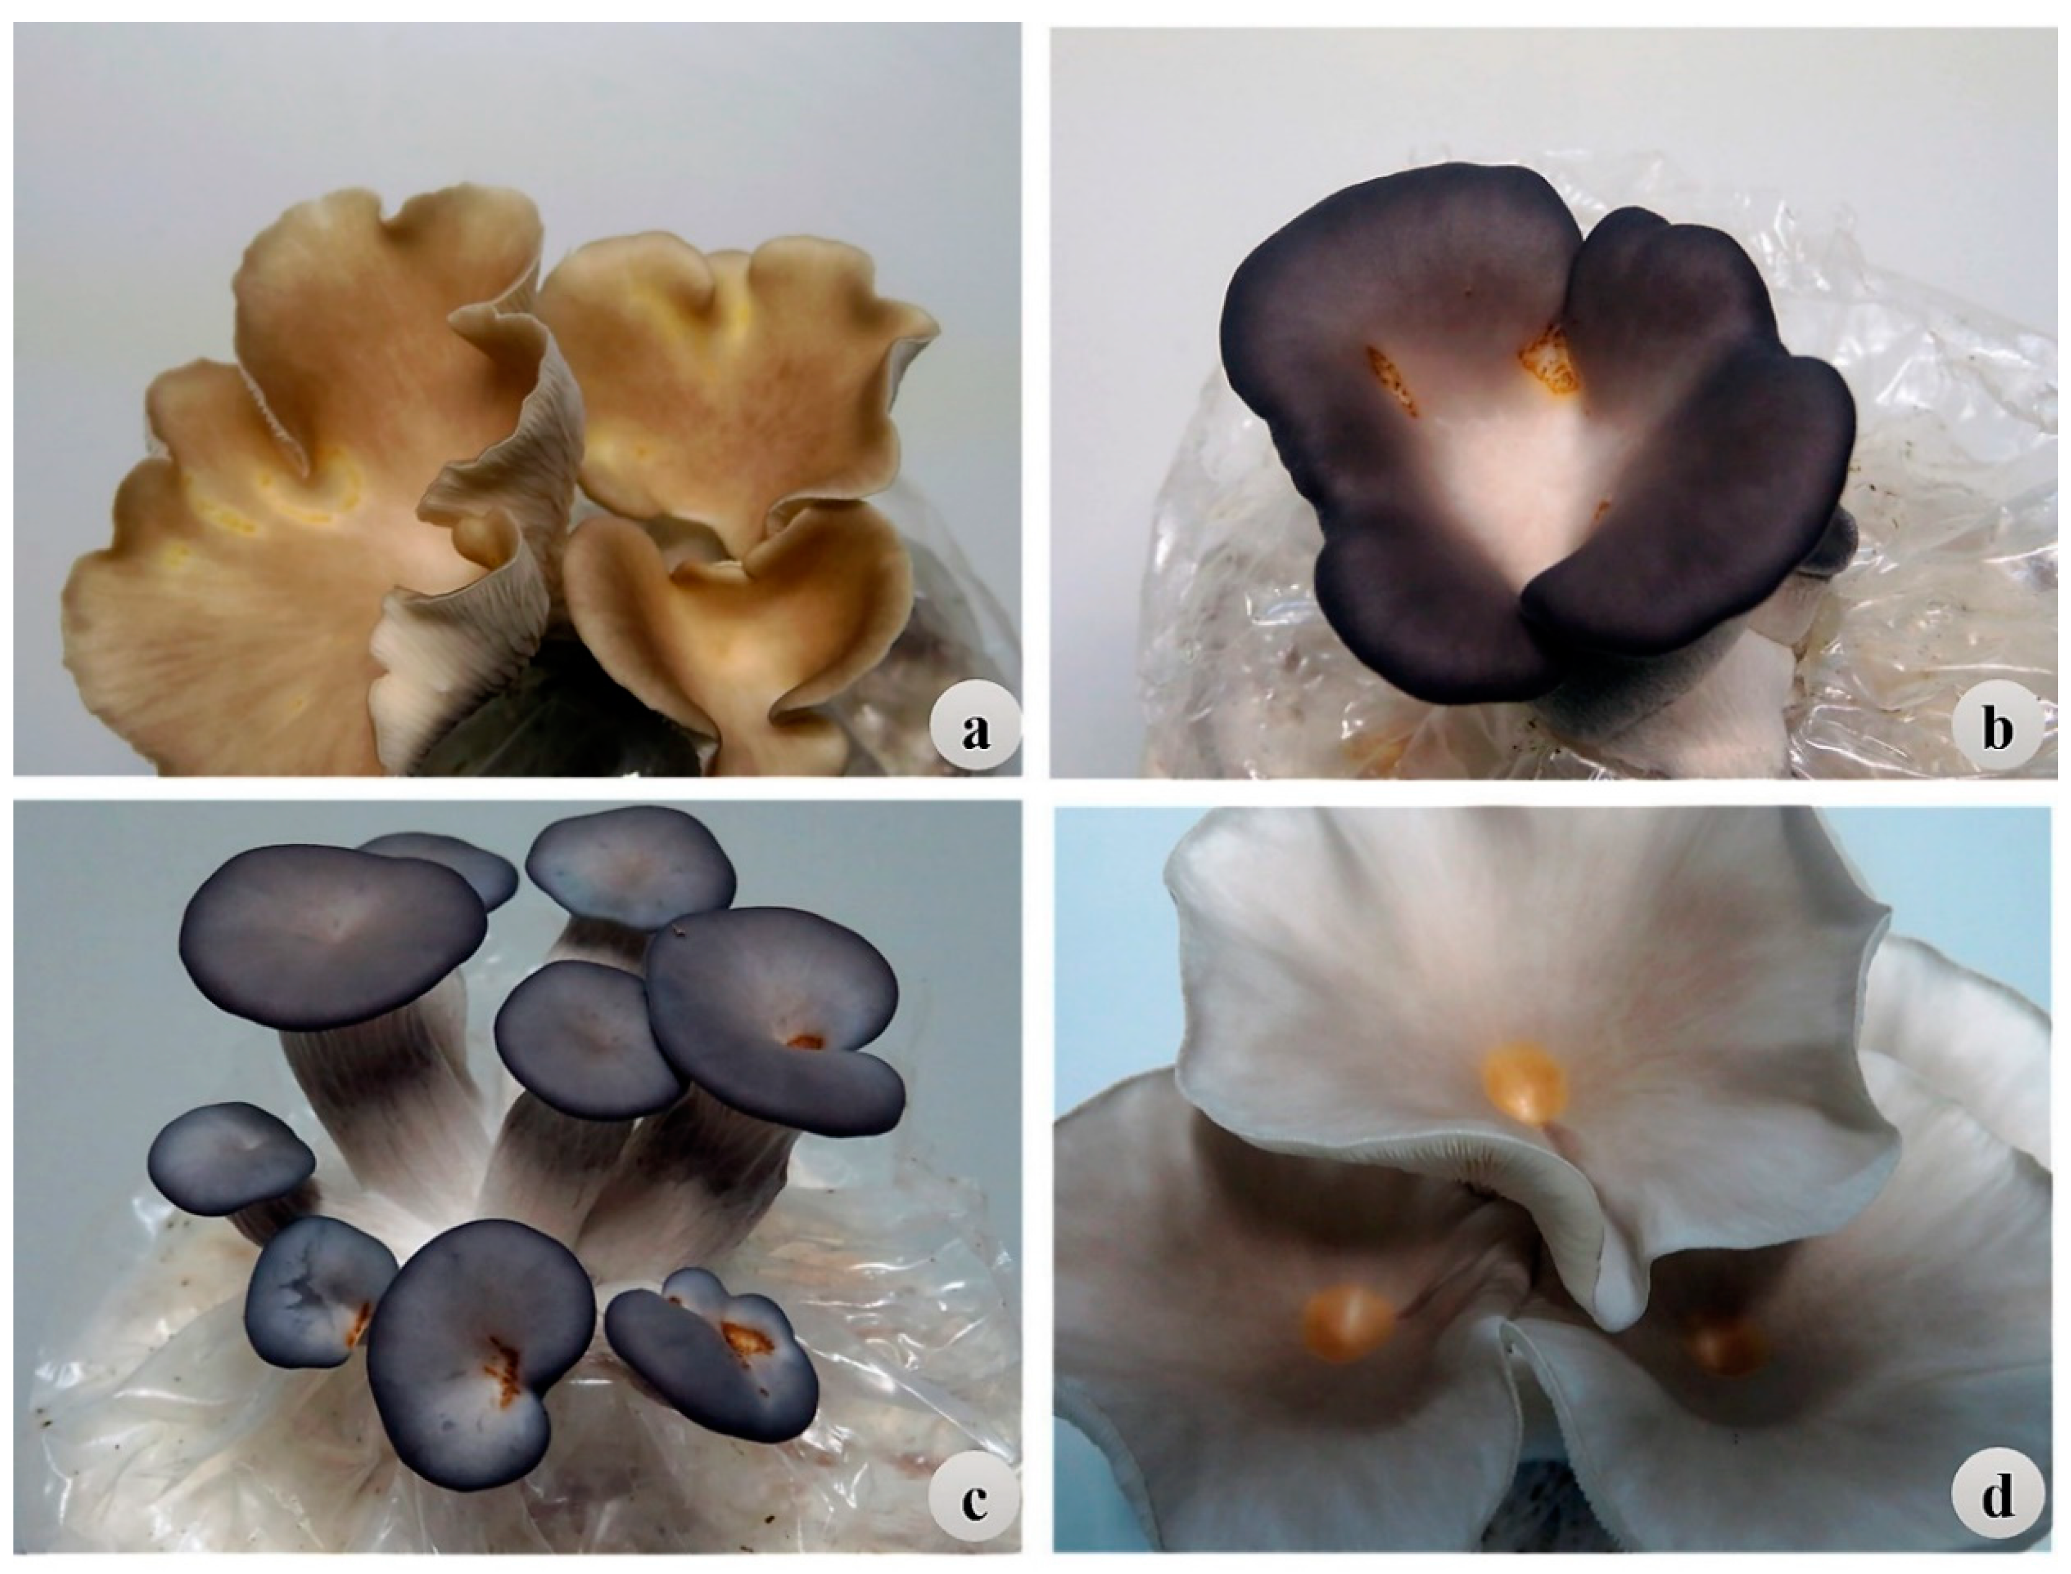
Compared to the IMP method, the IMSS method revealed a marked difference in resistance levels among the 97 strains. For example, among the P. cf. floridanus strains, P282 was highly susceptible, while P287 was highly resistant. Moreover, a higher level of resistance to BBD was observed for some strains as their fruiting bodies were completely symptomless. This contrasts with Zhang et al. [31], who observed partial resistance in 37 strains of P. ostreatus using the IMSS method. The study showed that besides the host pileus interacting with P. tolaasii, host vegetative mycelia interaction with P. tolaasii could prevent pathogen spread onto the pileus surface during the initial stages of fruiting body development. The vegetative mycelia of Pleurotus spp. are known to degrade living bacteria [46], and the antagonistic interactions between the host mycelia and the pathogen may reduce P. tolaasii population in the spawned substrate, which leads to less pathogen load reaching the mushroom pileus. The Pleurotus strains showed variable levels of P. tolaasii (CFU) in the substrate after the first flush harvest. Thus, the resistance of the strains may be related to P. tolaasii population in the spawn substrate. In contrast, Zhang et al. [31] reported no relationship between mushroom resistance and P. tolaasii population in the substrate.
Further, a possible resistance strategy obtained with the IMSS method is the escape of the host’s fruiting body from the minimum inoculum dosage required for successful infection. We found that three strains during the preliminary evaluation of the IMP method could carry ≈2.6 × 10⁵ cells of P. tolaasii/cap without showing symptoms on their fruiting bodies. Similar observations had been made on Agaricus mushrooms [27,47].
The classification of the strains into the susceptible and resistant groups was influenced by the methods (IMSS or IMP) used for assessment. For example, some strains (F324, P334, and P346) were completely symptomless using the IMSS; however, they showed symptoms in the IMP method. Additionally, there was a weak or no linear relationship for the responses of strain between the two screening methods. The discrepancy between the methods may be due to differences in the disease scales used for the study. Further, because the specific disease resistance mechanisms at the different mushroom growth stages (vegetative mycelia and fruiting) are poorly understood, it is possible that the IMP and IMSS screening methods exhibit distinct disease resistance mechanisms. The tendency of hosts to advance defenses throughout their developmental stages has been reported in numerous plant pathological systems and are considered paramount in disease management [48,49,50]. Considering the sources of pathogen inoculum and dissemination in mushroom farms, as well as the host developmental stage at which infection occurs, to identify resistance to BBD in a collection, the selection of genotypes was based on those with lowered DS in both screening methods, using their overall disease index (DI). The results suggest that the data from IMP and IMSS screening methods should be combined to enhance the selection process when evaluating resistance to BBD, because they reflect the primary and secondary routes of infection by P. tolaasii and demonstrate the accurate total resistance in the mushroom.
Our study identified P. pulmonarius and P. cf. floridanus strains as sources of resistance to P. tolaasii. On average, P. pulmonarius exhibited higher levels of resistance to P. tolaasii than P. cf. floridanus and P. ostreatus. Sixteen strains identified herein as partially resistant (both HR and MR) have the potential to reduce mushroom production losses due to BBD under both primary and secondary infections. Five strains, F122, F324, F344, and F9 of P. pulmonarius and P287 of P. cf. floridanus, ranked highly resistant. Compared to the other two species, none of the P. ostreatus strains included in the study were classified as partially resistant based on the DI. However, the large variance in susceptibility attributed to strains in the study indicated that individual strains rather than species are the most needed for breeding against P. tolaasii in further study. The Pleurotus collection originated from five provinces in China and two other countries (Pakistan and USA). However, there were no obvious trends for the association of BBD resistance to biogeography. Also, there was a range of resistance within the collection for both wild and cultivated strains. For example, most of the P. pulmonarius strains that were resistant to P. tolaasii were wild-type strains. In order to exploit the five highly resistant Pleurotus strains, exhaustive histological and molecular work is needed to elucidate the precise resistance mechanisms present in the Pleurotus collection. Further analyses on the nutritional composition and structural characteristics of the resistant strains are required in order to introgress the resistance to other popular strains by breeding.

4. Materials and Methods

4.1. Mushroom Strains and Cultivation Under Controlled Environment

For the germplasm evaluation, a total of 97 strains of Pleurotus (56 P. pulmonarius, 20 P. ostreatus, 21 P. cf. floridanus) were identified and provided by the Engineering Research Center for Edible and Medicinal Fungi (ERCEMF), Jilin Agricultural University, Jilin Province, China (Supplementary Table S1). These strains were cultured on potato dextrose agar (PDA) and incubated at 25 °C for 5–8 days to resume active growth. Two different trials were performed by different inoculation methods: The first trial was inoculated using the IMP method from August to November 2017, and the second trial was inoculated using the IMSS method from April to July 2018. Both experiments were carried out in controlled incubation rooms at the Mushroom Base of Jilin Agriculture University, China. The cultivation substrate filled into 9 × 8 × 20 cm polyethylene bag consisted of 2:1:2 ratio (w/w) of 40% sawdust, 19% wheat straw, 40% corn straw, supplemented with 1% (w/w) calcium carbonate, and moistened to 60%. The bags were autoclaved at 121 °C for 2 hours (h) and inoculated with fungal mycelia (10 bags/strain). For each trial, 1555 and 300 inoculated bags were completely randomized, respectively, in two incubation rooms at 25 ± 1 °C, 75% RH, and 1000–2000 ppm CO2 for 21 days. After spawn run, in order to satisfy the different fruiting requirement of different species, the conditions were adjusted to 21 ± 1°C, 90% RH, 150 lux light, and 500–600 ppm CO2 for P. cf. floridanus and P. pulmonarius strains in room 1 and 18 ± 1°C, 90% RH, 150 lux light, and 500–600 ppm CO2 for P. ostreatus strains in room 2, respectively [34,51,52]. The same substrate ingredients, formula, and incubation rooms were used for the two trials.

4.2. Bacteria Strain

The bacterial strain (Pt011W) used in this study was isolated from brown blotch infected caps of cultivated P. ostreatus at the mushroom farm of Huazhong Agriculture University, China, 2017. The strain Pt011W, which has never been used for resistance screening before, was maintained at −80 °C in the ERCEMF. The identity of Pt011W was verified by 16S ribosomal RNA (16S rRNA), RNA polymerase beta subunit (rpoβ), and tolaasin biosynthesis gene. The total bacterial genomic DNA was isolated using a BioFlux Kit (Bioer Tech. Co. Ltd. China). PCR amplifications were performed with primer pairs 27F/1492R for 16S rRNA and rpoB-PSF/rpoB-PTR for rpoβ in a Bio-Rad T100 thermal cycler (Bio-Rad Lab. Inc. Ltd., USA) [53,54] and Pt-1A/ Pt-1D1 for tolaasin biosynthesis gene (Supplementary Table S2) [36]. PCR products were sequenced at Sangon Biotech Co. Ltd. Changchun, China. The resultant sequences of Pt011W were compared with sequences of Pseudomonas spp. in GenBank for homology using the BLASTn suite of the National Center for Biotechnology Information (NCBI). To infer the phylogenetic relationship of Pt011W within representative Pseudomonas spp., a neighbor-joining (NJ) tree from their concatenated 16S rRNA and rpoβ sequence alignment was constructed with a T92+G model and 1000 bootstrap replicates in MEGA 7 software (Supplementary Table S3) [55].

4.3. Inoculum Preparation

The single colony of P. tolaasii Pt011W was cultured in LB liquid medium (Solarbio S&T Co. Ltd., Beijing, China) and incubated at 25 °C for 16 h by orbital shaking at 150 rpm. After being centrifuged at 5000 rpm, the bacterial pellets were re-suspended in sterile distilled water. The density was adjusted to 0.3 absorbance at 450 nm using a spectrophotometer (Spectramax i3, Molecular Devices, LLC. San Jose, CA. USA) according to Rama et al. [39]. Viable cell count expressed as colony-forming units/mL (CFU/mL) was estimated by the spread plate method on LB solid medium at appropriate dilutions and incubated at 25 °C for 48 h. Three replicate spread plates were used to estimate mean cell count. The bacteria inoculum suspension provided ≈ 1.3 ± 0.2 × 10⁸ CFU/ml for both experiments.

4.4. Pathogenicity and the Efficacy of the IMP Method for Resistance Evaluation

The pathogenicity of P. tolaasii strain Pt011W and the efficacy of the IMP method for resistance evaluation was first verified using different concentrations of the bacterial suspension applied to three strains, P0 (P. ostreatus), P282 (P. cf. floridanus), and PPU (P. pulmonarius). Six dosages, 1.3 × 10⁸, 8.7 × 10⁷, 6.5 × 10⁷, 4.3 × 10⁷, 2.6 × 10⁷, 1.3 × 10⁷ CFU/mL, were prepared by diluting the initial inoculum (≈ 1.3 × 10⁸ CFU/mL) with sterile distilled water in the ratio 1:0, 1:0.5, 1:1, 1:2, 1:4, 1:9. The inoculation procedure involved dripping 20 µL aliquot of inoculum suspension onto the pileus surface (IMP) in situ was used [27]. When the pileus diameter was about 2–4 cm, the inoculum was dripped onto the pileus surface of three randomly selected caps/bag. For each strain, the treatment was performed on six bags as replications. Caps treated with sterile water served as controls. In the first experiment, all the fruiting bodies of mushroom in situ were incubated in room 1. The same experiment was repeated in room 2 (second experiment) using different bags but the same strains (P0, P282, and PPU) to detect whether the fruiting temperature had an influence on BBD severity.
Blotch symptoms appeared on the treated caps 24 hours after inoculation but failed to spread, except the portion inoculated on the pileus surface. The DS of each treated cap was assessed based on the blotch lesion morphology or the extent of discoloration [27]. The scale ratings were measured from 0–5 with 0 = no symptom; 0.5 = very pale lesion difficult to distinguish from the cap; 1 = level yellowish lesion; 2 = level brown lesions; 3 = slightly sunken lesion; 4 = extensive brown sunken lesion; 5 = extensive dark sunken lesions occasionally with sticky cytosolic material. Observation and rating of developed symptoms were carried out at 24, 48, and 72 hours after inoculation (HAI).

4.5. Characterization of 97 Pleurotus Strains for Resistance to BBD

Two screening methods, IMP and IMSS, were used to investigate the resistance response of each Pleurotus strain to P. tolaasii Pt011W infection in two separate experiments. In 2017, a total of 97 Pleurotus strains were tested by the IMP method using ≈1 × 10⁸ CFU/mL of Pt011W inoculum suspension. The infection assay was performed as described above with slight modifications. All of the P. cf. floridanus and P. pulmonarius strains were incubated in room 1, and those of P. ostreatus in room 2. For each strain, the first flush fruiting bodies of 10 bags (three randomly selected caps/bag) were treated with the bacterial inoculum. Blotch symptoms were assessed visually at 48 HAI using the 0–5 lesion morphology scale mentioned above. The experiment was repeated for the second flush fruiting. Then the average DS score (DS1) of the two flushes/bag was determined for each strain. The DS1 was used to rate the reaction of the host as HR (DS1 ≤ 0.5), MR (DS1 ≤ 1.5), MS (DS1 ≤ 2.5), S (DS1 ≤ 3.5), or HS (DS1 > 3.5).
In 2018, the IMSS screening method was used to assess the resistance of the same 97 Pleurotus mushroom strains to Pt011W infection [31]. After 21 days of spawn run, each spawned substrate bag was sprayed with 1 ml of bacterial inoculum suspension (≈1 × 10⁸ CFU/mL) using a mini hand sprayer. The bags were further incubated for five days before the incubation conditions were adjusted in each room for the formation of fruiting bodies. During the fruiting period, the mushrooms were observed daily for the presence and development of blotch symptoms. Blotch symptoms developed on the pinhead fruiting bodies but were more visible on primordial and pileus surface. At maturity (diameter of caps about 2–4 cm), the severity of the disease was assessed based on blotch lesion size and the proportion (%) of cap surface area covered by the blotches on a scale of 0–3, where 0 =no symptom; 1= slight symptom with few spotty blotches (0.1–1% area affected); 2 = moderate symptom with many spotty blotches (1–5% area affected); 3 = severe symptom with many spotty or large blotches (>5% area affected) (adapted from [31,41]). To avoid substrate contamination, the first flush fruiting bodies were carefully harvested and bags were incubated for the second flush fruiting. Similar symptoms were observed and assessed in the second flush fruiting. From these two flushes, the mean DS score (DS2) from the 10 replicate bags (3 caps assessed/flush/bag) was determined for each strain. Host reactions were rated on the basis of the DS2 obtained as HR (DS2 ≤ 0.5), MR (DS2 ≤ 1.0), MS (DS2 ≤ 1.5), S (DS2 ≤ 2.0) or HS (DS2 > 2.0).

4.6. Detection of P. tolaasii on Mushroom Caps and Quantification in Spawned Substrate Bags

During the IMP and IMSS screening trials, blotch symptomatic caps were picked frequently for bacterial re-isolation. Cut tissue segments containing blotches were macerated in 10 ml sterilized distilled water and evenly spread on Pseudomonas Agar for the detection of fluorescein (PAF agar) (Solarbio S&T Co. Ltd., Beijing, China). The plates were incubated at 25 °C for 48 h. Based on morphology, the colonies were identified as previously described [35] to fulfill Koch’s postulates. The identities of the colonies were further confirmed by DNA extraction and PCR methods using two sets of primers Pt-1A/Pt-1D1 (5’ATCCCTTCGGCGTTTACCTG3’/5’CAAAGTAACCCTGCTTCTGC3’) and Pt-PM/Pt- QM (5’TGCCTTACGCGCTGATTGGC3’/5’TGATCAAACTCCAGCAATAG3’) [36].
For the quantification of the bacteria in the substrate bags, 14 strains selected randomly were assessed. The spawn material, 20 g/strain was collected from five bags (4 g/bag) after the first flush harvest. Then, 10 g aliquot was suspended in 50 ml of sterile distilled water and agitated on an orbital shaker (150 rpm) at 25 °C for 10 min. Nine serial dilutions with sterile water were prepared from the supernatant and 100 µL aliquots from each diluted suspension plated on PAF agar. Three replicates were prepared and subsequently incubated at 25 °C for 48 h. The colonies were identified, and their average count/strain determined by plate counting (CFU/mL), which was reported as CFU/10g of the spawned substrate.

4.7. Statistical Analysis

Prior to each analysis, data were subjected to a Q–Q plot for normality and homogeneity of variance [56]. A 3-way crossed analysis of variance (ANOVA) model was used to determine the effects of temperature (21 °C and 18 °C), strain (P0, P282, and PPU), inoculum dosages (7 levels), and their interactions on BBD severity. The mixed procedure was used to estimate the variance components of each factor as a random effect by the Kenward and Roger approximation method [57]. The analysis was repeated for each disease assessment period (24, 48, and 72 HAI) to determine the best time for symptom evaluation.
Data obtained from the two screening experiments and bacteria counts were subjected to ANOVA to detect statistical significance. Heterogeneous group means were separated with Duncan’s multiple range test (DMRT). For clarity in data presentation, the analysis of relative responses of mushroom strains was done for each species group. Rather than performing interspecies group contrast, the added variance due to species was estimated using the variance component analysis. Furthermore, a mixed effect model consisting of strains nested within species was used.
Pearson correlation index (r) was used to examine the relationship between the behaviors of strains response to BBD in the two screening experiments, using their mean DS values as bivariate data. All statistical tests were performed at 5% significance level in Minitab® 18.1 software (Minitab, LLC. USA) [58]. The average DS scores from the IMP screening method (DS1) and that from the IMSS method (DS2) were pooled for each strain tested to obtain DI, using the formula:
DI = 0.5   ( 1 5 DS 1 + 1 3 DS 2 ) ×   100   %
where DI = overall disease severity index, DS = disease severity, and the denominators 5 and 3 represent the highest rating on the symptom severity scale of the IMP and IMSS method, respectively. The overall reaction of the host to BBD was rated based on DI as HR (DI ≤ 15.0%), MR (DI ≤ 25.0%), MS (DI ≤ 40.0%), S (DI ≤ 55.0%), or HS (DI > 55.1%).

Supplementary Materials

The following are available online at https://www.mdpi.com/2076-0817/8/4/227/s1. Figure S1. The phylogenetic relationship between P. tolaasii strain Pt011W and other Pseudomonas spp., inferred by the neighbor-joining method based on the concatenated 16S rRNA and rpoβ gene sequence data; Table S1. List of fungal strains used in the study, herbarium ID, and site of collection; Table S2. List of genes and primers used for characterization of P. tolaasii strain Pt011W; Table S3. Pseudomonas species and GenBank accession numbers of strains used in phylogenetic analyses.

Author Contributions

Y.F. and Y.L. conceptualized the research. B.A.O. designed and performed experiments and prepared a draft manuscript. D.D., S.X., and Z.L. supported in conducting the experiments. B.S. and F.L.S. reviewed the experiments and statistical analysis. Y.F. and Y.L. approved the final data. H.S., Y.F., and F.L.S. contributed to subsequent revisions of the manuscript. All authors read and approved the manuscript prior to submission.

Funding

This study was financially supported by the National Natural Science Foundation of China (No. 31700012); the Education Department of Science and Technology Project of Jilin Province (No. JJKH20180673KJ); the Scientific Research Foundation for the Returned Overseas Chinese Scholars; “111” Project (No. D17014); and the International Cooperation Research Center of China (2017B01011).

Acknowledgments

We are grateful to Yinbin Bian of Huazhong Agriculture University, China for providing the bacteria strain.

Conflicts of Interest

The authors declare no conflicts of interest.

Abbreviations

BBD: Brown blotch disease; DI: Disease index; DS: Disease severity; HAI: Hours after inoculation; IMP: Inoculation of the pathogen on mushroom pileus; IMSS: Inoculation of the pathogen on mushroom spawned substrate; HR: Highly resistant; MR: Moderately resistant; MS: Moderately susceptible; S: Susceptible; HS: Highly susceptible.

References

  1. Bellettini, M.B.; Fiorda, F.A.; Maieves, H.A.; Teixeira, G.L.; Avila, S.; Hornung, P.S.; Junior, A.M.; Ribani, R.H. Factors affecting mushroom Pleurotus spp. Saudi J. Biol. Sci. 2016. [Google Scholar] [CrossRef] [PubMed]
  2. Zied, D.C.; Pardo-Giménez, A. Edible and Medicinal Mushrooms: Technology and Applications; John Wiley & Sons: Hoboken, NJ, USA, 2017. [Google Scholar]
  3. Wu, S.; Zhao, C.; Hou, B.; Tai, L.; Gui, M. Analysis on Chinese edible fungus production area layout of nearly five years. Edible Fungi China 2013, 1, 51–53. [Google Scholar]
  4. Han, H.-S.; Jhune, C.-S.; Cheong, J.-C.; Oh, J.-A.; Kong, W.-S.; Cha, J.-S.; Lee, C.-J. Occurrence of black rot of cultivated mushrooms (Flammulina velutipes) caused by Pseudomonas tolaasii in Korea. Eur. J. Plant Pathol. 2012, 133, 527–535. [Google Scholar] [CrossRef]
  5. Suyama, K.; Fujii, H. Bacterial disease occurred on cultivated mushroom in Japan. J. Agric. Sci. Tokyo Nogyo Daigaku 1993, 38, 35–50. [Google Scholar]
  6. Tsuneda, A.; Suyama, K.; Murakami, S.; Ohira, I. Occurrence of Pseudomonas tolaasii on fruiting bodies of Lentinula edodes formed on Quercus logs. Mycoscience 1995, 36, 283–288. [Google Scholar] [CrossRef]
  7. González, A.; González-Varela, G.; Gea, F. Brown blotch caused by Pseudomonas tolaasii on cultivated Pleurotus eryngii in Spain. Plant Dis. 2009, 93, 667. [Google Scholar] [CrossRef]
  8. Gill, W. Bacterial diseases of Agaricus mushrooms. Rep. Tottori Mycol. Inst. (Jpn.) 1995, 33, 34–55. [Google Scholar]
  9. Rainey, P.B.; Brodey, C.L.; Johnstone, K. Biological properties and spectrum of activity of tolaasin, a lipodepsipeptide toxin produced by the mushroom pathogen Pseudomonas tolaasii. Physiol. Mol. Plant Pathol. 1991, 39, 57–70. [Google Scholar] [CrossRef]
  10. Soler-Rivas, C.; Jolivet, S.; Arpin, N.; Olivier, J.; Wichers, H. Biochemical and physiological aspects of brown blotch disease of Agaricus bisporus. FEMS Microbiol. Rev. 1999, 23, 591–614. [Google Scholar] [CrossRef]
  11. Sante, L.; Savoie, J.; Foulongneoriol, M.; Largeteau, M.; Barroso, G. Recent advances on bacterial disease of cultivated mushrooms. In Proceedings of the 7th International Conference on Mushroom Biology and Mushroom Products, Arcachon, France, 4–7 October 2011; pp. 4–7. [Google Scholar]
  12. Gaze, R.H. Mushroom Pest and Disease Control: A Colour Handbook; Academic Press: San Diego, CA, USA, 2008. [Google Scholar]
  13. Munsch, P.; Alatossava, T. Several pseudomonads, associated with the cultivated mushrooms Agaricus bisporus or Pleurotus sp., are hemolytic. Microbiol. Res. 2002, 157, 311–315. [Google Scholar] [CrossRef]
  14. Fermor, T.R.; Henry, M.B.; Fenlon, J.S.; Glenister, M.J.; Lincoln, S.P.; Lynch, J.M. Development and application of a biocontrol system for bacterial blotch of the cultivated mushroom. Crop Prot. 1991, 10, 271–278. [Google Scholar] [CrossRef]
  15. Rainey, P.; Brodey, C.; Johnstone, K. Biology of Pseudomonas tolaasii, cause of brown blotch disease of the cultivated mushroom. Adv. Plant Pathol. 1992, 8, 95–117. [Google Scholar]
  16. Bruno, G.L.; Rana, G.L.; Sermani, S.; Scarola, L.; Cariddi, C. Control of bacterial yellowing of cardoncello mushroom Pleurotus eryngii using acetic or hydrochloric acid solutions. Crop Prot. 2013, 50, 24–29. [Google Scholar] [CrossRef]
  17. Diamantopoulou, P.; Philippoussis, A.; Lahouvaris, L.; Parissopoulos, G. The effect of calcium chloride irrigation on yield and quality of Agaricus bisporus. Mushroom Sci. 2000, 15, 475–489. [Google Scholar]
  18. Geels, F. Pseudomonas tolaasii control by kasugamycin in cultivated mushrooms (Agaricus bisporus). J. Appl. Bacteriol. 1995, 79, 38–42. [Google Scholar] [CrossRef]
  19. Lomax, K. Dew point temperature related to wet mushroom caps. Mushroom News-Kennett Sq. Wash. 2007, 55, 4. [Google Scholar]
  20. Malpani, M.; Rajput, P.; Ghodile, N. Effect of medicinally potential plant extracts and isolated ingredients on pathogen damaging mushroom cultivation in Vidarbha region of India. In Proceedings of the 18th Congress of ISMS, Beijing, China, 25–30 August 2012; pp. 390–393. [Google Scholar]
  21. Lo Cantore, P.; Lazzaroni, S.; Coraiola, M.; Serra, M.D.; Cafarchia, C.; Evidente, A.; Iacobellis, N.S. Biological characterization of white line-inducing principle (WLIP) produced by Pseudomonas reactans NCPPB1311. Mol. Plant-Microbe Interact. 2006, 19, 1113–1120. [Google Scholar] [CrossRef]
  22. Tsukamoto, T.; Shirata, A.; Murata, H. Isolation of a Gram-positive bacterium effective in suppression of brown blotch disease of cultivated mushrooms, Pleurotus ostreatus and Agaricus bisporus, caused by Pseudomonas tolaasii. Mycoscience 1998, 39, 273–278. [Google Scholar] [CrossRef]
  23. Wu, R.M.; Palmer, B.; Cole, A. Phenotypic variation and survival of genetically marked Pseudomonas tolaasii in mushroom compost. Can. J. Microbiol. 1998, 44, 373–377. [Google Scholar] [CrossRef]
  24. Cutri, S.; Macauley, B.; Roberts, W. Characteristics of pathogenic non-fluorescent (smooth) and non-pathogenic fluorescent (rough) forms of Pseudomonas tolaasii and Pseudomonas gingeri. J. Appl. Bacteriol. 1984, 57, 291–298. [Google Scholar] [CrossRef]
  25. Sinha, H.; Pain, A.; Johnstone, K. Analysis of the role of recA in phenotypic switching of Pseudomonas tolaasii. J. Bacteriol. 2000, 182, 6532–6535. [Google Scholar] [CrossRef] [PubMed]
  26. Fletcher, J. Disease resistance in protected crops and mushrooms. Euphytica 1992, 63, 33–49. [Google Scholar] [CrossRef]
  27. Olivier, J.; Mamoun, M.; Munsch, P. Standardization of a method to assess mushroom blotch resistance in cultivated and wild Agaricus bisporus strains. Can. J. Plant Pathol. 1997, 19, 36–42. [Google Scholar] [CrossRef]
  28. Soler-Rivas, C. Molecular Aspects of the Bacterial Blotch Disease of Agaricus bisporus. Ph.D. Thesis, University Claude-Bernard, Lyon, France, 1998. [Google Scholar]
  29. Moquet, F.; Mamoun, M.; Olivier, J. Pseudomonas tolaasii and tolaasin: Comparison of symptom induction on a wide range of Agaricus bisporus strains. FEMS Microbiol. Lett. 1996, 142, 99–103. [Google Scholar] [CrossRef]
  30. Peng, J. Resistance to Disease in Agaricus bisporus (Lange) Imbach. Ph.D. Thesis, University of Leeds, Leeds, UK, 1986. [Google Scholar]
  31. Zhang, R.Y.; Hu, D.D.; Gu, J.G.; Zuo, X.M.; Hu, Q.X.; Zhang, J.X. Evaluation of oyster mushroom strains for resistance to Pseudomonas tolaasii by inoculation in spawned substrates. Eur. J. Plant Pathol. 2013, 137, 119–126. [Google Scholar] [CrossRef]
  32. Loftus, M.; Moore, D.; Elliott, T. DNA polymorphisms in commercial and wild strains of the cultivated mushroom, Agaricus bisporus. Theor. Appl. Genet. 1988, 76, 712–718. [Google Scholar] [CrossRef]
  33. Wu, D.; Zhang, Z.; Zhang, R.; Hu, D.; Gu, J.; Hu, Q. Characterization of 18 novel polymorphic SSR markers and evaluation of genetic diversity within oyster mushroom strains cultivated in China. Acta Edulis Fungi 2012, 19, 15–25. [Google Scholar]
  34. Rajarathnam, S.; Bano, Z.; Miles, P.G. Pleurotus mushrooms. Part I A. Morphology, life cycle, taxonomy, breeding, and cultivation. Crit. Rev. Food Sci. Nutr. 1987, 26, 157–223. [Google Scholar] [CrossRef]
  35. Wong, W.; Preece, T. Identification of Pseudomonas tolaasi: The white line in agar and mushroom tissue block rapid pitting tests. J. Appl. Bacteriol. 1979, 47, 401–407. [Google Scholar] [CrossRef]
  36. Lee, H.I.; Jeong, K.S.; Cha, J.S. PCR assays for specific and sensitive detection of Pseudomonas tolaasii, the cause of brown blotch disease of mushrooms. Lett. Appl. Microbiol. 2002, 35, 276–280. [Google Scholar] [CrossRef]
  37. Estrada, A.R.; Royse, D. Yield, size and bacterial blotch resistance of Pleurotus eryngii grown on cottonseed hulls/oak sawdust supplemented with manganese, copper and whole ground soybean. Bioresour. Technol. 2007, 98, 1898–1906. [Google Scholar] [CrossRef] [PubMed]
  38. Moquet, F.; Desmerger, C.; Mamoun, M.; Ramos-Guedes-Lafargue, M.; Olivier, J.M. A quantitative trait locus of Agaricus bisporus resistance to Pseudomonas tolaasii is closely linked to natural cap color. Fungal Genet. Biol. 1999, 28, 34–42. [Google Scholar] [CrossRef] [PubMed]
  39. Rama, T.; Mamoun, M.; Olivier, J. Rapid extraction of a bacteria free fraction inducing blotch symptoms on Agaricus bisporus. Mushroom Sci. 1995, 14, 571–577. [Google Scholar]
  40. Vale, F.X.R.; Parlevliet, J.; Zambolim, L. Concepts in plant disease resistance. Fitopatol. Bras. 2001, 26, 577–589. [Google Scholar] [CrossRef]
  41. Wong, W.; Preece, T. Pseudomonas tolaasii in cultivated mushroom (Agaricus bisporus) crops: Numbers of the bacterium and symptom development on mushrooms grown in various environments after artificial inoculation. J. Appl. Bacteriol. 1982, 53, 87–96. [Google Scholar] [CrossRef]
  42. Burton, K.S.; Hammond, J.B.W.; Minamide, T. Protease activity in Agaricus bisporus during periodic fruiting (flushing) and sporophore development. Curr. Microbiol. 1994, 28, 275–278. [Google Scholar] [CrossRef]
  43. Murata, H. Toxin production in a mushroom pathogenic bacterium, Pseudomonas tolaasii strain PT814 is activated by signals present in a host, Pleurotus ostreatus, and those accumulating in the medium in the course of bacterial growth. In Mushroom Biology and Mushroom Products, Proceedings of the 2nd International Conference, University Park, PA, USA, 9–12 June 1996; Royse, D.J., Ed.; Penn State University Press: University Park, PA, USA, 1996; pp. 483–494. [Google Scholar]
  44. Beelman, R.; Simons, S.; Miklus, M. Relationship between copper accumulation and yield and quality of fresh mushrooms. Mushroom Sci. 1995, 14, 765–770. [Google Scholar]
  45. Münger, K.; Lerch, K.; Tschierpe, H. Metal accumulation in Agaricus bisporus: Influence of Cd and Cu on growth and tyrosinase activity. Experientia 1982, 38, 1039–1041. [Google Scholar] [CrossRef]
  46. Tsuneda, A.; Thorn, G. Interactions between Lentinula edodes and pseudomonads. Can. J. Microbiol. 1994, 40, 937–943. [Google Scholar] [CrossRef]
  47. Nair, N.; Bradley, J. Mushroom blotch bacterium during cultivation. Mushroom J. 1980, 90, 201–203. [Google Scholar]
  48. Develey-Rivière, M.P.; Galiana, E. Resistance to pathogens and host developmental stage: A multifaceted relationship within the plant kingdom. New Phytol. 2007, 175, 405–416. [Google Scholar] [CrossRef] [PubMed]
  49. Ficke, A.; Gadoury, D.M.; Seem, R.C. Ontogenic resistance and plant disease management: A case study of grape powdery mildew. Phytopathology 2002, 92, 671–675. [Google Scholar] [CrossRef] [PubMed]
  50. Qi, Z.; Mew, T. Adult-plant resistance of rice cultivars to bacterial blight. Plant Dis. 1985, 69, 896–898. [Google Scholar]
  51. Ahmed, S.A.; Kadam, J.; Mane, V.; Patil, S.; Baig, M. Biological efficiency and nutritional contents of Pleurotus florida (Mont.) Singer cultivated on different agro-wastes. Nat. Sci. 2009, 7, 44–48. [Google Scholar]
  52. Shah, Z.; Ashraf, M.; Ishtiaq, C.M. Comparative study on cultivation and yield performance of oyster mushroom (Pleurotus ostreatus) on different substrates (wheat straw, leaves, saw dust). Pak. J. Nutr. 2004, 3, 158–160. [Google Scholar]
  53. Godfrey, S.; Harrow, S.; Marshall, J.; Klena, J. Characterization by 16S rRNA sequence analysis of pseudomonads causing blotch disease of cultivated Agaricus bisporus. Appl. Environ. Microbiol. 2001, 67, 4316–4323. [Google Scholar] [CrossRef]
  54. Sajben, E.; Manczinger, L.; Nagy, A.; Kredics, L.; Vágvölgyi, C. Characterization of pseudomonads isolated from decaying sporocarps of oyster mushroom. Microbiol. Res. 2011, 166, 255–267. [Google Scholar] [CrossRef]
  55. Kumar, S.; Stecher, G.; Tamura, K. MEGA7: Molecular evolutionary genetics analysis version 7.0 for bigger datasets. Mol. Biol. Evol. 2016, 33, 1870–1874. [Google Scholar] [CrossRef]
  56. Bartlett, M.S. Properties of sufficiency and statistical tests. Proc. R. Soc. Lond. Ser. A-Math. Phys. Sci. 1937, 160, 268–282. [Google Scholar]
  57. Littell, R.C.; Milliken, G.A.; Stroup, W.W.; Wolfinger, R.D. SAS System for Mixed Models; SAS Institute. Inc.: Cary, NC, USA, 1996. [Google Scholar]
  58. Minitab, I. Minitab Statistical Software Release 18.1 for Windows. State College, PA, USA. 2017. Available online: https://www.minitab.com/en-us/ (accessed on 20 March 2017).
Figure 1. Brown blotch disease (BBD) symptoms caused by P. tolaasii strain Pt011W on fruiting bodies of three Pleurotus strains, 48 hours after inoculation. (A1–C1) Botch symptoms on mushroom caps inoculated with ≈ 2.6 × 10⁶ CFU/20 µL of P. tolaasii. (A2–C2) Healthy mushroom inoculated with sterile water. (A1,A2) P. pulmonarius (PPU), (B1,B2) P. cf. florida (P282), (C1,C2) P. ostreatus (P0).
Pathogens 08 00227 g001
Figure 2. Development of BBD over an infection time course from 24–72 HAI with P. tolaasii strain Pt011W inoculum suspension on mushroom caps of three Pleurotus strains (P0, P282, and PPU) in a controlled environment. (ac) Blotch symptom severity with increasing levels of inoculum dosage at 24, 48, and 72 HAI, respectively. (d) Symptom progression on the three strains using the optimum inoculum dosage. Disease severity (DS) rating was based on a 0–5 scale according to the extent of tissue discoloration and nature, where 0 = no symptom; 0.5 = very pale lesion difficult to distinguish from the cap; 1 = level yellowish lesion; 2 = level brown lesions; 3 = slightly sunken lesion; 4 = extensive brown sunken lesion; 5 = extensive dark sunken lesions occasionally with sticky cytosolic material [28]. Data are mean disease severity scores of two trials (at 18 °C and 21 °C), each with six bags treated (three fruiting caps inoculated/bag)/strain. Bars are the standard errors of the means.
Pathogens 08 00227 g002
Figure 3. Typical symptoms of BBD on mushroom fruiting bodies after inoculation of P. tolaasii on the mushroom spawned substrate (a–c) and on the mushroom fruiting cap (d). (a) P. pulmonarius, (b) P. cf. florida, (c,d) P. ostreatus.
Pathogens 08 00227 g003
Figure 4. Molecular detection of P. tolaasii using DNA template isolated from three selected colonies (Lanes 1, 2, and 3) growing on PAF agar. Amplified products were obtained in a nested PCR assay. Profile A is the first-round PCR product (449 bp) with primer set Pt-1A/Pt-1D1, and B second-round PCR product (249 bp) with the internal primer set Pt-PM/Pt-QM as described in Lee et al. [36]. They were separated in agarose gel electrophoresis. Lane M, Trans2K DNA Marker (TransGen Ltd., China). DNA fragments of 449 bp and 249 bp indicate the presence of P. tolaasii.
Pathogens 08 00227 g004
Table 1. Results of the ANOVA test and variance component estimate for the main, 2- and 3-way interactive effects of strain (S), incubation temperature (T), and inoculum dosage (D) on the progression of BBD severity, 24–72 hours after inoculation.
Time (h) After the Inoculation of P. tolaasii
24 h48 h72 h24 h48 h72 h
Source of variationdfp-valuep-valuep-valueVariance component estimate (%)
Strain20.0000.0000.0002.444.745.80
Temp10.6780.1610.2200.000.070.04
Dosage60.0000.0000.00086.0182.1581.99
Strain*Temp20.8630.7890.9700.000.000.00
Strain*Dosage120.0140.0000.0001.124.564.63
Temp*Dosage60.9110.7510.7570.000.000.00
Strain*Temp*Dosage120.8841.0000.9920.000.000.00
Error210 10.448.477.55
Total251 100.00100.00100.00
df = degrees of freedom; p-values < 0.05 were considered significant. * Interaction.
Table 2. BBD severity and resistance ratings of 56 P. pulmonarius strains based on screening with two methods via the inoculation of the pathogen on mushroom cap or pileus method (IMP) and on the mushroom spawned substrate method (IMSS).
Screening with the IMP Method XScreening with the IMSS Method YOverall Disease Response (DI) Z
NoStrain IDOriginTypeCap ColorDisease Severity (DS1)Resistance RatingDisease Severity (DS2)Resistance RatingOverall DI (%)Resistance Rating
1F65Yunnan, ChinaWBrown1.07 ± 0.21a*MR1.13 ± 0.23j–n*MS29.6MS
2F321Yunnan, ChinaCBrown1.13 ± 0.17aMR1.10 ± 0.35j–mMS29.7MS
3F319Yunnan, ChinaWDark brown1.17 ± 0.28aMR0.70 ± 0.25f–hMR23.3MR
4F359Heilongjiang, ChinaWPale brown1.17 ± 0.24aMR0.33 ± 0.42b–eHR17.2MR
5F372Yunnan, ChinaWPale brown1.18 ± 0.25a–bMR0.43 ± 0.42c–fHR19.0MR
6F364Yunnan, ChinaWPale brown1.20 ± 0.23a–bMR2.17 ± 0.33tHS48.1S
7F10Yunnan, ChinaWDark brown1.23 ± 0.23a–cMR0.30 ± 0.43a–dHR17.3MR
8F13Yunnan, ChinaWBrown1.23 ± 0.23a–cMR1.83 ± 0.24sS42.9S
9F7Yunnan, ChinaWDark brown1.23 ± 0.27a–cMR2.40 ± 0.26tHS52.3S
10F9Yunnan, ChinaWBrown1.23 ± 0.27a–cMR0.07 ± 0.21a–bHR13.4HR
11F11Yunnan, ChinaWBrown1.27 ± 0.31a–dMR0.70 ± 0.19f–hMR24.3MR
12F17Jilin, China WCream1.27 ± 0.26a–dMR0.97 ± 0.37h–kMR28.8MS
13F333PakistanWBrown1.27 ± 0.31a–dMR0.27 ± 0.44a–dHR17.1MR
14F368Yunnan, ChinaWBrown1.27 ± 0.21a–dMR1.63 ± 0.33p–sS39.9MS
15F5Yunnan, ChinaWCream1.27 ± 0.21a–dMR1.03 ± 0.25i–lMS29.9MS
16F337PakistanWPale brown1.33 ± 0.35a–eMR0.70 ± 0.33f–hMR25.0MR
17F79Heilongjiang, ChinaWPale brown1.33 ± 0.35a–eMR1.47 ± 0.17o–rMS37.8MS
18F324Yunnan, ChinaWCream1.33 ± 0.22a–eMR0.00 ± 0.00aHR13.3HR
19F122Yunnan, ChinaWPale brown1.37 ± 0.39a–eMR0.00 ± 0.00aHR13.7HR
20F344Heilongjiang, ChinaWPale brown1.36 ± 0.48a-eMR0.00 ± 0.00aHR13.7HR
21F371Yunnan, ChinaWPale brown1.36 ± 0.36a–eMR0.87 ± 0.17h–jMR28.1MS
22F2Yunnan, ChinaWPale brown1.50 ± 0.36b–fMR0.77 ± 0.39g–iMR27.8MS
23F366Yunnan, ChinaWBrown1.53 ± 0.23c–fMS1.33 ± 0.42l–pMS37.5MS
24F376Yunnan, ChinaWPale brown1.57 ± 0.32d–fMS0.43 ± 0.42c–fHR22.9MR
25F74Jilin, ChinaWBrown1.60 ± 0.31e–gMS1.57 ± 0.39p–sS42.1S
26F365Yunnan, ChinaWCream1.63 ± 0.29e–gMS0.83 ± 0.28g–jMR30.2MS
27F6Yunnan, ChinaWCream1.70 ± 0.29f–hMS0.67 ± 0.31f–hMR28.1MS
28F21Heilongjiang, ChinaWDark brown1.77 ± 0.23f–iMS1.70 ± 0.19q–sS46.0S
29F363Yunnan, ChinaWCream1.77 ± 0.23f–jMS2.20 ± 0.42tHS54.3S
30F370Yunnan, ChinaWBrown1.77 ± 0.27f–iMS2.37 ± 0.19tHS57.1HS
31F334PakistanWCream1.80 ± 0.23f–kMS1.43 ± 0.32n–qMS41.9S
32F318Yunnan, ChinaWPale brown1.90 ± 0.32g–kMS1.77 ± 0.32r–sS48.5S
33F14Yunnan, ChinaWPale brown1.97 ± 0.25h–lMS0.63 ± 0.33e–hMR30.2MS
34PPUJilin, ChinaCDark brown2.07 ± 0.41i–mMS1.50 ± 0.42o–rMS45.7S
35F73Jilin, ChinaWPale brown2.23 ± 0.32l–nMS1.50 ± 0.39o–rMS47.3S
36F320Yunnan, ChinaCBrown2.27 ± 0.22m–oMS1.37 ± 0.48m-pMS45.5S
37F20Heilongjiang, ChinaWCream2.30 ± 0.25m–oMS2.17 ± 0.18tHS59.1HS
38F3Yunnan, ChinaWBrown2.33 ± 0.35m–oMS1.43 ± 0.57n–qMS47.2S
39F367Yunnan, ChinaWBrown2.37 ± 0.37m–oMS1.10 ± 0.23j–mMS42.0S
40F96Yunnan, ChinaWCream2.47 ± 0.39n–pMS0.93 ± 0.26h–kMR40.2S
41F53Sichuan, ChinaWBrown2.57 ± 0.32o–qS2.87 ± 0.17uHS73.4HS
42F369Yunnan, ChinaWPale brown2.67 ± 0.31p–rS2.73 ± 0.44uHS72.2HS
43F362Yunnan, ChinaWBrown2.67 ± 0.38p–rS1.23 ± 0.23k–oMS47.2S
44F111Jilin, ChinaWPale brown2.70 ± 0.29p–rS0.23 ± 0.42a–dHR30.9MS
45F8Yunnan, ChinaWPale brown2.70 ± 0.33p–rS0.87 ± 0.17g–jMR41.4S
46F336PakistanWBrown2.73 ± 0.26p–sS0.83 ± 0.28g–jMR41.2S
47F108Yunnan, ChinaWPale brown2.77 ± 0.23p–sS0.20 ± 0.28a–cHR31.0MS
48F86Heilongjiang, ChinaWPale brown2.83 ± 0.24q–tS2.93 ± 0.26uHS77.2HS
49F361Yunnan, ChinaWBrown2.87 ± 0.42q–tS0.53 ± 0.45d–gMR37.6MS
50F81Heilongjiang, ChinaWPale brown2.97 ± 0.37r–uS0.83 ± 0.18g–jMR43.6S
51F68Sichuan, ChinaWCream3.03 ± 0.33s–vS1.07 ± 0.31i–mMS48.1S
52F1Yunnan, ChinaWCream3.10 ± 0.23t–vS1.50 ± 0.24o–rMS56.0HS
53F4Yunnan, ChinaWBrown3.10 ± 0.41t–vS1.57 ± 0.25p–sS57.1HS
54F72Jilin, China WBrown3.10 ± 0.42t–vS2.17 ± 0.18tHS67.1HS
55F360Yunnan, ChinaWBrown3.23 ± 0.32u–vS2.20 ± 0.23tHS69.0HS
56F18Jilin, ChinaWWhite3.30 ± 0.25vS0.63 ± 0.40e–hMR43.6S
X The P. pulmonarius and P. cf. florida strains were cultivated in room 1 (at 21 ± 1 °C, 90% RH, 150 lux light, 500–600 ppm CO2) in 2017. Strain collection type: Wild (W) and cultivated (C).
DS1 = mean DS scores from two flushes produced/strain obtained after 48 hours of inoculation on mushroom caps/pilei of 10 replicate bags (3 caps were inoculated/flush/bag) ± standard deviation. Resistance scale based on DS1: 0–0.5 = highly resistant (HR); 0.6–1.5 = moderately resistant (MR); 1.6–2.5 = moderately susceptible (MS); 2.6–3.5 = susceptible (S); >3.5 = highly susceptible (HS).
Y The P. pulmonarius and P. cf. florida strains were cultivated in room 1 (at 21 ± 1 °C, 90% RH, 150 lux light, 500–600 ppm CO2) in 2018. DS2 = mean DS scores from two flushes produced/strain, obtained during mushroom fruiting after inoculation of P. tolaasii on the spawned substrate, calculated from 10 replicate bags (3 caps scored/flush/bag) ± standard deviation. Resistance scale based on DS2: 0–0.5 = HR; 0.6–1.0 = MR; 1.1–1.5 = MS; 1.6–2.0 = S; >2.0 = HS.
Z Overall resistance scale base on DI: 0.01–15.0% = HR; 15.1–25.0% = MR; 25.1–40.0% = MS; 40.1–55.0% = S; >55.1% = HS. DI, disease index.
* Means having a different letter(s) in the same column differed significantly (p < 0.05) according to the DMRT.
Table 3. BBD severity and resistance ratings of 21 P. cf. florida strains based on screening with two methods via the inoculation of the pathogen on mushroom cap or pileus method (IMP) and on the mushroom spawned substrate method (IMSS).
Screening with the IMP Method XScreening with the IMSS Method YOverall Disease Response (DI) Z
NoStrain IDOriginTypeCap ColorDisease Severity (DS1)Resistance RatingDisease Severity (DS2)Resistance RatingOverall DI (%)Resistance Rating
1P290Kunming, ChinaCCream1.30 ± 0.25aMR1.30 ± 0.29g–hMS34.7MS
2P287Kunming, ChinaCCream1.43 ± 0.27a–bMR0.00 ± 0.00aHR14.3HR
3P301Kunming, ChinaCCream1.47 ± 0.28a–bMR1.13 ± 0.28f–gMS33.6MS
4P328PakistanCCream1.50 ± 0.24a–bMR0.97 ± 0.33e–fMR31.1MS
5P202Shandong, ChinaWCream1.57 ± 0.32a–bMS1.80 ± 0.36i–jS45.7S
6P289Kunming, ChinaCWhite1.73 ± 0.31bMS0.00 ± 0.00aHR17.3MR
7P334USAWCream1.73 ± 0.31bMS0.00 ± 0.00aHR17.3MR
8P298Kunming, ChinaCCream1.77 ± 0.47bMS0.43 ± 0.27b–cHR24.9MR
9P299Kunming, ChinaCWhite2.13 ± 0.47cMS2.37 ± 0.43l–mHS60.8HS
10P326PakistanWWhite2.13 ± 0.36cMS1.57 ± 0.23h–iS47.4S
11P296Kunming, ChinaCCream2.20 ± 0.28cMS2.20 ± 0.39k–lHS58.7HS
12P271Kunming, ChinaCDark gray2.33 ± 0.25cMS2.53 ± 0.32mHS65.2HS
13P332PakistanWCream2.63 ± 0.33dS0.20 ± 0.42a–bHR29.7MS
14P331PakistanWWhite2.70 ± 0.43dS0.80 ± 0.32d–eMR40.3S
15P335USAWWhite2.70 ± 0.37dS0.00 ± 0.00aHR27.0MS
16P282Yunnan, ChinaCPale gray2.73 ± 0.41d–eS2.87 ± 0.50nHS75.1HS
17P309Kunming, ChinaCCream2.83 ± 0.32d–fS2.27 ± 0.34l–mHS66.1HS
18P316Kunming, ChinaCWhite2.83 ± 0.39d–fS2.13 ± 0.32k–lHS63.9HS
19P329PakistanWCream2.93 ± 0.34d–fS0.80 ± 0.28d–eMR42.7S
20P325PakistanWWhite3.07 ± 0.41e–fS1.97 ± 0.33j–kS63.5HS
21P330PakistanWCream3.10 ± 0.27fS0.53 ± 0.32c–dMR39.9MS
See Table 2 for footnotes.
Table 4. BBD severity and resistance ratings of 20 P. ostreatus strains based on screening with two methods via the inoculation of the pathogen on mushroom cap or pileus method (IMP) and on the mushroom spawned substrate method (IMSS).
Screening with the IMP method XScreening with the IMSS method YOverall disease response (DI) Z
NoStrain IDOriginTypeCap ColorDisease Severity (DS1)Resistance RatingDisease Severity (DS2)Resistance RatingOverall DI (%)Resistance Rating
1P10Changchun, ChinaCGray1.53 ± 0.39a*MS2.63 ± 0.48h–i*HS59.2HS
2P164Heilongjiang, ChinaCGray1.57 ± 0.27aMS1.80 ± 0.45d–fS45.7S
3P92Changchun, ChinaWGray1.77 ± 0.23aMS1.17 ± 0.28cMS37.1MS
4P191Shandong, ChinaCPale gray2.23 ± 0.42bMS2.20 ± 0.32gHS59.0HS
5P179Heilongjiang, ChinaCGray2.27 ± 0.26bMS2.33 ± 0.44g–hHS61.6HS
6P297Yunnan, ChinaCPale gray2.43 ± 0.39bMS2.23 ± 0.50gHS61.5HS
7P35Yunnan, ChinaWDark gray2.53 ± 0.48b–cS1.60 ± 0.38dS52.0S
8P11Changchun, ChinaCPale gray2.60 ± 0.41b–cS2.00 ± 0.42e–gS59.3HS
9P90Changchun, ChinaWPale gray2.60 ± 0.31b–cS1.70 ± 0.37d–eS54.3S
10P67Changchun, ChinaWDark gray2.87 ± 0.28c–dS2.96 ± 0.20iHS78.0HS
11P176Heilongjiang, ChinaCGray3.00 ± 0.39dS0.97 ± 0.25b–cMR46.1S
12P186Heilongjiang, ChinaCDark gray3.10 ± 0.49d–eS2.93 ± 0.44iHS79.9HS
13P279Yunnan, ChinaCPale gray3.20 ± 0.39d–fS2.30 ± 0.37g–hHS70.3HS
14P317Yunnan, ChinaCPale gray3.20 ± 0.36d–gS0.70 ± 0.25bMR43.7S
15P346Yunnan, ChinaCCream3.23 ± 0.42d–hS0.00 ± 0.00aHR32.3MS
16P62Yunnan, ChinaWDark gray3.43 ± 0.35e–hS1.83 ± 0.33d–fS64.9HS
17P173Heilongjiang, ChinaCDark gray3.57 ± 0.32f–iHS2.63 ± 0.40h–iHS79.6HS
18P40Yunnan, ChinaCDark gray3.88 ± 0.42iHS2.70 ± 0.48iHS83.7HS
19P0Jilin, ChinaCPale gray3.90 ± 0.32iHS2.10 ± 0.39f–gHS74.0HS
20P167Heilongjiang, ChinaCDark gray4.33 ± 0.52jHS1.70 ± 0.29d–eS71.7HS
X The P. ostreatus strains were cultivated in room 2 (at 18 ± 1 °C, 90% RH, 150 lux light, 500–600 ppm CO2) in 2017. Strain collection type: Wild (W) and cultivated (C).
DS1 = mean DS scores from two flushes produced/strain obtained after 48 hours of inoculation on mushroom caps/pilei of 10 replicate bags (3 caps were inoculated/flush/bag) ± standard deviation. Resistance scale based on DS1: 0–0.5 = highly resistant (HR); 0.6–1.5 = moderately resistant (MR); 1.6–2.5 = moderately susceptibly (MS); 2.6–3.5 = susceptible (S); >3.5 = highly susceptible (HS).
Y The P. ostreatus strains were cultivated in room 2 (at 18 ± 1 °C, 90% RH, 150 lux light, 500–600 ppm CO2) in 2018. DS2 = mean DS scores from two flushes produced/strain, obtained during mushroom fruiting after inoculation of P. tolaasii on the spawned substrate, calculated from 10 replicate bags (3 caps scored/flush/bag) ± standard deviation. Resistance scale based on DS2: 0-0.5 = HR; 0.6-1.0 = MR; 1.1-1.5 = MS; 1.6-2.0 = S; >2.0 = HS.
Z Overall resistance scale base on DI: 0.01–15.0% = HR; 15.1–25.0% = MR; 25.1–40.0% = MS; 40.1–55.0% = S; >55.1% = HS.
* Means having a different letter(s) in the same column differed significantly (p < 0.05) according to the DMRT.
Table 5. Variance estimate attributed to species and strains of Pleurotus in resistance to P. tolaasii, after screening with the IMP method and the IMSS method.
Source of VariationDegree of FreedomSum of SquaresMean SquaresF-valuep-valueVariance ComponentPercent of Total
Screening by the IMP method
Species2122.9861.4912.580.0000.2025.44
Strain (Species)94459.554.8945.030.0000.4860.76
Error87394.780.11 0.1113.80
Total969677.31 0.79100.00
Screening by the IMSS method
Species282.0941.046.410.0020.1314.96
Strain (Species)94601.896.4058.020.0000.6372.35
Error87396.340.11 0.1112.69
Total969780.32 0.87100.00
The variance component was estimated with a mixed effect nested ANOVA. p-values < 0.05 were significant.
Table 6. The number of Pleurotus strains and their resistance classes according to their overall disease index (DI).
Resistance Class*P. pulmonariusP. ostreatusP. cf. floridaTotal
HR (1.0–15.0%)4015
MR (15.1–25.0%)80311
MS (25.1–40.0%)152623
S (40.1–55.0%)205429
HS (55.1–80.0%)913729
Total56202197
* Resistance classes are based on DI ranges (in %) obtained by combining the mean DS obtained in both screening methods (IMP and IMSS) for each strain evaluated. Highly resistant (HR); moderately resistant (MR); moderately susceptible (MS); susceptible (S); highly susceptible (HS).
Table 7. Quantitative recovery of P. tolaasii from 10 g spawn substrate among strains of three Pleurotus species after harvesting the first flush of fruiting bodies.
P. pulmonariusNo. of P. tolaasii CFU (× 107)P. ostreatusNo. of P. tolaasii CFU (× 107)P. cf. floridaNo. of P. tolaasii CFU (× 107)
F359 27.8 ± 12.4 aP17632.8 ± 11.6 aP334 17.3 ± 12.5 a
F111 30.5 ± 11.4 aP19145.3 ± 12.7 aP30130.0 ± 10.8 a–b
F36947.0 ± 11.1 a–bP055.5 ± 11.3 aP27143.3 ± 11.3 b–c
PPU53.5 ± 10.0 b–cP18663.7 ± 11.9 aP282 62.5 ± 14.2 c
F53 69.0 ± 10.2 c
F86 75.0 ± 13.4 c
Means with a different letter(s) in the same column differed significantly (p < 0.05) according to the DMRT test. Data were square-root transformed prior to ANOVA; the reported are untransformed means. Viable counts were estimated from three replicate spread-plates and expressed as CFU/10 g substrate for each strain sampled ± standard deviation.

