
Identification of QTLs for Reduced Susceptibility to Rose Rosette Disease in Diploid Roses

 , ,
, ,
Abstract
:1. Introduction
2. Results
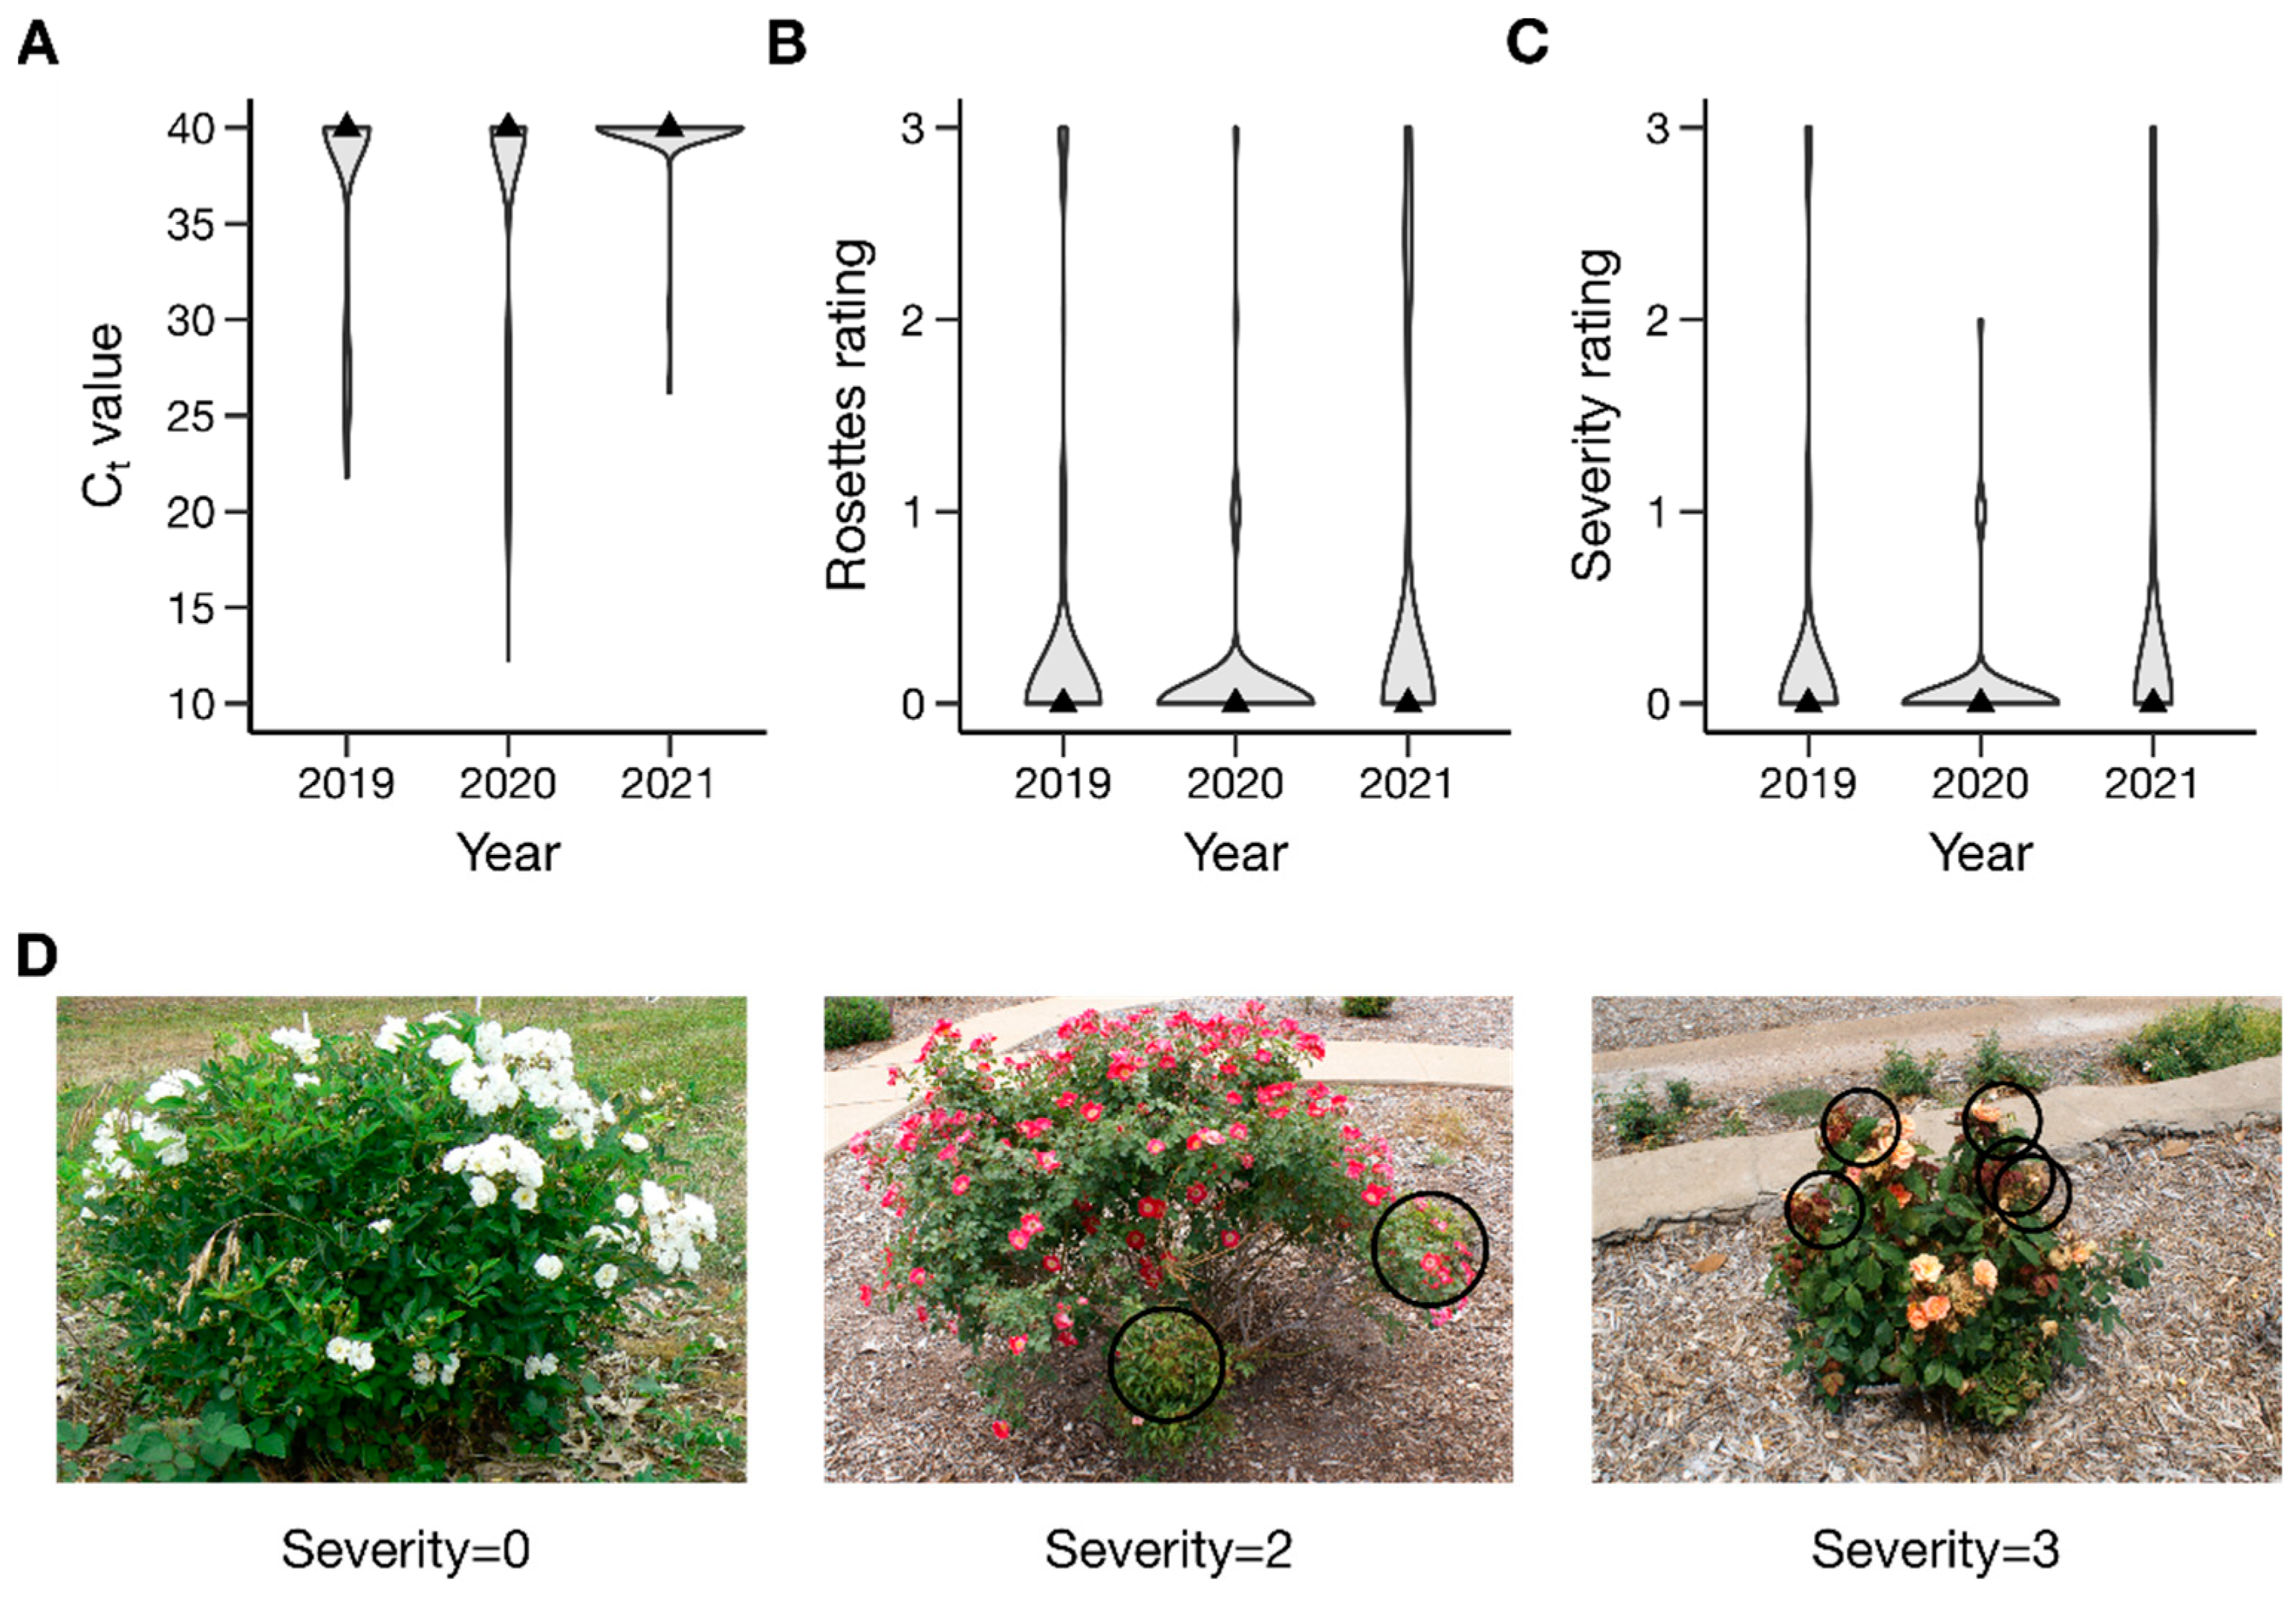
2.1. Phenotypic Data Analysis
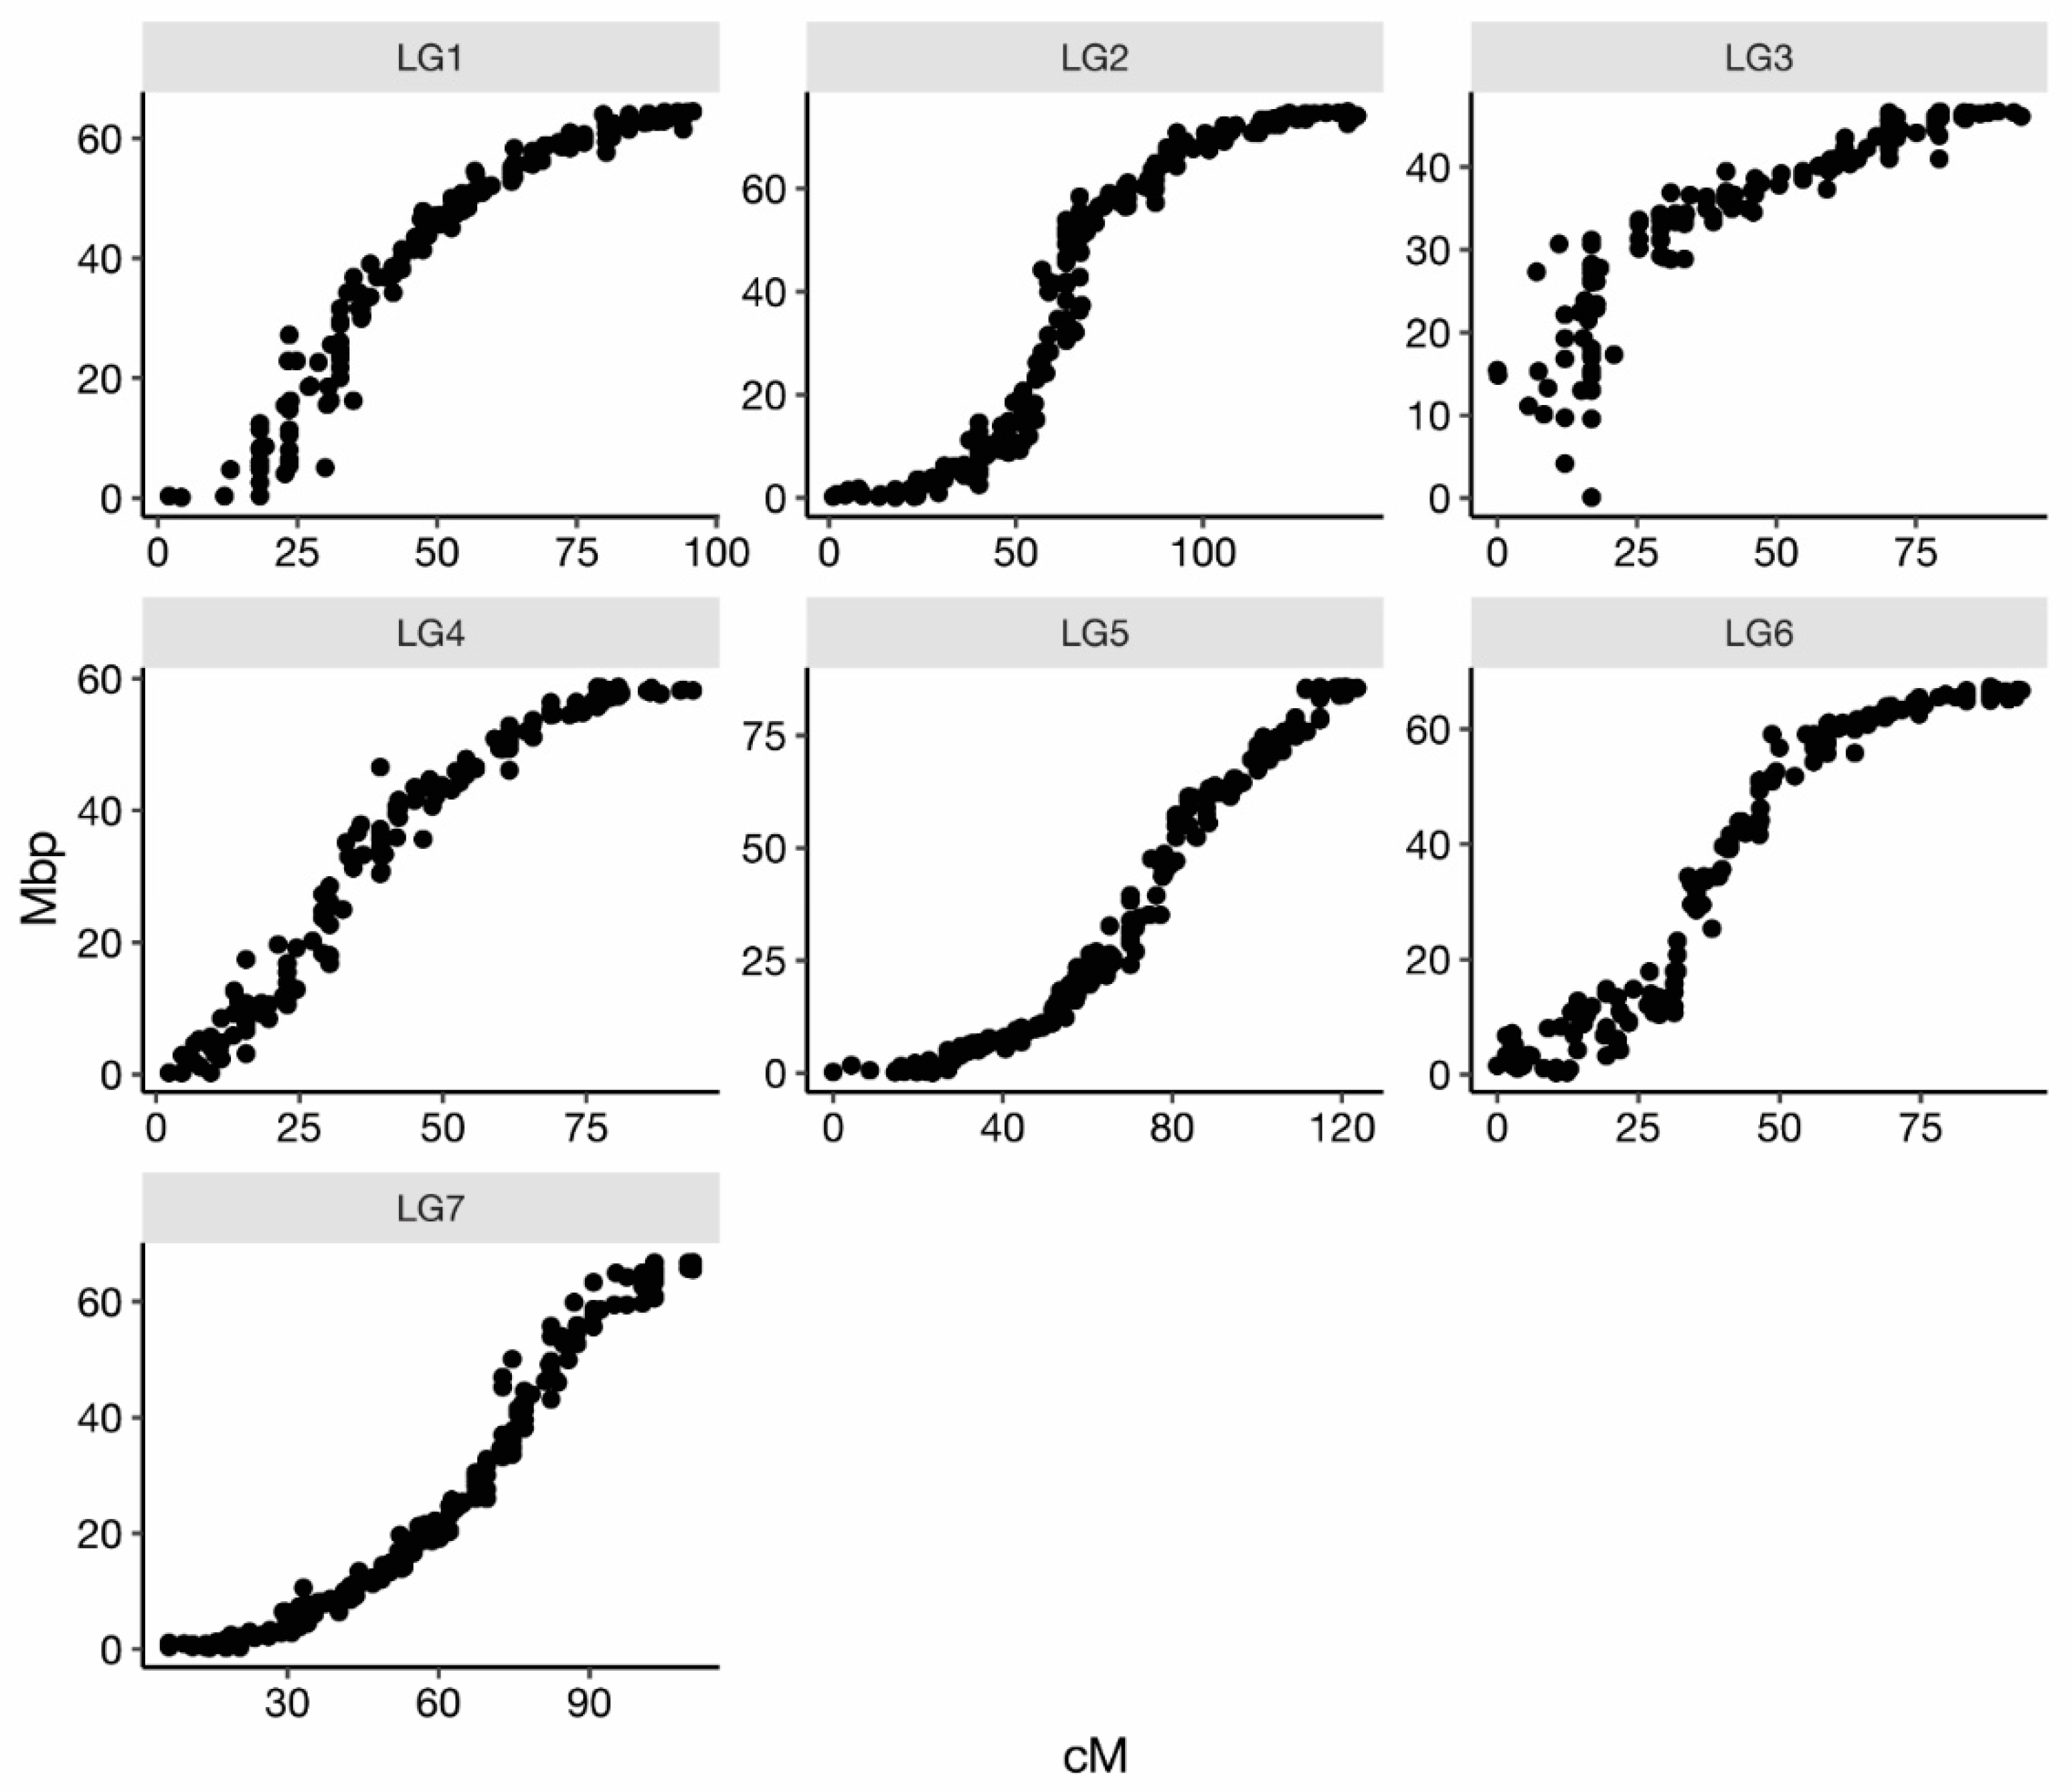
2.2. Linkage Map
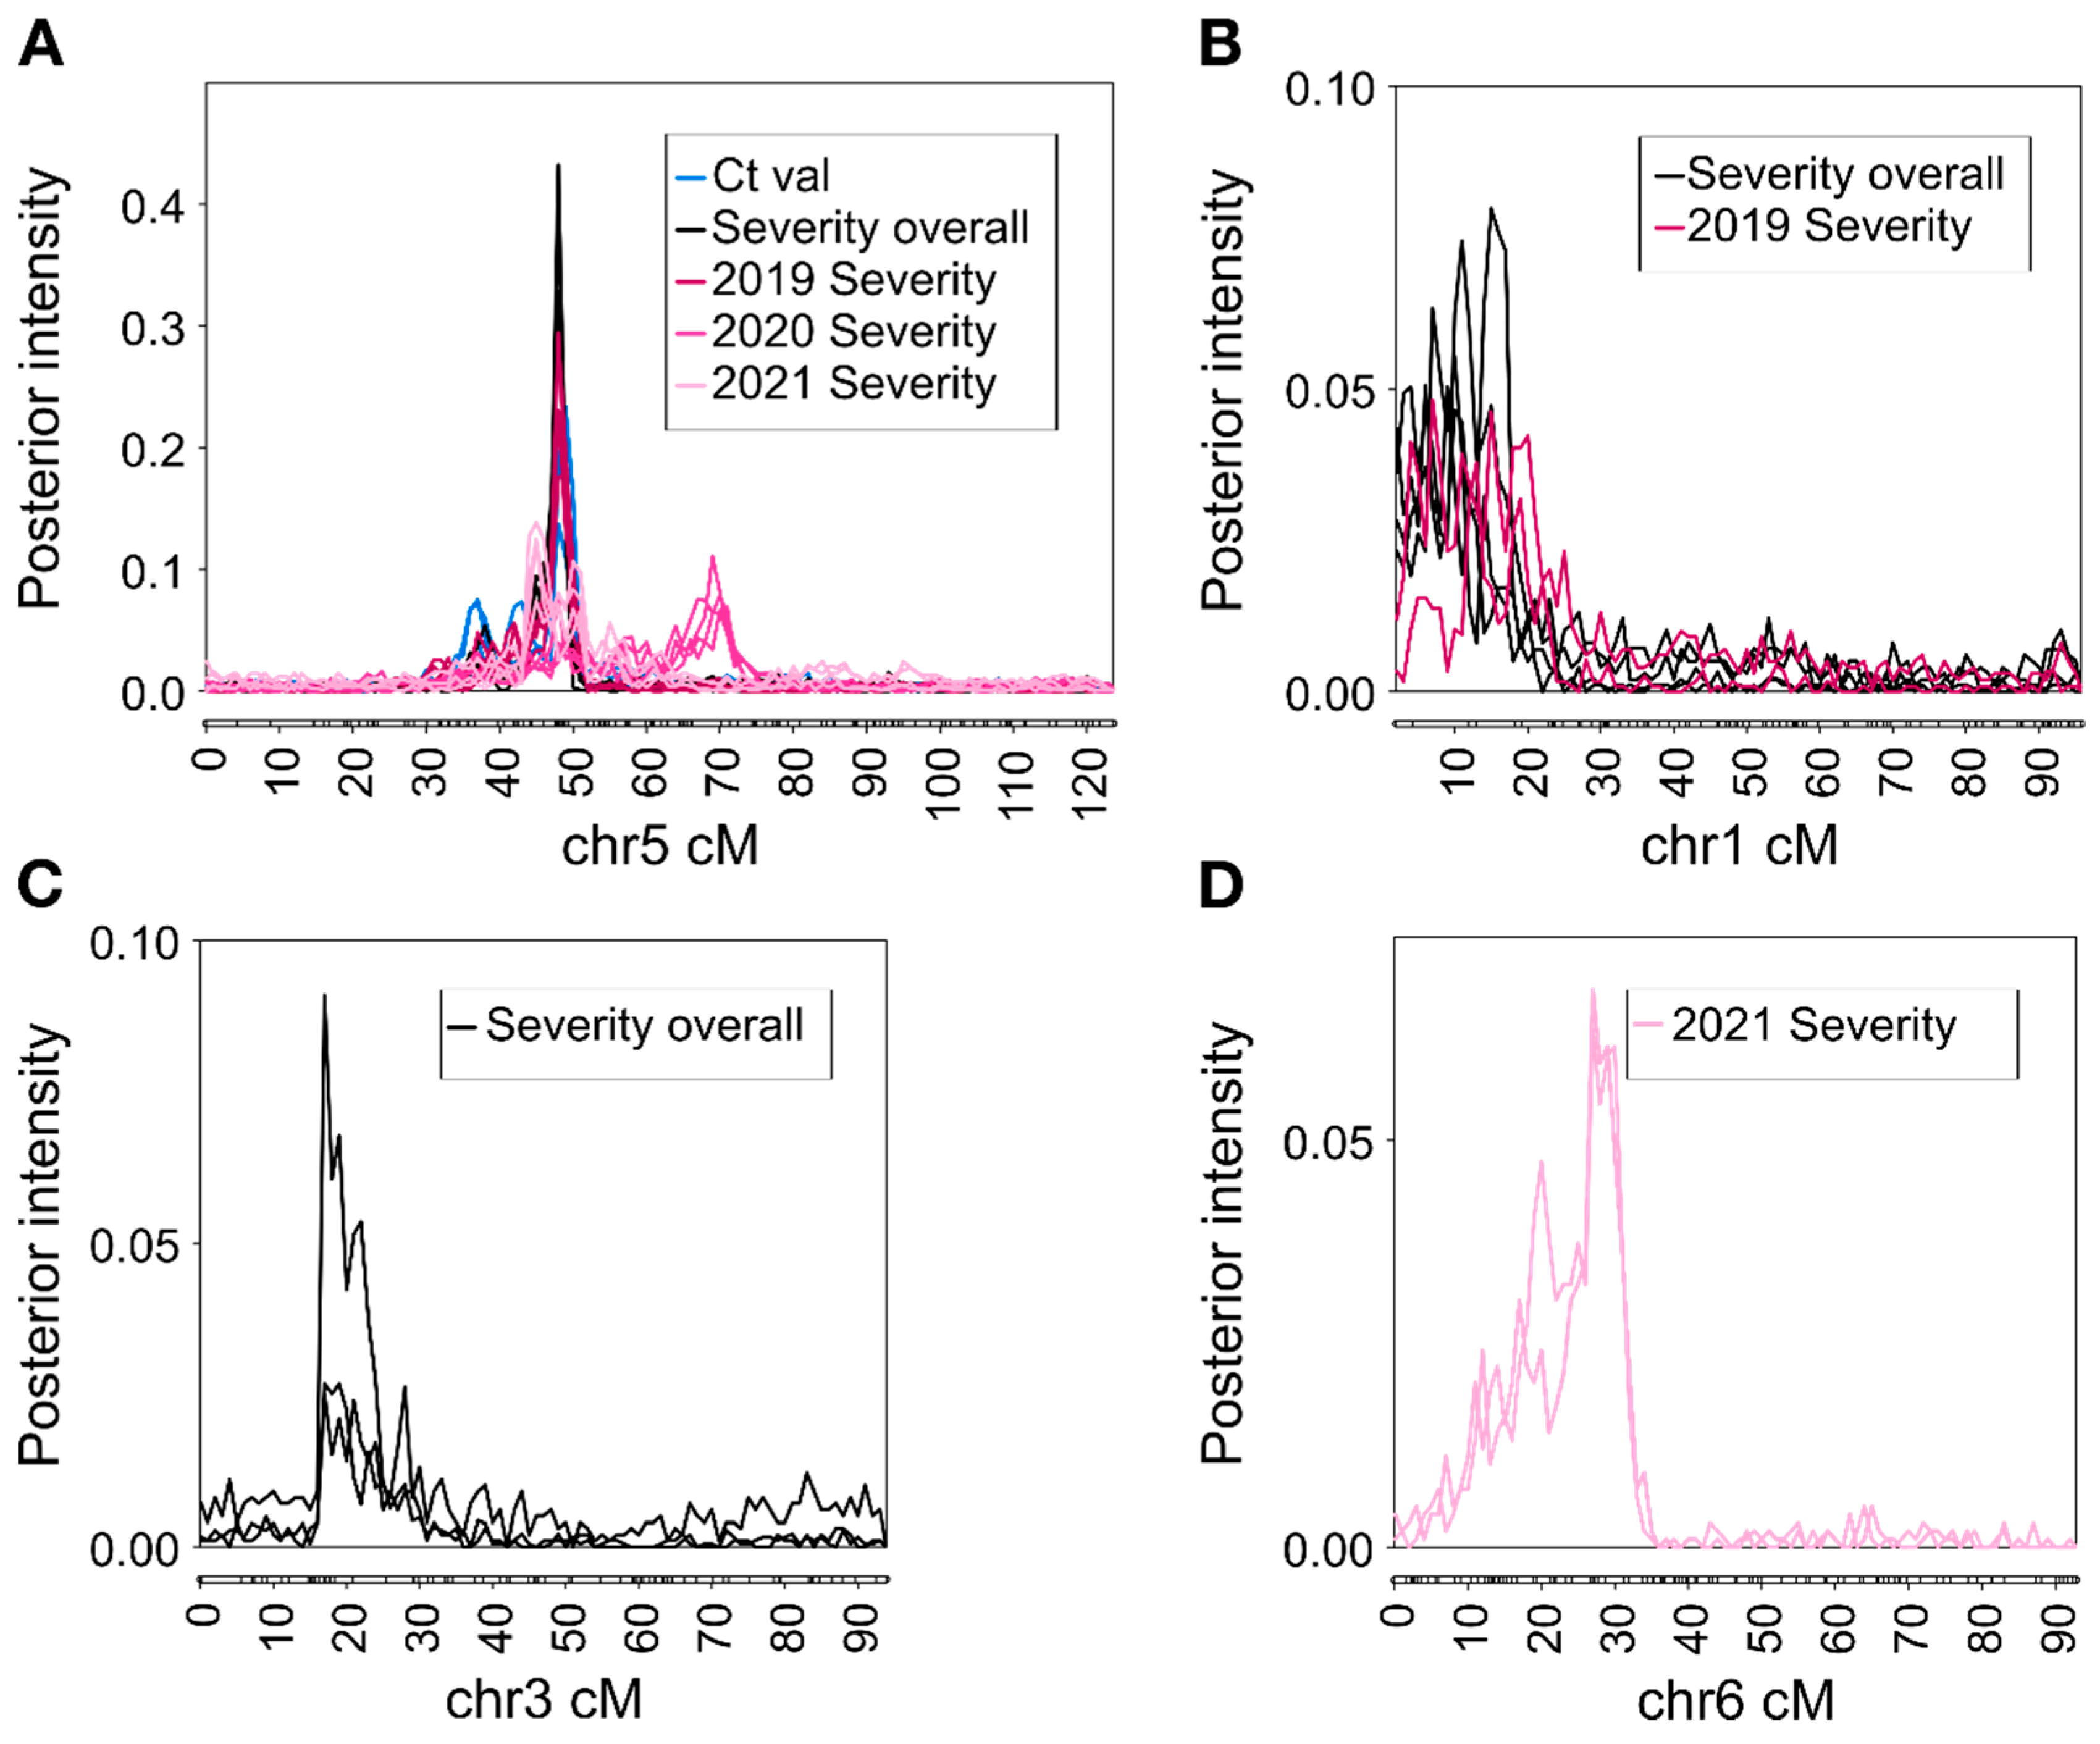
2.3. QTL Analysis
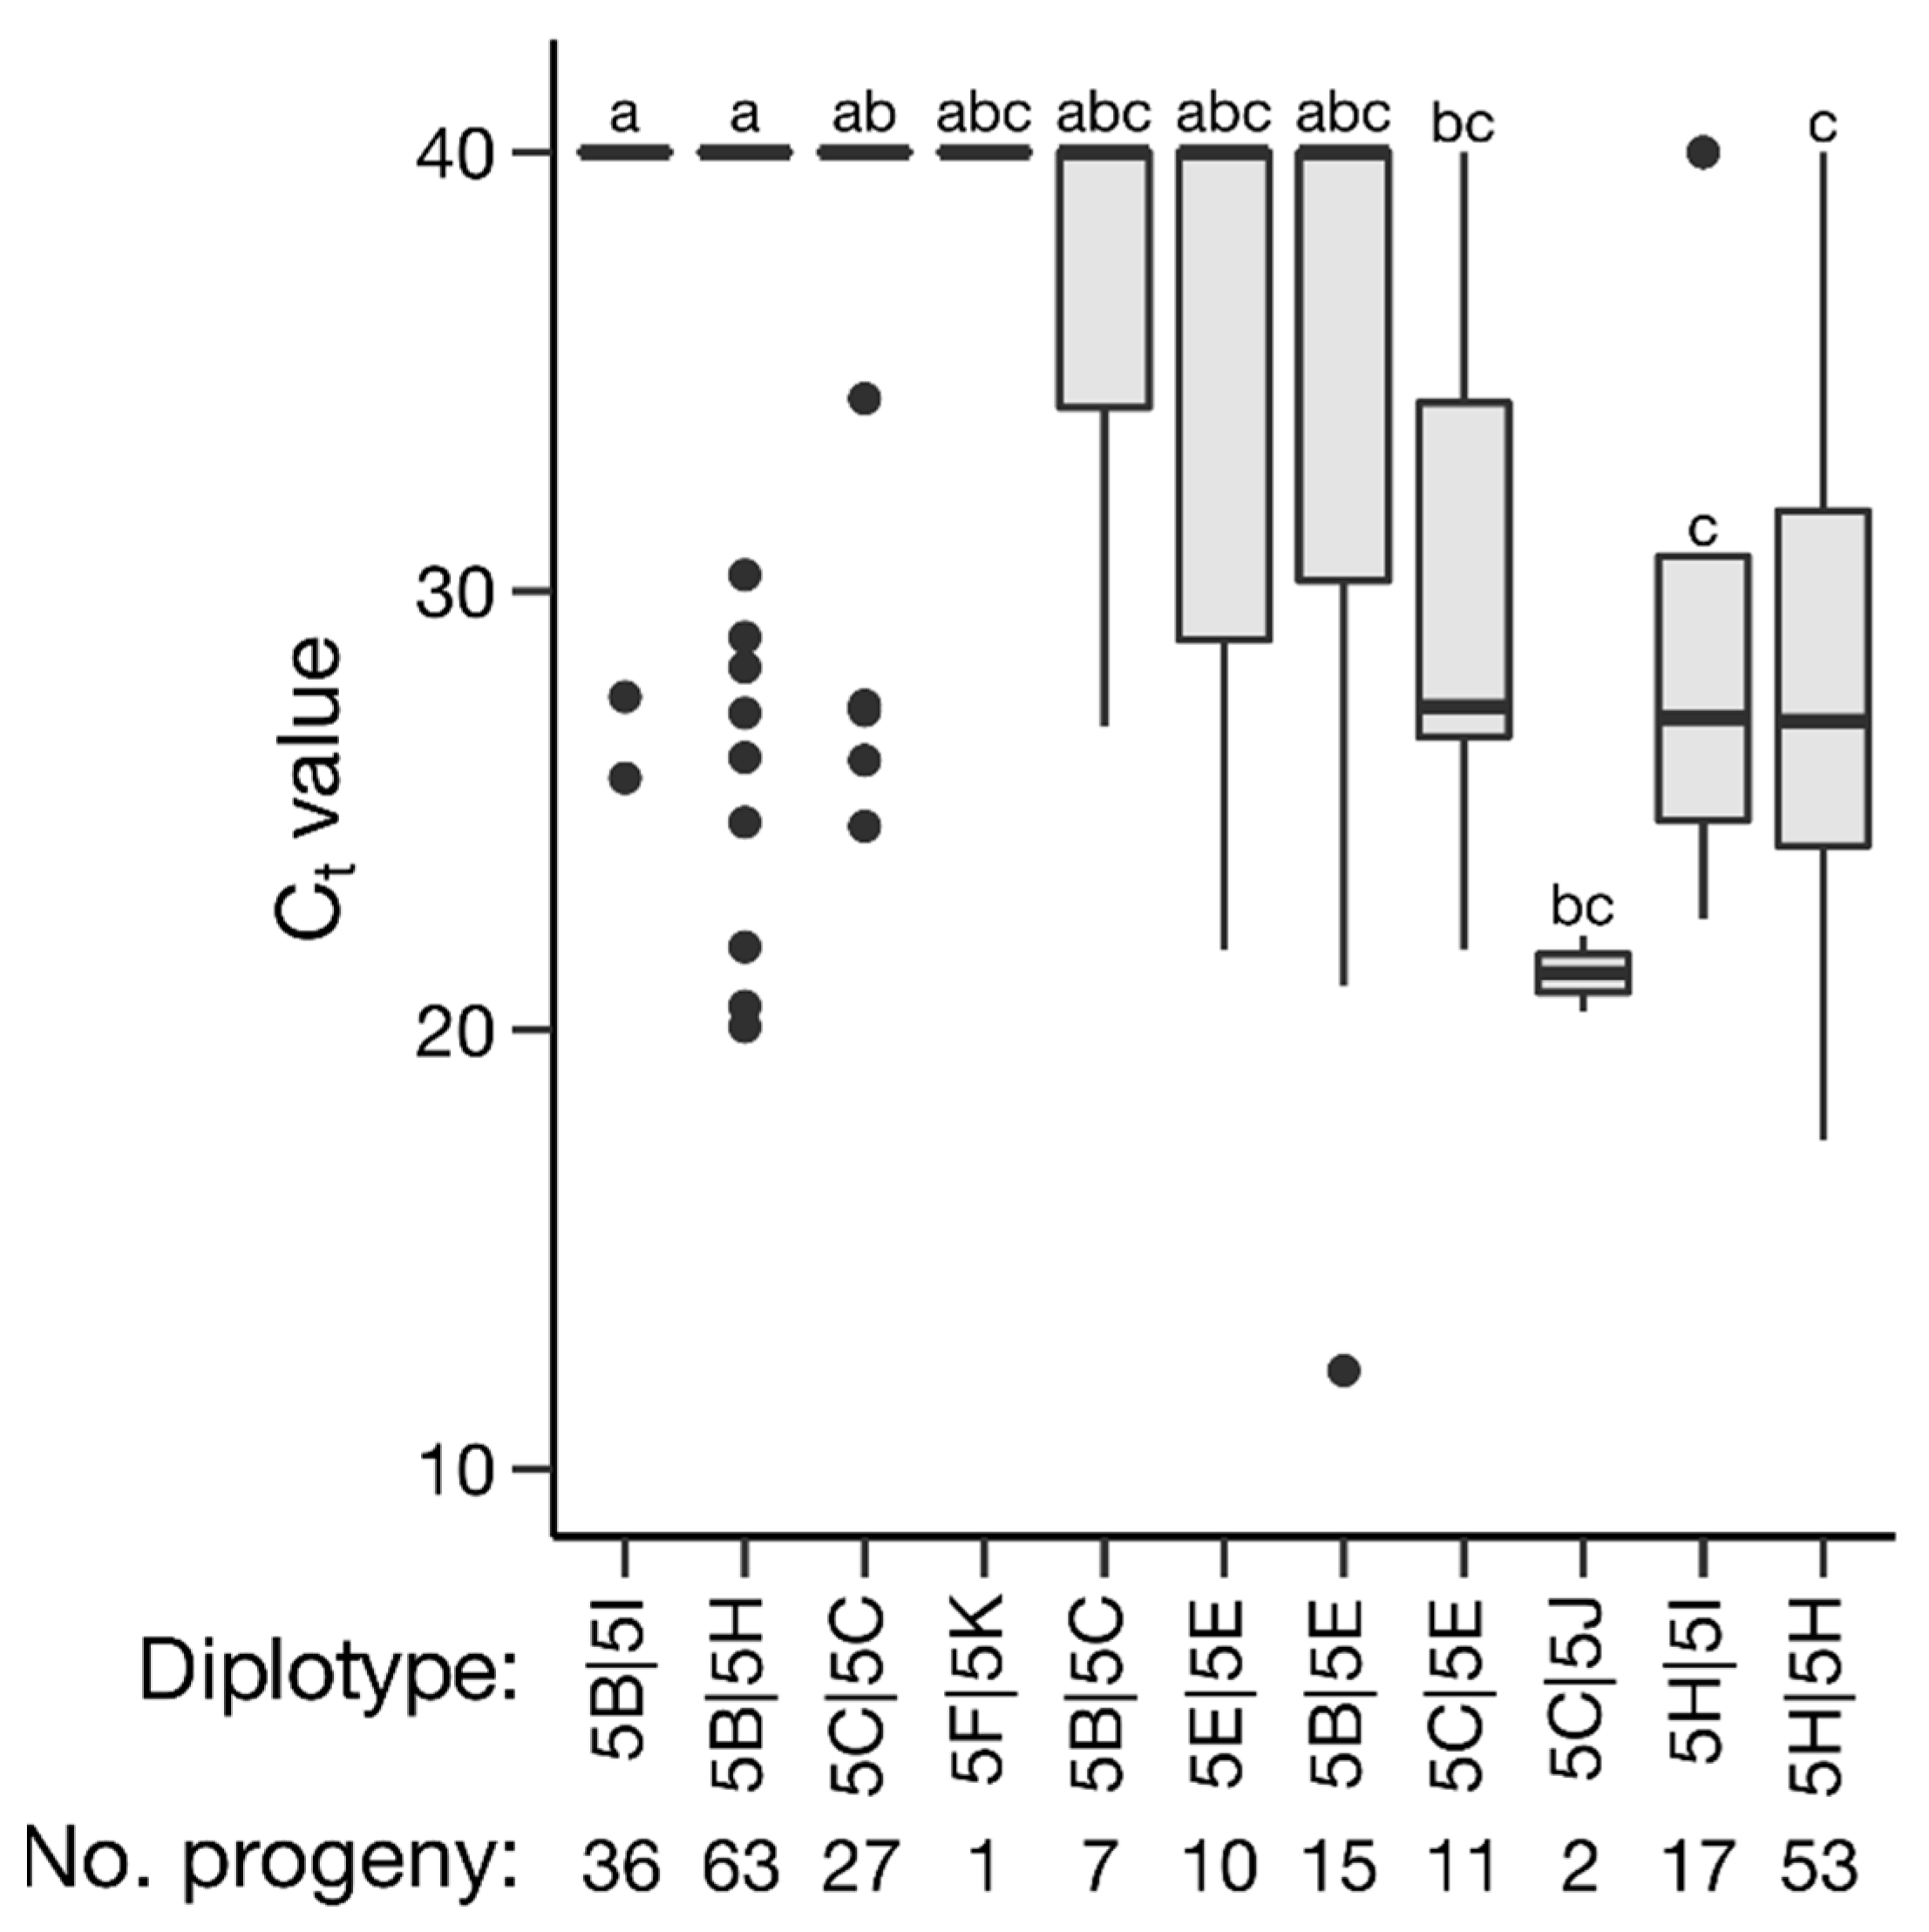
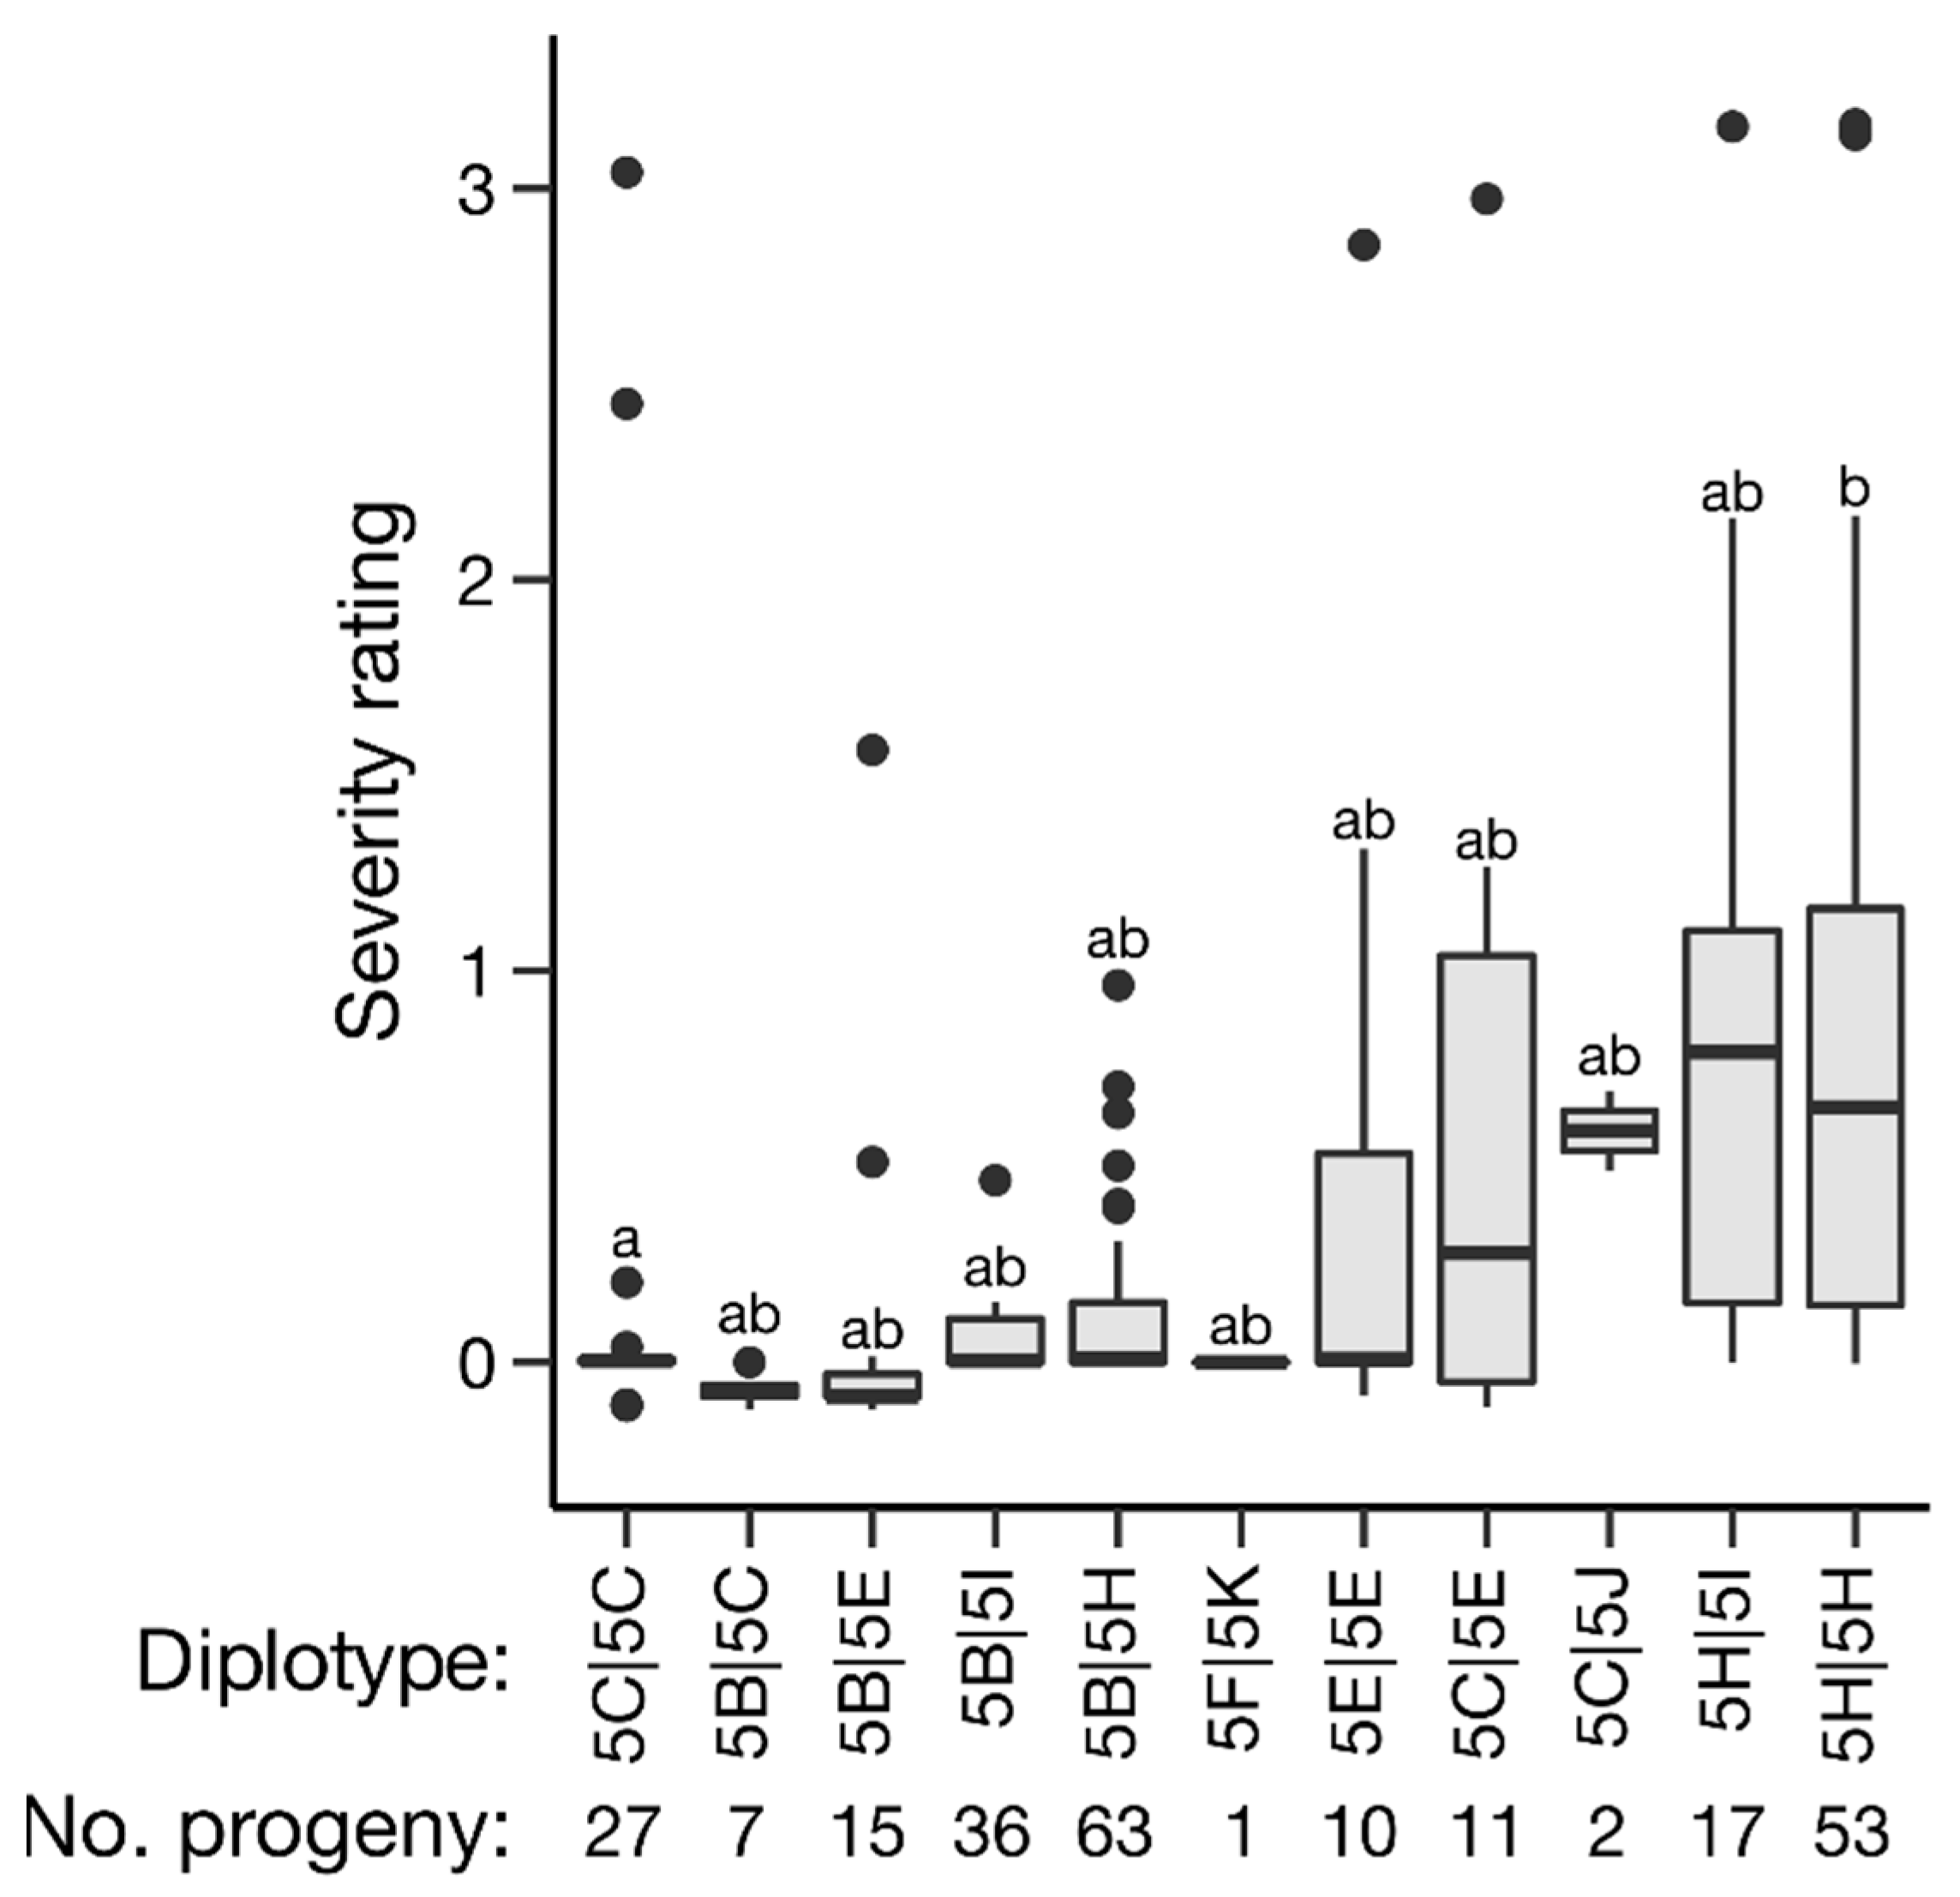
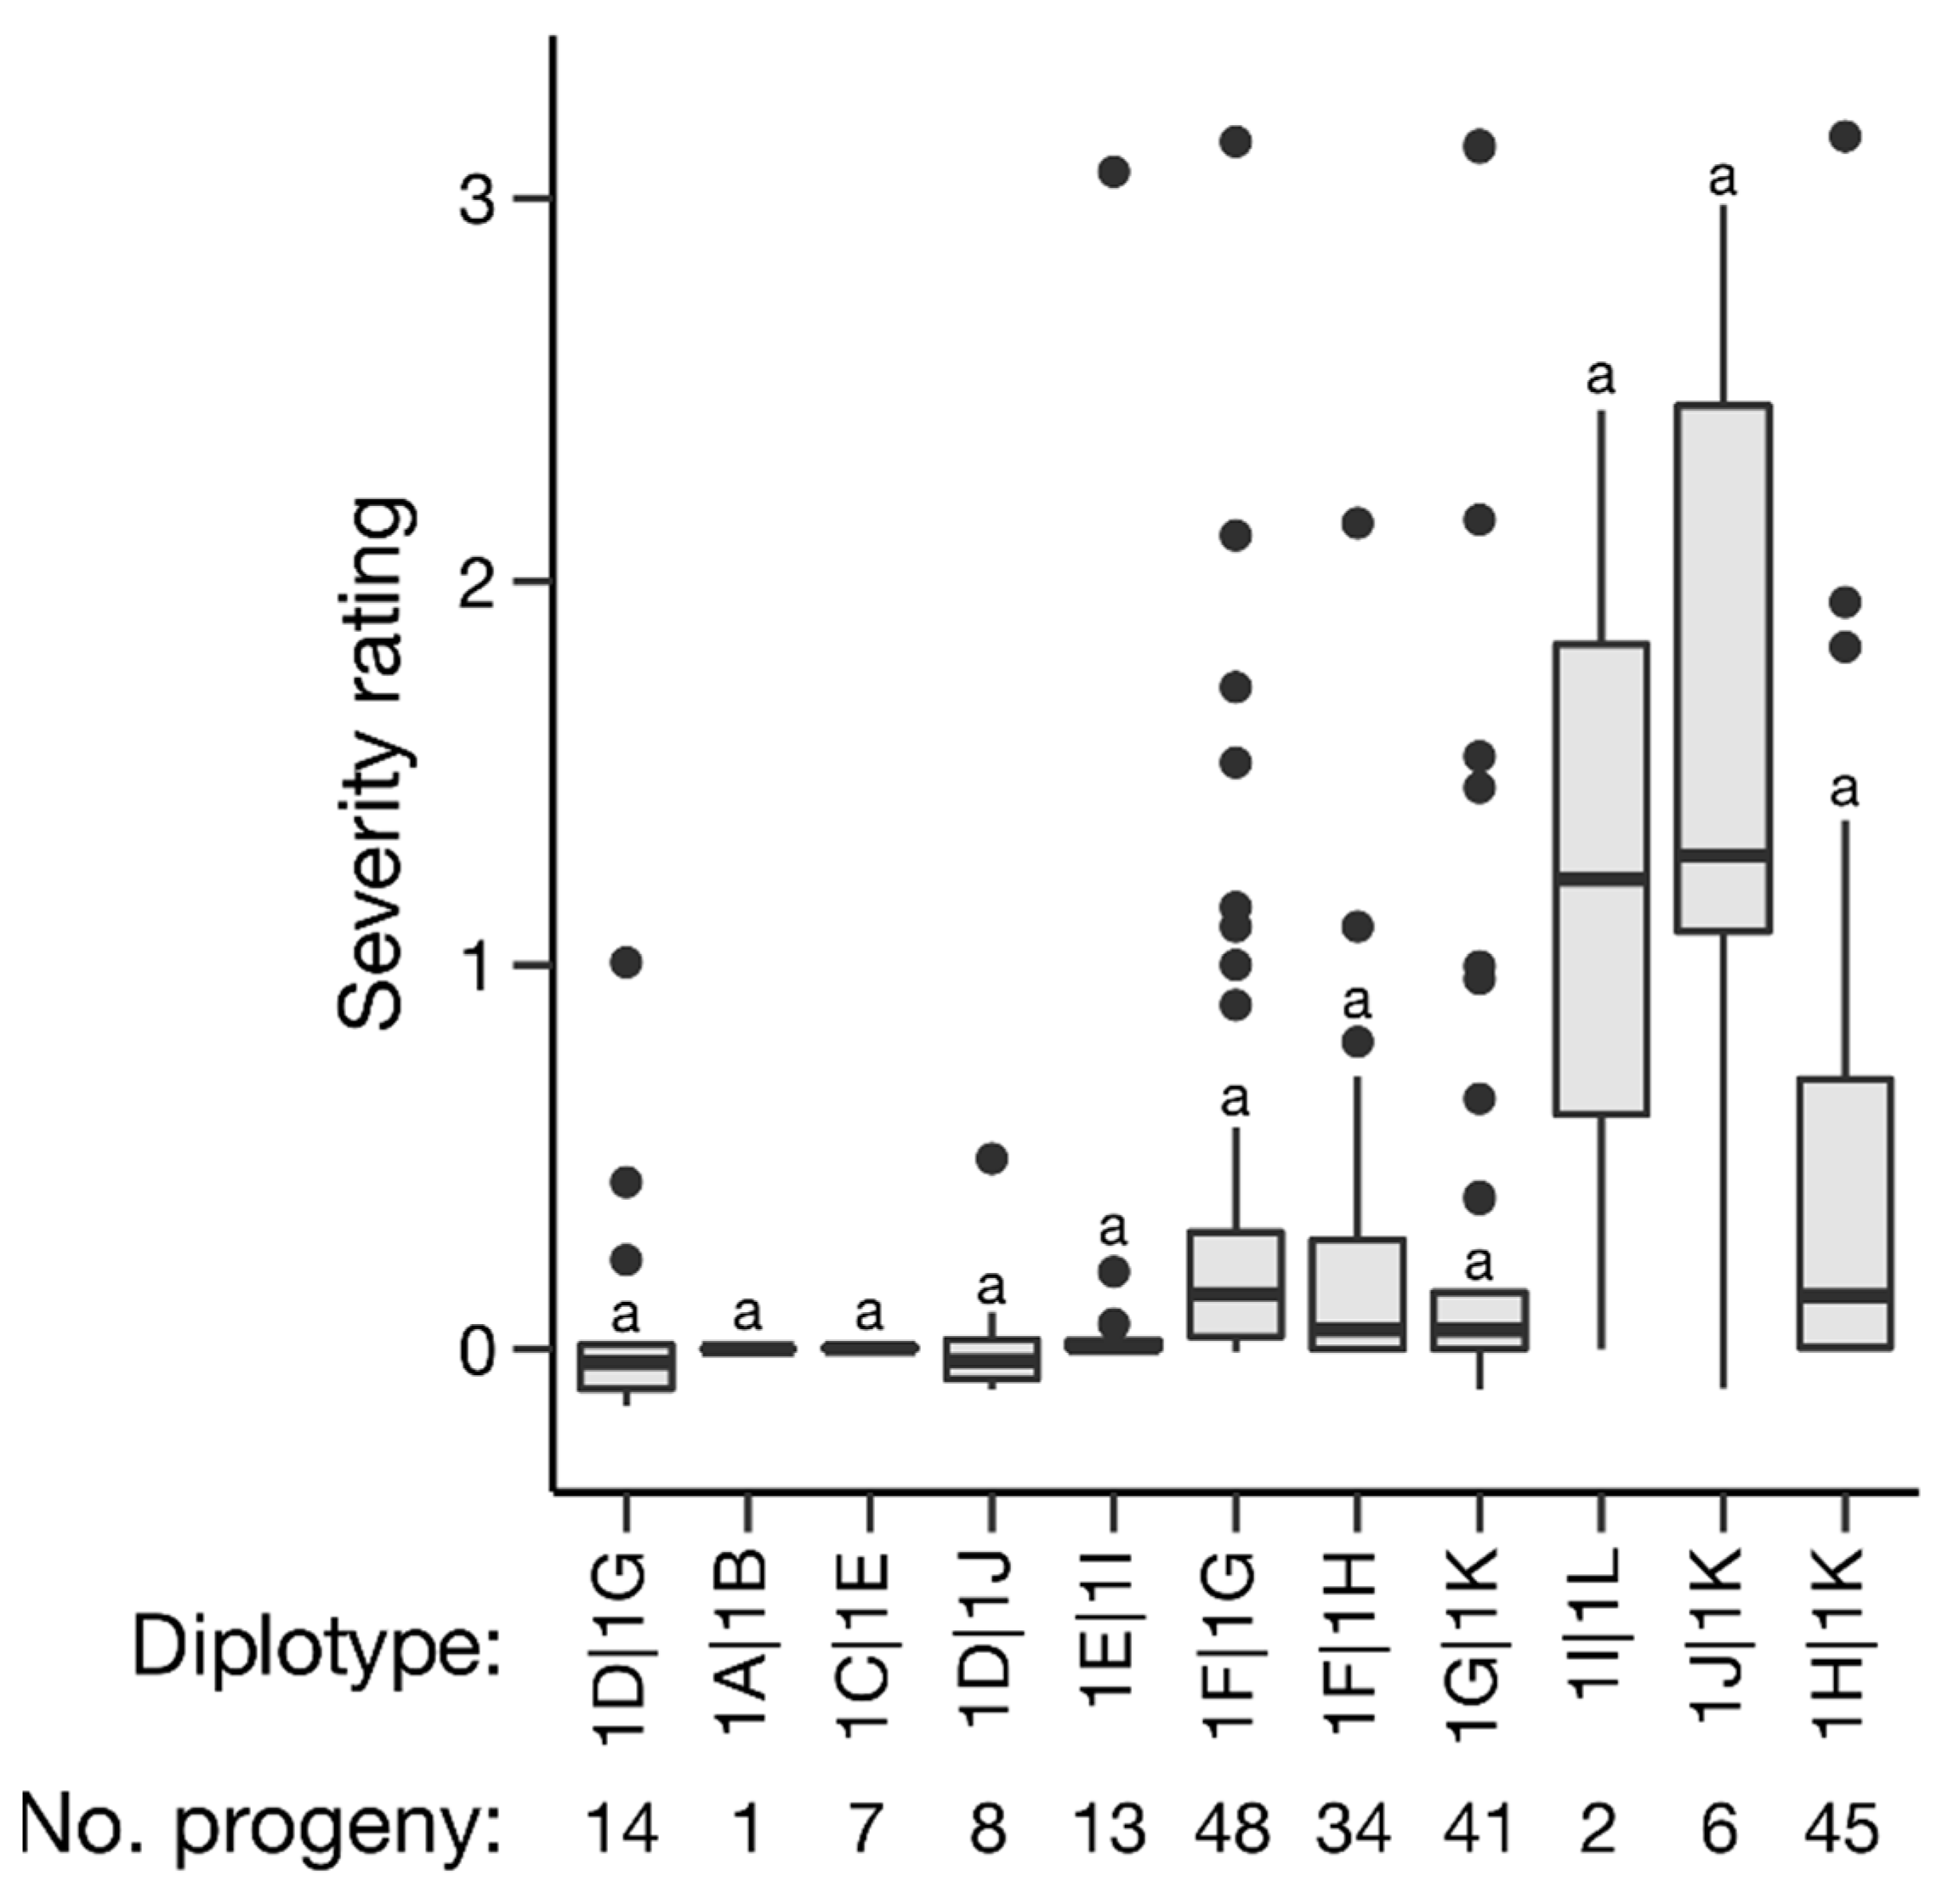
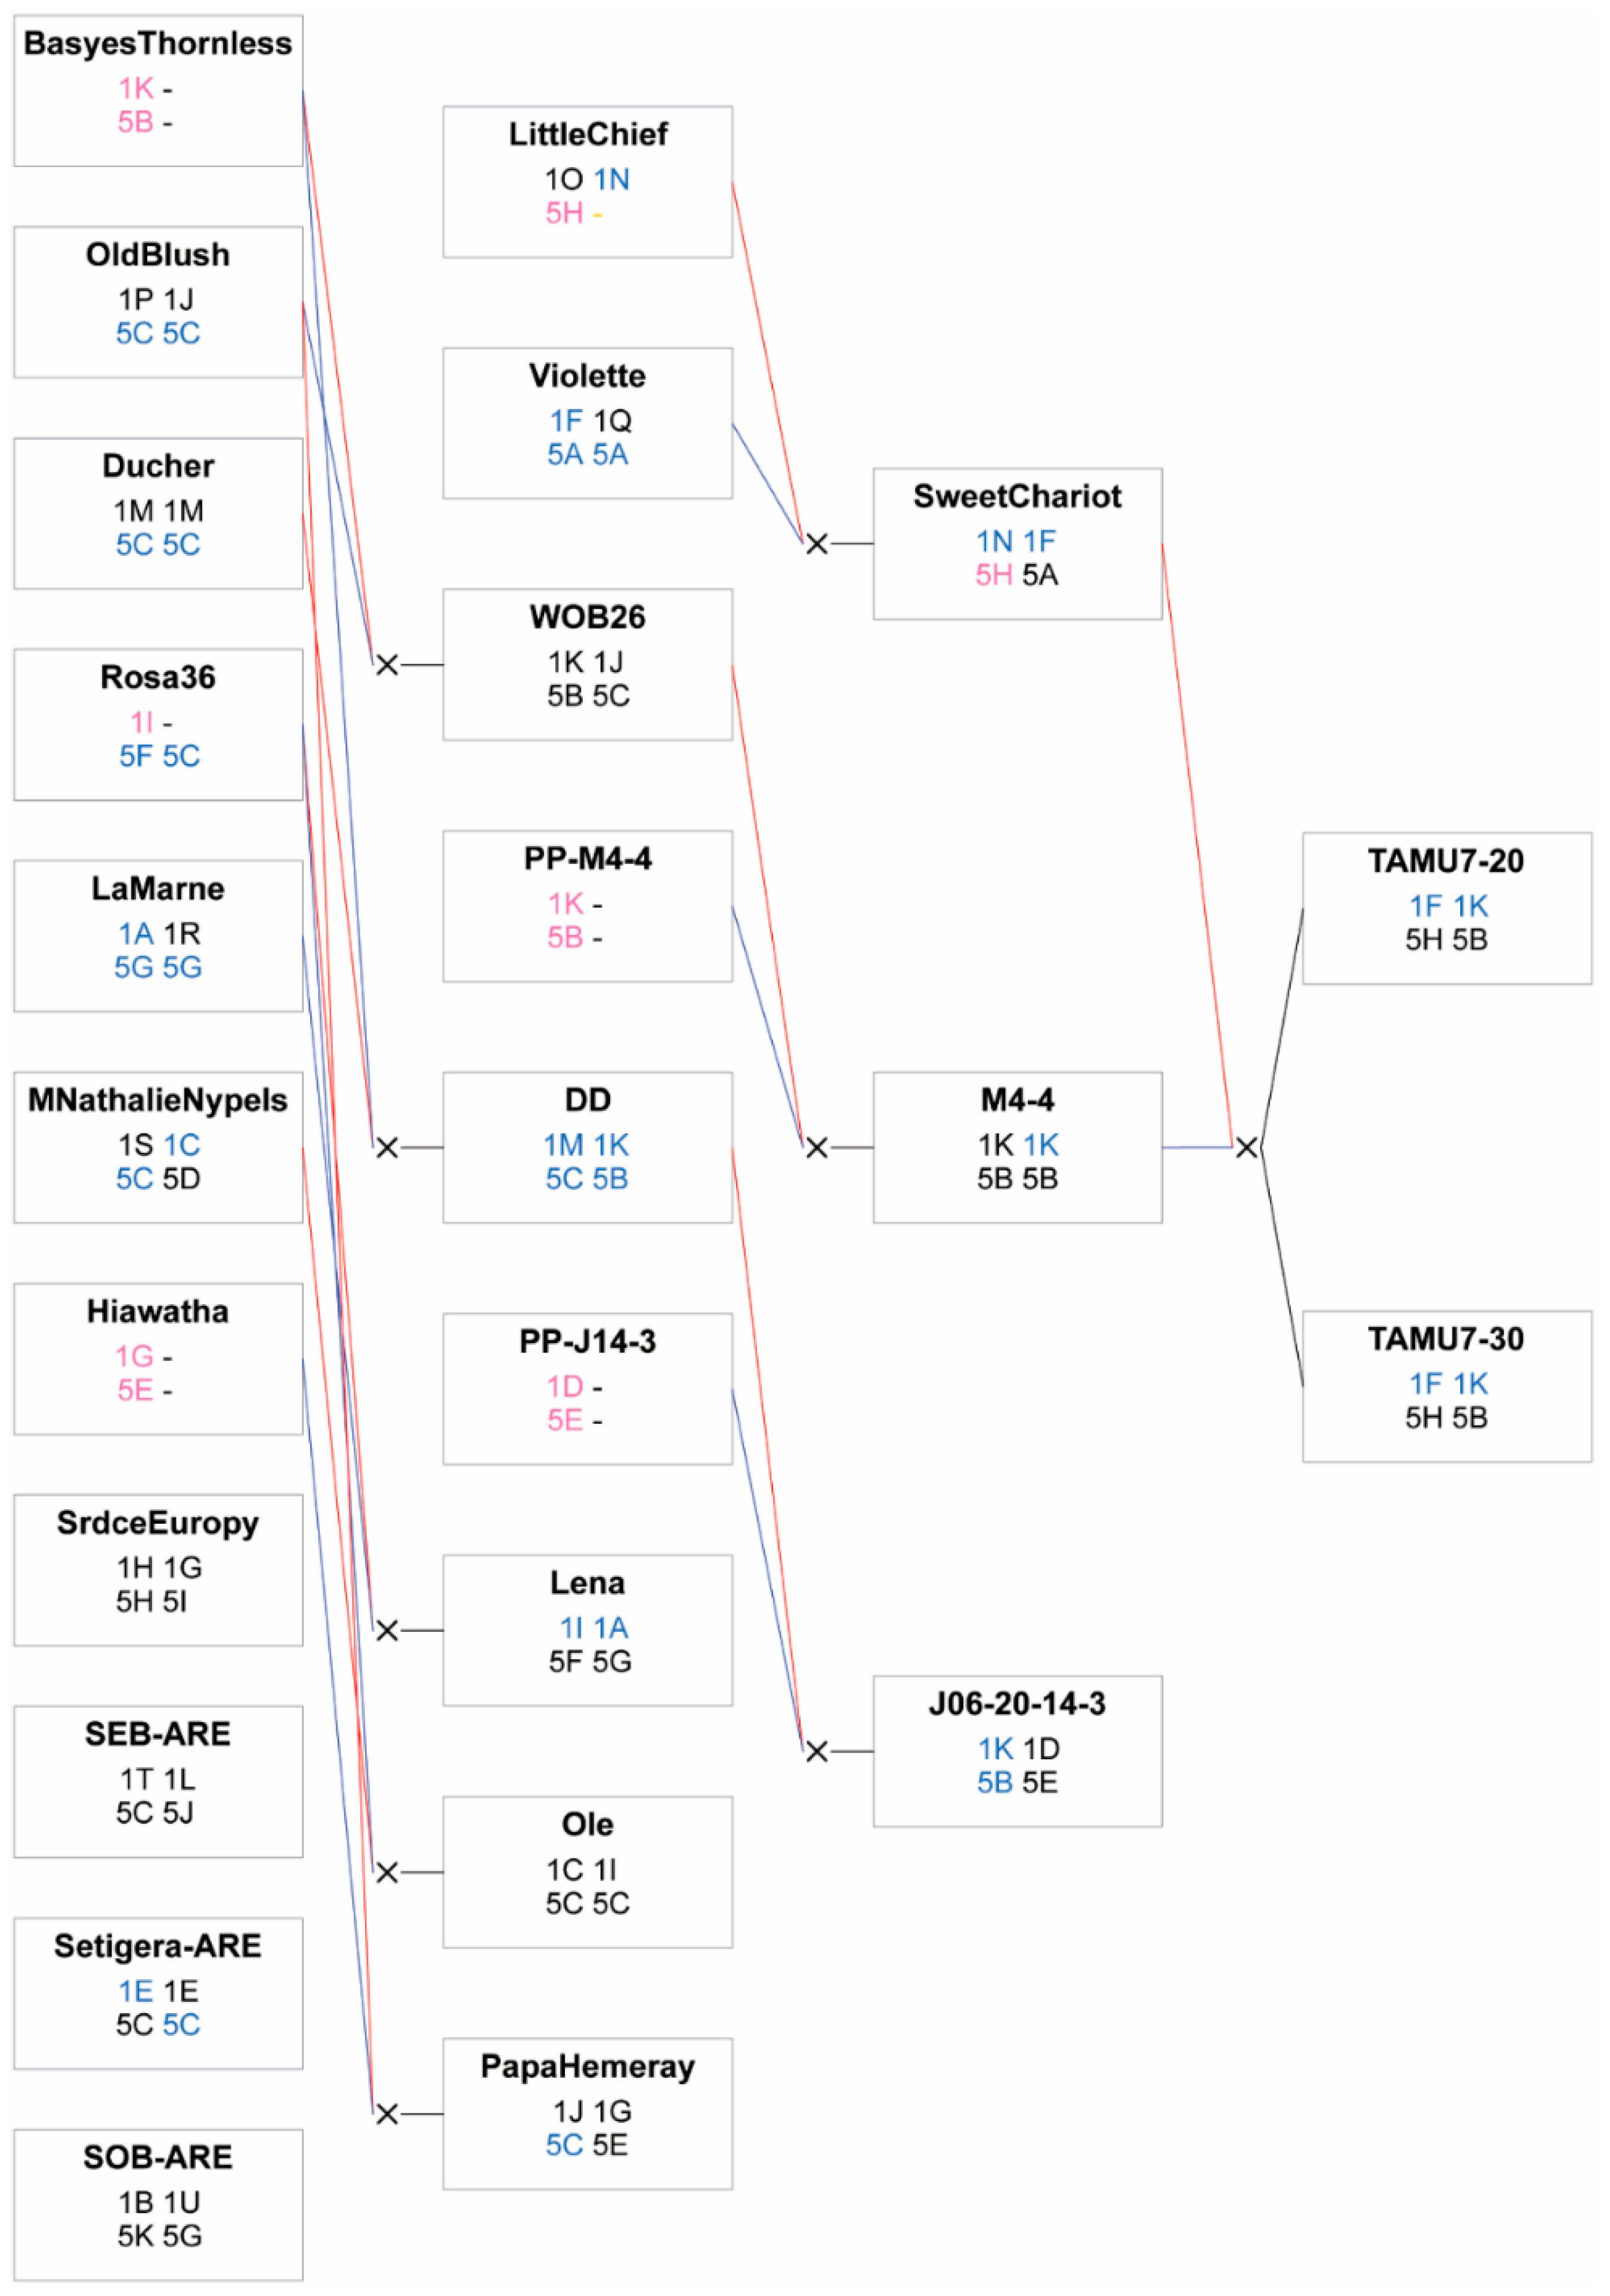
2.4. Haplotype Analysis
3. Discussion
4. Materials and Methods
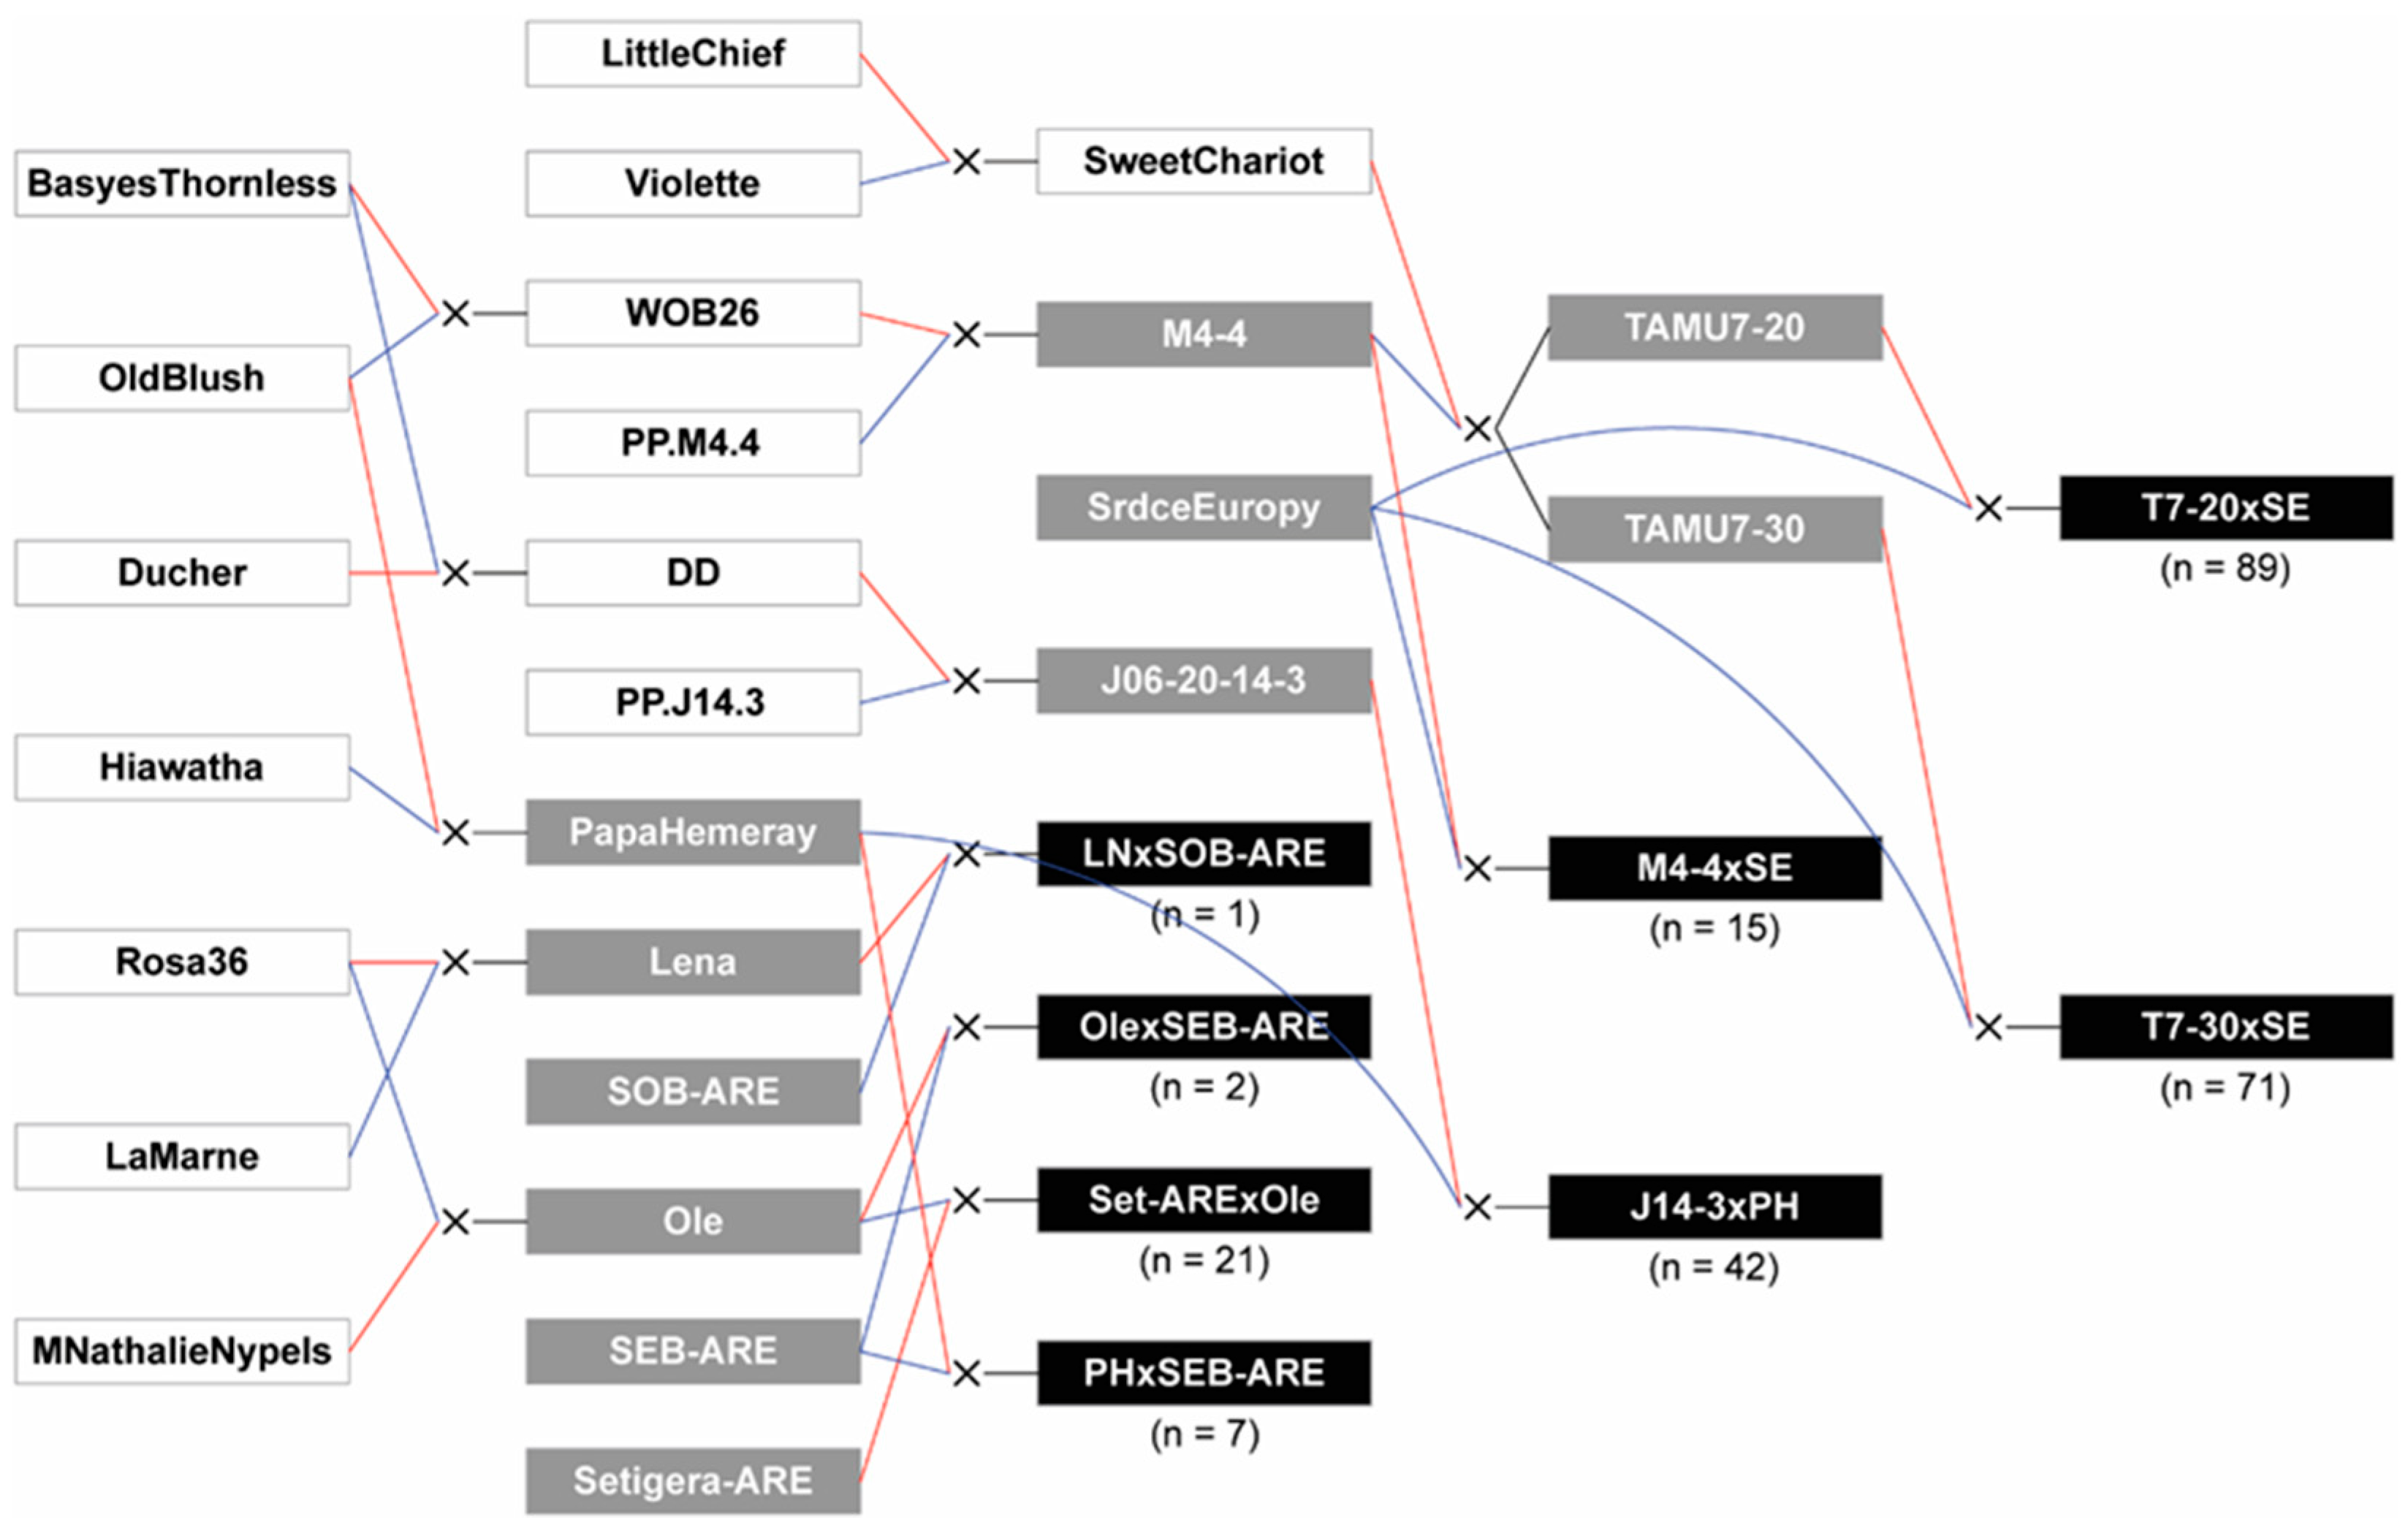
4.1. Plant Material
4.2. Phenotypic Data
4.3. DNA Extraction and SNP Genotyping
4.4. Linkage Map Development
4.5. QTL Analysis
4.6. Haplotype Analysis
Supplementary Materials
Author Contributions
Funding
Institutional Review Board Statement
Informed Consent Statement
Data Availability Statement
Acknowledgments
Conflicts of Interest
References
- Pemberton, H.B.; Ong, K.; Windham, M.; Olson, J.; Byrne, D.H. What is Rose Rosette Disease? J. Hortic. Sci. 2018, 53, 592–595. [Google Scholar] [CrossRef] [Green Version]
- USDA-NASS. Census of Horticultural Specialties (2019). Available online: https://www.nass.usda.gov/Publications/AgCensus/2017/Online_Resources/Census_of_Horticulture_Specialties/index.php (accessed on 22 May 2022).
- Chakraborty, P.; Das, S.; Saha, B.; Karmakar, A.; Saha, D.; Saha, A. Rose rosette virus: An emerging pathogen of garden roses in India. Australas. Plant Pathol. 2017, 46, 223–226. [Google Scholar] [CrossRef]
- Vazquez-Iglesias, I.; Ochoa-Corona, F.M.; Tang, J.; Robinson, R.; Clover, G.R.G.; Fox, A.; Boonham, N. Facing Rose rosette virus: A risk to European rose cultivation. Plant Pathol. 2020, 69, 1603–1617. [Google Scholar] [CrossRef]
- Amrine, J.W.; Hindal, D.F.; Stasny, T.A.; Williams, R.L.; Coffman, C.C. Transmission of the rose rosette disease agent to Rosa multiflora by Phyllocoptes fructiphilus (Acari: Eriophyidae). Entomol. News 1988, 99, 239–252. [Google Scholar]
- Hoy, M. Eriophyid mite vector of rose rosette disease (RRD) Phyllocoptes fructiphilus Keifer (Arachnida: Acari: Eriophyidae). EDIS 2013, 8, EENY-558. [Google Scholar] [CrossRef]
- Windham, M.; Windham, A.; Hale, F.; Amrine Jr, J. Observations on rose rosette disease. Am. Rose 2014, 42, 56–62. [Google Scholar]
- Olson, J.; Rebek, E.; Schnelle, M. Rose Rosette Disease. 2015, p. EPP-7329. Available online: https://extension.okstate.edu/fact-sheets/print-publications/epp-entomology-and-plant-pathologhy/rose-rosette-disease-epp-7329.pdf (accessed on 22 May 2022).
- Laney, A.G.; Keller, K.E.; Martin, R.R.; Tzanetakis, I.E. A discovery 70 years in the making: Characterization of the rose rosette virus. J. Gen. Virol. 2011, 92, 1727–1732. [Google Scholar] [CrossRef]
- Di Bello, P.L.; Ho, T.; Tzanetakis, I.E. The evolution of emaraviruses is becoming more complex: Seven segments identified in the causal agent of rose rosette disease. Virus Res. 2015, 210, 241–244. [Google Scholar] [CrossRef]
- Kormelink, R.; Verchot, J.; Tao, X.; Desbiez, C. The Bunyavirales: The Plant-Infecting Counterparts. Viruses 2021, 13, 842. [Google Scholar] [CrossRef]
- Verchot, J.; Herath, V.; Urrutia, C.D.; Gayral, M.; Lyle, K.; Shires, M.K.; Ong, K.; Byrne, D. Development of a Reverse Genetic System for Studying Rose Rosette Virus in Whole Plants. Mol. Plant-Microbe Interact. 2020, 33, 1209–1221. [Google Scholar] [CrossRef]
- Katsiani, A.; Stainton, D.; Lamour, K.; Tzanetakis, I.E. The population structure of Rose rosette virus in the USA. J. Gen. Virol. 2020, 101, 676–684. [Google Scholar] [CrossRef] [PubMed]
- Mielke-Ehret, N.; Mühlbach, H.-P. Emaravirus: A novel genus of multipartite, negative strand RNA plant viruses. Viruses 2012, 4, 1515–1536. [Google Scholar] [CrossRef] [PubMed] [Green Version]
- Byrne, D.H.; Klein, P.; Yan, M.; Young, E.; Lau, J.; Ong, K.; Shires, M.; Olson, J.; Windham, M.; Evans, T. Challenges of breeding rose rosette–resistant roses. HortScience 2018, 53, 604–608. [Google Scholar] [CrossRef]
- Zlesak, D.C. Pollen diameter and guard cell length as predictors of ploidy in diverse rose cultivars, species, and breeding lines. Floric. Ornam. Biotechnol. 2009, 3, 53–70. [Google Scholar]
- Hibrand Saint-Oyant, L.; Ruttink, T.; Hamama, L.; Kirov, I.; Lakhwani, D.; Zhou, N.N.; Bourke, P.M.; Daccord, N.; Leus, L.; Schulz, D.; et al. A high-quality genome sequence of Rosa chinensis to elucidate ornamental traits. Nat. Plants 2018, 4, 473–484. [Google Scholar] [CrossRef] [Green Version]
- Bink, M.C.A.M.; Jansen, J.; Madduri, M.; Voorrips, R.E.; Durel, C.E.; Kouassi, A.B.; Laurens, F.; Mathis, F.; Gessler, C.; Gobbin, D.; et al. Bayesian QTL analyses using pedigreed families of an outcrossing species, with application to fruit firmness in apple. Theor. Appl. Genet. 2014, 127, 1073–1090. [Google Scholar] [CrossRef]
- Yan, M.; Byrne, D.H.; Klein, P.E.; Yang, J.; Dong, Q.; Anderson, N. Genotyping-by-sequencing application on diploid rose and a resulting high-density SNP-based consensus map. Hortic. Res. 2018, 5, 17. [Google Scholar] [CrossRef]
- Li, S.; Yang, G.; Yang, S.; Just, J.; Yan, H.; Zhou, N.; Jian, H.; Wang, Q.; Chen, M.; Qiu, X. The development of a high-density genetic map significantly improves the quality of reference genome assemblies for rose. Sci. Rep. 2019, 9, 5985. [Google Scholar] [CrossRef]
- Bourke, P.M.; Arens, P.; Voorrips, R.E.; Esselink, G.D.; Koning-Boucoiran, C.F.; van’t Westende, W.P.; Santos Leonardo, T.; Wissink, P.; Zheng, C.; Geest, G. Partial preferential chromosome pairing is genotype dependent in tetraploid rose. Plant J. 2017, 90, 330–343. [Google Scholar] [CrossRef] [Green Version]
- Zurn, J.D.; Zlesak, D.C.; Holen, M.; Bradeen, J.M.; Hokanson, S.C.; Bassil, N.V. Mapping a novel black spot resistance locus in the climbing rose Brite Eyes™(‘RADbrite’). Front. Plant Sci. 2018, 9, 1730. [Google Scholar] [CrossRef]
- Zurn, J.D.; Zlesak, D.C.; Holen, M.; Bradeen, J.M.; Hokanson, S.C.; Bassil, N.V. Mapping the black spot resistance locus Rdr3 in the shrub rose ‘George Vancouver’ allows for the development of improved diagnostic markers for DNA-informed breeding. Theor. Appl. Genet. 2020, 133, 2011–2020. [Google Scholar] [CrossRef] [PubMed]
- Goff, K.E.; Ramonell, K.M. The Role and Regulation of Receptor-Like Kinases in Plant Defense. Gene Regul. Syst. Biol. 2007, 1, 167–175. [Google Scholar] [CrossRef] [Green Version]
- Zhao, L.; Liu, S.; Abdelsalam, N.R.; Carver, B.F.; Bai, G. Characterization of wheat curl mite resistance gene Cmc4 in OK05312. Theor. Appl. Genet. 2021, 134, 993–1005. [Google Scholar] [CrossRef] [PubMed]
- Verma, S.; Evans, K.; Guan, Y.; Luby, J.; Rosyara, U.; Howard, N.; Bassil, N.; Bink, M.; van de Weg, W.; Peace, C. Two large-effect QTLs, Ma and Ma3, determine genetic potential for acidity in apple fruit: Breeding insights from a multi-family study. J. Tree Genet. Genom. 2019, 15, 1–17. [Google Scholar] [CrossRef] [Green Version]
- Kostick, S.A.; Teh, S.L.; Norelli, J.L.; Vanderzande, S.; Peace, C.; Evans, K.M. Fire blight QTL analysis in a multi-family apple population identifies a reduced-susceptibility allele in ‘Honeycrisp’. Hortic. Res. 2021, 8, 28. [Google Scholar] [CrossRef]
- Marçon, A.; Kaeppler, S.M.; Jensen, S.G. Resistance to Systemic Spread of High Plains Virus and Wheat Streak Mosaic Virus Cosegregates in Two F2 Maize Populations Inoculated with Both Pathogens. Crop Sci. 1997, 37, 1923–1927. [Google Scholar] [CrossRef]
- Nachappa, P.; Haley, S.; Pearce, S. Resistance to the wheat curl mite and mite-transmitted viruses: Challenges and future directions. Curr. Opin. Insect Sci. 2021, 45, 21–27. [Google Scholar] [CrossRef]
- Saxena, R.K.; Kale, S.M.; Kumar, V.; Parupali, S.; Joshi, S.; Singh, V.; Garg, V.; Das, R.R.; Sharma, M.; Yamini, K.N. Genotyping-by-sequencing of three mapping populations for identification of candidate genomic regions for resistance to sterility mosaic disease in pigeonpea. J. Sci. Rep. 2017, 7, 1813. [Google Scholar] [CrossRef] [Green Version]
- Gnanesh, B.; Bohra, A.; Sharma, M.; Byregowda, M.; Pande, S.; Wesley, V.; Saxena, R.; Saxena, K.; Kishor, P.K.; Varshney, R. Genetic mapping and quantitative trait locus analysis of resistance to sterility mosaic disease in pigeonpea [Cajanus cajan (L.) Millsp.]. Field Crops Res. 2011, 123, 53–61. [Google Scholar] [CrossRef] [Green Version]
- Saxena, R.K.; Hake, A.; Bohra, A.; Khan, A.W.; Hingane, A.; Sultana, R.; Singh, I.P.; Naik, S.J.S.; Varshney, R.K. A diagnostic marker kit for Fusarium wilt and sterility mosaic diseases resistance in pigeonpea. Theor. Appl. Genet. 2021, 134, 367–379. [Google Scholar] [CrossRef] [PubMed]
- Voorrips, R.E.; Bink, M.C.; van de Weg, E. Pedimap: Software for the visualization of genetic and phenotypic data in pedigrees. J. Hered. 2012, 903–907. [Google Scholar] [CrossRef] [PubMed]
- Dobhal, S.; Olson, J.D.; Arif, M.; Suarez, J.A.G.; Ochoa-Corona, F.M. A simplified strategy for sensitive detection of Rose rosette virus compatible with three RT-PCR chemistries. J. Virol. Methods 2016, 232, 47–56. [Google Scholar] [CrossRef] [PubMed] [Green Version]
- R Core Team. R: A Language and Environment for Statistical Computing; R Foundation for Statistical Computing: Vienna, Austria, 2020; Available online: https://www.R-project.org/ (accessed on 22 May 2022).
- Peterson, B.G.; Carl, P. PerformanceAnalytics: Econometric Tools for Performance and Risk Analysis, 2.0.4. 2020. Available online: https://CRAN.R-project.org/package=PerformanceAnalytics (accessed on 22 May 2022).
- Butler, D. asreml: Fits the Linear Mixed Model, 4.1.0.160. 2021. Available online: https://asreml.kb.vsni.co.uk/knowledge-base/asreml/ (accessed on 22 May 2022).
- Morishige, D.T.; Klein, P.E.; Hilley, J.L.; Sahraeian, S.M.E.; Sharma, A.; Mullet, J.E. Digital genotyping of sorghum–a diverse plant species with a large repeat-rich genome. BMC Genom. 2013, 14, 448. [Google Scholar] [CrossRef] [PubMed] [Green Version]
- Purcell, S.; Chang, C. PLINK 1.9. 2015. Available online: https://www.cog-genomics.org/plink2 (accessed on 22 May 2022).
- Purcell, S.; Neale, B.; Todd-Brown, K.; Thomas, L.; Ferreira, M.A.; Bender, D.; Maller, J.; Sklar, P.; De Bakker, P.I.; Daly, M.J. PLINK: A tool set for whole-genome association and population-based linkage analyses. Am. J. Hum. Genet. 2007, 81, 559–575. [Google Scholar] [CrossRef] [Green Version]
- Bourke, P.M.; van Geest, G.; Voorrips, R.E.; Jansen, J.; Kranenburg, T.; Shahin, A.; Visser, R.G.F.; Arens, P.; Smulders, M.J.M.; Maliepaard, C. polymapR—linkage analysis and genetic map construction from F1 populations of outcrossing polyploids. Bioinformatics 2018, 34, 3496–3502. [Google Scholar] [CrossRef] [PubMed]
- Preedy, K.; Hackett, C. A rapid marker ordering approach for high-density genetic linkage maps in experimental autotetraploid populations using multidimensional scaling. Theor. Appl. Genet. 2016, 129, 2117–2132. [Google Scholar] [CrossRef]
- Holtz, Y.; David, J.L.; Ranwez, V. The genetic map comparator: A user-friendly application to display and compare genetic maps. Bioinformatics 2017, 33, 1387–1388. [Google Scholar] [CrossRef] [Green Version]
- Endelman, J.B.; Plomion, C. LPmerge: An R package for merging genetic maps by linear programming. Bioinformatics 2014, 30, 1623–1624. [Google Scholar] [CrossRef] [Green Version]
- van Muijen, D.; Basnet, R.; Dek, N.; Maliepaard, C.; Gutteling, E. Mapfuser: An integrative toolbox for consensus map construction and Marey maps. bioRxiv 2017. [Google Scholar] [CrossRef]
- Kass, R.E.; Raftery, A.E. Bayes factors. J. Am. Stat. Assn. 1995, 90, 773–795. [Google Scholar] [CrossRef]
- Voorrips, R.E. MapChart: Software for the graphical presentation of linkage maps and QTLs. J. Hered. 2002, 93, 77–78. [Google Scholar] [CrossRef] [PubMed] [Green Version]
- Jung, S.; Lee, T.; Cheng, C.-H.; Buble, K.; Zheng, P.; Yu, J.; Humann, J.; Ficklin, S.P.; Gasic, K.; Scott, K. 15 years of GDR: New data and functionality in the Genome Database for Rosaceae. Nucleic Acids Res. 2018, 47, D1137–D1145. [Google Scholar] [CrossRef] [PubMed] [Green Version]
- Rawandoozi, Z.J.; Hartmann, T.P.; Carpenedo, S.; Gasic, K.; da Silva Linge, C.; Cai, L.; Van de Weg, E.; Byrne, D.H. Identification and characterization of QTLs for fruit quality traits in peach through a multi-family approach. BMC Genom. 2020, 21, 1–18. [Google Scholar] [CrossRef] [PubMed]
- Voorrips, R.E.; Bink, M.C.A.M.; Kruisselbrink, J.W.; Koehorst-van Putten, H.J.J.; van de Weg, W.E. PediHaplotyper: Software for consistent assignment of marker haplotypes in pedigrees. Mol. Breed. 2016, 36, 119. [Google Scholar] [CrossRef] [Green Version]
- Pohlert, T. PMCMRplus: Calculate Pairwise Multiple Comparisons of Mean Rank Sums Extended, 1.9.0. 2021. Available online: https://CRAN.R-project.org/package=PMCMRplus (accessed on 22 May 2022).


| Chr | Trait a | Year | Prior b | Run | BF(1 vs. 0) c | BF(2 vs. 1) c | Position (cM) d | Physical Position (Mbp) | PVE (%) e |
|---|---|---|---|---|---|---|---|---|---|
| 1 | Severity | 2019 | 1 | 1 | 3.1 | 0.2 | 14 (6–26) | 0.4–27.2 | 15.7 |
| 1 | Severity | 2019 | 5 | 2 | 2.2 | 0.5 | 8 (6–28) | 0.3–27.2 | 13.0 |
| 1 | Severity | Overall | 1 | 1 | 4 | −0.2 | 10 (4–24) | 0.1–27.2 | 18.1 |
| 1 | Severity | Overall | 1 | 2 | 4.2 | 0.5 | 8 (4–26) | 0.1–27.2 | 17.0 |
| 1 | Severity | Overall | 5 | 1 | 3.1 | 0.2 | 16 (4–20) | 0.1–12.5 | 14.0 |
| 1 | Severity | Overall | 5 | 2 | 2.9 | 0.5 | 12 (4–22) | 0.1–12.5 | 14.2 |
| 3 | Severity | Overall | 1 | 1 | 2.2 | −0.1 | 18 (16–30) | 9.6–34.3 | 9.1 |
| 3 | Severity | Overall | 1 | 2 | 2 | −0.4 | 18 (16–30) | 9.6–34.3 | 9.7 |
| 3 | Severity | Overall | 5 | 1 | 2.1 | 0.2 | 18 (16–26) | 0.6–33.6 | 9.1 |
| 5 | Ctval | Overall | 1 | 1 | 10.9 | 1.2 | 50 (32–60) | 5.0–23.5 | 22.1 |
| 5 | Ctval | Overall | 1 | 2 | 11.2 | 1.7 | 50 (34–64) | 5.0–27.0 | 23.7 |
| 5 | Ctval | Overall | 5 | 1 | 9.9 | 1.3 | 49 (34–54) | 5.0–18.3 | 16.3 |
| 5 | Ctval | Overall | 5 | 2 | 9.2 | 1 | 49 (34–52) | 5.0–14.1 | 15.2 |
| 5 | Severity | Overall | 1 | 1 | 31 | 0.6 | 49 (42–52) | 6.8–14.1 | 43.2 |
| 5 | Severity | Overall | 1 | 2 | 31 | 0.4 | 49 (36–50) | 5.3–11.1 | 40.6 |
| 5 | Severity | Overall | 5 | 1 | 26.8 | 0.7 | 49 (42–52) | 6.8–14.1 | 39.1 |
| 5 | Severity | Overall | 5 | 2 | 26.9 | 0.6 | 49 (44–52) | 6.8–14.1 | 41.0 |
| 5 | Severity | 2019 | 1 | 1 | 31 | 0.2 | 49 (36–52) | 5.3–14.1 | 27.2 |
| 5 | Severity | 2019 | 1 | 2 | 15.8 | −0.1 | 49 (30–52) | 3.9–14.1 | 27.0 |
| 5 | Severity | 2019 | 5 | 1 | 26.8 | 0.6 | 49 (36–52) | 5.3–14.1 | 23.6 |
| 5 | Severity | 2019 | 5 | 2 | 27 | 0.3 | 50 (36–52) | 5.3–14.1 | 24.5 |
| 5 | Severity | 2020 | 1 | 1 | 9.6 | 0.7 | 71 (30–78) | 3.9–47.6 | 17.9 |
| 5 | Severity | 2020 | 1 | 2 | 9.6 | 0.9 | 72 (30–74) | 3.9–39.5 | 17.9 |
| 5 | Severity | 2020 | 5 | 1 | 9.8 | 1.2 | 70 (54–74) | 12.3–39.5 | 14.3 |
| 5 | Severity | 2020 | 5 | 2 | 9.7 | 1.6 | 68 (56–76) | 16.0–47.6 | 13.1 |
| 5 | Severity | 2021 | 1 | 1 | 7.5 | 2.2 | 46 (34–58) | 5.0–32.7 | 11.6 |
| 5 | Severity | 2021 | 1 | 2 | 8.9 | 2.3 | 46 (34–66) | 5.0–32.7 | 12.2 |
| 5 | Severity | 2021 | 5 | 1 | 7.9 | 2.2 | 46 (40–58) | 5.3–23.5 | 10.1 |
| 5 | Severity | 2021 | 5 | 2 | 7.1 | 2.4 | 51 (34–58) | 5.0–23.5 | 10.1 |
| 6 | Severity | 2021 | 1 | 1 | 6.4 | 0.6 | 28 (4–34) | 0.3–34.4 | 13.0 |
| 6 | Severity | 2021 | 1 | 2 | 5.9 | 0.2 | 28 (6–36) | 0.3–34.4 | 13.1 |
| 6 | Severity | 2021 | 5 | 1 | 6.9 | 0.1 | 29 (16–32) | 3.2–23.2 | 12.7 |
| 6 | Severity | 2021 | 5 | 2 | 6.8 | 0.4 | 28 (16–32) | 3.2–23.2 | 12.5 |
| Ct Value | Severity Overall | |||||||||||||
|---|---|---|---|---|---|---|---|---|---|---|---|---|---|---|
| No. Offspring | Presence | Absence | Presence | Absence | ||||||||||
| Haplotype Sequence | ID | Homo a | Het b | Total | c | SD | d | SD | p-Value e | c | SD | d | SD | p-Value e |
| AATGCCT | 5B | 0 | 121 | 121 | 37.8 | 5.5 | 33.7 | 5.5 | <0.0001 | 0.09 | 0.23 | 0.47 | 0.79 | <0.0001 |
| AGTGTCA | 5C | 27 | 20 | 47 | 36.1 | 6.3 | 34.5 | 7.4 | 0.12 | 0.25 | 0.74 | 0.39 | 0.71 | <0.0001 |
| _GATTAA | 5E | 10 | 26 | 36 | 33.8 | 7.9 | 34.9 | 7.2 | 0.37 | 0.39 | 0.8 | 0.37 | 0.7 | 0.01 |
| AG___AA | 5F | 0 | 1 | 1 | 40.0 | NA | 34.8 | 7.3 | 0.47 | 0.00 | NA | 0.37 | 0.71 | 0.38 |
| TGATTAA | 5H | 53 | 80 | 133 | 32.0 | 7.6 | 36.4 | 6.5 | <0.0001 | 0.63 | 0.84 | 0.22 | 0.57 | <0.0001 |
| AGTGCCA | 5I | 0 | 53 | 53 | 36.1 | 6.4 | 34.6 | 7.3 | 0.18 | 0.31 | 0.60 | 0.38 | 0.72 | 0.78 |
| AATGTCA | 5J | 0 | 2 | 2 | 21.3 | 1.2 | 34.8 | 7.2 | 0.01 | 0.59 | 0.14 | 0.37 | 0.71 | 0.15 |
| AA___CA | 5K | 0 | 1 | 1 | 40.0 | NA | 34.8 | 7.2 | 0.47 | 0.00 | NA | 0.37 | 0.71 | 0.38 |
| No. Offspring | Presence | Absence | |||||||
|---|---|---|---|---|---|---|---|---|---|
| Haplotype Sequence | ID | Homo a | Het b | Total | c | SD | d | SD | p-Value e |
| CAGTA_AAG_ATGC | 1A | 0 | 1 | 1 | 0.00 | NA | 0.37 | 0.71 | 0.40 |
| CAG_A_AAG_AT_C | 1B | 0 | 1 | 1 | 0.00 | NA | 0.37 | 0.71 | 0.40 |
| CATTATGAG_ATGC | 1C | 0 | 7 | 7 | 0.00 | 0.00 | 0.37 | 0.72 | 0.17 |
| GATTGTGGGCCTG_ | 1D | 0 | 22 | 22 | 0.06 | 0.27 | 0.38 | 0.72 | <0.001 |
| CAGTATAAG_ATGC | 1E | 0 | 20 | 20 | 0.17 | 0.68 | 0.38 | 0.71 | 0.17 |
| C_GT_TGGGCATGT | 1F | 0 | 82 | 82 | 0.32 | 0.56 | 0.38 | 0.74 | 0.22 |
| CAGTATGGGCATGT | 1G | 0 | 103 | 103 | 0.33 | 0.68 | 0.38 | 0.72 | 0.88 |
| CAGAATGAGGATAC | 1H | 0 | 79 | 79 | 0.36 | 0.57 | 0.37 | 0.74 | 0.09 |
| CAGTATAGT_ATGC | 1I | 0 | 15 | 15 | 0.39 | 0.97 | 0.37 | 0.70 | 0.68 |
| CCGTGTAAGCATGC | 1J | 0 | 14 | 14 | 0.69 | 1.08 | 0.36 | 0.70 | 0.76 |
| CCGAAAAATGACAC | 1K | 0 | 92 | 92 | 0.49 | 0.80 | 0.34 | 0.69 | 0.04 |
| CAGTA_AAGCATGC | 1L | 0 | 2 | 2 | 1.22 | 1.73 | 0.37 | 0.71 | 0.60 |
Publisher’s Note: MDPI stays neutral with regard to jurisdictional claims in published maps and institutional affiliations. |
© 2022 by the authors. Licensee MDPI, Basel, Switzerland. This article is an open access article distributed under the terms and conditions of the Creative Commons Attribution (CC BY) license (https://creativecommons.org/licenses/by/4.0/).
Share and Cite
Young, E.L.; Lau, J.; Bentley, N.B.; Rawandoozi, Z.; Collins, S.; Windham, M.T.; Klein, P.E.; Byrne, D.H.; Riera-Lizarazu, O. Identification of QTLs for Reduced Susceptibility to Rose Rosette Disease in Diploid Roses. Pathogens 2022, 11, 660. https://doi.org/10.3390/pathogens11060660
Young EL, Lau J, Bentley NB, Rawandoozi Z, Collins S, Windham MT, Klein PE, Byrne DH, Riera-Lizarazu O. Identification of QTLs for Reduced Susceptibility to Rose Rosette Disease in Diploid Roses. Pathogens. 2022; 11(6):660. https://doi.org/10.3390/pathogens11060660
Chicago/Turabian StyleYoung, Ellen L., Jeekin Lau, Nolan B. Bentley, Zena Rawandoozi, Sara Collins, Mark T. Windham, Patricia E. Klein, David H. Byrne, and Oscar Riera-Lizarazu. 2022. "Identification of QTLs for Reduced Susceptibility to Rose Rosette Disease in Diploid Roses" Pathogens 11, no. 6: 660. https://doi.org/10.3390/pathogens11060660