Article

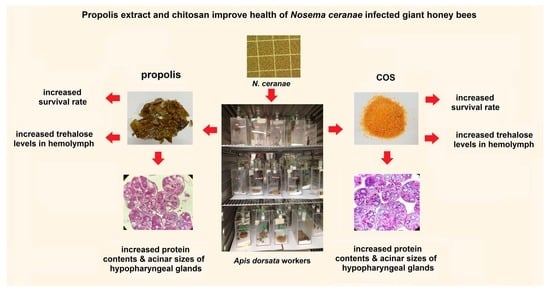
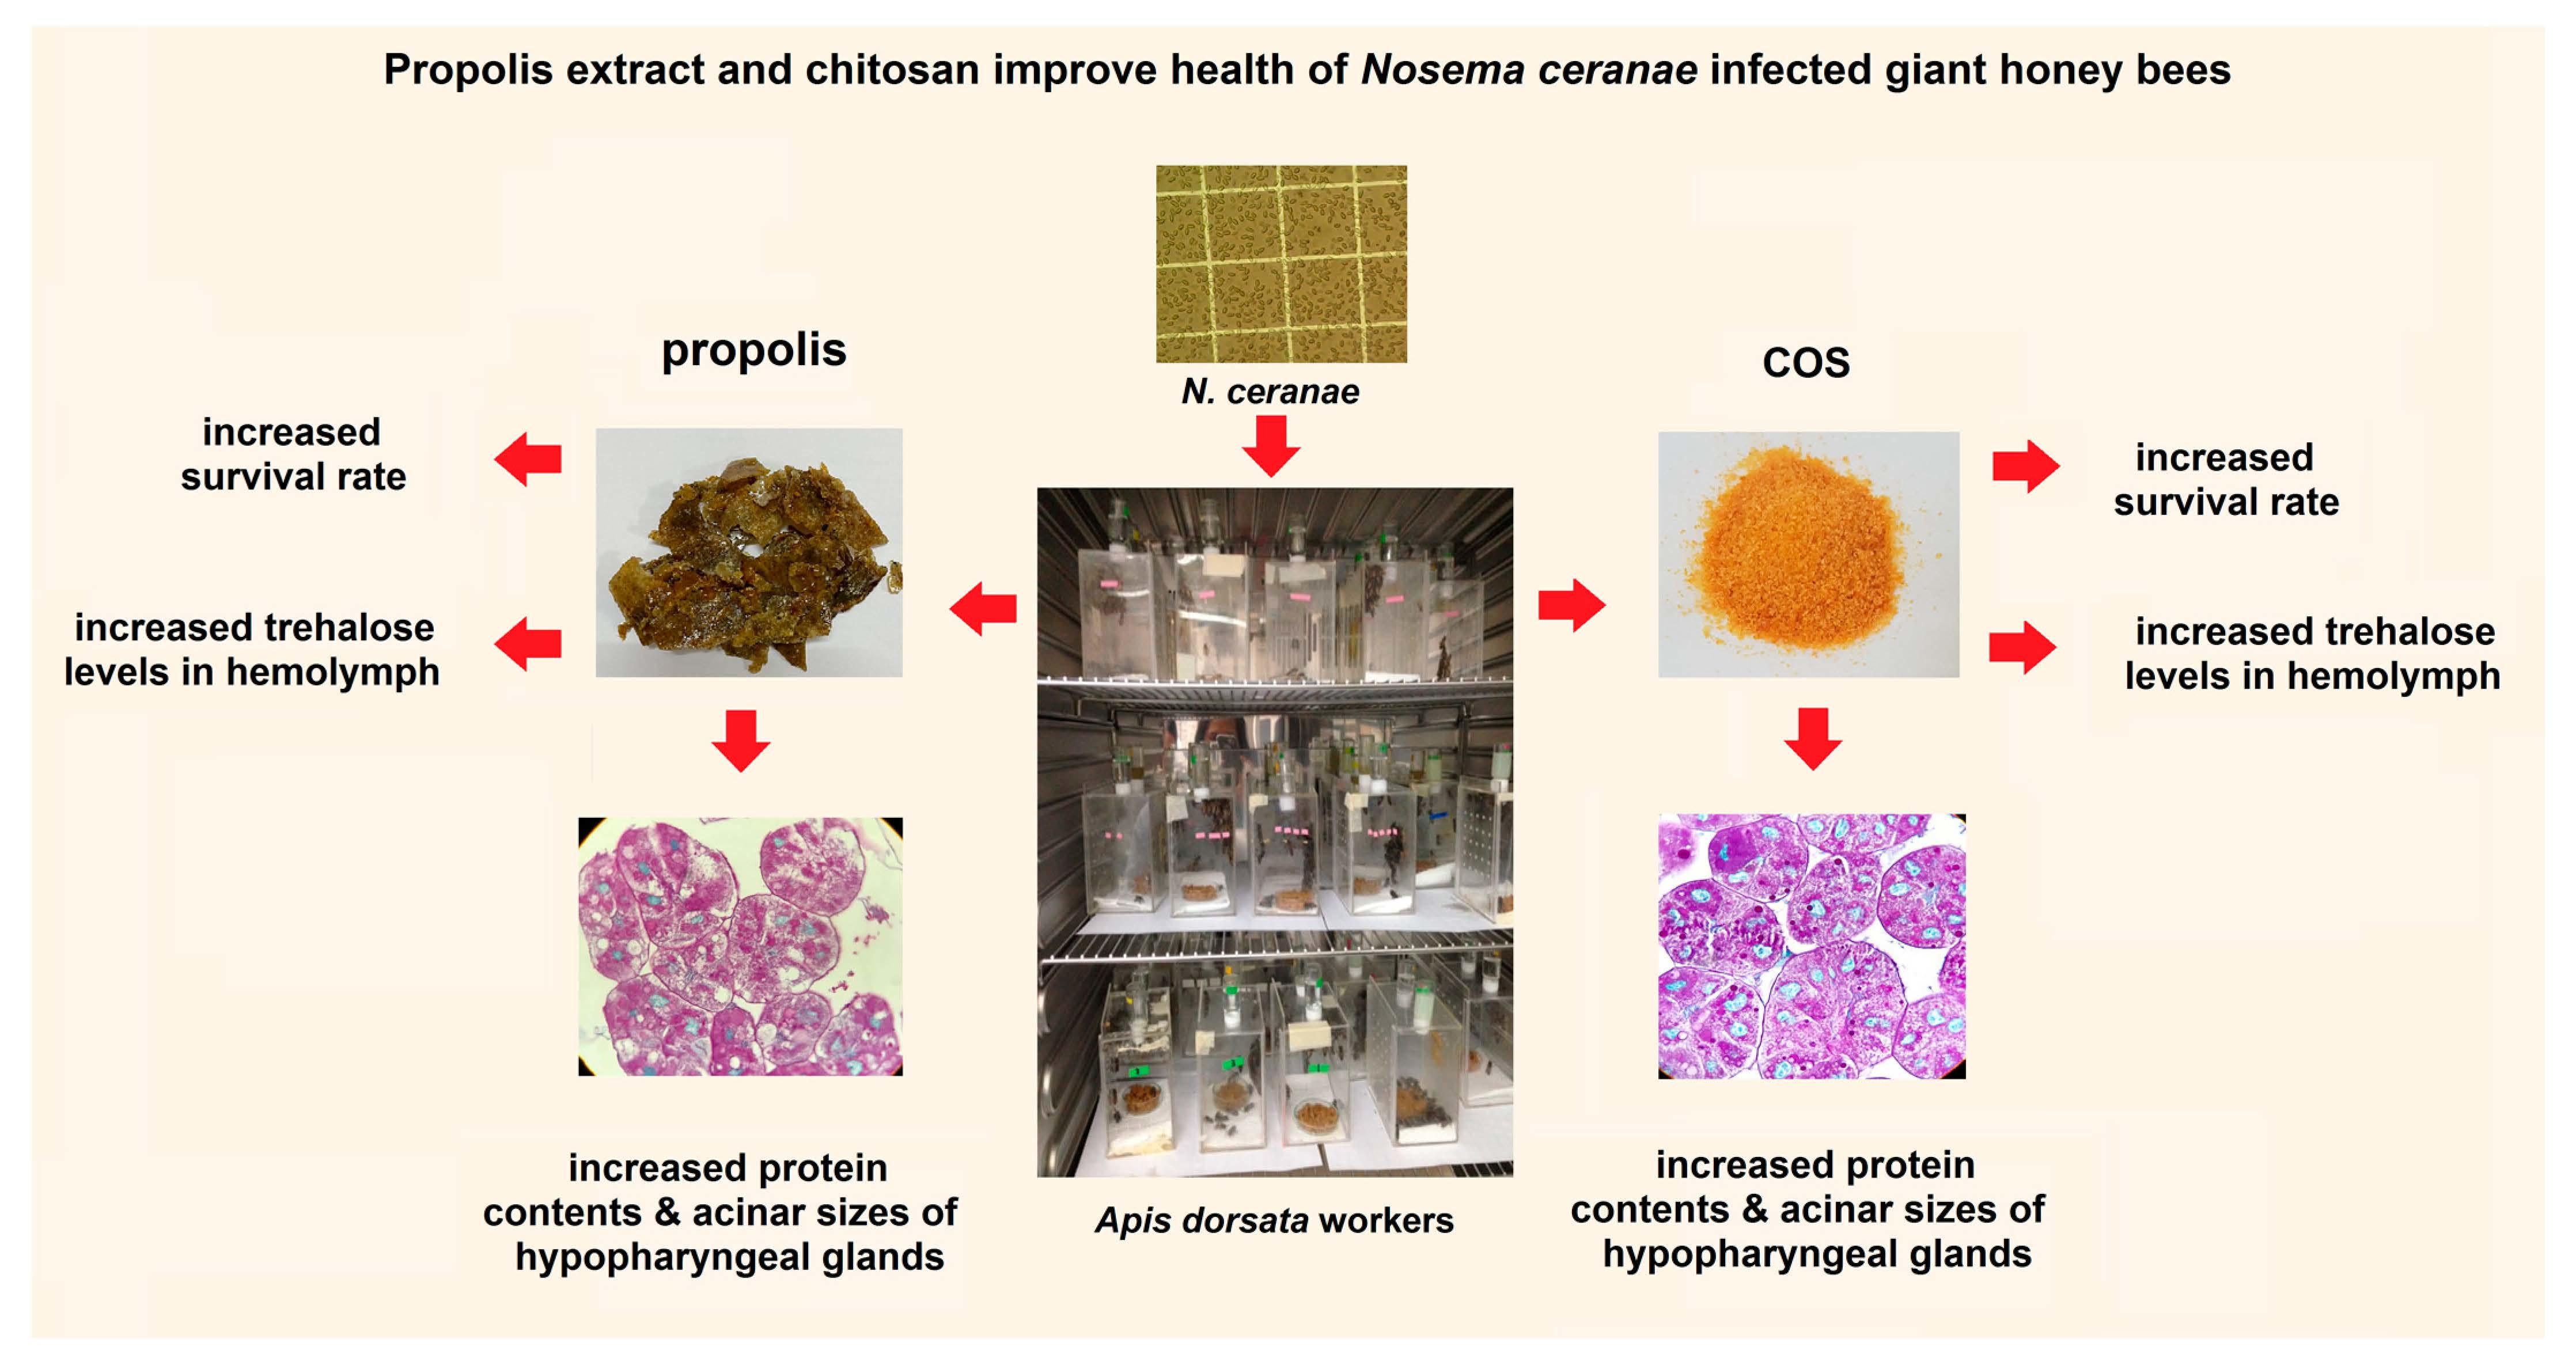
Propolis Extract and Chitosan Improve Health of Nosema ceranae Infected Giant Honey Bees, Apis dorsata Fabricius, 1793

by
Sanchai Naree
1,
Rujira Ponkit
1,
Evada Chotiaroonrat
1,
Christopher L. Mayack
2 and
Guntima Suwannapong
1,*
1
Biological Science Program, Faculty of Science, Burapha University, Chon Buri 20131, Thailand
2
Molecular Biology, Genetics, and Bioengineering, Faculty of Engineering and Natural Sciences, Sabanci University, 34956 Istanbul, Turkey
*
Author to whom correspondence should be addressed.
Pathogens 2021, 10(7), 785; https://doi.org/10.3390/pathogens10070785
Submission received: 25 May 2021 / Revised: 18 June 2021 / Accepted: 20 June 2021 / Published: 22 June 2021
(This article belongs to the Special Issue Infection in Honey Bees: Host–Pathogen Interaction and Spillover)

Abstract

:
Nosema ceranae is a large contributing factor to the most recent decline in honey bee health worldwide. Developing new alternative treatments against N. ceranae is particularly pressing because there are few treatment options available and therefore the risk of increased antibiotic resistance is quite high. Recently, natural products have demonstrated to be a promising avenue for finding new effective treatments against N. ceranae. We evaluated the effects of propolis extract of stingless bee, Tetrigona apicalis and chito-oligosaccharide (COS) on giant honey bees, Apis dorsata, experimentally infected with N. ceranae to determine if these treatments could improve the health of the infected individuals. Newly emerged Nosema-free bees were individually inoculated with 106N. ceranae spores per bee. We fed infected and control bees the following treatments consisting of 0%, 50%, propolis extracts, 0 ppm and 0.5 ppm COS in honey solution (w/v). Propolis extracts and COS caused a significant increase in trehalose levels in hemolymph, protein contents, survival rates and acini diameters of the hypopharyngeal glands in infected bees. Our results suggest that propolis and COS could improve the health of infected bees. Further research is needed to determine the underlying mechanisms responsible for the improved health of the infected bees.

Graphical Abstract

1. Introduction

Honey bees play a vital role in agricultural crop production and ecosystem stability due to their pollination services [1,2,3,4,5,6]. Despite their importance there has been a global decline in bee health around the world at unsustainable rates [7,8,9]. The health decline can be attributed to a number of health factors such as pesticide exposure and poor nutrition, with parasitic infections as one of the major contributors [10,11]. Nosema disease or nosemosis is one of the most widespread parasitic infections of adult honey bees and has been implicated to play a major role in the most recent global bee health decline [12,13,14]. Nosemosis is caused by three species of microsporidia, Nosema apis, N. ceranae and N. neumanni, but the most prevalent strain found in honey bees that has emerged is N. ceranae displacing much of the N. apis infections worldwide [15,16]. Nosemosis is considered to be a chronic infection that does not exhibit obvious external disease symptoms, but can cause a poor nutrient and energy absorption leading to a suppressed immune function and ultimately a shortened life span [17,18,19,20,21]. Infected bees have evidence of lower trehalose and lipid levels, and a reduced hypopharyngeal gland resulting from the poor nutrient absorption across the gut lining [22,23,24]. N. ceranae primarily lives and reproduces in the gut lining which is likely the cause for the poor nutrient absorption in infected bees [25,26]. Consequently, infected individuals suffer from energetic stress, which results in increased bee mortality on the individual and colony level [24,27,28,29,30].
There are only a few treatment options on the market for controlling Nosemosis. The antibiotic Fumagillin has been on the market for a long time, but it is unable to kill the mature spore form of the parasite [31], so reinfections can occur [32,33]. Moreover, its use has been banned in the European Union because it has been shown to contaminate honey and could possibly lead to the buildup of antibiotic resistance in humans [34]. A natural product that is completely safe and environmentally friendly is desirable, especially for organic beekeepers. There have been a number of recent developments in this area which include using phytochemicals, Bee Cleanse, zeolite clinoptilolite, plant extracts, and propolis extract that have been documented to be effective alternative treatments [30,35,36,37,38]. These studies generally show lowered parasite loads and improved survival of the treated bees, but very few assess the health of the bee to determine how the survival of the treated bees are being increased. Among the various promising substances to control N. ceranae- infection, ApiHerb® and Api-Bioxal®, commercial dietary supplements were used as treatments against N. ceranae-infection effectively in both laboratory and colony level [39]. The commercial probiotics, Vetafarm Probotic, Protexin Concentrate single-strain (Enterococcus faecium), and Protexin Concentrate multi-strain (Lactobacillus acidophilus, L. plantarum, L. rhamnosus, L. delbrueckii, Bifidobacterium bifidum, Streptococcus salivarius, and E. faecium [40], and Parasaccharibacter apium (PC1 sp.) and Bacillus sp. (PC2 sp.) [41] also were used to reduce spore loads and mortality in N. ceranae infected-honey bees. Currently, the control of N. ceranae-infections involves the use of the natural compounds to stimulate the immunity of honey bee, A. mellifera by inducing resistance against pathogens. Chitosan and peptidoglycans were used to reduce N. ceranae-infection, and increase survivorship of N. ceranae infected-bees. In addition, peptidoglycan and chitosan promoted the gene expression of hymenoptaecin and defensin2 [42]. Another example of natural compounds being effective at reducing N. ceranae loads involves using Brassicaceae defatted seed meals (DSMs) containing antimicrobial and antioxidant properties [43]. Besides fumagillin, sulforaphane was used to control N. ceranae-infection in laboratory. It was reported that 1.25 mg/mL of sulforaphane showed 100% reduction of spore counts, but also caused 100% bee mortality. The antimicrobial properties of this new alternative treatment may be promising, however reducing its toxicity is required before it can be considered as an alternative treatment for controlling N. ceranae [44].
Propolis extract of stingless bees is emerging to be an effective treatment to control N. ceranae across three of the four honey bee species, A. cerana, A. mellifera, and A. florea, [30,45,46,47]. Propolis is collected by bees and contains a number of plant resins, which are considered to be a natural product. In general, the plant resins are known to have antimicrobial effects and are used by bees to aid in sanitizing their hives. These plant resins also have recently been found to have a potential inhibitory effect on microsporidian development [30,45,46,47,48]. However, the propolis has to be fed to the honey bee in order to observe a reduction in the proliferation of N. ceranae in the midgut cells as the bees do not preferentially consume food containing propolis when infected. When fed, propolis extract treatment significantly enhances bee survival [30,45,46,47]. Another natural product, chito-oligosaccharides (COS) promotes antimicrobial activity and has been shown to stimulate the immune system thereby reducing N. apis infection in A. mellifera [48,49,50,51]. COS is a derivative of chitosan which is known as a biopolymer and polysaccharide found in the exoskeleton of insects and crustaceans. This water-soluble glycoprotein molecule has been used as a pre-biotic for gastrointestinal infections and diarrhea. COS is also known to aid in increased amino acid absorption across the gut lining, and also promote gut health including anti-inflammation activity through activation of 5’ AMP-activated protein kinase (AMPK) [52,53,54,55]. We, therefore, hypothesize that this treatment can aid in treating the symptoms of a N. ceranae infection and consequently improve the health of the honey bee.
Whether the pathological effects from a N. ceranae infection is of the same magnitude across the honey bee species and can be generalized to the giant honey bee, A. dorsata, remains unknown. A. dorsata serves as a main pollinator for crop plants in Thailand and provides a substantial amount of honey for a number of Asian countries [6]. Thus, the first aim of this study is to investigate the pathological effects of a N. ceranae infection in A. dorsata. Secondly, we aim to determine the efficacy of propolis extract and COS, as alternative treatment options for N. ceranae infections, by measuring hemolymph trehalose levels, protein contents in the hypopharyngeal gland, survival rates and acini diameters of the hypopharyngeal glands as health status indicators.

2. Results

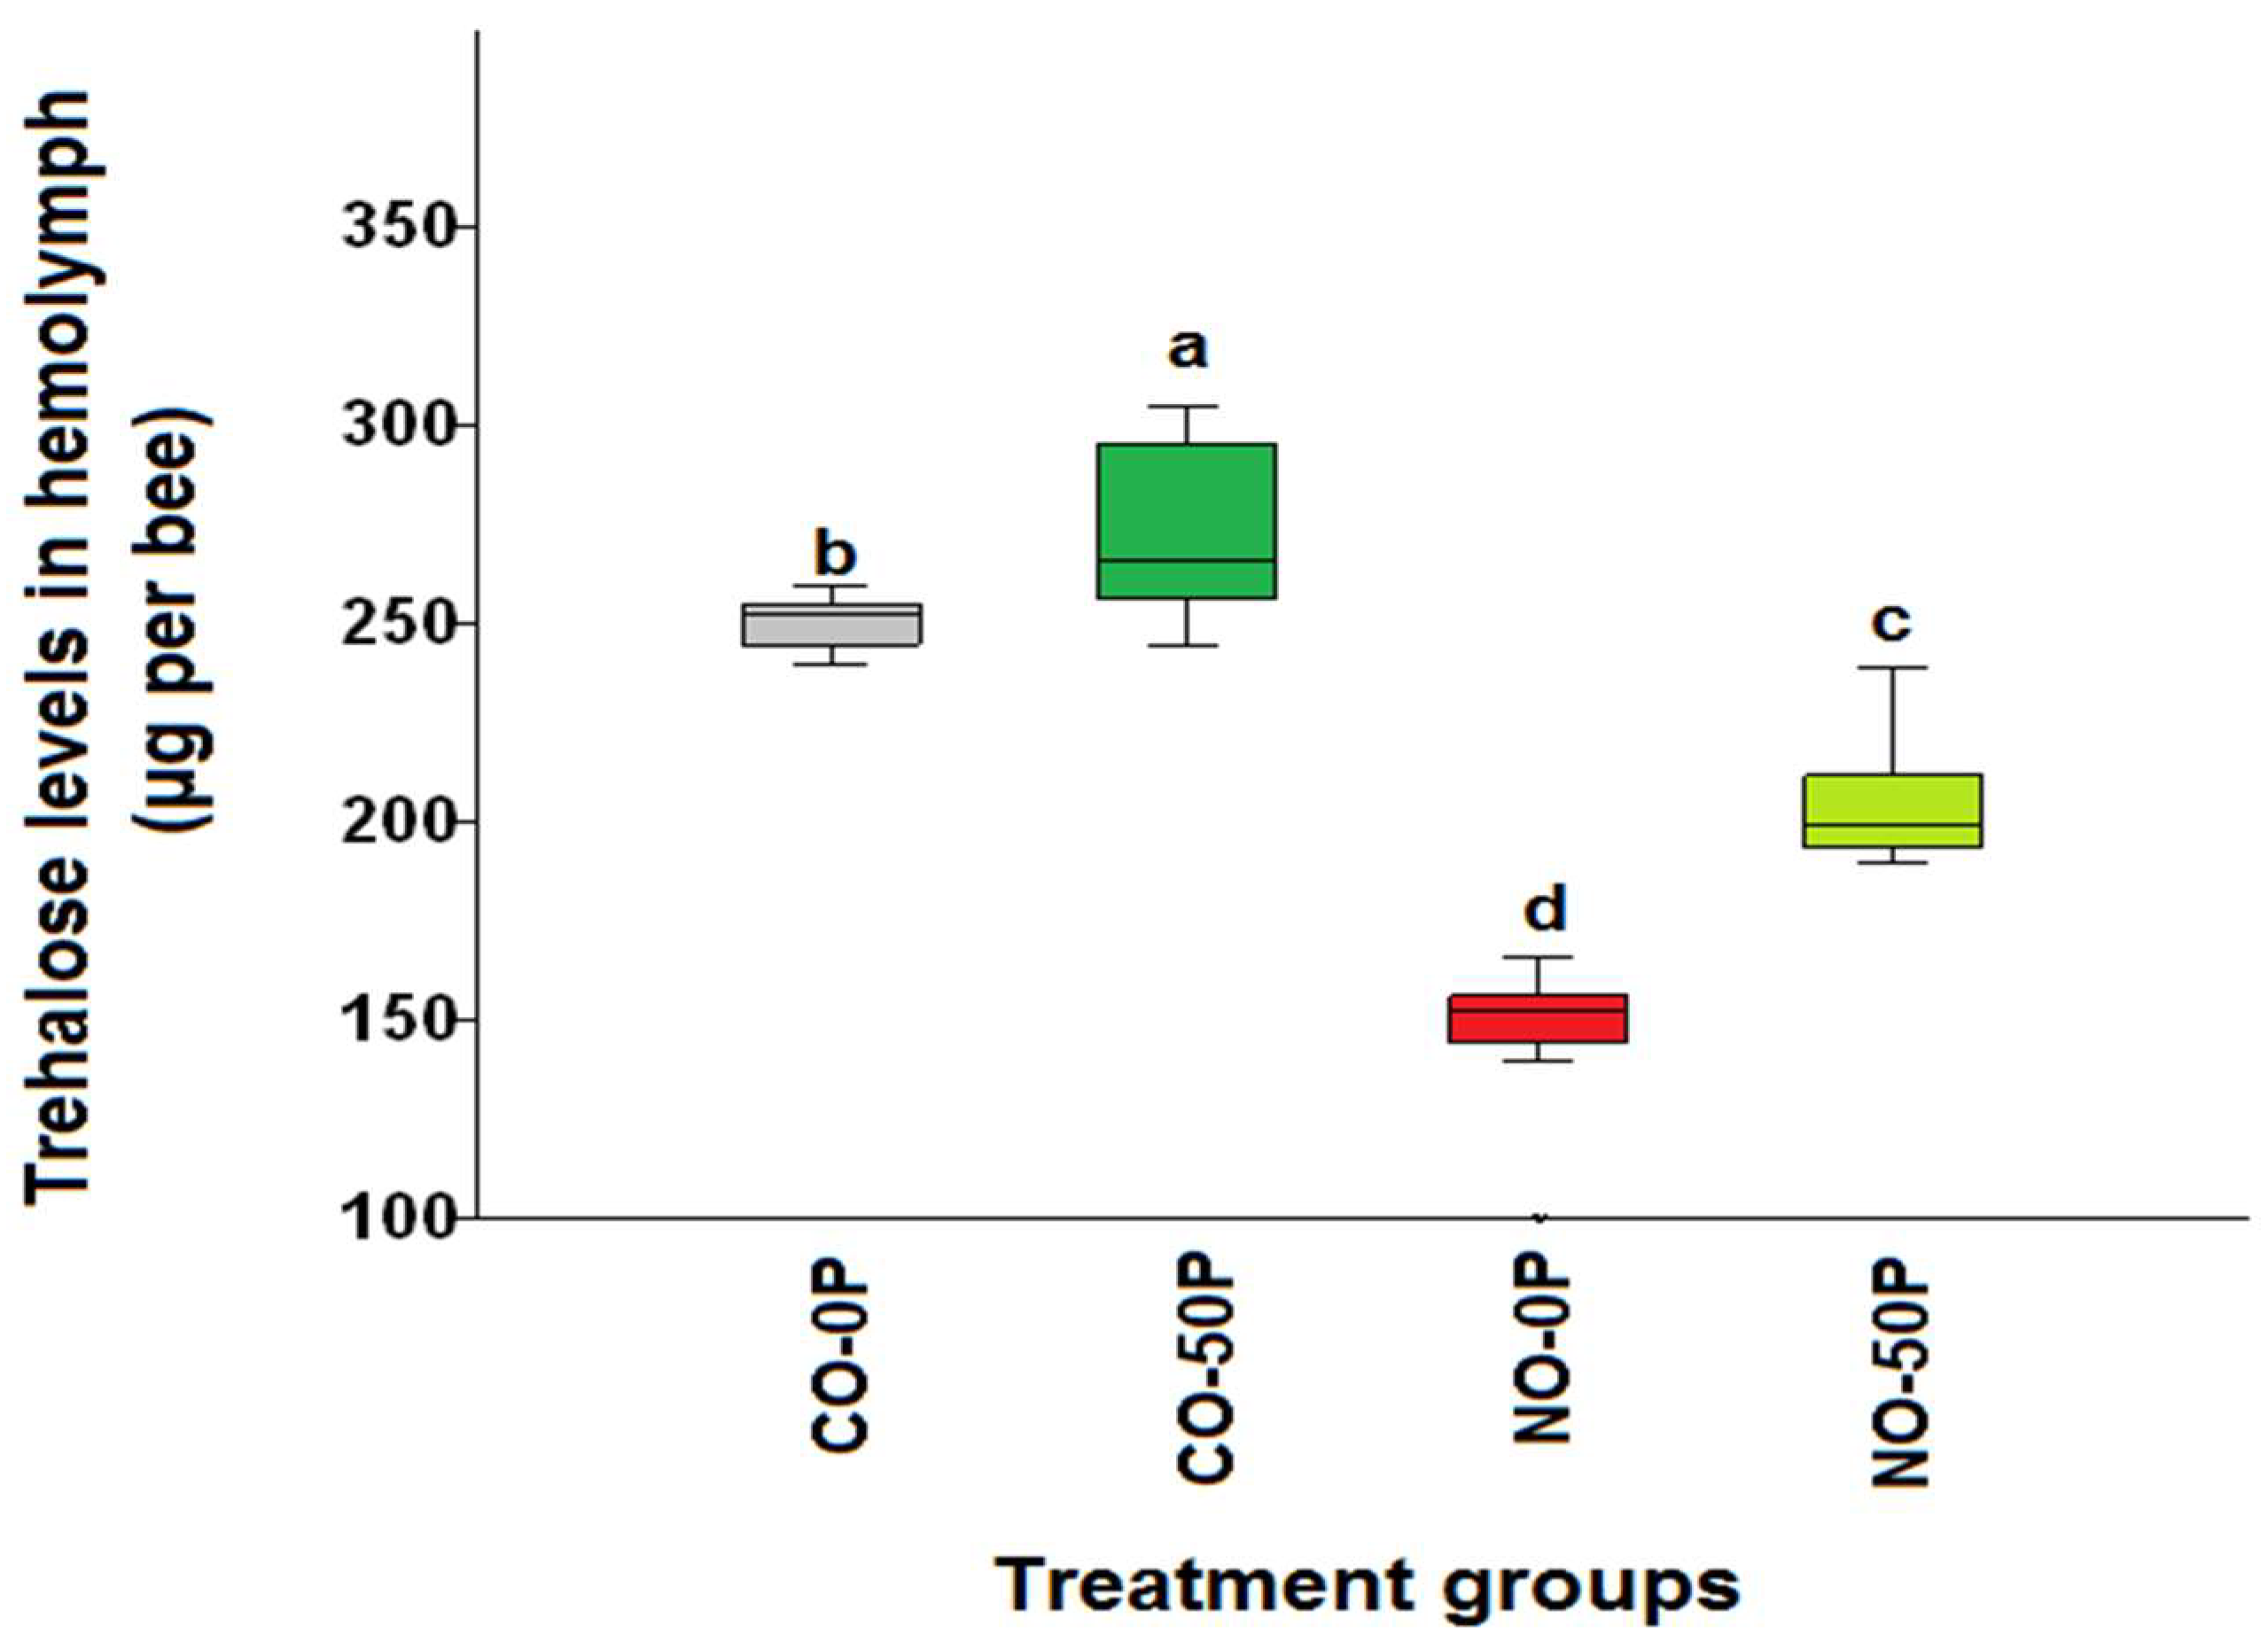
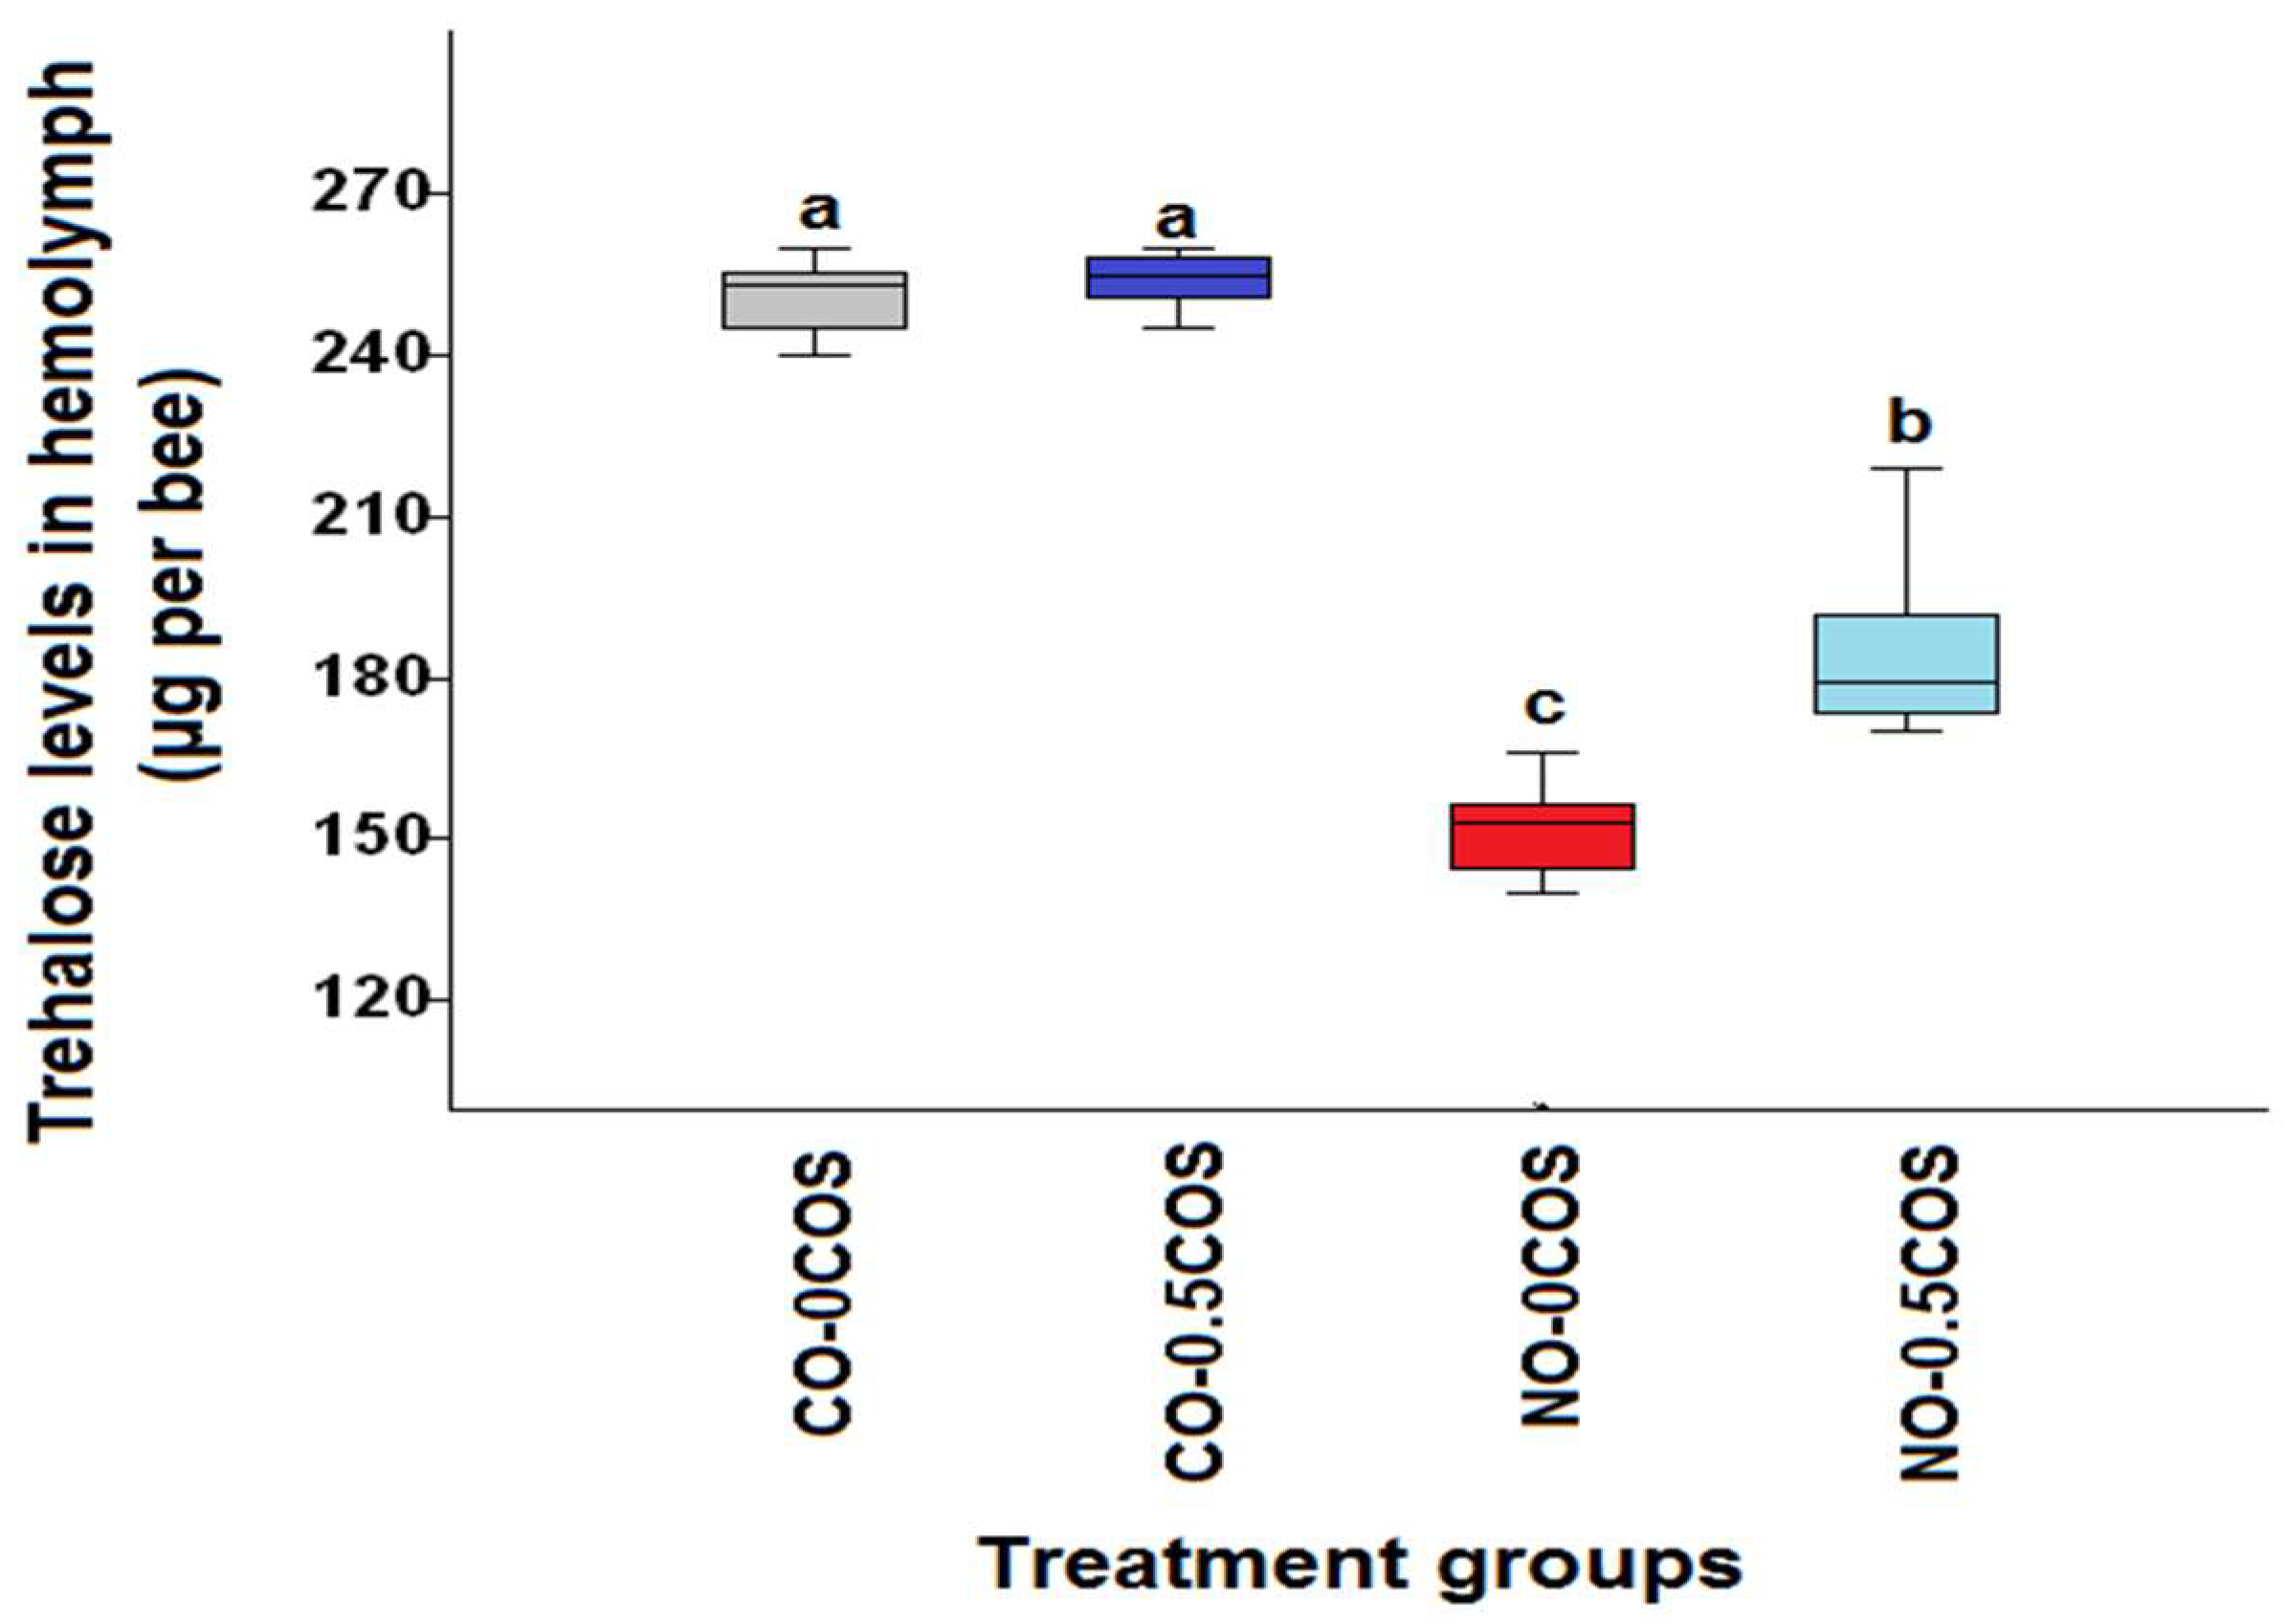
2.1. Hemolymph Trehalose Levels

N. ceranae-infected bees without any treatment had the lowest hemolymph trehalose levels on day 14 p.i. compared to all other treatment groups (χ2 = 34.52, df = 3, p < 0.0001, Figure 1). The highest levels of hemolymph trehalose were found in uninfected bees treated with propolis extract, CO-50P (273.2 ± 6.69 μg/bee) followed by the control group, CO-0P (250.8 ± 2.26 μg/bee). However, N. ceranae-infected bees treated with 50% propolis extract (NO-50P) showed higher levels of trehalose (204.2 ± 5.13 μg/bee) than that of N. ceranae-infected bees without propolis extract treatment, NO-0P (148.0 ± 5.79 μg/bee). Interestingly, similar trend was found in bees treated with COS where the highest hemolymph trehalose levels were found in the control group with 0.5 COS (CO-0.5COS) and without COS(CO-0COS) treatment 250.8 ± 2.26 μg/bee and 254.2 ± 1.73 µg/bee, respectively. The lowest hemolymph trehalose levels were found in the Nosema infected bees without treatment (NO-0COS) 148.0 ± 5.79 µg/bee, while there was a significant increase in the infected bees that received a COS treatment (NO-0.5COS) 184.2 ± 5.14 μg/bee (χ2 = 33.21, df = 3, p < 0.0001, Figure 2).

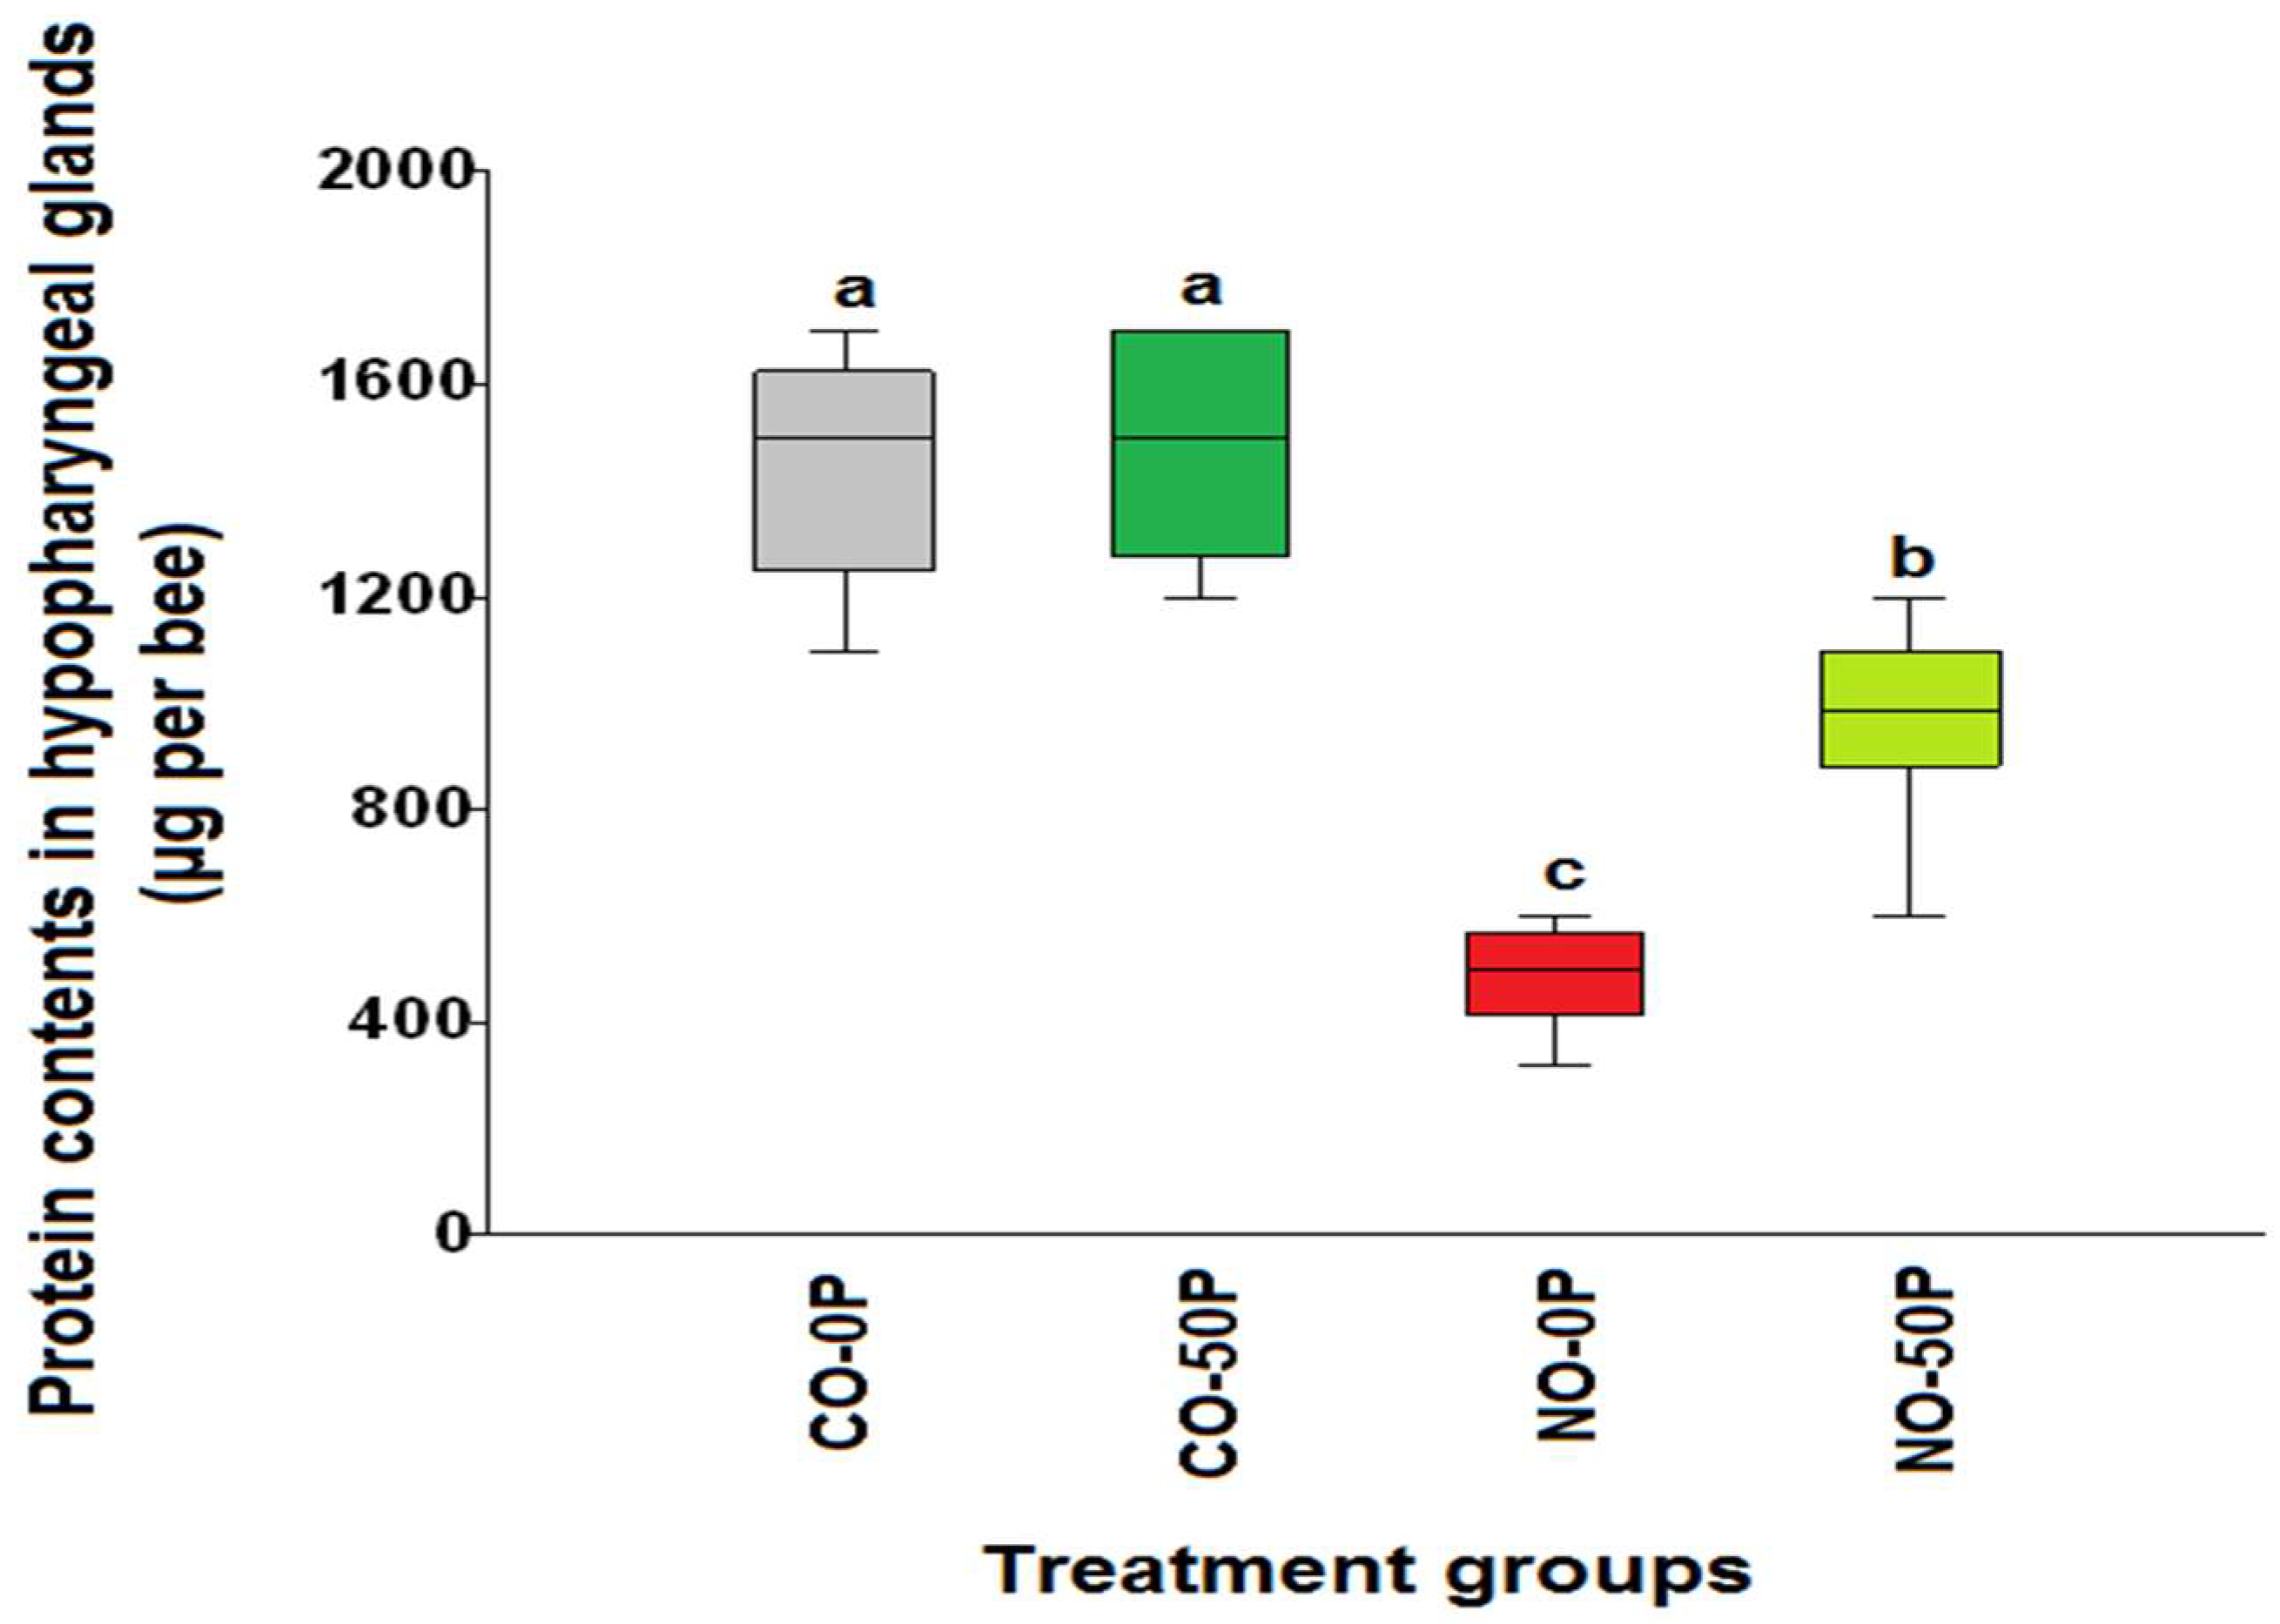
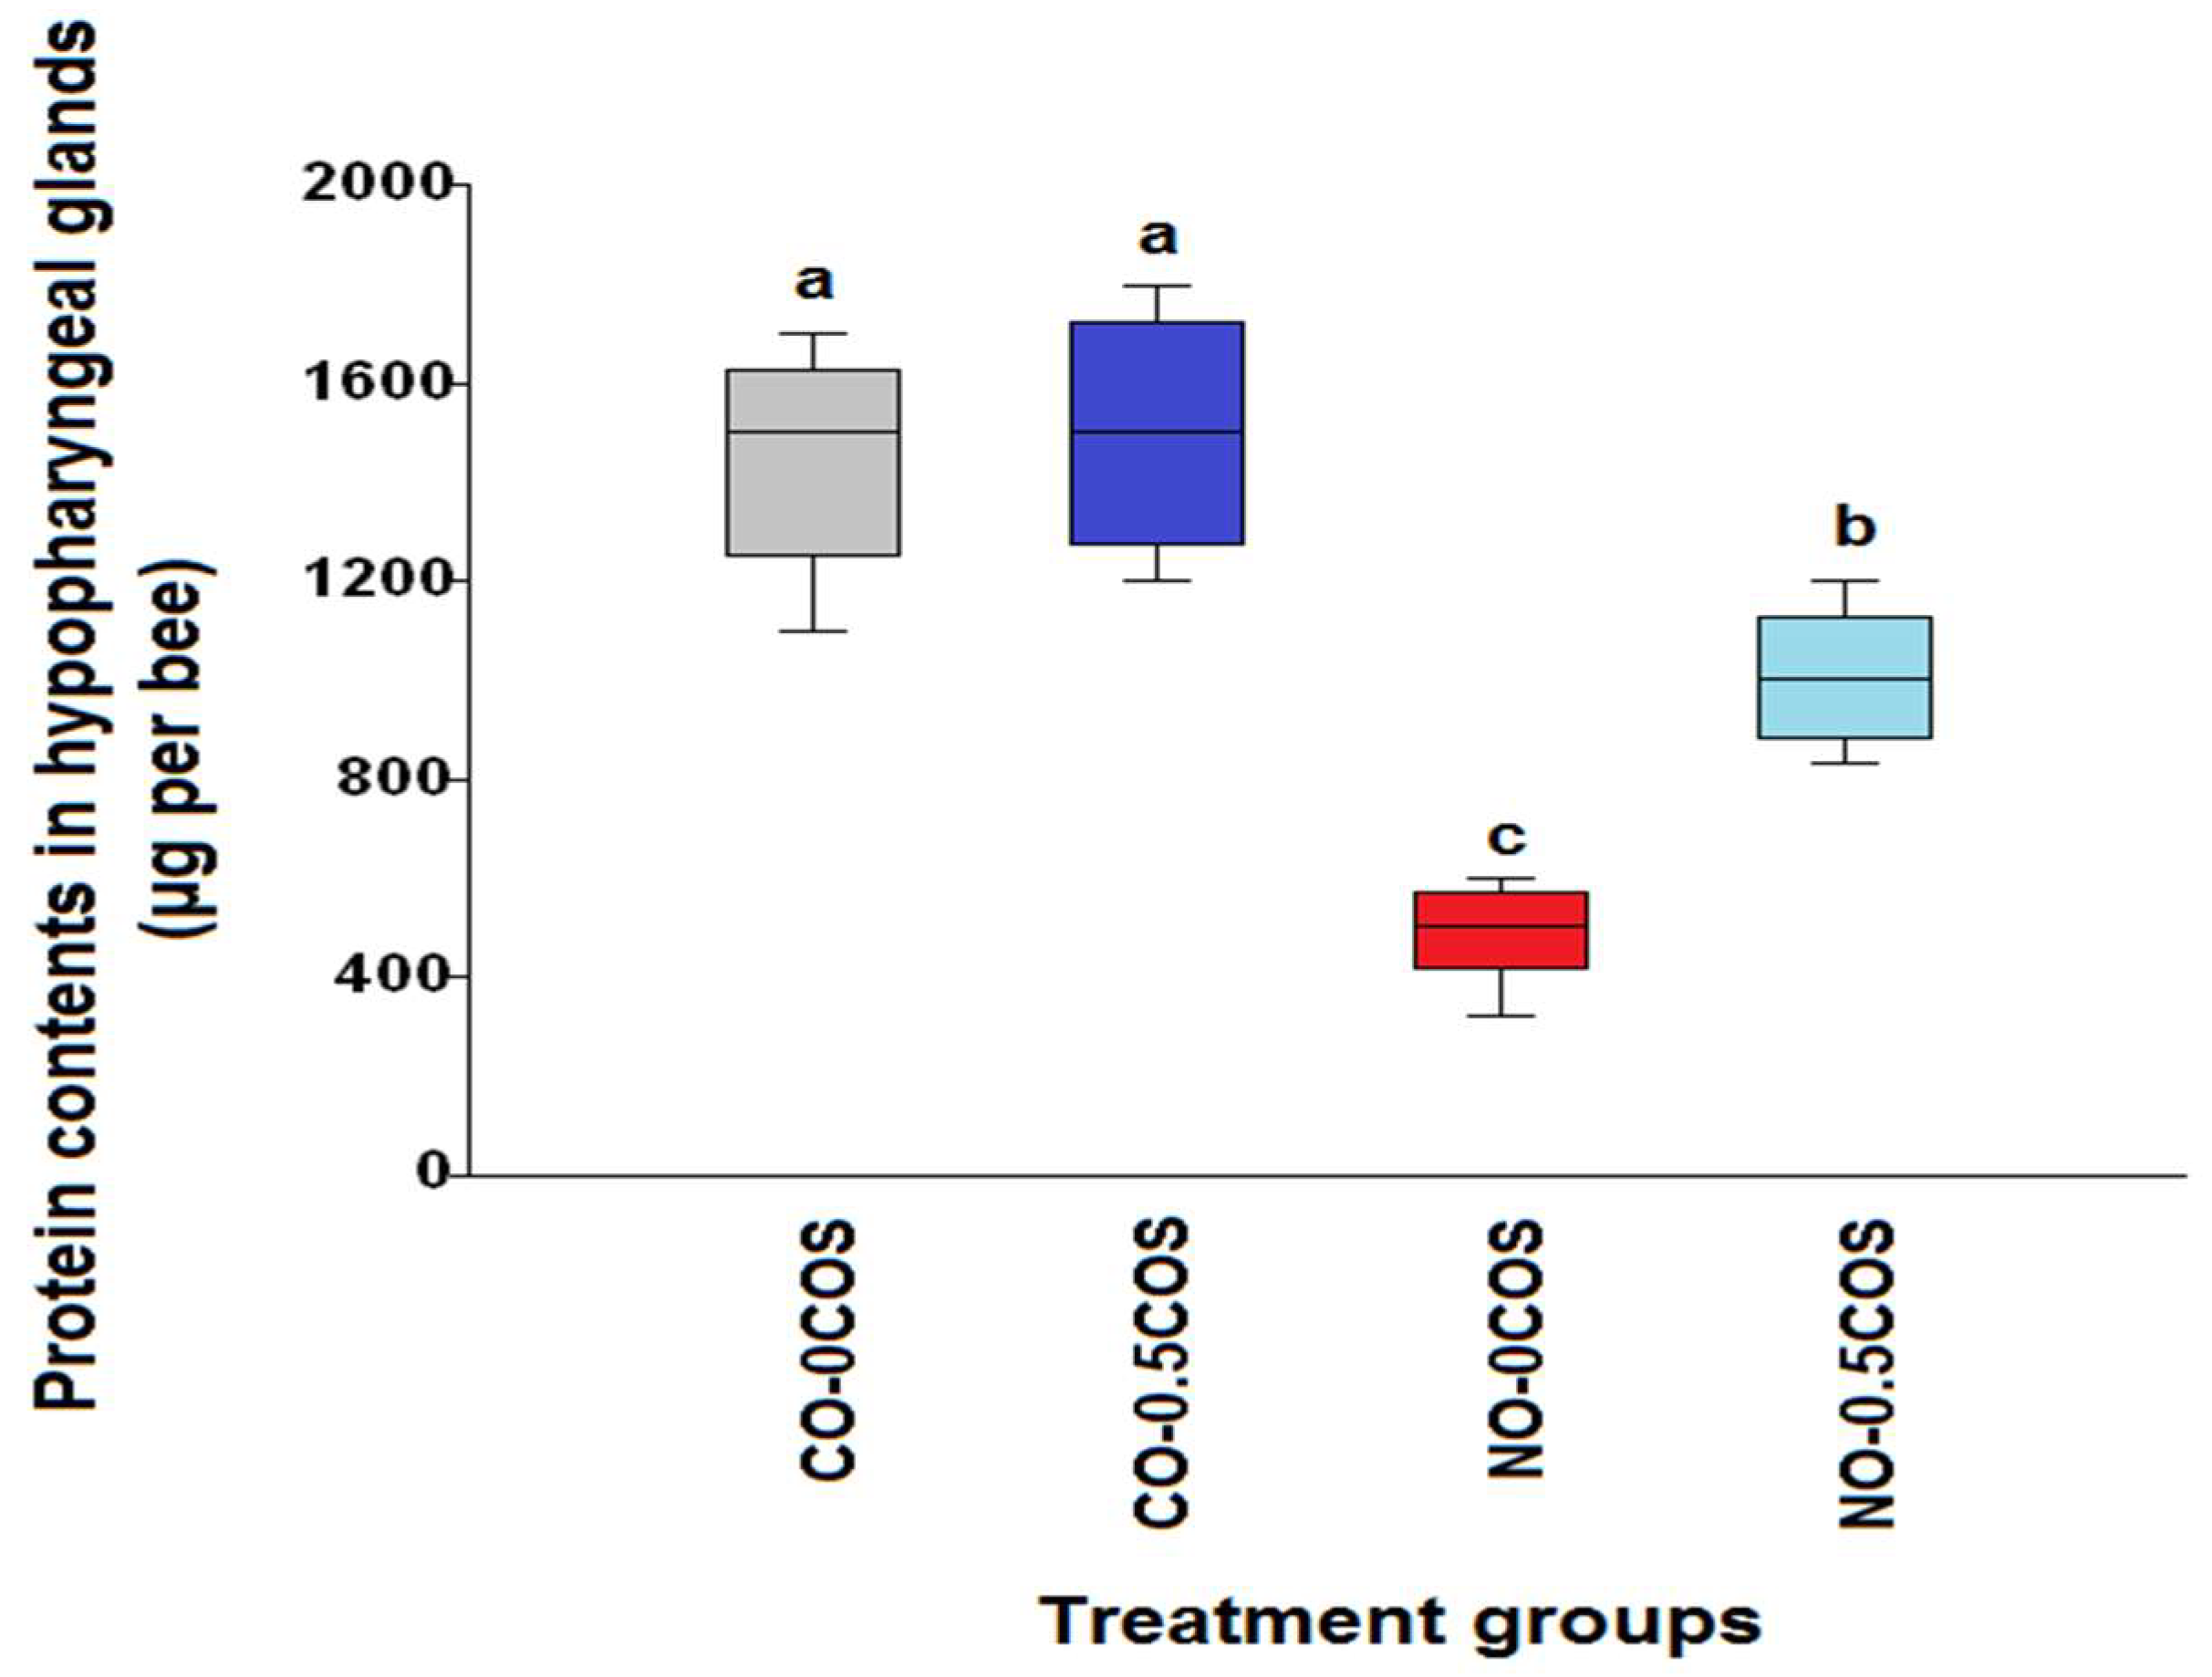
2.2. Hypopharyngeal Gland Protein Content

The hypopharyngeal gland protein contents of control bees treated with propolis extract (CO-50P) and not treated with 50% propolis extract (CO-0P) were significantly higher than the infected bees (χ2 = 31.75, df = 3, p < 0.0001, Figure 3), they were 1470.0 ± 65.06 μg/bee and 1326.23 ± 103.4 μg/bee, respectively. The N. ceranae-infected bees treated with propolis extract (NO-50P) had significantly higher protein levels, 963.0 ± 52.77 μg/bee, in comparison to the infected bees not treated with propolis extract (NO-0P), which had 486.0 ± 32.5 μg/bee of protein, respectively (χ2 = 31.75, df = 1, p = 0.0002). The similar trend was found in both groups of bees treated with 0.5COS (χ2 = 31.39, df= 3, p < 0.0001, Figure 4). The highest protein content was found in the control bees treated with COS (CO-0.5COS) (1500.0 ± 76.01 µg/bee), and it was not significantly different from that of control bees not treated with COS (CO-0COS) (χ2 = 31.39, df= 1, p = 0.5657). However, infected bees treated with 0.5 ppm COS had significantly increased protein content of the hypopharyngeal glands (1006.0 ± 44.4 µg/bee), in comparison with N. ceranae-infected bees that were not treated with COS (486.0 ± 32.5 µg/bee).

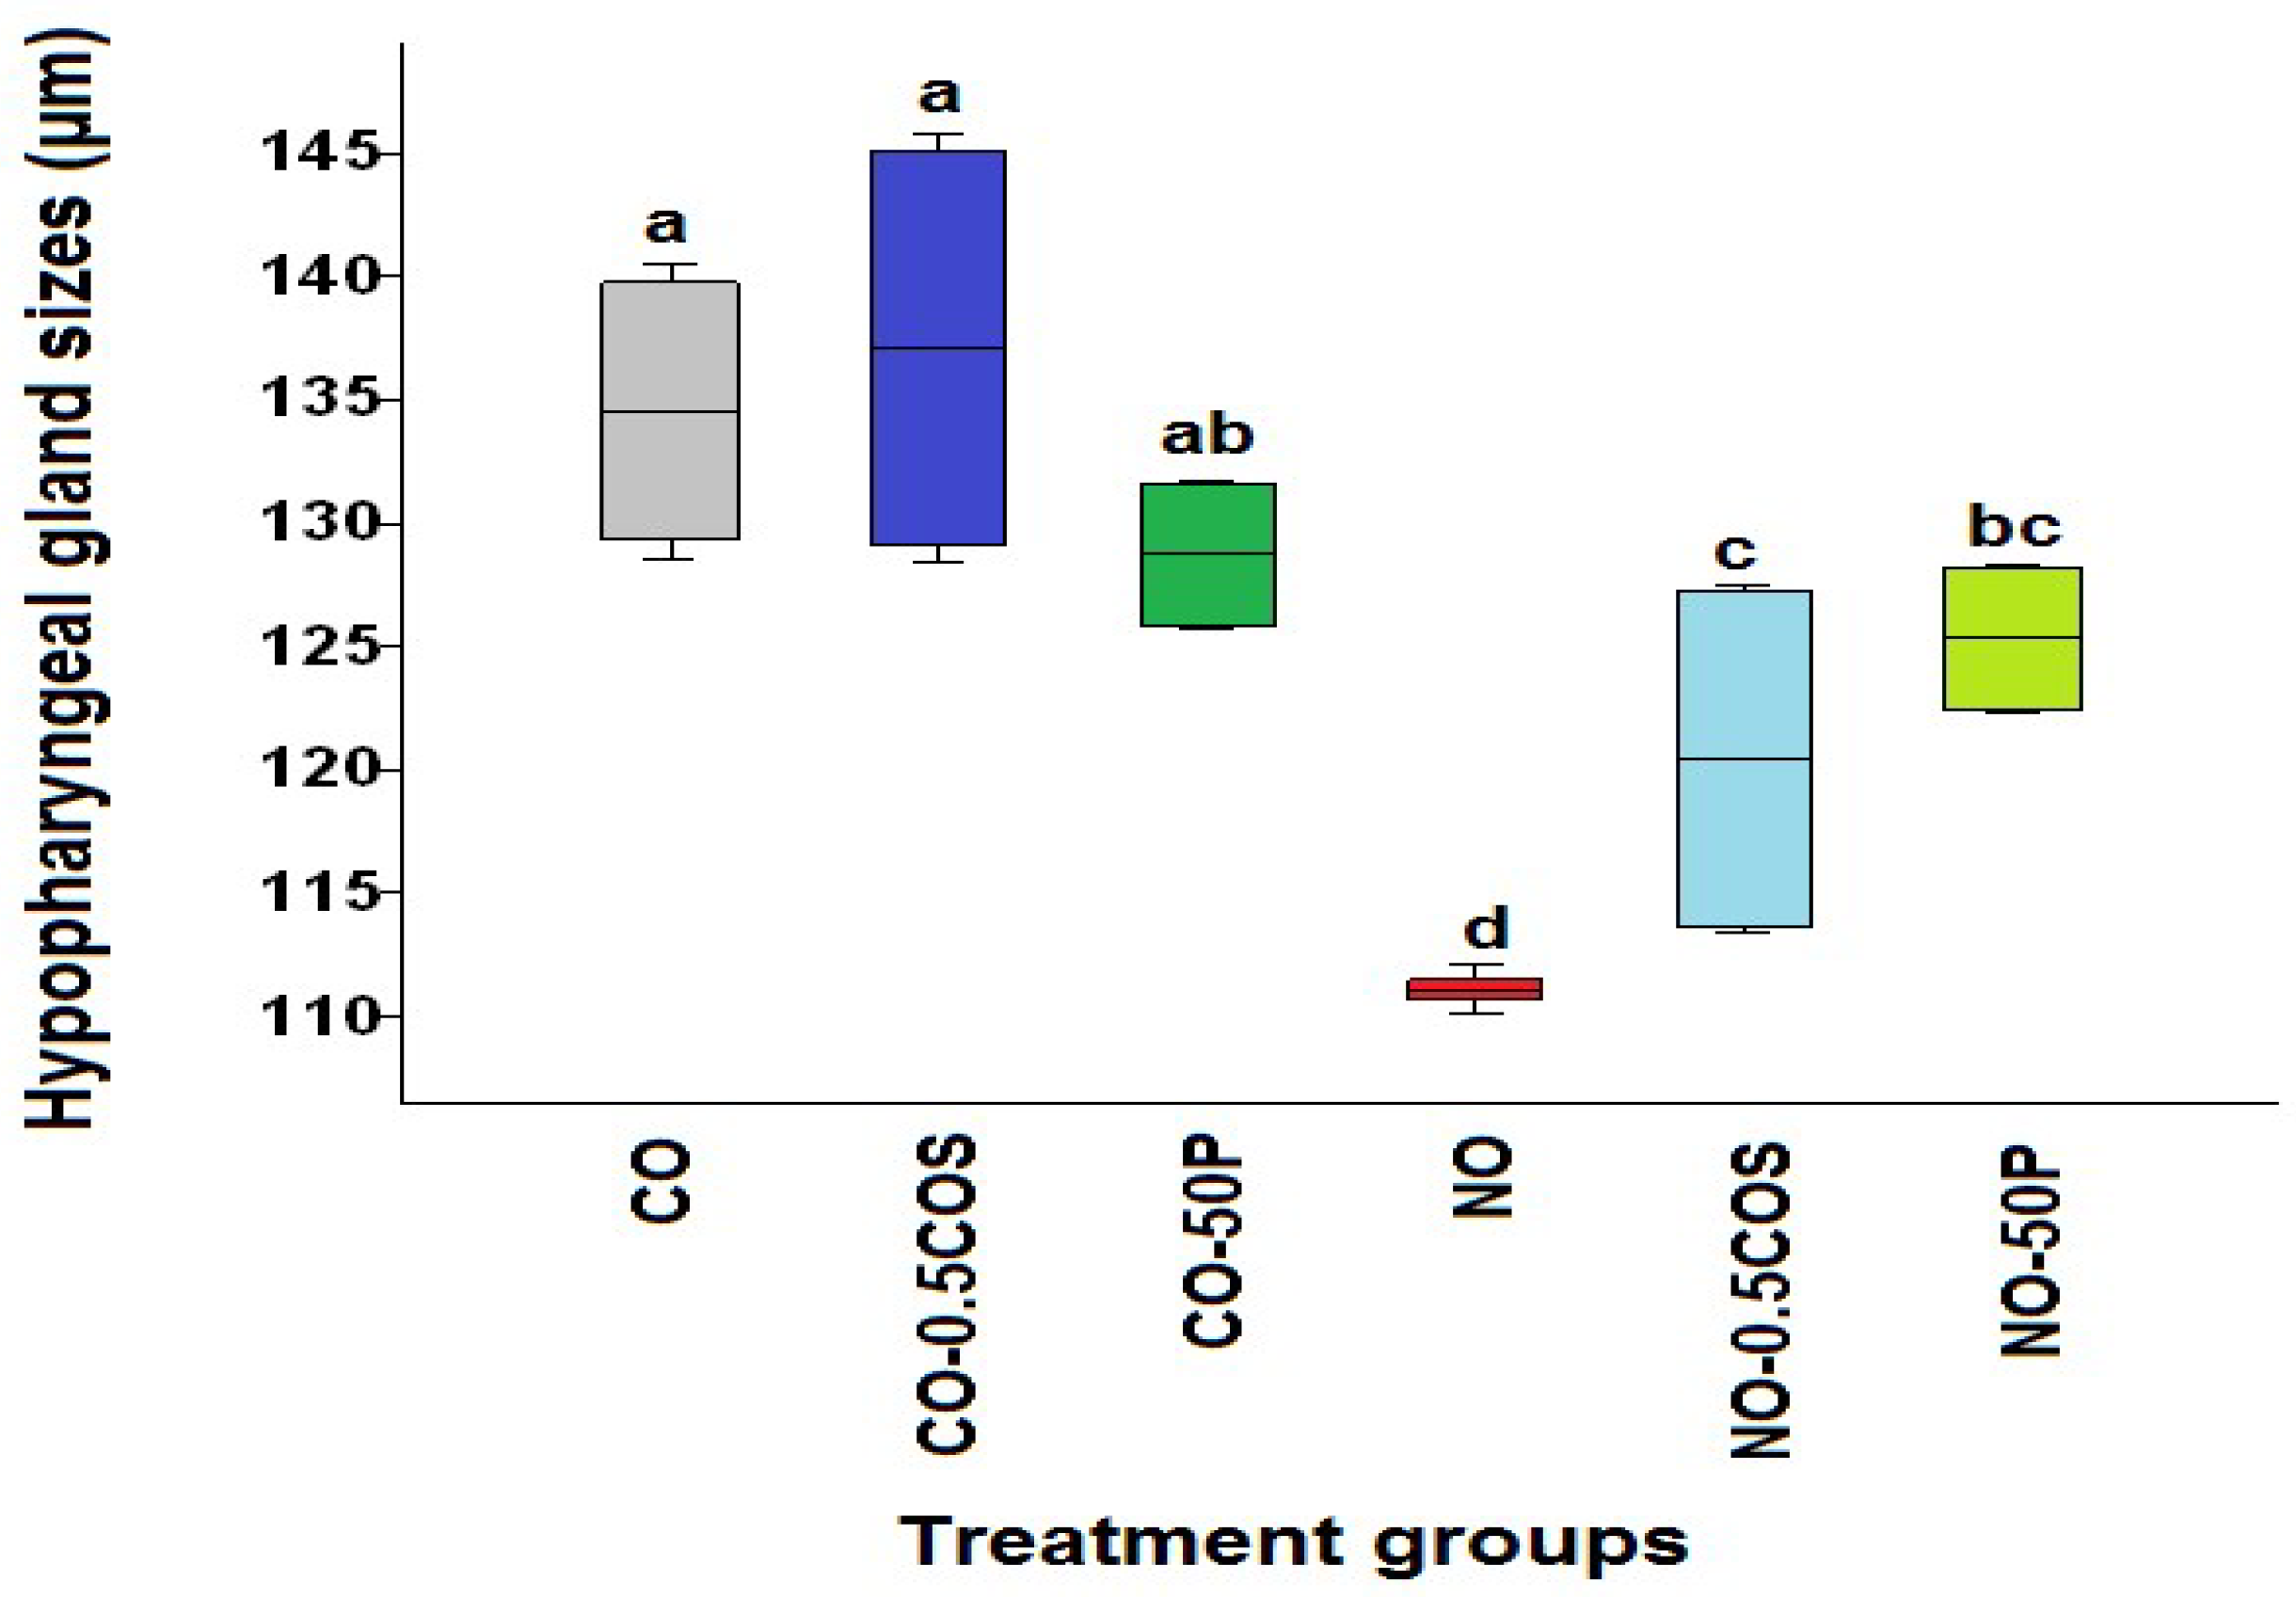
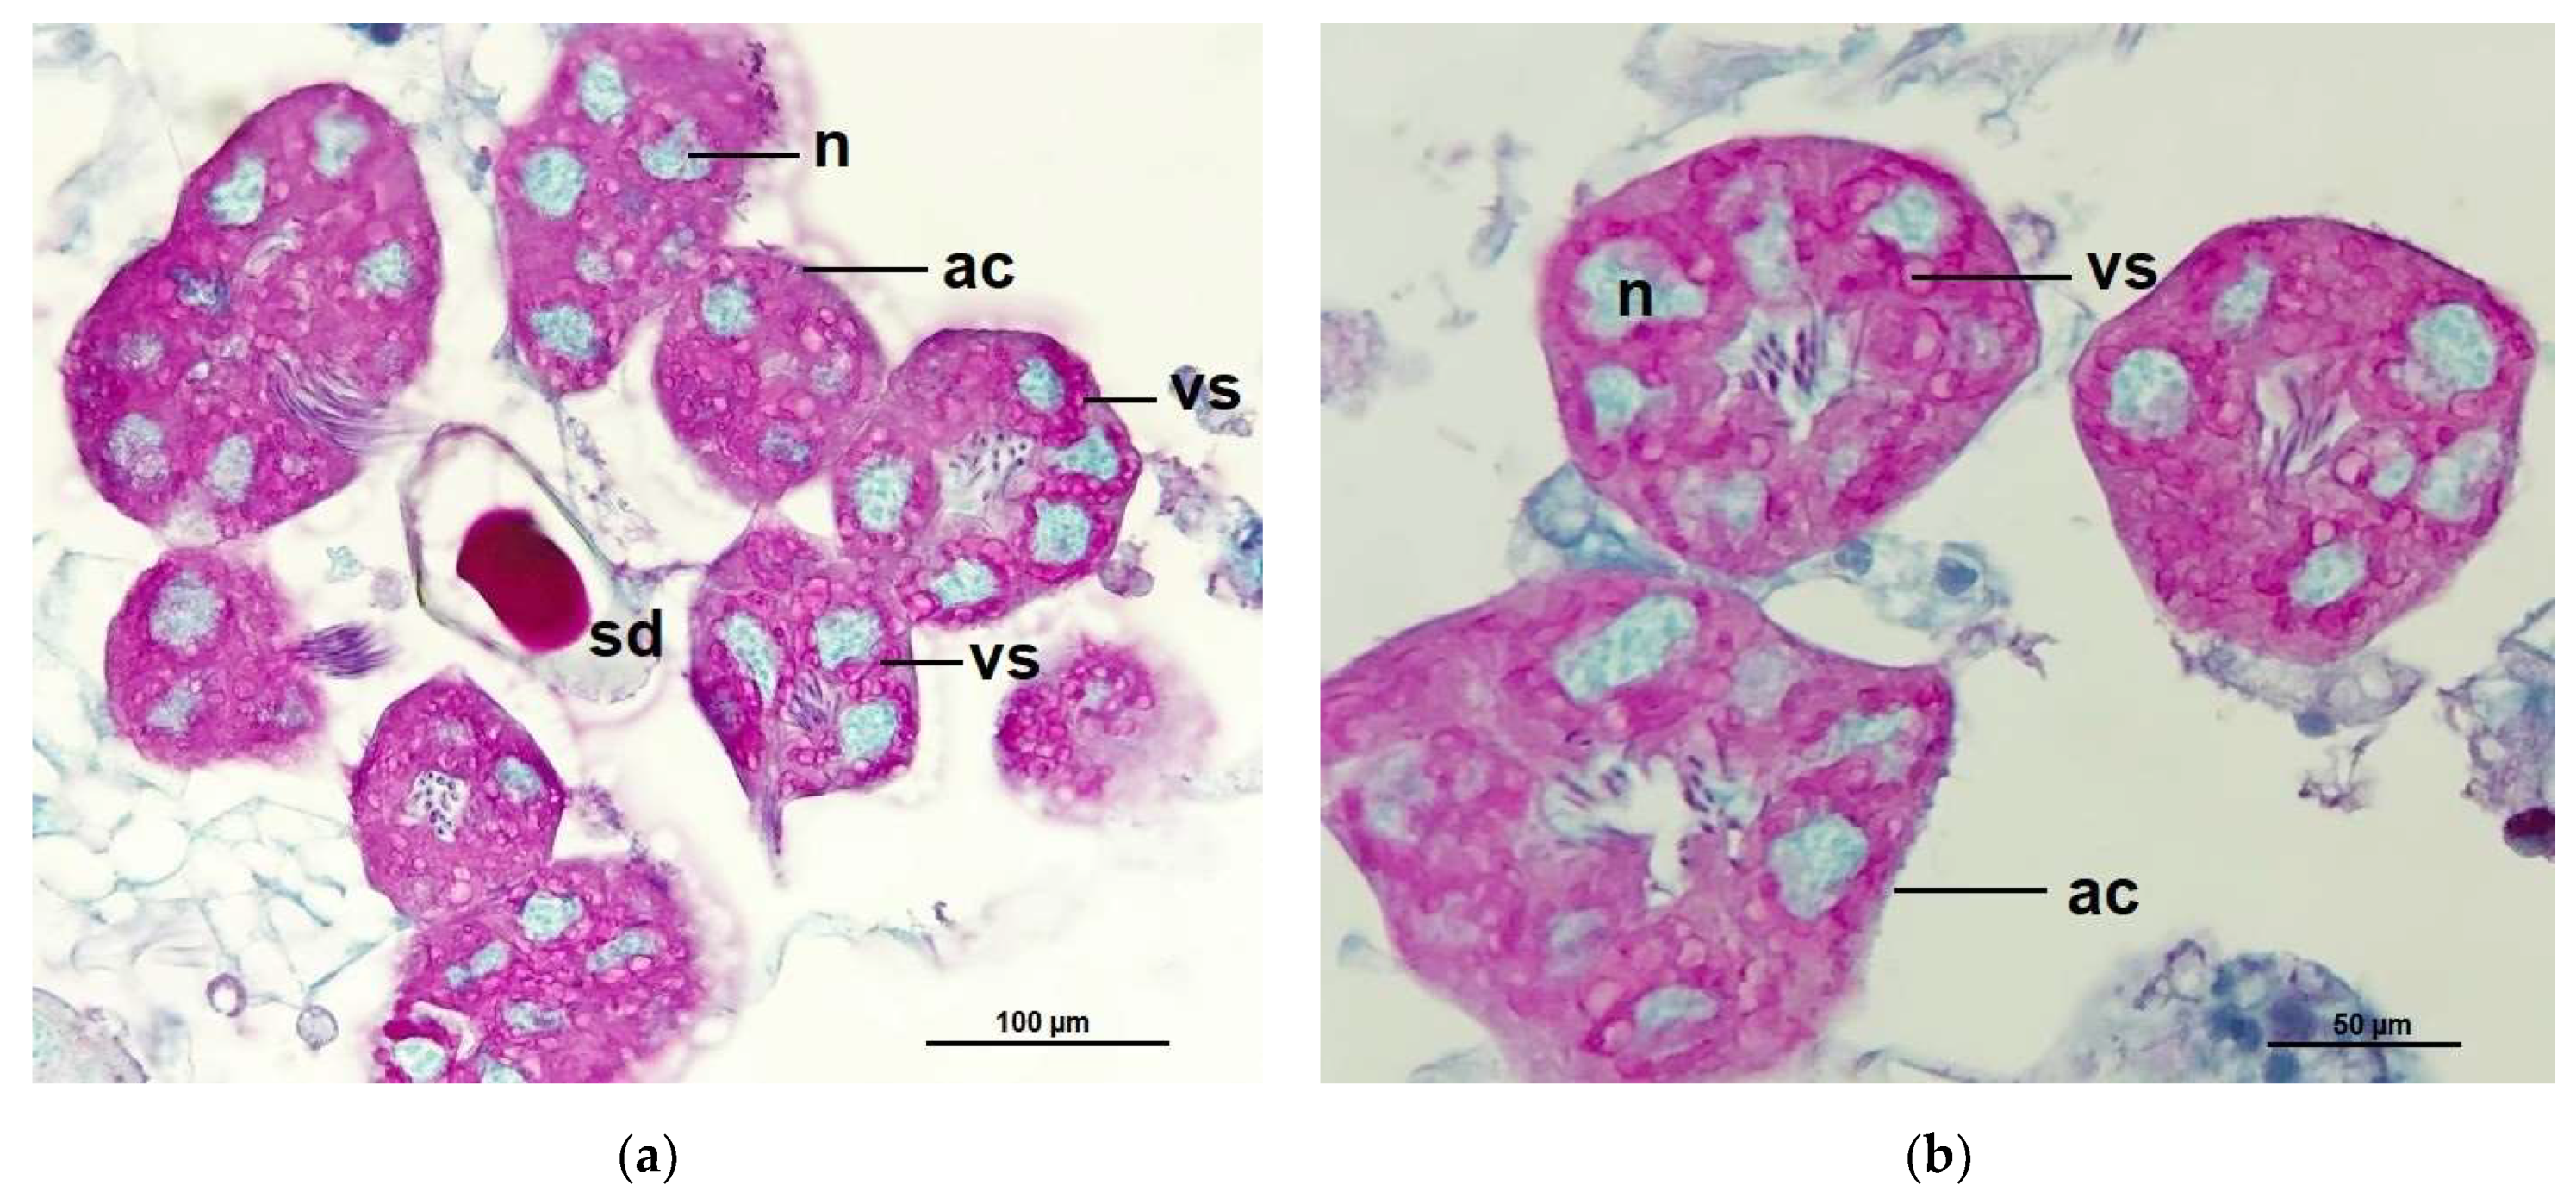
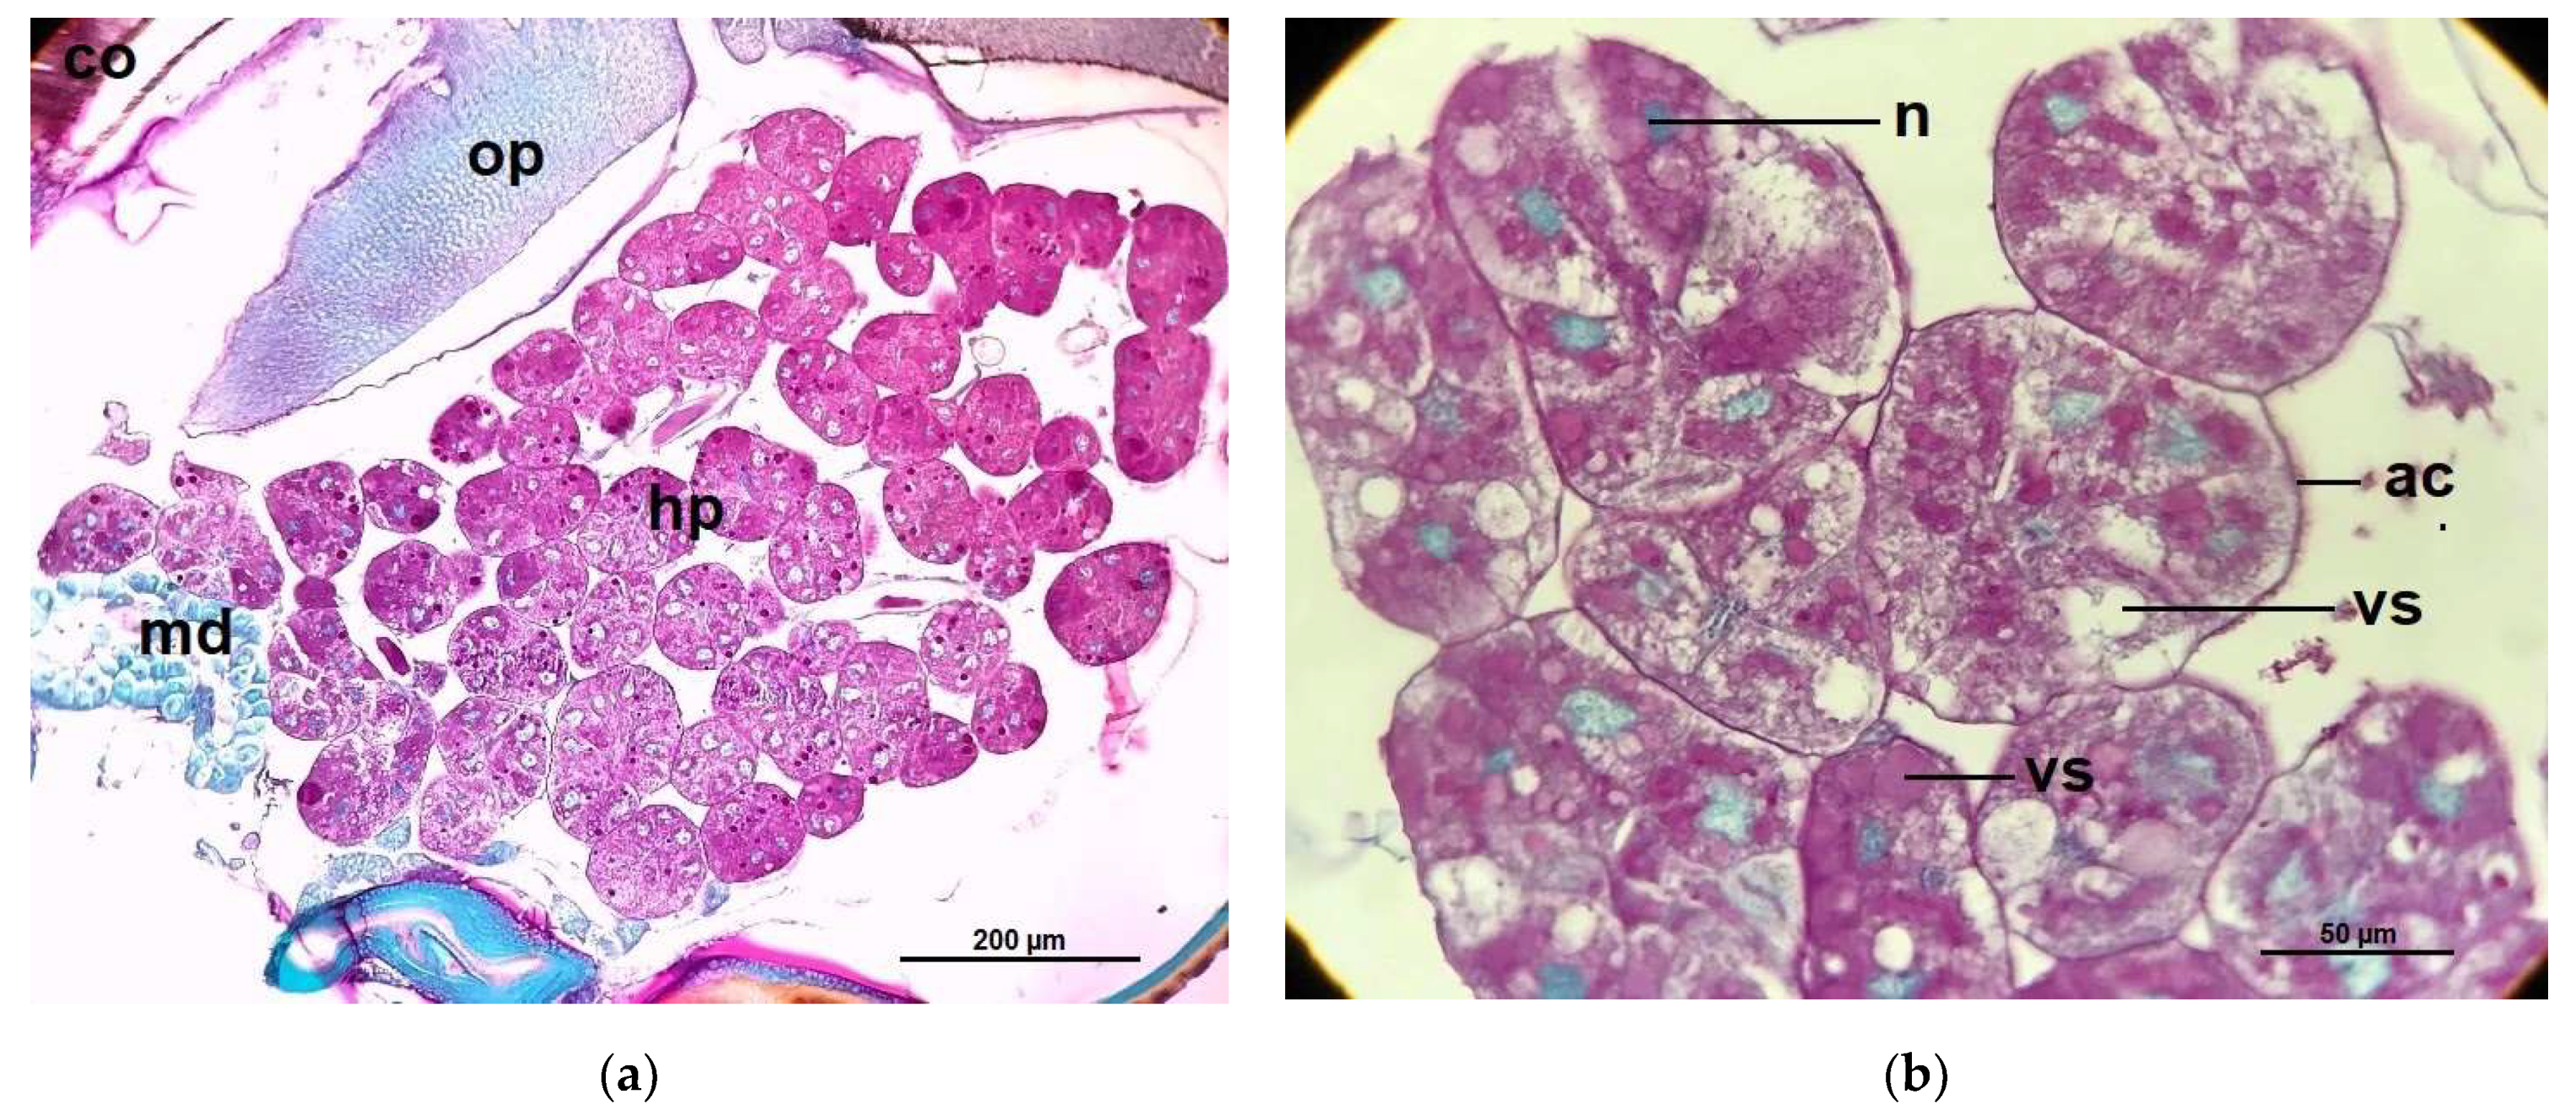
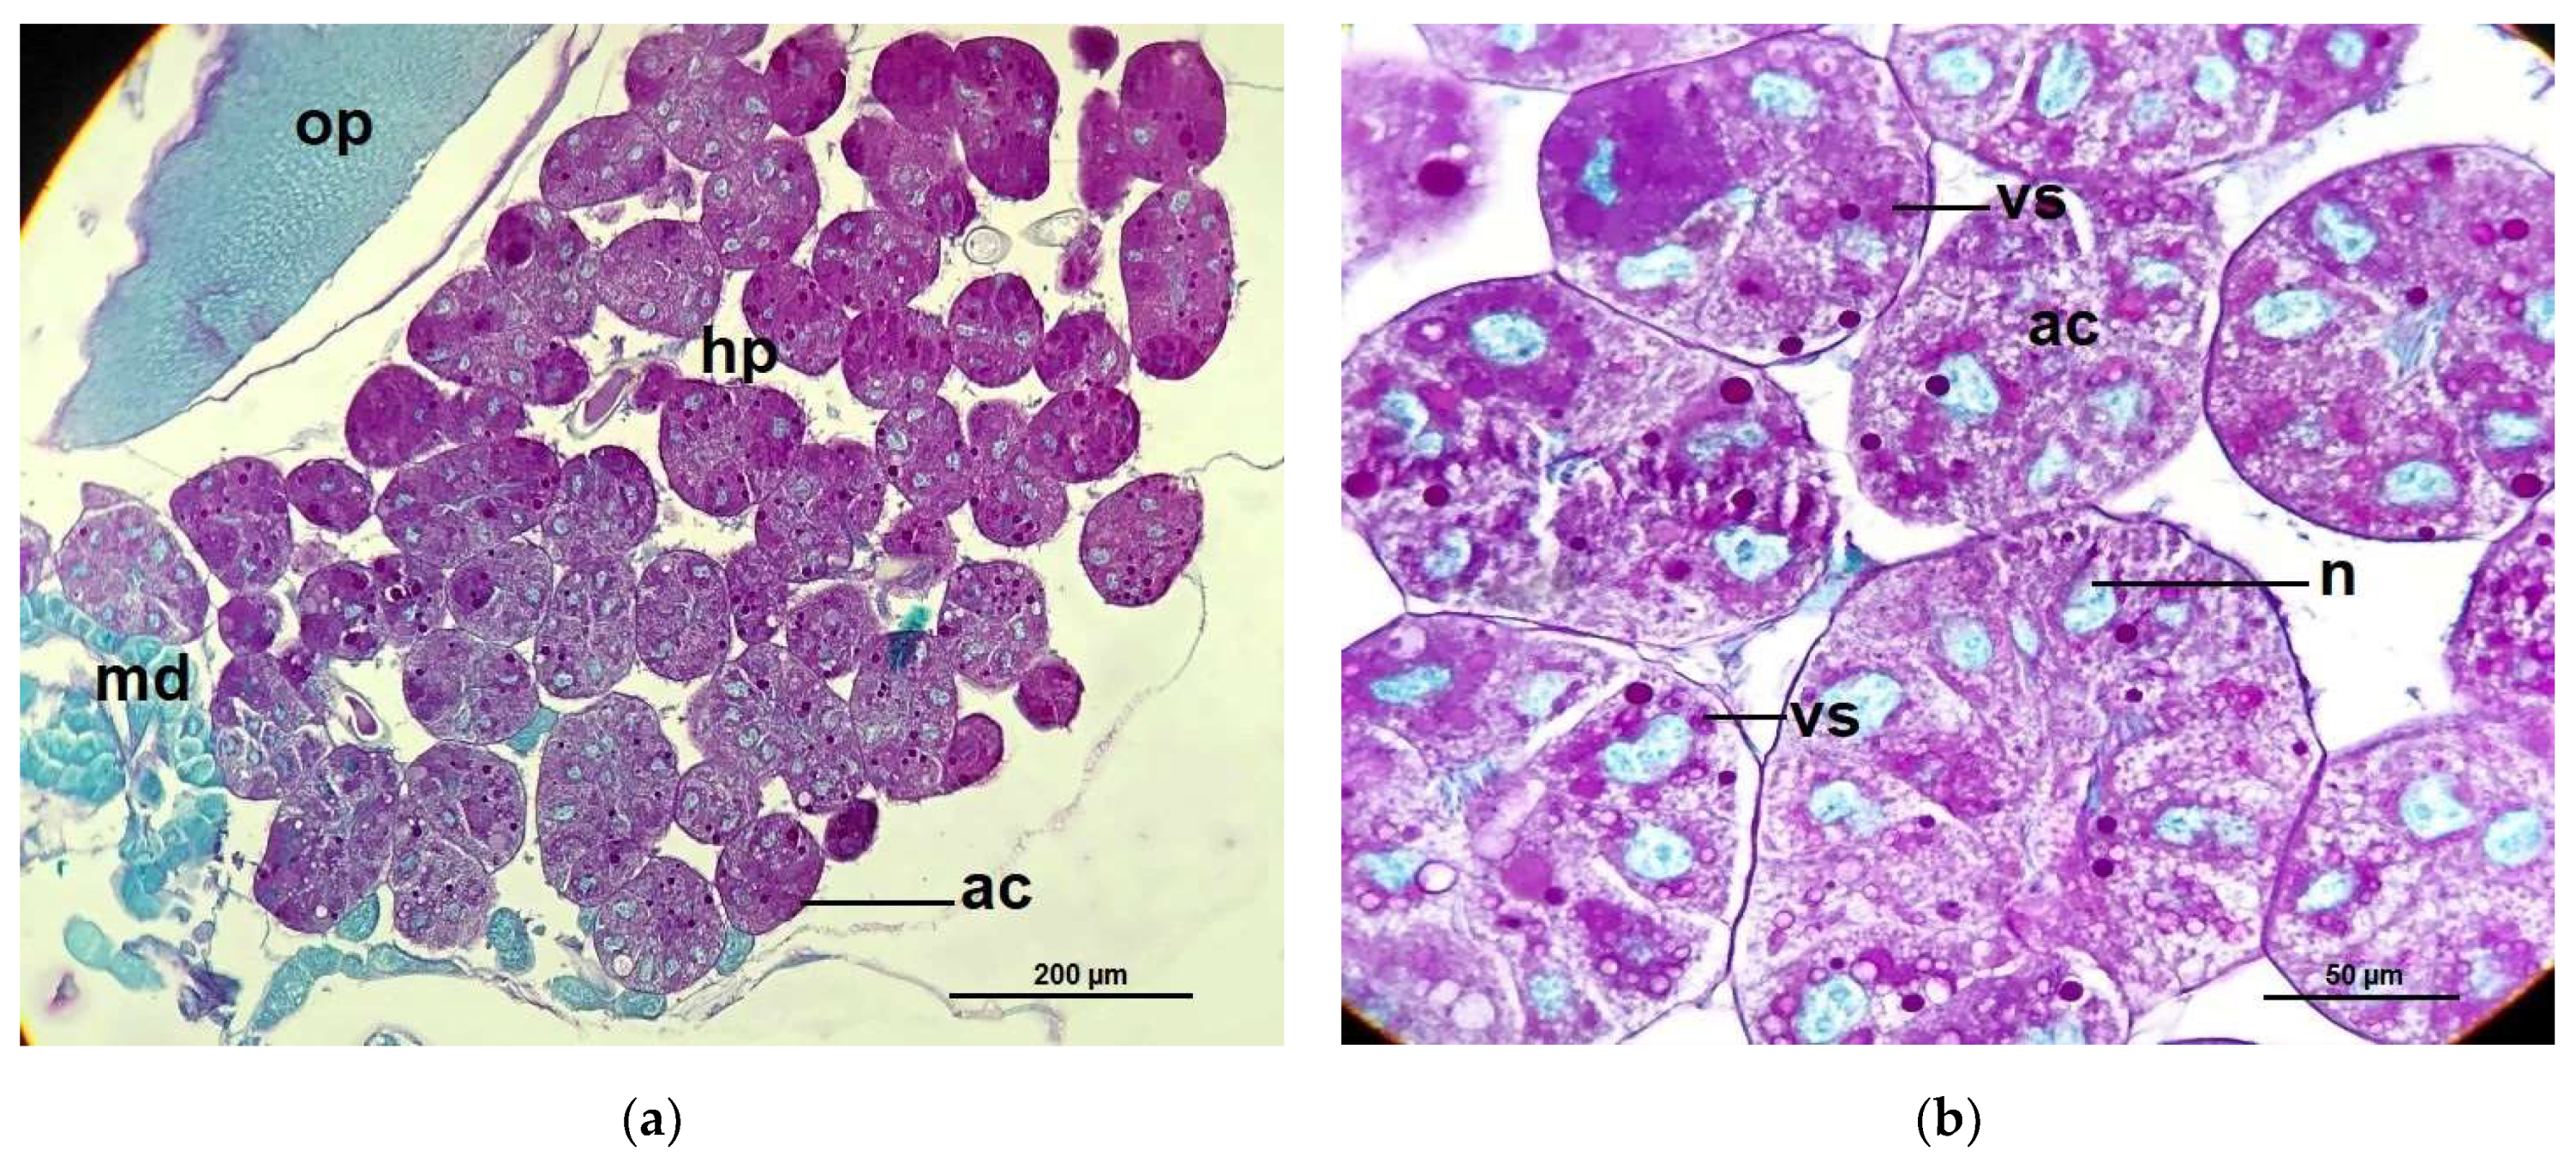
2.3. Acini Diameters of Hypopharyngeal Glands

The smallest acini diameter on average was found in the Nosema-infected workers (NO) without any treatment, with a distance of 111.05 ± 0.4 µm. The mean diameters of acini of the hypopharyngeal glands were largest in the untreated control bees (CO) (134.55 ± 5.22 µm) and the COS treated control bees (CO-0.5COS) (137.13 ± 8.73 µm), followed by the control bees treated with propolis extract (CO-50P) (128.75 ± 2.9 µm), the infected bees treated with the propolis extract (NO-50P) (125.34 ± 2.9 µm), and the infected bees treated with COS (NO-0.5COS) (120.44 ± 6.8 µm). When we compare between Nosema-infected bees and the ones treated with propolis extract and COS, we see a significant increase in the acini diameter on average (χ2 = 33.09, df = 5, p < 0.0001, Figure 5). However, the COS treated bees have significantly lower acini distances than the control bees (χ2 = 33.09, df = 1, p = 0.0022), but the propolis extract treated bees do not have a significant difference in acini distance in comparison to the control bees treated with propolis (χ2 = 33.09, df = 1, p = 0.0553).
The histological structure of the hypopharyngeal glands of CO bees showed fully developed and contained with several secretory units or acini (oval to rounded shape), each unit composed of 5–8 secretory cells surrounded a central secretory duct. The secretory cells contained with numerous secretory granules stained red-pink with PAS that surround the large cell nuclei, stained greenish with light green (Figure 6), while the secretory units of the hypopharyngeal glands of Nosema-infected bees (NO) were incomplete developed in structure indicated by different irregular in shaped and sizes. Therefore, each cell cytoplasm consisted of numerous small secretory vesicles stained pink with PAS (Figure 7). Interestingly, the glands of NO-50P and NO-0.5COS showed fully developed acini. The secretory cell contains several vesicles giving both positive and negative staining with PAS, this indicated the cell storage both carbohydrate and non-carbohydrate molecules. In addition, the large extracellular space between adjacent acinar cells were found indicated by white gap between adjacent cells separating them from each other (Figure 8 and Figure 9).

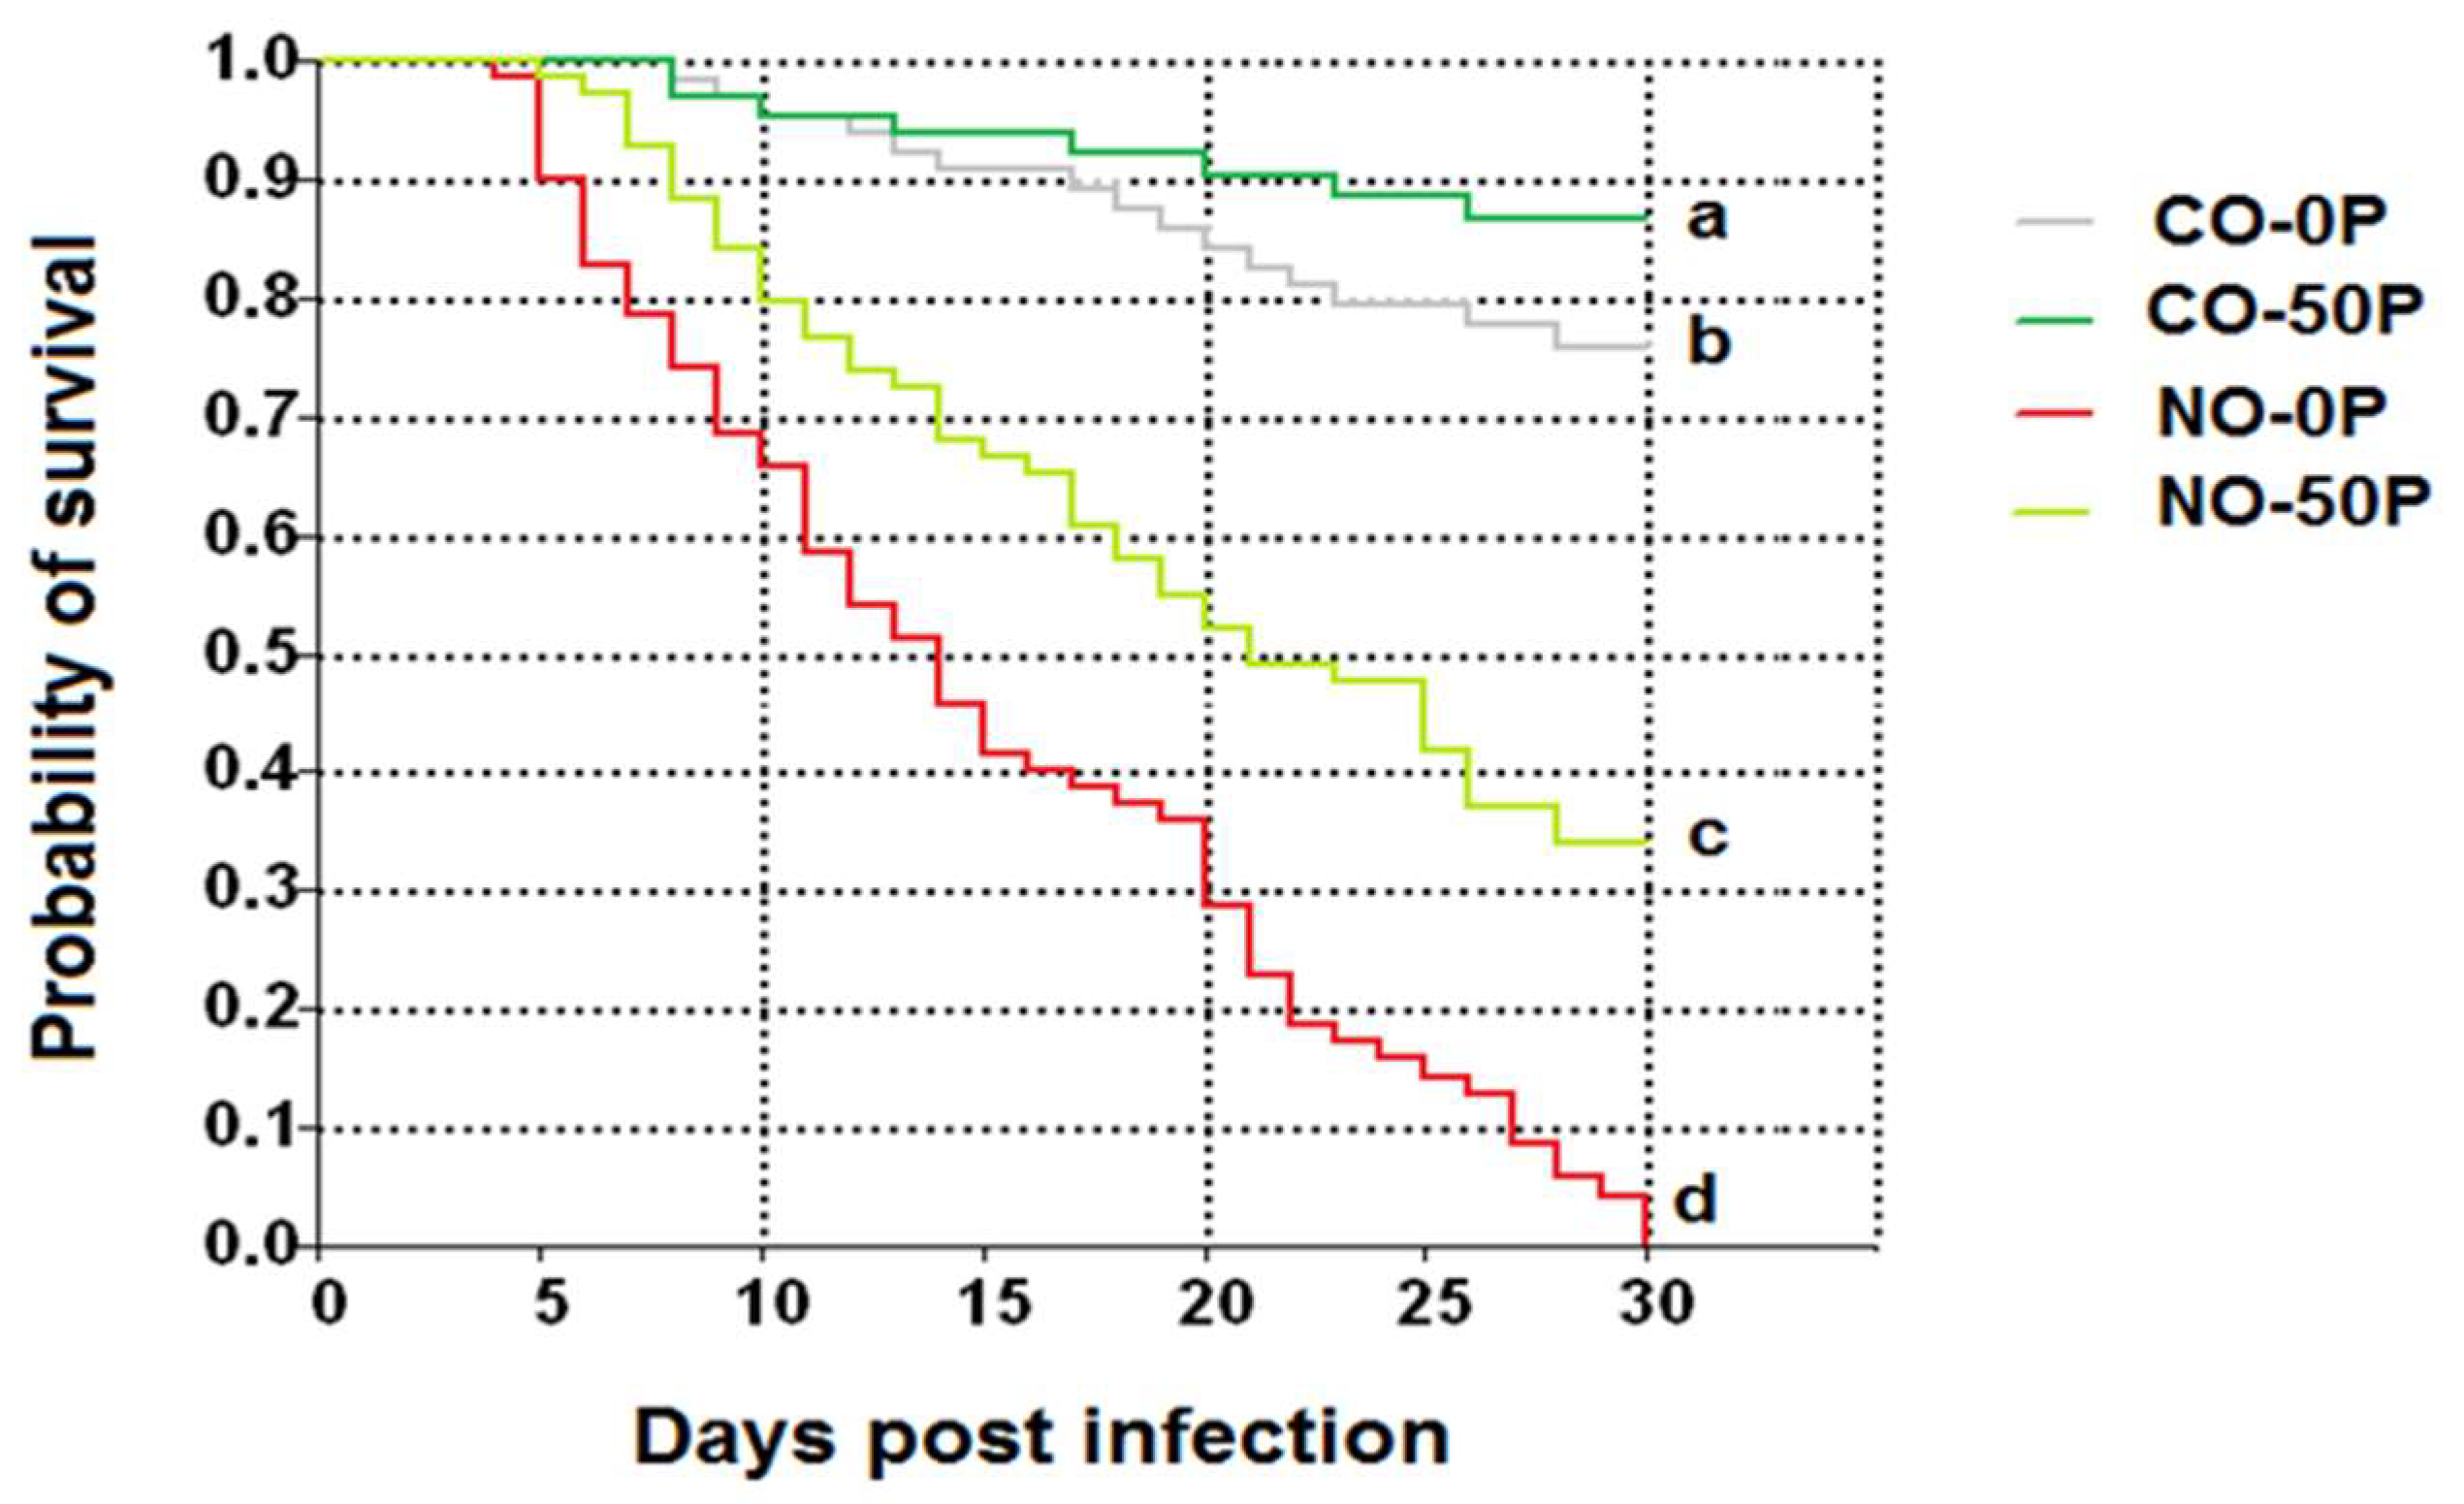
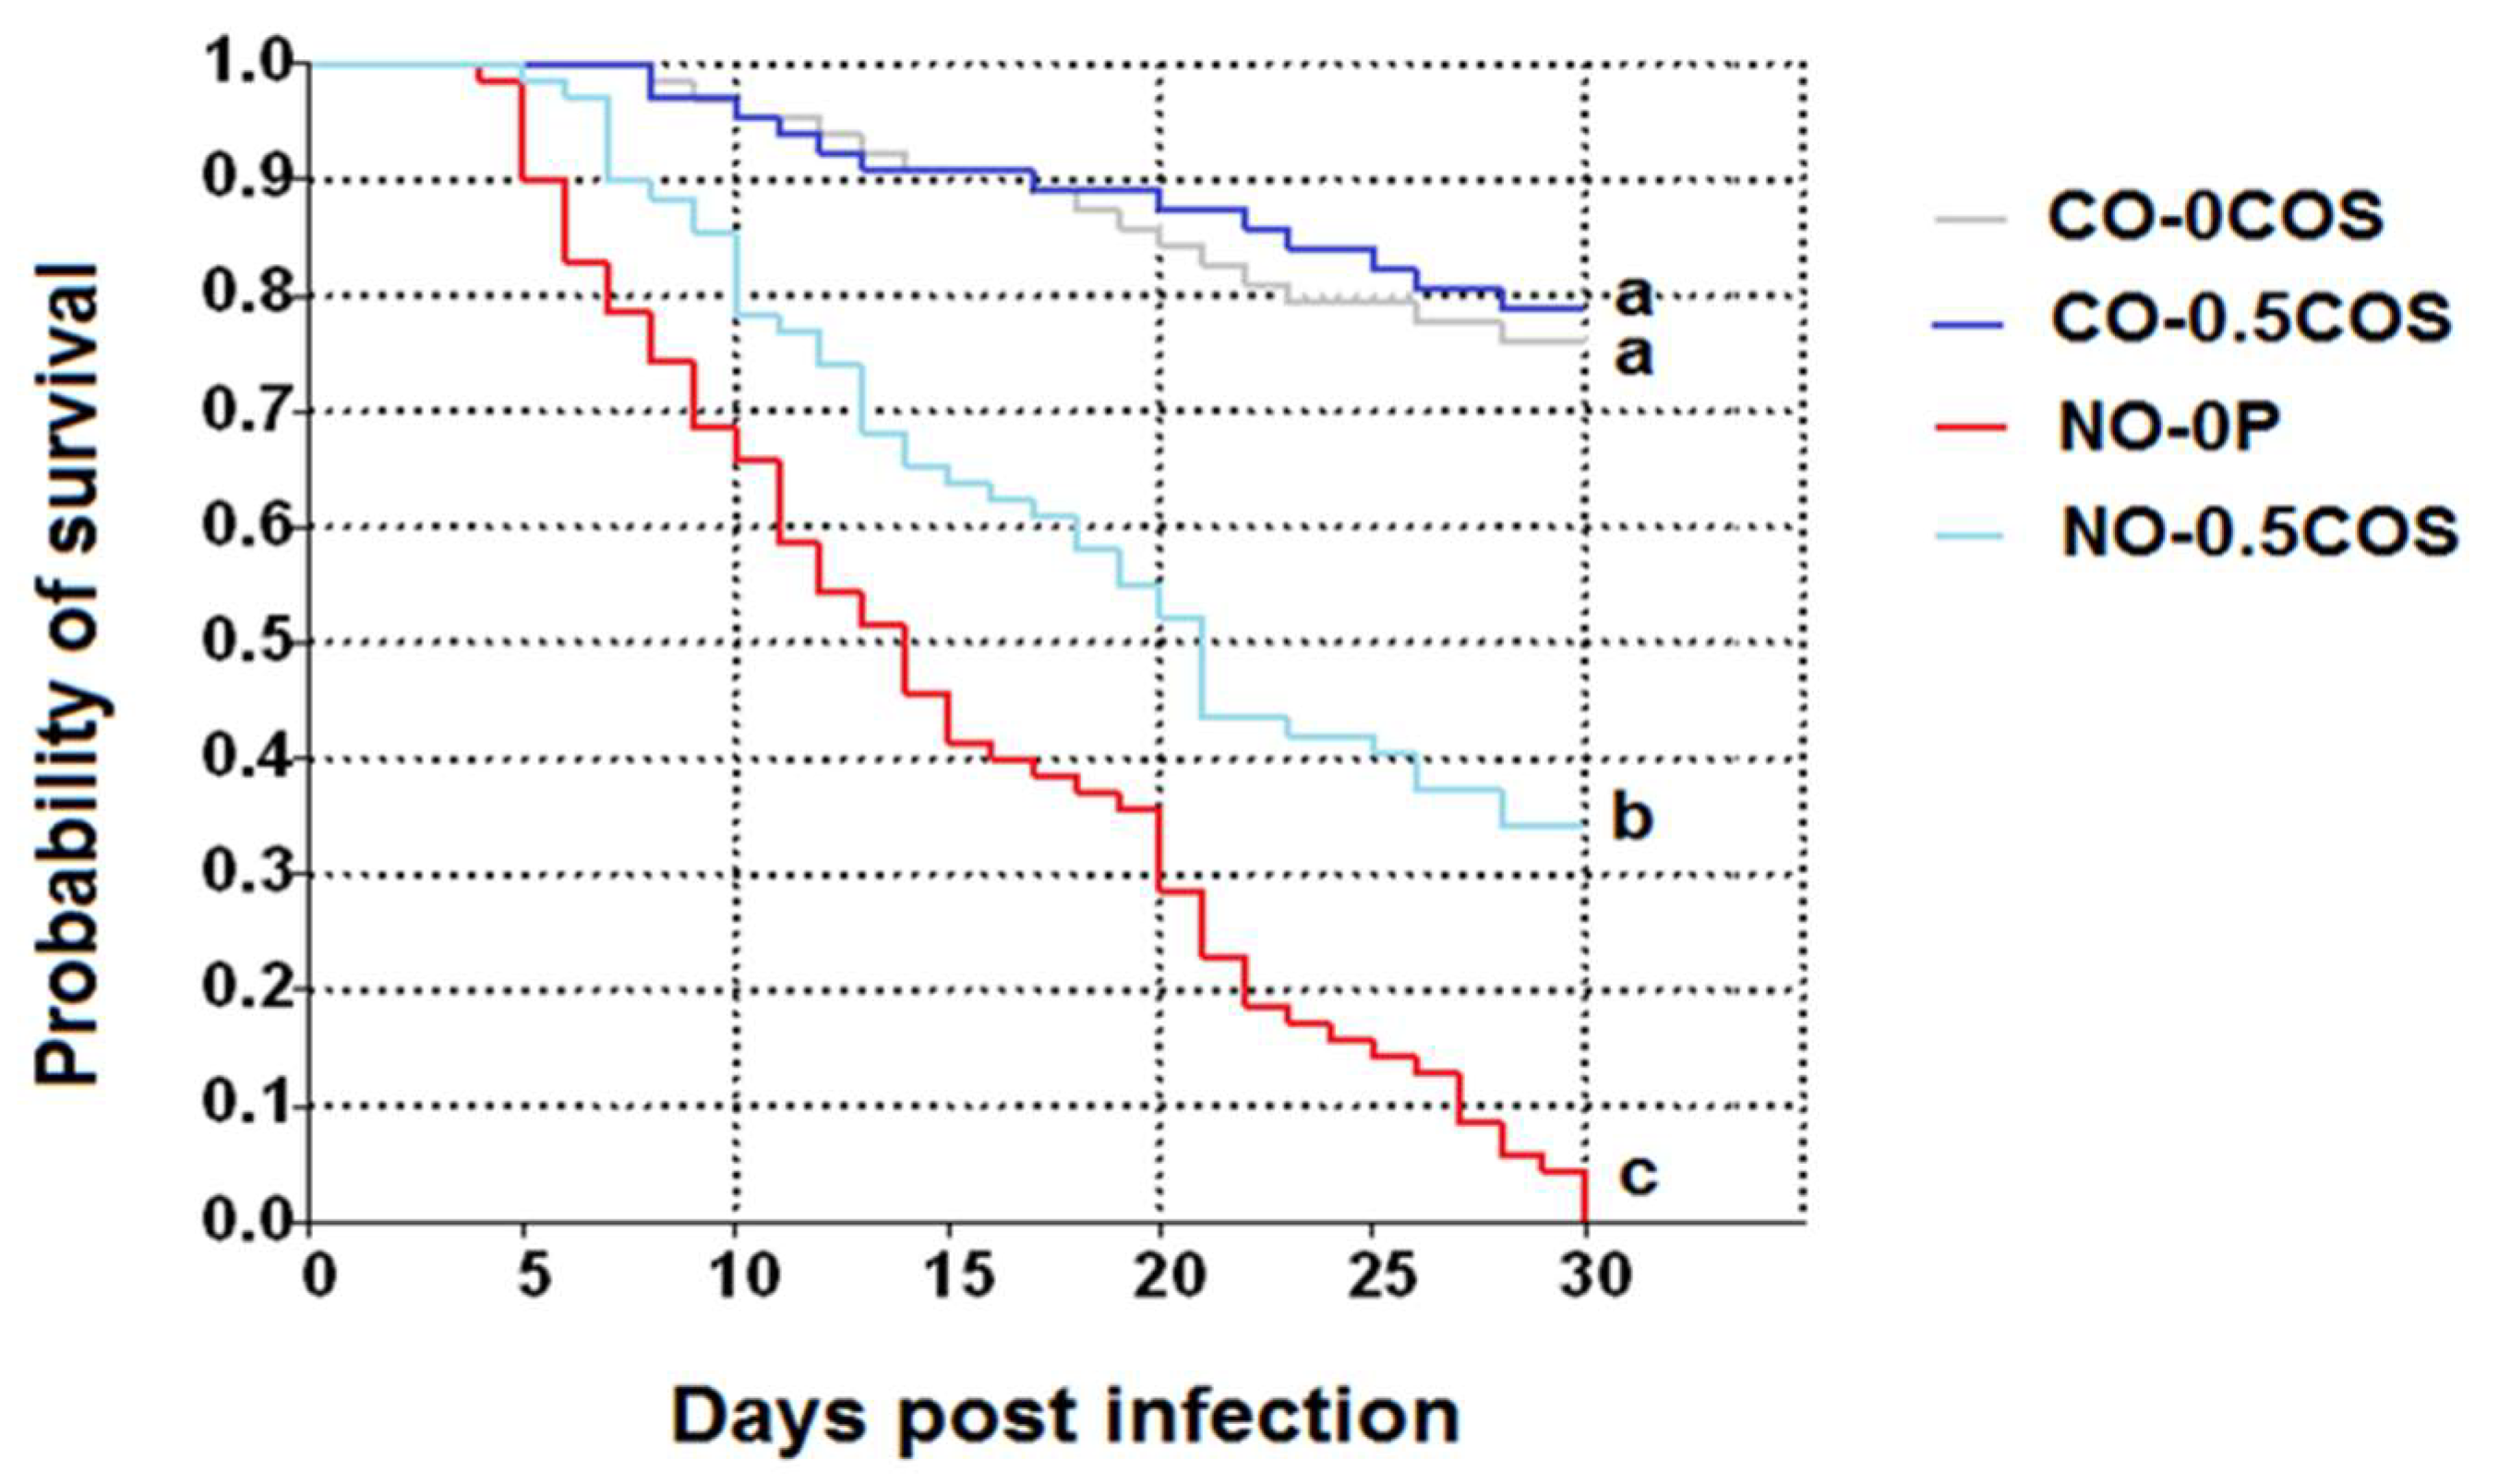
2.4. Honey Bee Survival Rates

Kaplan–Meier curves showed that A. dorsata workers infected with N. ceranae dosed with 106 spores per bee (NO-0P) had significantly lower survival in comparison to the infected bees that received propolis treatment (χ2 = 17.33, df = 3, p = 0.0005, Figure 10). The control bees treated with propolis extract (CO-50P) had the highest survival, followed by CO-0P and NO-50P, respectively. A similar trend was found in bees treated with 0.5 ppm COS, except in this case there was no significant difference between the control bees and the control bees treated with COS (χ2 = 16.08, df = 3, p = 0.0010, Figure 11).

3. Discussion

The increase of hemolymph trehalose levels, protein content of the hypopharyngeal glands, and enhanced acini diameters of hypopharyngeal glands of the infected giant honey bee, A. dorsata, all indicate improved health after 50% propolis extract and 0.5 ppm COS treatment. Although the levels after treatment were not to the same level of the uninfected control bees, except for the acini diameter from the propolis treatment, there was still a significant increase for all health measures in comparison to the infected bees without any treatment. Based on our results, both stingless bee propolis extract and COS are effective treatments in improving the health of the honey bee. Propolis extract however may be a slightly better treatment as indicated by the full recovery of the acini diameter distance of the hypopharyngeal gland, which was not the case for the COS treatment. For both treatments there were no detrimental effects in the uninfected control bees for hemolymph trehalose levels, protein content in the hypopharyngeal gland, and the acini diameters in the hypopharyngeal gland, which suggests that these treatments are not having any damaging side-effects for these health parameters measured. Whether the increased trehalose levels and protein content of the hypopharyngeal gland is due to a lower parasite load or the improved nutrient absorption across the gut lining in treated bees—which results in higher tolerance of the parasite—remains to be investigated.
The higher trehalose levels in the uninfected bees treated with propolis extract in comparison to the uninfected bees without any treatment suggests that propolis might be affecting the sugar metabolism of the honey bee. This is interesting to note because hemolymph trehalose levels are central to buffering against the energetic stress suffered from the infected bees [24]. In addition, increased trehalose levels were found to be a key difference in honey bees selected to better tolerate N. ceranae infections [56]. Therefore, the increased hemolymph trehalose levels from propolis consumption could be one way in which increased survival results from infected bees treated with this [30]. Propolis extract also positively increased the protein contents of hypopharyngeal glands, and the acini diameters of hypopharyngeal glands of honey bee. This suggests that the increased health measures may also be due to the lowering of the N. ceranae load in the treated bees. This corresponds to the results of the previous study which showed the potential of propolis extracted from stingless bee to control N. ceranae infection in the red dwarf honey bee, A. florea [30]. Recently, it has also been demonstrated that propolis extract can increase the survival of A. mellifera [45,46]. Taken together, these results suggest that propolis extract may have a general positive impact on bee health, across all honey bee species. Further supporting this notion is the fact that stingless bee propolis extracts are known to specifically have antifungal properties [57]. Moreover, a previous study demonstrated abnormal structure of N. ceranae spores, inside A. cerana bees, after being treated with propolis extract, which corresponded with the interference of spore growth and development [47].
Bees treated with COS after infection with N. ceranae also had significantly higher trehalose levels, protein contents of hypopharyngeal glands, and increased acini diameters. However, it is more likely that these effects are resulting from indirect mechanisms such as enhanced bee immunity or increased nutrient absorption across the gut lining as opposed to directly reducing the reproduction and growth of the N. ceranae infection. COS is known to improve nutrient digestibility, gut functions and gut modifications in animals [50]. COS may affect Nosema development, but is more likely to achieve this through enhancing bee immunity, that will eventually result in higher hypopharyngeal gland protein contents, trehalose levels, and the increasing hypopharyngeal gland acini from decreased N. ceranae loads [58]. This is plausible because N. ceranae typically suppresses the immune system in infected bees in order for increased growth and reproduction inside the host [17,59].
It is important to note that N. ceranae can infect A. dorsata and develop well in this host. As previously shown, A. mellifera, A. cerana and A. florea can also be infected by N. ceranae. To date, all of the honey bee species have now been shown that not only can become infected with this parasite, but they are also suffering from the pathological effects of the infections as well. Based on our results A. dorsata is no exception, which raises concerns as the honey bee species may be suffering from some of the same behavioral and physiological changes that have been documented in A. mellifera from a N. ceranae infection [27]. Previous results show that the parasite develops well in each of the four honey bee species and that the intracellular life cycle is completed within three days p.i. [60,61,62]. Due to the successful reproduction in all four of the honey bee species there are opportunities for cross transmission between the species on a community level as they have overlapping foraging ranges and are known to share the same floral species when foraging [62,63,64].
The reduction in acini diameter of the hypopharyngeal glands of N. ceranae-infected bees might due to deficiency of amino acids used for secretory cell development. This is not surprising because previously it has been shown that the amino acid profiles in the hemolymph of infected bees is altered and feeding pollen can increase the survival of infected bees [65,66]. The recovery in the hypopharyngeal gland protein is important because it has been noted to play a role in protein synthesis of royal jelly production [6]. Metabolite dysregulation of royal jelly secretions has been documented in N. ceranae infected bee hives, which has implications for the antibacterial effectiveness of the secretions when feeding the brood [18]. Our findings suggest that COS and propolis extract treatment is likely to contribute to the increase of royal jelly productivity as well at the colony level, due to the increase of protein contents and the acini diameters of the hypopharyngeal glands. The lowering of the immune system is likely to be a result in the lack of protein nutrition resulting from the force feeding of spores that geminate and proliferate within the midgut epithelial cells where they disrupt host nutrient absorption [67,68]. Although infected bees do not exhibit obvious external disease symptoms, some of the main pathophysiological effects from an infection identified from omics studies have pointed to metabolic dysregulation [18,21,25,69]. Resulting from this metabolic dysregulation are the key symptoms of infection, which are lowered trehalose levels and reduced hypopharyngeal glands [22,24,62]. Therefore, we find that the measures used in this study to be accurate predictors of bee health and recovery from a N. ceranae infection. The effects of a N. ceranae infection on the colony level include lower colony population and the reduction of honey production [61,70]. Thus, we are interested if this treatment at the colony level might show an improvement in these colony level symptoms of infection.
The use of natural product such as propolis from stingless bees and COS will facilitate new strategies that can be used to control Nosema and improve honey bee health and beekeeping production. However, further experiments could be performed to determine the optimal doses to maximize the effect for each of the treatments. In addition, long term treatments could be investigated on a colony level to determine if they are great enough to effectively reduce the N. ceranae parasitic loads in a more natural setting. Perhaps using both treatments at the same time will synergistically improve the overall effectiveness in improving the health and survival of the honey bee. On one hand, N. bombi might also be another suitable target for this treatment which could lead to the health improvement of bumble bees as well, but on the other hand, the non-lethal side effects of these treatments should be investigated to determine if they pose any detriment to the health of bees. All of these would be interesting avenues to pursue in the future to further understand the practical use of stingless bee propolis extract and COS in terms of managing N. ceranae infections around the world.

4. Materials and Methods

4.1. Propolis Extraction

We collected propolis from three different stingless bee, Tetrigona apicalis, colonies from an apiary located in Chanthaburi Province, Thailand. We then dried the propolis in a hot air oven (Binder ED 53, BINDER GmbH, Tuttlingen, Germany) at 80 °C for 72 h, this was then frozen at −21 °C (Sharp SJ-X43T, Sharp Thai Co., Ltd. (STCL), Bangkok, Thailand) for 3 h and grinded using a motor and pestle. We extracted 60 g of propolis powder with 100 mL of 70% ethanol for 72 h, this was then followed by gravity filtration using a Whatman No. 4 filter paper [30]. After filtration a crude ethanol extract was formed that we defined as 100% propolis stock solution. For the experiments a 50% propolis solution was prepared by diluting the stock solution with water (v/v).

4.2. Chito-Oligosaccharide Solution Preparation

We made a 104 ppm stock of COS, by taking 0.25 g of COS (6081 Da) and dissolving it in 5 mL of pure A. dorsata honey (pH = 3.45). We then adjusted the final volume of this to 20 mL with 50% sucrose solution (v/v). We then diluted the 104 ppm stock solution of COS to a 50% honey solution using water (v/v) to make a final concentration of 102 ppm. Afterwards we then prepared a 0.5 ppm COS solution using the same methods that had a pH of 3.77 (pH meter, Mettler Toledo Gmbh, Greifensee, Zurich, Switzerland).

4.3. Spore Preparation

Nosema ceranae spores were propagated from heavily infected A. florea colonies located in the Chon Buri Province of Thailand. We fed isolated spores to A. mellifera workers (5 × 10⁷ spores for 50 bees) that were kept at 34 ± 2 °C (Memmert IPP 260, Schwabach, Germany) with relative humidity (Barigo-8861, Schwenningen, Germany) (RH) between 50–55% for 14 days in order to propagate more spores for the experimental infections. To propagate more spores, midguts were removed and transferred to a 1.5 mL microcentrifuge tube containing 100 µL distilled water. The midguts were then homogenized using a sterile pestle and centrifuged at 6000× g (Benchmark Scientific Z206-A, Sayreville, NJ, USA) for 10 min, this was repeated for 3 times [40]. We discarded the supernatant each time and the white sediment at the bottom was collected to be counted using a hemocytometer (Hausser Scientific, Horsham, PA, USA) under a light microscope (Olympus CX50, Shinjuku, Tokyo, Japan) [71]. After one more centrifugation, we re-suspended the spores in 50% (w/v) sucrose solution to make a final concentration of 5 × 10⁵ spores per µL. We stored this syrup at room temperature overnight until further use.

4.4. Propolis Extract and COS Treatment Experiments

We obtained 3 frames of sealed brood from three Nosema free colonies of A. dorsata located in Samut Songkhram Province, Thailand. Colonies were confirmed to be Nosema free following standard procedures [72,73]. To obtain newly emerged bees, the brood frames were kept in an incubator (Memmert IPP 260, Schwabach, Germany) at 34 ± 2 °C with RH (Barigo-8861, Schwenningen, Germany) between 50–55%. The newly emerged bees, between 24–48 h of age, were confined to cages, in groups of 50, and divided into 8 groups. The first 4 groups, were individually force-fed with 2 µL 50% sucrose solution (v/v) containing 106 N. ceranae spores per bee. We then provided 2 groups with 2 mL of either 0% or 50% stingless bee propolis extracts, daily, and these groups were defined as NO-0P and NO-50P, respectively. For the other 2 groups, we provided 2 mL of 0 ppm or 0.5 ppm of COS defined as NO-0COS and NO-0.5COS, respectively.
The control groups were individually force-fed with only 50% sucrose solution (v/v), and were defined as the negative control bees CO-0P, CO-0COS, CO-0.5COS, and CO-50P, respectively. In the CO-50P control group was each bee was also treated daily with 2 mL of 50% stingless bee propolis extract, while in the CO-0.5COS control group the bees were treated daily with 2 mL of 0.5 ppm COS. For the duration of the experiment, each cage was fitted with two gravity feeders, one containing distilled water, and the other sugar syrup (50% w/v sucrose solution). We also supplied 60 g of pollen mixed with 17 mL of 50% sucrose solution (w/v), each was replenished as necessary throughout the experiment. All cages were placed in an incubator at 34 ± 2 °C (Memmert IPP 260, Schwabach, Germany), with a RH ranging from 50–55%. The 50% stingless bee propolis extract was provided in 2 mL at a time in a 1.5 mL micro-centrifuge tube from the start of the experiment (0 Day p.i.), until the end (30 Days p.i.), and was replaced as necessary. For the COS treatment, we provided 2 mL of 0.5 ppm COS in 50% honey solution in a 1.5 mL micro-centrifuge at the start of the experiment (0 Day p.i.) and this was replaced as necessary until the end of the experiment (30 Days p.i.).

4.5. Hemolymph Trehalose Measurements

On Day 14 p.i., 10 honey bees were removed from each cage and were anaesthetized at −21 °C for 5 min. Before we collected their hemolymph, honey bees were mounted on a wax plate by a pair of insect pins crossing over the waist. Using a glass microcapillary (Hirschmann® Laborgerate, Eberstadt, Germany), 5 µL per bee was collected by puncturing abdomen segments between tergites 3 and 4, and the hemolymph was transferred to a microcentrifuge tube (Eppendorf, Hamburg, Germany) containing 45 µL of 0.85% NaCl. For each sample, 2.9 mL of anthrone reagent was added and then vortexed for 30 s before we quickly put them into a boiling water bath for 15 min. After this they were placed into cold water (4 °C) for 20 min and read at 620 nm absorbance using a Shimadzu UV-visible spectrophotometer (UV-1610). Quantification of the hemolymph trehalose amounts were based on a standard curve.

4.6. Hypopharyngeal Gland Protein Content Measurements

Another 10 bees were randomly removed from each cage at 14 days post infection (p.i.). These bees were decapitated so that their hypopharyngeal glands could be removed under a stereomicroscope (Olympus CH30, Shinjuku, Tokyo, Japan). Glands of each bee were stored in 50 µL of phosphate buffer solution (pH 7.8) in a 1.5 mL microcentrifuge tube. These were then homogenized and centrifuged at 1000× g for 2 min. Supernatant from each tube was used in the Bradford protein assay [74]. Quantification of protein content was based on standard curves that were prepared using bovine serum albumin (BSA). Protein absorbance was measured at 595 nm absorbance against a blank reagent using a Shimadzu UV-visible spectrophotometer (UV-1610).

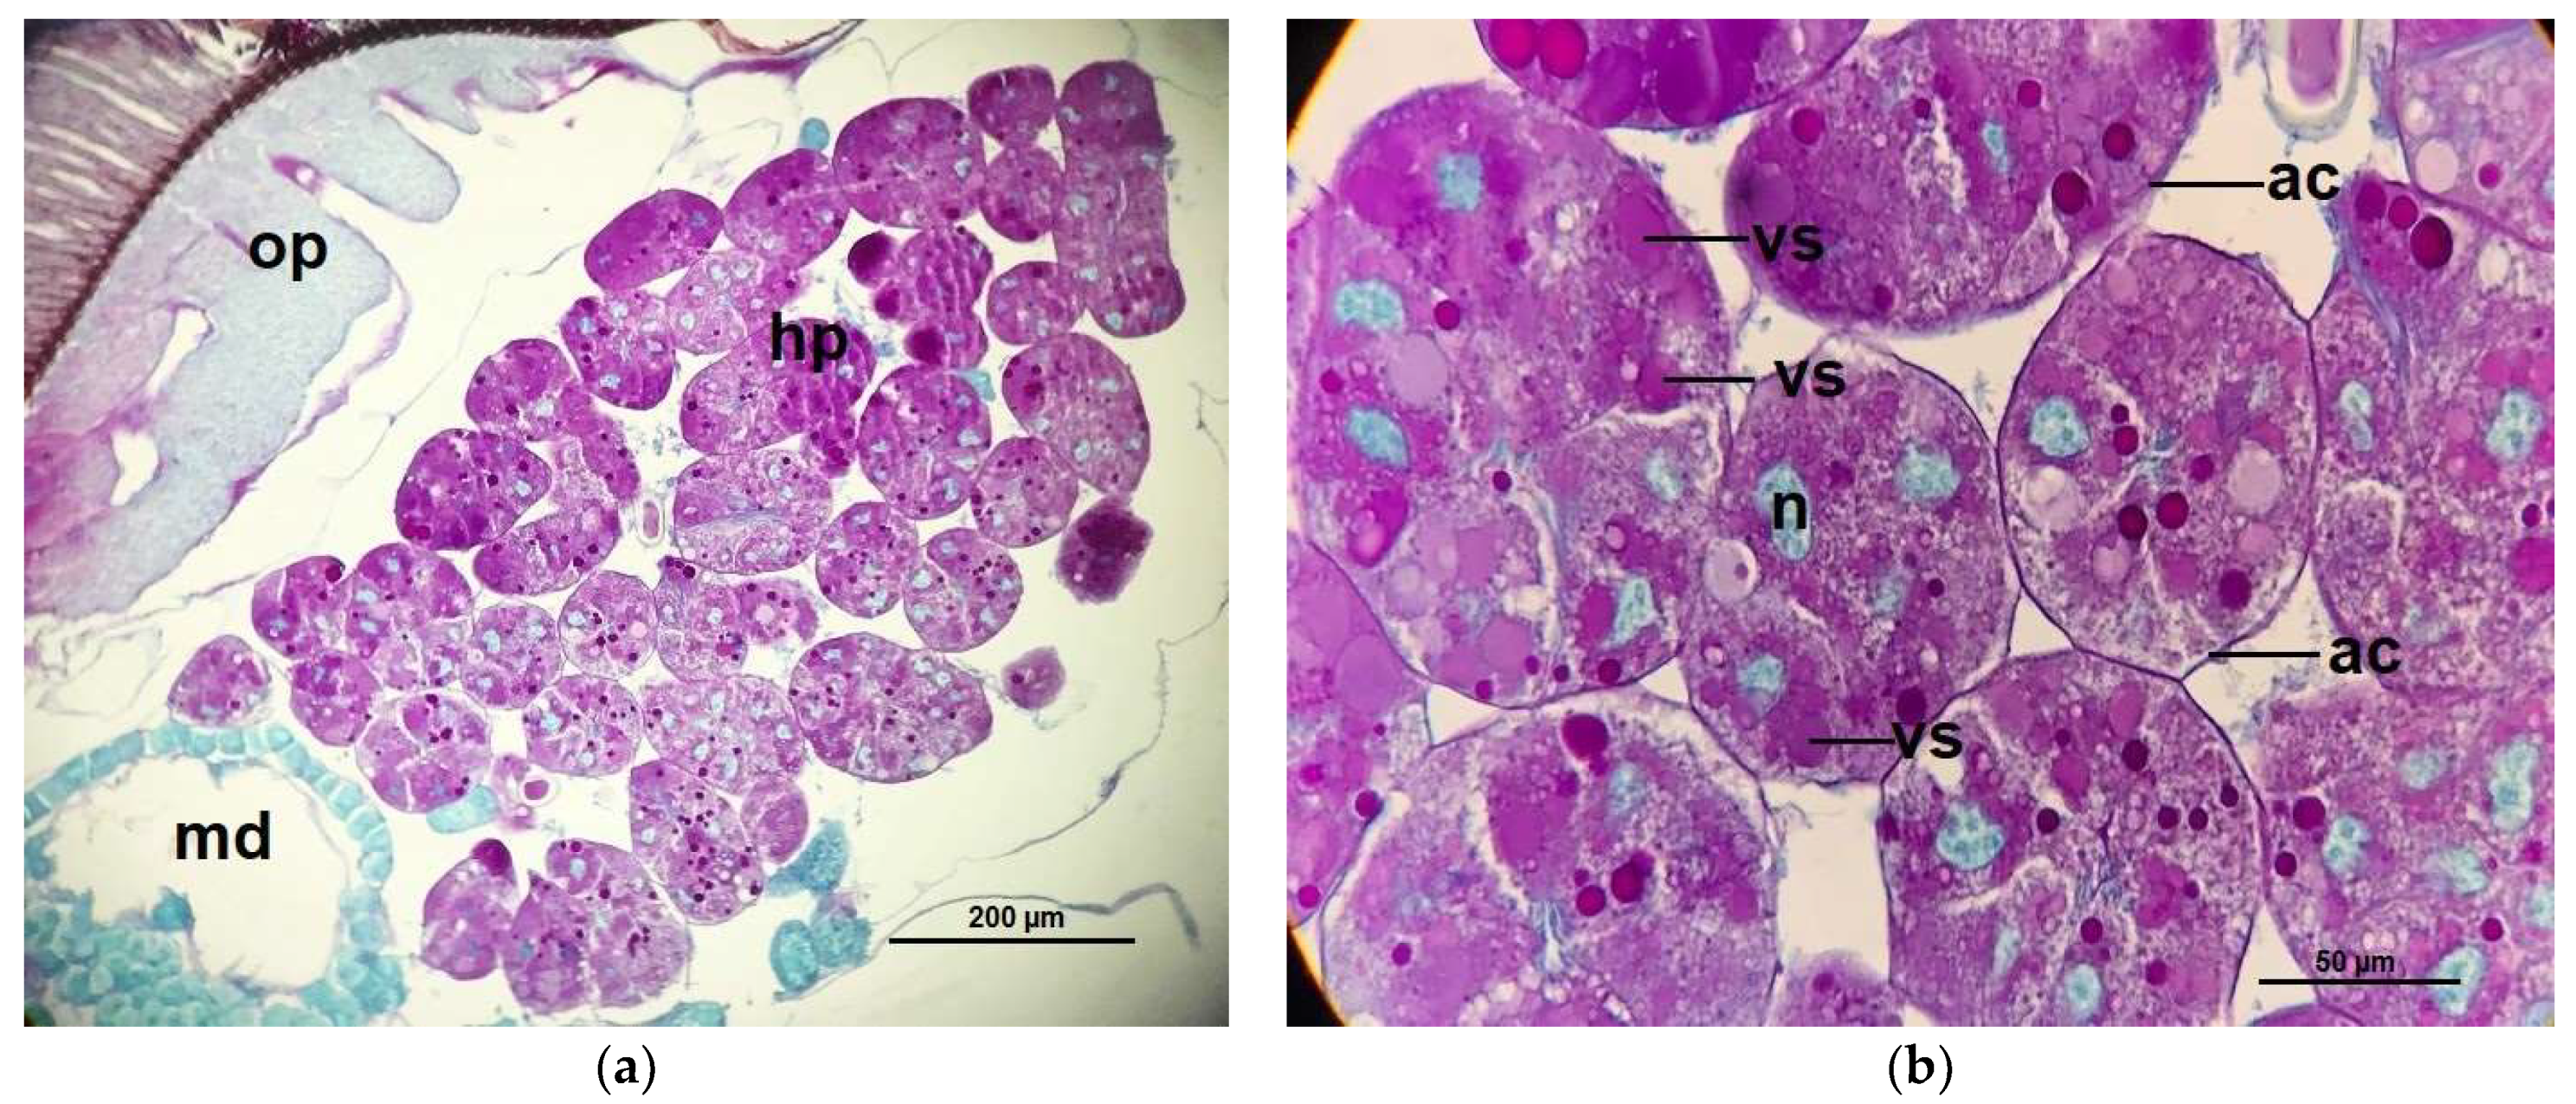
4.7. Measurements of Acinar Sizes of the Hypopharyngeal Glands and Histological Structure

Another 10 bees from each group were collected on 14 days p.i. and the heads were dissected in insect saline (NaCl 7.5 g/L, Na2HPO4 2.38 g/L, KH2PO4 2.72 g/L) and then fixed in Bouin’s solution for 24 h. Samples were dehydrated using a series of increasing ethyl alcohol concentrations: 70%, 90%, 95%, and 100% for 10 min per concentration. Samples were then soaked in xylene for 1 h and then embedded in paraffin wax. The tissues were sectioned into 6 µm thickness using a rotary microtome (Leica, Wetzlar, Germany), and then stained with Periodic acid Schiff’s reagent (PAS) followed by a counter staining of light green dye [75,76]. Measurement of acinar sizes of the hypopharyngeal glands were made under a light microscopy (Olympus CX 50, Shinjuku, Tokyo, Japan) using a micrometer (ERMA: ESM-11, Japan); n = 10 per bee each treatment.

4.8. Survival Analysis

Survivorship curves of all treatment groups were generated using the Kaplan–Meier approach by plotting number of surviving bees against days from initiation of the experiment [30]. Honey bee survival rates were compared across the treatment groups using a non-parametric, univariate analysis of variance and a corresponding post hoc test (Kruskal–Wallis test and the Mann–Whitney U test).

4.9. Statistical Analyses

Hemolymph trehalose levels, protein contents of the hypopharyngeal gland, the diameter of the hypopharyngeal gland acini of N. ceranae-infected bees on day 14 p.i., and the survival rates were normally distributed (Jarque–Bera JB test: p > 0.05) but had unequal variances (Levene’s test: p < 0.05). We, therefore, used a non-parametric Kruskal–Wallis test and a Mann–Whitney U test to compare across the treatment groups. Multiple comparisons were accounted for using a Bonferroni correction.

Author Contributions

Conceptualization, G.S. and S.N.; methodology, R.P. and E.C.; software, S.N.; validation, G.S., S.N. and C.L.M.; formal analysis, C.L.M. and S.N.; investigation, R.P. and E.C.; resources, R.P.; data curation, R.P.; E.C., S.N.; writing—original draft preparation, G.S.; writing—review and editing, G.S. and C.L.M.; visualization, S.N. and E.C.; supervision, G.S. and C.L.M.; project administration, G.S.; funding acquisition, G.S., S.N. and R.P. All authors have read and agreed to the published version of the manuscript.

Funding

This research was funded by The Royal Golden Jubilee Ph.D. Scholarship (RGJ) no. PHD58K0155; PHD/0078/2559, Thailand Research Funds.

Institutional Review Board Statement

The study was conducted according to the guidelines of the Declaration of Helsinki, and approved by Thai IACUC (Animal care and uses Committee of Thailand) (Protocol Code: U1-03211-2559 and date of approval: 20 March 2016).

Informed Consent Statement

Informed consent was sought from the owner of honey bee colonies. Honey bee samples were collected from that owner who has agreed to have his honey bee sampled.

Data Availability Statement

The data presented in this study are available on requested from the corresponding author.

Acknowledgments

We would like to thank Department of Biology, Faculty of Science, Burapha University for providing research facilities.

Conflicts of Interest

The authors declare no conflict of interest.

References

  1. Breeze, T.D.; Vaissière, B.E.; Bommarco, R.; Petanidou, T.; Seraphides, N.; Kozák, L.; Scheper, J.; Biesmeijer, J.C.; Kleijn, D.; Gyldenkaerne, S.; et al. Agricultural Policies Exacerbate Honeybee Pollination Service Supply-Demand Mismatches Across Europe. PLoS ONE 2014, 9, e82996. [Google Scholar] [CrossRef] [PubMed] [Green Version]
  2. Genersch, E. Honey bee pathology: Current threats to honey bees and beekeeping. Appl. Microbiol. Biotechnol. 2010, 87, 87–97. [Google Scholar] [CrossRef]
  3. Klein, A.-M.; Vaissière, B.E.; Cane, J.H.; Steffan-Dewenter, I.; Cunningham, S.A.; Kremen, C.; Tscharntke, T. Importance of pollinators in changing landscapes for world crops. Proc. R. Soc. B Biol. Sci. 2007, 274, 303–313. [Google Scholar] [CrossRef] [PubMed] [Green Version]
  4. Kremen, C.; Williams, N.M.; Aizen, M.A.; Gemmill-Herren, B.; Lebuhn, G.; Minckley, R.; Packer, L.; Potts, S.G.; Roulston, T.; Steffan-Dewenter, I.; et al. Pollination and other ecosystem services produced by mobile organisms: A conceptual framework for the effects of land-use change. Ecol. Lett. 2007, 10, 299–314. [Google Scholar] [CrossRef]
  5. Potts, S.G.; Petanidou, T.; Roberts, S.; O’Toole, C.; Hulbert, A.; Willmer, P. Plant-pollinator biodiversity and pollination services in a complex Mediterranean landscape. Biol. Conserv. 2006, 129, 519–529. [Google Scholar] [CrossRef]
  6. Suwannapong, G. Honeybees of Thailand; Nova Science Publishers, Inc.: New York, NY, USA, 2019; pp. 1–378. [Google Scholar]
  7. Goulson, D.; Nicholls, E.; Botías, C.; Rotheray, E.L. Bee declines driven by combined stress from parasites, pesticides, and lack of flowers. Science 2015, 347, 1255957. [Google Scholar] [CrossRef] [PubMed]
  8. Kulhanek, K.; Steinhauer, N.; Rennich, K.; Caron, D.M.; Sagili, R.R.; Pettis, J.S.; Ellis, J.D.; Wilson, M.E.; Wilkes, J.T.; Tarpy, D.R.; et al. A national survey of managed honey bee 2015–2016 annual colony losses in the USA. J. Apic. Res. 2017, 56, 328–340. [Google Scholar] [CrossRef] [Green Version]
  9. López-Uribe, M.M.; Ricigliano, V.A.; Simone-Finstrom, M. Defining Pollinator Health: A Holistic Approach Based on Ecological, Genetic, and Physiological Factors. Annu. Rev. Anim. Biosci. 2020, 8, 269–294. [Google Scholar] [CrossRef]
  10. McMahon, D.P.; Fürst, M.; Caspar, J.; Theodorou, P.; Brown, M.J.F.; Paxton, R. A sting in the spit: Widespread cross-infection of multiple RNA viruses across wild and managed bees. J. Anim. Ecol. 2015, 84, 615–624. [Google Scholar] [CrossRef]
  11. Paxton, R. Does infection by Nosema ceranae cause “Colony Collapse Disorder” in honey bees (Apis mellifera)? J. Apic. Res. 2010, 49, 80–84. [Google Scholar] [CrossRef]
  12. Higes, M.; Hernández, R.M.; Botías, C.; Bailón, E.G.; González-Porto, A.V.; Barrios, L.; Nozal, M.J.; Bernal, J.L.; Jiménez, J.J.; Palencia, P.G.; et al. How natural infection by Nosema ceranae causes honeybee colony collapse. Environ. Microbiol. 2008, 10, 2659–2669. [Google Scholar] [CrossRef]
  13. Klee, J.; Besana, A.M.; Genersch, E.; Gisder, S.; Nanetti, A.; Tam, D.Q.; Chinh, T.X.; Puerta, F.; Ruz, J.M.; Kryger, P.; et al. Widespread dispersal of the microsporidian Nosema ceranae, an emergent pathogen of the western honey bee, Apis mellifera. J. Invertebr. Pathol. 2007, 96, 1–10. [Google Scholar] [CrossRef] [PubMed]
  14. Martín-Hernández, R.; Bartolomé, C.; Chejanovsky, N.; Le Conte, Y.; Dalmon, A.; Dussaubat, C.; García-Palencia, P.; Meana, A.; Pinto, M.A.; Soroker, V.; et al. Nosema ceranaein in Apis mellifera: A 12 years postdetectionperspective. Environ. Microbiol. 2018, 20, 1302–1329. [Google Scholar] [CrossRef] [Green Version]
  15. Chemurot, M.; De Smet, L.; Brunain, M.; De Rycke, R.; de Graaf, D.C. Nosema neumanni n. sp. (Microsporidia, Nosematidae), a new microsporidian parasite of honeybees, Apis mellifera in Uganda. Eur. J. Protistol. 2017, 61, 13–19. [Google Scholar] [CrossRef]
  16. Zander, E. Tierische Parasiten als Krankheitserreger bei der Biene. Munch. Bienenztg. 1909, 21, 196–204. [Google Scholar]
  17. Antúnez, K.; Hernández, R.M.; Prieto, L.; Meana, A.; Zunino, P.; Higes, M. Immune suppression in the honey bee (Apis mellifera) following infection by Nosema ceranae (Microsporidia). Environ. Microbiol. 2009, 11, 2284–2290. [Google Scholar] [CrossRef]
  18. Broadrup, R.L.; Mayack, C.; Schick, S.J.; Eppley, E.J.; White, H.K.; Macherone, A. Honey bee (Apis mellifera) exposomes and dysregulated metabolic pathways associated with Nosema ceranae infection. PLoS ONE 2019, 14, e0213249. [Google Scholar] [CrossRef] [Green Version]
  19. Goblirsch, M.; Huang, Z.Y.; Spivak, M. Physiological and Behavioral Changes in Honey Bees (Apis mellifera) Induced by Nosema ceranae Infection. PLoS ONE 2013, 8, e58165. [Google Scholar] [CrossRef]
  20. Lecocq, A.; Jensen, A.B.; Kryger, P.; Nieh, J.C. Parasite infection accelerates age polyethism in young honey bees. Sci. Rep. 2016, 6, 22042. [Google Scholar] [CrossRef] [PubMed]
  21. Vidau, C.; Panek, J.; Texier, C.; Biron, D.G.; Belzunces, L.P.; Le Gall, M.; Broussard, C.; Delbac, F.; El Alaoui, H. Differential proteomic analysis of midguts from Nosema ceranae-infected honeybees reveals manipulation of key host functions. J. Invertebr. Pathol. 2014, 121, 89–96. [Google Scholar] [CrossRef] [PubMed]
  22. Corby-Harris, V.; Deeter, M.E.; Snyder, L.; Meador, C.; Welchert, A.C.; Hoffman, A.; Obernesser, B.T. Octopamine mobilizes lipids from honey bee (Apis mellifera) hypopharyngeal glands. J. Exp. Biol. 2020, 223, 216135. [Google Scholar] [CrossRef] [PubMed]
  23. Li, W.; Chen, Y.; Cook, S.C. Chronic Nosema ceranae infection inflicts comprehensive and persistent immunosuppression and accelerated lipid loss in host Apis mellifera honey bees. Int. J. Parasitol. 2018, 48, 433–444. [Google Scholar] [CrossRef]
  24. Mayack, C.; Naug, D. Parasitic infection leads to decline in hemolymph sugar levels in honeybee foragers. J. Insect Physiol. 2010, 56, 1572–1575. [Google Scholar] [CrossRef]
  25. Dussaubat, C.; Brunet, J.-L.; Higes, M.; Colbourne, J.K.; Lopez, J.; Choi, J.-H.; Hernández, R.M.; Botías, C.; Cousin, M.; McDonnell, C.; et al. Gut Pathology and Responses to the Microsporidium Nosema ceranae in the Honey Bee Apis mellifera. PLoS ONE 2012, 7, e37017. [Google Scholar] [CrossRef] [PubMed] [Green Version]
  26. García-Palencia, P.; Hernández, R.M.; González-Porto, A.-V.; Marin, P.; Meana, A.; Higes, M. Natural infection by Nosema ceranaecauses similar lesions as in experimentally infected caged-worker honey bees (Apis mellifera). J. Apic. Res. 2010, 49, 278–283. [Google Scholar] [CrossRef]
  27. Mayack, C.; Natsopoulou, M.E.; McMahon, D. Nosema ceranaealters a highly conserved hormonal stress pathway in honeybees. Insect Mol. Biol. 2015, 24, 662–670. [Google Scholar] [CrossRef]
  28. Mayack, C.; Naug, D. Energetic stress in the honeybee Apis mellifera from Nosema ceranae infection. J. Invertebr. Pathol. 2009, 100, 185–188. [Google Scholar] [CrossRef]
  29. Mayack, C.; Naug, D. Individual energetic state can prevail over social regulation of foraging in honeybees. Behav. Ecol. Sociobiol. 2013, 67, 929–936. [Google Scholar] [CrossRef]
  30. Suwannapong, G.; Maksong, S.; Phainchajoen, M.; Benbow, M.; Mayack, C. Survival and health improvement of Nosema infected Apis florea (Hymenoptera: Apidae) bees after treatment with propolis extract. J. Asia-Pacific Èntomol. 2018, 21, 437–444. [Google Scholar] [CrossRef]
  31. Shimanuki, H.; Knox, D.A.; Furgala, B.; Caron, D.M.; Williams, J.L. Diseases and pests of honey bee. In The Hive and the Honey Bee; Graham, J.M., Ed.; Dadant and Sons: Hamilton, IL, USA, 1992; pp. 1083–1152. [Google Scholar]
  32. Giacobino, A.; Rivero, R.; Molineri, A.I.; Cagnolo, N.B.; Merke, J.; Orellano, E.; Salto, C.; Signorini, M. Fumagillin control of Nosema ceranae (Microsporidia:Nosematidae) infection in honey bee (Hymenoptera:Apidae) colonies in Argentina. Vet. Ital. 2016, 52, 145–151. [Google Scholar] [PubMed]
  33. Mendoza, Y.; Diaz-Cetti, S.; Ramallo, G.; Santos, E.; Porrini, M.; Invernizzi, C. Nosema ceranae Winter Control: Study of the Effectiveness of Different Fumagillin Treatments and Consequences on the Strength of Honey Bee (Hymenoptera: Apidae) Colonies. J. Econ. Èntomol. 2016, 110, 1–5. [Google Scholar] [CrossRef]
  34. Maistrello, L.; Lodesani, M.; Costa, C.; Leonardi, F.; Marani, G.; Caldon, M.; Mutinelli, F.; Granato, A. Screening of natural compounds for the control of nosema disease in honeybees (Apis mellifera). Apidologie 2008, 39, 436–445. [Google Scholar] [CrossRef] [Green Version]
  35. Gajger, I.T.; Ribaric, J.; Matak, M.; Svecnjak, L.; Kozaric, Z.; Nejedli, S.; Skerl, I.S. Zeolite clinoptilolite as a dietary supplement and remedy for honeybee (Apis mellifera L.) colonies. Veterinární Med. 2017, 60, 696–705. [Google Scholar] [CrossRef] [Green Version]
  36. Tlak-Gajger, I.; Tomljanovic, Z.; Stanisavljevic, L. An environmentally friendly approach to the control of Varroa destructor mite and Nosema ceranae disease in Carniolan honeybee (Apis mellifera Carnica) colonies. Arch. Biol. Sci. 2013, 65, 1585–1592. [Google Scholar] [CrossRef] [Green Version]
  37. Higes, M.; Gómez-Moracho, T.; Rodríguez-García, C.; Botías, C.; Hernández, R.M. Preliminary effect of an experimental treatment with “Nozevit®”, (a phyto-pharmacological preparation) for Nosema ceranae control. J. Apic. Res. 2014, 53, 472–474. [Google Scholar] [CrossRef]
  38. Porrini, M.P.; Fernández, N.J.; Garrido, P.M.; Gende, L.B.; Medici, S.K.; Eguaras, M.J. In vivo evaluation of antiparasitic activity of plant extracts on Nosema ceranae (Microsporidia). Apidologie 2011, 42, 700–707. [Google Scholar] [CrossRef] [Green Version]
  39. Cilia, G.; Garrido, C.; Bonetto, M.; Tesoriero, D.; Nanetti, A. Effect of Api-Bioxal® and ApiHerb® Treatments against Nosema ceranae Infection in Apis mellifera Investigated by Two qPCR Methods. Veter-Sci. 2020, 7, 125. [Google Scholar] [CrossRef] [PubMed]
  40. Borges, D.; Guzman-Novoa, E.; Goodwin, P. Effects of Prebiotics and Probiotics on Honey Bees (Apis mellifera) Infected with the Microsporidian Parasite Nosema ceranae. Microorganisms 2021, 9, 481. [Google Scholar] [CrossRef]
  41. El Khoury, S.; Rousseau, A.; Lecoeur, A.; Cheaib, B.; Bouslama, S.; Mercier, P.-L.; Demey, V.; Castex, M.; Giovenazzo, P.; Derome, N. Deleterious Interaction Between Honeybees (Apis mellifera) and its Microsporidian Intracellular Parasite Nosema ceranae Was Mitigated by Administrating Either Endogenous or Allochthonous Gut Microbiota Strains. Front. Ecol. Evol. 2018, 6, 58. [Google Scholar] [CrossRef] [Green Version]
  42. Valizadeh, P.; Guzman-Novoa, E.; Goodwin, P.H. Effect of Immune Inducers on Nosema ceranae Multiplication and Their Impact on Honey Bee (Apis mellifera L.) Survivorship and Behaviors. Insects 2020, 11, 572. [Google Scholar] [CrossRef]
  43. Nanetti, A.; Ugolini, L.; Cilia, G.; Pagnotta, E.; Malaguti, L.; Cardaio, I.; Matteo, R.; Lazzeri, L. Seed Meals from Brassica nigra and Eruca sativa Control Artificial Nosema ceranae Infections in Apis mellifera. Microorganisms 2021, 9, 949. [Google Scholar] [CrossRef]
  44. Borges, D.; Guzman-Novoa, E.; Goodwin, P.H. Control of the microsporidian parasite Nosema ceranae in honey bees (Apis mellifera) using nutraceutical and immuno-stimulatory compounds. PLoS ONE 2020, 15, e0227484. [Google Scholar] [CrossRef]
  45. Mura, A.; Pusceddu, M.; Theodorou, P.; Angioni, A.; Floris, I.; Paxton, R.J.; Satta, A. Propolis Consumption Reduces Nosema ceranae Infection of European Honey Bees (Apis mellifera). Insects 2020, 11, 124. [Google Scholar] [CrossRef] [Green Version]
  46. Naree, S.; Ellis, J.D.; Benbow, M.E.; Suwannapong, G. The use of propolis for preventing and treating Nosema ceranae infection in western honey bee (Apis mellifera Linnaeus, 1787) workers. J. Apic. Res. 2021, 1–11. [Google Scholar] [CrossRef]
  47. Yemor, T.; Phiancharoen, M.; Benbow, M.E.; Suwannapong, G. Effects of stingless bee propolis on Nosema ceranae infected Asian honey bees, Apis cerana. J. Apic. Res. 2015, 54, 468–473. [Google Scholar] [CrossRef]
  48. Arismendi, N.; Vargas, M.; López, M.D.; Barría, Y.; Zapata, N. Promising antimicrobial activity against the honey bee parasite Nosema ceranae by methanolic extracts from Chilean native plants and propolis. J. Apic. Res. 2018, 57, 522–535. [Google Scholar] [CrossRef]
  49. Saltykova, E.S.; Karimova, A.A.; Gataullin, A.R.; Gaifullina, L.; Matniyazov, R.T.; Frolova, M.A.; Albulov, A.I.; Nikolenko, A.G. The effect of high-molecular weight chitosans on the antioxidant and immune systems of the honeybee. Appl. Biochem. Microbiol. 2016, 52, 553–557. [Google Scholar] [CrossRef]
  50. Thongsong, B.; Suthongsa, S.; Pichyangkura, R.; Kalandakanond-Thongsong, S. Effects of chito-oligosaccharide supplementation with low or medium molecular weight and high degree of deacetylation on growth performance, nutrient digestibility and small intestinal morphology in weaned pigs. Livest. Sci. 2018, 209, 60–66. [Google Scholar] [CrossRef]
  51. Yousef, M.; Pichyangkura, R.; Soodvilai, S.; Chatsudthipong, V.; Muanprasat, C. Chitosan oligosaccharide as potential therapy of inflammatory bowel disease: Therapeutic efficacy and possible mechanisms of action. Pharmacol. Res. 2012, 66, 66–79. [Google Scholar] [CrossRef]
  52. Azagra-Boronat, I.; Rodríguez-Lagunas, M.J.; Castell, M.; Pérez-Cano, F.J. Chapter 14—Prebiotics for gastrointestinal infections and acute diarrhea. In Dietary Interventions in Gastrointestinal Diseases; Watson, R., Preedy, V., Eds.; Academic Press: Cambridge, MA, USA, 2019; pp. 179–191. [Google Scholar]
  53. Guan, G.; Azad, A.K.; Lin, Y.; Kim, S.W.; Tian, Y.; Liu, G.; Wang, H. Biological Effects and Applications of Chitosan and Chito-Oligosaccharides. Front. Physiol. 2019, 10, 516. [Google Scholar] [CrossRef] [Green Version]
  54. Kunanusornchai, W.; Witoonpanich, B.; Tawonsawatruk, T.; Pichyangkura, R.; Chatsudthipong, V.; Muanprasat, C. Chitosan oligosaccharide suppresses synovial inflammation via AMPK activation: An in vitro and in vivo study. Pharmacol. Res. 2016, 113, 458–467. [Google Scholar] [CrossRef]
  55. Zhang, C.; Jiao, S.; Wang, Z.A.; Du, Y. Exploring Effects of Chitosan Oligosaccharides on Mice Gut Microbiota in in vitro Fermentation and Animal Model. Front. Microbiol. 2018, 9, 2388. [Google Scholar] [CrossRef] [PubMed] [Green Version]
  56. Kurze, C.; Mayack, C.; Hirche, F.; Stangl, G.I.; Le Conte, Y.; Kryger, P.; Moritz, R.F.A. Nosema spp. infections cause no energetic stress in tolerant honeybees. Parasitol. Res. 2016, 115, 2381–2388. [Google Scholar] [CrossRef] [PubMed] [Green Version]
  57. Drescher, N.; Klein, A.-M.; Neumann, P.; Yañez, O.; Leonhardt, S.D. Inside Honeybee Hives: Impact of Natural Propolis on the Ectoparasitic Mite Varroa destructor and Viruses. Insects 2017, 8, 15. [Google Scholar] [CrossRef] [PubMed] [Green Version]
  58. Saltykova, E.S.; Gaifullina, L.R.; Kaskinova, M.; Gataullin, A.R.; Matniyazov, R.T.; Poskryakov, A.V.; Nikolenko, A.G. Effect of Chitosan on Development of Nosema apis Microsporidia in Honey Bees. Microbiology 2018, 87, 738–743. [Google Scholar] [CrossRef]
  59. Paris, L.; El Alaoui, H.; Delbac, F.; Diogon, M. Effects of the gut parasite Nosema ceranae on honey bee physiology and behavior. Curr. Opin. Insect Sci. 2018, 26, 149–154. [Google Scholar] [CrossRef]
  60. Higes, M.; García-Palencia, P.; Hernández, R.M.; Meana, A. Experimental infection of Apis mellifera honeybees with Nosema ceranae (Microsporidia). J. Invertebr. Pathol. 2007, 94, 211–217. [Google Scholar] [CrossRef] [PubMed]
  61. Suwannapong, G.; Maksong, S.; Seanbualuang, P.; Benbow, M.E. Experimental infection of red dwarf honeybee, Apis florea, with Nosema ceranae. J. Asia-Pacific Èntomol. 2010, 13, 361–364. [Google Scholar] [CrossRef]
  62. Suwannapong, G.; Yemor, T.; Boonpakdee, C.; Benbow, M.E. Nosema ceranae, a new parasite in Thai honeybees. J. Invertebr. Pathol. 2011, 106, 236–241. [Google Scholar] [CrossRef]
  63. Suwannapong, G.; Benbow, M.E.; Nieh, J.C. Biology of Thai honeybees: Natural history and threats. In Bees: Biology, Threats and Colonies; Florio, R.M., Ed.; Nova Science Publishers, Inc.: New York, NY, USA, 2011; pp. 1–98. [Google Scholar]
  64. Suwannapong, G.; Maksong, S.; Yemor, T.; Junsuri, N.; Benbow, M.E. Three species of native Thai honey bees exploit overlapping pollen resources: Identification of bee flora from pollen loads and midguts from Apis cerana, A. dorsata and A. florea. J. Apic. Res. 2013, 52, 196–201. [Google Scholar] [CrossRef]
  65. Aliferis, K.A.; Copley, T.; Jabaji, S. Gas chromatography–mass spectrometry metabolite profiling of worker honey bee (Apis mellifera L.) hemolymph for the study of Nosema ceranae infection. J. Insect Physiol. 2012, 58, 1349–1359. [Google Scholar] [CrossRef]
  66. Jack, C.J.; Uppala, S.S.; Lucas, H.M.; Sagili, R.R. Effects of pollen dilution on infection of Nosema ceranae in honey bees. J. Insect Physiol. 2016, 87, 12–19. [Google Scholar] [CrossRef] [PubMed] [Green Version]
  67. Chen, Y.; Evans, J.D.; Smith, I.B.; Pettis, J.S. Nosema ceranae is a long-present and wide-spread microsporidian infection of the European honey bee (Apis mellifera) in the United States. J. Invertebr. Pathol. 2008, 97, 186–188. [Google Scholar] [CrossRef]
  68. Chen, Y.P.; Evans, J.D.; Murphy, C.; Gutell, R.; Zuker, M.; Gundensen-Rindal, D.; Pettis, J.S. Morphological, Molecular, and Phylogenetic Characterization of Nosema ceranae, a Microsporidian Parasite Isolated from the European Honey Bee, Apis mellifera. J. Eukaryot. Microbiol. 2009, 56, 142–147. [Google Scholar] [CrossRef] [Green Version]
  69. Kurze, C.; Dosselli, R.; Grassl, J.; Le Conte, Y.; Kryger, P.; Baer, B.; Moritz, R.F. Differential proteomics reveals novel insights into Nosema–honey bee interactions. Insect Biochem. Mol. Biol. 2016, 79, 42–49. [Google Scholar] [CrossRef]
  70. Malone, L.; Giacon, H.A.; Newton, M.R. Comparison of the responses of some New Zealand and Australian honey bees (Apis mellifera L) to Nosema apis Z. Apidologie 1995, 26, 495–502. [Google Scholar] [CrossRef] [Green Version]
  71. Cantwell, G.E. Standard method for counting Nosema spores. Am. Bee J. 1970, 110, 222–223. [Google Scholar]
  72. Fries, I.; Chauzat, M.-P.; Chen, Y.-P.; Doublet, V.; Genersch, E.; Gisder, S.; Higes, M.; McMahon, D.P.; Martín-Hernández, R.; Natsopoulou, M.; et al. Standard methods for Nosema research. J. Apic. Res. 2013, 52, 1–28. [Google Scholar] [CrossRef] [Green Version]
  73. Higes, M.; Martín-Hernández, R.; Garrido-Bailón, E.; García-Palencia, P.; Meana, A. Detection of infective Nosema ceranae (Microsporidia) spores in corbicular pollen of forager honeybees. J. Invertebr. Pathol. 2008, 97, 76–78. [Google Scholar] [CrossRef] [PubMed]
  74. Bradford, M.M. A rapid and sensitive method for the quantitation of microgram quantities of protein utilizing the principle of protein-Dye binding. Anal. Biochem. 1976, 72, 248–254. [Google Scholar] [CrossRef]
  75. Suwannapong, G.; Chaiwongwattanakul, S.; Benbow, M.E. Histochemical Comparison of the Hypopharyngeal Gland in Apis cerana Fabricius, 1793 Workers and Apis mellifera Linnaeus, 1758 Workers. Psyche A J. Èntomol. 2010, 2010, 1–7. [Google Scholar] [CrossRef] [Green Version]
  76. Suwannapong, G.; Seanbualuang, P.; Wongsiri, S. A histochemical study of the hypopharangeal glands of the dwarf honey bees Apis andreniformis and Apis florea. J. Apic. Res. 2007, 46, 260–263. [Google Scholar] [CrossRef]
Figure 1. A box plot with the lines representing the median levels of hemolymph trehalose across the treatment groups of the propolis extract experiment. The control bees (CO-0P) (grey), propolis control bees (CO-50P) (green), N. ceranae-infected bees not treated with propolis extract (NO-0P) (red) and infected bees treated with 50% propolis extract (NO-50P) (light green) are represented by each box plot. The hemolymph trehalose levels are measured on 14 days p. i. The box indicates the inter-quartile range while the vertical bars indicate the range of the data. The different letters above each box represent significant differences (Kruskal–Wallis test: χ2 = 34.52, df = 3, p < 0.0001).
Pathogens 10 00785 g001
Figure 2. A box plot showing the median hemolymph trehalose levels data across treatments from the COS experiment. The control bees not treated (CO-0COS) (grey), the treated COS control bees (CO-0.5COS) (purple), N. ceranae-infected bees not treated (NO-0COS) (red) and the infected bees treated with 0.5 ppm (NO-0.5COS) (light blue) are each indicated by a box plot. The hemolymph trehalose levels were measured on day 14 p.i.. The boxes indicate the interquartile range, while the vertical bars represent the range of the data. The different letters above each box plot represent significant differences (Kruskal–Wallis test: χ2 = 33.21, df = 3, p < 0.0001).
Pathogens 10 00785 g002
Figure 3. A box plot showing the median levels of hypopharyngeal gland protein contents across the treatments from the propolis extract experiment: control bees (CO-0P) (grey), control bees treated with propolis extract (CO-50P) (green), N. ceranae-infected bees not treated with propolis (NO-0P) (red) and infected bees treated with 50% propolis extract (NO-50P) (light green). The hypopharyngeal gland protein content was measured 14 days p.i. The boxes indicate the interquartile range, while the vertical bars indicate the range of the data. The different letters above each box plot represent significant differences (Kruskal–Wallis test: χ2= 31.75, df = 3, p < 0.0001).
Pathogens 10 00785 g003
Figure 4. A box plot showing the median hypopharyngeal gland protein content levels from the COS experiment. The following treatments are shown with each box plot: control bees not treated with COS (CO-0COS) (grey), control bees treated with 0.5 ppm COS (CO-0.5COS) (purple), N. ceranae-infected bees not treated with COS (NO-0COS) (red) and infected bees treated with 0.5 ppm of COS (NO-0.5COS) (light blue). The hypopharyngeal gland was measured on day 14 p.i. The boxes represent interquartile ranges, while the vertical bars indicate the range of the data. The different letters above the box plots represent significant differences (Kruskal–Wallis test: χ2= 31.39, df = 3, p < 0.0001).
Pathogens 10 00785 g004
Figure 5. A box plot showing the median acini diameters across the treatments for the propolis extract and COS experiments. Each box plot represents a treatment: A. dorsata infected with N. ceranae dosages 106 spores per bee without any treatment (NO) (red), N. ceranae-infected bees treated with propolis extract (NO-50P) (light green), N. ceranae-infected bees treated with 0.5 ppm COS (NO-0.5COS) (light blue), control bees without any treatment (CO) (grey), control bees treated with 0.5 ppm COS (CO-0.5COS) (purple), and control bees treated with 50% propolis extract (CO-50P) (green). The boxes indicate interquartile ranges, while the vertical bars represent the range of the data. The different letters above each box plot represents significant differences (Kruskal–Wallis test: χ2 = 33.09, df = 5, p < 0.0001).
Pathogens 10 00785 g005
Figure 6. Histology cross sections of the hypopharyngeal gland of A. dorsata worker: (a) the completely developed secretory units of the glands on 14 dpi of control bees (CO). The secretory cells contain secretory granules surrounded the large nuclei of the secretory cells; (b) a section of the hypopharyngeal gland of CO bees with the high magnification of light microscope, the cytoplasm of the secretory cell is seen to contain variable numbers of secretory vesicles (stained red-pink with PAS). The oval nuclei are stained greenish with light green. Abbreviations: ac, acinus; hp, hypopharyngeal gland; md, mandibular gland; n, nucleus; op, optic lobe; vs, secretory vesicle.
Pathogens 10 00785 g006
Figure 7. A section of the hypopharyngeal gland of 106 N. ceranae-infected A. dorsata worker (a) on 14 dpi of 106 N. ceranae-infected bees (NO), the cell cytoplasm contains variable numbers of secretory granules stained red-pink with PAS. The large oval loose nuclei are stained greenish from a light green dye used as a counterstain; (b) A medial section of NO bees on 14 dpi, the secretory cell contains secretory granules surround the large nuclei of the secretory cells. Abbreviations: ac, acinus; n, nucleus; sd, secretory duct; vs, secretory vesicle.
Pathogens 10 00785 g007
Figure 8. The light micrographs of: (a) A section of the hypopharyngeal glands of 106 N. ceranae-infected bees on14 dpi, treated with 50% propolis (NO-50P). The cytoplasm of the secretory cell contains variable numbers of secretory granules stained red-pink with PAS. The oval nuclei are stained a greenish color from light green; (b) with higher magnification of NO-50P shows the secretory cell contains several secretory vesicles with negative staining using PAS, and also contains secretory vesicles with smaller amounts of carbohydrate, which are characterized by a red-pink color from PAS staining. Abbreviations: ac, acinus; co, compound eyes; hp, hypopharyngeal gland; md, mandibular gland; n, nucleus; op, optic lobe; vs, secretory vesicle.
Pathogens 10 00785 g008
Figure 9. (a) A cross section of the hypopharyngeal gland from 106 N. ceranae-infected A. dorsata bees on 14 dpi that were treated with 0.5 ppm COS (NO-0.5COS). The cytoplasm of the secretory cells contains variable numbers of secretory granules stained red-pink with PAS. The oval nuclei are stained greenish from a light green; (b) a medial cross section of the hypopharyngeal gland from 106 N. ceranae-infected A. dorsata bees on 14 dpi that were treated with 0.5 ppm COS (NO-0.5COS). Abbreviations: ac, acinus; hp, hypopharyngeal gland; md, mandibular gland; n, nucleus; op, optic lobe; vs, secretory vesicle.
Pathogens 10 00785 g009
Figure 10. Kaplan–Meier survivorship curves of A. dorsata workers after being infected with 106 N. ceranae spores (NO-0P), versus infected bees that received a propolis treatment (NO-50P) or no infection and a propolis treatment (control: CO-0P and CO-50P). Survivorship curves with different letters within treatments are significantly different (Kruskal–Wallis test: χ2 = 17.33, df = 3, p = 0.0005).
Pathogens 10 00785 g010
Figure 11. Kaplan–Meier survivorship curves of A. dorsata workers after N. ceranae infection at 106 spores (NO-0COS), NO-0.5COS or no infection (control: CO-0COS and CO-0.5COS). Survivorship curves with different letters within treatments are significantly different (Kruskal–Wallis test: χ2 = 16.08, df = 3, p = 0.0010).
Pathogens 10 00785 g011
Publisher’s Note: MDPI stays neutral with regard to jurisdictional claims in published maps and institutional affiliations.

