Article

Combined Therapy of Chitosan and Exercise Improves the Lipid Profile, Adipose Tissue and Hepatic Alterations in an In Vivo Model of Induced-Hyperlipidemia

by
João P. G. Passos
1,
Carlisson R. Melo
1,
Felipe M. A. Carvalho
1,
Patricia Severino
1,
Juliana C. Cardoso
1,
John L. S. Cunha
2,
Amanda Cano
3,4,
Eliana B. Souto
3,5,6,* and
Ricardo L. C. de Albuquerque-Júnior
1,*
1
Institute of Technology and Research (ITP), University of Tiradentes, Aracaju 49010-390, Sergipe, Brazil
2
Post-Graduating Program in Stomatopathology, University of Campinas, Campinas 13083-970, São Paulo, Brazil
3
Department of Pharmacy, Pharmaceutical Technology and Physical Chemistry, Faculty of Pharmacy and Food Sciences, University of Barcelona, Av. Joan XXIII, 27-31, Campus Diagonal, 08028 Barcelona, Spain
4
Institute of Nanoscience and Nanotechnology (IN2UB), University of Barcelona, Av. Joan XXIII, 27-31, Campus Diagonal, 08028 Barcelona, Spain
5
Department of Pharmaceutical Technology, Faculty of Pharmacy of University of Porto (FFUP), Rua Jorge de Viterbo Ferreira 228, 4050-313 Porto, Portugal
6
REQUIMTE/UCIBIO, Faculty of Pharmacy, University of Porto (FFUP), Rua Jorge de Viterbo Ferreira 228, 4050-313 Porto, Portugal
*
Authors to whom correspondence should be addressed.
Nutraceuticals 2022, 2(2), 116-131; https://doi.org/10.3390/nutraceuticals2020009
Submission received: 27 February 2022 / Revised: 6 June 2022 / Accepted: 7 June 2022 / Published: 9 June 2022
(This article belongs to the Special Issue Functional Foods as a New Therapeutic Strategy)

Abstract

:
Obesity is a prevalent public health concern in several countries, and is closely associated with several pathological disorders, including diabetes, hypertension, cardiovascular diseases, and increased dyslipidemia. Dyslipidemia is an asymptomatic condition characterized by high levels of low-density lipoproteins (LDL) and low levels of high-density lipoproteins (HDL), leading to the increased risk of ischemic heart disease. As lipid disorders are strongly associated with lifestyle and diet, in this work we have evaluated the effect of associating chitosan and exercise on the improvement of the lipid profile of high-fat diet-fed rats. Animals were submitted orally to hypercaloric diets based on liquid butter at 1 mL/100 g to induce a hyperlipidemic state for 8 weeks (as shown by body weight and measures of the Lee obesity index). After 8 weeks, the 40 rats were separated into five groups (n = 8) and adapted to different treatment strategies: physical exercise and/or treatment with chitosan (at a concentration of 2%). The hyperlipidemic group exhibited altered levels of glucose and hepatic enzymes, i.e., aspartate aminotransferase (AST) and alanine aminotransferase (ALT). The treatment with chitosan over 8 weeks significantly reduced the bodyweight of the animals, reaching values lower than the control group. Exercise reduced the Lee obesity index values of all the treated groups compared to non-treated rats. The concentration of total cholesterol, triglycerides, LDL, and VLDL was significantly reduced at the end of the study to healthy thresholds. The hepatic parenchyma of hyperlipidemic animals was recovered to show normal morphology when treated with chitosan; improved histological features (ca. 20–30% of parenchymal cells) could be achieved with physical exercise. In conclusion, oral administration of chitosan associated with physical exercise had a hypolipidemic effect in a model of dyslipidemia in rodents, showing decreased levels of total cholesterol, triglycerides, LDL-c, VLDL-c, glucose, and liver enzymes (AST and ALT). Our results are attributed to the synergism between the administration of chitosan and physical exercise that helps to reduce oxidative stress.

1. Introduction

Current lifestyle habits promote an unfavorable condition in the individual’s overall health status with an increased risk of metabolic diseases [1,2]. The health–disease relationship is directly associated with the type and amount of fat contained in the diet and an inactive posture that characterizes a sedentary lifestyle, significantly contributing to the establishment of a positive energy imbalance [3,4]. More than 80% of adolescents aged between 11 and 17 years old do not follow the recommendations of the World Health Organization (WHO) about physical exercise for health improvement and, although the prevalence of physical inactivity varies greatly worldwide, about 80% of some adult populations [5] do not follow the recommendations.
A sedentary lifestyle and inadequate diet are environmental risk factors which, combined with individual factors (age, sex, education, genetic characteristics) [6,7,8,9], determine the onset of chronic diseases, including dyslipidemia [6]. Dyslipidemias are changes in serum levels of lipoproteins and present a significant public health concern due to their direct relationship with cardiovascular diseases [10,11]. These diseases are significant causes of mortality in both developed and developing countries, increasing the social and economic burden of health care systems [12,13,14,15,16].
The prevalence of dyslipidemia was found to be significantly higher in men than in women [17], but a higher prevalence of dyslipidemia components was reported for postmenopausal women [10]. Other studies demonstrate the trend of a higher lipid profile for men, which is associated with a higher risk of cardiovascular diseases when compared to women with the same lifestyle [18]. Food content directly influences plasma levels of triglycerides [19]. Guerra et al. (2007) [20] evaluated the effects of diet, serum lipids, and body weight in exercised rats. The authors observed that the intensity and time of physical exercise influenced high-density lipoprotein (HDL)-cholesterol (HDL-c) levels more acutely than the levels of triglycerides. Furthermore, a high-fat diet should follow a 14% change in lipid parameters and the use of the lipid substrate as a resource ergogenic.
The beneficial effects of healthy eating habits and physical exercise on dyslipidemia were demonstrated in the work by Mann et al. (2014) [21], in which serum levels of total cholesterol and low-density lipoprotein (LDL)-cholesterol (LDL-c) were reduced for individuals who performed physical exercise. On the other hand, total cholesterol, LDL-c, and weight had lower levels for the group submitted to physical exercise and to a specific diet, with an increase in HDL-c for this group as well. These results point out to the importance of the association between exercise and diet, optimizing changes in the lipoprotein profile.
The acute or chronic effect of aerobic exercise can improve the lipoprotein profile, stimulating a better functioning of the enzymatic processes involved in lipid metabolism, favoring the increase in HDL-c levels, and also modifying the chemical composition of LDL-c, making them the least atherogenic [21]. However, the association of diet and loss of body mass to aerobic exercise seems to be essential to obtaining an optimal lipid profile [22]. Hypocholesterolemic substances have been frequently used to decrease body mass and control hypercholesterolemia [23].
It is worth mentioning that cholesterol comes from two main sources, namely, from diet and from endogenous production [24]. Dietary cholesterol can be found free or esterified, while the latter needs to be de-esterified to be absorbed. For this absorption to occur, emulsification is necessary through the action of bile salts, fatty acids, and phospholipids, among others, forming the chylomicrons that will reach the bloodstream. The administration of substances capable of inhibiting the absorption of lipids has contributed to the control of serum cholesterol levels [25]. Although several studies report the effect of different treatment strategies with the use of lipid-lowering substances and different isolated diets [26,27,28,29,30,31], or just the practice of physical exercise on the plasma lipoprotein profile [9,32,33,34,35], the simultaneous approach to nutrition and physical exercise is important, as it encompasses a significant lifestyle change. A lifestyle change is also important in reducing the use of natural substances or lipid-lowering drugs needed to control dyslipidemia and, consequently, to prevent cardiovascular diseases [26].
In this process, polysaccharides can act by sequestering bile salts [24]. The viscosity and molecular weight of polysaccharides directly affect the aggregates formed in the intestinal lumen due to the ability to thicken and/or form gels enhanced by physical tangles, which, dependent on the monomeric units that make up the polysaccharide, benefit the non-internalization of cholesterol dietary [24]. Examples of polysaccharides are β-glucans, galactomannans, glucomannans, arabinoxylans, pectin, alginate, and chitosan. The latter is a linear polysaccharide composed of D-glucosamine and N-acetyl-D-glucosamine linked to positively charged β(1-4), which allows more efficient binding with bile salts that are negatively charged in the intestinal lumen [36,37,38,39,40].
It has already been reported that chitosan has hypocholesterolemic effects both in humans and in animals [41,42,43,44,45], behaving as an indigestible dietary fiber in the presence of mammalian enzymes from the gut [46]. The mechanism behind its beneficial effects for lipid metabolic disorders has however not been fully described. Tong et al. (2020) [47] demonstrated that Ganoderma lucidum polysaccharide and chitosan synergistically reduced hyperlipidemia in high-fat diet (HFD)-fed hamsters by lowering the contents of serum total triglycerides, total cholesterol, LDL-c, and aspartate aminotransferase (AST). The authors stressed that chitosan could even modify the composition of the gut microbiota with increased levels of beneficial bacteria, including those producing short-chain fatty acids.
Chiu et al. (2019) [46] compared the effect of chitosan of different molecular weights on cholesterol regulation in HFD-fed rats. This study confirmed chitosan of both high and low molecular weight could reduce hypercholesterolemia effectively by means of the activation of the hepatic AMPKα and PPARα cholesterol-modulators, inhibiting cholesterol-modulators in the intestine (ACAT2) and also modulating downstream LDLR and CYP7A1 signals. In this work, we evaluated the effect of a therapy combining chitosan and exercise on the lipid profile, adipose, and hepatic tissue, using an in vivo model of induced-hyperlipidemia.

2. Materials and Methods

2.1. Animals

Male rats of the Wistar lineage (45 days old, 220 ± 20 g) (n = 40) from the animal facility of Tiradentes University (Aracaju, Sergipe, Brazil) were used. The animals were kept under standardized conditions, with a 12 h light–dark cycle, treated with balanced feed and water ad libitum, with a temperature of 20 ± 4 °C and relative humidity of 70 ± 5%. The project was approved by the Research Ethics Committee of Tiradentes University under the embodied opinion number 060209-1.

2.2. Hyperlipidemia Induction

The liquid butter (bottle butter) used in the hyperlipidemia induction procedure was purchased at the Municipal Market of Aracaju, sold by one of the stores specializing in dairy products from family farms in the municipality of Glória (Sergipe, Brazil).

2.3. Chitosan

Low molecular weight chitosan (80 kDa) was purchased from the manufacturer Quimer Herbal (São Paulo, Brazil) as powdered crustacean fiber and distributed by Embrafarma Produtos Químicos e Farmacêuticos LTDA (São Paulo, Brazil), original batch: 029/3368.

2.4. Hyperlipidemia Induction Procedure

Of the 40 animals, 32 underwent an experimental process of induction of hyperlipidemia as described by Pan et al. (2016) [38]. These animals (45 days old) received the administration of liquid butter (1 mL/100 g of body weight) orally (gavage), to supplement the standard diet, developing a condition of hyperlipidemia for 8 weeks. This high-fat diet was administered from weaning onwards, continued for 8 weeks. The remaining 8 animals received a standard diet (NUVILAB® chow, Seoul, Korea) and distilled water orally (gavage) without the introduction of liquid butter (normolipidic diet) during the same period. NUVILAB® standard feed is composed of: calcium carbonate, corn, soybean, wheat bran, dicalcium phosphate, sodium chloride, mineral, amino acid premix, and an antioxidant additive. Confirmation of the hyperlipidemic state of the animals was performed by analyzing the serum lipid compositions (triglycerides, total cholesterol, high-density lipoproteins (HDL-c), low-density lipoproteins (LDL-c), and very low-density lipoprotein (VLDL-c)) and the blood glucose of the animals 8 weeks after induction.

2.5. Treatment Phase

Eight weeks after the hyperlipidemia induction phase, the 40 animals were separated into five groups (n = 8) and submitted to different treatment strategies: physical exercise, treatment with administration of chitosan, and the combination of both (Table 1).

2.5.1. Physical Training

The animals participated in aerobic physical exercises of light to moderate intensity, based on the adapted swimming training protocol as described by Dos Reis et al. (2018) [48]. The exercises were performed in tanks 100 cm deep by 60 cm wide and 80 cm long, with controlled temperatures between 28–32 °C. Initially, the animals were submitted to a period of adaptation to the liquid environment for one week, in which the time of sessions and the workload (caudal weight) were gradually increased until reaching that stipulated in the protocol. Work overload was up to 2% of body mass. The overload model was determined by using lead weights tied to the animal’s tail with a pre-defined mass from the weekly measurement of the animals’ body mass. The exercise took place in 45 min sessions with overload, 5 days a week, for 8 weeks.

2.5.2. Chitosan Treatment

For the use of chitosan, a solution in acetic acid 0.5 mol/L at a concentration of 2% was prepared, which was homogenized and made available for use. Gonçalves et al. (2017) [49] demonstrated that 2% chitosan in acetic acid has a high viscosity, as recommended for the oral sequestering of bile salts. The animals in the Hyp–Ch and Hyp–ChEx groups received 1 mL of the chitosan solution (corresponding to 20 mg of this product per animal) by oral gavage for 8 weeks. The other groups received 1.5 mL of water, replacing chitosan throughout the experiment, so that non-treated animals were subjected to similar stress procedures and conditions.

2.6. Assessment of Body Mass and Lee’s Obesity Index

All animals were subjected to measurement of body mass at the beginning of the experiment, at the end of the induction phase, and at the end of the treatment phase, always at the same morning time, using a digital scale (Marte®, model AS2000C, São Paulo, Brazil). The gain in body mass at the end of the treatment phase was determined by the following equation:
B W G = W i W f W i × 100
where BWG is the body weight gain, Wi is the initial weight, and Wf is the final weight. The Lee’s Obesity Index (LOI) was determined according to the following equation:
L O I = B W 3 N a L
where LOI is the Lee obesity index, BW is the body weight (g), and NaL is the nasoanal length (cm).

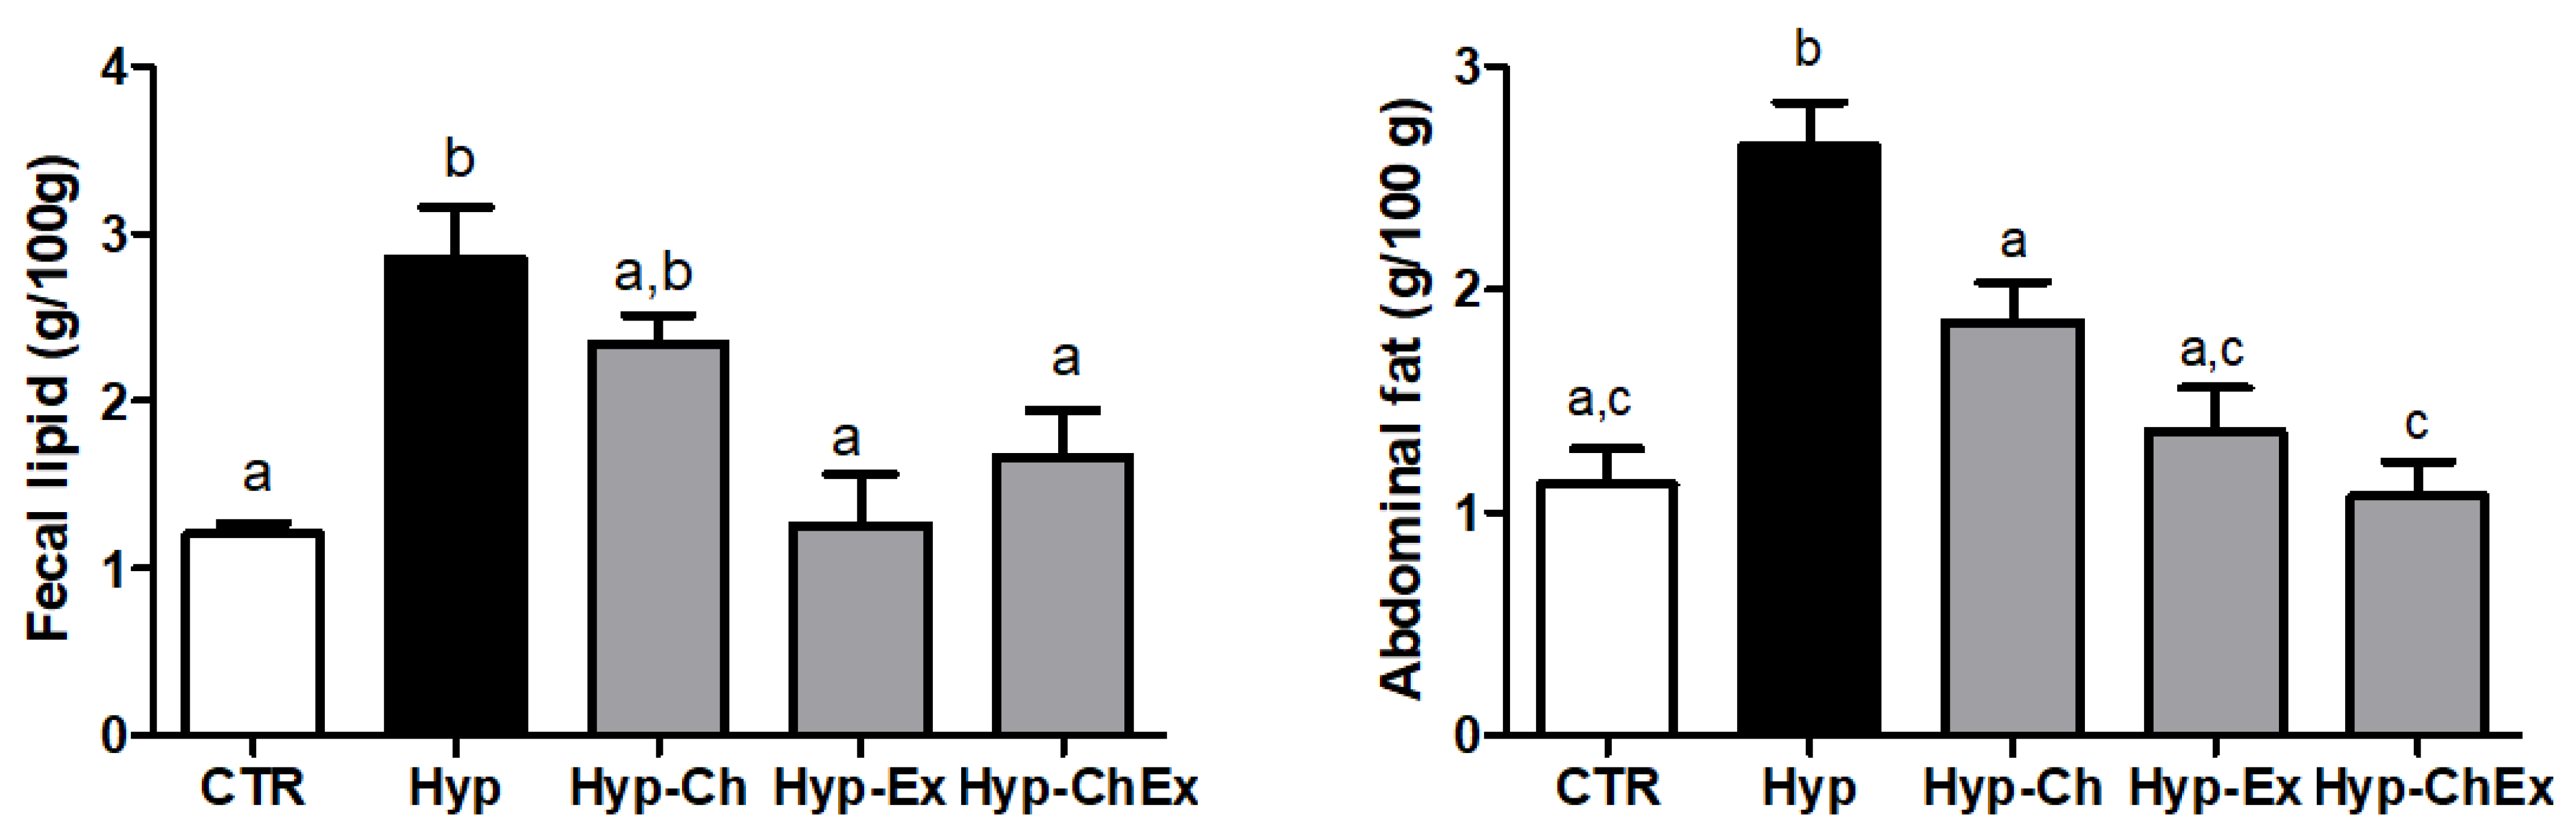
2.7. Determination of Lipid Percentage in Feces

Samples of 2 g of feces were collected using a spatula, weighed and submitted to extraction using petroleum ether in a Soxhlet type extractor. After 4 h of extraction, the solvent was recovered and the glass flask was weighed. The mass of lipids in the sample was calculated by the difference between the mass of the empty container and that obtained after the extraction and elimination of the solvent, with the results were expressed as the percentage.

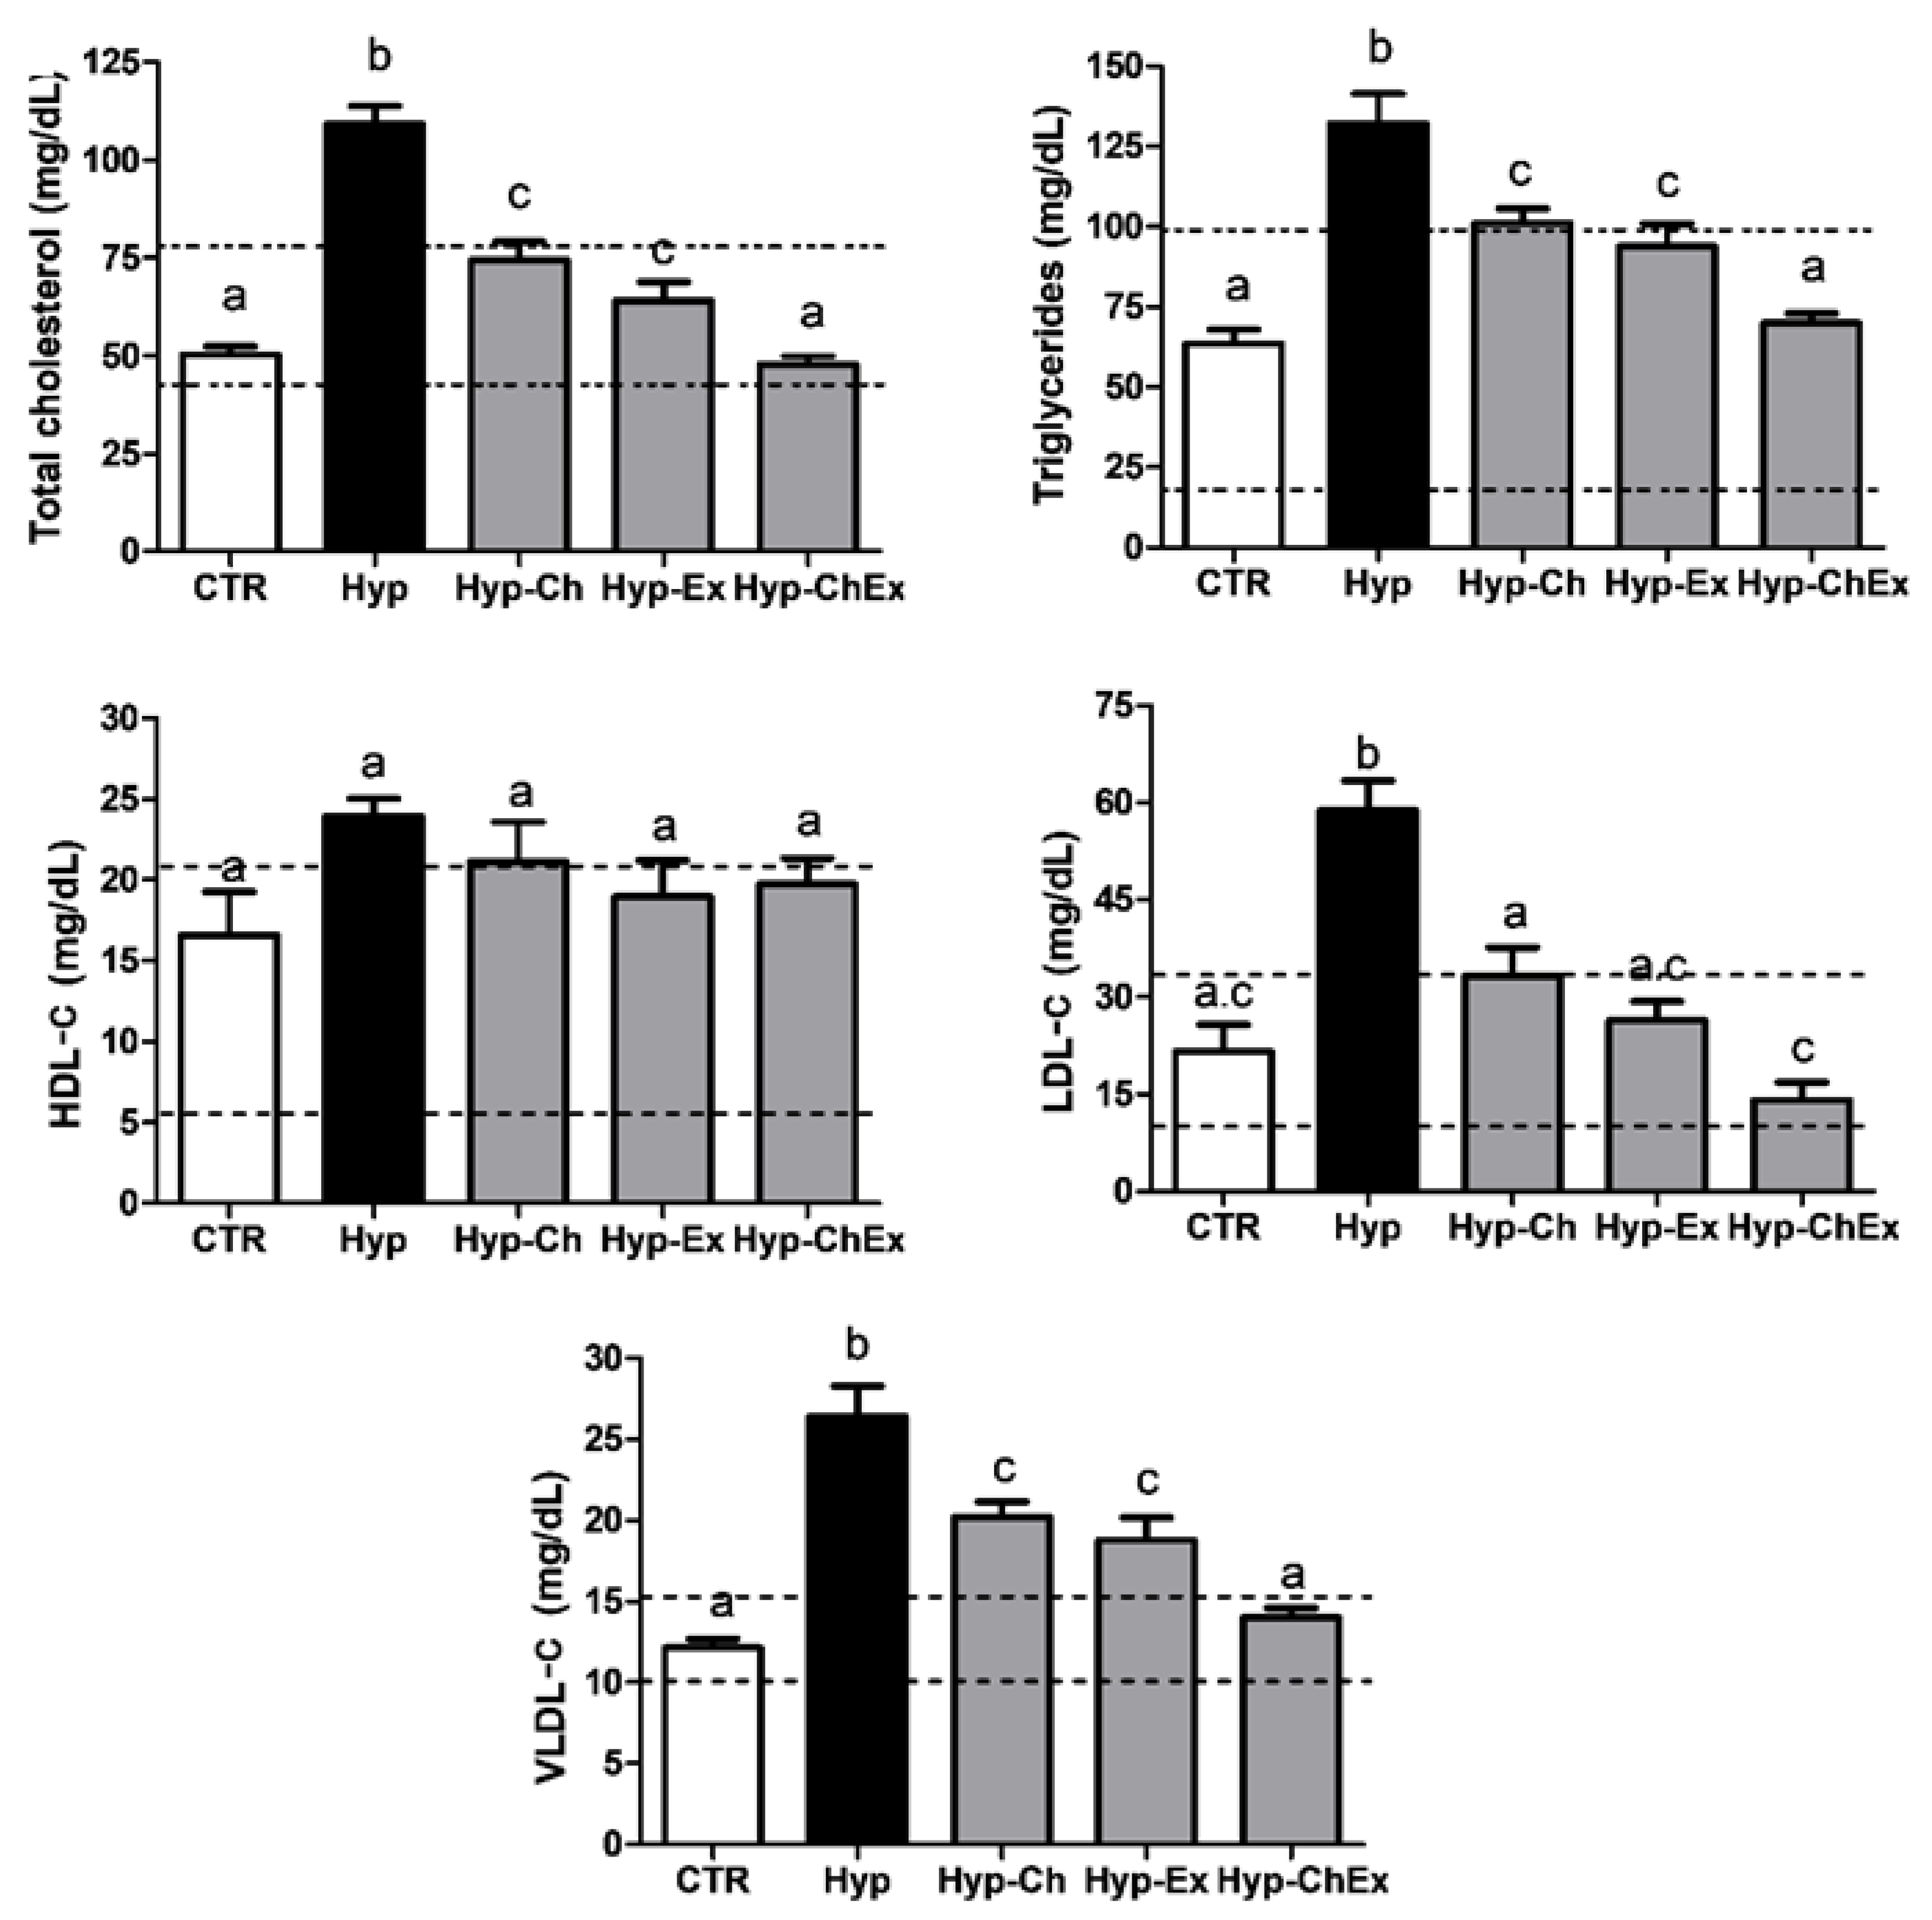
2.8. Biochemical Analysis of Serum Lipid Concentrations

To obtain the serum, the animals were first anesthetized with 3% isofuran by inhalation, and blood samples were then collected by cardiac puncture using complete ether anesthesia and centrifuged at 3000× g for 10 min. Serum was stored in a freezer until the time of biochemical analysis. Triglycerides and cholesterol were measured with Trinder enzyme kits (Labtest, Belo Horizonte, MG, Brazil). This test is based on the hydrolysis of cholesteryl esters by cholesterol esterase to form free cholesterol and fatty acid. Subsequently, the cholesterol is oxidized to cholest-4-en-one and hydrogen peroxide which, in the presence of peroxidase and hydrogen peroxide, phenol, and 4-amino antipyrine, form antipyrylquinonimine that can be measured in a spectrophotometer at 500 nm. The color intensity is directly proportional to the cholesterol concentration in the sample. HDL-c was determined after precipitation of VLDL-c and LDL-c with phosphotungstic acid and magnesium chloride. VLDL-c and LDL-c concentrations were calculated using the Friedewald equation:
LDL = Total   Cholesterol ( HDL + VLDL ) ,   where   VLDL = Triglycerides 5

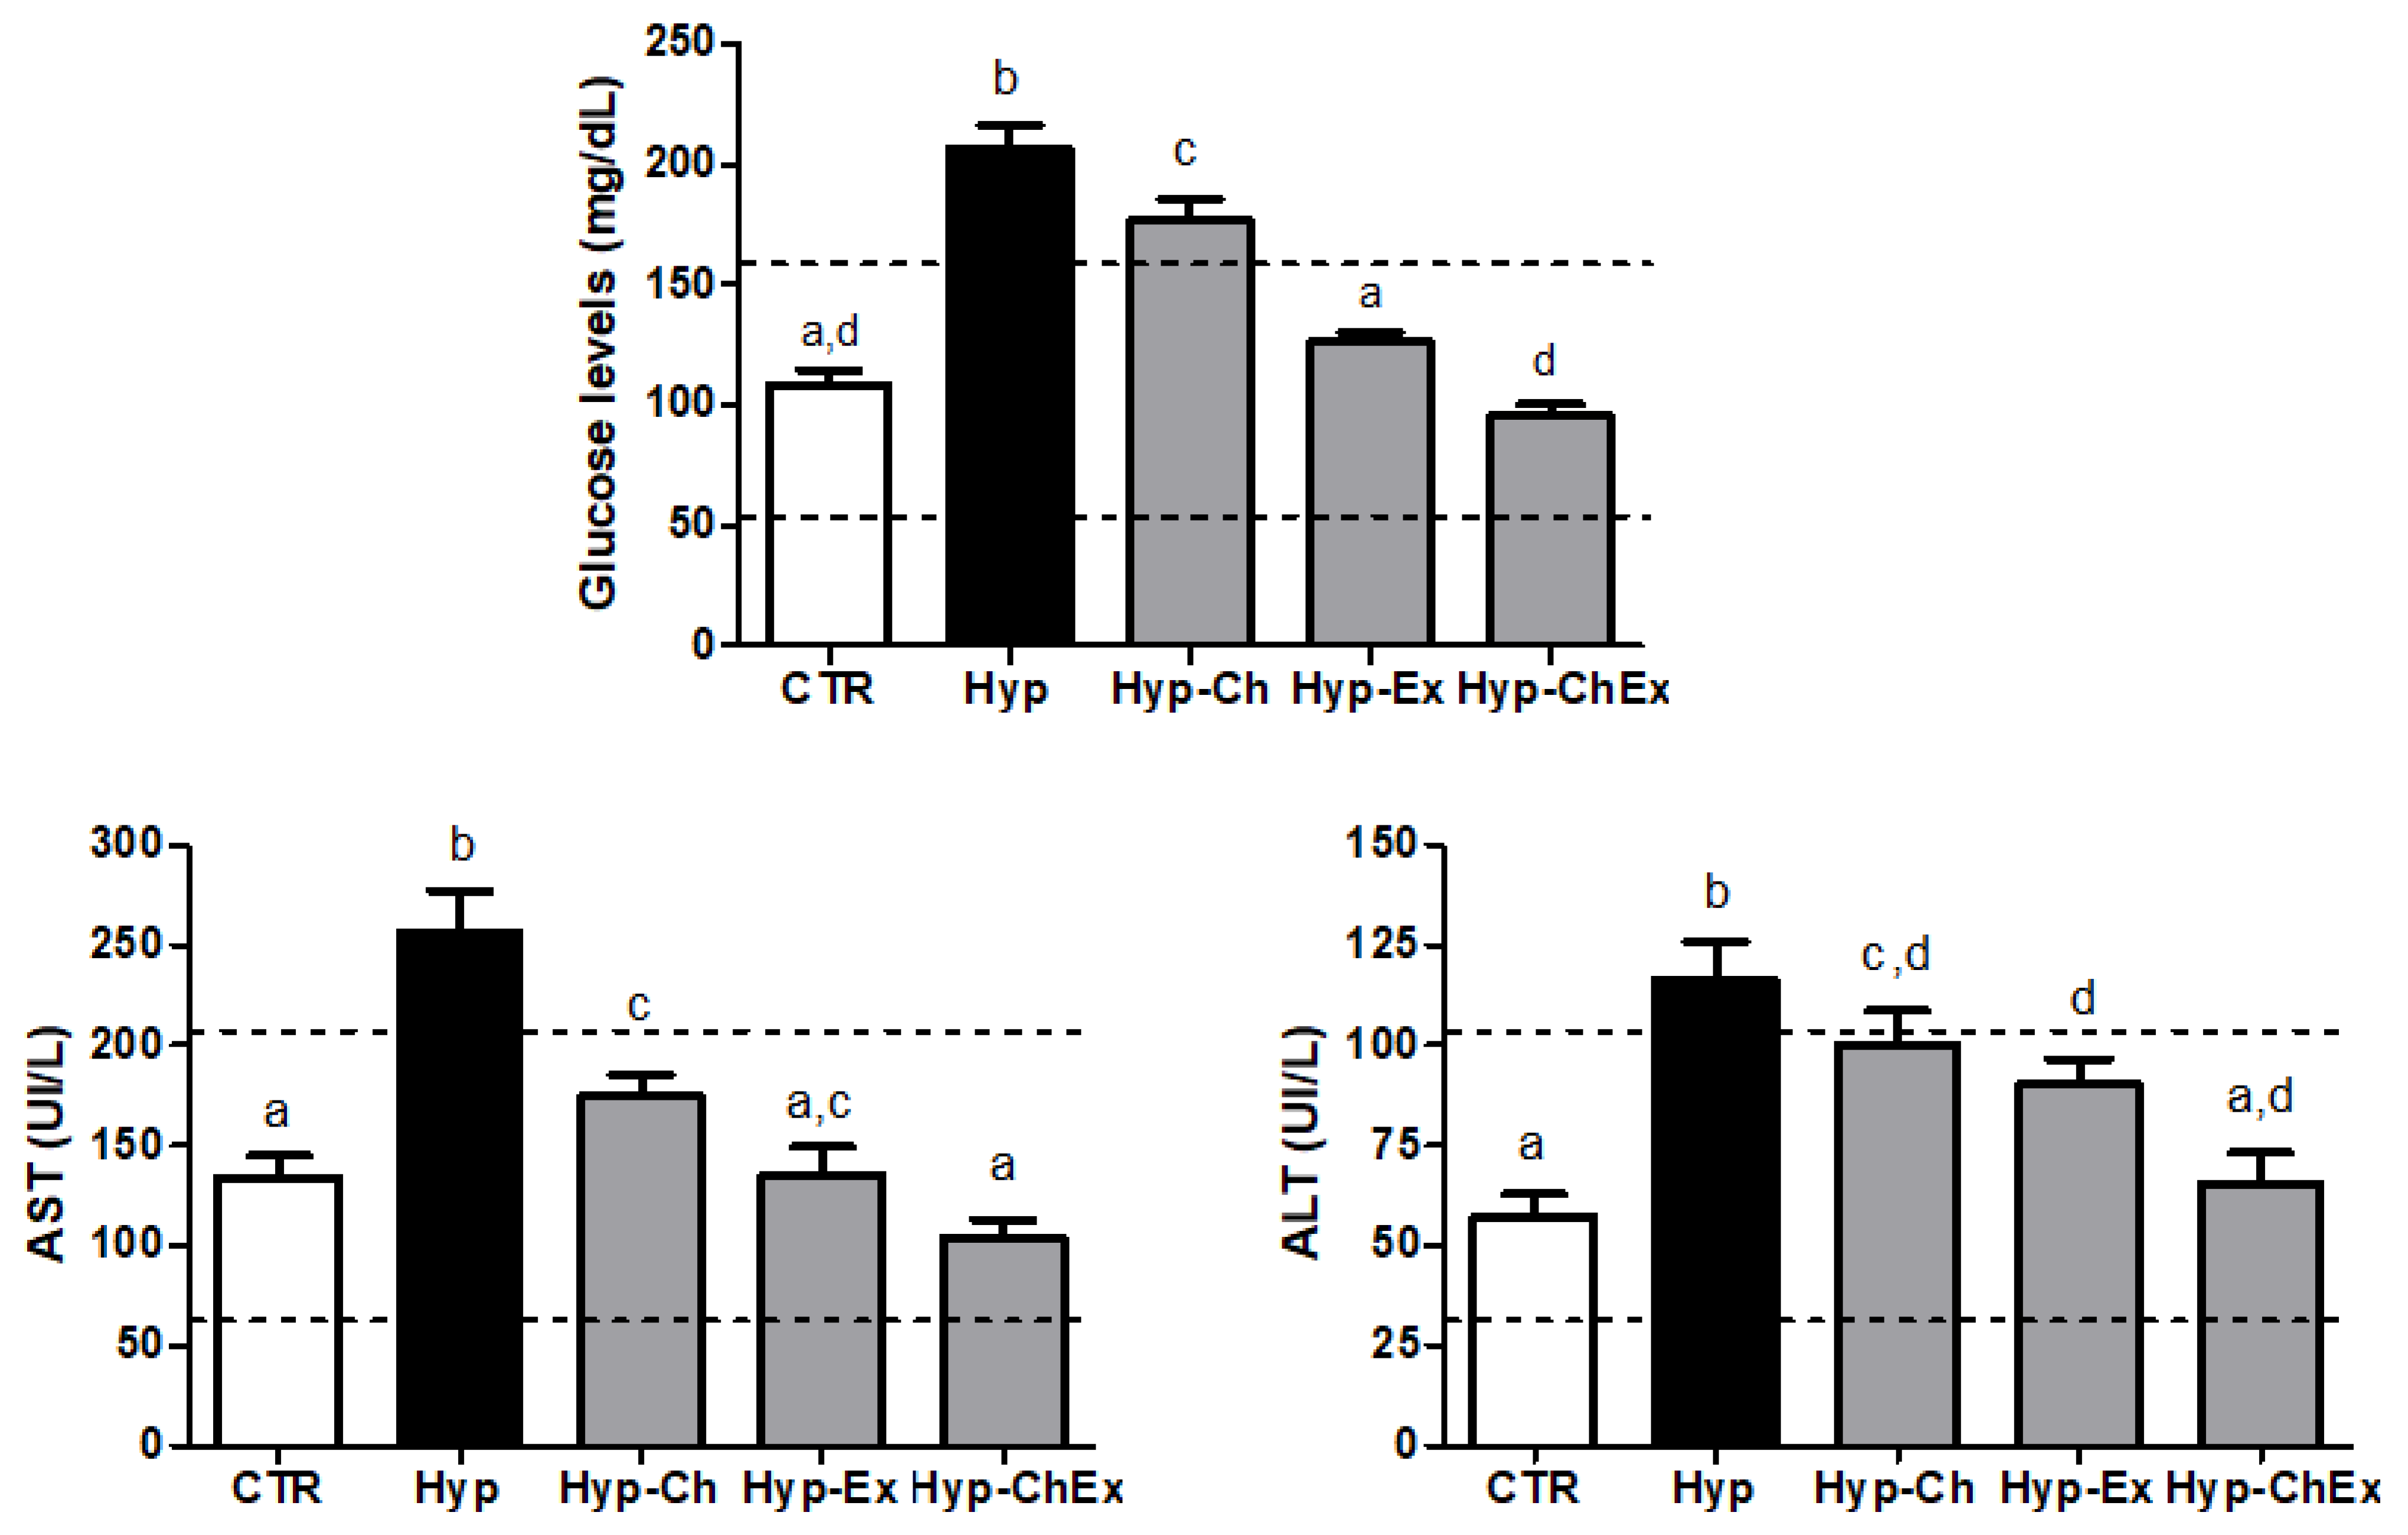
2.9. Biochemical Analysis of Liver Enzyme and Glucose Dosages

Serum levels of liver enzymes (aspartate aminotransferase (AST) andalanine aminotransferase (ALT)) and glucose in serum samples were measured by the enzymatic method using commercial kits from Biorex Diagnostics (Antrim, UK) in a Roche Hitachi 911 Chemistry Analyzer (Ramsey, MN, USA).

2.10. Animal Euthanasia

After the eight weeks of treatment, the animals fasted overnight (12 h) and were then submitted to the procedure of euthanasia by anoxia in carbon dioxide chambers (model CGSCO2G, Beira-Mae, Aracaju, SE, Brazil), with 100% CO2 (Bonther, Ribeirão Preto, São Paulo, Brazil, flow rate of 1–3 L/min) for 15 min. Lack of breathing and the fading of eye color were used to certify death. All animals were euthanized at the same time of day, after blood collection, following the same fasting period. The animal experiments were approved by the Research Ethics Committee of Universidade Tiradentes under the embodied opinion number 060209-1.

2.11. Assessment of Abdominal Adipose Tissue Weight

The assessment of abdominal adipose tissue Weight (AATW) was evaluated by weighing the subcutaneous and visceral adipose tissues. The weights of these two tissues were combined to form the ex vivo abdominal fat weight, which was expressed as the ratio of AATW and the bodyweight of each animal (wt/wt).

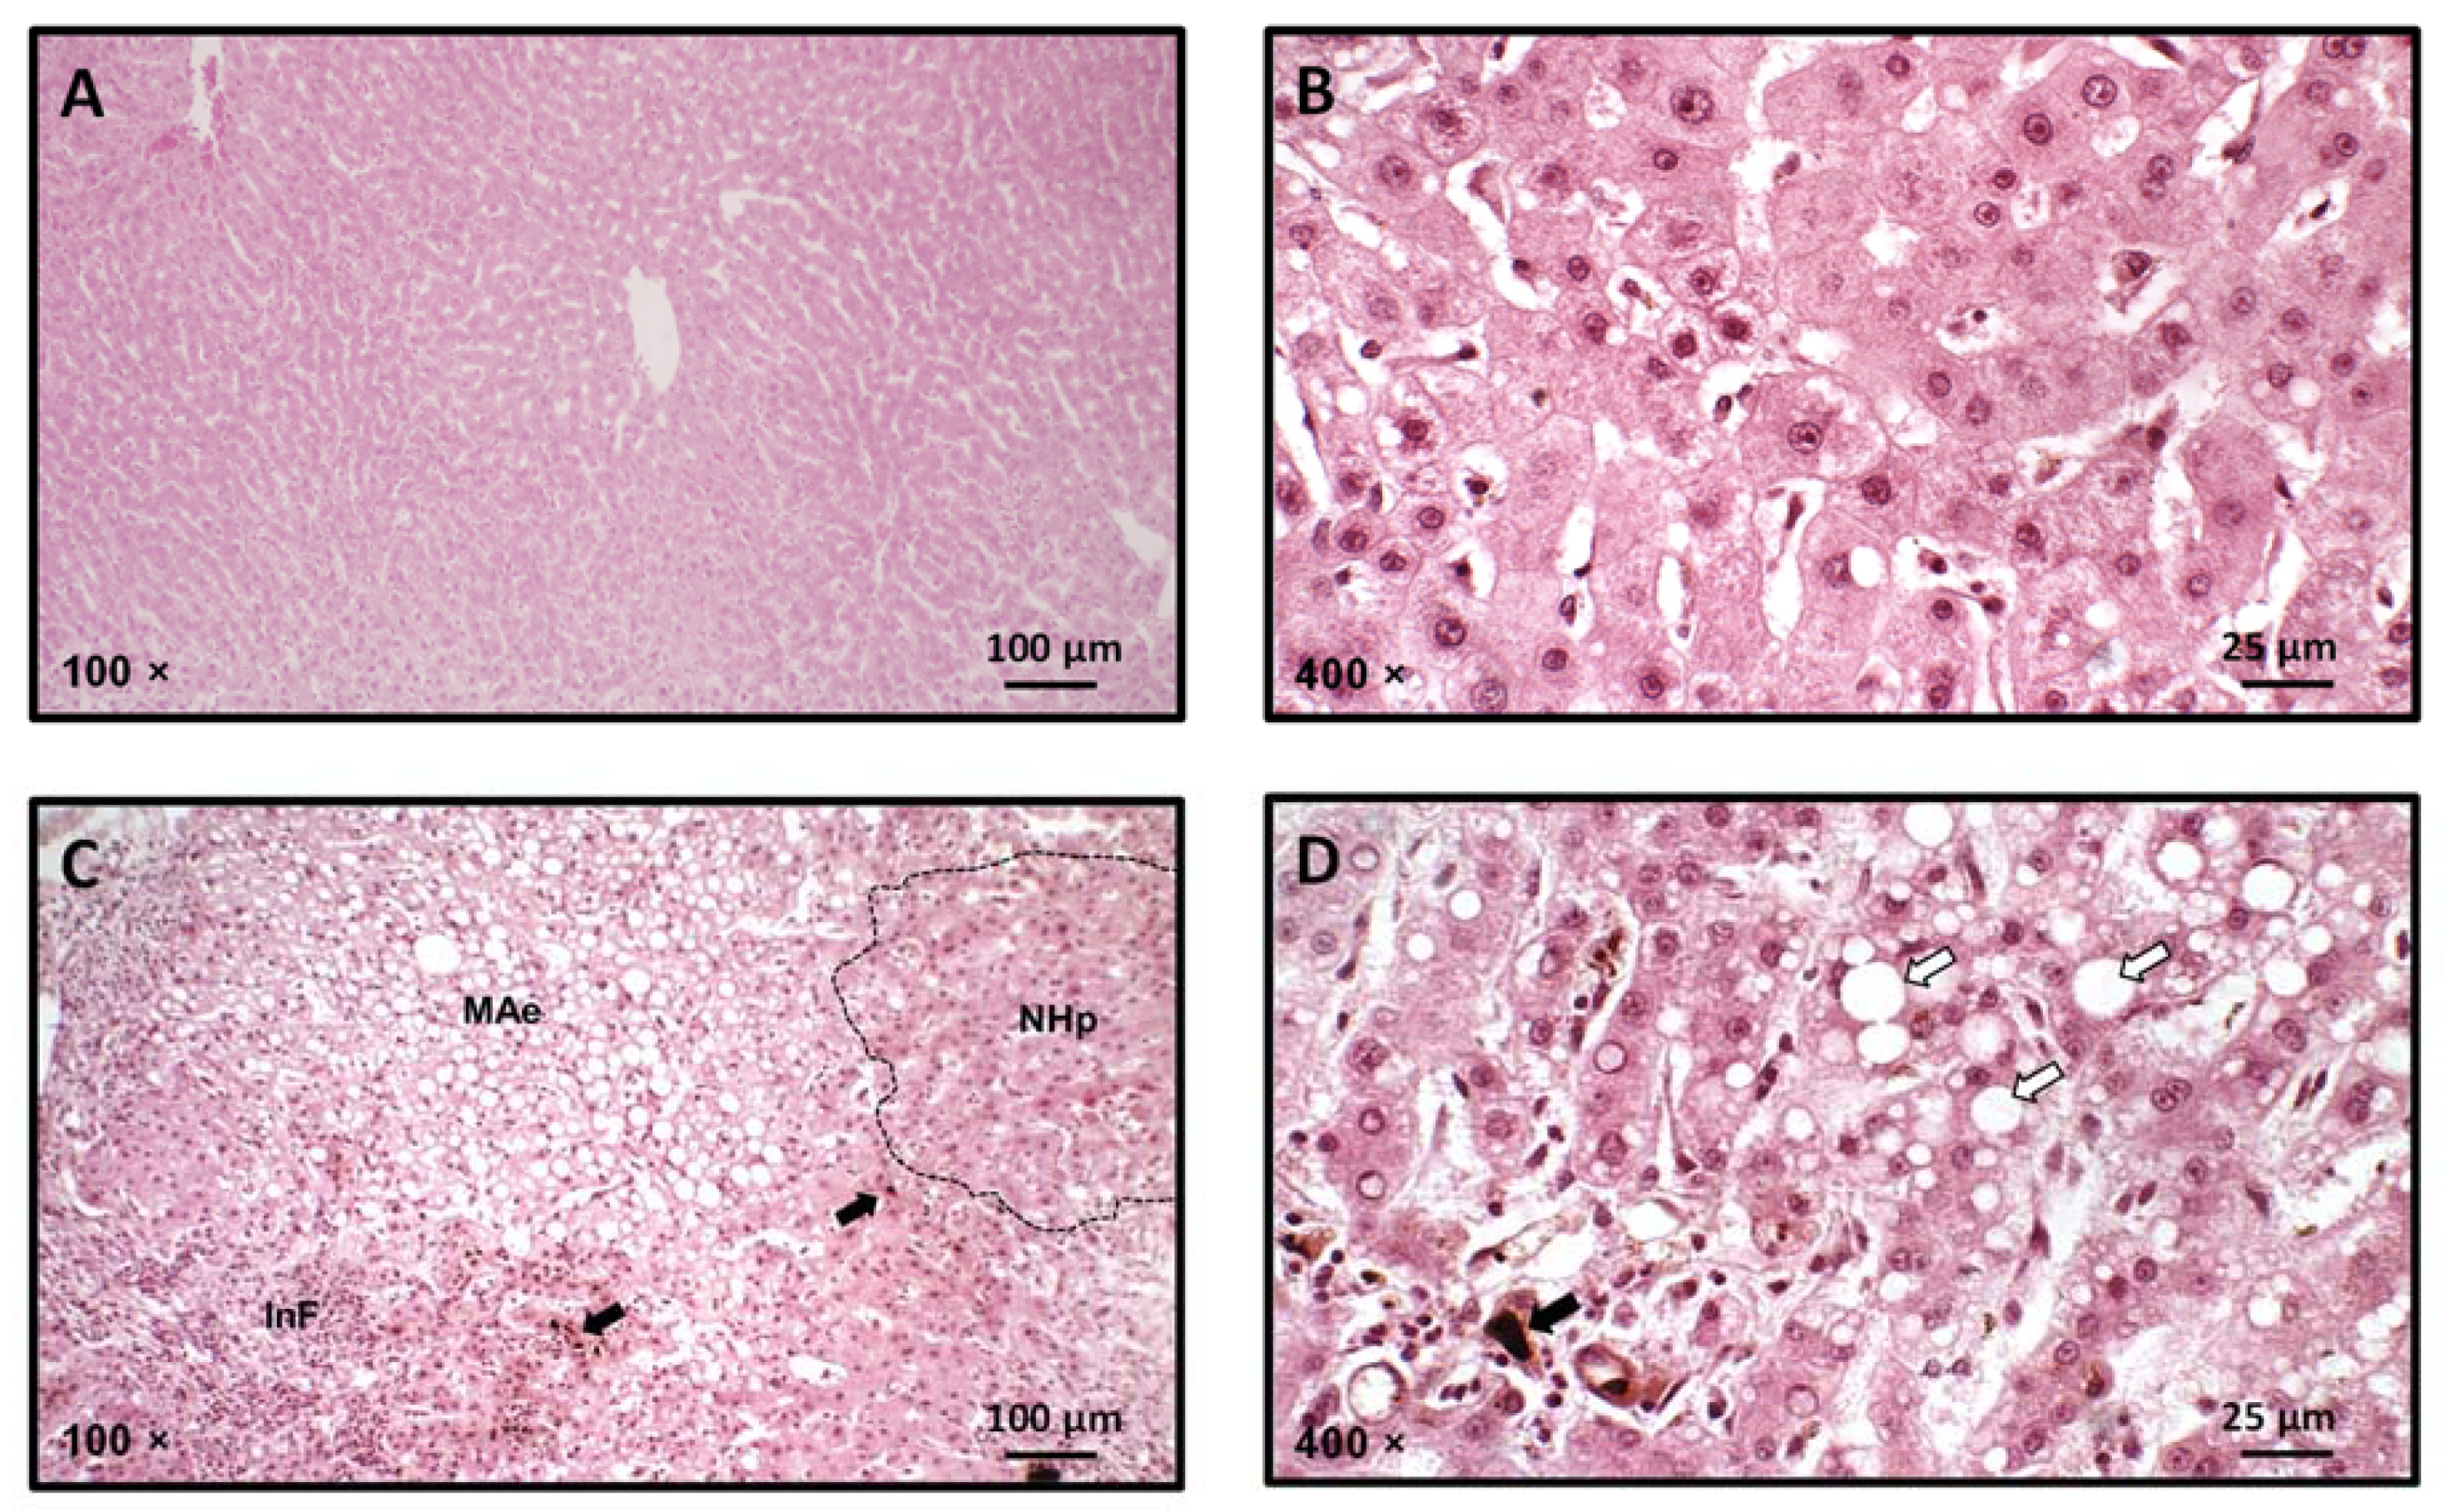
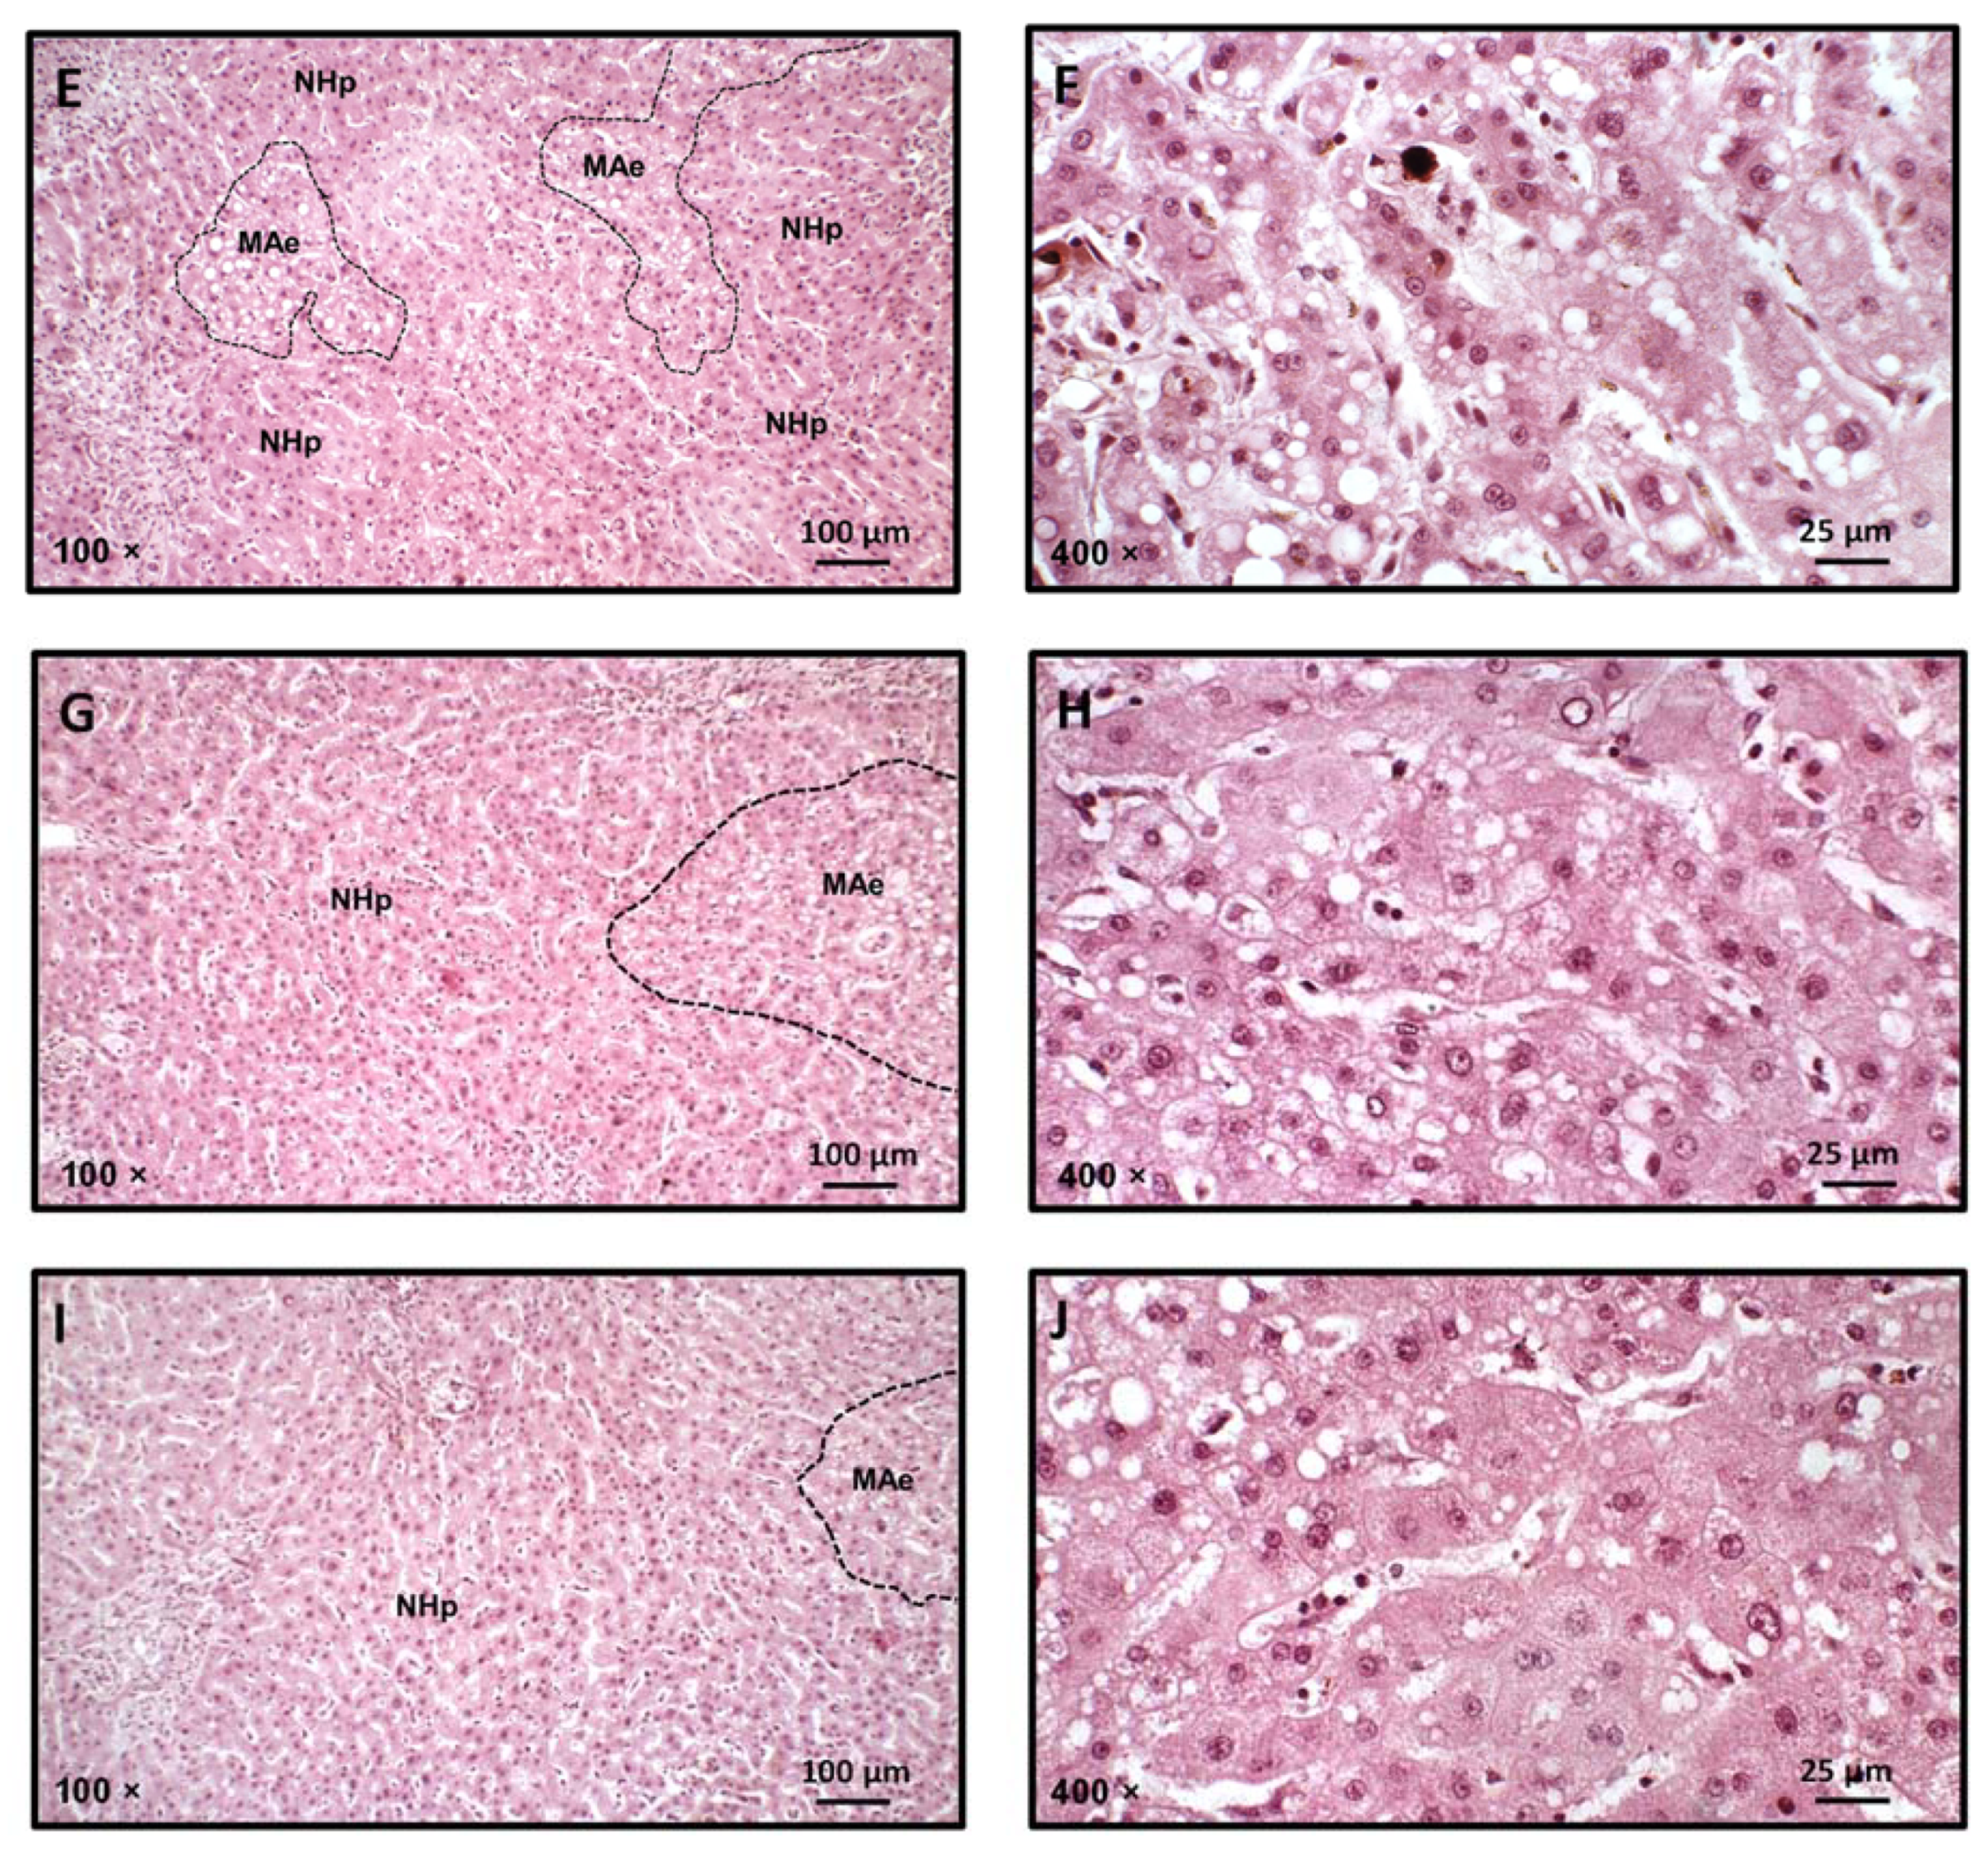
2.12. Histopathological Analysis of Liver Specimens

Immediately after euthanasia and ex vivo abdominal fat dissection, the animals’ livers were removed and fixed in buffered formaldehyde (10%, pH 7.4) for 24 h. All livers were then dehydrated in increasing concentrations of ethanol (70 °gL, 80 °gL, 90 °gL, and 99.9 °gL), cleared in xylene, and embedded in paraffin for histological examination. Histological sections (5 µm thick) were obtained from specimens embedded in paraffin and stained with hematoxylin-eosin (HE), using a semi-automated rotary microtome HistoCore MULTICUT (Leica Geosystems, São Paulo, Brazil) [50]. Histological analysis was performed considering cytological and morphoarchitectural characteristics of the hepatic parenchymal and stromal components, as well as the presence of inflammatory infiltrate, necrosis, or degenerative changes.

2.13. Statistical Analysis

All data were subjected to normal distribution analysis using the Shapiro–Wilk test. Once the Gaussian (normal) distribution of the data was confirmed, the Student’s t-test (comparison between two groups) and the ANOVA test were used, followed by the Tukey multiple comparisons test (comparison between three or more groups). All data are expressed as mean ± standard error of the mean (SEM). For all tests, a significance level of 5% was applied.

3. Results and Discussion

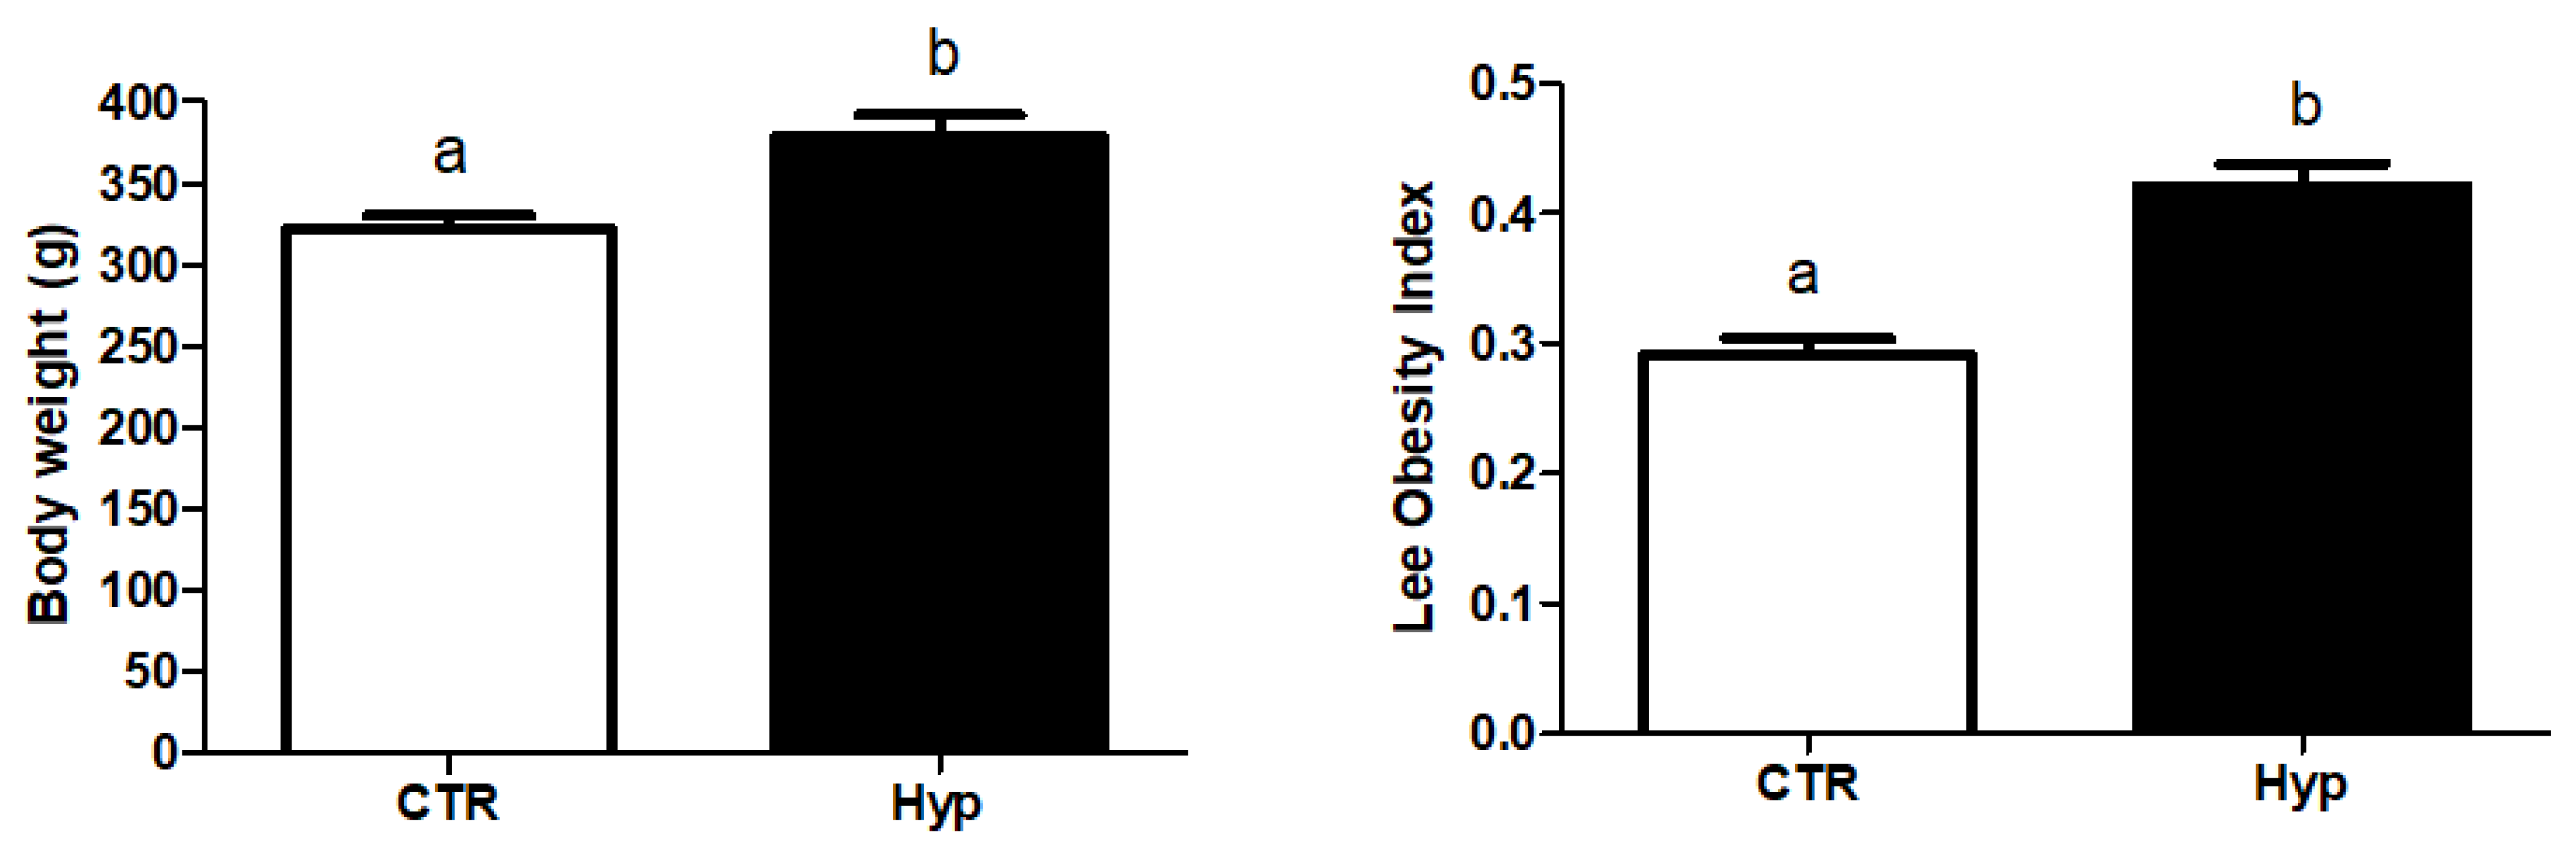
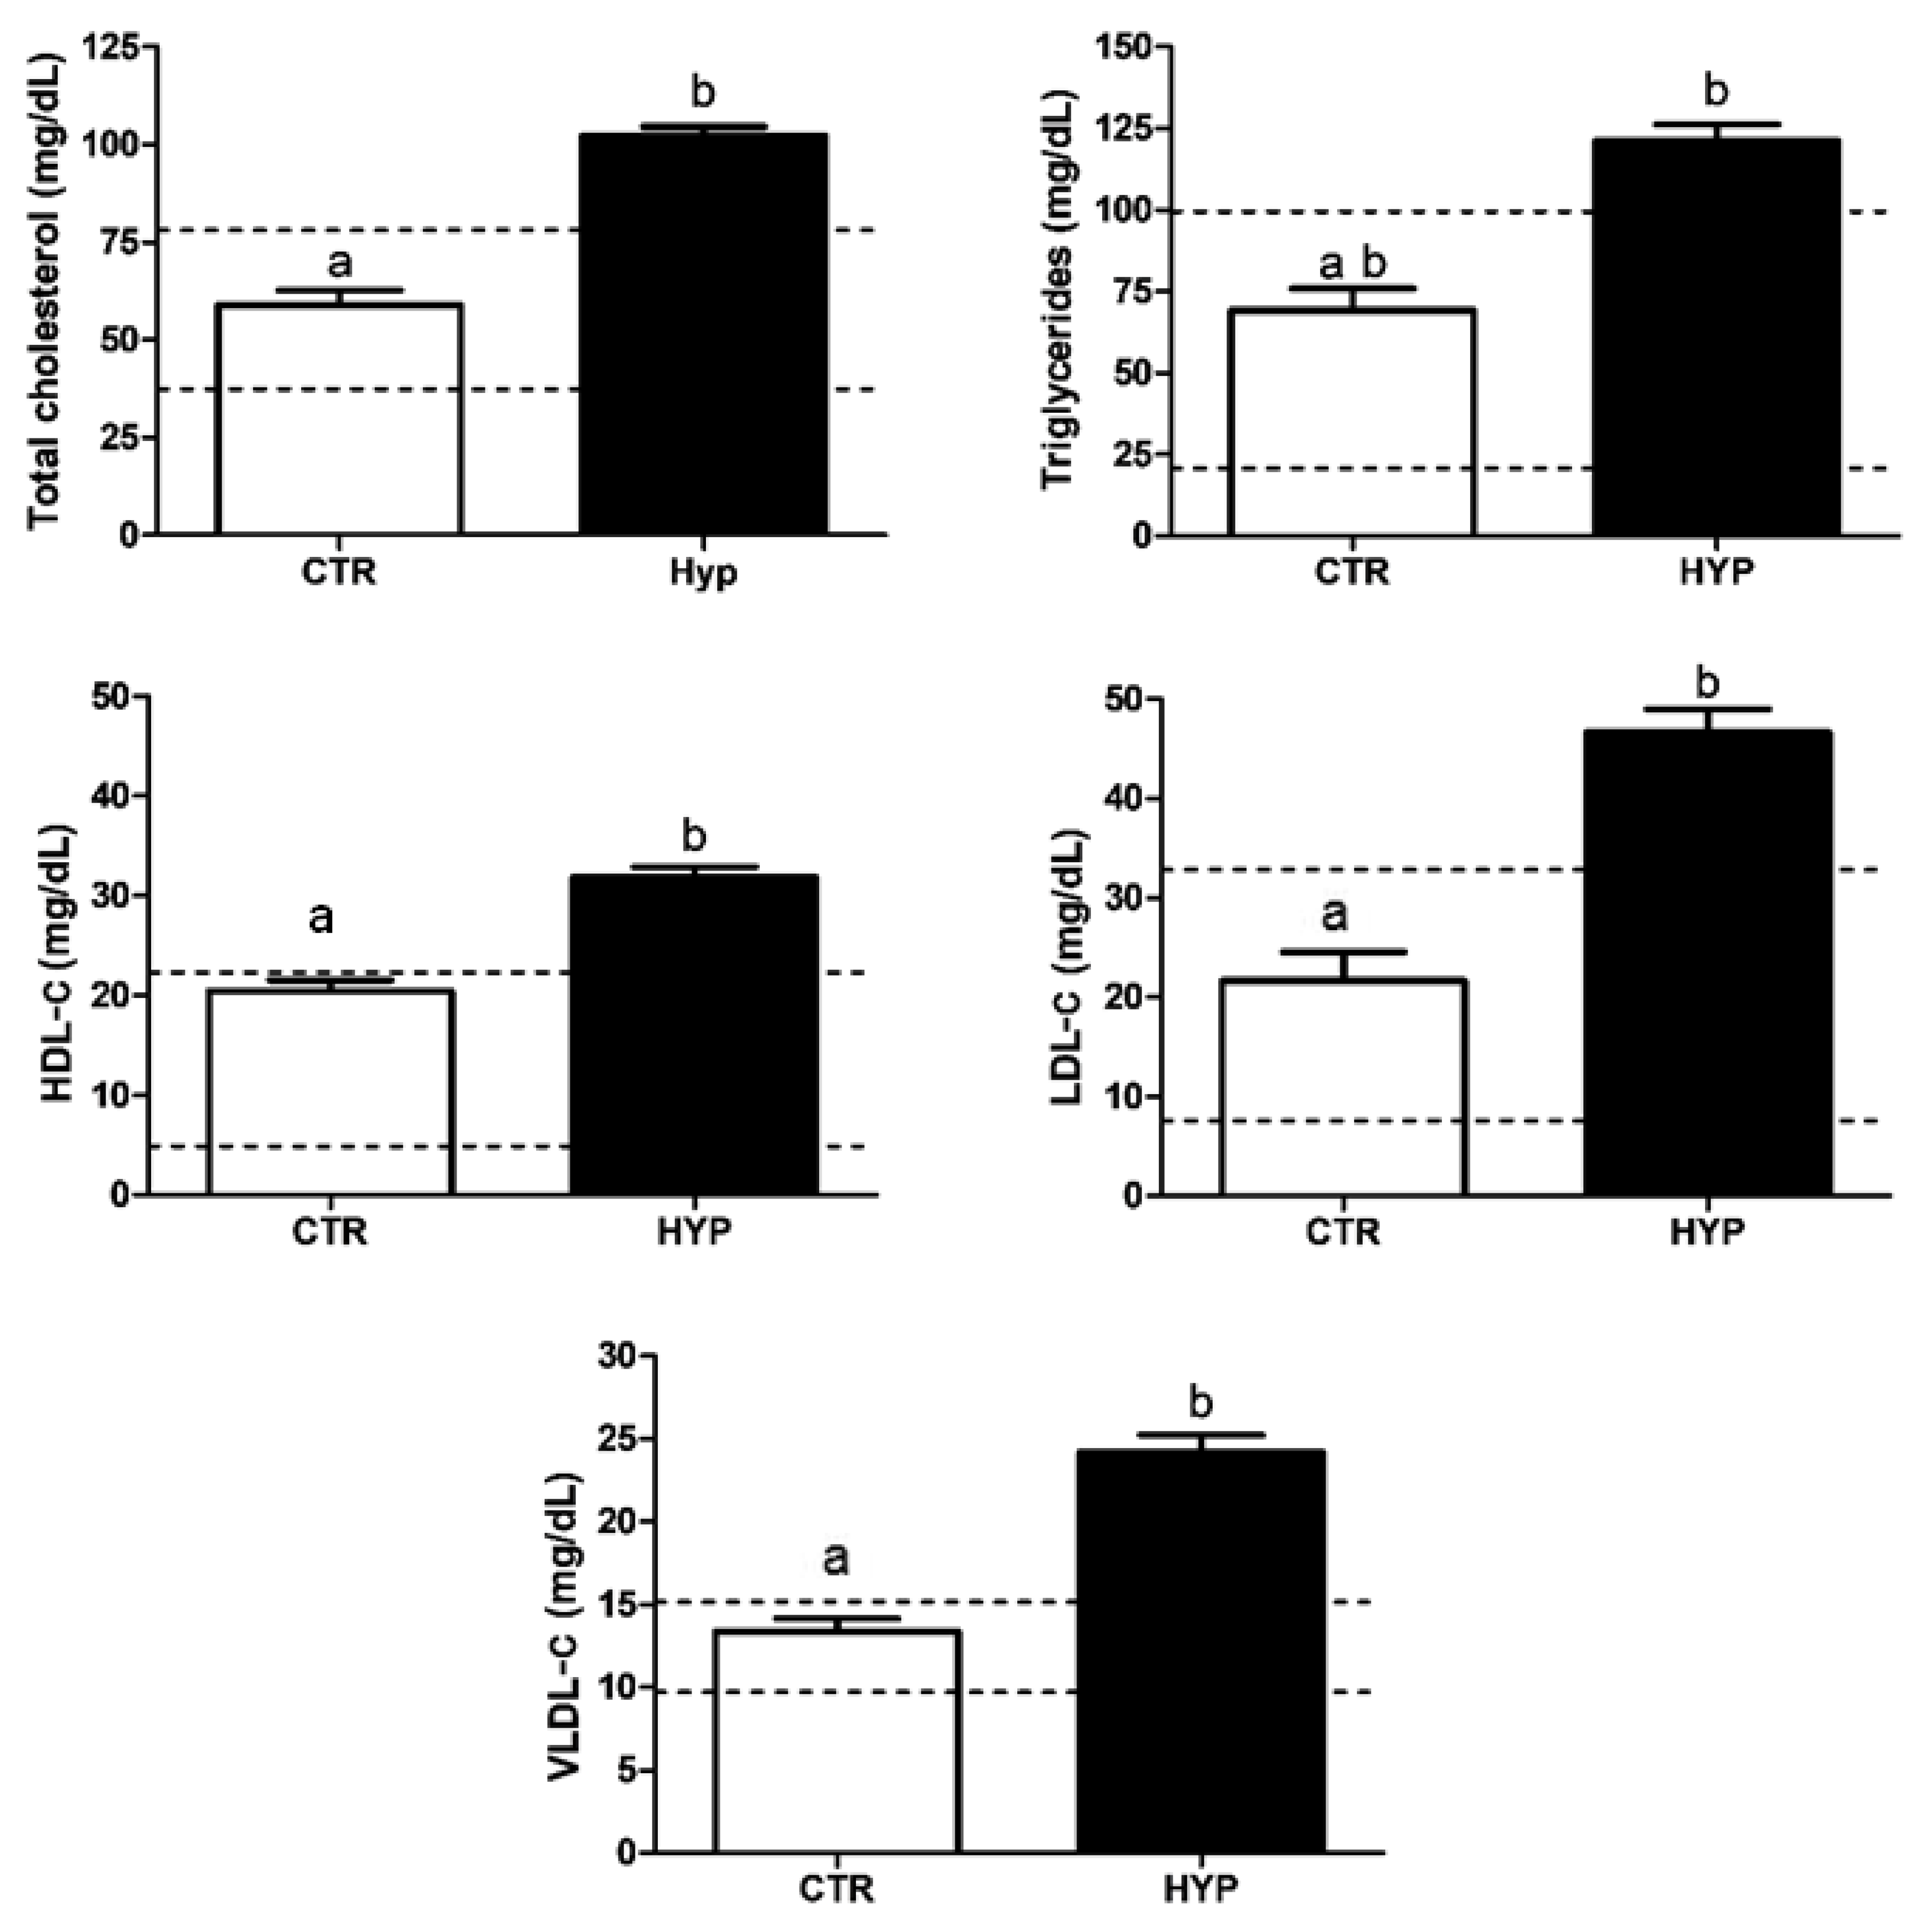
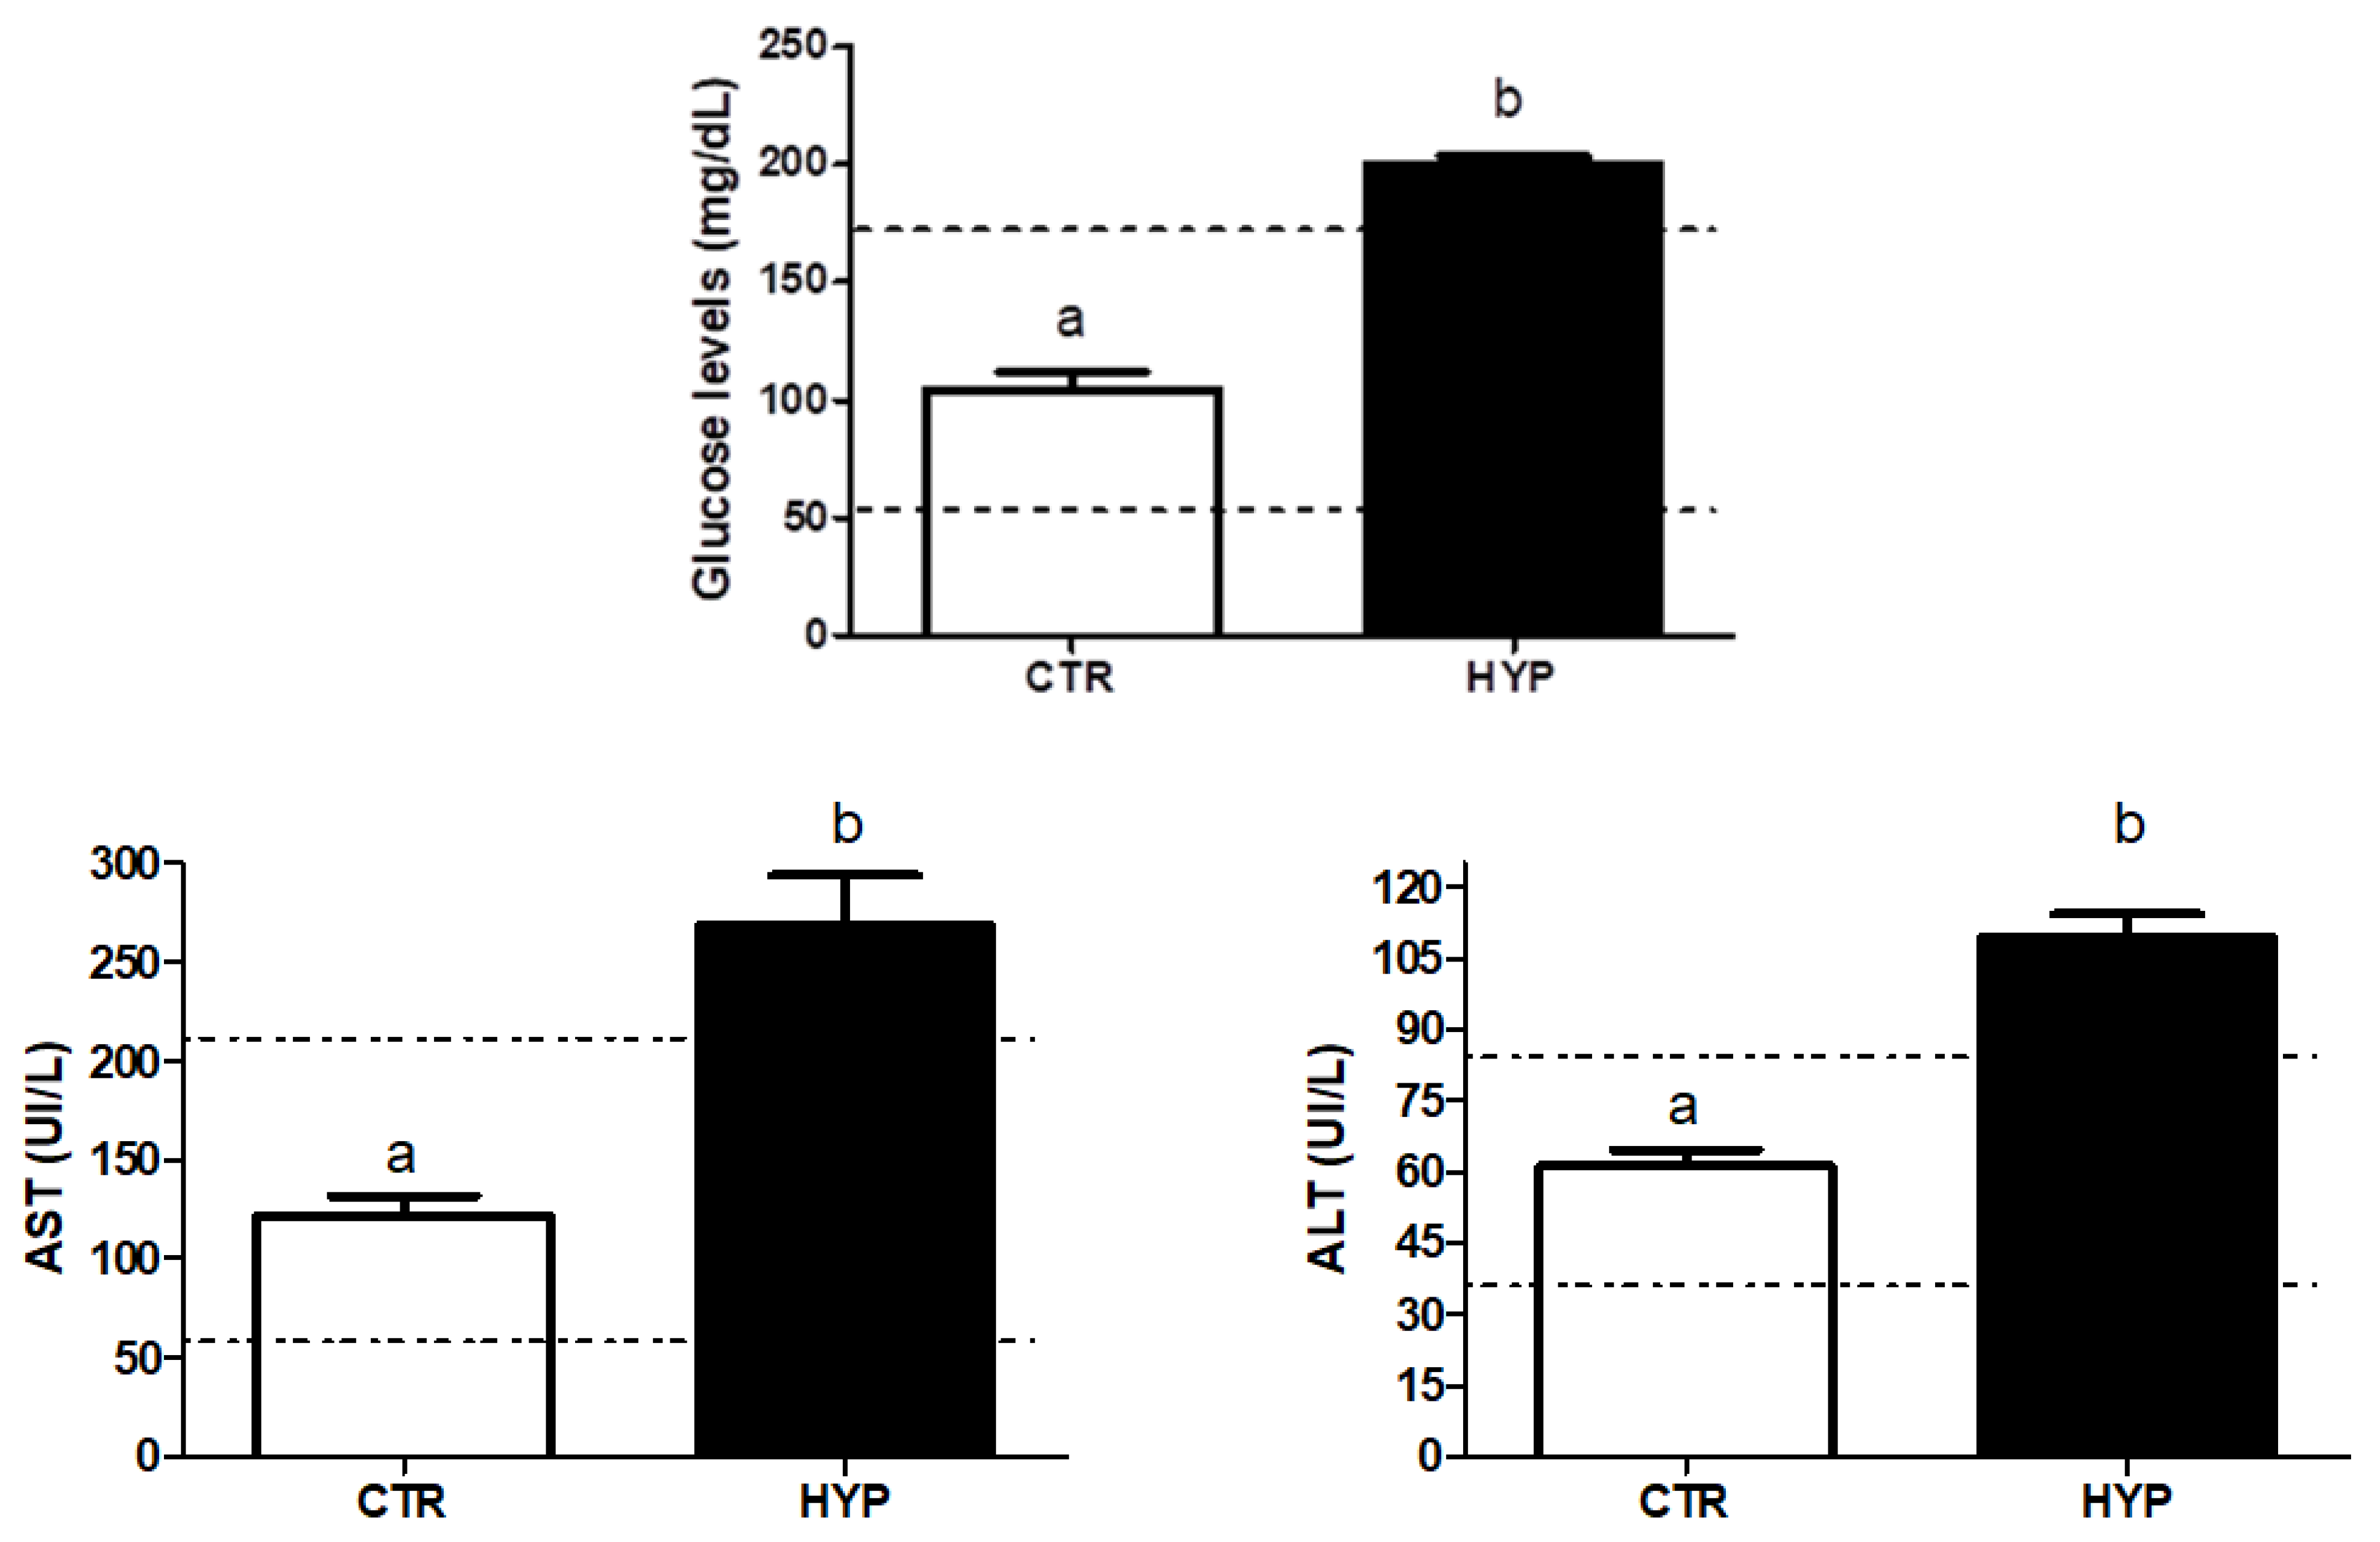
3.1. Hyperlipidemia Induction

As shown in Figure 1, both bodyweight and Lee obesity index (LOI) demonstrated that liquid butter at 1 mL/100 g of body weight inducted a hyperlipidemic state in the animals after 8 weeks of feeding. Screening of the lipidic profile corroborated this. The total cholesterol, triglycerides, HDL-c, LDL-c, and VLDL-c concentrations were almost doubled in the hyperlipidemic group in comparison to the control group (Figure 2), showing statistically significant differences between both treated groups (Hyp and CTR) for both outputs (body weight and LOI). Moreover, the established threshold for the healthy condition was exceeded in all lipid measurements in the hyperlipidemic group.
Similarly, measurements of glucose and hepatic enzyme levels were also altered in the hyperlipidemic group. Whereas glucose levels of the control group were 104.1 ± 8.6 mg/dL, the hyperlipidemic group reached levels of 199.8 ± 3.8 mg/dL, surpassing the established threshold of healthy conditions (Figure 2, Total cholesterol). As for the hepatic enzymes, both AST and ALT were significantly increased (268.3 ± 25.8 UI/L and 109.4 ± 4.86 UI/L respectively) in the hyperlipidemic group (p < 0.05), and the established healthy threshold was exceeded too (Figure 3, AST) (p < 0.05).

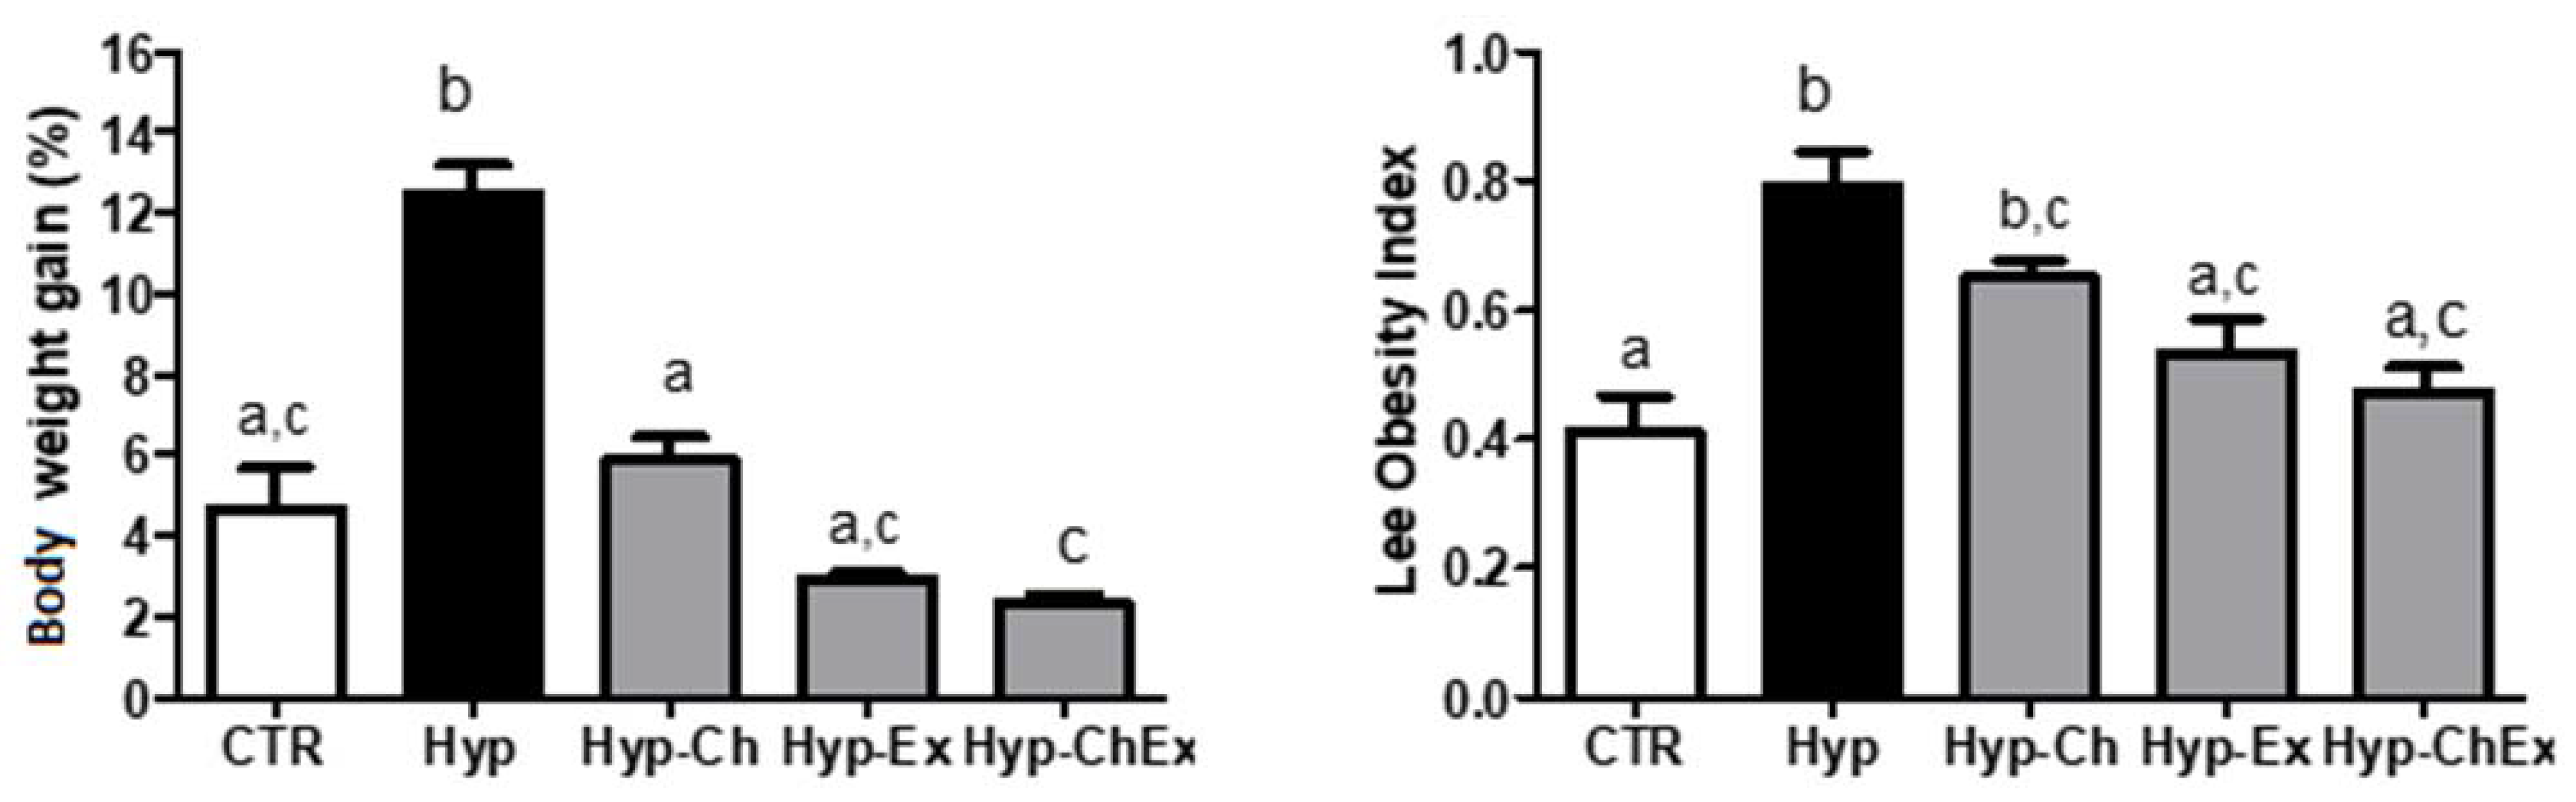
3.2. Physical Training and Chitosan Treatment

After 8 weeks of treatment, hyperlipidemic rats exhibited a significant body gain weight compared to those littermates fed with the standard diet. However, those animals fed with liquid butter and simultaneously treated with chitosan significantly reduced their body weight (p < 0.05). When exercise was added to the treatment schedule, weight values were also significantly reduced (p < 0.05), reaching values even lower than the control group (Figure 4, body weight gain). Using Lee’s obesity index, the same results were observed. Hyperlipidemic rats treated with chitosan and supplemented with physical exercise exhibited the lowest Lee obesity index values of all the treated groups compared to non-treated rats, reaching values close to similar to the standard diet-fed rats.
At the end of the study, the treatment of hyperlipidemic rats with chitosan was able to reduce total cholesterol, triglycerides, LDL-c, and VLDL-c concentrations compared to non-treated hyperlipidemic rats, but none of these molecules were reduced to the established healthy threshold (Figure 5). Total cholesterol and LDL-c were reduced to the established healthy threshold in those hyperlipidemic rats that underwent physical exercise only. Interestingly, the combination of chitosan treatment and physical exercise was able to significantly reduce the total cholesterol, triglycerides, LDL-c, and VLDL-c concentrations to the established healthy threshold (p < 0.05). Furthermore, in the case of LDL-c, this value was even lower than the control group. HDL-c results did not show any change in all the experimental groups compared to controls.
As observed with the lipid profile, the combination of chitosan and physical exercise exhibited the best results. Whereas chitosan’s treatment only reduced the AST concentration in the hyperlipidemic rats, the supplementation of physical exercise significantly reduced glucose, AST, and ALT levels to the established healthy threshold (Figure 6) (p < 0.05). Moreover, in the case of AST, obtained values were even lower than in the control group.
Analysis of feces showed that the treatment with chitosan supplemented with physical exercise significantly reduces the lipid content of the feces compared to the non-treated hyperlipidemic littermates. Similar results were obtained in the hyperlipidemic rats that underwent physical exercise only (Figure 7, fecal lipid). Much higher differences were found in the abdominal fat assay. Once more, hyperlipidemic rats that received a combined treatment of chitosan and physical exercise exhibited the highest reduction of abdominal fat, reaching values close to the control group (p < 0.05). However, chitosan treatment and physical exercise separately were each also able to reduce abdominal fat in comparison to the non-treated hyperlipidemic group (Figure 6, AST).
Samples of the liver of the group CTR showed the usual morphological and architectural appearance of the hepatic parenchyma, characterized by a typical lobular structure and polygonal hepatocytes (over 50% of the liver parenchyma), with wide granular cytoplasm, bulky nuclei, and prominent nucleoli (Figure 8A,B). Non-treated hyperlipidemic animals (group Hyp), on the other hand, presented intense and diffusely distributed hepatocyte cytoplasmic vacuolization resulting from intracellular lipid accumulation (macrovesicular steatosis).
Focal areas of interlobular lymph-histiocytic inflammation, and both intracytoplasmic and intraductal accumulation of brown granular pigment compatible with bilirubin, were also observed (Figure 8C,D). All therapeutic approaches tested in the current work reduced the extent of the pathological changes observed in the liver tissues. However, the group treated only with oral administration of chitosan (Hyp–Ch) exhibited a persistence of multiple and large foci of macrovesicular steatosis (30–50% of the liver parenchyma) and intracellular/intraductal bilirubin accumulation (Figure 8E,F).
A better improvement of the histological features of the liver tissue occurred with the practice of physical exercises (20–30% of the parenchyma) (Figure 8G,H), but the reduction of the steatosis obtained from the combination of both treatments was remarkable, since less than 20% of the hepatocytes presented intracellular lipid inclusions, and no morphological signs of inflammation or cholestasis (reduction of the bile flow and consequent accumulation of bilirubin in the hepatic parenchyma) were observed (Figure 8I,J).
Studies of the effect of chitosan supplantation on the diet of overweight and obese patients have been published. The beneficial effects of this polysaccharide on hyperlipidemic individuals have been attributed to its role in the improvement of blood pressure and serum lipids status [51]. Trivedi et al. (2016) [52] conducted a randomized phase IV clinical study, which consisted of the administration of chitosan capsules (500 mg, five/day) and indistinguishable placebo capsules as daily supplements to 96 overweight and obese subjects over 90 days, resulting in a 10.91-fold reduction of the body mass index and loss of 3 kg [52]. Chitosan also reduced HbA1C levels (below 6%) in subjects who had initial higher values, but the lipid levels were not affected. Bahijri et al. (2017) [22] evaluated the effect of chitosan on markers of obesity and cardiometabolic risk in rats fed normal chow (NC) or a high-fat/high-cholesterol diet (HF/HCD) [20], concluding that chitosan improved lipid profile, insulin sensitivity, and oxidative stress caused by a high-cholesterol diet [38,39,40,53].
In our study, the combination of physical exercise with chitosan supplantation in the diet of treated animals was able to significantly reduce the levels of total cholesterol, triglycerides, LDL-c, VLDL-c, glucose, AST, and ALT to the established healthy thresholds (p < 0.01). The levels of lipid content both in the abdomen of animals and in faces were also influenced by the combined therapy attributed to improved nutrients’ digestibility [54]. Although the precise mechanisms underlying the chitosan-decreased triglycerides, LDL-c, and VLDL-c are not fully clear, possible associations with the decrease of the ratios of surface lipids to core lipids of the VLDL particles [55], upregulation of hepatic LDL receptor mRNA expression [56], upregulation of lecithin cholesterol acyl transferase activity [57], and elevation of plasma angiopoietin-like 4 (ANGPTL4) protein and adiponectin expression [58] have been previously proposed. Such metabolic effects would lead not only to an increase in the hepatic metabolism of fatty acids, but also to elevated excretion of fecal bile acids. The regulation of the hepatic metabolism and excretion of lipids could also explain the improvement of the AST and ALT levels. In addition, the catecholamine response to exercise increases lipolysis of triacylglycerols in adipose tissue and increases the adipose tissue blood flow, decreasing fatty acid re-esterification in glycerol [59]. Therefore, the combination of treatments appears to act synergistically to reduce lipid constituents and improve the expression of liver enzymes in the blood.

4. Conclusions

In this study, we have demonstrated that oral administration of chitosan together with physical exercise had a hypolipidemic effect in a rodent model of dyslipidemia. Levels of total cholesterol, triglycerides, LDL-c, VLDL-c, glucose, and hepatic enzymes (AST and ALT) were significantly improved followed by improved histological features of hepatic parenchyma. A synergistic effect is therefore expected with the proposed therapy combining the effect of chitosan in reducing the risk of obesity and the reduction of oxidative stress promoted by physical exercise.

Author Contributions

J.P.G.P., C.R.M., F.M.A.C., P.S. and J.C.C. contributed to the conceptualization, methodology, validation, formal analysis, investigation, and writing—original draft preparation. J.L.S.C., A.C., E.B.S. and R.L.C.d.A.-J. contributed to the methodology, supervision, writing—review and editing, project administration, resources, and funding acquisition. All authors have made a substantial contribution to the work. All authors have read and agreed to the published version of the manuscript.

Funding

This research was funded by the National Council for Scientific and Technological Development (Conselho Nacional de Desenvolvimento Científico e Tecnológico—CNPq, Brazil), the Coordination for the Improvement of Higher Education Personnel (Coordenação de Aperfeiçoamento de Pessoal de Nível Superior—CAPES, Brazil), grant #2015/20630-4 São Paulo Research Foundation and grant #2021/05719-0 São Paulo Research Foundation, and by Fundação Carolina (Movilidad de profesorado Brasil-España, Movilidad. Estancias de Investigación, C.2020) granted to P.S.

Institutional Review Board Statement

The animal experiments were approved by the Research Ethics Committee of Universidade Tiradentes under the embodied opinion number 060209-1.

Informed Consent Statement

Not applicable.

Data Availability Statement

Not applicable.

Conflicts of Interest

The authors declare no conflict of interest.

References

  1. Rychter, A.M.; Skrzypczak-Zielinska, M.; Zielinska, A.; Eder, P.; Souto, E.B.; Zawada, A.; Ratajczak, A.E.; Dobrowolska, A.; Krela-Kazmierczak, I. Is the Retinol-Binding Protein 4 a Possible Risk Factor for Cardiovascular Diseases in Obesity? Int. J. Mol. Sci. 2020, 21, 5229. [Google Scholar] [CrossRef] [PubMed]
  2. Karczewski, J.; Zielińska, A.; Staszewski, R.; Eder, P.; Dobrowolska, A.; Souto, E.B. Obesity and the brain. Int. J. Mol. Sci. 2022; submitted. [Google Scholar]
  3. Kolb, H.; Martin, S. Environmental/lifestyle factors in the pathogenesis and prevention of type 2 diabetes. BMC Med. 2017, 15, 131. [Google Scholar] [CrossRef] [PubMed]
  4. Galgani, J.E.; Fernández-Verdejo, R. Pathophysiological role of metabolic flexibility on metabolic health. Obes. Rev. 2021, 22, e13131. [Google Scholar] [CrossRef] [PubMed]
  5. WHO (World Health Organization). Available online: https://www.who.int/ncds/prevention/physical-activity/inactivity-global-health-problem/en/ (accessed on 8 June 2021).
  6. Stewart, J.; McCallin, T.; Martinez, J.; Chacko, S.; Yusuf, S. Hyperlipidemia. Pediatr. Rev. 2020, 41, 393–402. [Google Scholar] [CrossRef] [PubMed]
  7. Chanoine, P.; Spector, N.D. Hyperlipidemia, eating disorders, and smoking cessation. Curr. Opin. Pediatr. 2008, 20, 734–739. [Google Scholar] [CrossRef] [PubMed]
  8. Xi, Y.; Niu, L.; Cao, N.; Bao, H.; Xu, X.; Zhu, H.; Yan, T.; Zhang, N.; Qiao, L.; Han, K.; et al. Prevalence of dyslipidemia and associated risk factors among adults aged ≥35 years in northern China: A cross-sectional study. BMC Public Health 2020, 20, 1068. [Google Scholar] [CrossRef]
  9. Dankner, R.; Ben Avraham, S.; Harats, D.; Chetrit, A. ApoE Genotype, Lipid Profile, Exercise, and the Associations With Cardiovascular Morbidity and 18-Year Mortality. J. Gerontol. Ser. A Biol. Sci. Med. Sci. 2020, 75, 1887–1893. [Google Scholar] [CrossRef]
  10. Mendonça, M.A.A.; Ribeiro, A.R.S.; Lima, A.K.; Bezerra, G.B.; Pinheiro, M.S.; Albuquerque-Júnior, R.L.C.; Gomes, M.Z.; Padilha, F.F.; Thomazzi, S.M.; Novellino, E.; et al. Red Propolis and Its Dyslipidemic Regulator Formononetin: Evaluation of Antioxidant Activity and Gastroprotective Effects in Rat Model of Gastric Ulcer. Nutrients 2020, 12, 2951. [Google Scholar] [CrossRef]
  11. Mendoza-Herrera, K.; Pedroza-Tobías, A.; Hernández-Alcaraz, C.; Ávila-Burgos, L.; Aguilar-Salinas, C.A.; Barquera, S. Attributable Burden and Expenditure of Cardiovascular Diseases and Associated Risk Factors in Mexico and other Selected Mega-Countries. Int. J. Environ. Res. Public Health 2019, 16, 4041. [Google Scholar] [CrossRef] [Green Version]
  12. Gebreegziabiher, G.; Belachew, T.; Mehari, K.; Tamiru, D. Prevalence of dyslipidemia and associated risk factors among adult residents of Mekelle City, Northern Ethiopia. PLoS ONE 2021, 16, e0243103. [Google Scholar] [CrossRef]
  13. Erem, C.; Hacihasanoglu, A.; Deger, O.; Kocak, M.; Topbas, M. Prevalence of dyslipidemia and associated risk factors among Turkish adults: Trabzon lipid study. Endocrine 2008, 34, 36–51. [Google Scholar] [CrossRef] [PubMed]
  14. Opoku, S.; Gan, Y.; Fu, W.; Chen, D.; Addo-Yobo, E.; Trofimovitch, D.; Yue, W.; Yan, F.; Wang, Z.; Lu, Z. Prevalence and risk factors for dyslipidemia among adults in rural and urban China: Findings from the China National Stroke Screening and prevention project (CNSSPP). BMC Public Health 2019, 19, 1500. [Google Scholar] [CrossRef] [PubMed]
  15. Gao, H.; Wang, H.; Shan, G.; Liu, R.; Chen, H.; Sun, S.; Liu, Y. Prevalence of dyslipidemia and associated risk factors among adult residents of Shenmu City, China. PLoS ONE 2021, 16, e0250573. [Google Scholar] [CrossRef] [PubMed]
  16. Zhang, F.L.; Xing, Y.Q.; Wu, Y.H.; Liu, H.Y.; Luo, Y.; Sun, M.S.; Guo, Z.N.; Yang, Y. The prevalence, awareness, treatment, and control of dyslipidemia in northeast China: A population-based cross-sectional survey. Lipids Health Dis. 2017, 16, 61. [Google Scholar] [CrossRef] [PubMed] [Green Version]
  17. Mosca, L. Management of Dyslipidemia in Women in the Post–hormone Therapy Era. J. Gen. Intern. Med. 2005, 20, 297–305. [Google Scholar] [CrossRef] [Green Version]
  18. Yu, K.; Xue, Y.; He, T.; Guan, L.; Zhao, A.; Zhang, Y. Association of Spicy Food Consumption Frequency with Serum Lipid Profiles in Older People in China. J. Nutr. Health Aging 2018, 22, 311–320. [Google Scholar] [CrossRef]
  19. Sobczak, A.I.S.; Blindauer, C.A.; Stewart, A.J. Changes in Plasma Free Fatty Acids Associated with Type-2 Diabetes. Nutrients 2019, 11, 2022. [Google Scholar] [CrossRef] [Green Version]
  20. Guerra, R.L.F.; Prado, W.L.; Cheik, N.C.; Viana, F.P.; Botero, J.P.; Vendramini, R.C.; Carlos, I.Z.; Rossi, E.A.; Dâmaso, A.R. Effects of 2 or 5 consecutive exercise days on adipocyte area and lipid parameters in Wistar rats. Lipids Health Dis. 2007, 6, 16. [Google Scholar] [CrossRef] [Green Version]
  21. Mann, S.; Beedie, C.; Jimenez, A. Differential effects of aerobic exercise, resistance training and combined exercise modalities on cholesterol and the lipid profile: Review, synthesis and recommendations. Sports Med. 2014, 44, 211–221. [Google Scholar] [CrossRef] [Green Version]
  22. Bahijri, S.M.; Alsheikh, L.; Ajabnoor, G.; Borai, A. Effect of Supplementation With Chitosan on Weight, Cardiometabolic, and Other Risk Indices in Wistar Rats Fed Normal and High-Fat/High-Cholesterol Diets Ad Libitum. Nutr. Metab. Insights 2017, 10, 1178638817710666. [Google Scholar] [CrossRef] [Green Version]
  23. Jemai, H.; Bouaziz, M.; Fki, I.; El Feki, A.; Sayadi, S. Hypolipidimic and antioxidant activities of oleuropein and its hydrolysis derivative-rich extracts from Chemlali olive leaves. Chem.-Biol. Interact. 2008, 176, 88–98. [Google Scholar] [CrossRef] [PubMed]
  24. Silva, I.M.V.; Machado, F.; Moreno, M.J.; Nunes, C.; Coimbra, M.A.; Coreta-Gomes, F. Polysaccharide Structures and Their Hypocholesterolemic Potential. Molecules 2021, 26, 4559. [Google Scholar] [CrossRef] [PubMed]
  25. Erickson, N.; Zafron, M.; Harding, S.V.; Marinangeli, C.P.F.; Rideout, T.C. Evaluating the Lipid-Lowering Effects of α-lipoic Acid Supplementation: A Systematic Review. J. Diet. Suppl. 2020, 17, 753–767. [Google Scholar] [CrossRef] [PubMed]
  26. Poli, A.; Visioli, F. Pharmacology of Nutraceuticals with Lipid Lowering Properties. High Blood Press. Cardiovasc. Prev. 2019, 26, 113–118. [Google Scholar] [CrossRef]
  27. Yang, M.; Hu, D.; Cui, Z.; Li, H.; Man, C.; Jiang, Y. Lipid-Lowering Effects of Inonotus obliquus Polysaccharide In Vivo and In Vitro. Foods 2021, 10, 3085. [Google Scholar] [CrossRef]
  28. Derosa, G.; Colletti, A.; Maffioli, P.; D’Angelo, A.; Lupi, A.; Zito, G.B.; Mureddu, G.F.; Raddino, R.; Fedele, F.; Cicero, A.F.G. Lipid-lowering nutraceuticals update on scientific evidence. J. Cardiovasc. Med. 2020, 21, 845–859. [Google Scholar] [CrossRef]
  29. Hadipour, E.; Taleghani, A.; Tayarani-Najaran, N.; Tayarani-Najaran, Z. Biological effects of red beetroot and betalains: A review. Phytother. Res. PTR 2020, 34, 1847–1867. [Google Scholar] [CrossRef]
  30. Xiong, Z.; Cao, X.; Wen, Q.; Chen, Z.; Cheng, Z.; Huang, X.; Zhang, Y.; Long, C.; Zhang, Y.; Huang, Z. An overview of the bioactivity of monacolin K/lovastatin. Food Chem. Toxicol. 2019, 131, 110585. [Google Scholar] [CrossRef]
  31. Gerards, M.C.; Terlou, R.J.; Yu, H.; Koks, C.H.; Gerdes, V.E. Traditional Chinese lipid-lowering agent red yeast rice results in significant LDL reduction but safety is uncertain—A systematic review and meta-analysis. Atherosclerosis 2015, 240, 415–423. [Google Scholar] [CrossRef] [Green Version]
  32. Hosseini, Z.; Ghaedi, H.; Ahmadi, M.; Hosseini, S.A. Lipid-Lowering Effects of Concurrent Training and Green Tea Consumption in Overweight Women. J. Obes. Metab. Syndr. 2020, 29, 313–319. [Google Scholar] [CrossRef]
  33. Conte, M.S.; Bradbury, A.W.; Kolh, P.; White, J.V.; Dick, F.; Fitridge, R.; Mills, J.L.; Ricco, J.B.; Suresh, K.R.; Murad, M.H. Global vascular guidelines on the management of chronic limb-threatening ischemia. J. Vasc. Surg. 2019, 69, 3S–125S.e140. [Google Scholar] [CrossRef] [PubMed] [Green Version]
  34. Pearson, G.J.; Thanassoulis, G.; Anderson, T.J.; Barry, A.R.; Couture, P.; Dayan, N.; Francis, G.A.; Genest, J.; Grégoire, J.; Grover, S.A.; et al. 2021 Canadian Cardiovascular Society Guidelines for the Management of Dyslipidemia for the Prevention of Cardiovascular Disease in Adults. Can. J. Cardiol. 2021, 37, 1129–1150. [Google Scholar] [CrossRef] [PubMed]
  35. Arocha Rodulfo, J.I. Sedentary lifestyle a disease from xxi century. Clin. Investig. Arterioscler. Publ. Of. Soc. Esp. Arterioscler. 2019, 31, 233–240. [Google Scholar] [CrossRef]
  36. Naumann, S.; Schweiggert-Weisz, U.; Eglmeier, J.; Haller, D.; Eisner, P. In Vitro Interactions of Dietary Fibre Enriched Food Ingredients with Primary and Secondary Bile Acids. Nutrients 2019, 11, 1424. [Google Scholar] [CrossRef] [PubMed] [Green Version]
  37. Maezaki, Y.; Tsuji, K.; Nakagawa, Y.; Kawai, Y.; Akimoto, M.; Tsugita, T.; Takekawa, W.; Terada, A.; Hara, H.; Mitsuoka, T. Hypocholesterolemic Effect of Chitosan in Adult Males. Biosci. Biotechnol. Biochem. 1993, 57, 1439–1444. [Google Scholar] [CrossRef]
  38. Pan, H.; Yang, Q.; Huang, G.; Ding, C.; Cao, P.; Huang, L.; Xiao, T.; Guo, J.; Su, Z. Hypolipidemic effects of chitosan and its derivatives in hyperlipidemic rats induced by a high-fat diet. Food Nutr. Res. 2016, 60, 31137. [Google Scholar] [CrossRef] [Green Version]
  39. Choi, C.R.; Kim, E.K.; Kim, Y.S.; Je, J.Y.; An, S.H.; Lee, J.D.; Wang, J.H.; Ki, S.S.; Jeon, B.T.; Moon, S.H.; et al. Chitooligosaccharides decreases plasma lipid levels in healthy men. Int. J. Food Sci. Nutr. 2012, 63, 103–106. [Google Scholar] [CrossRef]
  40. Caffall, K.H.; Mohnen, D. The structure, function, and biosynthesis of plant cell wall pectic polysaccharides. Carbohydr. Res. 2009, 344, 1879–1900. [Google Scholar] [CrossRef]
  41. Naveed, M.; Phil, L.; Sohail, M.; Hasnat, M.; Baig, M.; Ihsan, A.U.; Shumzaid, M.; Kakar, M.U.; Mehmood Khan, T.; Akabar, M.D.; et al. Chitosan oligosaccharide (COS): An overview. Int. J. Biol. Macromol. 2019, 129, 827–843. [Google Scholar] [CrossRef]
  42. Swiatkiewicz, S.; Swiatkiewicz, M.; Arczewska-Wlosek, A.; Jozefiak, D. Chitosan and its oligosaccharide derivatives (chito-oligosaccharides) as feed supplements in poultry and swine nutrition. J. Anim. Physiol. Anim. Nutr. 2015, 99, 1–12. [Google Scholar] [CrossRef]
  43. Zhang, J.; Xia, W.; Liu, P.; Cheng, Q.; Tahirou, T.; Gu, W.; Li, B. Chitosan modification and pharmaceutical/biomedical applications. Mar. Drugs 2010, 8, 1962–1987. [Google Scholar] [CrossRef] [PubMed] [Green Version]
  44. Ngo, D.H.; Kim, S.K. Antioxidant effects of chitin, chitosan, and their derivatives. Adv. Food Nutr. Res. 2014, 73, 15–31. [Google Scholar] [CrossRef] [PubMed]
  45. Riaz Rajoka, M.S.; Zhao, L.; Mehwish, H.M.; Wu, Y.; Mahmood, S. Chitosan and its derivatives: Synthesis, biotechnological applications, and future challenges. Appl. Microbiol. Biotechnol. 2019, 103, 1557–1571. [Google Scholar] [CrossRef] [PubMed]
  46. Chiu, C.Y.; Yen, T.E.; Liu, S.H.; Chiang, M.T. Comparative Effects and Mechanisms of Chitosan and Its Derivatives on Hypercholesterolemia in High-Fat Diet-Fed Rats. Int. J. Mol. Sci. 2019, 21, 92. [Google Scholar] [CrossRef] [Green Version]
  47. Tong, A.J.; Hu, R.K.; Wu, L.X.; Lv, X.C.; Li, X.; Zhao, L.N.; Liu, B. Ganoderma polysaccharide and chitosan synergistically ameliorate lipid metabolic disorders and modulate gut microbiota composition in high fat diet-fed golden hamsters. J. Food Biochem. 2020, 44, e13109. [Google Scholar] [CrossRef]
  48. Dos Reis, I.G.M.; Martins, L.E.B.; de Araujo, G.G.; Gobatto, C.A. Forced Swim Reliability for Exercise Testing in Rats by a Tethered Swimming Apparatus. Front. Physiol. 2018, 9, 1839. [Google Scholar] [CrossRef] [Green Version]
  49. Gonçalves, R.P.; Ferreira, W.H.; Gouvêa, R.F.; Andrade, C.T. Effect of Chitosan on the Properties of Electrospun Fibers From Mixed Poly(Vinyl Alcohol)/ Chitosan Solutions. Mater. Res. 2017, 20, 984–993. [Google Scholar] [CrossRef]
  50. Shi, P.; Chen, J.; Lin, J.; Zhang, L. High-throughput fat quantifications of hematoxylin-eosin stained liver histopathological images based on pixel-wise clustering. Sci. China Inf. Sci. 2017, 60, 092108. [Google Scholar] [CrossRef]
  51. Jull, A.B.; Ni Mhurchu, C.; Bennett, D.A.; Dunshea-Mooij, C.A.; Rodgers, A. Chitosan for overweight or obesity. Cochrane Database Syst. Rev. 2008, 16, CD003892. [Google Scholar] [CrossRef]
  52. Trivedi, V.R.; Satia, M.C.; Deschamps, A.; Maquet, V.; Shah, R.B.; Zinzuwadia, P.H.; Trivedi, J.V. Single-blind, placebo controlled randomised clinical study of chitosan for body weight reduction. Nutr. J. 2016, 15, 3. [Google Scholar] [CrossRef] [Green Version]
  53. Tungland, B.C.; Meyer, D. Nondigestible Oligo- and Polysaccharides (Dietary Fiber): Their Physiology and Role in Human Health and Food. Compr. Rev. Food Sci. Food Saf. 2002, 1, 90–109. [Google Scholar] [CrossRef] [PubMed]
  54. Razdan, A.; Pettersson, D. Effect of chitin and chitosan on nutrient digestibility and plasma lipid concentrations in broiler chickens. Br. J. Nutr. 1994, 72, 277–288. [Google Scholar] [CrossRef] [PubMed] [Green Version]
  55. Yao, H.T.; Chiang, M.T. Plasma lipoprotein cholesterol in rats fed a diet enriched in chitosan and cholesterol. J. Nutr. Sci. Vitaminol. 2002, 48, 379–383. [Google Scholar] [CrossRef] [PubMed]
  56. Xu, G.; Huang, X.; Qiu, L.; Wu, J.; Hu, Y. Mechanism study of chitosan on lipid metabolism in hyperlipidemic rats. Asia Pac. J. Clin. Nutr. 2007, 16 (Suppl. 1), 313–317. [Google Scholar]
  57. Wang, D.; Han, J.; Yu, Y.; Li, X.; Wang, Y.; Tian, H.; Guo, S.; Jin, S.; Luo, T.; Qin, S. Chitosan oligosaccharide decreases very-low-density lipoprotein triglyceride and increases high-density lipoprotein cholesterol in high-fat-diet-fed rats. Exp. Biol. Med. 2011, 236, 1064–1069. [Google Scholar] [CrossRef]
  58. Liu, S.-H.; Cai, F.-Y.; Chiang, M.-T. Long-Term Feeding of Chitosan Ameliorates Glucose and Lipid Metabolism in a High-Fructose-Diet-Impaired Rat Model of Glucose Tolerance. Mar. Drugs 2015, 13, 7302–7313. [Google Scholar] [CrossRef] [Green Version]
  59. Muscella, A.; Stefàno, E.; Lunetti, P.; Capobianco, L.; Marsigliante, S. The Regulation of Fat Metabolism During Aerobic Exercise. Biomolecules 2020, 10, 1699. [Google Scholar] [CrossRef]
Figure 1. Assessment of body weight and Lee obesity index of the animals after the time-course of experimental induction of hyperlipidemia status (Hyp) using oral administration of liquid butter. Animals of the control group (CTR) were treated only with distilled water. Different letters (a,b) above the columns represent statistically different means (T Student test; p < 0.05).
Nutraceuticals 02 00009 g001
Figure 2. Assessment of lipidemic profile of the animals after the time-course of experimental induction of hyperlipidemia status (Hyp) using oral administration of liquid butter. Animals of the control group (CTR) were treated only with distilled water. Different letters (a,b) above the columns represent statistically different means (T Student test; p < 0.05). The normal range of the reference values is limited by the dashed lines.
Nutraceuticals 02 00009 g002
Figure 3. Assessment of the glucose and hepatic enzymes (Aspartate aminotransferase (AST) and alanine aminotransferase (ALT)) serum levels of the animals after the time-course of experimental induction of hyperlipidemia status (Hyp) using oral administration of liquid butter. Animals of the control group (CTR) were subjected to fake procedures using distilled water. Different letters (a,b) above the columns represent statistically different means (T Student test; p < 0.05). The normal range of the reference values is limited by the dashed lines.
Nutraceuticals 02 00009 g003
Figure 4. Assessment of body weight and Lee obesity index of the animals after the time-course of experimental induction of hyperlipidemia status (Hyp) using oral administration of liquid butter. Animals of the control group (CTR) were subjected to fake procedures using distilled water. Different letters (a,b,c) above the columns represent statistically different means (ANOVA and Tukey’s test; p < 0.05).
Nutraceuticals 02 00009 g004
Figure 5. Assessment of lipidemic profile of the animals after treatment with oral administration of chitosan (Hyp–Ch), subjected to a standard protocol of physical exercises (Hyp–Ex) and combining both treatments (Hyp–ChEx). The control group is represented as CTR and the untreated hyperlipidemic group as Hyp. All data are expressed as mean ± SEM. Different letters (a,b,c) above the columns represent statistically different values (ANOVA and Tukey’s multiple comparisons tests; p < 0.05). The normal range of the reference values is limited by the dashed lines.
Nutraceuticals 02 00009 g005
Figure 6. Assessment of the glucose and hepatic enzymes (Aspartate aminotransferase (AST) and alanine aminotransferase (ALT)) serum levels of the animals after treatment with oral administration of chitosan (Hyp–Ch), subject to a standard protocol of physical exercises (Hyp–Ex) and combining both treatments (Hyp–ChEx). The Control group is represented as CTR and the untreated hyperlipidemic group as Hyp. All data are expressed as mean ± SEM. Different letters (a,b,c,d) above the columns represent statistically different values (ANOVA and Tukey’s multiple comparisons tests; p < 0.05). The normal range of the reference values is limited by the dashed lines.
Nutraceuticals 02 00009 g006
Figure 7. Assessment of fecal lipid and abdominal fat relative to the content of animals after treatment with oral administration of chitosan (Hyp–Ch), subjected to a standard protocol of physical exercises (Hyp–Ex), and the combination of both treatments (Hyp–ChEx). The control group is represented as CTR and the untreated hyperlipidemic group as Hyp. All data are expressed as mean ± SEM. Different letters (a,b,c) above the columns represent statistically different values (ANOVA and Tukey’s multiple comparisons tests; p < 0.05). The normal range of the reference values is limited by the dashed lines.
Nutraceuticals 02 00009 g007
Figure 8. Histological sections of HE-stained samples of liver of the experimental groups. (A,B) Usual morphological and architectural appearance of the hepatic parenchyma is shown in CTR. (C,D) Hyperlipidemic animals showing intense and diffuse cytoplasmic round-shaped vacuolar changes of hepatocytes compatible with lipidic inclusions (macrovesicular steatosis); focal areas of chronic inflammatory infiltrate and droplets of brownish granular pigment compatible with bilirubin are also observed. In some focal areas, the reminiscent normal hepatic parenchyma can be observed. (E,F) Hyperlipidemic group treated with chitosan administration (Hyp–Ch) showing multiple and large foci of macrovesicular steatosis permeating the normal hepatic parenchyma. (G,H) Hyperlipidemic group treated with physical exercises (Hyp–Ex) showing large focal areas of reminiscent macrovesicular steatosis. (I,J) Hyperlipidemic group treated with combined chitosan administration and physical exercises (Hyp–ChEx) showing scant and less extensive foci of macrovesicular steatosis. NHp: Normal hepatic parenchyma; MAe: Macrovesicular steatosis; InF: chronic inflammatory infiltrate; black arrows: bilirubin pigment; white arrows: steatotic hepatocytes.
Nutraceuticals 02 00009 g008aNutraceuticals 02 00009 g008b
Table 1. Distribution of experimental groups according to diet and recommended treatment.
Group (n = 8)Systemic StateOral TreatmentPhysical Exercise
CTRNormolipidemicDistilled water-
HypHyperlipidemicDistilled water-
Hyp–ChHyperlipidemicChitosan-
Hyp–ExHyperlipidemicDistilled waterForced swimming
Hyp–ChExHyperlipidemicChitosanForced swimming
Publisher’s Note: MDPI stays neutral with regard to jurisdictional claims in published maps and institutional affiliations.

