Article

Quantification of in Vivo Colonic Short Chain Fatty Acid Production from Inulin

1
Translational Research in Gastrointestinal Disorders, KU Leuven, Leuven 3000, Belgium
2
Leuven Food Science and Nutrition Research Centre, KU Leuven, Leuven 3000, Belgium
3
Clinical Department of Laboratory Medicine, University Hospitals Leuven, Leuven 3000, Belgium
4
Department of Pathology, Bacteriology and Avian Diseases, Ghent University, Merelbeke 9820, Belgium
5
Centre for Food and Microbial Technology, KU Leuven, Leuven 3000, Belgium
*
Author to whom correspondence should be addressed.
Nutrients 2015, 7(11), 8916-8929; https://doi.org/10.3390/nu7115440
Submission received: 27 August 2015 / Revised: 16 October 2015 / Accepted: 20 October 2015 / Published: 28 October 2015

Abstract

:
Short chain fatty acids (SCFA), including acetate, propionate, and butyrate, are produced during bacterial fermentation of undigested carbohydrates in the human colon. In this study, we applied a stable-isotope dilution method to quantify the in vivo colonic production of SCFA in healthy humans after consumption of inulin. Twelve healthy subjects performed a test day during which a primed continuous intravenous infusion with [1-13C]acetate, [1-13C]propionate and [1-13C]butyrate (12, 1.2 and 0.6 μmol·kg−1·min−1, respectively) was applied. They consumed 15 g of inulin with a standard breakfast. Breath and blood samples were collected at regular times during the day over a 12 h period. The endogenous rate of appearance of acetate, propionate, and butyrate was 13.3 ± 4.8, 0.27 ± 0.09, and 0.28 ± 0.12 μmol·kg−1·min−1, respectively. Colonic inulin fermentation was estimated to be 137 ± 75 mmol acetate, 11 ± 9 mmol propionate, and 20 ± 17 mmol butyrate over 12 h, assuming that 40%, 10%, and 5% of colonic derived acetate, propionate, and butyrate enter the systemic circulation. In conclusion, inulin is mainly fermented into acetate and, to lesser extents, into butyrate and propionate. Stable isotope technology allows quantifying the production of the three main SCFA in vivo and proved to be a practical tool to investigate the extent and pattern of SCFA production.

1. Introduction

Short chain fatty acids (SCFA), such as acetate, propionate and butyrate, are produced in the colon during bacterial fermentation of undigested carbohydrates and to a lesser extent of proteins. Carbohydrate fermentation predominates in the proximal colon where substrates are abundantly available for fermentation, which explains the decline in levels of luminal SCFA when progressing towards the distal colon [1]. SCFA production from undigested carbohydrates involves different steps. First, the undigested carbohydrates are broken down into monosaccharides via microbial hydrolysis. Secondly, the monosaccharides are fermented to phosphoenolpyruvate (PEP) via the Embden-Meyerhof-Parnas pathway. Finally, acetate, propionate and butyrate are produced from PEP via different reactions. Propionate is mainly produced via the succinate pathway and the acrylate pathway. The most important pathway is the succinate pathway utilized by Bacteriodetes and Negativicutes [2]. Production of acetate and butyrate require PEP conversion into acetyl-coenzyme A (acetyl-CoA). Acetate is formed directly from acetyl-CoA by many Firmicutes. Butyrate can be produced via either butyrate kinase or butyryl-CoA:acetate CoA-transferase. The latter is considered the most important route and is only possible in the presence of acetate [3]. Well-known bacteria using this pathway are Firmicutes belonging to Clostridium clusters IV and XIVa [4].
After production in the colon, SCFA are rapidly and almost completely absorbed by the colonocytes (only 5%–10% is excreted in feces) where part of them, in particular butyrate, are oxidized. In this way, SCFA are important energy substrates which contribute to up to 70% of the energy requirements of the colonocytes [5]. The remaining SCFA are transported through the portal vein into the liver. Measurement of fluxes of SCFA across the gut and liver in humans undergoing abdominal surgery indicated a significant uptake of propionate and butyrate (but not of acetate) by the liver which counterbalanced the release by the gut. In particular acetate and to a minor extent propionate were released into the systemic circulation whereas no splanchnic release of butyrate was observed [6].
Several in vitro studies as well as experiments in different laboratory and production animals have demonstrated the impact of SCFA on mammalian physiology. In addition, it has become evident that each of the individual SCFA affects health differently. For example, whereas acetate acts as a precursor for lipogenesis and cholesterol synthesis [7,8,9], propionate has been reported to inhibit acetate incorporation into cholesterol. Indeed, acetate incorporation in cholesterol was lower in healthy humans when acetate was rectally infused in combination with propionate than when it was infused alone [10]. Similarly, anti-inflammatory effects of the SCFA depend on the type of acid. Butyrate and propionate, but not acetate, inhibit histone deacetylases (HDACs) and affect in this way the expression of various genes [11]. Inhibition of HDACs prevents activation of NF-κB, which is one of the key transcription factors that regulate the expression of genes implicated in innate immunity, cell cycle control and apoptosis [12], and in the release of inflammatory cytokines [13]. A recent cell-based screening assay based on analysis of the activity of the NF-κB pathway showed that SCFA reduce NF-κB activity in the order butyrate > propionate >> acetate [14]. More recently, it was shown that inhibition of HDACs by butyrate and propionate induces the immunosuppressive enzymes indoleamine-2,3-dioxygenase (IDO1) and aldehyde dehydrogenase 2 (Ald1A2) in dendritic cells. This potentiates their ability to convert naïve T cells into FoxP3+ regulatory T cells and to suppress the conversion of naïve T cells into INF-γ + T cells [15]. In addition, the interaction of SCFA with G-protein coupled receptor (GPR) 43, also known as free fatty acid receptor (FFAR) 2, profoundly affects inflammatory processes which might explain the anti-inflammatory effect of acetate. In mice, stimulation of GPR43 by SCFAs was necessary for the normal resolution of inflammatory responses, as GPR43-deficient (Gpr43−/−) mice showed exacerbated or unresolving inflammation in models of colitis, arthritis, and asthma [16].
Activation of GPR43 (FFAR2) as well as of GPR41 (FFAR3) by SCFA has also been postulated as a mechanism by which SCFA regulate energy homeostasis. The selectivity of the SCFA for both receptors depends on their chain length. This explains the differential effects of each SCFA, with butyrate being more selective for GPR41, acetate more selective for GPR43, and propionate binding to both receptors [17]. In addition, propionate and butyrate, but not acetate, may activate intestinal gluconeogenesis (IGN), albeit by a different mechanism, leading to increased glucose levels in the portal vein. Butyrate acts through a cAMP-dependent mechanism, whereas propionate, itself a substrate of IGN, activates IGN gene expression via a gut-brain neural circuit involving GPR41. The increased glucose levels are sensed by a glucose sensor that transmits the signal to the brain by the peripheral nervous system to promote beneficial effects on food intake and glucose metabolism [18]. In contrast, propionate is the only SCFA that can be used as a precursor for gluconeogenesis in the liver [19,20]. Recently, a GPR-independent mechanism, common to each of the SCFA has been revealed. SCFA supplementation in mice down regulated peroxisome proliferator-activated receptor-γ (PPAR-γ) activity, resulting ultimately in a shift of the metabolism in adipose and liver tissue from lipogenesis to fatty acid oxidation [21].
In humans, evidence for the beneficial physiological effects of SCFA is more scarce. A major reason is the lack of reliable information on in vivo production and absorption kinetics of the individual SCFA. In view of the different mechanisms by which individual SCFA exert their physiological effects, it might well be important to not only know the total amount of SCFA formed, but also their relative proportions. Quantification of the in vivo colonic SCFA production is rather difficult due to the inaccessibility of the production site and the rapid absorption by the colonocytes. An elegant strategy to circumvent these difficulties is the use of stable isotope dilution. In this technique, a constant intravenous infusion of 13C-labeled SCFA is applied which results in a constant 13C-SCFA enrichment in blood. During fermentation of an undigestible carbohydrate in the colon unlabeled SCFA are produced that enter the circulation and dilute the 13C-SCFA, resulting in a decreased 13C-SCFA enrichment. In the present study we used stable isotope dilution to quantify acetate, propionate, and butyrate production in vivo in the human colon during fermentation of inulin as a model substrate.

2. Materials and Methods

2.1. Study Population

Twelve healthy men and women aged 18–65 year were included in the study. Inclusion criteria included a body mass index between 18.5 and 28.5 kg/m2 and a regular diet with three meals a day, at least five times a week. Exclusion criteria were a history of metabolic or gastrointestinal disease or former abdominal surgery (except for appendectomy), the use of antibiotics or any other medical treatment influencing gut transit or intestinal microbiota for at least three months, consumption of a low calorie or other special diet during the last month prior to the study, pregnancy or breastfeeding, diabetes (type 1 and 2), and hemoglobin (Hb) levels below reference values. The study protocol complied with the Helsinki Declaration and was approved by the Ethics Committee of the University of Leuven. All participants gave written informed consent. The study was registered at ClinicalTrial.gov (clinical trial number: NCT01757379).

2.2. Study Design

During the three days prior to the test day the subjects consumed a low fiber diet (consisting of maximum one piece of fruit and 100 g vegetables a day, and white flour instead of wholemeal products) and avoided alcohol consumption. On the evening before the test day a completely digestible and non-fermentable meal (lasagna) was consumed. After an overnight fast, the subjects presented at the laboratory and provided two basal breath samples for measurement of H2 and 14CO2. In both arms a catheter was introduced into an antecubital vein. One catheter was used to collect blood samples and via the second catheter a primed continuous infusion of 13C-labeled SCFA (sodium [1-13C]acetate: 6 μmol·kg−1 + 12 μmol·kg−1·h−1; sodium [1-13C]propionate: 0.6 μmol·kg−1 + 1.2 μmol·kg−1·h−1; sodium [1-13C]butyrate: 0.3 μmol·kg−1 + 0.6 μmol·kg−1·h−1) (99% 13C enrichment, Euriso-top, St. Aubin, Cédex, France) was administered. After collection of a basal blood sample, the infusion was started and the subjects received a standard breakfast (pancake; 8.4 g protein, 26.7 g carbohydrate, 11.2 g fat, 244 kcal) together with 15 g inulin (Raftilin HP (degree of polymerisation ranging from 2 to 60 with an average of 23) Beneo-Orafti, Mannheim, Germany) dissolved in 200 mL of water. To determine the time of arrival of the meal in the colon, inulin-14C-carboxylic acid (74 kBq, ARC, St. Louis, MO, USA) was added to the breakfast. After breakfast, breath samples were collected every 20 min for up to 10 h. Blood samples were collected every hour during the first 4 h, every 20 min from 4 to 9 h and every 40 min from 9 to 12 h. After 4 h and 8 h, the subjects received a standard, completely digestible meal (white bread with ham or cheese). Finally, all subjects delivered a fecal sample that was stored at 4 °C at home until it could be delivered in the laboratory where it was frozen at −80 °C within 10 h after collection until analysis.

2.3. Analytical Procedures

2.3.1. Analysis of Breath Samples

Breath samples for hydrogen analysis were collected in Exetainers© (Labco Ltd., Ceredigion, UK) and analyzed using a hydrogen monitor (M.E.C., Brussels, Belgium). Hydrogen excretion was expressed in parts per million (ppm). A significant increase in H2 in breath was defined as an increase of 2.5 times the standard deviation of all previous points above the running average of all previous points [22]. Breath samples for analysis of 14CO2 were collected by blowing through a pipette into a vial containing 2 mmol hyamine hydroxide until discoloration of the thymolphtaleine indicator, corresponding to the capture of 2 mmol CO2. The amount of 14CO2 was measured using β-scintillation counting (Packard Tricarb Liquid Scintillation Spectrometer, model 3375; Packard Instruments, Downers Grove, IL, USA) after addition of 10 mL of Hionic fluor (Perkin Elmer, Boston, MA, USA) and expressed as disintegrations per minute (dpm). The time of arrival of the meal in the colon was defined as the time at which a significant increase in 14CO2 was observed in the breath and was determined in a similar way as for H2.

2.3.2. Analysis of 13C Enrichment in Plasma Samples

Venous blood was sampled into EDTA tubes (BD Vacutainer®, Erembodegem, Belgium) and centrifuged to obtain plasma which was aliquoted and frozen at −80 °C. Plasma samples were thawed prior to analysis and prepared as described by Morrison et al. [23]. The 13C/12C ratio of SCFA was measured on a Delta plus-XP isotope ratio mass spectrometer (GC-C-IRMS, Thermo Fisher, Bremen, Germany) equipped with a trace gas chromatograph (Interscience, Breda, The Netherlands) and a combustion interface type 3 (Thermo Fisher). Separation of the SCFA was achieved with an AT-Aquawax-DA column (30 m × 0.53 mm, i.d., 1.00 μm, Grace, Lokeren, Belgium) on which 4 μL was injected splitless with the injector temperature at 240 °C. Helium 5.0 was used as carrier gas, at a constant flow of 2.5 mL/min. The oven temperature was first kept at 80 °C for 3 min, then ramped to 140 °C at 4 °C/min, further increased to 240 °C at 16 °C/min and then held for 1 min. The separated GC-effluents were online combusted to NOx, CO2, SO2, (SiO2)x, and H2O in an oxidation furnace (CuO/NiO/Pt) at 940 °C. NOx was reduced to N2 and, in addition, O2 bleed from the oxidation oven was removed by the reduction reactor operating at 640 °C. The produced water was removed by an online Nafion capillary (Thermo Fisher). The delta (δ13PDB) values were calculated using Isodat 2.0 software (Thermo Fisher) and expressed as atom percentage (AP). At any time point t, the measured AP was corrected for the baseline AP by subtracting it with the enrichment measured in the baseline sample which results in the atom per cent excess (APE) [24].

2.3.3. Analysis of Butyrate Producing Capacity in Fecal Samples

Quantitative PCR (qPCR) was used to quantify the abundance of Clostridium cluster IV, Clostridium cluster XIV, butyryl-CoA:acetate-CoA transferase and butyrate kinase genes in fecal samples using primers described elsewhere [25,26,27,28]. DNA was extracted from fecal samples using the CTAB (cetyltrimethylammonium bromide) method, as previously described by Griffiths et al. [29]. To 200 mg of fecal sample, 0.5 g of unwashed glass beads (Sigma-Aldrich, St. Louis, MO, USA), 0.5 mL of CTAB buffer (5.0% (w/v), 0.35 M NaCl, 120 mM K2HPO4) and 0.5 mL of phenol-chloroform-isoamyl alcohol (25:24:1) (Sigma-Aldrich, St. Louis, MO, USA) were added, followed by homogenization in a 2 mL destruction tube using a beadbeater (MagnaLyser, Roche, Basel, Switzerland). After centrifugation (10 min, 5900 g), 300 μL of the supernatant was transferred to a new Eppendorf tube. For a second time, 0.25 mL of CTAB buffer was added to the original DNA sample and 300 μL of the supernatant was added to the first 300 μL. The phenol was removed by mixing with an equal volume of chloroform-isoamyl alcohol (24:1) (Sigma-Aldrich, St. Louis, MO, USA) followed by centrifugation (10 s, 11,700 g) at room temperature. Total nucleic acids were subsequently precipitated from the extracted aqueous layer with two volumes of PEG-6000 solution (polyethyleenglycol 30% (w/v), 1.6 M NaCl) (Fluka BioChemika, Sigma-Aldrich, Bornem, Belgium) for 2 h at room temperature. After centrifugation (20 min, 9500 g), the pellet was rinsed with 1 mL of ice-cold 70% (v/v) ethanol and air dried prior to suspension in 100 μL RNase free water (VWR, Leuven, Belgium).
Amplification and detection (CFX96 Biorad Detection System, Biorad, Nazareth-Eke, Belgium) were carried out using 2× SensimixTM SYBR No-ROX mix (Bioline, Kampenhout, Belgium). Each reaction was done in triplicate in a 12.0 μL total reaction mixture using 2.0 μL of appropriate dilutions of the DNA sample and 0.5 μM (Clostridium cluster IV), 0.2 μM (Clostridium cluster XIV), 2.5 μM (butyryl-CoA:acetate-CoA transferase), 0.4 μM (butyrate kinase) final quantitative PCR primer concentration. The amplification program consisted of 1 cycle of 95 °C for 10 min, followed by 40 cycles of 95 °C for 30 s, 60 °C for 1 min (Clostridium cluster IV), 40 cycles of 95 °C for 30 s, 52 °C for 1 min (Clostridium cluster XIV), 40 cycles of 95 °C for 30 s, 53 °C for 30 s, 72 °C for 30 s (butyryl-CoA:acetate-CoA transferase), and 40 cycles of 95 °C for 30 s, 60 °C for 1 min, 72 °C for 30 s (butyrate kinase). A stepwise increase of the temperature from 55 to 95 °C (at 5 s/0.5 °C) was added to analyze melting curve data to confirm the specificity of the reactions.
PCR primers and DNA used for construction of the standard curves are listed in Table 1. After purification and determination of the DNA concentration, the volume of the linear double-stranded DNA standard was adjusted to 6.04 × 10⁸ copies·mL−1 assuming an average molecular weight of 660 per nucleotide pair. This stock solution was 10-fold serially-diluted to obtain a standard series from 6.04 × 10⁷ to 6.04 × 101 copies·mL−1. The copy numbers of samples were determined by reading off the standard series with the Ct values of the samples. Gene copy numbers were expressed as log10 values per gram wet weight of feces.
Table 1. Primers used for construction of standard curves for quantification of the butyrate producing capacity present in fecal samples.
Standard CurveDNA SourceOligonucleotideSequence (5′–3′)
Clostridium Cluster IVButyricicoccus pullicaecorumForward primerAGTACGGCCGCAAGGTTGAAA
Reverse primerCTGCCATTGTAGTACGTGTG
Clostridium Cluster XIVButyricicoccus pullicaecorumForward primerTGACCGGCCACATTGGGACTG
Reverse primerTCATCCCCACCTTCCTCCAG
Butyryl-CoA:acetate-CoA transferaseButyricicoccus pullicaecorumForward primerAATCCGGAGACTGGGTAGAT
Reverse primerGGACAGATAAGCTCCGAGC
Butyrate kinaseClostridium perfringensForward primerTGGGGGAGGAAAGTTATATGGC
Reverse primerCTCCTACTGAAACTCCGCCC

2.4. Calculations

In this study, it was assumed that the rate of SCFA appearance and that of the infusion of 13C-labeled SCFA enter into a single, homogenous, instantly-mixing pool from which sampling occurs. The rate of appearance (Ra; μmol·kg body weight−1·min−1) of acetate, propionate, and butyrate at each time point was calculated using the rate of infusion of 13C-SCFA (i), the isotopic enrichment of the infused SCFA (tracer enrichment), and the isotopic enrichment of the SCFA measured in plasma (plasma enrichment) according to Equation (1) [30]:
R a = i   x   [ ( T r a c e r   e n r i c h m e n t P l a s m a   e n r i c h m e n t ) 1 ]
with tracer and plasma enrichment expressed in atom percent excess (APE).
The endogenous Ra reflects the rate of SCFA appearance in the absence of colonic fermentation from the administered substrate. It was calculated from the mean plateau enrichment obtained during the first 3 h of the infusion. Endogenous Ra was subtracted from the whole body Ra to obtain the increase in SCFA originating from colonic fermentation of inulin (exogenous SCFA production). The cumulative recovery during the 12 h observation period was determined by calculating the area under the curve (AUC) of the exogenous Ra of the SCFA-time curve using the trapezoidal method and was multiplied by the body weight to yield total amount of SCFA recovered (in μmol) in plasma.
To estimate colonic production, total amounts of SCFA recovered in plasma during the 12 h observation period were multiplied by a bioavailability index that accounts for the extraction of the SCFA in the splanchnic bed [31]. Based on literature data, we assumed mean bioavailability indices of 40% [30], 10% [32] and 5% [6,33] for acetate, propionate, and butyrate, respectively. The bioavailability index of butyrate was based on the observation that the colonocytes remove approximately 90% [33,34] of butyrate and that subsequently more than 50% of the remaining butyrate is extracted by the liver [6].

2.5. Statistics

Statistical analyses were performed by using SPSS, version 22.0 (IBM, Brussels, Belgium). All results are presented as mean ± standard deviation. Normality was checked with the Shapiro-Wilk protocol. All analyses were performed using linear mixed models, paired t-tests or Pearson’s product-moment correlation coefficients, except for correlations including colonic butyrate production, whole-body Ra of propionate, and butyrate, which were analyzed using Spearman’s rho correlation coefficients. Pairwise comparisons using paired samples t-tests were corrected with false discovery rate (FDR) for multiple testing.

3. Results

3.1. Study Population

In total, 17 interested subjects attended a screening examination that included assessment of height and body weight, plasma hemoglobin levels, medical history and filling out a dietary questionnaire. Three subjects dropped out due to lack of time and two candidates were excluded because of hemoglobin levels below the reference values. Thus, 12 subjects performed the test day according to the protocol. Baseline characteristics are presented in Table 2.
Table 2. Baseline characteristics of the 12 healthy subjects who completed the study.
MenWomenp Value
N57
Age (year)27 ± 824 ± 40.530
Length (m)1.82 ± 0.091.65 ± 0.060.003
Weight (kg)78 ± 857 ± 40.005
Body mass index (kg/m2)24 ± 421 ± 20.149
log butyrate kinase (copies/g feces)3.83 ± 0.793.97 ± 0.80 *0.792
log butyryl-CoA:acetate-CoA transferase (copies/g feces)8.14 ± 0.497.85 ± 0.66 *0.429
log Clostridium cluster IV (copies/g feces)8.80 ± 0.588.67 ± 0.60 *0.662
log Clostridium cluster XIV (copies/g feces)9.72 ± 0.319.52 ± 0.47 *0.537
* n = 6, one female subject was not able to deliver a sample.

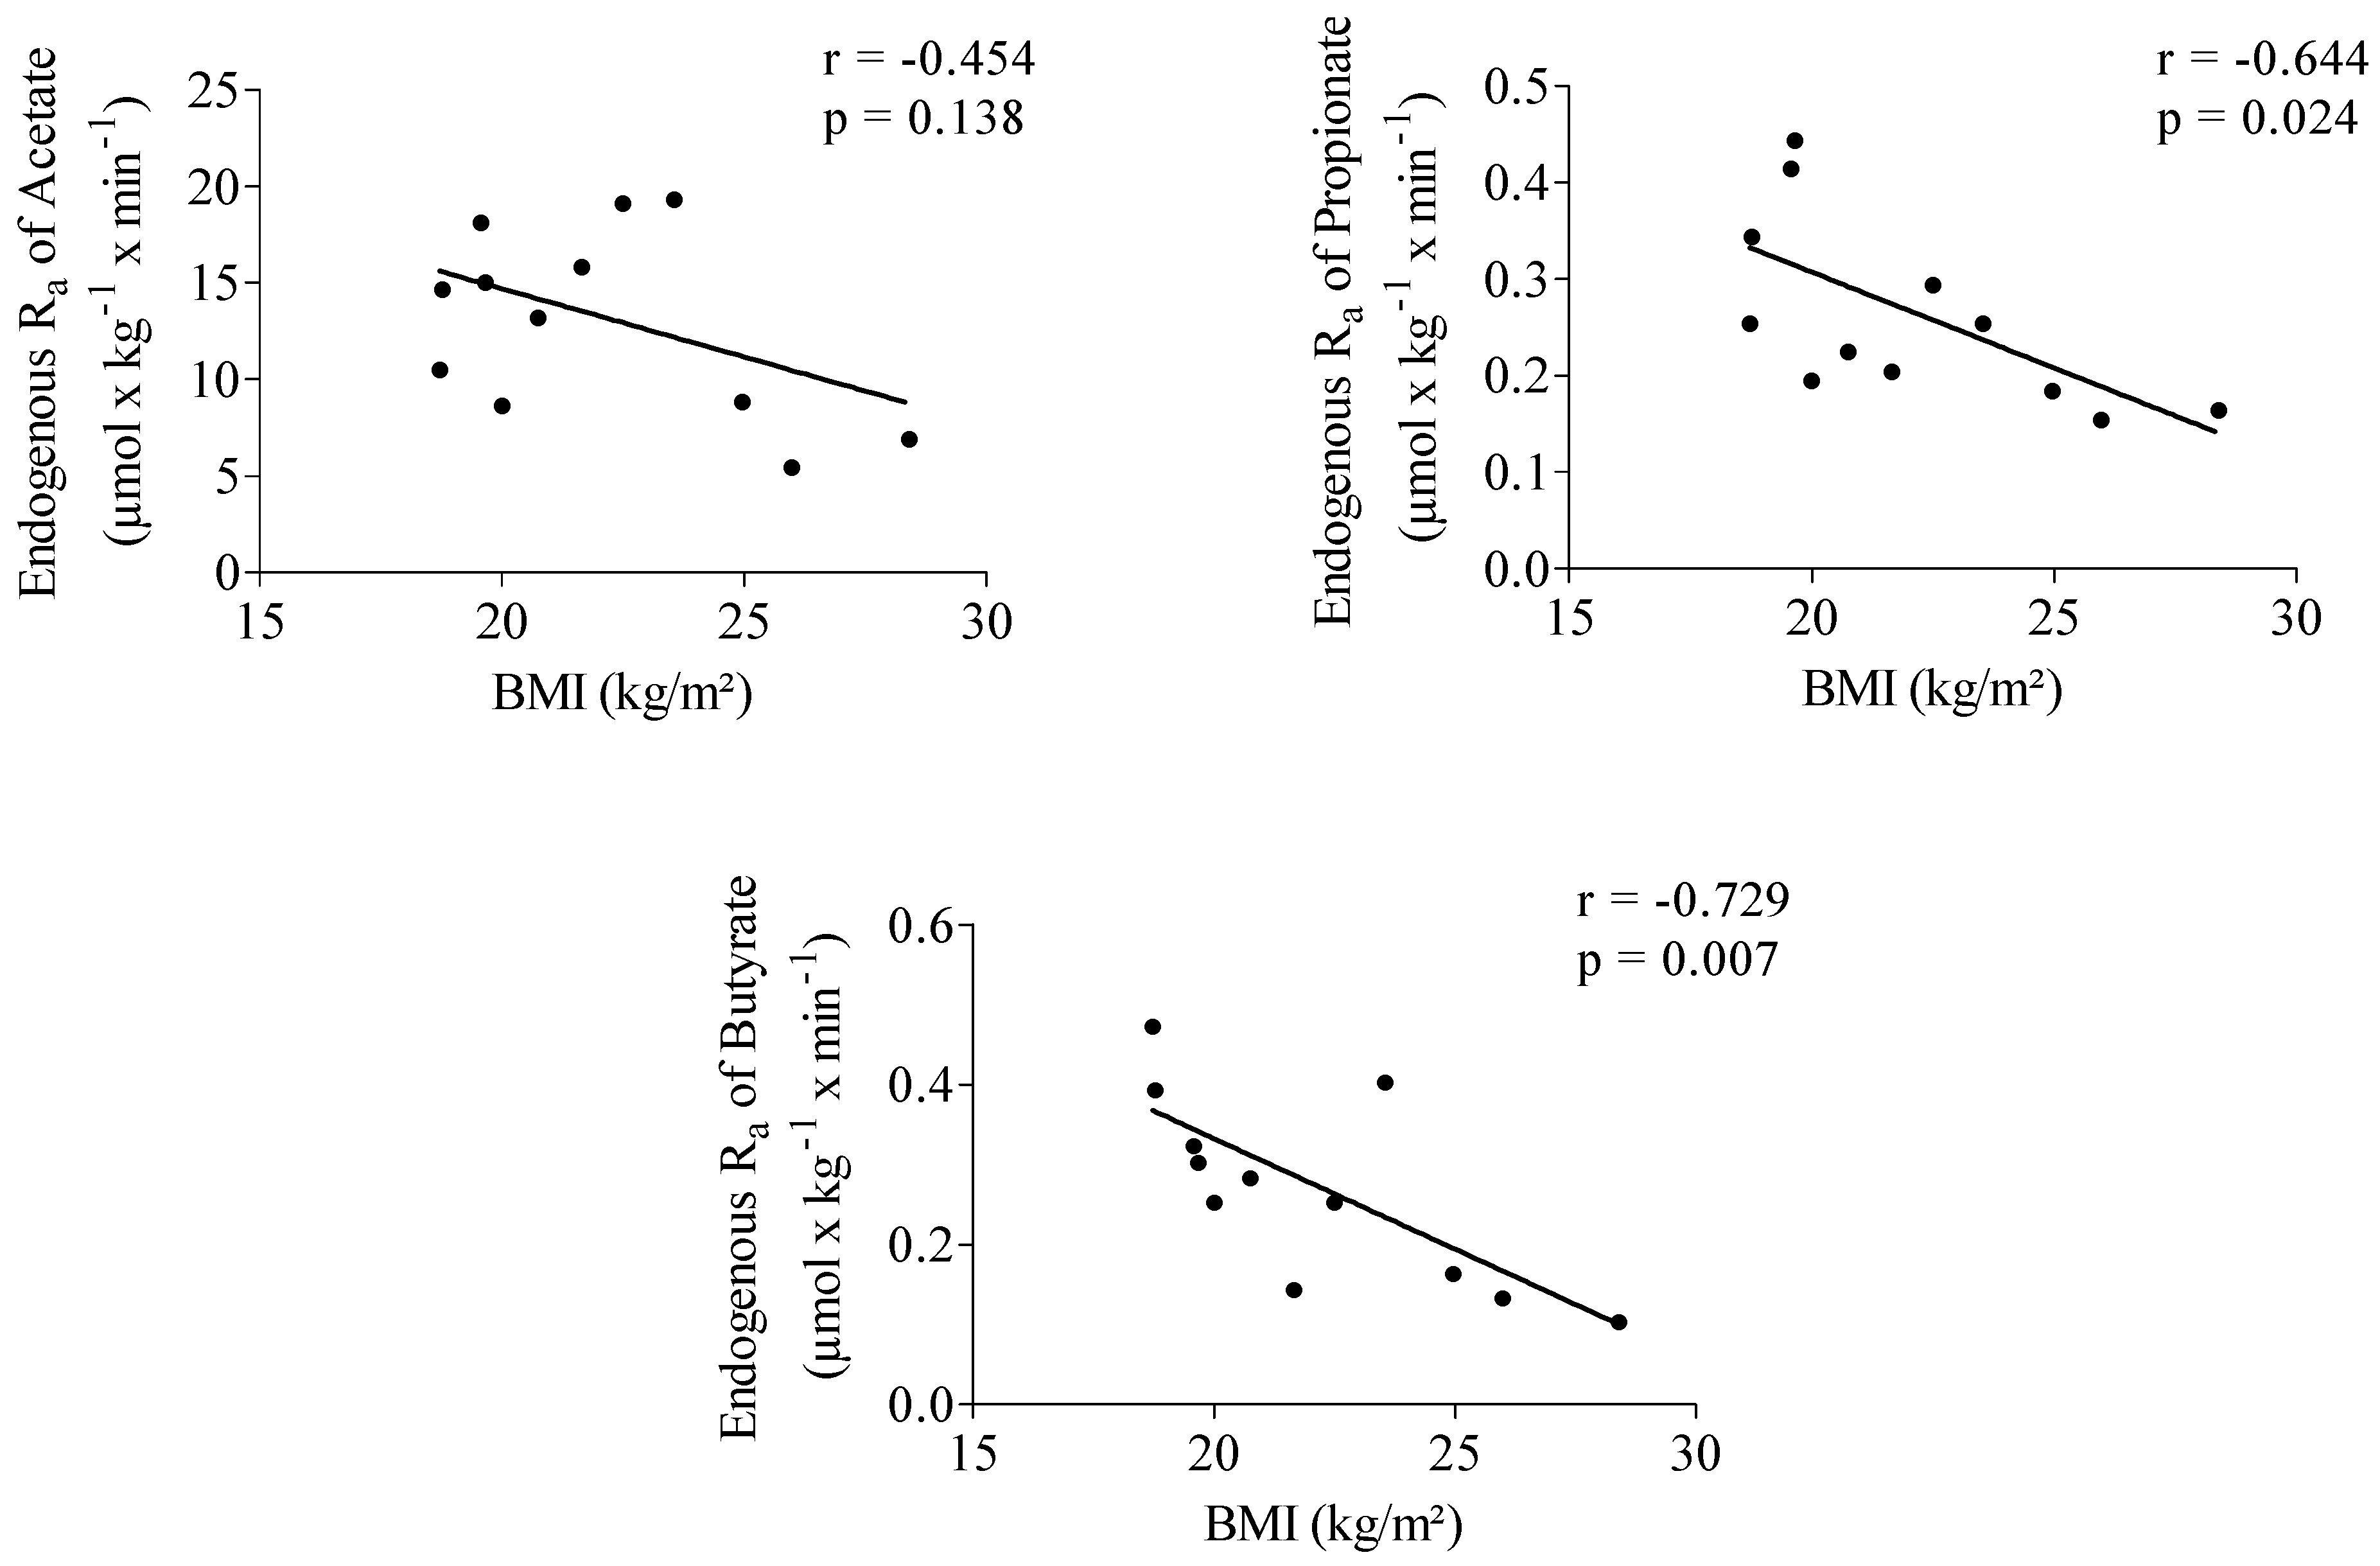
3.2. Steady-State Characteristics

At baseline, hydrogen excretion in breath was lower than 15 ppm in all subjects and remained unchanged up to about 240 min after breakfast. Endogenous Ra of SCFA was determined based on the plasma enrichments measured during the first three hours after inulin ingestion. No fermentation of inulin was observed during this period based on the breath hydrogen results implicating that no SCFA were produced in the colon and no SCFA were entering the plasma. Endogenous Ra was significantly higher for acetate compared to propionate and butyrate (p < 0.001, Table 3).
Table 3. The enrichments and rate of appearances (Ra) of acetate, propionate, and butyrate in plasma in healthy subjects before and during inulin fermentation. (APE: atom percent excess).
AcetatePropionateButyratep-Value
Isotopic enrichment (APE)Before inulin fermentation0.86 ± 0.36 a2.53 ± 0.74 b1.03 ± 0.47 a< 0.001
Minimum during fermentation0.48 ± 0.20 c1.60 ± 0.59 d0.61 ± 0.27 c< 0.001
Ra (μmol·kg−1·min−1)Before inulin fermentation13.26 ± 4.82 e0.27 ± 0.09 f0.28 ± 0.12 f< 0.001
Maximum during fermentation24.98 ± 10.70 g0.47 ± 0.23 h0.50 ± 0.29 h< 0.001
All values expressed as mean (±SD), n = 12. Measurements were statistically evaluated using linear mixed models and p-values refer to overall significance of the linear mixed model. Different letters in superscript indicate significant differences after pairwise comparisons using paired samples t-tests with false discovery rate (FDR) correction for multiple testing, p < 0.01.
Endogenous Ra of propionate showed a significantly positive correlation with acetate (r = 0.652, p = 0.022). No correlation was observed between the endogenous Ra of butyrate and acetate (r = 0.478, p = 0.116) and between Ra of butyrate and propionate (r = 0.551, p = 0.063). Propionate (r = −0.644, p = 0.024) and butyrate (r = −0.729, p = 0.007) endogenous Ra were significantly negatively correlated with body mass index (BMI) (Figure 1).
Figure 1. Correlation between acetate, propionate and butyrate endogenous rate of appearance (Ra) and body mass index (BMI). n = 12.
Nutrients 07 05440 g001

3.3. Impact of Inulin on Rate of Appearance of SCFA

3.3.1. Start of Fermentation

After arrival into the colon of the undigested part of the breakfast labeled with inulin-14C-carboxylic acid, the latter is fermented resulting in the production of 14CO2 which is excreted in breath. Arrival in the colon, thus indicated by the increased excretion of 14CO2 in breath, occurred 364 ± 87 min after consumption of the breakfast and was not significantly different (p = 0.094) from the time point of increased hydrogen excretion in breath (338 ± 94 min) indicating the start of fermentation of the unlabeled inulin.

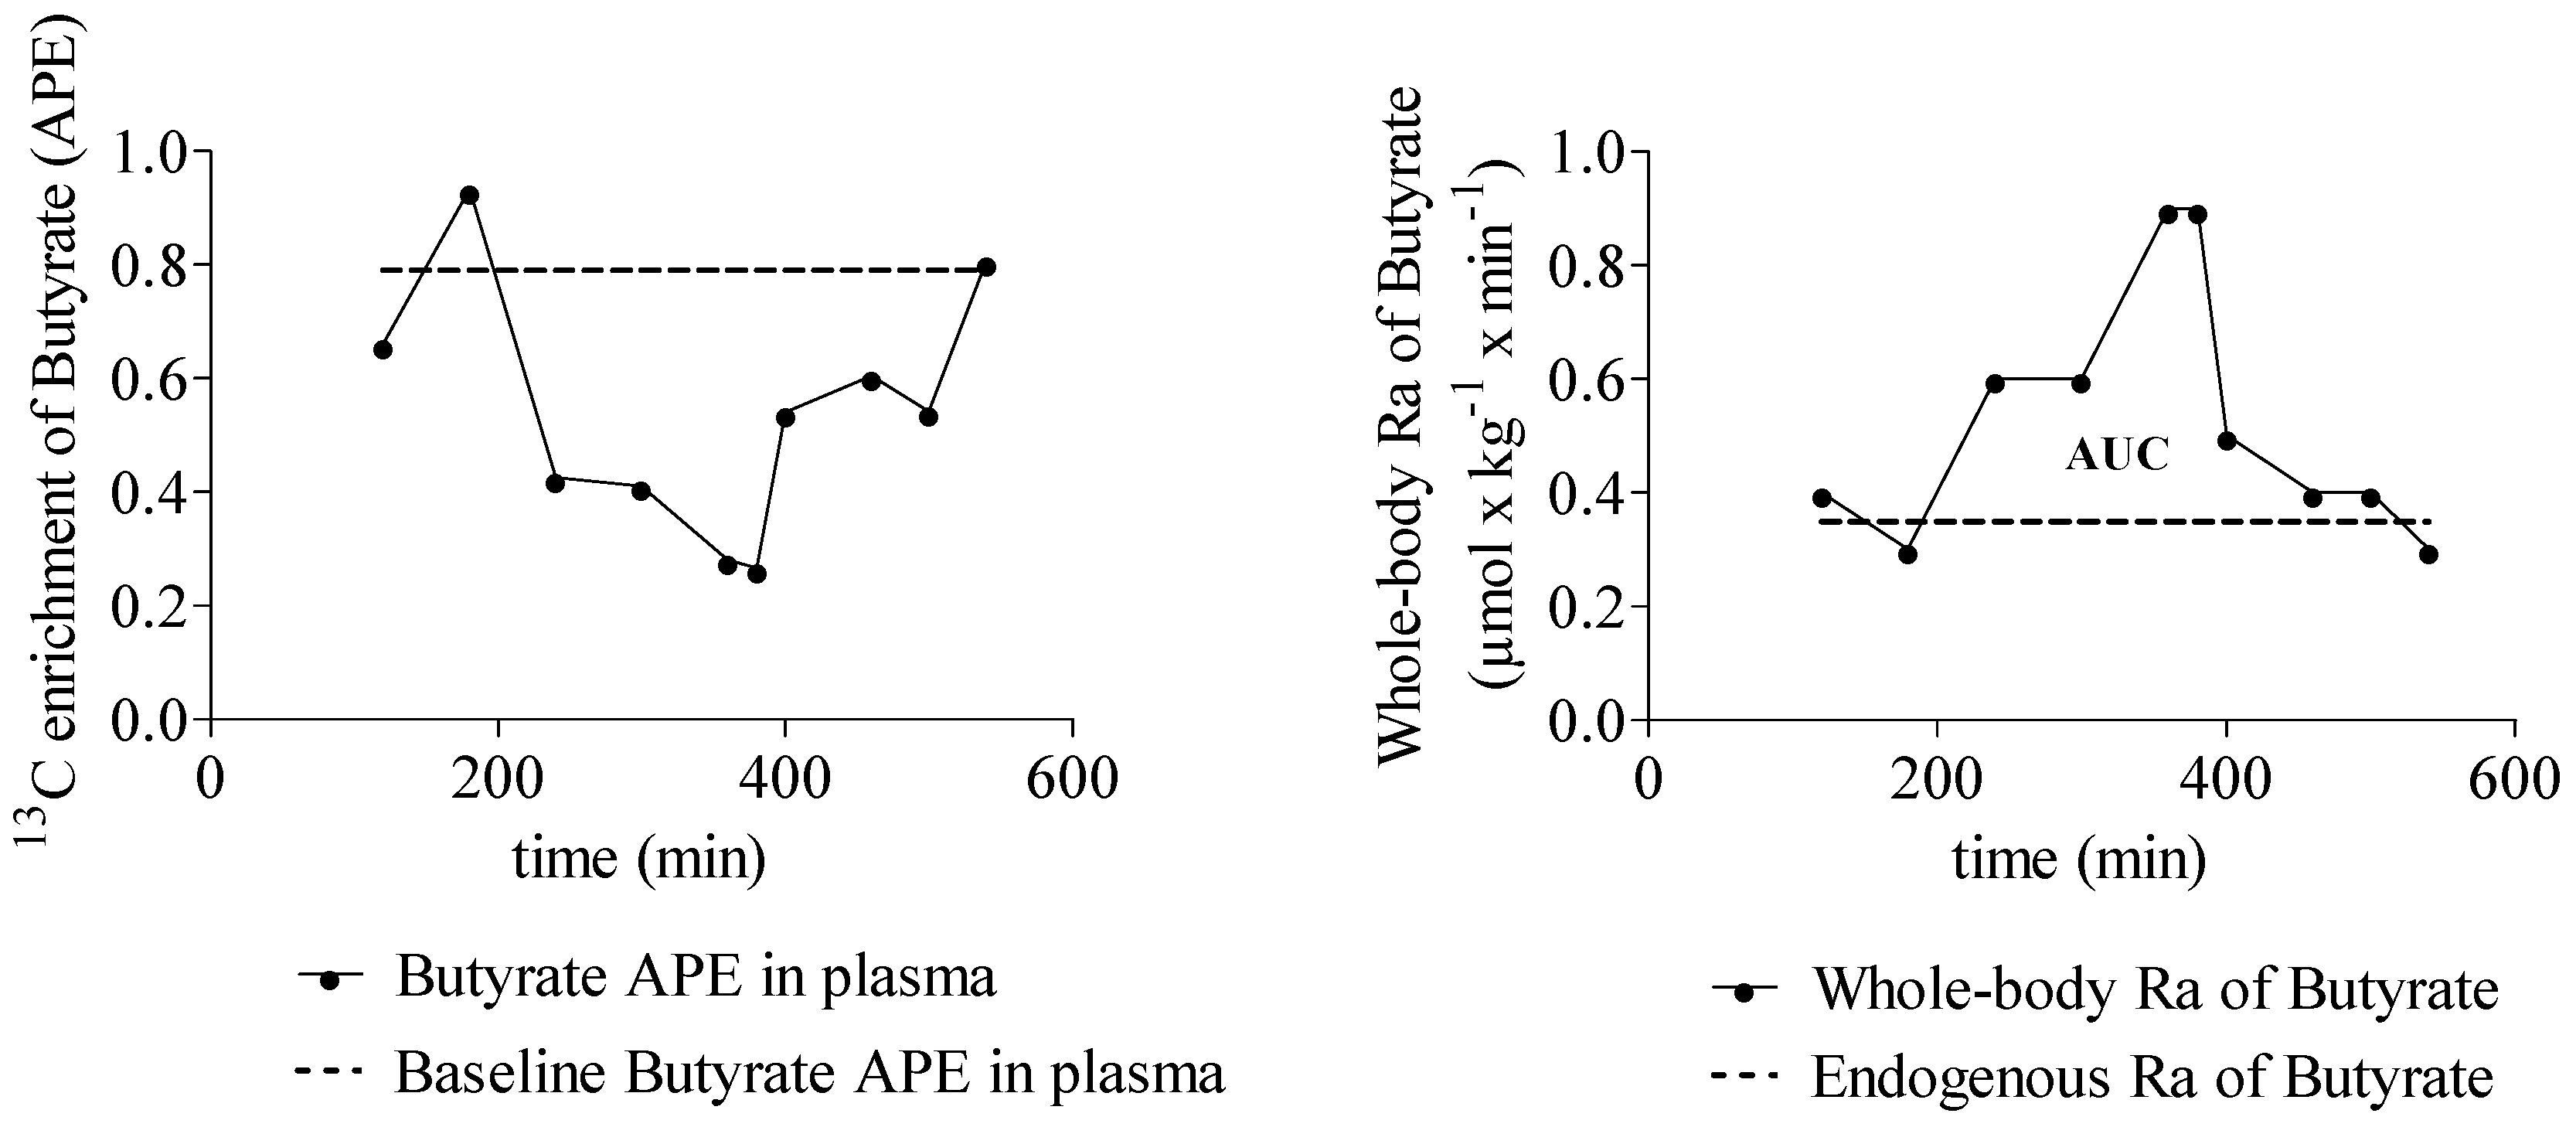
3.3.2. SCFA Enrichment in Plasma and Rate of SCFA Appearance

The Ra of SCFA increased significantly during fermentation of inulin (Table 3). A representative example of the 13C enrichment of butyrate and whole body Ra of butyrate in one subject is shown in Figure 2. A positive correlation was observed between whole-body Ra of propionate and butyrate (r = 0.657, p = 0.020). No correlations were observed between butyrate and acetate whole-body Ra and between propionate and acetate whole-body Ra.
Figure 2. Typical example that shows the 13C enrichment (APE) of butyrate in plasma over time and the whole-body rate of appearance (Ra) of butyrate over time. n = 1.
Nutrients 07 05440 g002

3.3.3. Quantification of SCFA Production from Inulin

Twelve hours after consumption of the inulin, the SCFA Ra of all subjects had returned to the endogenous Ra level. The cumulative amounts of exogenous SCFA production appearing in plasma amounted to 55 ± 30, 1.1 ± 0.9, and 1.0 ± 0.9 mmol for acetate, propionate, and butyrate, respectively (Table 4). The estimated colonic production was 137 ± 75 mmol for acetate, 11 ± 9 mmol for propionate, and 20 ± 17 mmol for butyrate over the 12 h period after inulin ingestion (Table 4). Production of SCFA was not related to the BMI of the subjects (p = 0.778, 0.749 and 0.633 for acetate, propionate, and butyrate, respectively).
Table 4. Cumulative amount (AUC) of exogenous short chain fatty acid (SCFA) production, SCFA in the peripheral circulation after consumption of 15 g of inulin in healthy subjects, and calculation of the amounts produced in the colon.
AcetatePropionateButyrate
Cumulative amount SCFA in plasma (μmol/kg)860 ± 49717 ± 1316 ± 15
Peripheral SCFA (mmol)55 ± 301.1 ± 0.91.0 ± 0.9
Colonic SCFA (mmol) *137 ± 7511 ± 920 ± 17
Ratio (%) **82612
* Calculated based on literature data assuming that a constant percentage of colonic derived acetate (40% [27]), propionate (10% [29]), and butyrate (5% [3,30]) appear in plasma; ** The ratio indicates the contribution of acetate, propionate and butyrate to the total amount of colonic produced SCFA expressed as molar ratio.

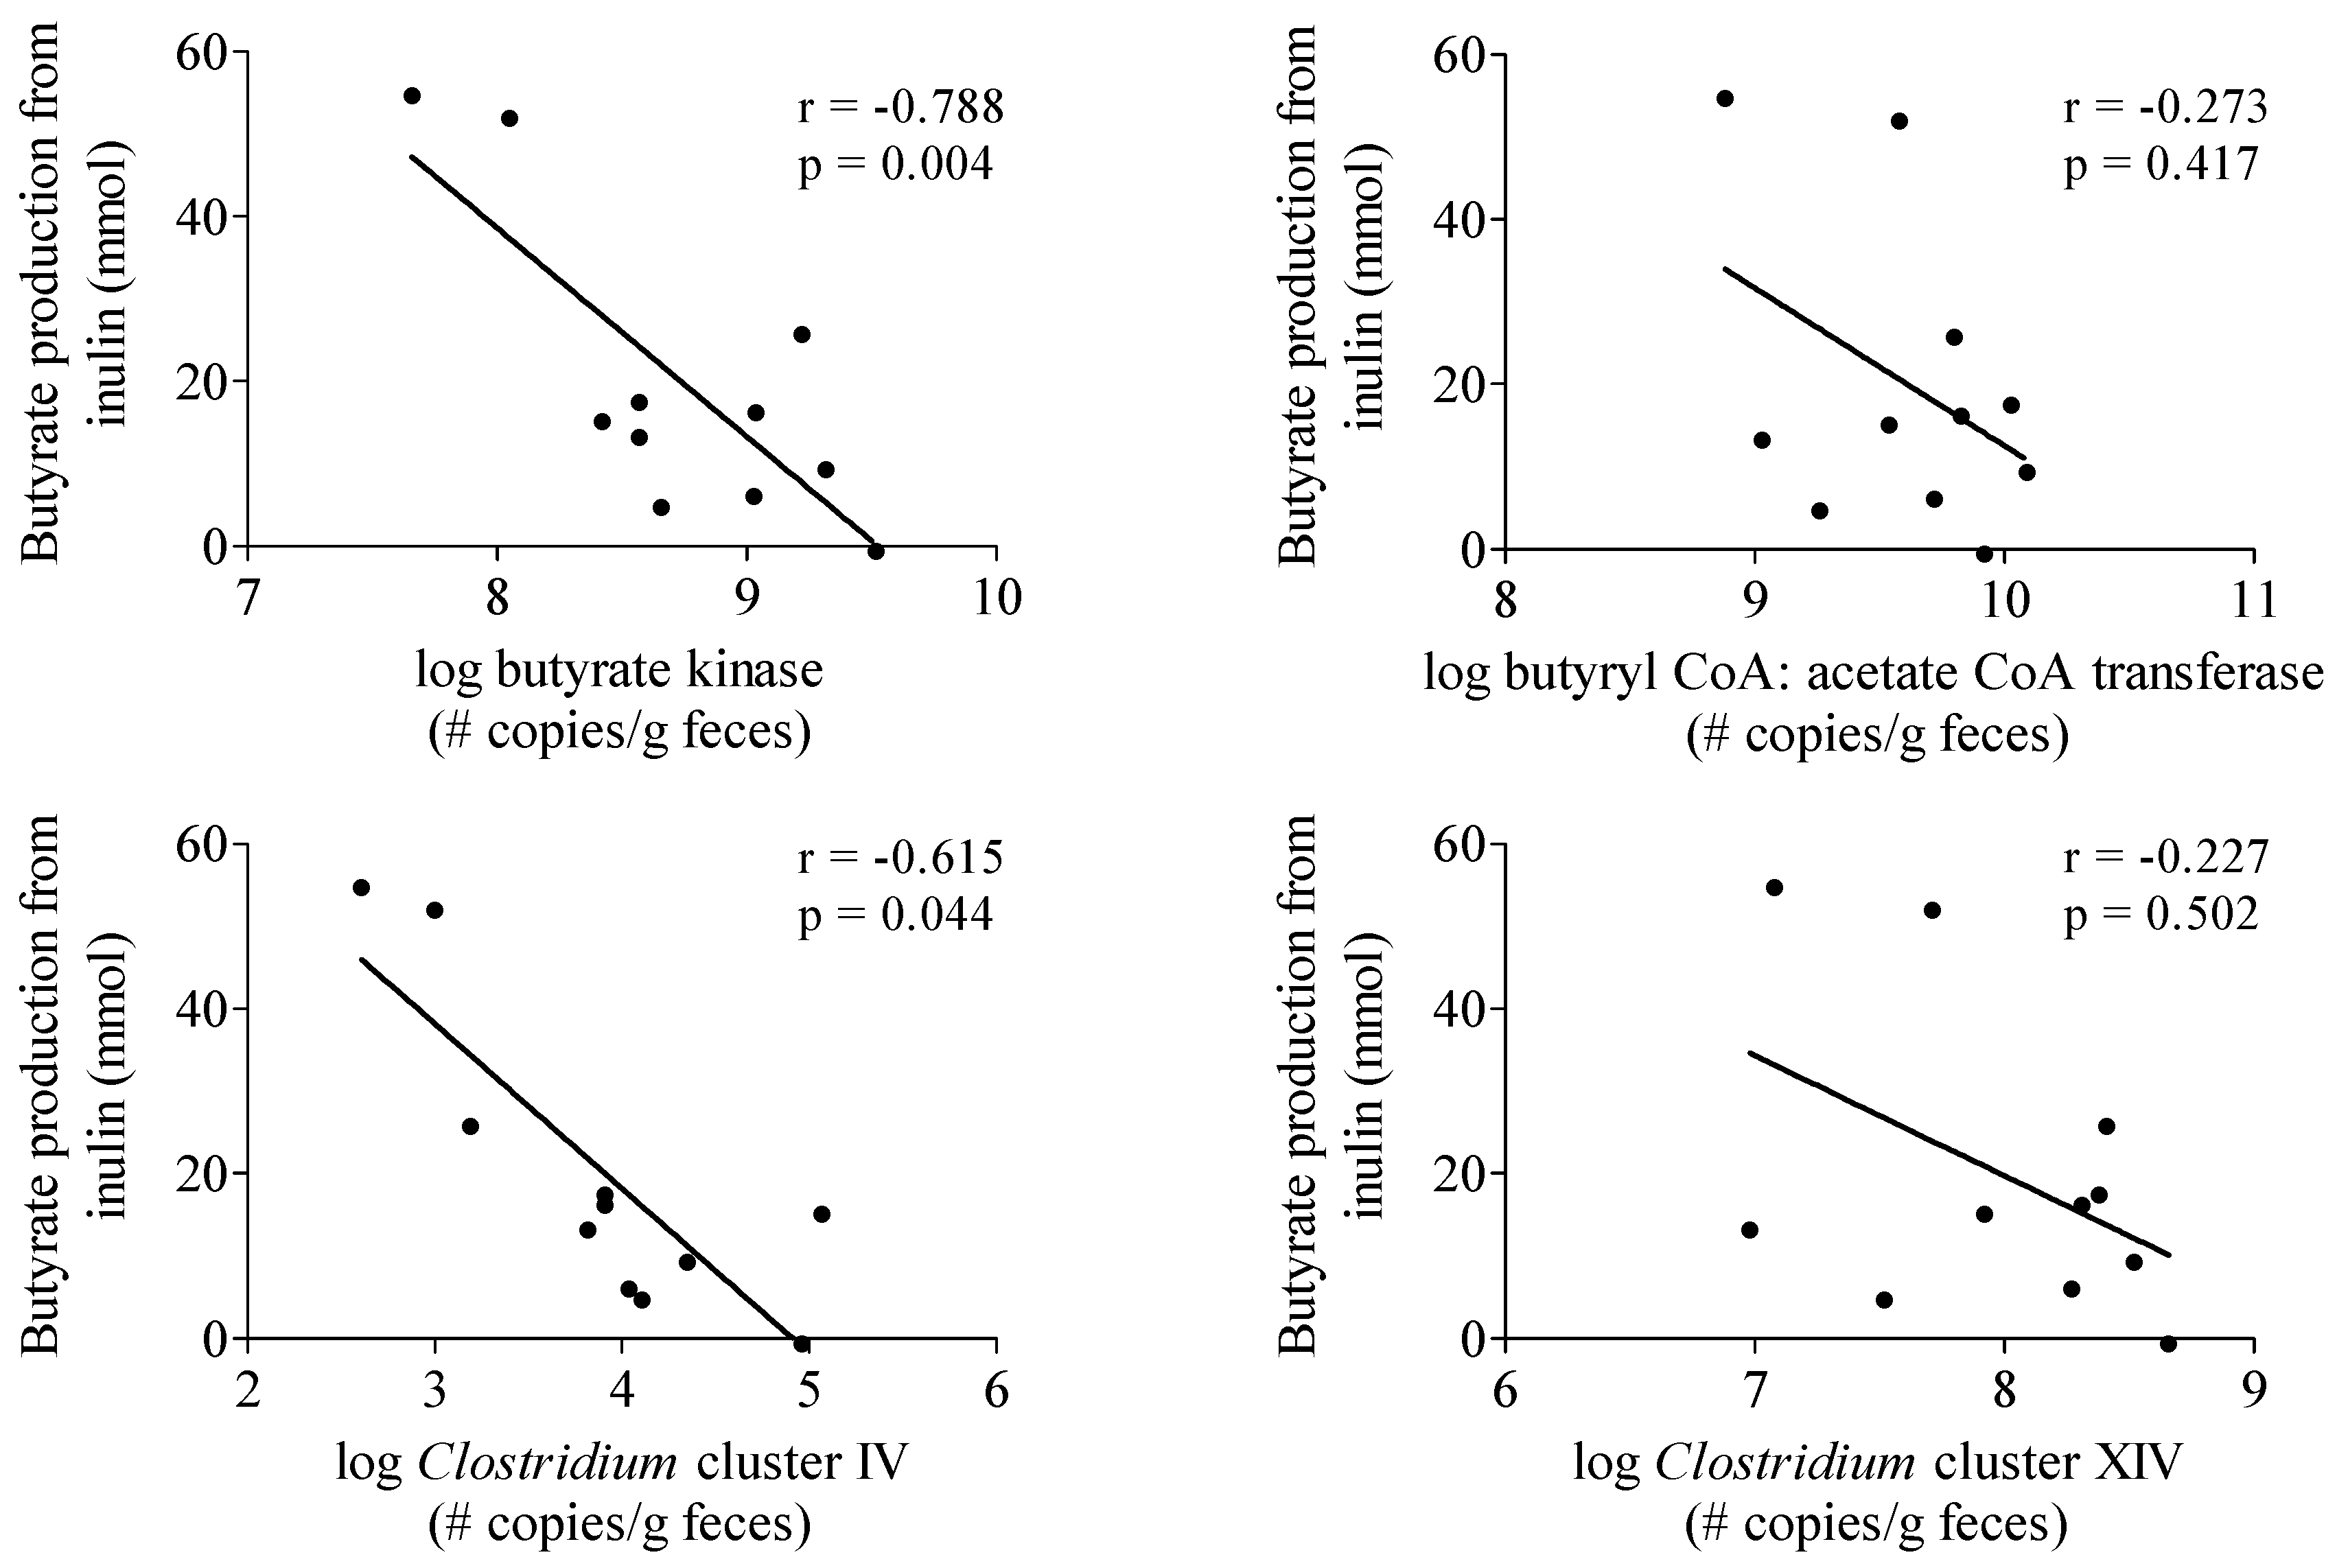
3.3.4. Butyrate-Producing Capacity

To investigate whether the production of butyrate from inulin depended on the intestinal microbiota composition of the subjects, the butyrate-producing capacity in a fecal sample obtained from each subject was determined (Table 2). No correlation was observed between butyrate production from inulin and butyrate butyryl-CoA:acetate CoA-transferase and Clostridium cluster XIVa genes (Figure 3). In contrast, butyrate production was negatively correlated with butyrate kinase (r = −0.788, p = 0.004) and Clostridium cluster IV genes (r = −0.615, p = 0.044) (Figure 3).
Figure 3. Correlation between butyrate production from inulin and parameters of butyrate producing capacity. n = 11, one subject was not able to deliver a sample.
Nutrients 07 05440 g003

4. Discussion

Much of the currently available information on SCFA production has been obtained from in vitro experiments. The simplest experimental setups used fecal microbiota as inoculum in anaerobic batch fermentations, whether or not pH controlled [35,36]. However, these conditions do not adequately mimic the in vivo situation as fecal microbiota do not represent the microbiota in the proximal colon [37]. In addition, fermentation products accumulate in the medium and may affect ongoing reactions. More sophisticated models include the Simulator of the Human Intestinal Microbial Ecosystem (SHIME®, University of Ghent, Gent, Belgium) [38,39] that harbors a microbial community resembling that from the human colon both in fermentation activity and composition. The TNO intestinal models TIM-1 and TIM-2 (TNO, Zeist, The Netherlands) consist of vessels connected with flexible walls to allow simulation of peristalsis. In addition, the vessels are equipped with a hollow fiber membrane to absorb water and SCFA [40]. In human intervention studies, fecal SCFA concentrations have often been measured as an approximation of the in vivo SCFA production [41]. However, this does not provide a true reflection of SCFA production since SCFA are absorbed and utilized by the colon epithelial cells. Similarly, plasma SCFA concentrations are the net result of production, absorption, and splanchnic extraction of the SCFA and do not adequately reflect colonic generation either. The use of stable isotopes provides an attractive alternative to quantify in vivo SCFA production. Stable isotope dilution techniques have been used in the past to study acetate kinetics in animals and humans [30,42,43].
In this study, we have shown that such approaches can also be applied for quantifying propionate and butyrate production. Indeed, they allow calculating total Ra of SCFA which, in steady state conditions, equals the rate of SCFA disappearance from the pool by either uptake in the tissues or by excretion in urine or other routes [44]. The total Ra of SCFA is composed of the amount of SCFA that is produced in the human body (exogenous and endogenous) and the amount of SCFA infused in a single pool. To determine the whole-body SCFA Ra, as used in the present study, the tracer infusion rate was subtracted from the total Ra of SCFA. We assumed no contribution from colonic fermentation to the whole-body SCFA Ra to happen during the first 3–4 h of the test day, as the subjects had consumed a low fiber diet for the three previous days and a fiber free dinner on the evening prior to the test. Indeed, breath hydrogen levels were below 15 ppm in all subjects for up to 4 h.
Endogenous Ra of acetate obtained in this study are slightly higher than in previously published studies in humans (6.0–11.4 μmol·kg−1·min−1) [23,30,31,45]. Morrison et al. found higher endogenous acetate Ra (22.5 μmol·kg−1·min−1) in two subjects after repeated oral doses of a tracer solution containing both [1-13C]acetate and [2H3]acetate to mimic an intravenous infusion. Only one study has previously reported endogenous Ra of propionate. In four healthy subjects after intravenous infusion of both 1-[13C]-propionate and [2H5]-propionate, they found values of 17.6 μmol·kg−1·h−1 and 17.5 μmol·kg−1·h−1, respectively [46]. Our results of 0.27 μmol·kg−1·min−1 or (expressed differently as) 16.2 μmol·kg−1·h−1 are in good agreement with those results. To our knowledge, no information is available on the kinetics of butyrate in humans. Pouteau et al. measured endogenous Ra of acetate, propionate, and butyrate in rats and found a butyrate Ra that was 96 times lower than acetate and 13 times lower than propionate Ra [47]. In our study, the Ra of butyrate was very similar to that of propionate and only 47 times lower than that of acetate.
To convert plasma Ra of SCFA into the amount of SCFA produced in the colon, the exogenous Ra of SCFA versus time curves were integrated to yield total amounts of SCFA in plasma and multiplied by a bioavailability index that accounts for the extraction of the SCFA in the splanchnic bed [31]. Based on literature data, we used mean bioavailability indices of 40%, 10%, and 5% for acetate, propionate and butyrate, respectively. In this way, we calculated that colonic fermentation of inulin per gram of substrate yields 9.13 mmol of acetate, 0.72 mmol of propionate, and 1.31 mmol of butyrate which is in the same range as results from previous in vitro studies. Yet, these in vitro studies showed a broad range in amounts of SCFA produced from inulin ranging from 1.7 to 26.2 mmol/g carbohydrate for acetate, 0.1–14.7 mmol/g carbohydrate for propionate, and 0.18–11.48 mmol/g carbohydrate for butyrate [35,36,48,49,50,51,52,53]. Using the same bioavailability index for acetate, Pouteau et al. calculated a colonic production of 7 mmol of acetate per gram of administered lactulose [31].
Proportions of acetate:propionate:butyrate (82:6:12) confirm previous results indicating that fermentation of inulin-type fructans results in a relatively higher production of acetate compared to other indigestible carbohydrates, such as resistant starch, polydextrose, arabinogalactan, and arabinoxylan [54,55]. Remarkably, most subjects (8 out of 12) favored butyrate production over propionate production, whereas most in vitro studies report higher propionate than butyrate levels [35,49,50,53]. Nevertheless, some in vitro batch fermentation studies with inulin showed higher butyrate than propionate production [36,48]. In addition, fermentation of inulin (degree of polymerization ranging from 2 to 60 with an average of 10) in the TIM-2 model also yielded a higher proportion of butyrate compared to propionate [55].
We observed considerable inter-individual variation in the Ra of SCFA which is in agreement with other studies reporting large variability in plasma SCFA concentrations in humans [6,56]. A factor that might explain this variability is the composition of the intestinal microbiota. In particular butyrate production depends on cross-feeding, i.e. acetate conversion into butyrate, and the presence of specific butyrate producing bacteria, mainly belonging to the Clostridium clusters IV and XIVa [57]. In view of the high phylogenetic diversity in human butyrate producers, functionall-based approaches have been developed. Genes involved in the pathways of butyrate production such as the butyryl-CoA:acetate CoA transferase and butyrate kinase gene can be amplified using degenerate primers that recognize multiple phylogenetic groups [26]. Surprisingly, the amount of butyrate produced from inulin, as estimated from the Ra of butyrate in plasma, was not positively correlated to any of the parameters of butyrate producing capacity. The relatively low number of subjects might, at least partially, explain the lack of positive correlation. However, these results may also indicate that parameters other than microbiota composition, such as absorption and splanchnic extraction of the SCFA, have a more profound impact on the Ra of butyrate in plasma.
Some, but not all, studies report higher fecal SCFA levels in obese subjects compared to normal weight persons [58,59,60]. Higher fecal SCFA levels have been related to higher colonic production and an increased energy harvest from undigested carbohydrates in the obese [61]. In contrast, several animal studies indicate that treatment with SCFA can reduce or reverse gains in body weight and adiposity [18,21,62]. In the present study, no increase in SCFA production in subjects with higher BMI could be confirmed. However, we found a significant negative correlation between endogenous Ra of propionate and butyrate with BMI, indicating that the rate of appearance of those acids in plasma is higher in subjects with lower BMI. Although plasma propionate and butyrate mainly originate from colonic fermentation, this does not necessarily point at a higher colonic production of those SCFA in low BMI subjects as also the absorption by the colonocytes and the splanchnic extraction may depend on BMI. Ra of acetate, which is also produced endogenously during fatty acid oxidation and glucose or amino acid metabolism, was not related to BMI. It needs to be mentioned that the BMI of the participants varied between 18.5 and 28.5 with no obese subjects participating in the study.
The major limitation of this study is the uncertainty about the SCFA bioavailability, i.e., the fraction of SCFA produced in the colon that reaches the systemic circulation. Due to a lack of individual data, we relied on estimates for bioavailability reported in literature and used the same value for each individual. Stable isotope studies might also be useful to quantify SCFA bioavailabilities; for example, by introducing known amounts of labeled SCFA in the colon and quantifying the resulting labeled SCFA in the plasma, and to evaluate the impact of possible confounding factors as BMI and microbiota composition.

5. Conclusions

In the present study, we used a stable-isotope dilution technique to quantify the production of the three major SCFA in the colon of healthy subjects after consumption of inulin as a model substrate. However, the method is easily applicable to any other dietary fiber that is fermented into SCFA. Quantification of the amounts of total SCFA and of the proportion of the individual SCFA produced in vivo from different dietary fibers will facilitate the further evaluation of health benefits attributed to SCFA.

Acknowledgments

This research was conducted in the framework of the W. K. Kellogg Chair in Cereal Science and Nutrition at the KU Leuven (chair holders J.A. Delcour and K. Verbeke). Fruitful discussions with C.M. Courtin (KU Leuven), L. Sanders, K. Spence, J. Reid, A. Birkett, and R. McDermott (Kellogg Company, Battle Creek, MI, USA) are highly appreciated.

Author Contributions

E.B. and K.V. conceived and designed the study; E.B. performed the test days; E.B., E.H., L.D. and K.Ve. performed the analyses; J.A.D. and S.V.G. contributed to the revision of the manuscript; E.B. and K.V. wrote the paper.

Conflicts of Interest

The authors declare no conflict of interest.

References

  1. Cummings, J.H.; Pomare, E.W.; Branch, W.J.; Naylor, C.P.; Macfarlane, G.T. Short chain fatty acids in human large intestine, portal, hepatic and venous blood. Gut 1987, 28, 1221–1227. [Google Scholar] [CrossRef] [PubMed]
  2. Reichardt, N.; Duncan, S.H.; Young, P.; Belenguer, A.; McWilliam Leitch, C.; Scott, K.P.; Flint, H.J.; Louis, P. Phylogenetic distribution of three pathways for propionate production within the human gut microbiota. ISME J. 2014, 8, 1323–1335. [Google Scholar] [CrossRef] [PubMed]
  3. Louis, P.; Duncan, S.H.; McCrae, S.I.; Millar, J.; Jackson, M.S.; Flint, H.J. Restricted distribution of the butyrate kinase pathway among butyrate-producing bacteria from the human colon. J. Bacteriol. 2004, 186, 2099–2106. [Google Scholar] [CrossRef] [PubMed]
  4. Louis, P.; Hold, G.L.; Flint, H.J. The gut microbiota, bacterial metabolites and colorectal cancer. Nat. Rev. Microbiol. 2014, 12, 661–672. [Google Scholar] [CrossRef] [PubMed]
  5. Roediger, W.E. Role of anaerobic bacteria in the metabolic welfare of the colonic mucosa in man. Gut 1980, 21, 793–798. [Google Scholar] [CrossRef] [PubMed]
  6. Bloemen, J.G.; Venema, K.; van de Poll, M.C.; Olde Damink, S.W.; Buurman, W.A.; Dejong, C.H. Short chain fatty acids exchange across the gut and liver in humans measured at surgery. Clin. Nutr. 2009, 28, 657–661. [Google Scholar] [CrossRef] [PubMed]
  7. Hellerstein, M.K.; Christiansen, M.; Kaempfer, S.; Kletke, C.; Wu, K.; Reid, J.S.; Mulligan, K.; Hellerstein, N.S.; Shackleton, C.H. Measurement of de novo hepatic lipogenesis in humans using stable isotopes. J. Clin. Investig. 1991, 87, 1841–1852. [Google Scholar] [CrossRef] [PubMed]
  8. Hellman, L.; Rosenfeld, R.S.; Gallagher, T.F. Cholesterol synthesis from C14-acetate in man. J. Clin. Investig. 1954, 33, 142–149. [Google Scholar] [CrossRef] [PubMed]
  9. Raiford, R.L.; Wong, H.Y. In vivo incorporation of acetate-1-C14 into cholesterol and fatty acids following testosterone propionate administration. Circ. Res. 1962, 11, 753–757. [Google Scholar] [CrossRef] [PubMed]
  10. Wolever, T.M.; Spadafora, P.; Eshuis, H. Interaction between colonic acetate and propionate in humans. Am. J. Clin. Nutr. 1991, 53, 681–687. [Google Scholar] [PubMed]
  11. Tan, J.; McKenzie, C.; Potamitis, M.; Thorburn, A.N.; Mackay, C.R.; Macia, L. The role of short-chain fatty acids in health and disease. Adv. Immunol. 2014, 121, 91–119. [Google Scholar] [PubMed]
  12. Tedelind, S.; Westberg, F.; Kjerrulf, M.; Vidal, A. Anti-inflammatory properties of the short-chain fatty acids acetate and propionate: A study with relevance to inflammatory bowel disease. World J. Gastroenterol. 2007, 13, 2826–2832. [Google Scholar] [PubMed]
  13. Hayden, M.S.; West, A.P.; Ghosh, S. NF-κB and the immune response. Oncogene 2006, 25, 6758–6780. [Google Scholar] [CrossRef] [PubMed]
  14. Meijer, K.; Vonk, R.J.; Priebe, M.G.; Roelofsen, H. Cell-based screening assay for anti-inflammatory activity of bioactive compounds. Food Chem. 2015, 166, 158–164. [Google Scholar] [CrossRef] [PubMed]
  15. Gurav, A.; Sivaprakasam, S.; Bhutia, Y.D.; Boettger, T.; Singh, N.; Ganapathy, V. Slc5a8, a Na+-coupled high-affinity transporter for short-chain fatty acids, is a conditional tumor suppressor in colon that protects against colitis and colon cancer under low-fiber dietary conditions. Biochem. J. 2015, in press. [Google Scholar] [CrossRef] [PubMed]
  16. Maslowski, K.M.; Vieira, A.T.; Ng, A.; Kranich, J.; Sierro, F.; Yu, D.; Schilter, H.C.; Rolph, M.S.; Mackay, F.; Artis, D.; et al. Regulation of inflammatory responses by gut microbiota and chemoattractant receptor GPR43. Nature 2009, 461, 1282–1286. [Google Scholar] [CrossRef] [PubMed]
  17. Hara, T.; Kashihara, D.; Ichimura, A.; Kimura, I.; Tsujimoto, G.; Hirasawa, A. Role of free fatty acid receptors in the regulation of energy metabolism. Biochim. Biophys. Acta 2014, 1841, 1292–1300. [Google Scholar] [CrossRef] [PubMed]
  18. De Vadder, F.; Kovatcheva-Datchary, P.; Goncalves, D.; Vinera, J.; Zitoun, C.; Duchampt, A.; Backhed, F.; Mithieux, G. Microbiota-generated metabolites promote metabolic benefits via gut-brain neural circuits. Cell 2014, 156, 84–96. [Google Scholar] [CrossRef] [PubMed]
  19. Leng, R.A.; Steel, J.W.; Luick, J.R. Contribution of propionate to glucose synthesis in sheep. Biochem. J. 1967, 103, 785–790. [Google Scholar] [CrossRef] [PubMed]
  20. Den Besten, G.; Lange, K.; Havinga, R.; van Dijk, T.H.; Gerding, A.; van Eunen, K.; Muller, M.; Groen, A.K.; Hooiveld, G.J.; Bakker, B.M.; et al. Gut-derived short-chain fatty acids are vividly assimilated into host carbohydrates and lipids. Am. J. Physiol. Gastrointest. Liver Physiol. 2013, 305, G900–G910. [Google Scholar] [CrossRef] [PubMed]
  21. Den Besten, G.; Bleeker, A.; Gerding, A.; van Eunen, K.; Havinga, R.; van Dijk, T.H.; Oosterveer, M.H.; Jonker, J.W.; Groen, A.K.; Reijngoud, D.J.; et al. Short-chain fatty acids protect against high-fat diet-induced obesity via a ppargamma-dependent switch from lipogenesis to fat oxidation. Diabetes 2015, 64, 2398–2408. [Google Scholar] [CrossRef] [PubMed]
  22. Geypens, B.; Bennink, R.; Peeters, M.; Evenepoel, P.; Mortelmans, L.; Maes, B.; Ghoos, Y.; Rutgeerts, P. Validation of the lactose-[13C]ureide breath test for determination of orocecal transit time by scintigraphy. J. Nucl. Med. 1999, 40, 1451–1455. [Google Scholar] [PubMed]
  23. Morrison, D.J.; Cooper, K.; Waldron, S.; Slater, C.; Weaver, L.T.; Preston, T. A streamlined approach to the analysis of volatile fatty acids and its application to the measurement of whole-body flux. Rapid Commun. Mass Spectrom. 2004, 18, 2593–2600. [Google Scholar] [CrossRef] [PubMed]
  24. Verbeke, K.; Ferchaud-Roucher, V.; Preston, T.; Small, A.C.; Henckaerts, L.; Krempf, M.; Wang, H.; Vonk, R.J.; Priebe, M.G. Influence of the type of indigestible carbohydrate on plasma and urine short-chain fatty acid profiles in healthy human volunteers. Eur. J. Clin. Nutr. 2010, 64, 678–684. [Google Scholar] [CrossRef] [PubMed]
  25. Matsuki, T.; Watanabe, K.; Fujimoto, J.; Takada, T.; Tanaka, R. Use of 16s rRNA gene-targeted group-specific primers for real-time PCR analysis of predominant bacteria in human feces. Appl. Environ. Microbiol. 2004, 70, 7220–7228. [Google Scholar] [CrossRef] [PubMed]
  26. Louis, P.; Flint, H.J. Development of a semiquantitative degenerate real-time PCR-based assay for estimation of numbers of butyryl-coenzyme a (COA) COA transferase genes in complex bacterial samples. Appl. Environ. Microbiol. 2007, 73, 2009–2012. [Google Scholar] [CrossRef] [PubMed]
  27. Song, Y.; Liu, C.; Finegold, S.M. Real-time PCR quantitation of clostridia in feces of autistic children. Appl. Environ. Microbiol. 2004, 70, 6459–6465. [Google Scholar] [CrossRef] [PubMed]
  28. Vital, M.; Penton, C.R.; Wang, Q.; Young, V.B.; Antonopoulos, D.A.; Sogin, M.L.; Morrison, H.G.; Raffals, L.; Chang, E.B.; Huffnagle, G.B.; et al. A gene-targeted approach to investigate the intestinal butyrate-producing bacterial community. Microbiome 2013, 1, 8. [Google Scholar] [CrossRef] [PubMed]
  29. Griffiths, R.I.; Whiteley, A.S.; O’Donnell, A.G.; Bailey, M.J. Rapid method for coextraction of DNA and RNA from natural environments for analysis of ribosomal DNA- and rRNA-based microbial community composition. Appl. Environ. Microbiol. 2000, 66, 5488–5491. [Google Scholar] [CrossRef] [PubMed]
  30. Pouteau, E.; Piloquet, H.; Maugeais, P.; Champ, M.; Dumon, H.; Nguyen, P.; Krempf, M. Kinetic aspects of acetate metabolism in healthy humans using [1-13C]acetate. Am. J. Physiol. 1996, 271, E58–E64. [Google Scholar] [PubMed]
  31. Pouteau, E.; Vahedi, K.; Messing, B.; Flourie, B.; Nguyen, P.; Darmaun, D.; Krempf, M. Production rate of acetate during colonic fermentation of lactulose: A stable-isotope study in humans. Am. J. Clin. Nutr. 1998, 68, 1276–1283. [Google Scholar] [PubMed]
  32. Vogt, J.A.; Ishii-Schrade, K.B.; Pencharz, P.B.; Wolever, T.M. l-Rhamnose increases serum propionate after long-term supplementation, but lactulose does not raise serum acetate. Am. J. Clin. Nutr. 2004, 80, 1254–1261. [Google Scholar] [PubMed]
  33. Cook; Sellin. Review article: Short chain fatty acids in health and disease. Aliment. Pharmacol. Ther. 1998, 12, 499–507. [Google Scholar] [CrossRef] [PubMed]
  34. Van der Beek, C.M.; Bloemen, J.G.; van den Broek, M.A.; Lenaerts, K.; Venema, K.; Buurman, W.A.; Dejong, C.H. Hepatic uptake of rectally administered butyrate prevents an increase in systemic butyrate concentrations in humans. J. Nutr. 2015, 145, 2019–2024. [Google Scholar] [CrossRef] [PubMed]
  35. De Preter, V.; Falony, G.; Windey, K.; Hamer, H.M.; De Vuyst, L.; Verbeke, K. The prebiotic, oligofructose-enriched inulin modulates the faecal metabolite profile: An in vitro analysis. Mol. Nutr. Food Res. 2010, 54, 1791–1801. [Google Scholar] [CrossRef] [PubMed]
  36. Stewart, M.L.; Timm, D.A.; Slavin, J.L. Fructooligosaccharides exhibit more rapid fermentation than long-chain inulin in an in vitro fermentation system. Nutr. Res. 2008, 28, 329–334. [Google Scholar] [CrossRef] [PubMed]
  37. Marteau, P.; Pochart, P.; Dore, J.; Bera-Maillet, C.; Bernalier, A.; Corthier, G. Comparative study of bacterial groups within the human cecal and fecal microbiota. Appl. Environ. Microbiol. 2001, 67, 4939–4942. [Google Scholar] [PubMed]
  38. Possemiers, S.; Verthe, K.; Uyttendaele, S.; Verstraete, W. PCR-DGGE-based quantification of stability of the microbial community in a simulator of the human intestinal microbial ecosystem. FEMS Microbiol. Ecol. 2004, 49, 495–507. [Google Scholar] [CrossRef] [PubMed]
  39. Grootaert, C.; Van den Abbeele, P.; Marzorati, M.; Broekaert, W.F.; Courtin, C.M.; Delcour, J.A.; Verstraete, W.; Van de Wiele, T. Comparison of prebiotic effects of arabinoxylan oligosaccharides and inulin in a simulator of the human intestinal microbial ecosystem. FEMS Microbiol. Ecol. 2009, 69, 231–242. [Google Scholar] [CrossRef] [PubMed]
  40. Reimer, R.A.; Maathuis, A.J.; Venema, K.; Lyon, M.R.; Gahler, R.J.; Wood, S. Effect of the novel polysaccharide polyglycoplex(r) on short-chain fatty acid production in a computer-controlled in vitro model of the human large intestine. Nutrients 2014, 6, 1115–1127. [Google Scholar] [PubMed]
  41. McOrist, A.L.; Miller, R.B.; Bird, A.R.; Keogh, J.B.; Noakes, M.; Topping, D.L.; Conlon, M.A. Fecal butyrate levels vary widely among individuals but are usually increased by a diet high in resistant starch. J. Nutr. 2011, 141, 883–889. [Google Scholar] [CrossRef] [PubMed]
  42. Bergman, E.N.; Wolff, J.E. Metabolism of volatile fatty acids by liver and portal-drained viscera in sheep. Am. J. Physiol. 1971, 221, 586–592. [Google Scholar] [PubMed]
  43. Alam, M.K.; Sasaki, M.; Al-Mamun, M.; Sano, H. Plasma acetate turnover rate and rumen fermentation characteristics in sheep fed rice straw supplemented with soybean meal. J. Animal Sci. Adv. 2013, 3, 65–73. [Google Scholar] [CrossRef]
  44. Wolfe, R.R. Radioactive and stable isotope tracers in biomedicine. In Principles and Practice of Kinetic Analysis; Wiley-Liss: New York, NY, USA, 1992. [Google Scholar]
  45. Ferchaud-Roucher, V.; Pouteau, E.; Piloquet, H.; Zair, Y.; Krempf, M. Colonic fermentation from lactulose inhibits lipolysis in overweight subjects. Am. J. Physiol. Endocrinol. Metab. 2005, 289, E716–E720. [Google Scholar] [CrossRef] [PubMed]
  46. Walter, J.H.; Thompson, G.N.; Leonard, J.V.; Heatherington, C.S.; Bartlett, K. Measurement of propionate turnover in vivo using sodium [2H5]propionate and sodium [13C]propionate. Clin. Chim. Acta Int. J. Clin. Chem. 1989, 182, 141–150. [Google Scholar] [CrossRef]
  47. Pouteau, E.; Rochat, F.; Jann, A.; Meirim, I.; Sanchez-Garcia, J.L.; Ornstein, K.; German, B.; Ballevre, O. Chicory increases acetate turnover, but not propionate and butyrate peripheral turnovers in rats. Br. J. Nutr. 2008, 99, 287–296. [Google Scholar] [CrossRef] [PubMed]
  48. Hughes, S.A.; Shewry, P.R.; Li, L.; Gibson, G.R.; Sanz, M.L.; Rastall, R.A. In vitro fermentation by human fecal microflora of wheat arabinoxylans. J. Agric. Food Chem. 2007, 55, 4589–4595. [Google Scholar] [CrossRef] [PubMed]
  49. Velázquez, M.; Davies, C.; Marett, R.; Slavin, J.L.; Feirtag, J.M. Effect of oligosaccharides and fibre substitutes on short-chain fatty acid production by human faecal microflora. Anaerobe 2000, 6, 87–92. [Google Scholar] [CrossRef]
  50. Timm, D.A.; Stewart, M.L.; Hospattankar, A.; Slavin, J.L. Wheat dextrin, psyllium, and inulin produce distinct fermentation patterns, gas volumes, and short-chain fatty acid profiles in vitro. J. Med. Food 2010, 13, 961–966. [Google Scholar] [CrossRef] [PubMed]
  51. Rycroft, C.E.; Jones, M.R.; Gibson, G.R.; Rastall, R.A. A comparative in vitro evaluation of the fermentation properties of prebiotic oligosaccharides. J. Appl. Microbiol. 2001, 91, 878–887. [Google Scholar] [CrossRef] [PubMed]
  52. Gomez, E.; Tuohy, K.M.; Gibson, G.R.; Klinder, A.; Costabile, A. In vitro evaluation of the fermentation properties and potential prebiotic activity of agave fructans. J. Appl. Microbiol. 2010, 108, 2114–2121. [Google Scholar] [PubMed]
  53. Noack, J.; Timm, D.; Hospattankar, A.; Slavin, J. Fermentation profiles of wheat dextrin, inulin and partially hydrolyzed guar gum using an in vitro digestion pretreatment and in vitro batch fermentation system model. Nutrients 2013, 5, 1500–1510. [Google Scholar] [CrossRef] [PubMed]
  54. Wang, X.; Gibson, G.R. Effects of the in vitro fermentation of oligofructose and inulin by bacteria growing in the human large intestine. J. Appl. Bacteriol. 1993, 75, 373–380. [Google Scholar] [CrossRef] [PubMed]
  55. Van den Abbeele, P.; Venema, K.; Van de Wiele, T.; Verstraete, W.; Possemiers, S. Different human gut models reveal the distinct fermentation patterns of arabinoxylan versus inulin. J. Agric. Food Chem. 2013, 61, 9819–9827. [Google Scholar] [CrossRef] [PubMed]
  56. Peters, S.G.; Pomare, E.W.; Fisher, C.A. Portal and peripheral blood short chain fatty acid concentrations after caecal lactulose instillation at surgery. Gut 1992, 33, 1249–1252. [Google Scholar] [CrossRef] [PubMed]
  57. Louis, P.; Flint, H.J. Diversity, metabolism and microbial ecology of butyrate-producing bacteria from the human large intestine. FEMS Microbiol. Lett. 2009, 294, 1–8. [Google Scholar] [CrossRef] [PubMed]
  58. Schwiertz, A.; Taras, D.; Schafer, K.; Beijer, S.; Bos, N.A.; Donus, C.; Hardt, P.D. Microbiota and SCFA in lean and overweight healthy subjects. Obesity (Silver Spring) 2010, 18, 190–195. [Google Scholar] [CrossRef] [PubMed]
  59. Rahat-Rozenbloom, S.; Fernandes, J.; Gloor, G.B.; Wolever, T.M. Evidence for greater production of colonic short-chain fatty acids in overweight than lean humans. Int. J. Obes. (Lond.) 2014, 38, 1525–1531. [Google Scholar] [CrossRef] [PubMed]
  60. Fernandes, J.; Su, W.; Rahat-Rozenbloom, S.; Wolever, T.M.; Comelli, E.M. Adiposity, gut microbiota and faecal short chain fatty acids are linked in adult humans. Nutr. Diabetes 2014, 4, e121. [Google Scholar] [CrossRef] [PubMed]
  61. Turnbaugh, P.J.; Ley, R.E.; Mahowald, M.A.; Magrini, V.; Mardis, E.R.; Gordon, J.I. An obesity-associated gut microbiome with increased capacity for energy harvest. Nature 2006, 444, 1027–1031. [Google Scholar] [CrossRef] [PubMed]
  62. Lin, H.V.; Frassetto, A.; Kowalik, E.J., Jr.; Nawrocki, A.R.; Lu, M.M.; Kosinski, J.R.; Hubert, J.A.; Szeto, D.; Yao, X.; Forrest, G.; et al. Butyrate and propionate protect against diet-induced obesity and regulate gut hormones via free fatty acid receptor 3-independent mechanisms. PLoS ONE 2012, 7, e35240. [Google Scholar] [CrossRef] [PubMed]

