3.1. Concentrations of Main Components of FBTE
The high-dose FBTE was used as the sample for components analysis. All determination results showed that soluble sugar is the main component in FBTE, followed by tea polyphenols, total flavones, and caffeine; total free amino acids are at the lowest level of the components. The precise content is given in
Table 2.
Table 2.
Concentrations of main components of Fuzhuan brick-tea extract (g/100 mL).
Table 2.
Concentrations of main components of Fuzhuan brick-tea extract (g/100 mL).
| Total Free Amino Acids | Tea Polyphenols | Total Flavones | Caffeine | Soluble Sugar |
|---|
| 0.25 | 3.89 | 2.43 | 1.12 | 4.20 |
3.4. Blood Biochemistry
The middle- and high-FTBE dosages both improved total protein content in infected mice, but the middle dose was more effective (
p < 0.05). The middle dose improved albumin content, with a significant difference between groups B and D (
p < 0.01). All the groups receiving FBTE exhibited decreased serum triglycerides (
p < 0.05) compared to both the normal and infection model groups. None of the five groups exhibited significant differences in TC (total cholesterol), BS (blood sugar), or ALT (alanine aminotransferase). AST (aspartate transaminase), however, was significantly higher in the infection model group than in controls (
p < 0.01), and it was significantly reduced in the middle- and high-dose FBTE groups (
p < 0.05); data shown in
Table 4.
Table 4.
Results of blood biochemical tests of mice from each of the five groups (n = 10, ± s).
Table 4.
Results of blood biochemical tests of mice from each of the five groups (n = 10, ± s).
| Groups | Total Protein (TP) (g/L) | Albumin (ALB) (g/L) | Triacylglycerol (TG) (mmoL/L) | Total Cholesterol (TC) (mmoL/L) | Blood Sugar (BS) (mmoL/L) | Alanine Aminotransferase (ALT) (U/L) | Aspartate Transaminase (AST) (U/L) | Blood Urea Nitrogen (UREA) (mmoL/L) | Creatinine (CREA) (µmoL/L) |
|---|
| Normal (A) | 54.98 ± 7.34 | 41.72 ± 5.28 | 1.55 ± 0.27 | 3.08 ± 0.93 | 3.28 ± 1.18 | 68.80 ± 16.63 | 142.21 ± 27.46 | 5.92 ± 1.62 | 46.20 ± 5.14 |
| Model (B) | 51.58 ± 5.82 | 38.29 ± 4.07 | 1.30 ± 0.33 | 2.90 ± 0.71 | 3.59 ± 1.53 | 82.53 ± 15.29 | 205.64 ± 63.45 ★ | 8.80 ± 2.62 ∆ | 49.24 ± 4.63 |
| Low dose (C) | 51.55 ± 8.36 | 38.27 ± 6.13 | 0.99 ± 0.26 ★,▲ | 3.00 ± 0.89 | 3.04 ± 1.04 | 68.93 ± 19.89 | 178.43 ± 41.73 | 8.33 ± 4.51 ∆ | 46.35 ± 8.07 |
| Middle dose (D) | 61.08 ± 7.59 ▲ | 46.26 ± 3.41 * | 0.96 ± 0.37 ★,▲ | 2.63 ± 0.99 | 3.45 ± 1.74 | 63.33 ± 11.19 | 160.44 ± 31.30 ▲ | 6.87 ± 2.04 | 42.30 ± 10.10 ▲ |
| High dose (E) | 56.50 ± 13.80 | 43.09 ± 7.65 | 0.87 ± 0.14 ★,▲ | 2.42 ± 0.50 | 3.64 ± 1.70 | 55.20 ± 12.76 | 167.58 ± 32.21 ▲ | 5.49 ± 0.65 * | 42.91 ± 3.88 ▲ |
UREA content rose in the infection model group compared with controls (p < 0.05), and all mice administered FBTE displayed a gradual decrease in UREA content. UREA content was particularly decreased in mice treated with high-dose FBTE compared to the infection model mice (p < 0.01). CREA content did not vary significantly in the infection model mice relative to controls. However, CREA in the middle- and high-dose groups significantly decreased relative to the infection model group (p < 0.05).
3.9. DGGE Analysis of Mouse Colonic Microbiota
DGGE analysis of the total colonic microbiota was targeted on the V6–V8 region of 16S rDNA. The primary bacterial fingerprints are shown in
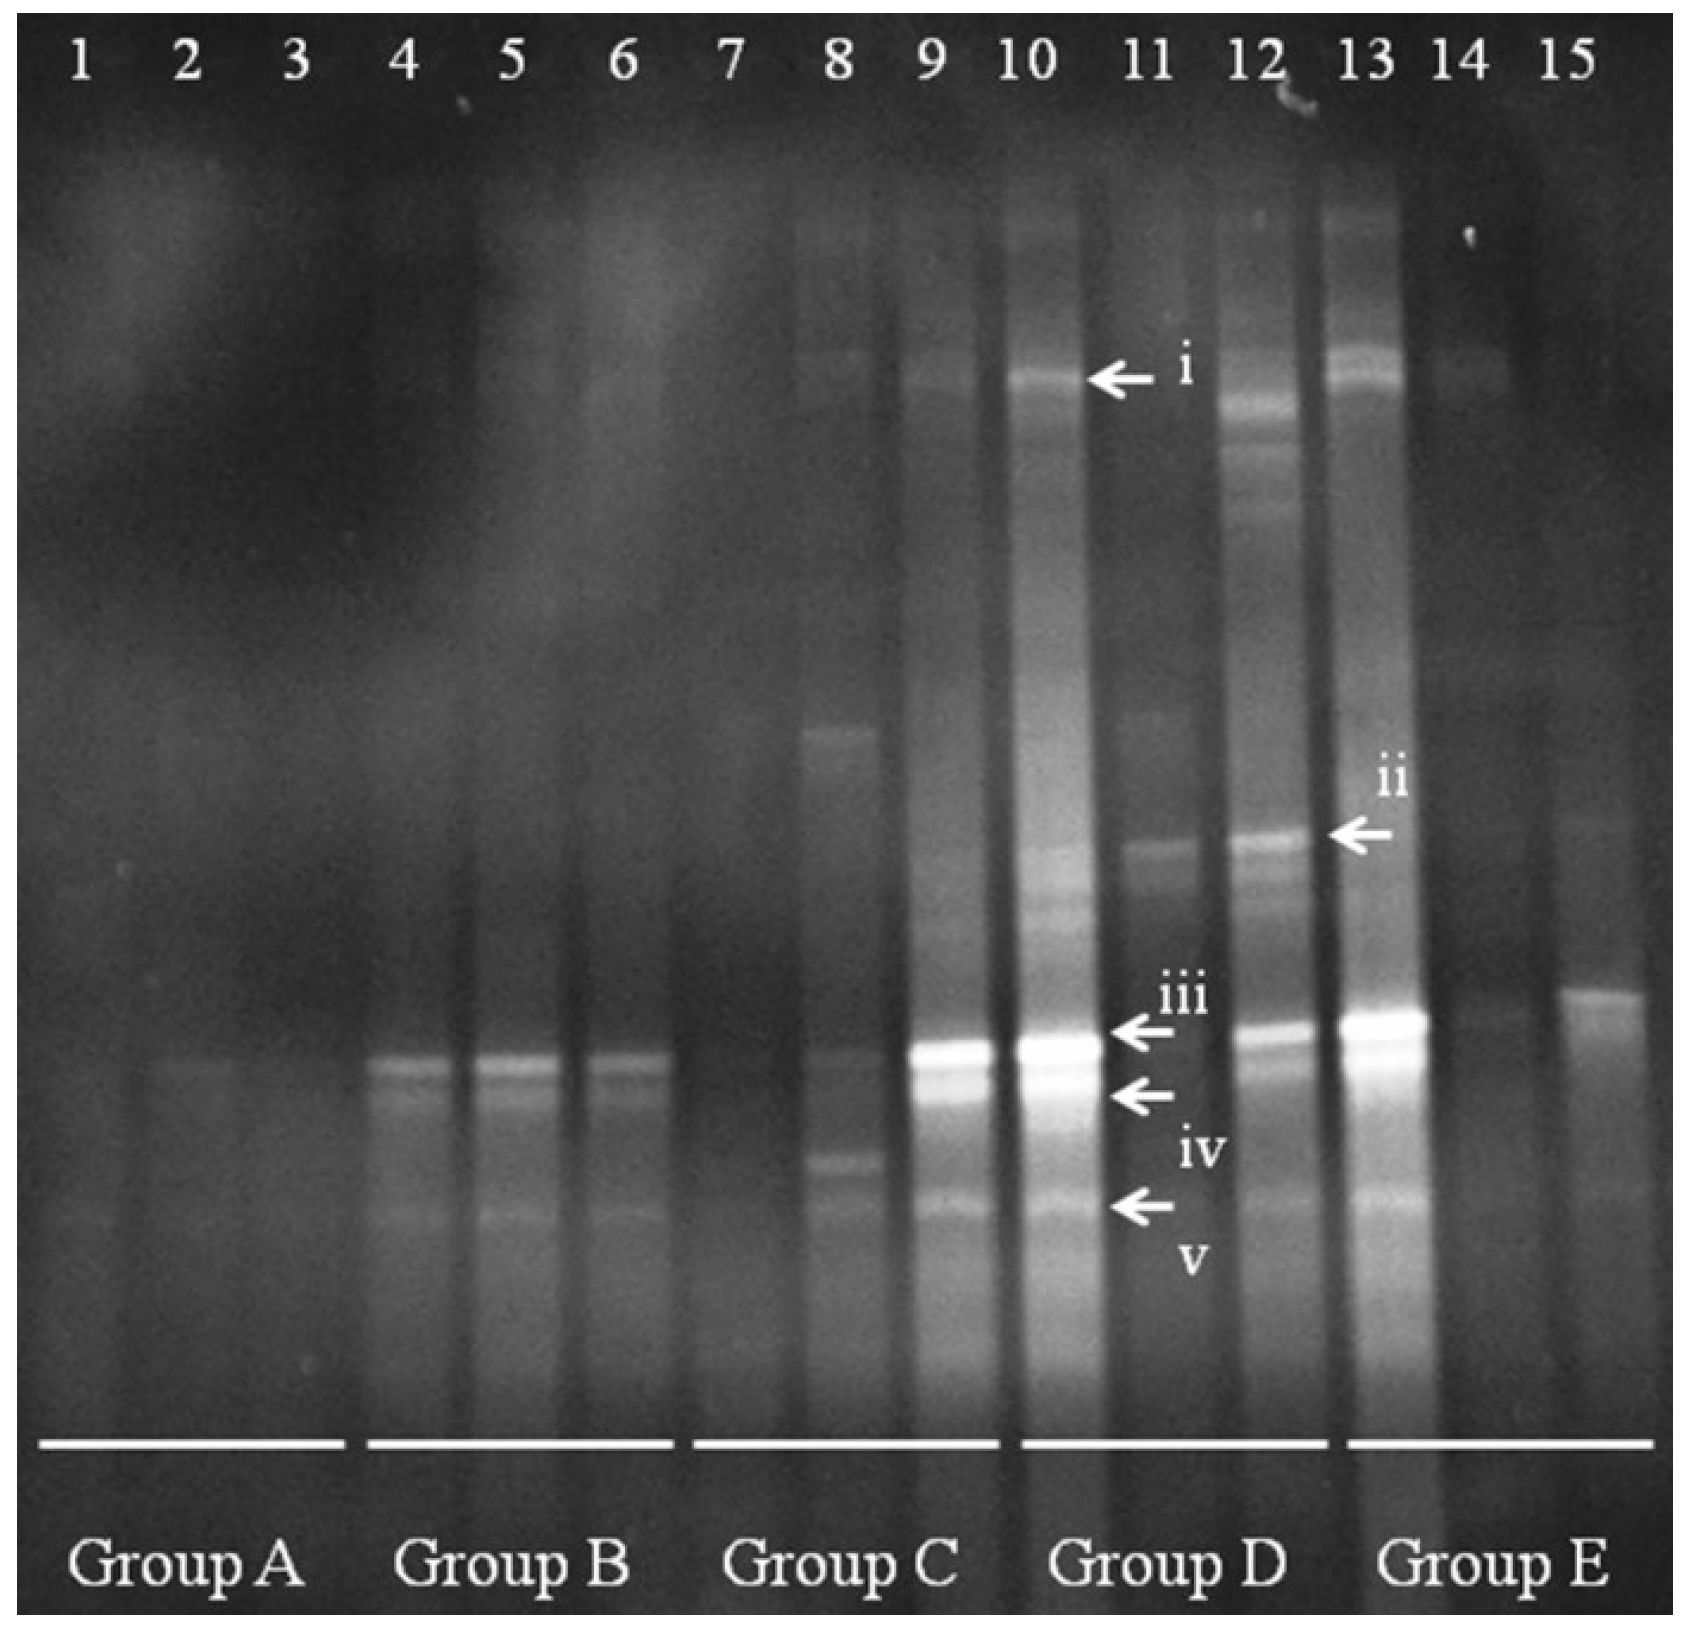
Figure 2. Results from all four treatment groups were different from controls. The
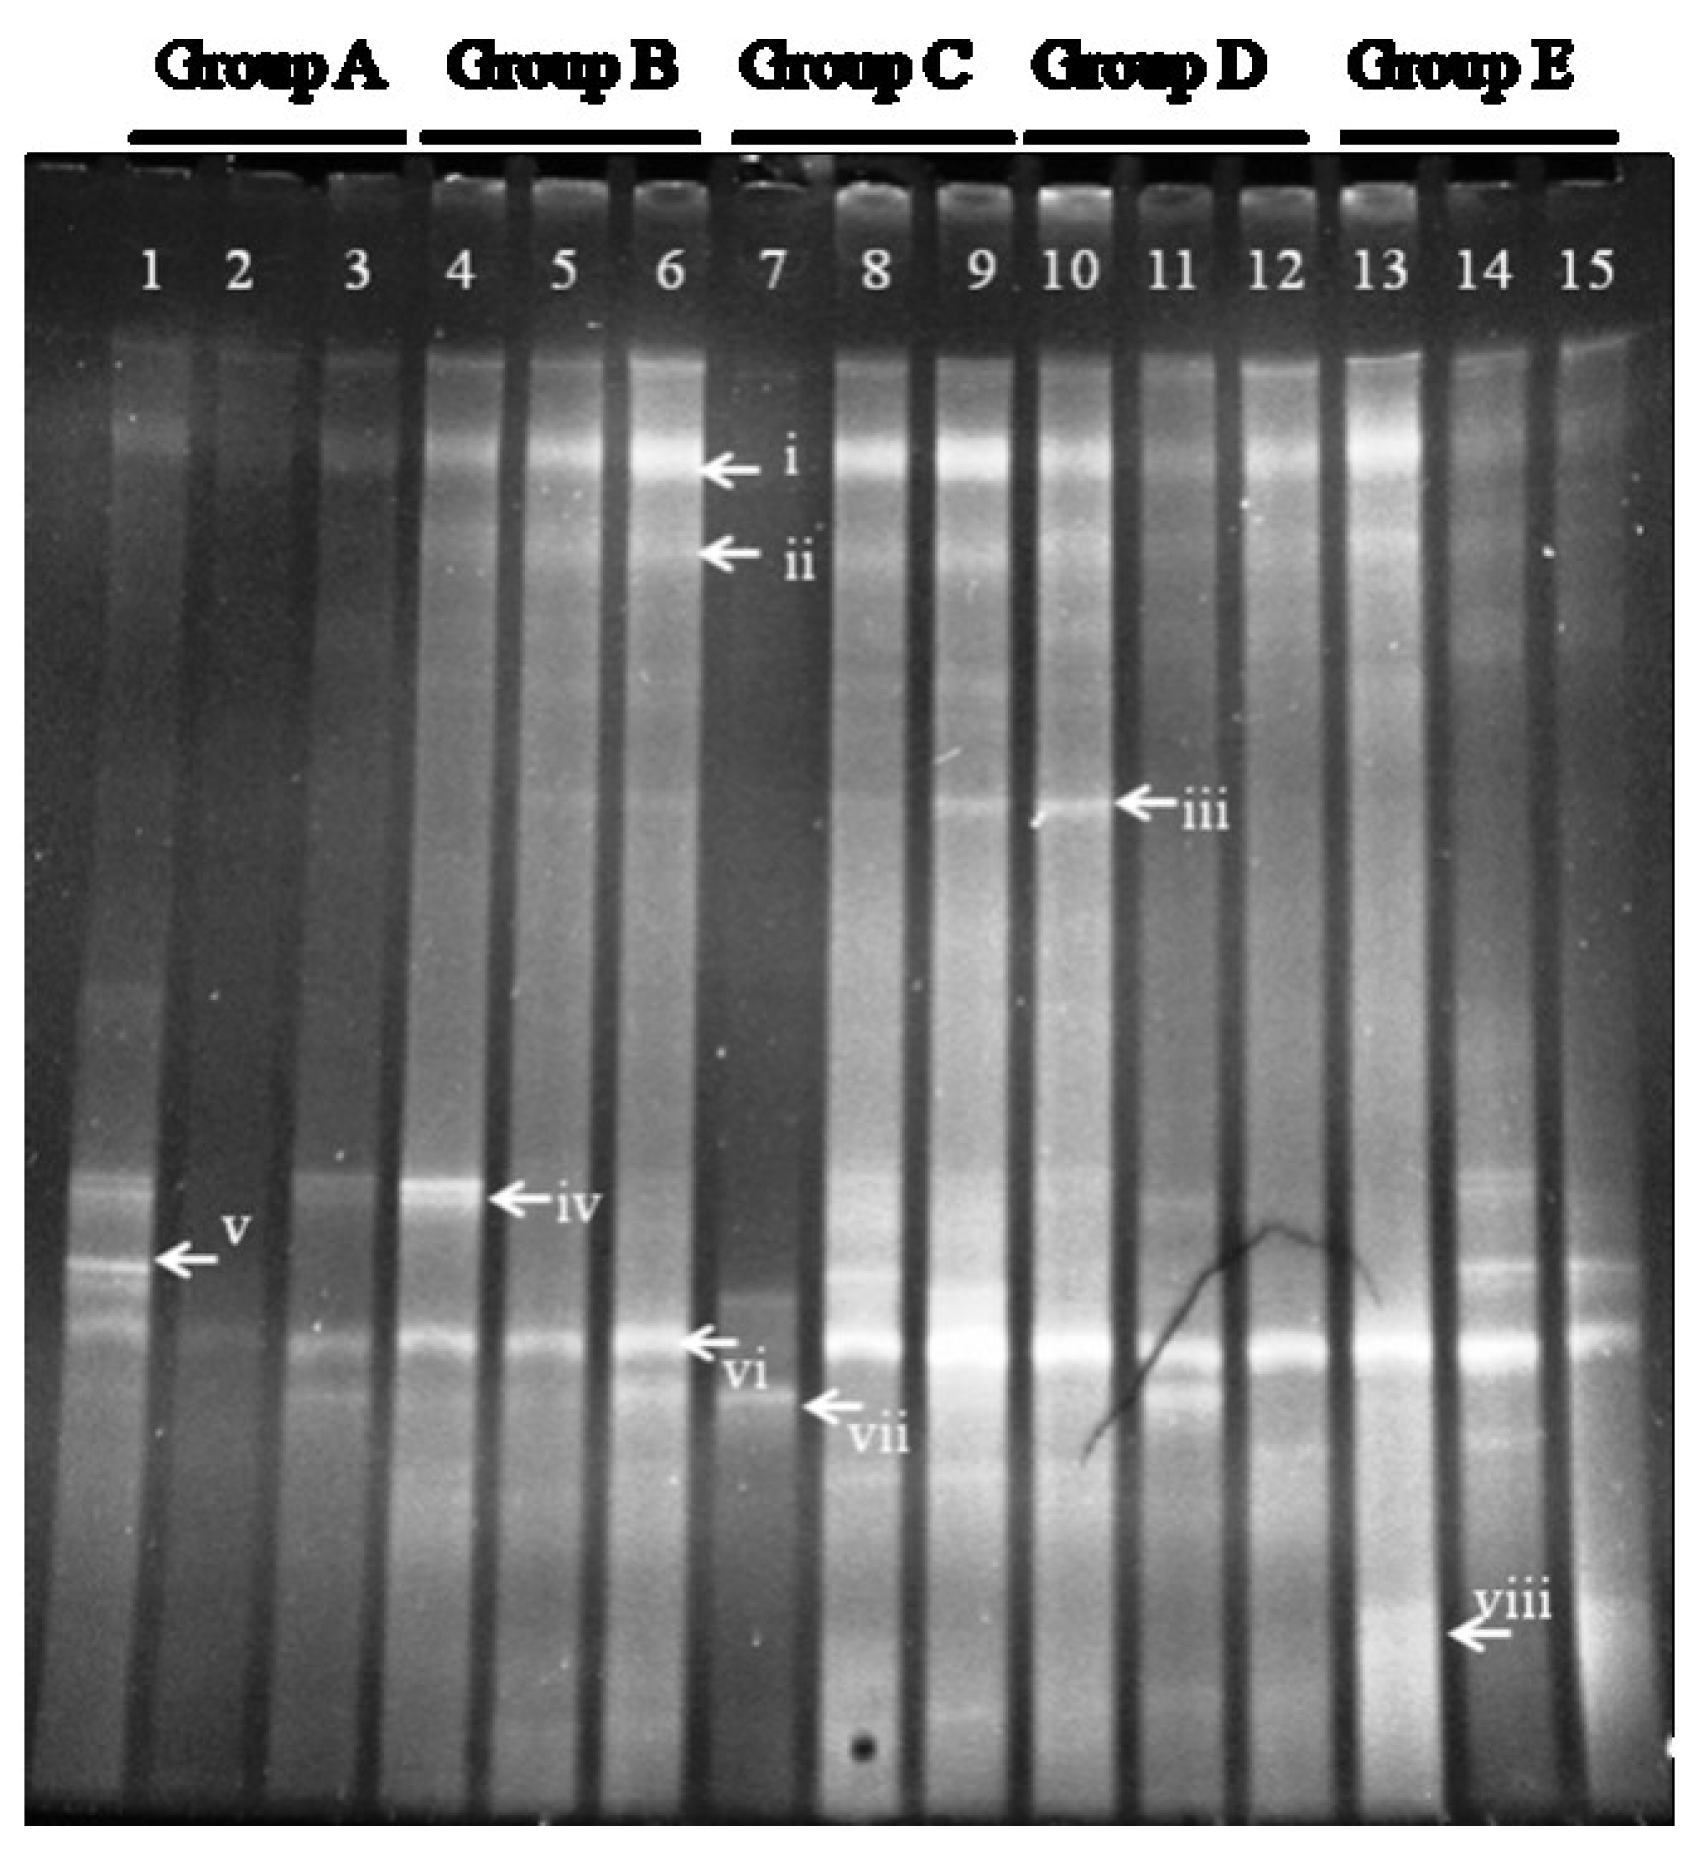
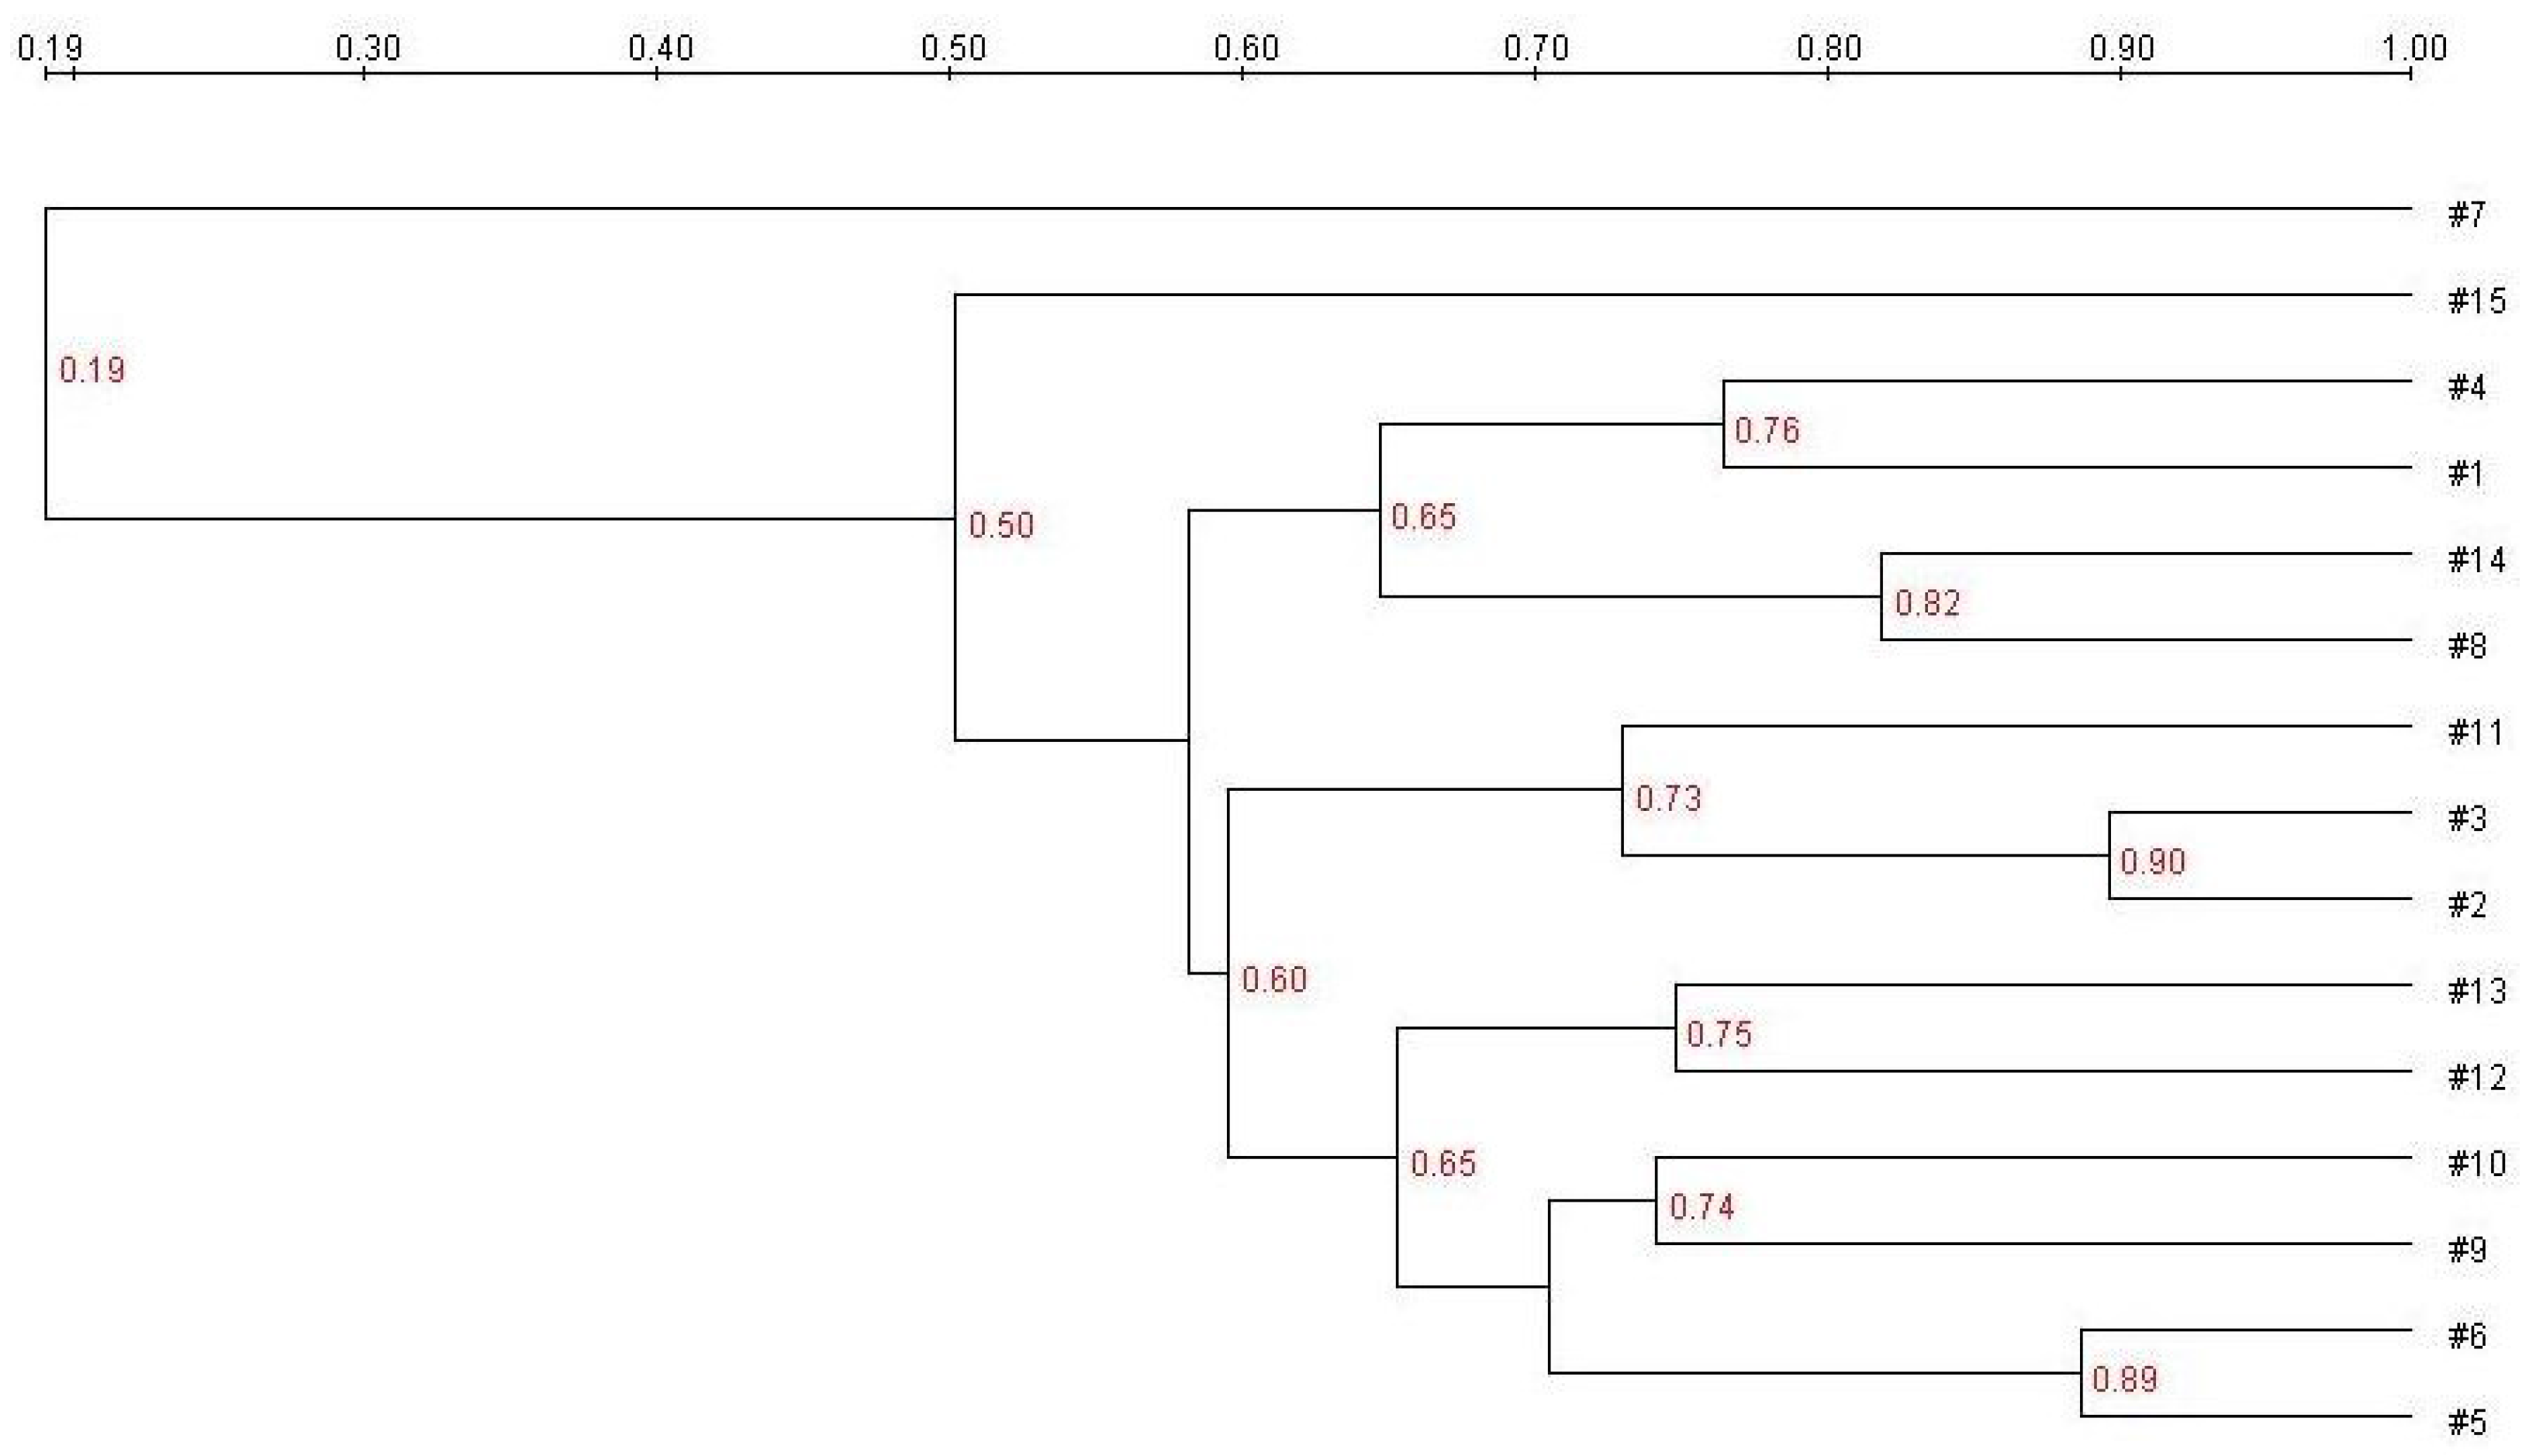
E. coli treatment (Group B) generated more bands in the DGGE fingerprint than seen in Group A. Some bacteria (denoted by bands i, ii, iii, vi, and vii) increased in quantity, and some (band v) decreased. The band pattern also changed depending on the FBTE concentration. In the low-dose group (Group C), band v appeared similar to the control, whereas in the middle-dose group (Group D), band iii varied among different mice; band iii was not present following high-dose FBTE treatment (Group E). Band v reappeared in some Group E mice (similar to Group A), and a new band (viii) was observed. These results suggest that new bacteria were being propagated in the colon. However, according to UPGMA analysis, the 15 lanes did not correspond to the five groups (
Figure 3). The DGGE map suggests the existence of individual differences in the colonic microbiota of the 15 mice. We conclude, therefore, that high-dose FBTE is beneficial to infected mice and that the bacteria represented by band iii are eliminated.
A clear change in the
Lactobacillus population is apparent between Group A and Groups B–E (
Figure 4). In controls (group A), the quantity and species diversity of
Lactobacillus were present at low levels, with almost no clearly visible band. After
E. coli infection,
Lactobacillus fingerprints appeared in bands iii–v. In low-dose-treated mice (Group B), the band intensity increased in mice 8 and 9, but not in mouse 7 (no difference from control). This result suggests that the new
Lactobacillus were fixed in the colon. Group D mice had some bands similar to i and ii, and the
Lactobacillus bands iii-v increased in quantity. However, high-dose treatment (Group E) appeared to cause changes in the
Lactobacillus bands, as seen in mice 14 and 15, with a single change in mouse 13.
Figure 2.
DGGE fingerprint for the total bacterial microbiota obtained from mouse distal colon. Lanes 1–3 (Group A) represent normal controls. Lanes 4–6 (Group B) represent infection models. Lanes 7–9 (Group C) represent infected mice treated with low-dose FTBE. Lanes 10–12 (Group D) represent infected mice treated with middle-dose FBTE, and lanes 13–15 (Group E) represent infected mice treated with high-dose FBTE. The arrows (i–viii) indicate bands that changed in intensity.
Figure 3.
Cluster analysis using the unweighted pair group method with arithmetic mean (UPGMA) method based on the Dice coefficient for the band pattern in
Figure 2.
Figure 3.
Cluster analysis using the unweighted pair group method with arithmetic mean (UPGMA) method based on the Dice coefficient for the band pattern in
Figure 2.
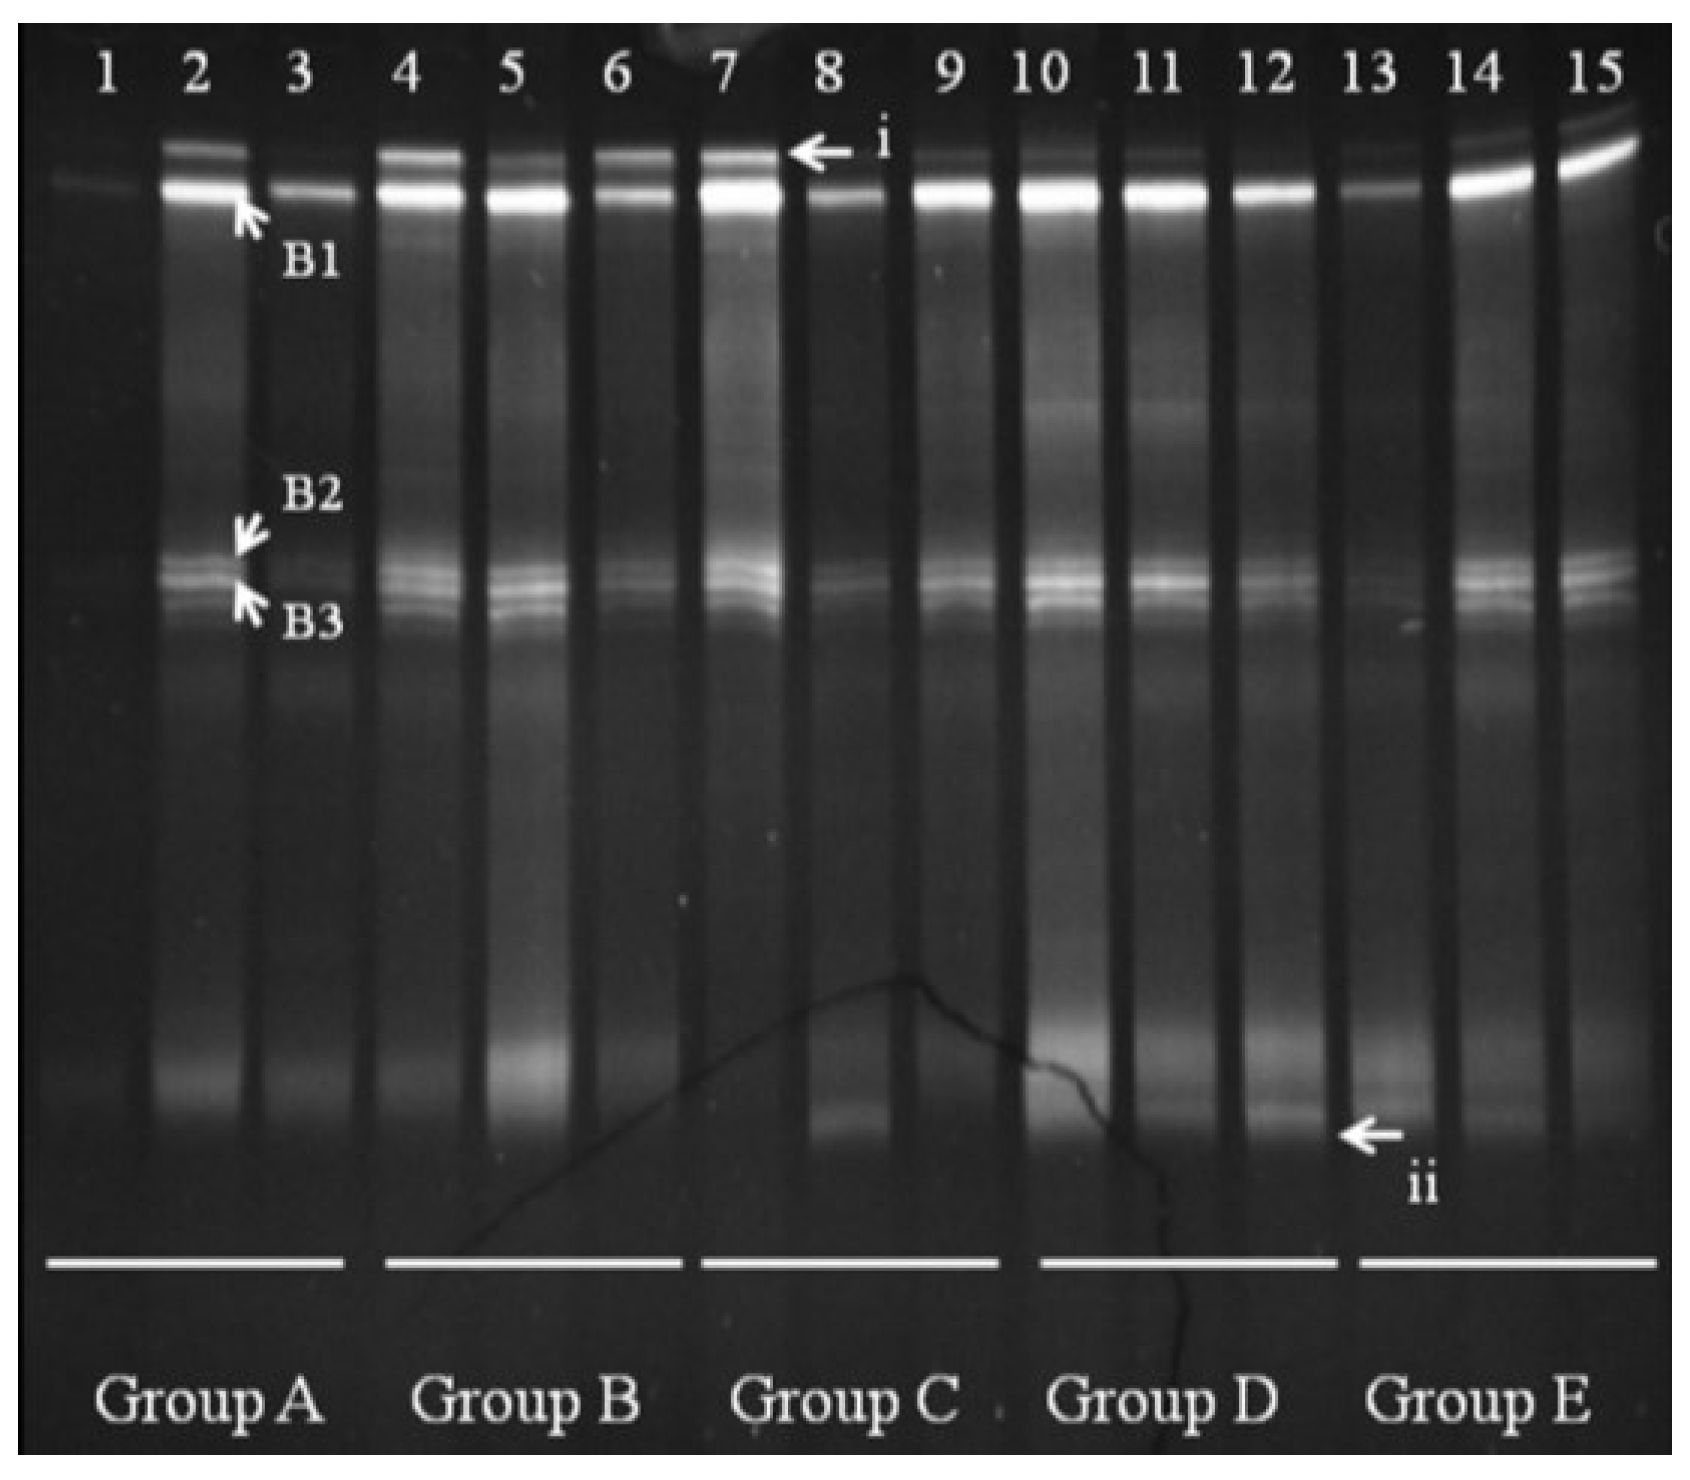
We observed several
Bacteroides bands in groups A and B, with some individual bands unique to Group A. Bands B1, B2, and B3 appeared in all groups shown (
Figure 5). Sequencing and BLAST analysis of bands B1, B2, and B3 against GenBank revealed the closest relatives as
Bacteroidesuniformis,
Bacteroidessartorii, and
Bacteroidesacidifaciens, respectively, which are 97% similar. Band i was reduced by FBTE treatment even at the low dose, although it appeared in all the mice in the infection model group. A new band (ii) appeared in the middle- and high-dose FBTE groups, suggesting that middle- or high-dose FBTE treatment may increase the diversity of
Bacteroides in the colon.
Figure 4.
Denaturing gradient gel electrophoresis (DGGE) for Lactobacillus obtained from mouse distal colonic microbiota. Lanes 1–3 (Group A) represent normal controls. Lanes 4–6 (Group B) represent infection models. Lanes 7–9 (Group C) represent infected mice treated with low-dose FTBE. Lanes 10–12 (Group D) represent infected mice treated with middle-dose FBTE, and lanes 13–15 (Group E) represent infected mice treated with high-dose FBTE. The arrows (i–v) indicate bands that changed in intensity.
Figure 5.
Denaturing gradient gel electrophoresis (DGGE) for Bacteroides obtained from mouse distal colonic microbiota. Lanes 1–3 (Group A) represent normal controls. Lanes 4–6 (Group B) represent infection models. Lanes 7–9 (Group C) represent infected mice treated with low-dose FTBE. Lanes 10–12 (Group D) represent infected mice treated with middle-dose FBTE, and lanes 13–15 (Group E) represent infected mice treated with high-dose FBTE. The arrows (i–ii) indicate bands that changed in intensity. Representative bands (B1–B3) were excised for cloning and sequencing.
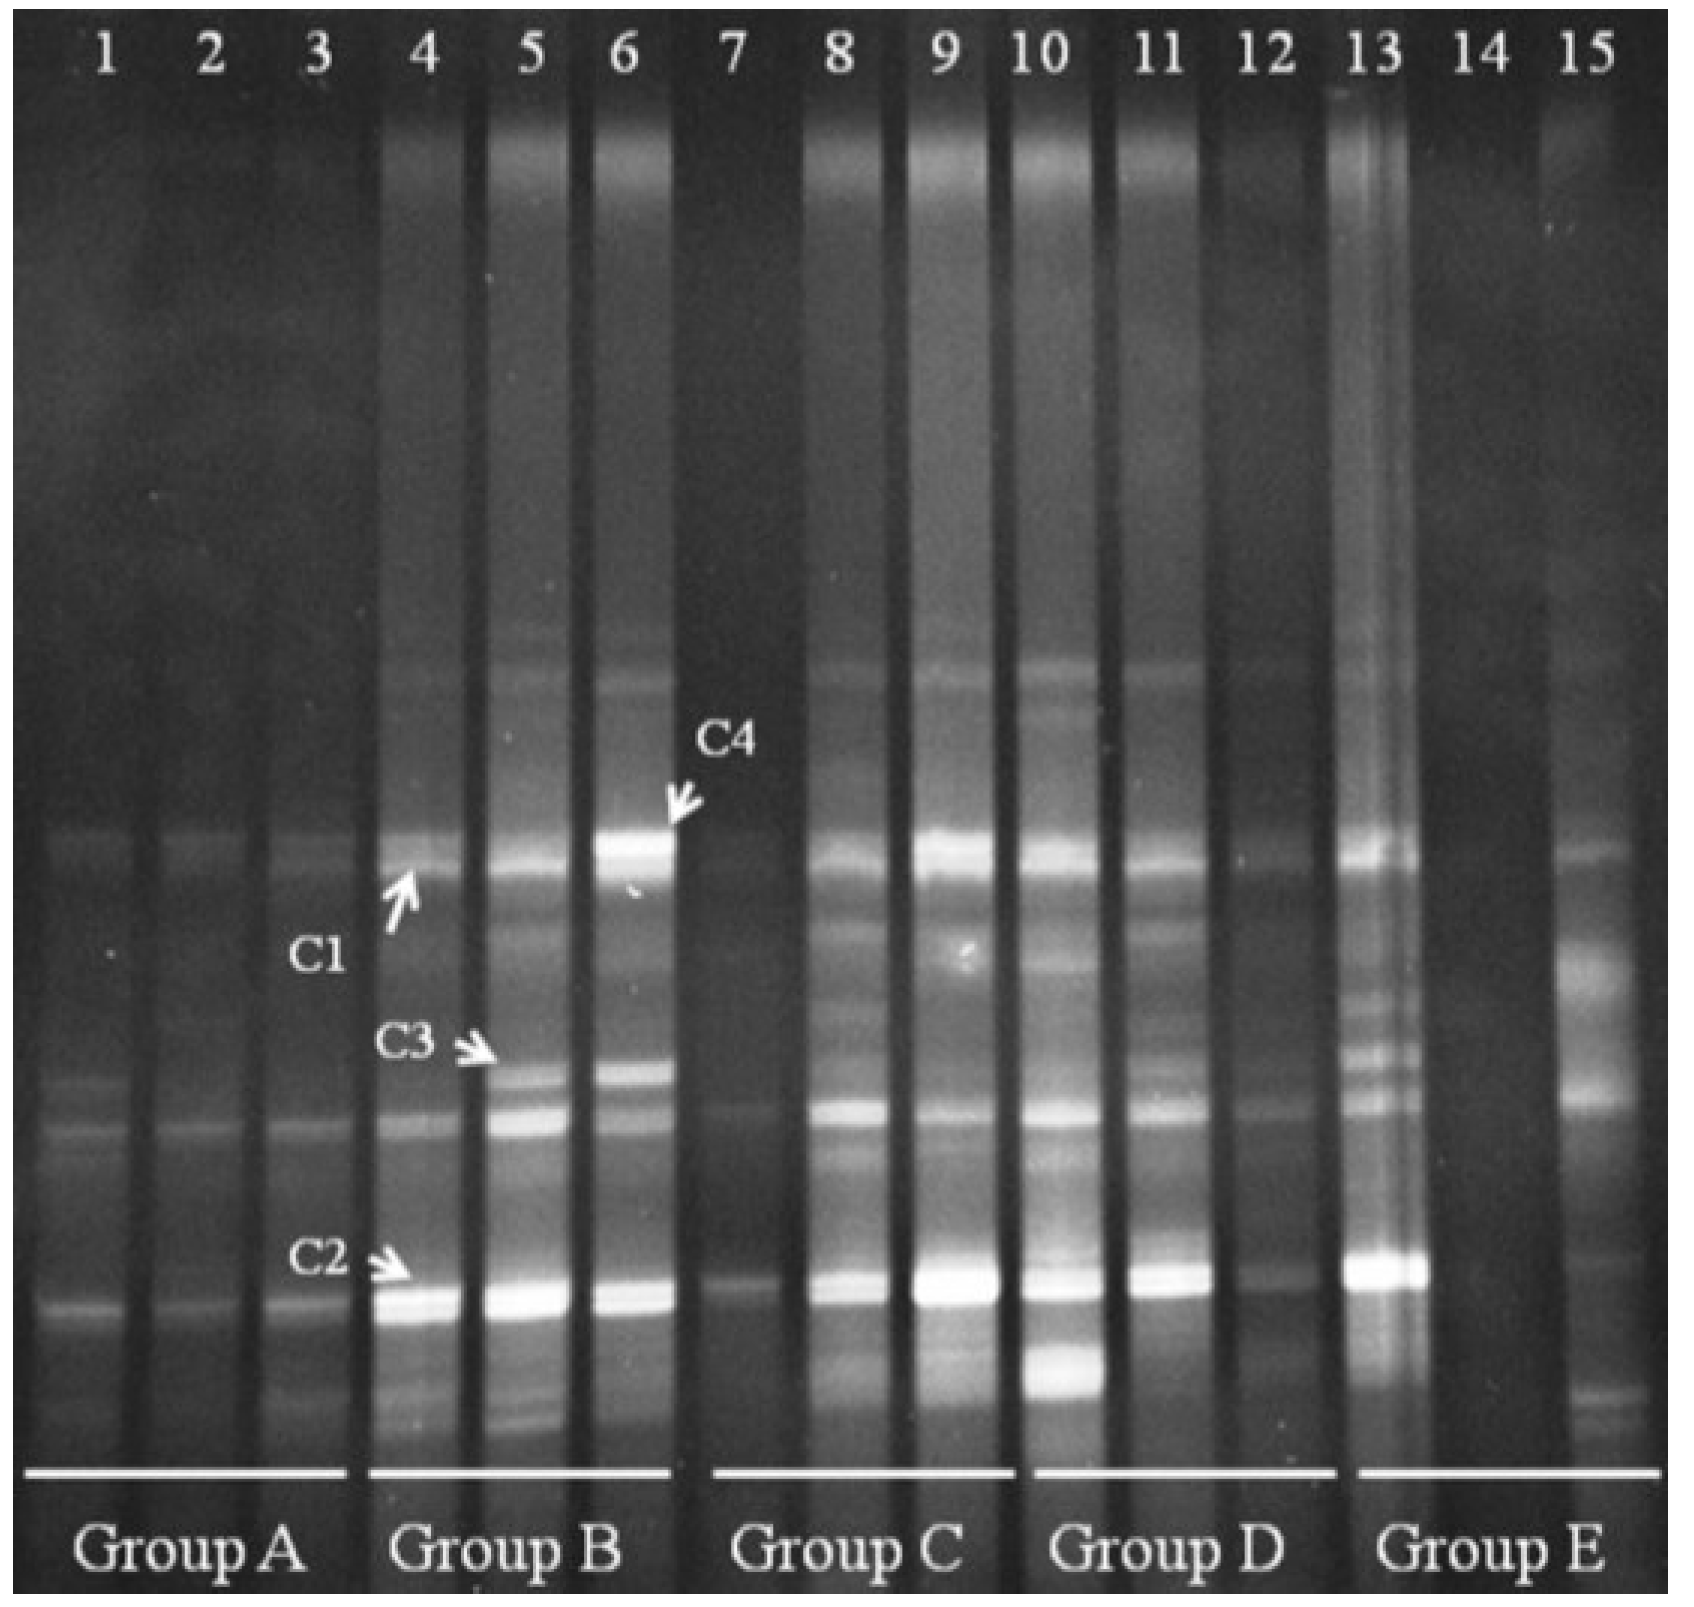
We also performed DGGE analysis for
Clostridium cluster IV in the distal colonic microbiota. Clear changes appeared for
Clostridium cluster IV in Groups B–E (
Figure 6). Group A bands were faint, suggesting that
Clostridium cluster IV is present at low levels in normal mice. Four bands appeared in Group B, and we verified that the four bands were derived from
Clostridium orbiscindens and
Clostridium viride. All four bands could be suppressed in a few mice by treating with FBTE, but most bands were not changed. This result suggests that tea extract cannot inhibit the growth of
Clostridium cluster IV in the colons of mice infected with
E. coli O157:H7.
Figure 6.
Denaturing gradient gel electrophoresis (DGGE) for Clostridium cluster IV obtained from the mouse distal colonic microbiota. Lanes 1–3 (Group A) represent normal controls. Lanes 4–6 (Group B) represent infection models. Lanes 7–9 (Group C) represent infected mice treated with low-dose FTBE. Lanes 10–12 (Group D) represent infected mice treated with middle-dose FBTE, and lanes 13–15 (Group E) represent infected mice treated with high-dose FBTE. Representative bands (indicated by C1–C4) were excised for cloning and sequencing.


