
The Effects of Yogurt Supplementation and Nutritional Education on Malnourished Infants: A Pilot RCT in Dhaka’s Slums
 , , ,
, , ,  ,
,
Abstract
:1. Background
2. Methods
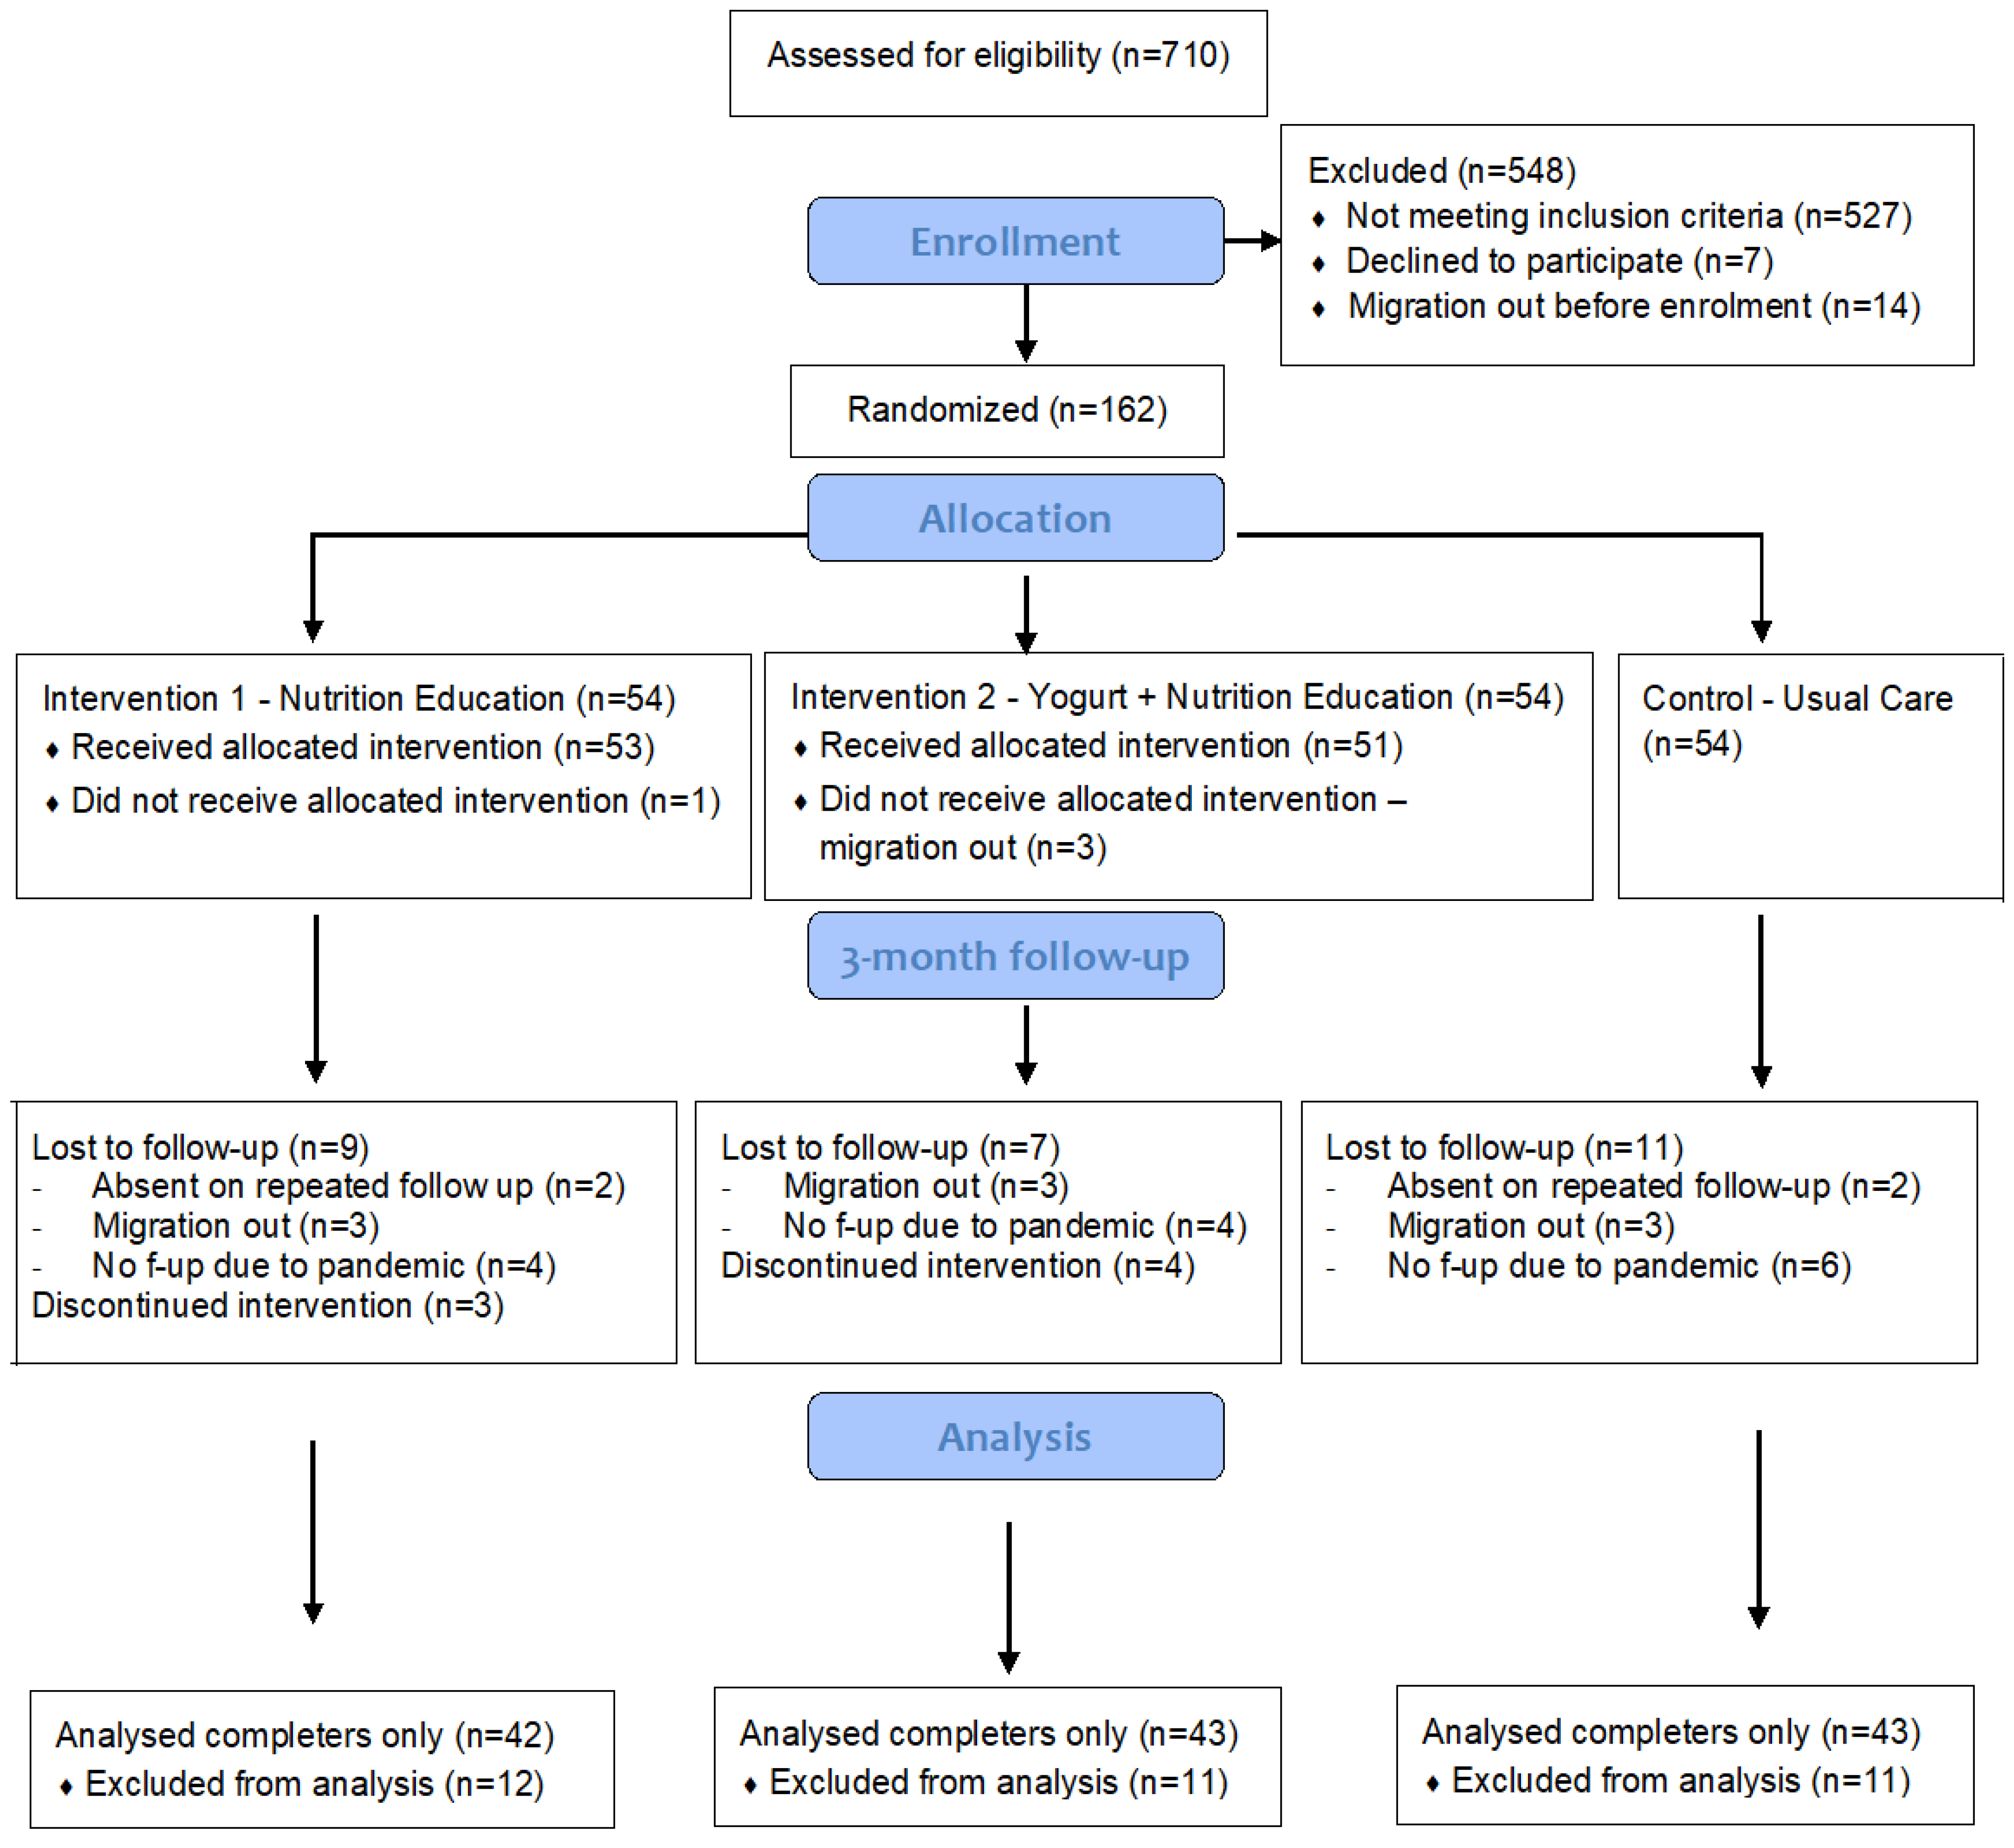
2.1. Study Design
2.2. Ethical Approval and Trial Registration
2.3. Participants and Recruitment
2.4. Randomisation and Masking
2.5. Intervention Groups
2.5.1. Intervention-1: Nutrition Education Enhanced with Self-Monitoring Using a Pictorial Calendar (Education-Only Group)
2.5.2. Intervention-2: Yogurt Supplement plus Nutrition Education Enhanced with Self-Monitoring Using pictorial Calendar (Yogurt-Plus Group)
2.5.3. Usual Care (Control Group)
2.6. Intervention Materials
2.6.1. Pictorial Calendar
2.6.2. Making Yogurt, Distribution, and Quality Control
2.7. Outcome Measures and Covariates
- (1)
- Minimum dietary diversity (MDD): the proportion of children who received food from five or more food categories out of the eight food groups on the previous day. To keep the scores comparable between the groups, the supplied yogurt was not considered while estimating the MDD score for the yogurt-plus group.
- (2)
- Minimum meal frequency (MMF): the proportion of children who received solid, semi-solid, or soft foods the minimum number of times or more on the previous day. The minimum acceptable number is two or more times until eight months and three or more times thereafter.
- (3)
- Minimum acceptable diet (MAD): the proportion of children who meet both MDD and MMF scores.
2.8. Monitoring Intervention Adherence
2.9. Data Collection and Procedures
2.10. Sample Size and Statistical Analysis
3. Results
4. Discussion
Strengths and Limitations
5. Conclusions
Author Contributions
Funding
Institutional Review Board Statement
Informed Consent Statement
Data Availability Statement
Acknowledgments
Conflicts of Interest
References
- Swaminathan, S.; Hemalatha, R.; Pandey, A.; Kassebaum, N.J.; Laxmaiah, A.; Longvah, T.; Lodha, R.; Ramji, S.; Kumar, G.A.; Afshin, A.; et al. The burden of child and maternal malnutrition and trends in its indicators in the states of India: The Global Burden of Disease Study 1990–2017. Lancet Child Adolesc. Health 2019, 3, 855–870. [Google Scholar] [CrossRef] [PubMed] [Green Version]
- Black, R.e.; Victora, C.g.; Walker, S.P.; Bhutta, Z.A.; Christian, P.; de Onis, M.; Ezzati, M.; Grantham-McGregor, S.; Katz, J.; Martorell, R.; et al. Maternal and child undernutrition and overweight in low-income and middle-income countries. Lancet 2013, 382, 427–451. [Google Scholar] [CrossRef]
- Prendergast, A.J.; Humphrey, J.H. The stunting syndrome in developing countries. Paediatr. Int. Child Health 2014, 34, 250–265. [Google Scholar] [CrossRef] [PubMed] [Green Version]
- Dewey, K.G.; Begum, K. Long-term consequences of stunting in early life. Matern. Child Nutr. 2011, 7, 5–18. [Google Scholar] [CrossRef] [PubMed]
- WHO; UNICEF. Levels and Trends in Child Malnutrition; Report No. 9240025251; WHO: Geneva, Switzerland; UNICEF: New York, NY, USA, 2021. [Google Scholar]
- Raju, D.; Kim, K.Y.; Nguyen, Q.T.; Govindaraj, R. Cities, Slums, and Child Nutrition in Bangladesh. Rev. Dev. Econ. 2018, 23, 760–781. [Google Scholar] [CrossRef]
- Onyango, A.W.; Borghi, E.; De Onis, M.; Casanovas, M.D.C.; Garza, C. Complementary feeding and attained linear growth among 6–23-month-old children. Public Health Nutr. 2013, 17, 1975–1983. [Google Scholar] [CrossRef]
- Chowdhury, T.R.; Chakrabarty, S.; Rakib, M.; Afrin, S.; Saltmarsh, S.; Winn, S. Factors associated with stunting and wasting in children under 2 years in Bangladesh. Heliyon 2020, 6, e04849. [Google Scholar] [CrossRef]
- Islam, M.S.; Zafar Ullah, A.N.; Mainali, S.; Imam, M.A.; Hasan, M.I. Determinants of stunting during the first 1000 days of life in Bangladesh: A review. Food Sci. Nutr. 2020, 8, 4685–4695. [Google Scholar] [CrossRef]
- Dewey, K.G.; Arnold, C.D.; Wessells, K.R.; Prado, E.L.; Abbeddou, S.; Adu-Afarwuah, S.; Ali, H.; Arnold, B.F.; Ashorn, P.; Ashorn, U.; et al. Preventive small-quantity lipid-based nutrient supplements reduce severe wasting and severe stunting among young children: An individual participant data meta-analysis of randomized controlled trials. Am. J. Clin. Nutr. 2022, 116, 1314–1333. [Google Scholar] [CrossRef]
- Panjwani, A.; Heidkamp, R. Complementary Feeding Interventions Have a Small but Significant Impact on Linear and Ponderal Growth of Children in Low- and Middle-Income Countries: A Systematic Review and Meta-Analysis. J. Nutr. 2017, 147, 2169S–2178S. [Google Scholar] [CrossRef] [Green Version]
- Lassi, Z.S.; Rind, F.; Irfan, O.; Hadi, R.; Das, J.K.; Bhutta, Z.A. Impact of Infant and Young Child Feeding (IYCF) Nutrition Interventions on Breastfeeding Practices, Growth and Mortality in Low- and Middle-Income Countries: Systematic Review. Nutrients 2020, 12, 722. [Google Scholar] [CrossRef] [PubMed] [Green Version]
- Harper, K.M.; Mutasa, M.; Prendergast, A.J.; Humphrey, J.; Manges, A.R. Environmental enteric dysfunction pathways and child stunting: A systematic review. PLoS Negl. Trop. Dis. 2018, 12, e0006205. [Google Scholar] [CrossRef] [PubMed] [Green Version]
- Humphrey, J.H. Child undernutrition, tropical enteropathy, toilets, and handwashing. Lancet 2009, 374, 1032–1035. [Google Scholar] [CrossRef] [PubMed]
- Ngure, F.M.; Reid, B.M.; Humphrey, J.H.; Mbuya, M.N.; Pelto, G.; Stoltzfus, R.J. Water, sanitation, and hygiene (WASH), environmental enteropathy, nutrition, and early child development: Making the links. Ann. N. Y. Acad. Sci. 2014, 1308, 118–128. [Google Scholar] [CrossRef] [PubMed]
- Watanabe, K.; Petri, W.A., Jr. Environmental Enteropathy: Elusive but Significant Subclinical Abnormalities in Developing Countries. EBioMedicine 2016, 10, 25–32. [Google Scholar] [CrossRef] [PubMed] [Green Version]
- Balasubramaniam, C.; Mallappa, R.H.; Singh, D.K.; Chaudhary, P.; Bharti, B.; Muniyappa, S.K.; Grover, S. Gut bacterial profile in Indian children of varying nutritional status: A comparative pilot study. Eur. J. Nutr. 2021, 60, 3971–3985. [Google Scholar] [CrossRef]
- Dinh, D.M.; Ramadass, B.; Kattula, D.; Sarkar, R.; Braunstein, P.; Tai, A.; Wanke, C.A.; Hassoun, S.; Kane, A.V.; Naumova, E.N.; et al. Longitudinal Analysis of the Intestinal Microbiota in Persistently Stunted Young Children in South India. PLoS ONE 2016, 11, e0155405. [Google Scholar] [CrossRef] [Green Version]
- Subramanian, S.; Huq, S.; Yatsunenko, T.; Haque, R.; Mahfuz, M.; Alam, M.A.; Benezra, A.; DeStefano, J.; Meier, M.F.; Muegge, B.D.; et al. Persistent gut microbiota immaturity in malnourished Bangladeshi children. Nature 2014, 510, 417–421. [Google Scholar] [CrossRef] [Green Version]
- Tickell, K.D.; Atlas, H.E.; Walson, J.L. Environmental enteric dysfunction: A review of potential mechanisms, consequences and management strategies. BMC Med. 2019, 17, 181. [Google Scholar] [CrossRef]
- Heuven, L.A.; Pyle, S.; Greyling, A.; Melse-Boonstra, A.; Eilander, A. Gut Microbiota–Targeted Nutritional Interventions Improving Child Growth in Low- and Middle-Income Countries: A Systematic Review. Curr. Dev. Nutr. 2021, 5, nzab124. [Google Scholar] [CrossRef]
- Dahiya, D.; Nigam, P.S. Probiotics, Prebiotics, Synbiotics, and Fermented Foods as Potential Biotics in Nutrition Improving Health via Microbiome-Gut-Brain Axis. Fermentation 2022, 8, 303. [Google Scholar] [CrossRef]
- Rul, F.; Béra-Maillet, C.; Champomier-Vergès, M.C.; El-Mecherfi, K.E.; Foligné, B.; Michalski, M.C.; Milenkovic, D.; Savary-Auzeloux, I. Underlying evidence for the health benefits of fermented foods in humans. Food Funct. 2022, 13, 4804–4824. [Google Scholar] [CrossRef]
- Donovan, S.M.; Rao, G. Health benefits of yogurt among infants and toddlers aged 4 to 24 months: A systematic review. Nutr. Rev. 2019, 77, 478–486. [Google Scholar] [CrossRef]
- Onubi, O.J.; Poobalan, A.S.; Dineen, B.; Marais, D.; McNeill, G. Effects of probiotics on child growth: A systematic review. J. Health Popul. Nutr. 2015, 34, 8. [Google Scholar] [CrossRef] [Green Version]
- Hossain, M.; Kabir, Y. Ethnic Fermented Foods and Beverages of Bangladesh. In Ethnic Fermented Foods and Alcoholic Beverages of Asia; Springer: New Delhi, India, 2016; pp. 73–89. [Google Scholar]
- Budge, S.; Parker, A.H.; Hutchings, P.T.; Garbutt, C. Environmental enteric dysfunction and child stunting. Nutr. Rev. 2019, 77, 240–253. [Google Scholar] [CrossRef] [Green Version]
- Korpe, P.S.; Petri, W.A., Jr. Environmental enteropathy: Critical implications of a poorly understood condition. Trends Mol. Med. 2012, 18, 328–336. [Google Scholar] [CrossRef] [Green Version]
- Bhattacharjee, P.; Sassi, M. Determinants of the severity of household food insecurity among the slums of Dhaka city, Bangladesh. Int. J. Urban Sustain. Dev. 2021, 13, 233–247. [Google Scholar] [CrossRef]
- Razzaque, A.; Clair, K.; Chin, B.; Islam, M.Z.; Mia, M.N.; Chowdhury, R.; Mustafa, A.G.; Kuhn, R. Association of time since migration from rural to urban slums and maternal and child outcomes: Dhaka (north and south) and Gazipur City corporations. J. Urban Health 2020, 97, 158–170. [Google Scholar] [CrossRef] [PubMed]
- Swapan, M.S.H.; Zaman, A.U.; Ahsan, T.; Ahmed, F. Transforming Urban Dichotomies and Challenges of South Asian Megacities: Rethinking Sustainable Growth of Dhaka, Bangladesh. Urban Sci. 2017, 1, 31. [Google Scholar] [CrossRef] [Green Version]
- Luby, S.P.; Rahman, M.; Arnold, B.F.; Unicomb, L.; Ashraf, S.; Winch, P.J.; Stewart, C.P.; Begum, F.; Hussain, F.; Benjamin-Chung, J.; et al. Effects of water quality, sanitation, handwashing, and nutritional interventions on diarrhoea and child growth in rural Bangladesh: A cluster randomised controlled trial. Lancet Glob. Health 2018, 6, e302–e315. [Google Scholar] [CrossRef] [Green Version]
- Kelly, M.P.; Barker, M. Why is changing health-related behaviour so difficult? Public Health 2016, 136, 109–116. [Google Scholar] [CrossRef] [PubMed] [Green Version]
- Anderson, E.S.; Winett, R.A.; Wojcik, J.R.; Williams, D.M. Social cognitive mediators of change in a group randomized nutrition and physical activity intervention: Social support, self-efficacy, outcome expectations and self-regulation in the guide-to-health trial. J. Health Psychol. 2010, 15, 21–32. [Google Scholar] [CrossRef] [PubMed]
- Glanz, K.; Bishop, D.B. The Role of Behavioral Science Theory in Development and Implementation of Public Health Interventions. Annu. Rev. Public Health 2010, 31, 399–418. [Google Scholar] [CrossRef] [PubMed] [Green Version]
- Williams, D.M.; Rhodes, R.E. The confounded self-efficacy construct: Conceptual analysis and recommendations for future research. Health Psychol. Rev. 2014, 10, 113–128. [Google Scholar] [CrossRef] [Green Version]
- Sheeran, P.; Maki, A.; Montanaro, E.; Avishai-Yitshak, A.; Bryan, A.; Klein, W.M.P.; Miles, E.; Rothman, A.J. The impact of changing attitudes, norms, and self-efficacy on health-related intentions and behavior: A meta-analysis. Health Psychol. 2016, 35, 1178–1188. [Google Scholar] [CrossRef]
- Tabasco, R.; Paarup, T.; Janer, C.; Peláez, C.; Requena, T. Selective enumeration and identification of mixed cultures of Streptococcus thermophilus, Lactobacillus delbrueckii subsp. bulgaricus, L. acidophilus, L. paracasei subsp. paracasei and Bifidobacterium lactis in fermented milk. Int. Dairy J. 2007, 17, 1107–1114. [Google Scholar] [CrossRef] [Green Version]
- Uriot, O.; Denis, S.; Junjua, M.; Roussel, Y.; Dary-Mourot, A.; Blanquet-Diot, S. Streptococcus thermophilus: From yogurt starter to a new promising probiotic candidate? J. Funct. Foods 2017, 37, 74–89. [Google Scholar] [CrossRef]
- Cogill, B. Anthropometric Indicators Measurement Guide; Food and Nutrition Technical Assistance Project; Academy for Educational Development: Washington, DC, USA, 2003. [Google Scholar]
- de Onis, M.; Onyango, A.W.; Van den Broeck, J.; Chumlea, C.W.; Martorell, R. Measurement and standardization protocols for anthropometry used in the construction of a new international growth reference. Food Nutr. Bull. 2004, 25 (Suppl. S1), S27–S36. [Google Scholar] [CrossRef]
- WHO. Indicators for Assessing Infant and Young Child Feeding Practices: Definitions and Measurement Methods; Report No. 9240018387; WHO: Geneva, Switzerland, 2021. [Google Scholar]
- Jannat, K.; Luby, S.P.; Unicomb, L.; Rahman, M.; Winch, P.J.; Parvez, S.M.; Das, K.K.; Leontsini, E.; Ram, P.K.; Stewart, C.P. Complementary feeding practices among rural Bangladeshi mothers: Results from WASH Benefits study. Matern. Child Nutr. 2018, 15, e12654. [Google Scholar] [CrossRef] [Green Version]
- Vyas, S.; Kumaranayake, L. Constructing socio-economic status indices: How to use principal components analysis. Health Policy Plan. 2006, 21, 459–468. [Google Scholar] [CrossRef] [Green Version]
- Powney, M.; Williamson, P.; Kirkham, J.; Kolamunnage-Dona, R. A review of the handling of missing longitudinal outcome data in clinical trials. Trials 2014, 15, 237. [Google Scholar] [CrossRef] [PubMed] [Green Version]
- Tripepi, G.; Chesnaye, N.C.; Dekker, F.W.; Zoccali, C.; Jager, K.J. Intention to treat and per protocol analysis in clinical trials. Nephrology 2020, 25, 513–517. [Google Scholar] [CrossRef] [Green Version]
- Billah, S.M.; Ferdous, T.E.; Kelly, P.; Raynes-Greenow, C.; Siddique, A.B.; Choudhury, N.; Ahmed, T.; Gillespie, S.; Hoddinott, J.; Menon, P.; et al. Effect of nutrition counselling with a digital job aid on child dietary diversity: Analysis of secondary outcomes from a cluster randomised controlled trial in rural Bangladesh. Matern. Child Nutr. 2021, 18, e13267. [Google Scholar] [CrossRef] [PubMed]
- Wit, J.M.; Himes, J.H.; van Buuren, S.; Denno, D.M.; Suchdev, P.S. Practical Application of Linear Growth Measurements in Clinical Research in Low- and Middle-Income Countries. Horm. Res. Paediatr. 2017, 88, 79–90. [Google Scholar] [CrossRef]
- Janmohamed, A.; Sohani, N.; Lassi, Z.S.; Bhutta, Z. The Effects of Community Home Visit and Peer Group Nutrition Intervention Delivery Platforms on Nutrition Outcomes in Low and Middle-Income Countries: A Systematic Review and Meta-Analysis. Nutrients 2020, 12, 440. [Google Scholar] [CrossRef] [PubMed] [Green Version]
- Saran, S.; Gopalan, S.; Krishna, T. Use of fermented foods to combat stunting and failure to thrive. Nutrition 2002, 18, 393–396. [Google Scholar] [CrossRef]
- He, M.; Yang, Y.-X.; Han, H.; Men, J.-H.; Bian, L.-H.; Wang, G.-D. Effects of yogurt supplementation on the growth of preschool children in Beijing suburbs. Biomed. Environ. Sci. 2005, 18, 192. [Google Scholar]
- Lassi, Z.S.; Das, J.K.; Zahid, G.; Imdad, A.; Bhutta, Z.A. Impact of education and provision of complementary feeding on growth and morbidity in children less than 2 years of age in developing countries: A systematic review. BMC Public Health 2013, 13, S13. [Google Scholar] [CrossRef] [Green Version]
- Menon, P.; Nguyen, P.H.; Saha, K.K.; Khaled, A.; Sanghvi, T.; Baker, J.; Afsana, K.; Haque, R.; Frongillo, E.A.; Ruel, M.T.; et al. Combining Intensive Counseling by Frontline Workers with a Nationwide Mass Media Campaign Has Large Differential Impacts on Complementary Feeding Practices but Not on Child Growth: Results of a Cluster-Randomized Program Evaluation in Bangladesh. J. Nutr. 2016, 146, 2075–2084. [Google Scholar] [CrossRef] [Green Version]
- Negash, C.; Belachew, T.; Henry, C.J.; Kebebu, A.; Abegaz, K.; Whiting, S.J. Nutrition Education and Introduction of Broad Bean—Based Complementary Food Improves Knowledge and Dietary Practices of Caregivers and Nutritional Status of Their Young Children in Hula, Ethiopia. Food Nutr. Bull. 2014, 35, 480–486. [Google Scholar] [CrossRef]
- Paul, K.H.; Muti, M.; Chasekwa, B.; Mbuya, M.N.; Madzima, R.C.; Humphrey, J.H.; Stoltzfus, R.J. Complementary feeding messages that target cultural barriers enhance both the use of lipid-based nutrient supplements and underlying feeding practices to improve infant diets in rural Zimbabwe. Matern. Child Nutr. 2010, 8, 225–238. [Google Scholar] [CrossRef] [PubMed]
- Peacock, S.; Konrad, S.; Watson, E.; Nickel, D.; Muhajarine, N. Effectiveness of home visiting programs on child outcomes: A systematic review. BMC Public Health 2013, 13, 17. [Google Scholar] [CrossRef] [Green Version]
- Mahfuz, M.; Das, S.; Mazumder, R.N.; Rahman, M.M.; Haque, R.; Bhuiyan, M.R.; Akhter, H.; Alam Sarker, S.; Mondal, D.; Muaz, S.S.A.; et al. Bangladesh Environmental Enteric Dysfunction (BEED) study: Protocol for a community-based intervention study to validate non-invasive biomarkers of environmental enteric dysfunction. BMJ Open 2017, 7, e017768. [Google Scholar] [CrossRef] [PubMed] [Green Version]
- Morais, M.B.d.; Silva, G.A.P.d. Environmental enteric dysfunction and growth. J. Pediatr. 2019, 5, S85–S94. [Google Scholar] [CrossRef] [PubMed]
- Keddy, K.H.; Saha, S.; Okeke, I.N.; Kalule, J.B.; Qamar, F.N.; Kariuki, S. Combating Childhood Infections in LMICs: Evaluating the contribution of Big Data Big data, biomarkers and proteomics: Informing childhood diarrhoeal disease management in Low-and Middle-Income Countries. EBioMedicine 2021, 73, 103668. [Google Scholar] [CrossRef] [PubMed]
- Jannat, K.; Kader, M.A.; Parvez, S.M.; Thomson, R.; Rahman, M.; Kabir, M.; Agho, K.; Haque, R.; Merom, D. Faecal markers of intestinal inflammation in slum infants following yogurt intervention: A pilot randomised controlled trial in Bangladesh. Front. Microbiomes 2023, 2, 10. [Google Scholar] [CrossRef]
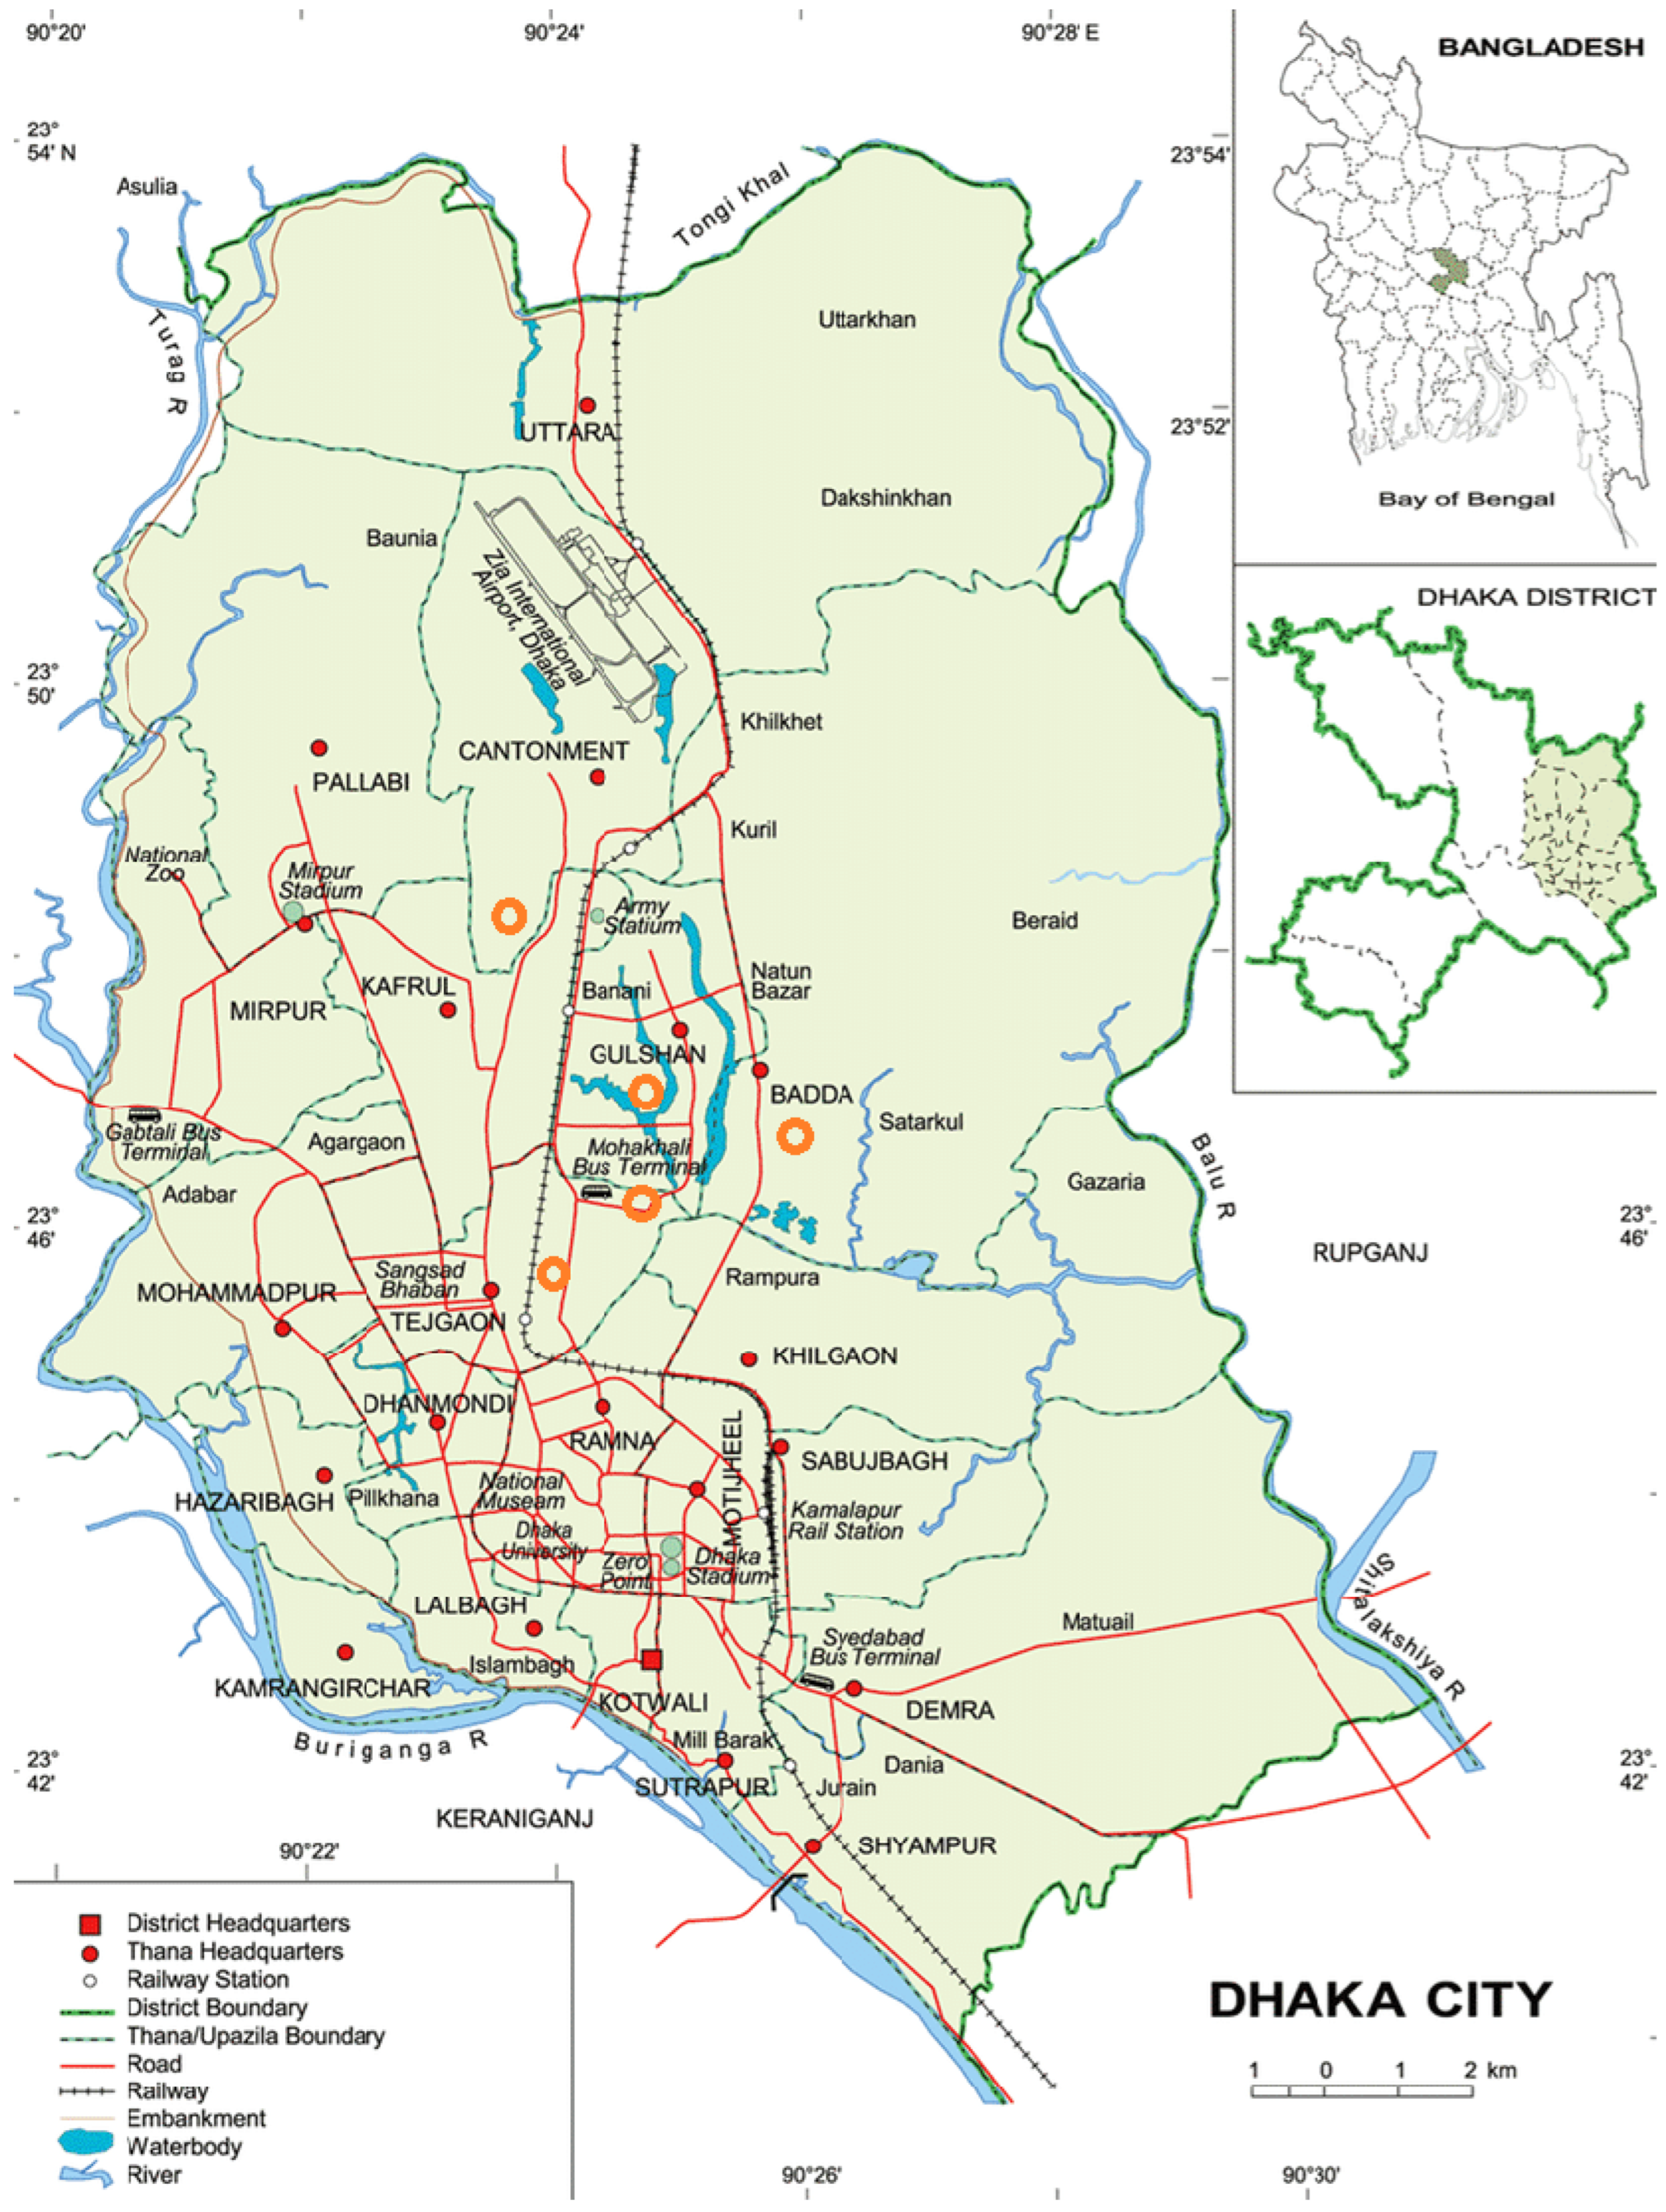
 Study sites in Dhaka, Bangladesh [31]; study sites are marked on the original image available via license: Creative Commons Attribution 4.0 International.
Study sites in Dhaka, Bangladesh [31]; study sites are marked on the original image available via license: Creative Commons Attribution 4.0 International.
Study sites in Dhaka, Bangladesh [31]; study sites are marked on the original image available via license: Creative Commons Attribution 4.0 International.


| Indicators | Control n = 54 (%) | Education-Only n = 54 (%) | Yogurt-Plus n = 54 (%) | |
|---|---|---|---|---|
| Child age in days at baseline survey (mean, 95% CI) | 180 (179, 182) | 180 (179, 181) | 180 (178, 181) | |
| Child gender (male) | 53.7 | 50.0 | 50.0 | |
| Type of delivery: caesarean section | 33.3 | 55.6 | 37.0 | |
| Birth order | First | 42.6 | 44.4 | 37.0 |
| Second | 33.3 | 38.9 | 40.7 | |
| Third | 18.5 | 13.0 | 13.0 | |
| Mother’s age in years (mean, 95% CI) | 25 (23, 26) | 24 (23, 25) | 25 (23, 26) | |
| Father’s education (mean, 95% CI) | 5.1 (4.0, 6.1) | 5.7 (4.6, 6.8) | 6.1 (5.0, 7.2) | |
| Mother’s education (mean, 95% CI) | 4.8 (4.0, 5.5) | 5.1 (4.4, 5.8) | 4.8 (4.1, 5.6) | |
| Household size (mean, 95% CI) | 4.7 (4.2, 5.2) | 4.8 (4.2, 5.4) | 5.1 (4.5, 5.8) | |
| Shared improved sanitation facilities (pour-flush latrine to piped sewer system) | Shared with <10 households Shared with ≥10 households | 74.1 25.9 | 68.5 31.5 | 75.9 24.1 |
| Sources of drinking water (municipal supply) | 98.2 | 98.2 | 100 | |
| Continued breastfeeding | 100 | 88.9 | 94.4 | |
| * n = 43 (%) | * n = 42 (%) | * n = 43 (%) | ||
| Prevalence of food insecurity | Food secure | 51.2 | 40.5 | 55.8 |
| Mildly food insecure | 9.3 | 7.1 | 7.0 | |
| Moderately food insecure | 28.0 | 31.0 | 30.2 | |
| Severely food insecure | 11.6 | 21.4 | 7.0 | |
| † Wealth | Quintile 1 (poorest) | 20.9 | 23.8 | 18.6 |
| Quintile 2 | 27.9 | 21.4 | 9.3 | |
| Quintile 3 | 16.3 | 21.4 | 23.3 | |
| Quintile 4 | 18.6 | 21.4 | 18.6 | |
| Quintile 5 | 16.3 | 11.9 | 30.2 |
| Anthropometry Indicators | ITT Analysis N = 162 | Complete-Case Analysis N = 127 | ||||||
|---|---|---|---|---|---|---|---|---|
| Baseline Mean | 3-Month Follow Up Mean | ‡ Mean ∆ | (95% CI) | Baseline Mean | 3-Month Follow Up Mean | ‡ Mean ∆ | (95% CI) | |
| Length (cm) | ||||||||
| Control | 63.87 | 68.15 | Ref. | - | 63.86 | 67.95 | Ref. | - |
| Education-only | 63.72 | 68.24 | 0.24 | −0.37, 0.84 | 63.79 | 68.25 | 0.37 | −0.23, 1.00 |
| Yogurt-plus | 63.81 | 68.38 | 0.29 | −0.29, 0.88 | 63.76 | 68.29 | 0.45 | −0.16, 1.05 |
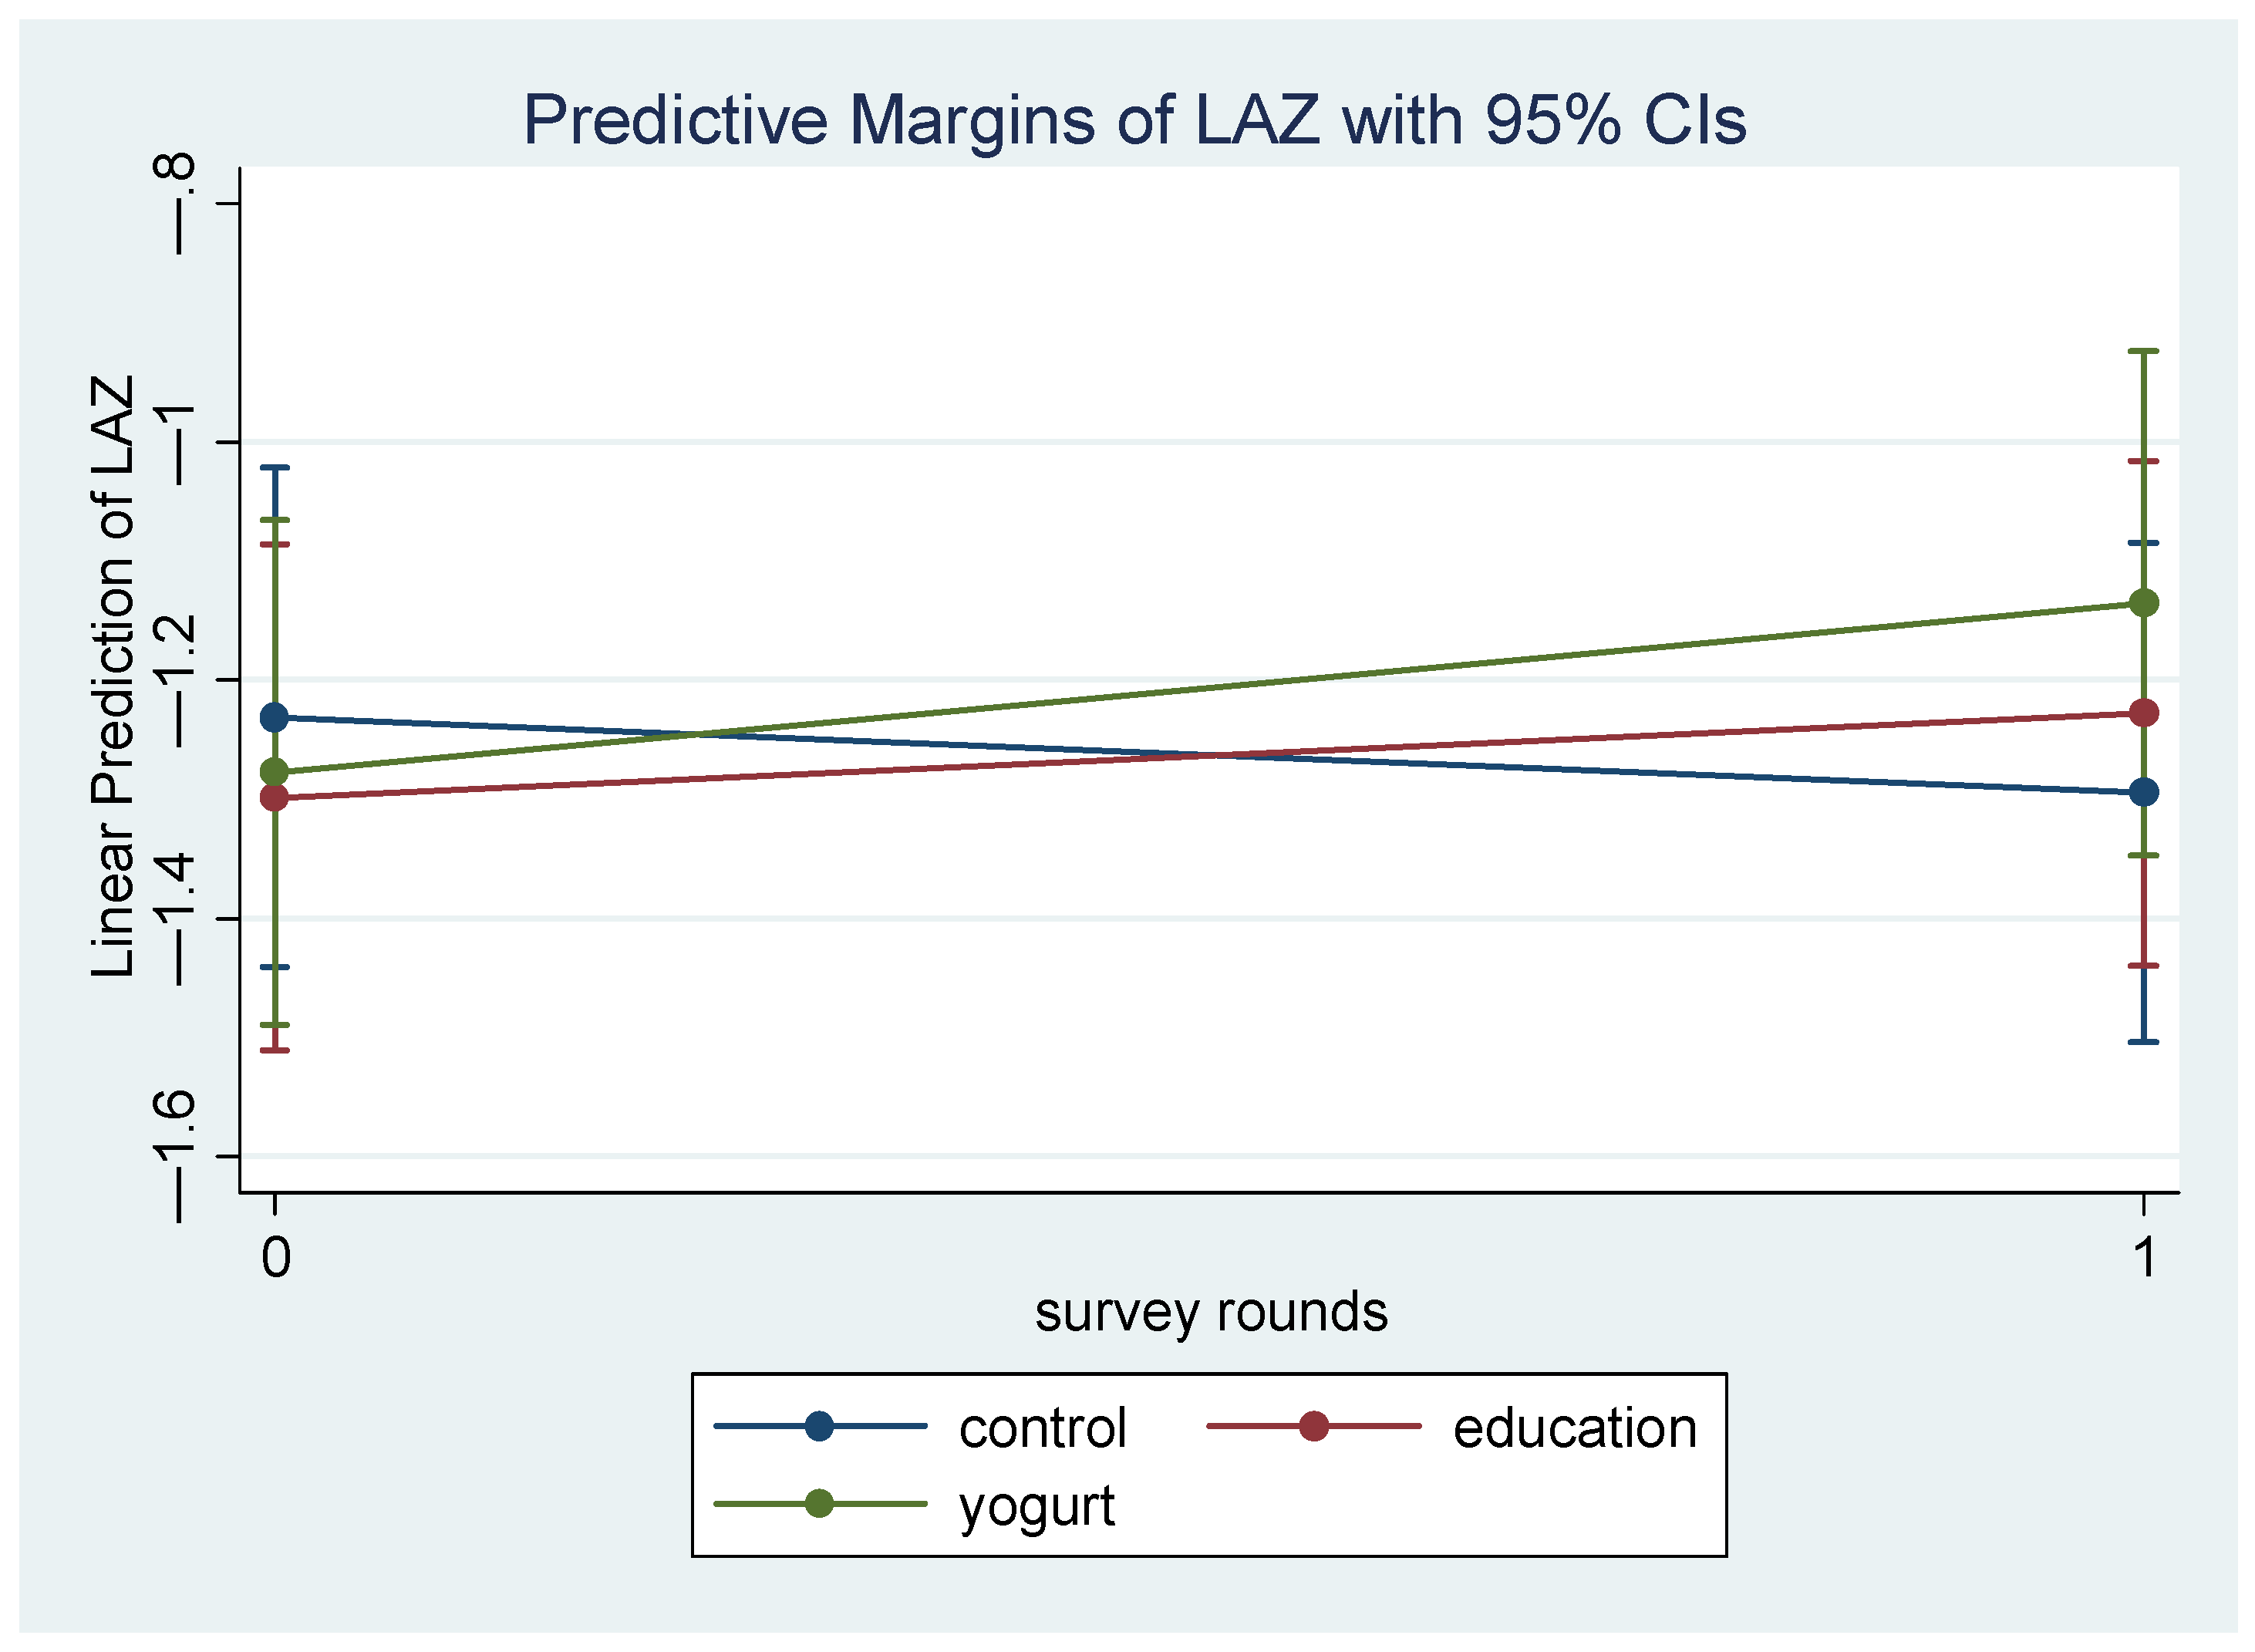
| Length-for-age z score (LAZ) | ||||||||
| Control | −1.25 | −1.23 | Ref. | −1.23 | −1.29 | Ref. | - | |
| Education-only | −1.29 | −1.19 | 0.09 | −0.17, 0.34 | −1.30 | −1.23 | 0.13 | −0.13, 0.39 |
| Yogurt-plus | −1.24 | −1.09 | 0.13 | −0.12, 0.38 | −1.28 | −1.14 | 0.20 | −0.06, 0.47 |
| Weight (kg) | ||||||||
| Control | 7.04 | 7.84 | Ref. | 6.84 | 7.67 | Ref. | - | |
| Education-only | 6.92 | 7.80 | 0.07 | −0.12, 0.27 | 6.83 | 7.74 | 0.07 | −0.09, 0.23 |
| Yogurt-plus | 6.86 | 7.77 | 0.11 | −0.05, 0.27 | 6.90 | 7.79 | 0.05 | −0.11. 0.22 |
| Weight-for-age z-score (WAZ) | ||||||||
| Control | −0.75 | −0.83 | 0 | −0.96 | −0.99 | 0 | - | |
| Education-only | −0.83 | −0.83 | 0.08 | −0.14, 0.30 | −0.97 | −0.94 | 0.06 | −0.12, 0.25 |
| Yogurt-plus | −0.89 | −0.84 | 0.13 | −0.05, 0.32 | −0.84 | −0.83 | 0.05 | −0.14, 0.24 |
| Dietary Diversity Indicators | Baseline | 3-Month Follow Up | ITT Analysis N = 162 | Baseline | 3-Month Follow Up | Complete-Case Analysis N = 127 | ||
|---|---|---|---|---|---|---|---|---|
| % | % | § OR | 95% CI | % | % | § OR | 95% CI | |
| ‖ Minimum dietary diversity (MDD) | ||||||||
| Control | 14.81 | 54.90 | Ref. | - | 16.28 | 44.19 | Ref. | - |
| Education-only | 14.81 | 58.02 | 2.44 | 0.45, 13.21 | 19.05 | 64.29 | 2.62 | 0.43, 15.93 |
| Yogurt-plus | 07.41 | 59.48 | 5.00 | 0.79, 31.80 | 09.52 | 57.14 | 4.82 | 0.67, 34.86 |
| ‖ Minimum meal frequency (MMF) | ||||||||
| Control | 33.33 | 89.54 | Ref. | - | 37.21 | 88.37 | Ref. | - |
| Education-only | 31.48 | 96.30 | 6.12 | 0.44, 85.70 | 30.95 | 97.62 | 9.65 | 0.65, 144.17 |
| Yogurt-plus | 38.89 | 98.69 | - | - | 45.24 | 100.00 | - | - |
| ‖ Minimum adequate diet (MAD) | ||||||||
| Control | 11.11 | 45.75 | Ref. | - | 11.63 | 39.53 | Ref. | - |
| Education-only | 12.96 | 51.85 | 2.20 | 0.43, 11.20 | 16.67 | 64.29 | 2.24 | 0.40, 12.36 |
| Yogurt-plus | 05.56 | 62.09 | 5.72 | 0.89, 37.00 | 07.14 | 57.14 | 4.52 | 0.66, 31.16 |
Disclaimer/Publisher’s Note: The statements, opinions and data contained in all publications are solely those of the individual author(s) and contributor(s) and not of MDPI and/or the editor(s). MDPI and/or the editor(s) disclaim responsibility for any injury to people or property resulting from any ideas, methods, instructions or products referred to in the content. |
© 2023 by the authors. Licensee MDPI, Basel, Switzerland. This article is an open access article distributed under the terms and conditions of the Creative Commons Attribution (CC BY) license (https://creativecommons.org/licenses/by/4.0/).
Share and Cite
Jannat, K.; Agho, K.E.; Parvez, S.M.; Rahman, M.; Thomson, R.; Amin, M.B.; Merom, D. The Effects of Yogurt Supplementation and Nutritional Education on Malnourished Infants: A Pilot RCT in Dhaka’s Slums. Nutrients 2023, 15, 2986. https://doi.org/10.3390/nu15132986
Jannat K, Agho KE, Parvez SM, Rahman M, Thomson R, Amin MB, Merom D. The Effects of Yogurt Supplementation and Nutritional Education on Malnourished Infants: A Pilot RCT in Dhaka’s Slums. Nutrients. 2023; 15(13):2986. https://doi.org/10.3390/nu15132986
Chicago/Turabian StyleJannat, Kaniz, Kingsley Emwinyore Agho, Sarker Masud Parvez, Mahbubur Rahman, Russell Thomson, Mohammed Badrul Amin, and Dafna Merom. 2023. "The Effects of Yogurt Supplementation and Nutritional Education on Malnourished Infants: A Pilot RCT in Dhaka’s Slums" Nutrients 15, no. 13: 2986. https://doi.org/10.3390/nu15132986