Front-of-Package Labels on Unhealthy Packaged Foods in India: Evidence from a Randomized Field Experiment

 , , and
Abstract
:1. Introduction
2. Materials and Methods
2.1. Institutional Review Board Approvals
2.2. Setting
2.3. Participants
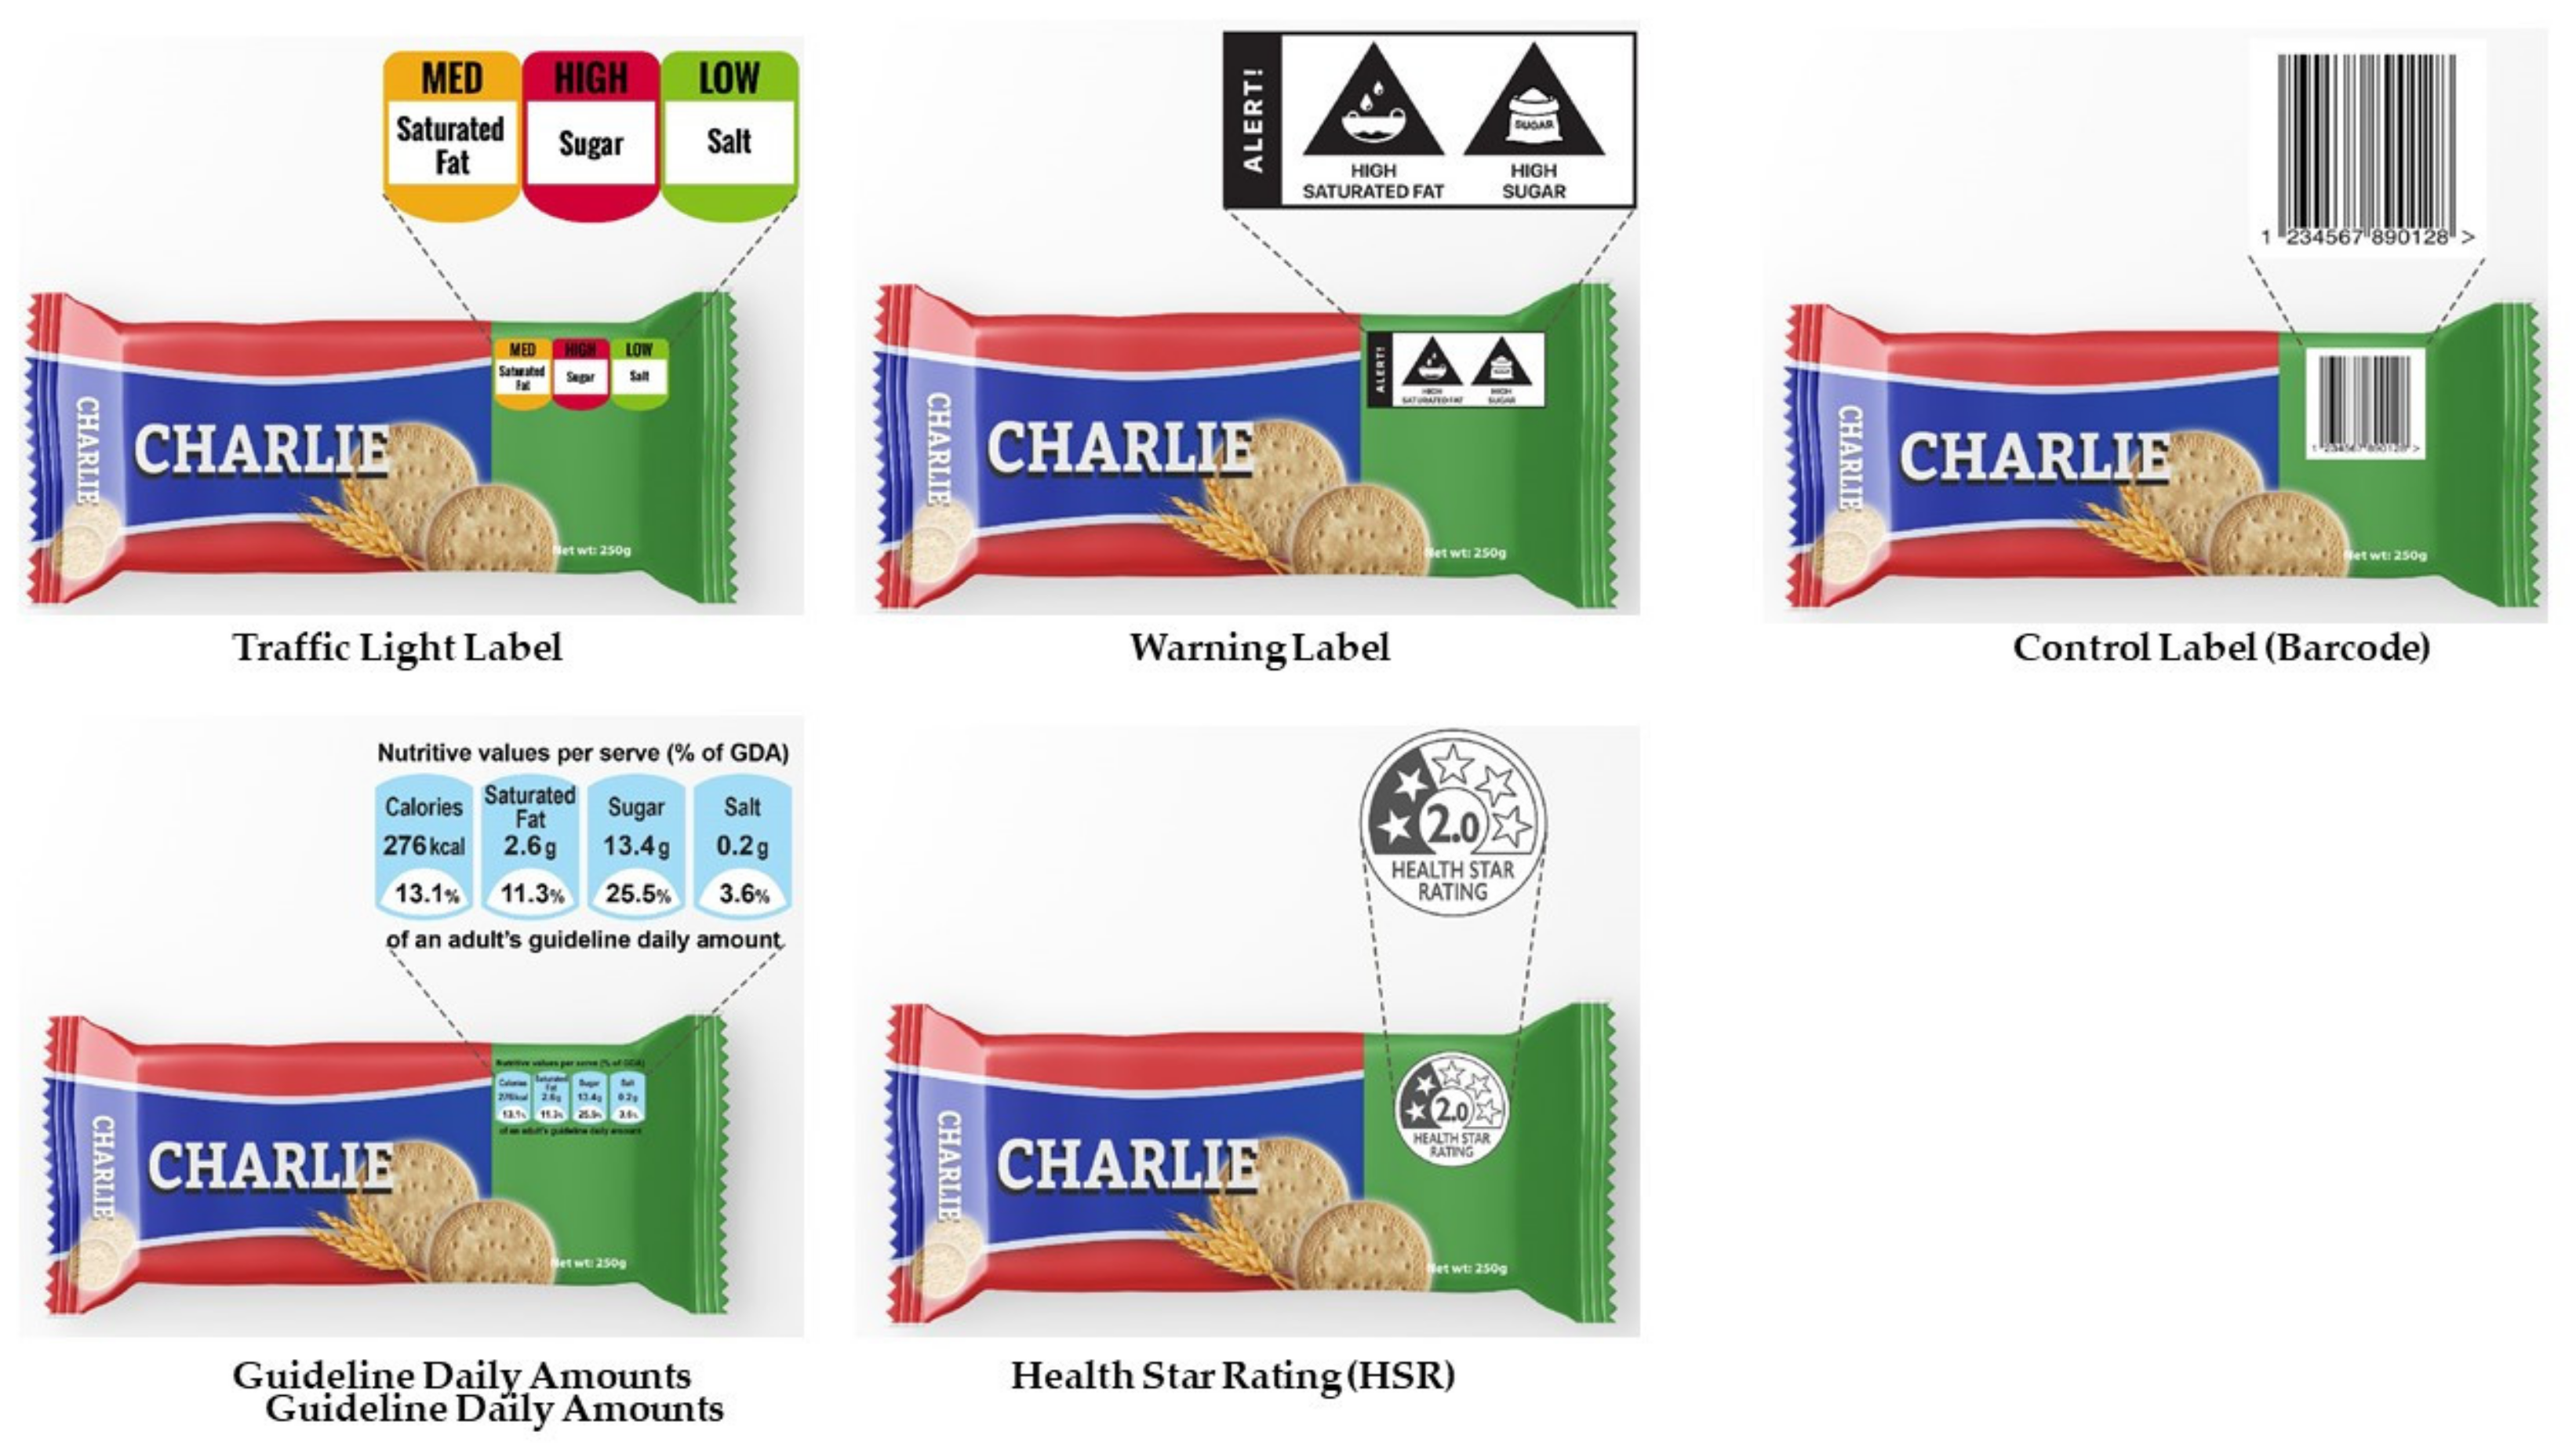
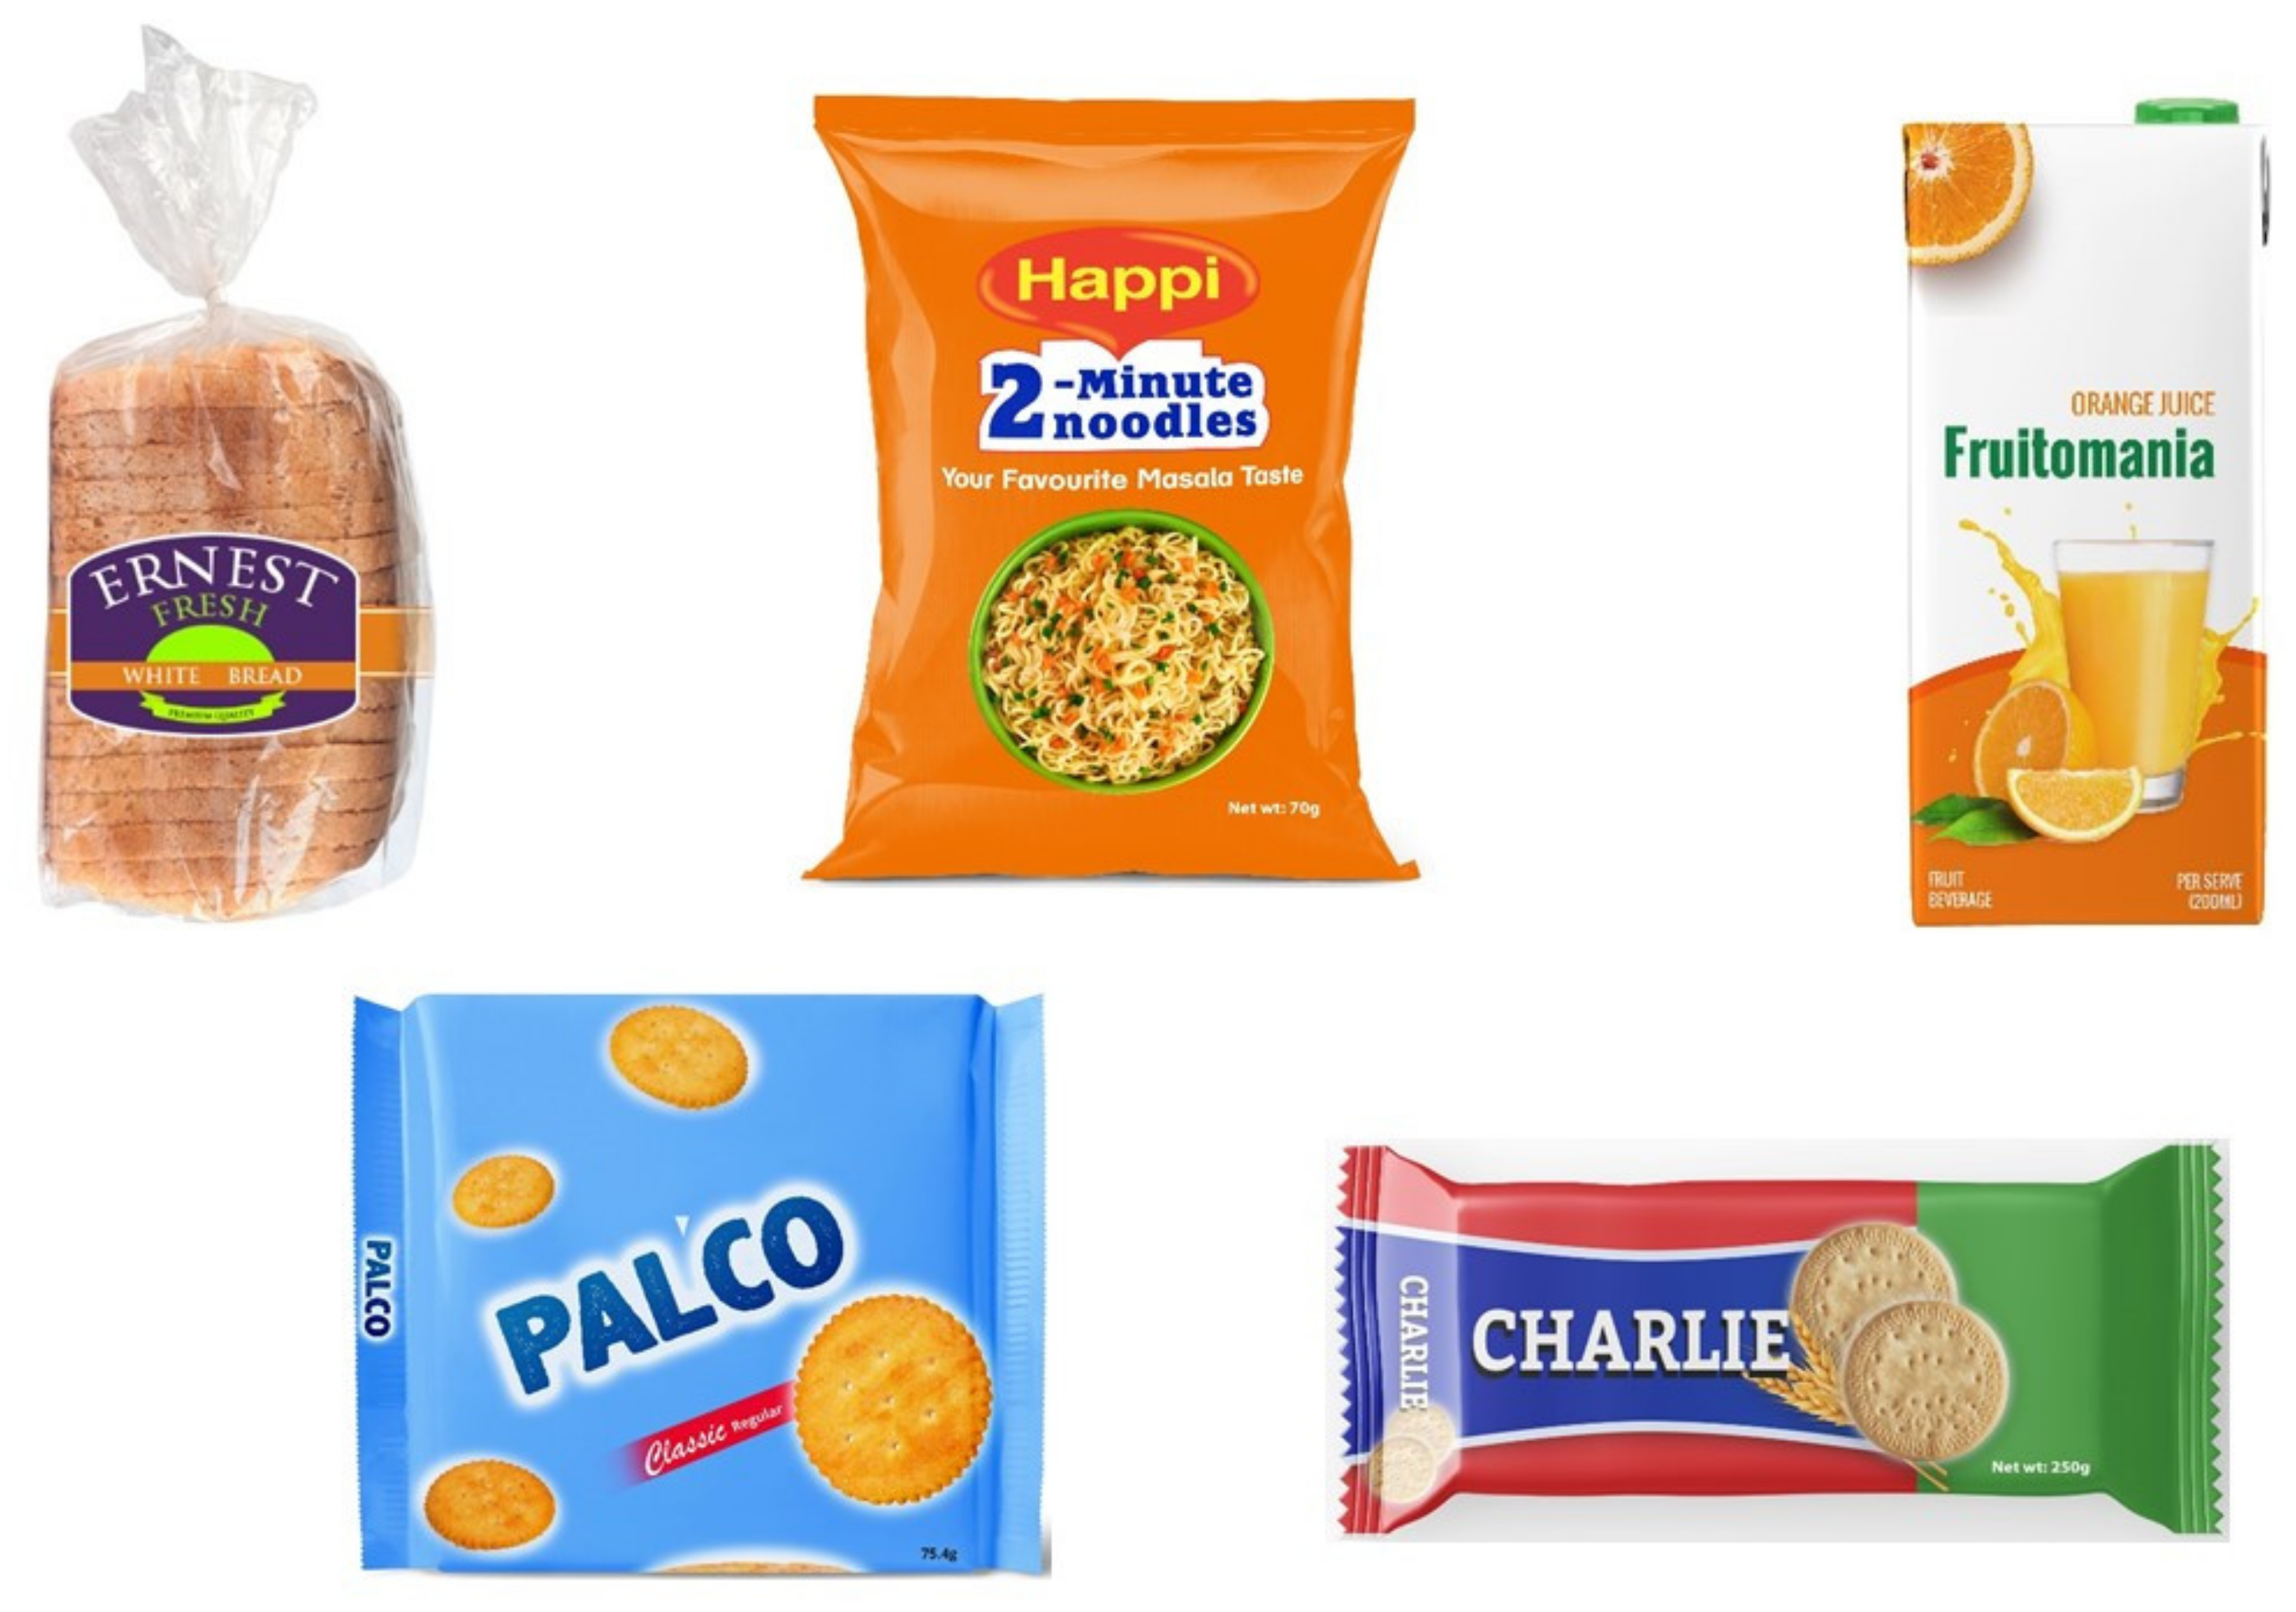
2.4. Stimuli
2.5. Cognitive Testing and Protocol Development
2.6. Procedure
2.7. Measures
2.8. Statistical Analysis
3. Results
3.1. Descriptive Results
3.2. Main Results
3.3. Moderation by Sociodemographic and Behavioral Characteristics
3.4. Label Selection
3.5. Sensitivity Analyses
4. Discussion
5. Conclusions
Author Contributions
Funding
Institutional Review Board Statement
Informed Consent Statement
Data Availability Statement
Acknowledgments
Conflicts of Interest
Appendix A


| Product Assessment | ||
| Excs_sf | B10. Do you think this product has high [sugar/sodium/saturated fat]? | 1 = Yes 0 = No |
| Unhealthy_sf | B11a. Is this product unhealthy? | 1 = Yes (Go to C11b) 0 = No (Go to C12a) |
| B11b. How unhealthy it is? | 1 = Very much 2 = Somewhat 3 = Very little | |
| Ppa_sf | B12a. Do you think this product is visually attractive? | 1 = Yes (Go to C12b) 0 = No (Go to C13a) |
| B12b. How visually attractive is this product? | 1 = Very much 2 = Somewhat 3 = Very little | |
| Buy_lkly_sf | B13a. Will you purchase this product next week, if it were available? | 1 = Yes (Go to C13b) 0 = No |
| B13b. How likely is it for you to want to purchase this product next week, if it were available? | 1 = Very much 2 = Somewhat 3 = Very little | |
| Label Assessment | ||
| Attention_sf | B1a. Does this label grab your attention? | 1 = Yes (Go to C1b) 0 = No (Go to C2a) |
| B1b. How much does this label grab your attention? | 1 = Very much 2 = Somewhat 3 = Very little | |
| PME_conc_sf | B2a. Does the label make you feel concerned about the health consequences of consuming this product? | 1 = Yes (Go to C2b) 0 = No (Go to C3a) |
| B2b. How concerned would you be about the health consequences of consuming this product? | 1 = Very much 2 = Somewhat 3 = Very little | |
| PME_unpl_sf | B3a. Does the label make this product seem unpleasant to you? | 1 = Yes (Go to C3b) 0 = No (Go to C4a) |
| B3b. How unpleasant does this product seem to you? | 1 = Very much 2 = Somewhat 3 = Very little | |
| Pme_disc_sf | B4a. Does the label make you feel discouraged from wanting to consume this product? | 1 = Yes (Got to C4b) 0 = No (Go to C5a) |
| B4b. How discouraged do you feel from wanting to consume this product? | 1 = Very much 2 = Somewhat 3 = Very little | |
| Cog_elab_sf | B5a. Does the label make you think about the health problems caused by consuming this product? | 1 = Yes (Go to C5b) 0 = No (Go to C6a) |
| B5b. How much does the label make you think about the health problems caused by consuming this product? | 1 = Very much 2 = Somewhat 3 = Very little | |
| Understand_sf | B6a. Do you understand what the label means? | 1 = Yes (Go to C6b) 0 = No (Go to C7a) |
| B6b. How much do you understand what the label means? | 1 = Very much 2 = Somewhat 3 = Very little | |
| Learn_new_sf | B7a. Has the label taught you anything? | 1 = Yes (Go to C7b) 0 = No (Go to C8a) |
| B7b. How much has the label taught you? | 1 = Very much 2 = Somewhat 3 = Very little | |
| Trust_sf | B8a. Do you think what label says is true? | 1 = Yes (Go to C8b) 0 = No (Go to C9a) |
| B8b. How much do you think what the label says is true? | 1 = Very much 2 = Somewhat 3 = Very little | |
| Liking_sf | B9a. Do you like to have this label on the products? | 1 = Yes (Go to C9b) 0 = No (Go to 10a) |
| B9b. How much would you like for products to have the label? | 1 = Very much 2 = Somewhat 3 = Very little |
| Control | Warning | GDA | HSR | MTL | |
|---|---|---|---|---|---|
| Product perceptions | |||||
| Identified all “high-in” nutrients, n (%) | 1125 (39.2) | 1819 (60.8) | 1517 (54.8) | 1363 (45.4) | 1495 (55.2) |
| How likely would you be to buy this product next week? | 2.6 (1.1) | 2.5 (1.0) | 2.6 (1.0) | 2.6 (1.0) | 2.5 (1.1) |
| How unhealthy is this product? | 1.7 (1.0) | 2.1 (1.2) | 1.9 (1.2) | 1.8 (1.1) | 2.0 (1.2) |
| How visually attractive is this product? | 2.7 (1.1) | 2.8 (1.0) | 2.9 (1.0) | 2.8 (1.0) | 2.9 (1.0) |
| Label reactions | |||||
| Does the label grab your attention? | 2.7 (1.0) | 2.9 (1.0) | 3.0 (1.0) | 2.8 (1.0) | 3.0 (1.0) |
| Perceived message effectiveness | 1.7 (0.8) | 2.1 (0.9) | 1.9 (0.8) | 1.9 (0.9) | 2.0 (0.9) |
| Does the label make you think about health problems? caused by this product? | 1.9 (1.1) | 2.4 (1.2) | 2.3 (1.2) | 2.2 (1.2) | 2.3 (1.2) |
| Do you understand the label? | 2.4 (1.1) | 2.8 (1.1) | 2.8 (1.1) | 2.7 (1.1) | 2.8 (1.1) |
| Does the label teach you anything? | 2.3 (1.2) | 2.8 (1.1) | 2.8 (1.1) | 2.7 (1.1) | 2.7 (1.2) |
| Do you think what the label says is true? | 2.6 (1.1) | 2.9 (1.1) | 2.9 (1.0) | 2.7 (1.1) | 2.8 (1.1) |
| Do you like to have the label on this product? | 2.7 (1.1) | 2.9 (1.0) | 2.9 (1.0) | 2.8 (1.0) | 2.9 (1.0) |
| Control | Warning | GDA | HSR | MTL | |
|---|---|---|---|---|---|
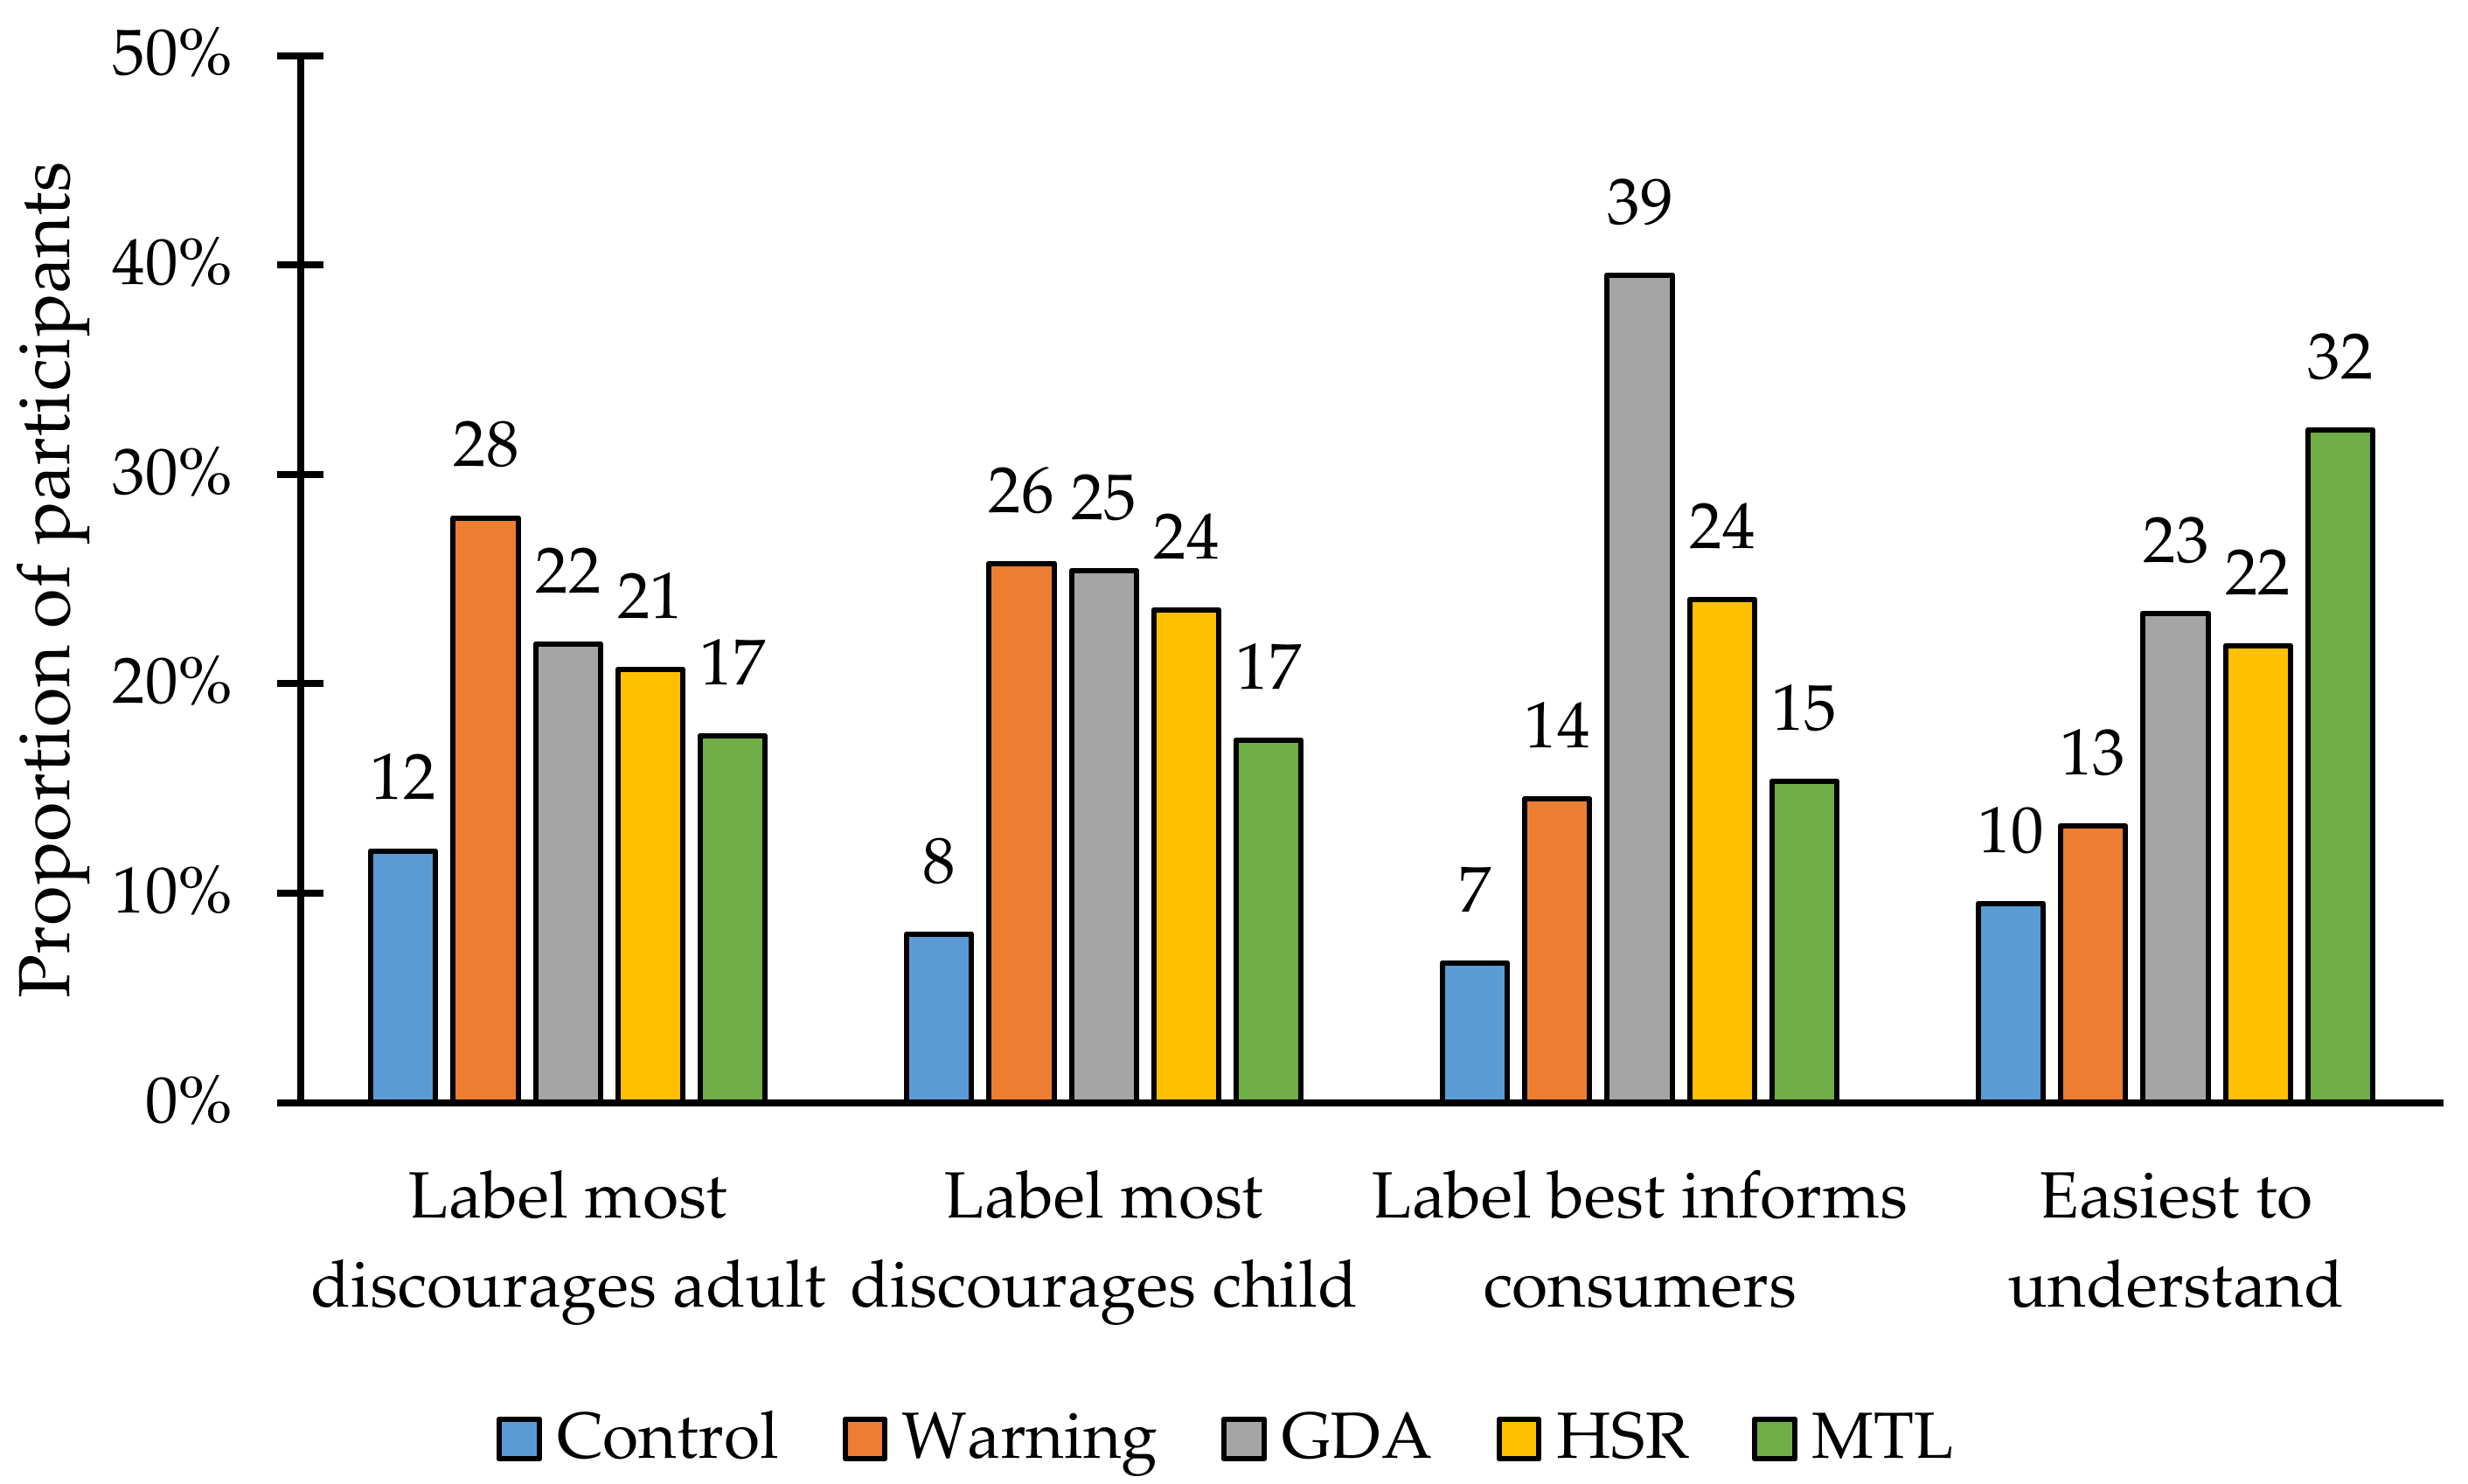
| Which label discourages you most from consuming this product? | |||||
| Control | 66 (11.5) | 73 (12.2) | 61 (11.0) | 80 (13.3) | 65 (12.0) |
| Warning | 174 (30.3) | 171 (28.6) | 137 (24.7) | 161 (26.8) | 158 (29.2) |
| GDA | 113 (19.7) | 124 (20.7) | 125 (22.6) | 149 (24.8) | 117 (21.6) |
| HSR | 124 (21.6) | 131 (21.9) | 110 (19.9) | 126 (21.0) | 102 (18.8) |
| MTL | 97 (16.9) | 99 (16.6) | 121 (21.8) | 85 (14.1) | 100 (18.5) |
| Which label discourages you most from feeding this product to a child? | |||||
| Control | 52 (9.1) | 54 (9.0) | 43 (7.8) | 41 (6.8) | 41 (7.6) |
| Warning | 140 (24.4) | 146 (24.4) | 138 (24.9) | 174 (29.0) | 140 (25.8) |
| GDA | 148 (25.8) | 164 (27.4) | 153 (27.6) | 139 (23.1) | 125 (23.1) |
| HSR | 136 (23.7) | 139 (23.2) | 126 (22.7) | 148 (24.6) | 126 (23.2) |
| MTL | 98 (17.1) | 95 (15.9) | 94 (17.0) | 99 (16.5) | 110 (20.3) |
| Which label best informs you that this product has high [nutrient]? | |||||
| Control | 44 (7.7) | 37 (6.2) | 37 (6.7) | 43 (7.2) | 30 (5.5) |
| Warning | 70 (12.2) | 99 (16.6) | 91 (16.4) | 78 (13.0) | 78 (14.4) |
| GDA | 234 (40.8) | 237 (39.6) | 221 (39.9) | 234 (38.9) | 207 (38.2) |
| HSR | 133 (23.2) | 149 (24.9) | 125 (22.6) | 147 (24.5) | 135 (24.9) |
| MTL | 93 (16.2) | 76 (12.7) | 80 (14.4) | 99 (16.5) | 92 (17.0) |
| Which label is easiest to understand? | |||||
| Control | 77 (13.4) | 45 (7.5) | 50 (9.0) | 56 (9.3) | 45 (8.3) |
| Warning | 66 (11.5) | 97 (16.2) | 75 (13.5) | 67 (11.1) | 74 (13.7) |
| GDA | 131 (22.8) | 152 (25.4) | 148 (26.7) | 134 (22.3) | 105 (19.4) |
| HSR | 120 (20.9) | 130 (21.7) | 122 (22.0) | 142 (23.6) | 112 (20.7) |
| MTL | 180 (31.4) | 174 (29.1) | 159 (28.7) | 202 (33.6) | 206 (38.0) |
| Control | Warning | GDA | HSR | MTL | |
|---|---|---|---|---|---|
| Correctly identified all high-in nutrients, n (%) | |||||
| Sweet biscuits | 142 (24.7) | 282 (47.2) | 216 (39.0) | 176 (29.3) | 190 (35.1) |
| Bread | 262 (45.6) | 410 (68.6) | 314 (56.7) | 295 (49.1) | 335 (61.8) |
| Fruit drink | 347 (60.5) | 459 (76.8) | 408 (73.6) | 385 (64.1) | 399 (73.6) |
| Noodles | 168 (29.3) | 323 (54) | 262 (47.3) | 244 (40.6) | 276 (50.9) |
| Savory biscuits | 206 (35.9) | 345 (57.7) | 317 (57.2) | 263 (43.8) | 295 (54.4) |
| Purchase intentions, mean (SD) | |||||
| Sweet biscuits | 2.6 (1.1) | 2.5 (1.0) | 2.7 (1.0) | 2.6 (1.0) | 2.6 (1.1) |
| Bread | 2.6 (1.1) | 2.5 (1.1) | 2.6 (1.0) | 2.7 (1.0) | 2.5 (1.1) |
| Fruit drink | 2.6 (1.1) | 2.4 (1.0) | 2.6 (1.0) | 2.6 (1.0) | 2.5 (1.1) |
| Noodles | 2.5 (1.1) | 2.4 (1.0) | 2.6 (1.0) | 2.5 (1.1) | 2.5 (1.0) |
| Savory biscuits | 2.6 (1.0) | 2.5 (1.0) | 2.6 (1.0) | 2.6 (1.0) | 2.6 (1.1) |
| Control | Warning | GDA | HSR | MTL | |
|---|---|---|---|---|---|
| Correctly identified all high-in nutrients, n (%) | |||||
| Odisha | 189 (47.8) | 221 (47) | 233 (50.7) | 173 (39.3) | 180 (43.4) |
| Uttar Pradesh | 224 (54) | 382 (85.8) | 438 (85.9) | 305 (67.8) | 363 (79.8) |
| Assam | 128 (25.9) | 260 (47.3) | 154 (33.5) | 101 (22.4) | 172 (45.9) |
| Delhi | 134 (24.4) | 241 (58.8) | 201 (42.8) | 168 (31.1) | 208 (42.9) |
| Karnataka | 272 (56.7) | 429 (72.1) | 283 (60.2) | 380 (63.3) | 272 (64.8) |
| Gujarat | 178 (33.3) | 286 (55) | 208 (52) | 236 (45) | 300 (53.6) |
| Purchase intentions, mean (SD) | |||||
| Odisha | 2.4 (1.1) | 2.2 (1.1) | 2.2 (1.1) | 2.2 (1.1) | 2.1 (1.1) |
| Uttar Pradesh | 2.7 (1.1) | 2.6 (1.0) | 2.8 (1.0) | 2.7 (1.0) | 2.8 (1.0) |
| Assam | 3.1 (0.8) | 2.8 (1.0) | 3.1 (0.8) | 3.1 (0.9) | 3 (0.9) |
| Delhi | 2.3 (1.1) | 2 (1.1) | 2.5 (1.1) | 2.4 (1.1) | 2.3 (1.1) |
| Karnataka | 2.7 (0.9) | 2.8 (0.9) | 2.8 (0.9) | 2.7 (0.9) | 2.7 (0.9) |
| Gujarat | 2.4 (1.0) | 2.2 (0.9) | 2.4 (0.9) | 2.5 (0.9) | 2.4 (1.0) |
| Control | Warning | GDA | HSR | MTL | |||||
|---|---|---|---|---|---|---|---|---|---|
| Mean (95% CI) | Mean (95% CI) | p | Mean (95% CI) | p | Mean (95% CI) | p | Mean (95% CI) | p | |
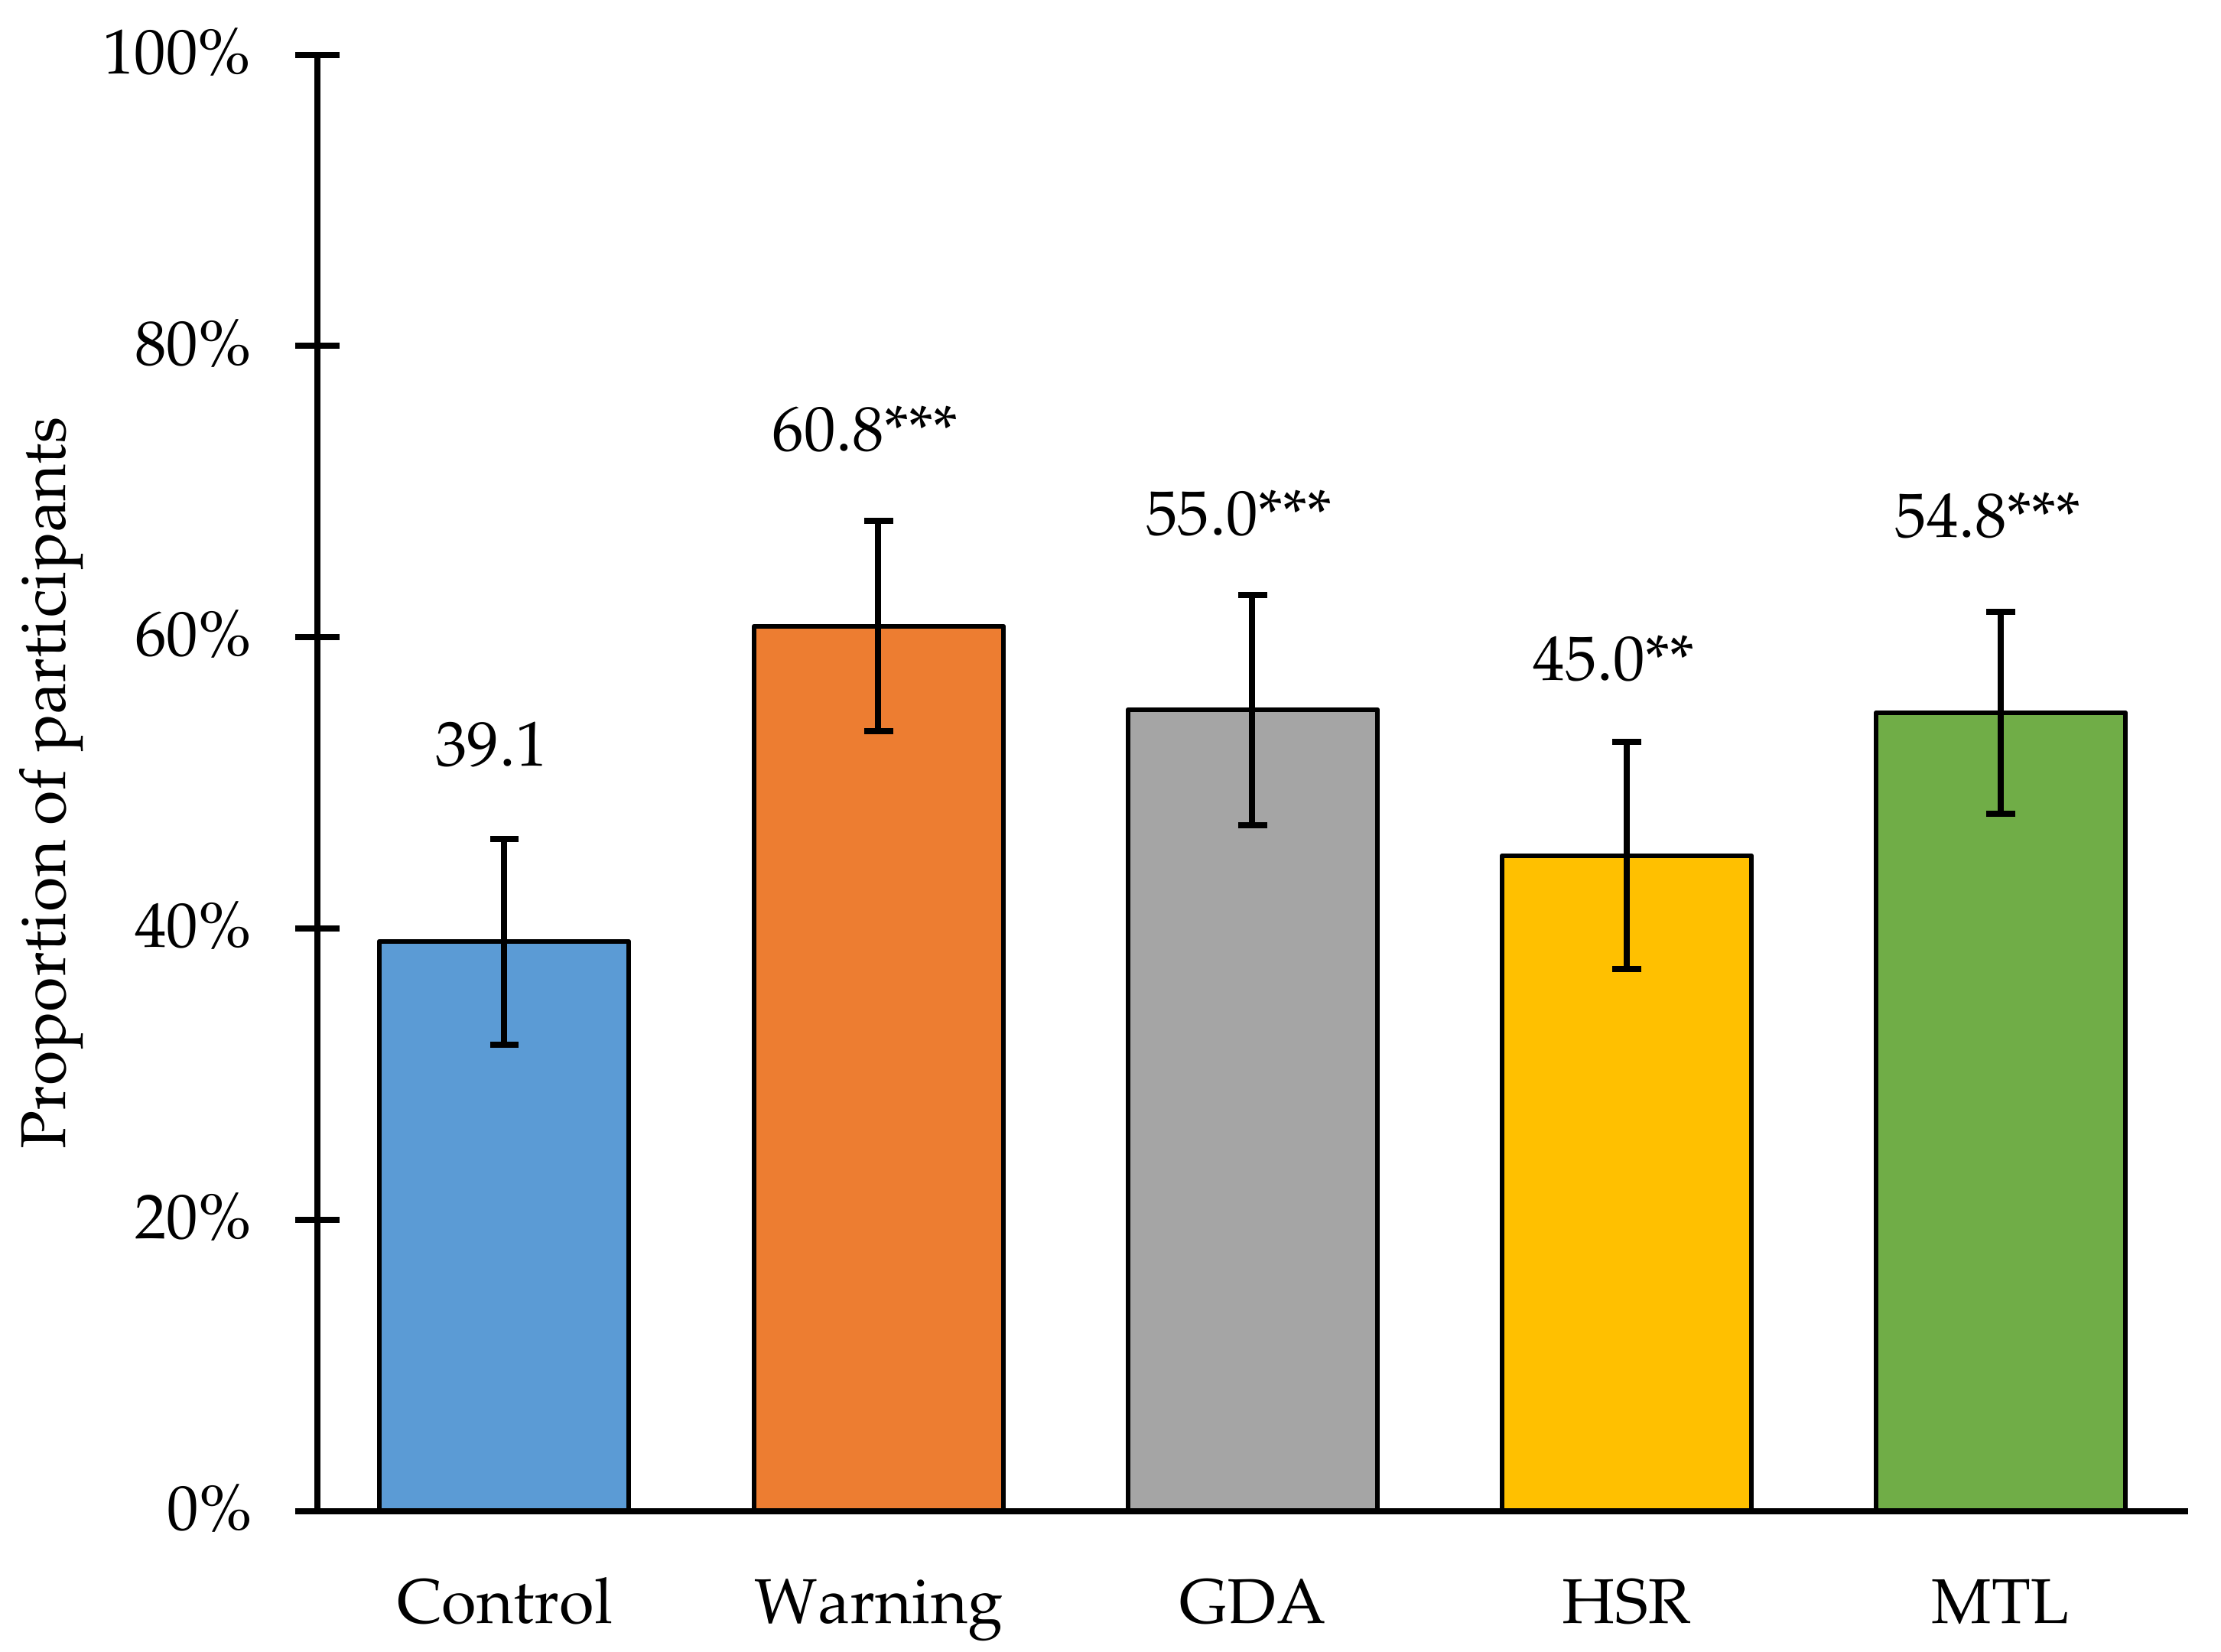
| Identified all “high-in” nutrients, % | 39.1 (32.0, 46.2) | 60.8 (53.5, 68.0) | <0.001 | 55.0 (47.1, 62.9) | <0.001 | 45.0 (37.1, 52.8) | 0.008 | 54.8 (47.9, 61.8) | <0.001 |
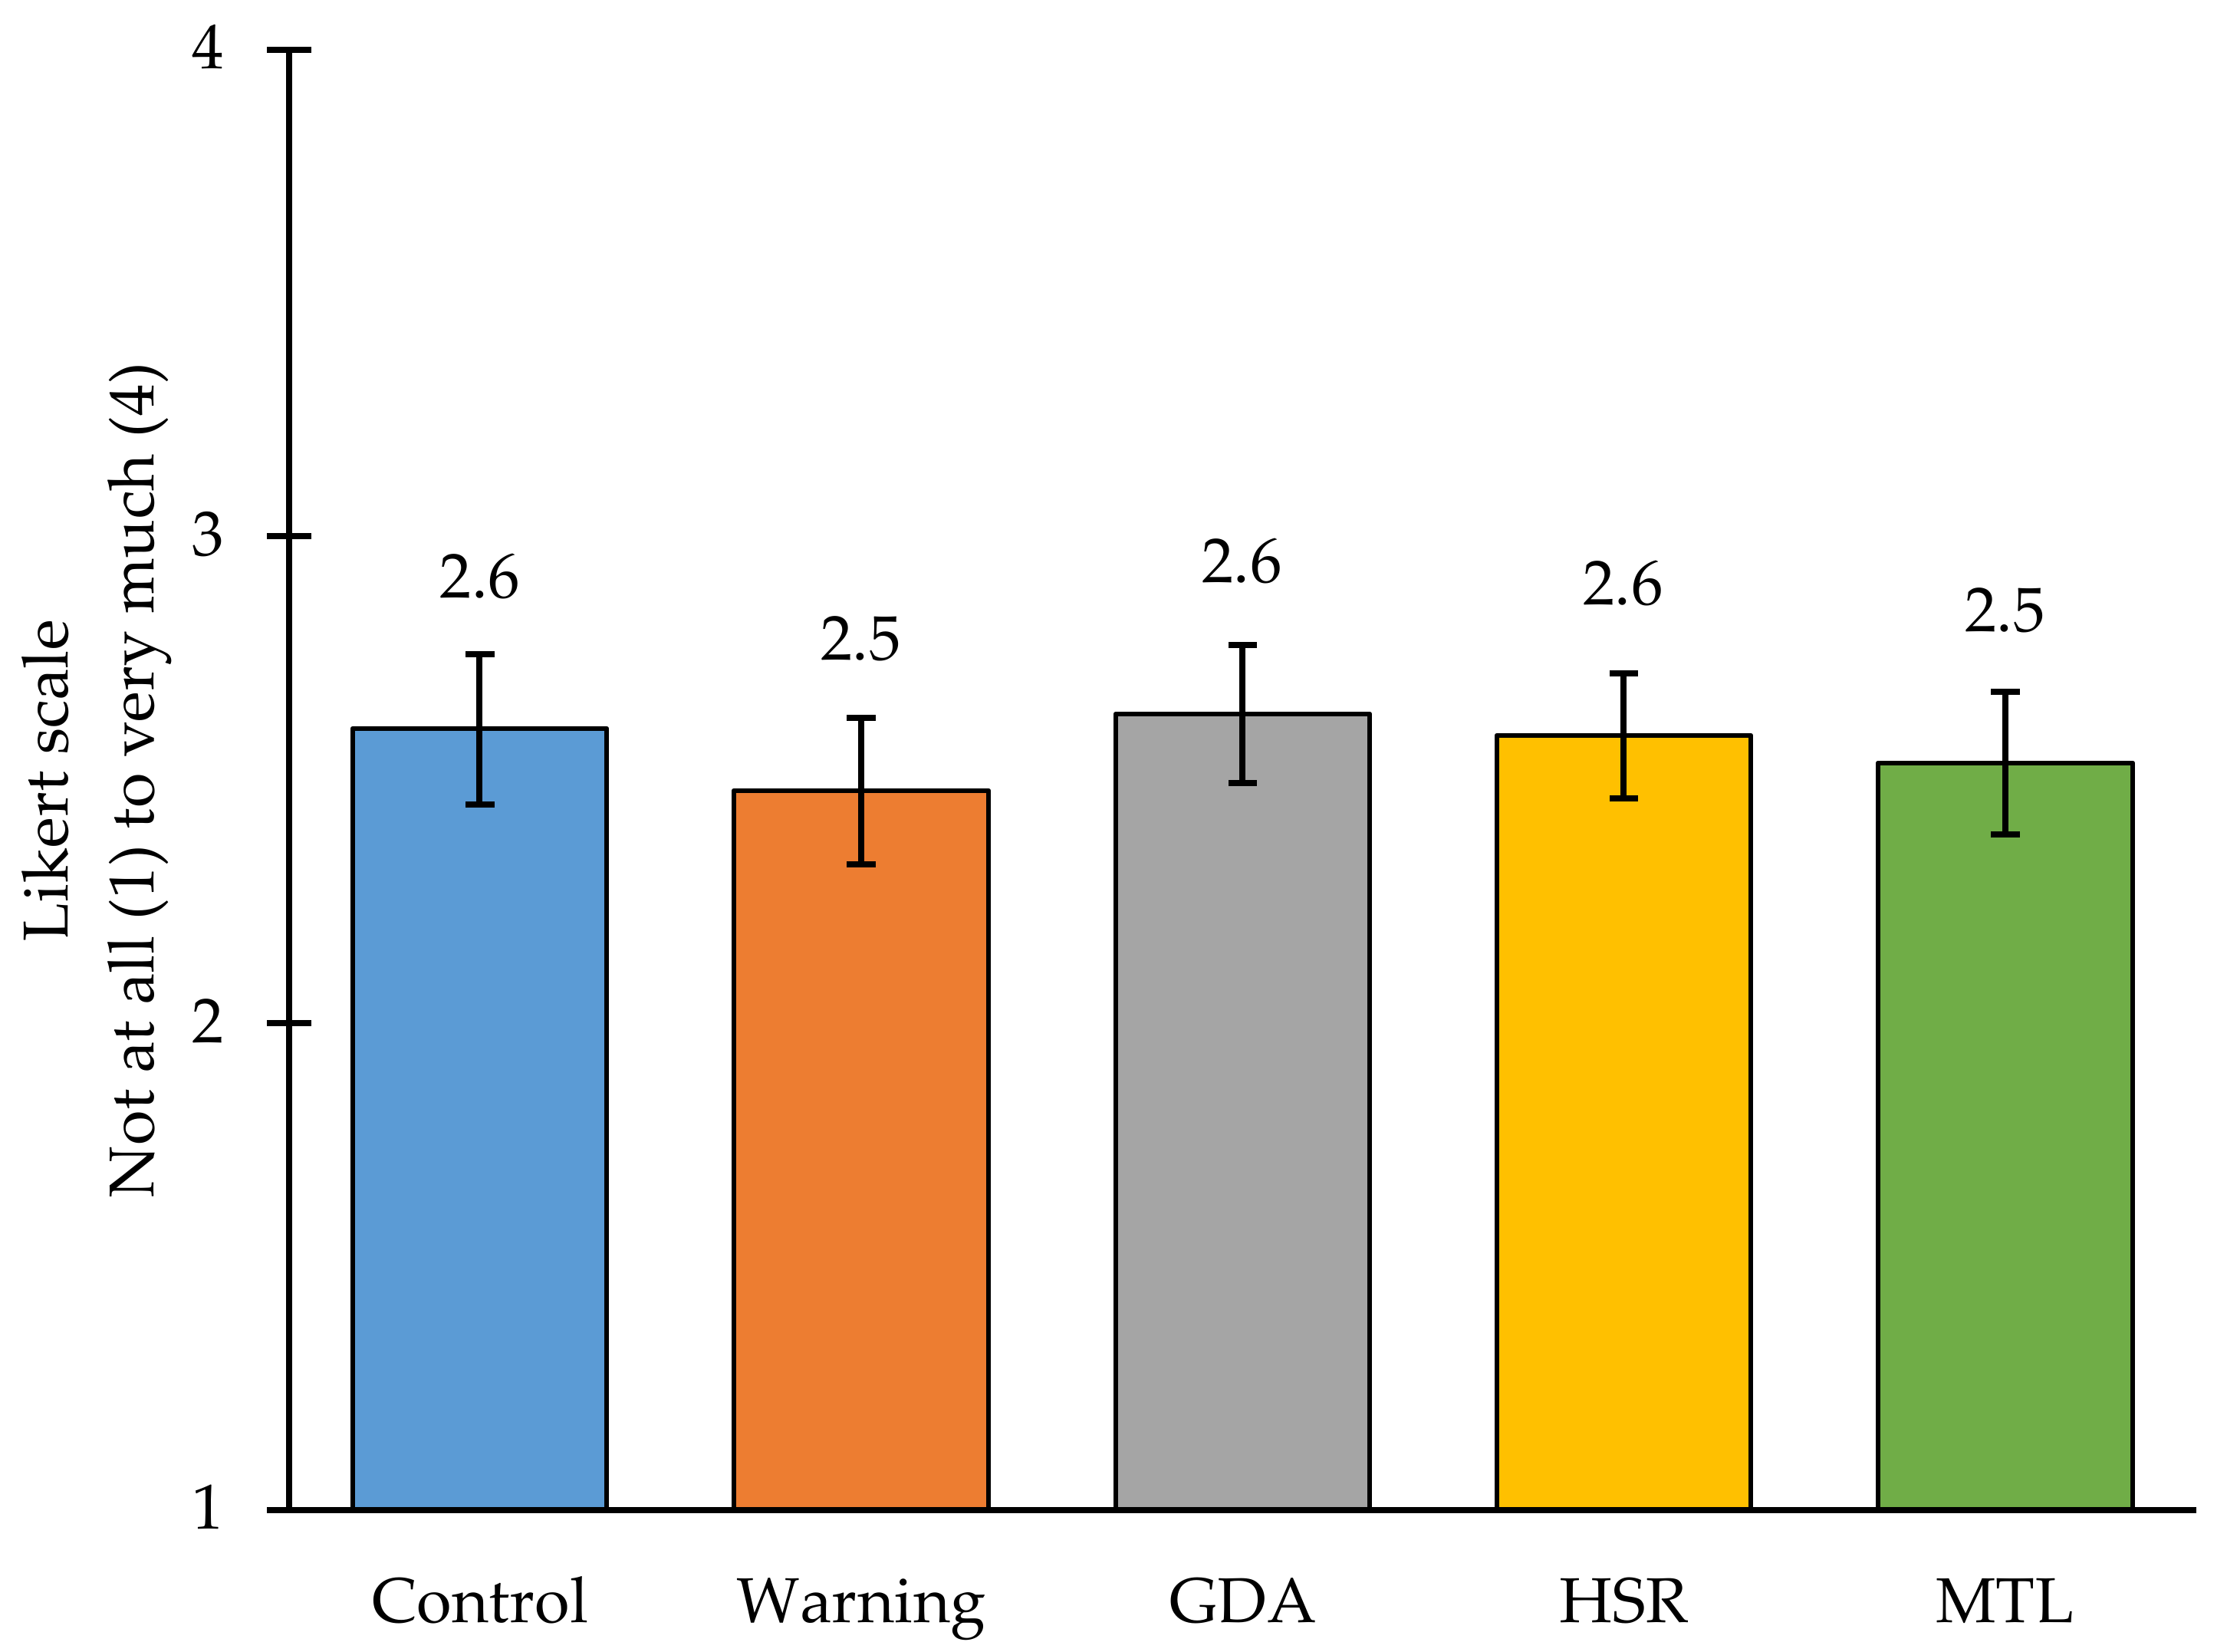
| How likely would you be to buy this product next week? | 2.6 (2.5, 2.8) | 2.5 (2.3, 2.6) | 0.110 | 2.6 (2.5, 2.8) | 1.000 | 2.6 (2.5, 2.7) | 0.758 | 2.5 (2.4, 2.7) | 0.664 |
| Control | Warning | GDA | HSR | MTL | |||||
|---|---|---|---|---|---|---|---|---|---|
| Mean (95% CI) | Mean (95% CI) | p | Mean (95% CI) | p | Mean (95% CI) | p | Mean (95% CI) | p | |
| Identified all “high-in” nutrients, % | 39.1 (36.3, 41.9) | 60.8 (58.0, 63.6) | <0.001 | 55.0 (52.0, 58.0) | <0.001 | 45.0 (42.2, 47.9) | 0.004 | 54.8 (51.8, 57.8) | <0.001 |
| How likely would you be to buy this product next week? | 2.6 (2.5, 2.7) | 2.5 (2.4, 2.5) | 0.018 | 2.6 (2.6, 2.7) | 1.000 | 2.6 (2.5, 2.7) | 0.763 | 2.5 (2.5, 2.6) | 0.393 |
| Control | Warning | GDA | HSR | MTL | |||||
|---|---|---|---|---|---|---|---|---|---|
| Mean (95% CI) | Mean (95% CI) | p | Mean (95% CI) | p | Mean (95% CI) | p | Mean (95% CI) | p | |
| Identified all “high-in” nutrients, % | 38.6 (35.8, 41.4) | 62.7 (59.8, 65.5) | <0.001 | 54.8 (51.8, 57.8) | <0.001 | 43.9 (41.0, 46.8) | 0.010 | 56.8 (53.8, 59.8) | <0.001 |
| How likely would you be to buy this product next week? | 2.6 (2.5, 2.7) | 2.5 (2.4, 2.6) | 0.083 | 2.6 (2.5, 2.7) | 0.886 | 2.6 (2.5, 2.6) | 0.915 | 2.6 (2.5, 2.6) | 0.967 |
References
- Shetty, P. Public health: India’s diabetes time bomb. Nature 2012, 485, S14–S16. [Google Scholar] [CrossRef]
- Misra, A.; Khurana, L. Obesity-related non-communicable diseases: South Asians vs. White Caucasians. Int. J. Obes. 2011, 35, 167–187. [Google Scholar] [CrossRef] [PubMed] [Green Version]
- Misra, A.; Khurana, L. The metabolic syndrome in South Asians: Epidemiology, determinants, and prevention. Metab. Syndr. Relat. Disord. 2009, 7, 497–514. [Google Scholar] [CrossRef] [PubMed]
- Government of India, International Institute for Population Sciences (IIPS) and ICF. National Family Health Survey (NFHS-5), 2019–2021; IIPS: Mumbai, India, 2022. [Google Scholar]
- World Obesity Federation. Global Obesity Observatory: India. Available online: https://data.worldobesity.org/country/india-95/#data_prevalence (accessed on 6 March 2022).
- Luhar, S.; Timæus, I.M.; Jones, R.; Cunningham, S.; Patel, S.A.; Kinra, S.; Clarke, L.; Houben, R. Forecasting the prevalence of overweight and obesity in India to 2040. PLoS ONE 2020, 15, e0229438. [Google Scholar] [CrossRef] [PubMed]
- Aiyar, A.; Rahman, A.; Pingali, P. India’s rural transformation and rising obesity burden. World Dev. 2021, 138, 105258. [Google Scholar] [CrossRef]
- Popkin, B.M.; Corvalan, C.; Grummer-Strawn, L.M. Dynamics of the double burden of malnutrition and the changing nutrition reality. Lancet 2020, 395, 65–74. [Google Scholar] [CrossRef]
- Subramanian, S.V.; Kawachi, I.; Smith, G.D. Income inequality and the double burden of under- and overnutrition in India. J. Epidemiol. Community Health 2007, 61, 802–809. [Google Scholar] [CrossRef] [Green Version]
- Meenakshi, J. Trends and patterns in the triple burden of malnutrition in India. Agric. Econ. 2016, 47, 115–134. [Google Scholar] [CrossRef] [Green Version]
- Pries, A.M.; Rehman, A.M.; Filteau, S.; Sharma, N.; Upadhyay, A.; Ferguson, E.L. Unhealthy Snack Food and Beverage Consumption Is Associated with Lower Dietary Adequacy and Length-for-Age z-Scores among 12–23-Month-Olds in Kathmandu Valley, Nepal. J. Nutr. 2019, 149, 1843–1851. [Google Scholar] [CrossRef]
- Euromonitor International. Passport Nutrition. Available online: http://www.euromonitor.com/. (accessed on 15 June 2022).
- Anand, S.S.; Hawkes, C.; de Souza, R.J.; Mente, A.; Dehghan, M.; Nugent, R.; Zulyniak, M.A.; Weis, T.; Bernstein, A.M.; Krauss, R.M.; et al. Food Consumption and its Impact on Cardiovascular Disease: Importance of Solutions Focused on the Globalized Food System: A Report From the Workshop Convened by the World Heart Federation. J. Am. Coll. Cardiol. 2015, 66, 1590–1614. [Google Scholar] [CrossRef] [Green Version]
- World Health Organization. Report of a WHO Forum and Technical Meeting. Reducing Salt Intake in Populations; WHO Press: Paris, France, 2006. [Google Scholar]
- World Health Organization; Food and Agricultural Organization. Diet, Nutrition and the Prevention of Chronic Diseases: Report of a Joint WHO/FAO Expert Consultation; Technical Report Series 916; WHO Press: Geneva, Switzerland, 2003. [Google Scholar]
- Pagliai, G.; Dinu, M.; Madarena, M.P.; Bonaccio, M.; Iacoviello, L.; Sofi, F. Consumption of ultra-processed foods and health status: A systematic review and meta-analysis. Br. J. Nutr. 2021, 125, 308–318. [Google Scholar] [CrossRef] [PubMed]
- Lane, M.M.; Davis, J.A.; Beattie, S.; Gómez-Donoso, C.; Loughman, A.; O’Neil, A.; Jacka, F.; Berk, M.; Page, R.; Marx, W. Ultraprocessed food and chronic noncommunicable diseases: A systematic review and meta-analysis of 43 observational studies. Obes. Rev. 2020, 22, e13146. [Google Scholar] [CrossRef] [PubMed]
- Askari, M.; Heshmati, J.; Shahinfar, H.; Tripathi, N.; Daneshzad, E. Ultra-processed food and the risk of overweight and obesity: A systematic review and meta-analysis of observational studies. Int. J. Obes. 2020, 44, 2080–2091. [Google Scholar] [CrossRef] [PubMed]
- Chen, X.; Zhang, Z.; Yang, H.; Qiu, P.; Wang, H.; Wang, F.; Zhao, Q.; Fang, J.; Nie, J. Consumption of ultra-processed foods and health outcomes: A systematic review of epidemiological studies. Nutr. J. 2020, 19, 86. [Google Scholar] [CrossRef] [PubMed]
- Meneguelli, T.S.; Hinkelmann, J.V.; Hermsdorff, H.H.M.; Zulet, M.Á.; Martínez, J.A.; Bressan, J. Food consumption by degree of processing and cardiometabolic risk: A systematic review. Int. J. Food Sci. Nutr. 2020, 71, 678–692. [Google Scholar] [CrossRef]
- Elizabeth, L.; Machado, P.; Zinöcker, M.; Baker, P.; Lawrence, M. Ultra-Processed Foods and Health Outcomes: A Narrative Review. Nutrients 2020, 12, 1955. [Google Scholar] [CrossRef] [PubMed]
- Santos, F.S.D.; Dias, M.D.S.; Mintem, G.C.; Oliveira, I.O.D.; Gigante, D.P. Food processing and cardiometabolic risk factors: A systematic review. Rev. De Saúde Pública 2020, 54, 70. [Google Scholar] [CrossRef]
- U.S. Department of Health and Human Services; U.S. Department of Agriculture. Scientific Report of the 2015 Dietary Guidelines Advisory Committee; U.S. Department of Health and Human Services: Washington, DC, USA; U.S. Department of Agriculture: Washington, DC, USA, 2015.
- World Health Organization. Guideline: Sugars Intake for Adults and Children; WHO Press: Geneva, Switzerland, 2015. [Google Scholar]
- World Cancer Research Fund International. Curbing Global Sugar Consumption: Effective Food Policy Actions to Help Promote Healthy Diets and Tackle Obesity; World Cancer Research Fund International: London, UK, 2015. [Google Scholar]
- Hall, K.D.; Ayuketah, A.; Brychta, R.; Cai, H.; Cassimatis, T.; Chen, K.Y.; Chung, S.T.; Costa, E.; Courville, A.; Darcey, V.; et al. Ultra-processed diets cause excess calorie intake and weight gain: A one-month inpatient randomized controlled trial of ad libitum food intake. Cell Metab. 2019, 30, 67–77.e3. [Google Scholar] [CrossRef] [Green Version]
- World Health Organization. Global Strategy on Diet, Physical Activity and Health; WHO Press: Paris, France, 2004. [Google Scholar]
- World Health Organization. Guiding Principles and Framework Manual for Front-of-Pack Labelling for Promoting Healthy Diets. Available online: https://apps.who.int/nutrition/publications/policies/guidingprinciples-labelling-promoting-healthydiet/en/index.html (accessed on 29 September 2021).
- World Health Organization. Sodium Intake for Adults and Children: Guidance Summary. Available online: https://www.who.int/publications/i/item/9789240025097 (accessed on 29 October 2021).
- World Health Organization Western Pacific. Reducing Sodium in Food and Excessive Salt Intake. Available online: https://www.who.int/china/activities/reducing-sodium-in-food-and-excessive-salt-intake (accessed on 2 November 2021).
- World Health Organization. Draft Guidelines on Saturated Fatty Acid and Trans-Fatty Acid Intake for Adults and Children; World Health Organization: Geneva, Switzerland, 2018; p. 103. [Google Scholar]
- Shekar, M.; Popkin, B. (Eds.) Obesity: Health and Economic Consequences of an Impending Global Challenge; Human Development Perspectives Series; The World Bank: Washington, DC, USA, 2020; p. 204. [Google Scholar]
- World Cancer Research Fund/American Institute for Cancer Research. Diet, Nutrition, Physical Activity and Cancer: A Global Perspective; Continuous Update Project Expert Report; WCRF International: London, UK, 2018. [Google Scholar]
- Roberto, C.A.; Ng, S.W.; Ganderats-Fuentes, M.; Hammond, D.; Barquera, S.; Jauregui, A.; Taillie, L.S. The Influence of Front-of-Package Nutrition Labeling on Consumer Behavior and Product Reformulation. Annu. Rev. Nutr. 2021, 41, 529–550. [Google Scholar] [CrossRef]
- Song, J.; Brown, M.K.; Tan, M.; MacGregor, G.A.; Webster, J.; Campbell, N.R.; Trieu, K.; Ni Mhurchu, C.; Cobb, L.K.; He, F.J. Impact of color-coded and warning nutrition labelling schemes: A systematic review and network meta-analysis. PLoS Med. 2021, 18, e1003765. [Google Scholar] [CrossRef]
- Grummon, A.H.; Hall, M.G. Sugary drink warnings: A meta-analysis of experimental studies. PLoS Med. 2020, 17, e1003120. [Google Scholar] [CrossRef]
- Scapin, T.; Fernandes, A.C.; Curioni, C.C.; Pettigrew, S.; Neal, B.; Coyle, D.H.; Rodrigues, V.M.; Bernardo, G.L.; Uggioni, P.L.; Proença, R.P. Influence of sugar label formats on consumer understanding and amount of sugar in food choices: A systematic review and meta-analyses. Nutr. Rev. 2021, 79, 788–801. [Google Scholar] [CrossRef] [PubMed]
- Taillie, L.; Bercholz, M.; Popkin, B.; Reyes, M.; Colchero, A.; Corvalan, C. Changes in food purchases after Chile’s polices on food labeling, marketing, and sales in schools: A before and after study. Lancet Planet. Health 2021, in press. [Google Scholar] [CrossRef]
- Correa, T.; Fierro, C.; Reyes, M.; Carpentier, F.R.D.; Taillie, L.S.; Corvalan, C. Responses to the Chilean law of food labeling and advertising: Exploring knowledge, perceptions and behaviors of mothers of young children. Int. J. Behav. Nutr. Phys. Act. 2019, 16, 21. [Google Scholar] [CrossRef] [PubMed]
- Fichera, E.; von Hinke, S. The response to nutritional labels: Evidence from a quasi-experiment. J. Health Econ. 2020, 72, 102326. [Google Scholar] [CrossRef]
- Sacks, G.; Rayner, M.; Swinburn, B. Impact of front-of-pack ‘traffic-light’ nutrition labelling on consumer food purchases in the UK. Health Promot. Int. 2009, 24, 344–352. [Google Scholar] [CrossRef] [Green Version]
- Radosevich, A.; Mendes, F.D.C.; Villegas, R.; Mora-Garcia, G.; Garcia-Larsen, V. Awareness, Understanding and Use of the ‘Traffic Light’ Food Labelling Policy and Educational Level in Ecuador—Findings from the National Nutrition Survey 2018. Curr. Dev. Nutr. 2020, 4, 1731. [Google Scholar] [CrossRef]
- Sandoval, L.A.; Carpio, C.E.; Sanchez-Plata, M. The effect of ‘Traffic-Light’nutritional labelling in carbonated soft drink purchases in Ecuador. PLoS ONE 2019, 14, e0222866. [Google Scholar] [CrossRef] [Green Version]
- Peñaherrera, V.; Carpio, C.; Sandoval, L.; Sánchez, M.; Cabrera, T.; Guerrero, P.; Borja, I. Effect of traffic-light labeling on nutritional content and on consumption of carbonated beverages in EcuadorEfeito da rotulagem nutricional com modelo de semáforo no consumo de refrigerantes no Equador. Rev. Panam. De Salud Publica = Pan Am. J. Public Health 2018, 42, e177. [Google Scholar]
- Shahid, M.; Neal, B.; Jones, A. Uptake of Australia’s Health Star Rating System 2014–2019. Nutrients 2020, 12, 1791. [Google Scholar] [CrossRef]
- Croker, H.; Packer, J.; Russell, S.J.; Stansfield, C.; Viner, R.M. Front of pack nutritional labelling schemes: A systematic review and meta-analysis of recent evidence relating to objectively measured consumption and purchasing. J. Hum. Nutr. Diet. 2020, 33, 518–537. [Google Scholar] [CrossRef] [PubMed]
- Neal, B.; Crino, M.; Dunford, E.; Gao, A.; Greenland, R.; Li, N.; Ngai, J.; Ni Mhurchu, C.; Pettigrew, S.; Sacks, G. Effects of different types of front-of-pack labelling information on the healthiness of food purchases—A randomised controlled trial. Nutrients 2017, 9, 1284. [Google Scholar] [CrossRef] [PubMed] [Green Version]
- Ni Mhurchu, C.; Volkova, E.; Jiang, Y.; Eyles, H.; Michie, J.; Neal, B.; Blakely, T.; Swinburn, B.; Rayner, M. Effects of interpretive nutrition labels on consumer food purchases: The Starlight randomized controlled trial. Am. J. Clin. Nutr. 2017, 105, 695–704. [Google Scholar] [CrossRef] [PubMed] [Green Version]
- Siegrist, M.; Leins-Hess, R.; Keller, C. Which front-of-pack nutrition label is the most efficient one? The results of an eye-tracker study. Food Qual. Prefer. 2015, 39, 183–190. [Google Scholar] [CrossRef]
- Ducrot, P.; Méjean, C.; Julia, C.; Kesse-Guyot, E.; Touvier, M.; Fezeu, L.; Hercberg, S.; Péneau, S. Effectiveness of Front-Of-Pack Nutrition Labels in French Adults: Results from the NutriNet-Santé Cohort Study. PLoS ONE 2015, 10, e0140898. [Google Scholar] [CrossRef] [PubMed]
- Ducrot, P.; Julia, C.; Mejean, C.; Kesse-Guyot, E.; Touvier, M.; Fezeu, L.K.; Hercberg, S.; Peneau, S. Impact of Different Front-of-Pack Nutrition Labels on Consumer Purchasing Intentions: A Randomized Controlled Trial. Am. J. Prev. Med. 2016, 50, 627–636. [Google Scholar] [CrossRef] [PubMed]
- Julia, C.; Péneau, S.; Buscail, C.; Gonzalez, R.; Touvier, M.; Hercberg, S.; Kesse-Guyot, E. Perception of different formats of front-of-pack nutrition labels according to sociodemographic, lifestyle and dietary factors in a French population: Cross-sectional study among the NutriNet-Santé cohort participants. BMJ Open 2017, 7, e016108. [Google Scholar] [CrossRef] [PubMed]
- Talati, Z.; Norman, R.; Pettigrew, S.; Neal, B.; Kelly, B.; Dixon, H.; Ball, K.; Miller, C.; Shilton, T. The impact of interpretive and reductive front-of-pack labels on food choice and willingness to pay. Int. J. Behav. Nutr. Phys. Act. 2017, 14, 171. [Google Scholar] [CrossRef] [PubMed] [Green Version]
- Vargas-Meza, J.; Jáuregui, A.; Contreras-Manzano, A.; Nieto, C.; Barquera, S. Acceptability and understanding of front-of-pack nutritional labels: An experimental study in Mexican consumers. BMC Public Health 2019, 19, 1751. [Google Scholar] [CrossRef] [Green Version]
- Jáuregui, A.; Vargas-Meza, J.; Nieto, C.; Contreras-Manzano, A.; Alejandro, N.Z.; Tolentino-Mayo, L.; Hall, M.G.; Barquera, S. Impact of front-of-pack nutrition labels on consumer purchasing intentions: A randomized experiment in low- and middle-income Mexican adults. BMC Public Health 2020, 20, 463. [Google Scholar] [CrossRef]
- Deliza, R.; de Alcantara, M.; Pereira, R.; Ares, G. How do different warning signs compare with the guideline daily amount and traffic-light system? Food Qual. Prefer. 2020, 80, 103821. [Google Scholar] [CrossRef]
- Temple, N.J. Front-of-package food labels: A narrative review. Appetite 2020, 144, 104485. [Google Scholar] [CrossRef] [PubMed]
- Hock, K.; Acton, R.B.; Jáuregui, A.; Vanderlee, L.; White, C.M.; Hammond, D. Experimental study of front-of-package nutrition labels’ efficacy on perceived healthfulness of sugar-sweetened beverages among youth in six countries. Prev. Med. Rep. 2021, 24, 101577. [Google Scholar] [CrossRef]
- Saleem, S.M.; Bhattacharya, S.; Deshpande, N. Non-communicable diseases, type 2 diabetes, and influence of front of package nutrition labels on consumer’s behaviour: Reformulations and future scope. Diabetes Metab. Syndr. Clin. Res. Rev. 2022, 16, 102422. [Google Scholar] [CrossRef] [PubMed]
- Pande, R.; Gavaravarapu, S.M.; Kulkarni, B. Front-of-pack nutrition labelling in India. Lancet Public Health 2020, 5, e195. [Google Scholar] [CrossRef]
- Sahay, A.; Sanghvi, R.; Ghosh, R.K. Consumer Preferences for Different Nutrition Front-of-Pack Labels in India. Available online: https://fssai.gov.in/upload/advisories/2022/02/6214c8459e38dIIMA_FoPL_Report_22_02_2022.pdf (accessed on 1 July 2022).
- Bopape, M.; Taillie, L.S.; Frank, T.; Murukutla, N.; Cotter, T.; Majija, L.; Swart, R. South African consumers’ perceptions of front-of-package warning labels on unhealthy foods and drinks. PLoS ONE 2021, 16, e0257626. [Google Scholar] [CrossRef]
- Hall, M.G.; Lazard, A.J.; Grummon, A.H.; Higgins, I.C.A.; Bercholz, M.; Richter, A.P.C.; Taillie, L.S. Designing warnings for sugary drinks: A randomized experiment with Latino parents and non-Latino parents. Prev. Med. 2021, 148, 106562. [Google Scholar] [CrossRef]
- Grummon, A.H.; Taillie, L.S.; Golden, S.D.; Hall, M.G.; Ranney, L.M.; Brewer, N.T. Sugar-Sweetened Beverage Health Warnings and Purchases: A Randomized Controlled Trial. Am. J. Prev. Med. 2019, 57, 601–610. [Google Scholar] [CrossRef]
- Hall, M.G.; Grummon, A.H.; Higgins, I.C.A.; Lazard, A.J.; Prestemon, C.E.; Avendano-Galdamez, M.I.; Taillie, L.S. The impact of pictorial health warnings on purchases of sugary drinks for children: A randomized controlled trial. PLoS Med. 2022, 19, e1003885. [Google Scholar] [CrossRef]
- Commonwealth of Australia, Department of Health. Health Star Rating Calculator. Available online: http://www.healthstarrating.gov.au/internet/healthstarrating/publishing.nsf/Content/excel-calculator (accessed on 1 January 2022).
- Indian Council of Medical Research-National Institute of Nutrition, Department of Health Research, Ministry of Health and Family Welfare, Government of India. Nutrient Requirements for Indians. Available online: https://www.nin.res.in/RDA_Full_Report_2020.html (accessed on 1 January 2022).
- Beatty, P.C.; Willis, G.B. Research Synthesis: The Practice of Cognitive Interviewing. Public Opin. Q. 2007, 71, 287–311. [Google Scholar] [CrossRef] [Green Version]
- Noar, S.M.; Barker, J.; Bell, T.; Yzer, M. Does Perceived Message Effectiveness Predict the Actual Effectiveness of Tobacco Education Messages? A Systematic Review and Meta-Analysis. Health Commun. 2020, 35, 148–157. [Google Scholar] [CrossRef]
- Taillie, L.S.; Hall, M.G.; Popkin, B.M.; Ng, S.W.; Murukutla, N. Experimental Studies of Front-of-Package Nutrient Warning Labels on Sugar-Sweetened Beverages and Ultra-Processed Foods: A Scoping Review. Nutrients 2020, 12, 569. [Google Scholar] [CrossRef] [PubMed] [Green Version]
- PAHO. Recommendations from a Pan American Health Organization Expert Consultation on the Marketing of Food and Non-Alcoholic Beverages to Children in the Americas; Pan American Health Organization: Washington, DC, USA, 2012; pp. 1–41. [Google Scholar]
- Regional Office for South-East Asia, World Health Organization. WHO Nutrient Profile Model for South-East Asia Region; WHO Regional Office for South-East Asia: New Delhi, India, 2017; p. 22. [Google Scholar]
- Pan American Health Organization, World Health Organization. Pan American Health Organization Nutrient Profile Model; Pan American Health Organization: Washington, DC, USA, 2016; p. 32. [Google Scholar]
- Mora-Plazas, M.; Aida Higgins, I.C.; Gomez, L.F.; Hall, M.; Parra, M.F.; Bercholz, M.; Murukutla, N.; Taillie, L.S. Impact of nutrient warning labels on choice of ultra-processed food and drinks high in sugar, sodium, and saturated fat in Colombia: A randomized controlled trial. PLoS ONE 2022, 17, e0263324. [Google Scholar] [CrossRef] [PubMed]
- Egnell, M.; Talati, Z.; Hercberg, S.; Pettigrew, S.; Julia, C. Objective Understanding of Front-of-Package Nutrition Labels: An International Comparative Experimental Study across 12 Countries. Nutrients 2018, 10, 1542. [Google Scholar] [CrossRef] [PubMed] [Green Version]
- Vanderlee, L.; Franco-Arellano, B.; Ahmed, M.; Oh, A.; Lou, W.; L’Abbé, M.R. The efficacy of ‘high in’warning labels, health star and traffic light front-of-package labelling: An online randomised control trial. Public Health Nutr. 2021, 24, 62–74. [Google Scholar] [CrossRef]
- Anderson, C.L.; O’Connor, E.L. The effect of the health star rating on consumer decision-making. Food Qual. Prefer. 2019, 73, 215–225. [Google Scholar] [CrossRef]
- Baig, S.A.; Noar, S.M.; Gottfredson, N.C.; Lazard, A.J.; Ribisl, K.M.; Brewer, N.T. Incremental criterion validity of message perceptions and effects perceptions in the context of anti-smoking messages. J. Behav. Med. 2021, 44, 74–83. [Google Scholar] [CrossRef]
- Baig, S.A.; Noar, S.M.; Gottfredson, N.C.; Boynton, M.H.; Ribisl, K.M.; Brewer, N.T. UNC Perceived Message Effectiveness: Validation of a brief scale. Ann. Behav. Med. A Publ. Soc. Behav. Med. 2018, 53, 732–742. [Google Scholar] [CrossRef]
- Grummon, A.H.; Hall, M.G.; Taillie, L.S.; Brewer, N.T. How should sugar-sweetened beverage health warnings be designed? A randomized experiment. Prev. Med. 2019, 121, 158–166. [Google Scholar] [CrossRef]
- Noar, S.M.; Bell, T.; Kelley, D.; Barker, J.; Yzer, M. Perceived message effectiveness measures in tobacco education campaigns: A systematic review. Commun. Methods Meas. 2018, 12, 295–313. [Google Scholar] [CrossRef]
- Hall, M.G.; Grummon, A.H.; Lazard, A.J.; Maynard, O.M.; Taillie, L.S. Reactions to graphic and text health warnings for cigarettes, sugar-sweetened beverages, and alcohol: An online randomized experiment of US adults. Prev. Med. 2020, 137, 106120. [Google Scholar] [CrossRef] [PubMed]
- The World Bank. Adult Literacy Rate in India, Age 15+; World Bank: Washington, DC, USA, 2018. [Google Scholar]
- Houts, P.S.; Doak, C.C.; Doak, L.G.; Loscalzo, M.J. The role of pictures in improving health communication: A review of research on attention, comprehension, recall, and adherence. Patient Educ. Couns. 2006, 61, 173–190. [Google Scholar] [CrossRef] [PubMed]
- Mutti, S.; Reid, J.L.; Gupta, P.C.; Pednekar, M.S.; Dhumal, G.; Nargis, N.; Hussain, A.G.; Hammond, D. Perceived effectiveness of text and pictorial health warnings for smokeless tobacco packages in Navi Mumbai, India, and Dhaka, Bangladesh: Findings from an experimental study. Tob. Control 2016, 25, 437–443. [Google Scholar] [CrossRef] [PubMed] [Green Version]
- Cantrell, J.; Vallone, D.M.; Thrasher, J.F.; Nagler, R.H.; Feirman, S.P.; Muenz, L.R.; He, D.Y.; Viswanath, K. Impact of tobacco-related health warning labels across socioeconomic, race and ethnic groups: Results from a randomized web-based experiment. PLoS ONE 2013, 8, e52206. [Google Scholar] [CrossRef] [PubMed] [Green Version]


| p | Control (n = 574) | Warning (n = 598) | GDA (n = 554) | HSR (n = 601) | MTL (n = 542) | Total (n = 2869) | |
|---|---|---|---|---|---|---|---|
| State | 0.114 | ||||||
| Odisha | 79 (13.8) | 94 (15.7) | 92 (16.6) | 88 (14.6) | 83 (15.3) | 436 (15.2) | |
| Uttar Pradesh | 83 (14.5) | 89 (14.9) | 102 (18.4) | 90 (15.0) | 91 (16.8) | 455 (15.9) | |
| Assam | 99 (17.2) | 110 (18.4) | 92 (16.6) | 90 (15.0) | 75 (13.8) | 466 (16.2) | |
| Delhi | 110 (19.2) | 82 (13.7) | 94 (17.0) | 108 (18.0) | 97 (17.9) | 491 (17.1) | |
| Karnataka | 96 (16.7) | 119 (19.9) | 94 (17.0) | 120 (20.0) | 84 (15.5) | 513 (17.9) | |
| Gujarat | 107 (18.6) | 104 (17.4) | 80 (14.4) | 105 (17.5) | 112 (20.7) | 508 (17.7) | |
| Urbanicity | 0.603 | ||||||
| Urban | 307 (53.5) | 289 (48.3) | 286 (51.6) | 309 (51.4) | 285 (52.6) | 1476 (51.4) | |
| Semi-urban | 133 (23.2) | 168 (28.1) | 131 (23.6) | 149 (24.8) | 124 (22.9) | 705 (24.6) | |
| Peri-rural | 134 (23.3) | 141 (23.6) | 137 (24.7) | 143 (23.8) | 133 (24.5) | 688 (24.0) | |
| Age | 0.880 | ||||||
| 18–30 year | 195 (34.0) | 209 (34.9) | 176 (31.8) | 205 (34.1) | 190 (35.1) | 975 (34.0) | |
| 31–40 year | 200 (34.8) | 220 (36.8) | 212 (38.3) | 211 (35.1) | 187 (34.5) | 1030 (35.9) | |
| 41–60 year | 179 (31.2) | 169 (28.3) | 166 (30.0) | 185 (30.8) | 165 (30.4) | 864 (30.1) | |
| Gender | 0.933 | ||||||
| Man | 290 (50.5) | 301 (50.3) | 286 (51.6) | 298 (49.6) | 266 (49.1) | 1441 (50.2) | |
| Woman | 284 (49.5) | 297 (49.7) | 268 (48.4) | 303 (50.4) | 276 (50.9) | 1428 (49.8) | |
| Education level | 0.098 | ||||||
| <12 years | 256 (44.6) | 237 (39.6) | 254 (45.8) | 255 (42.4) | 254 (46.9) | 1256 (43.8) | |
| ≥12 years | 318 (55.4) | 361 (60.4) | 300 (54.2) | 346 (57.6) | 288 (53.1) | 1613 (56.2) | |
| Salty biscuit intake | 0.279 | ||||||
| <1×/week | 171 (29.8) | 167 (27.9) | 167 (30.1) | 188 (31.3) | 166 (30.6) | 859 (29.9) | |
| 1×/week | 189 (32.9) | 211 (35.3) | 159 (28.7) | 200 (33.3) | 189 (34.9) | 948 (33.0) | |
| >1×/week | 214 (37.3) | 220 (36.8) | 228 (41.2) | 213 (35.4) | 187 (34.5) | 1062 (37.0) | |
| Sweet biscuit intake | 0.068 | ||||||
| <1×/week | 112 (19.5) | 112 (18.7) | 119 (21.5) | 142 (23.6) | 118 (21.8) | 603 (21.0) | |
| 1×/week | 164 (28.6) | 155 (25.9) | 164 (29.6) | 158 (26.3) | 122 (22.5) | 763 (26.6) | |
| >1×/week | 298 (51.9) | 331 (55.4) | 271 (48.9) | 301 (50.1) | 302 (55.7) | 1503 (52.4) | |
| Bread intake | 0.696 | ||||||
| <1×/week | 137 (23.9) | 169 (28.3) | 146 (26.4) | 156 (26.0) | 130 (24.0) | 738 (25.7) | |
| 1×/week | 148 (25.8) | 151 (25.3) | 145 (26.2) | 168 (28.0) | 148 (27.3) | 760 (26.5) | |
| >1×/week | 289 (50.3) | 278 (46.5) | 263 (47.5) | 277 (46.1) | 264 (48.7) | 1371 (47.8) | |
| Fruit drink intake | 0.139 | ||||||
| <1×/week | 245 (42.7) | 231 (38.6) | 248 (44.8) | 251 (41.8) | 228 (42.1) | 1203 (41.9) | |
| 1×/week | 141 (24.6) | 139 (23.2) | 139 (25.1) | 137 (22.8) | 145 (26.8) | 701 (24.4) | |
| >1×/week | 188 (32.8) | 228 (38.1) | 167 (30.1) | 213 (35.4) | 169 (31.2) | 965 (33.6) | |
| Noodles intake | 0.515 | ||||||
| <1×/week | 201 (35.0) | 202 (33.8) | 206 (37.2) | 238 (39.6) | 190 (35.1) | 1037 (36.1) | |
| 1×/week | 139 (24.2) | 144 (24.1) | 139 (25.1) | 145 (24.1) | 139 (25.6) | 706 (24.6) | |
| >1×/week | 234 (40.8) | 252 (42.1) | 209 (37.7) | 218 (36.3) | 213 (39.3) | 1126 (39.2) | |
| Financial situation | 0.212 | ||||||
| Excellent | 216 (37.6) | 247 (41.3) | 208 (37.5) | 240 (39.9) | 200 (36.9) | 1111 (38.7) | |
| Good | 251 (43.7) | 251 (42.0) | 259 (46.8) | 257 (42.8) | 261 (48.2) | 1279 (44.6) | |
| Moderate | 86 (15.0) | 80 (13.4) | 57 (10.3) | 78 (13.0) | 60 (11.1) | 361 (12.6) | |
| Poor | 21 (3.7) | 20 (3.3) | 30 (5.4) | 26 (4.3) | 21 (3.9) | 118 (4.1) | |
| Mixed language | 0.274 | ||||||
| Yes | 231 (40.2) | 242 (40.5) | 204 (36.8) | 251 (41.8) | 234 (43.2) | 1162 (40.5) |
| Control | Warning | GDA | HSR | MTL | |||||
|---|---|---|---|---|---|---|---|---|---|
| Mean (95% CI) | Mean (95% CI) | p | Mean (95% CI) | p | Mean (95% CI) | p | Mean (95% CI) | p | |
| Product perceptions | |||||||||
| The product is… | |||||||||
| Unhealthy | 1.7 (1.5, 1.8) | 2.1 (1.9, 2.3) | <0.001 | 1.9 (1.7, 2.2) | 0.002 | 1.8 (1.7, 2.0) | 0.003 | 2.0 (1.8, 2.2) | <0.001 |
| Visually attractive | 2.7 (2.5, 2.9) | 2.8 (2.7, 3.0) | 0.171 | 2.9 (2.7, 3.1) | 0.026 | 2.8 (2.6, 2.9) | 0.233 | 2.9 (2.7, 3.0) | 0.050 |
| Label reactions | |||||||||
| The label… | |||||||||
| Grabs my attention | 2.7 (2.6, 2.9) | 2.9 (2.8, 3.1) | 0.031 | 3.0 (2.8, 3.1) | 0.004 | 2.8 (2.7, 3.0) | 0.040 | 3.0 (2.8, 3.1) | 0.004 |
| Makes me concerned about health consequences | 1.9 (1.7, 2.1) | 2.4 (2.2, 2.6) | <0.001 | 2.3 (2.0, 2.5) | <0.001 | 2.2 (2.0, 2.3) | <0.001 | 2.3 (2.1, 2.5) | <0.001 |
| Is easy to understand | 2.4 (2.2, 2.6) | 2.8 (2.7, 3.0) | <0.001 | 2.8 (2.7, 3.0) | <0.001 | 2.7 (2.6, 2.9) | <0.001 | 2.8 (2.6, 2.9) | <0.001 |
| Taught me something new | 2.3 (2.1, 2.5) | 2.8 (2.6, 3.0) | <0.001 | 2.8 (2.6, 3.0) | <0.001 | 2.7 (2.5, 2.8) | <0.001 | 2.7 (2.5, 2.9) | <0.001 |
| Is true | 2.6 (2.4, 2.7) | 2.9 (2.7, 3.0) | <0.001 | 2.9 (2.7, 3.1) | <0.001 | 2.7 (2.5, 2.8) | 0.066 | 2.8 (2.6, 3.0) | 0.006 |
| Liking the label | 2.7 (2.5, 2.9) | 2.9 (2.7, 3.0) | 0.072 | 2.9 (2.8, 3.1) | 0.035 | 2.8 (2.7, 3.0) | 0.054 | 2.9 (2.8, 3.1) | 0.006 |
| PME | 1.7 (1.5, 1.8) | 2.1 (1.9, 2.3) | <0.001 | 1.9 (1.7, 2.0) | <0.001 | 1.9 (1.8, 2.1) | <0.001 | 2.0 (1.8, 2.2) | <0.001 |
| Control | Warning | GDA | HSR | MTL | |||||
|---|---|---|---|---|---|---|---|---|---|
| % (95% CI) | % (95% CI) | Pa | % (95% CI) | Pa | % (95% CI) | Pa | Mean (95% CI) | Pa | |
| Education | |||||||||
| <12 years | 35.2 (27.3, 43.1) | 51.5 (42.3, 60.6) | <0.001 | 49.5 (40.3, 58.7) | <0.001 | 45.2 (36.3, 54.2) | 0.002 | 46.7 (37.9, 55.6) | <0.001 |
| ≥12 years | 42.3 (34.8, 49.8) | 66.6 (59.5, 73.7) | <0.001 | 59.6 (51.9, 67.3) | <0.001 | 44.8 (36.3, 53.4) | 0.437 | 61.8 (54.7, 68.9) | <0.001 |
| Pb | 0.073 | 0.469 | 0.120 | 0.074 | |||||
| Language of interview | |||||||||
| State language | 41.5 (34.1, 48.8) | 63.3 (55.6, 71.1) | <0.001 | 54.9 (45.4, 64.4) | 0.001 | 44.6 (35.6, 53.6) | 0.279 | 57.6 (50.8, 64.4) | <0.001 |
| Mixed (state language and English) | 35.5 (23.8, 47.3) | 57.0 (44.2, 69.7) | 0.001 | 55.2 (42.9, 67.5) | <0.001 | 45.7 (33.4, 57.9) | 0.002 | 51.0 (38.0, 64.1) | 0.001 |
| Pb | 0.955 | 0.354 | 0.103 | 0.910 | |||||
| Urbanicity | |||||||||
| Urban | 40.0 (32.2, 47.7) | 59.9 (52.7, 67.1) | <0.001 | 54.0 (44.4, 63.5) | 0.001 | 47.3 (39.2, 55.3) | 0.013 | 54.6 (47.0, 62.2) | <0.001 |
| Semi-urban | 44.1 (36.0, 52.2) | 68.0 (59.9, 76.0) | <0.001 | 58.7 (48.8, 68.7) | 0.004 | 44.8 (34.1, 55.4) | 0.858 | 55.7 (46.2, 65.1) | 0.015 |
| Peri-rural | 32.2 (24.1, 40.3) | 53.8 (44.0, 63.5) | <0.001 | 53.6 (45.7, 61.5) | <0.001 | 40.4 (30.4, 50.5) | 0.054 | 54.6 (46.7, 62.4) | <0.001 |
| Pb | 0.678 | 0.273 | 0.244 | 0.135 | |||||
| Gender | |||||||||
| Men | 40.6 (32.3, 48.9) | 61.2 (54.4, 68.0) | <0.001 | 54.2 (45.5, 62.9) | <0.001 | 46.6 (37.9, 55.2) | 0.094 | 54.3 (46.0, 62.7) | <0.001 |
| Women | 37.6 (30.1, 45.2) | 60.4 (51.4, 69.3) | <0.001 | 55.9 (46.4, 65.4) | <0.001 | 43.5 (34.8, 52.2) | 0.054 | 55.3 (47.5, 63.0) | <0.001 |
| Pb | 0.607 | 0.316 | 0.981 | 0.301 | |||||
| State | |||||||||
| Odisha | 47.1 (32.2, 62.1) | 46.4 (30.9, 62.0) | 0.923 | 50.4 (36.7, 64.0) | 0.521 | 39.1 (24.0, 54.2) | 0.024 | 42.7 (25.5, 59.8) | 0.322 |
| Uttar Pradesh | 54.1 (32.7, 75.5) | 86.0 (76.7, 95.2) | 0.002 | 86.0 (77.7, 94.3) | 0.001 | 68.5 (47.1, 90.0) | 0.011 | 78.9 (68.0, 89.8) | 0.012 |
| Assam | 25.8 (11.3, 40.3) | 47.2 (34.7, 59.8) | 0.002 | 33.2 (19.5, 47.0) | 0.138 | 21.9 (6.0, 37.9) | 0.121 | 45.8 (31.2, 60.3) | 0.002 |
| Delhi | 23.2 (9.1, 37.3) | 59.5 (42.5, 76.5) | <0.001 | 42.6 (27.6, 57.5) | 0.037 | 30.4 (23.1, 37.8) | 0.229 | 42.0 (27.2, 56.8) | 0.014 |
| Karnataka | 57.4 (43.8, 71.0) | 72.2 (58.4, 86.0) | <0.001 | 60.7 (47.0, 74.4) | 0.178 | 63.4 (51.8, 75.0) | 0.026 | 64.8 (55.4, 74.3) | 0.046 |
| Gujarat | 33.4 (18.2, 48.6) | 53.8 (34.6, 73.1) | 0.023 | 52.4 (34.5, 70.3) | 0.063 | 44.5 (24.2, 64.8) | 0.109 | 53.0 (36.8, 69.2) | 0.006 |
| Pb | 0.025 | 0.027 | <0.001 | 0.002 | |||||
| Sweet biscuit intake | |||||||||
| <1×/week | 25.0 (13.1, 36.9) | 51.8 (36.4, 67.2) | <0.001 | 36.1 (22.7, 49.5) | 0.071 | 27.5 (16.4, 38.6) | 0.645 | 36.4 (27.0, 45.9) | 0.050 |
| 1×/week | 22.0 (14.0, 29.9) | 39.4 (27.1, 51.6) | 0.002 | 35.4 (22.1, 48.6) | 0.013 | 27.8 (16.2, 39.5) | 0.231 | 29.5 (20.1, 38.9) | 0.095 |
| >1×/week | 26.2 (15.9, 36.5) | 49.2 (38.7, 59.8) | <0.001 | 42.4 (29.7, 55.1) | 0.001 | 30.9 (19.6, 42.2) | 0.218 | 36.8 (26.4, 47.2) | 0.006 |
| Pb | 0.347 | 0.732 | 0.894 | 0.788 | |||||
| Bread intake | |||||||||
| <1×/week | 42.3 (31.0, 53.7) | 66.3 (54.8, 77.7) | <0.001 | 50.0 (39.4, 60.6) | 0.205 | 50.0 (37.8, 62.2) | 0.320 | 61.5 (52.7, 70.4) | 0.002 |
| 1×/week | 50.0 (37.0, 63.0) | 62.9 (48.6, 77.2) | 0.091 | 54.5 (41.9, 67.1) | 0.555 | 50.0 (38.0, 62.0) | 1.000 | 60.8 (48.1, 73.5) | 0.110 |
| >1×/week | 45.0 (35.2, 54.8) | 73.0 (64.8, 81.2) | <0.001 | 61.6 (50.0, 73.2) | 0.001 | 48.0 (36.7, 59.3) | 0.455 | 62.5 (51.4, 73.6) | 0.004 |
| Pb | 0.148 | 0.292 | 0.718 | 0.582 | |||||
| Fruit drink intake | |||||||||
| <1×/week | 58.4 (47.2, 69.6) | 75.8 (66.0, 85.5) | <0.001 | 73.8 (63.0, 84.5) | 0.005 | 69.7 (57.6, 81.8) | 0.041 | 75.0 (62.7, 87.3) | <0.001 |
| 1×/week | 59.6 (46.6, 72.6) | 79.1 (68.7, 89.6) | 0.004 | 77.0 (66.4, 87.6) | 0.012 | 61.3 (44.5, 78.1) | 0.798 | 75.2 (64.4, 86.0) | 0.017 |
| >1×/week | 63.8 (52.2, 75.5) | 76.3 (66.1, 86.5) | 0.020 | 70.7 (58.6, 82.7) | 0.264 | 59.2 (47.0, 71.3) | 0.365 | 70.4 (60.2, 80.6) | 0.266 |
| Pb | 0.522 | 0.363 | 0.138 | 0.336 | |||||
| Noodle intake | |||||||||
| <1×/week | 31.3 (20.9, 41.8) | 62.9 (52.5, 73.2) | <0.001 | 48.5 (36.9, 60.2) | 0.004 | 44.1 (30.6, 57.6) | 0.028 | 54.7 (46.5, 63.0) | <0.001 |
| 1×/week | 29.5 (18.2, 40.8) | 54.2 (41.6, 66.8) | <0.001 | 47.5 (36.7, 58.3) | 0.004 | 44.1 (34.0, 54.3) | 0.007 | 41.7 (30.1, 53.4) | 0.070 |
| >1×/week | 27.4 (18.4, 36.3) | 46.8 (35.0, 58.6) | <0.001 | 45.9 (33.6, 58.3) | 0.002 | 34.4 (22.9, 45.9) | 0.097 | 53.5 (41.4, 65.6) | <0.001 |
| Pb | 0.207 | 0.983 | 0.559 | 0.218 | |||||
| Savory biscuit intake | |||||||||
| <1×/week | 32.7 (20.8, 44.7) | 52.7 (38.9, 66.5) | 0.001 | 52.1 (40.7, 63.4) | <0.001 | 46.3 (33.9, 58.6) | 0.013 | 53.6 (43.4, 63.9) | 0.001 |
| 1×/week | 40.2 (29.2, 51.2) | 59.2 (48.8, 69.7) | 0.002 | 57.2 (45.2, 69.3) | 0.010 | 40.5 (29.6, 51.4) | 0.951 | 51.9 (41.5, 62.2) | 0.037 |
| >1×/week | 34.6 (22.9, 46.3) | 60.0 (47.4, 72.6) | <0.001 | 61.0 (47.3, 74.7) | <0.001 | 44.6 (30.3, 58.9) | 0.017 | 57.8 (42.2, 73.3) | 0.001 |
| Pb | 0.673 | 0.344 | 0.096 | 0.267 | |||||
| Control | Warning | GDA | HSR | MTL | |||||
|---|---|---|---|---|---|---|---|---|---|
| Mean (95% CI) | Mean (95% CI) | Pa | Mean (95% CI) | Pa | Mean (95% CI) | Pa | Mean (95% CI) | Pa | |
| Education | |||||||||
| <12 years | 2.6 (2.4, 2.8) | 2.5 (2.3, 2.7) | 0.408 | 2.6 (2.5, 2.8) | 0.507 | 2.6 (2.5, 2.8) | 0.743 | 2.5 (2.4, 2.7) | 0.405 |
| ≥12 years | 2.6 (2.5, 2.8) | 2.4 (2.3, 2.6) | 0.014 | 2.6 (2.5, 2.8) | 0.875 | 2.6 (2.4, 2.7) | 0.433 | 2.5 (2.4, 2.7) | 0.256 |
| Pb | 0.298 | 0.647 | 0.503 | 0.941 | |||||
| Language of interview | |||||||||
| State language | 2.7 (2.5, 2.9) | 2.6 (2.4, 2.8) | 0.086 | 2.7 (2.5, 2.9) | 0.801 | 2.7 (2.5, 2.8) | 0.446 | 2.6 (2.4, 2.8) | 0.159 |
| Mixed (state language and English) | 2.4 (2.2, 2.7) | 2.3 (2.1, 2.5) | 0.115 | 2.5 (2.3, 2.7) | 0.284 | 2.5 (2.3, 2.6) | 0.606 | 2.4 (2.2, 2.6) | 0.906 |
| Pb | 0.720 | 0.329 | 0.377 | 0.312 | |||||
| Urbanicity | |||||||||
| Urban | 2.6 (2.4, 2.8) | 2.4 (2.3, 2.6) | 0.005 | 2.6 (2.5, 2.8) | 0.793 | 2.5 (2.3, 2.6) | 0.033 | 2.5 (2.4, 2.7) | 0.256 |
| Semi-urban | 2.6 (2.4, 2.7) | 2.6 (2.4, 2.8) | 0.643 | 2.7 (2.6, 2.9) | 0.053 | 2.7 (2.5, 2.8) | 0.139 | 2.5 (2.3, 2.6) | 0.299 |
| Peri-rural | 2.6 (2.4, 2.9) | 2.4 (2.2, 2.6) | 0.033 | 2.6 (2.4, 2.8) | 0.508 | 2.7 (2.6, 2.9) | 0.312 | 2.6 (2.4, 2.9) | 0.944 |
| Pb | 0.055 | 0.208 | 0.004 | 0.780 | |||||
| Gender | |||||||||
| Men | 2.6 (2.4, 2.8) | 2.5 (2.3, 2.7) | 0.113 | 2.7 (2.5, 2.9) | 0.705 | 2.6 (2.4, 2.8) | 0.741 | 2.6 (2.4, 2.8) | 0.501 |
| Women | 2.6 (2.4, 2.8) | 2.4 (2.3, 2.6) | 0.070 | 2.6 (2.5, 2.8) | 0.728 | 2.6 (2.4, 2.7) | 0.992 | 2.5 (2.3, 2.7) | 0.235 |
| Pb | 0.765 | 0.916 | 0.806 | 0.788 | |||||
| State | |||||||||
| Odisha | 2.4 (2.1, 2.7) | 2.2 (2.0, 2.5) | 0.123 | 2.2 (1.9, 2.4) | 0.061 | 2.2 (2.0, 2.5) | 0.033 | 2.1 (1.8, 2.4) | 0.002 |
| Uttar Pradesh | 2.7 (2.2, 3.1) | 2.6 (2.3, 3.0) | 0.945 | 2.8 (2.4, 3.1) | 0.610 | 2.7 (2.4, 3.0) | 0.976 | 2.8 (2.4, 3.1) | 0.552 |
| Assam | 3.1 (2.9, 3.3) | 2.8 (2.7, 3.0) | 0.043 | 3.1 (2.9, 3.3) | 0.951 | 3.1 (2.8, 3.3) | 0.714 | 3.0 (2.9, 3.1) | 0.217 |
| Delhi | 2.3 (2.1, 2.6) | 2.0 (1.6, 2.3) | 0.004 | 2.5 (2.2, 2.8) | 0.250 | 2.4 (2.1, 2.6) | 0.663 | 2.3 (2.1, 2.5) | 0.910 |
| Karnataka | 2.7 (2.5, 2.9) | 2.8 (2.5, 3.1) | 0.362 | 2.8 (2.6, 3.0) | 0.322 | 2.7 (2.5, 2.9) | 0.707 | 2.7 (2.4, 3.1) | 0.847 |
| Gujarat | 2.4 (2.0, 2.9) | 2.2 (1.8, 2.6) | 0.015 | 2.4 (2.1, 2.7) | 0.900 | 2.5 (2.1, 2.8) | 0.808 | 2.4 (2.1, 2.7) | 0.608 |
| Pb | 0.056 | 0.304 | 0.492 | 0.177 | |||||
| Sweet biscuit intake | |||||||||
| <1×/week | 2.6 (2.3, 2.8) | 2.5 (2.2, 2.7) | 0.555 | 2.5 (2.3, 2.8) | 0.845 | 2.5 (2.3, 2.7) | 0.654 | 2.3 (2.1, 2.5) | 0.048 |
| 1×/week | 2.6 (2.4, 2.8) | 2.5 (2.3, 2.7) | 0.341 | 2.7 (2.5, 2.9) | 0.470 | 2.7 (2.5, 2.8) | 0.337 | 2.7 (2.5, 2.9) | 0.407 |
| >1×/week | 2.7 (2.5, 2.9) | 2.5 (2.3, 2.7) | 0.056 | 2.7 (2.5, 3.0) | 0.675 | 2.7 (2.5, 2.9) | 0.884 | 2.6 (2.4, 2.9) | 0.500 |
| Pb | 0.820 | 0.718 | 0.627 | 0.070 | |||||
| Bread intake | |||||||||
| <1×/week | 2.5 (2.3, 2.8) | 2.4 (2.1, 2.7) | 0.470 | 2.5 (2.3, 2.7) | 0.768 | 2.5 (2.2, 2.7) | 0.515 | 2.2 (2.0, 2.4) | 0.029 |
| 1×/week | 2.6 (2.3, 2.9) | 2.4 (2.1, 2.7) | 0.079 | 2.5 (2.3, 2.6) | 0.207 | 2.6 (2.4, 2.7) | 0.716 | 2.6 (2.3, 2.8) | 0.779 |
| >1×/week | 2.7 (2.5, 2.9) | 2.6 (2.4, 2.8) | 0.527 | 2.8 (2.6, 3.0) | 0.212 | 2.8 (2.7, 3.0) | 0.112 | 2.7 (2.4, 2.9) | 0.663 |
| Pb | 0.724 | 0.142 | 0.325 | 0.140 | |||||
| Fruit drink intake | |||||||||
| <1×/week | 2.5 (2.3, 2.8) | 2.4 (2.1, 2.7) | 0.271 | 2.6 (2.4, 2.8) | 0.437 | 2.5 (2.3, 2.7) | 0.996 | 2.3 (2.1, 2.6) | 0.100 |
| 1×/week | 2.5 (2.3, 2.8) | 2.4 (2.2, 2.6) | 0.485 | 2.5 (2.3, 2.7) | 0.876 | 2.6 (2.4, 2.8) | 0.470 | 2.6 (2.4, 2.8) | 0.491 |
| >1×/week | 2.7 (2.5, 2.8) | 2.5 (2.3, 2.7) | 0.094 | 2.7 (2.5, 3.0) | 0.453 | 2.7 (2.5, 2.8) | 0.974 | 2.6 (2.4, 2.9) | 0.940 |
| Pb | 0.765 | 0.886 | 0.790 | 0.220 | |||||
| Noodle intake | |||||||||
| <1×/week | 2.5 (2.3, 2.7) | 2.4 (2.1, 2.7) | 0.556 | 2.4 (2.2, 2.7) | 0.826 | 2.4 (2.2, 2.6) | 0.337 | 2.3 (2.1, 2.5) | 0.033 |
| 1×/week | 2.6 (2.3, 2.8) | 2.4 (2.2, 2.6) | 0.096 | 2.7 (2.5, 2.9) | 0.159 | 2.5 (2.3, 2.7) | 0.559 | 2.6 (2.4, 2.8) | 0.950 |
| >1×/week | 2.6 (2.3, 2.9) | 2.5 (2.3, 2.6) | 0.203 | 2.6 (2.5, 2.8) | 0.746 | 2.6 (2.3, 2.8) | 0.882 | 2.6 (2.4, 2.8) | 0.818 |
| Pb | 0.782 | 0.500 | 0.840 | 0.208 | |||||
| Savory biscuit intake | |||||||||
| <1×/week | 2.5 (2.3, 2.7) | 2.5 (2.3, 2.7) | 0.886 | 2.5 (2.3, 2.8) | 0.606 | 2.4 (2.2, 2.7) | 0.639 | 2.5 (2.3, 2.7) | 0.710 |
| 1×/week | 2.7 (2.4, 2.9) | 2.5 (2.4, 2.7) | 0.263 | 2.6 (2.4, 2.8) | 0.592 | 2.6 (2.4, 2.8) | 0.449 | 2.7 (2.5, 2.9) | 0.959 |
| >1×/week | 2.8 (2.5, 3.0) | 2.5 (2.3, 2.8) | 0.012 | 2.7 (2.5, 3.0) | 0.957 | 2.8 (2.6, 3.0) | 0.834 | 2.6 (2.3, 3.0) | 0.325 |
| Pb | 0.329 | 0.739 | 0.783 | 0.636 | |||||
Publisher’s Note: MDPI stays neutral with regard to jurisdictional claims in published maps and institutional affiliations. |
© 2022 by the authors. Licensee MDPI, Basel, Switzerland. This article is an open access article distributed under the terms and conditions of the Creative Commons Attribution (CC BY) license (https://creativecommons.org/licenses/by/4.0/).
Share and Cite
Singh, S.K.; Taillie, L.S.; Gupta, A.; Bercholz, M.; Popkin, B.; Murukutla, N. Front-of-Package Labels on Unhealthy Packaged Foods in India: Evidence from a Randomized Field Experiment. Nutrients 2022, 14, 3128. https://doi.org/10.3390/nu14153128
Singh SK, Taillie LS, Gupta A, Bercholz M, Popkin B, Murukutla N. Front-of-Package Labels on Unhealthy Packaged Foods in India: Evidence from a Randomized Field Experiment. Nutrients. 2022; 14(15):3128. https://doi.org/10.3390/nu14153128
Chicago/Turabian StyleSingh, S. K., Lindsey Smith Taillie, Ashish Gupta, Maxime Bercholz, Barry Popkin, and Nandita Murukutla. 2022. "Front-of-Package Labels on Unhealthy Packaged Foods in India: Evidence from a Randomized Field Experiment" Nutrients 14, no. 15: 3128. https://doi.org/10.3390/nu14153128