
Beyond Nutrient Deficiency—Opportunities to Improve Nutritional Status and Promote Health Modernizing DRIs and Supplementation Recommendations

 ,
,  ,
,  , , ,
, , , 
Abstract
:1. Introduction
2. Dietary Guidelines History
3. Understanding Population Derivation and Use of RDAs
4. Nutrient Gaps in the US and the Role of Dietary Supplements
5. Defining Optimal Nutrition and Lessons from Nutrients Considered Essential
6. Establishing Lutein and EPA + DHA DRIs and Updating Vitamin K and Mg DRIs
7. Lutein
8. Eicosapentaenoic Acid (EPA) and Docosahexaenoic Acid (EPA)
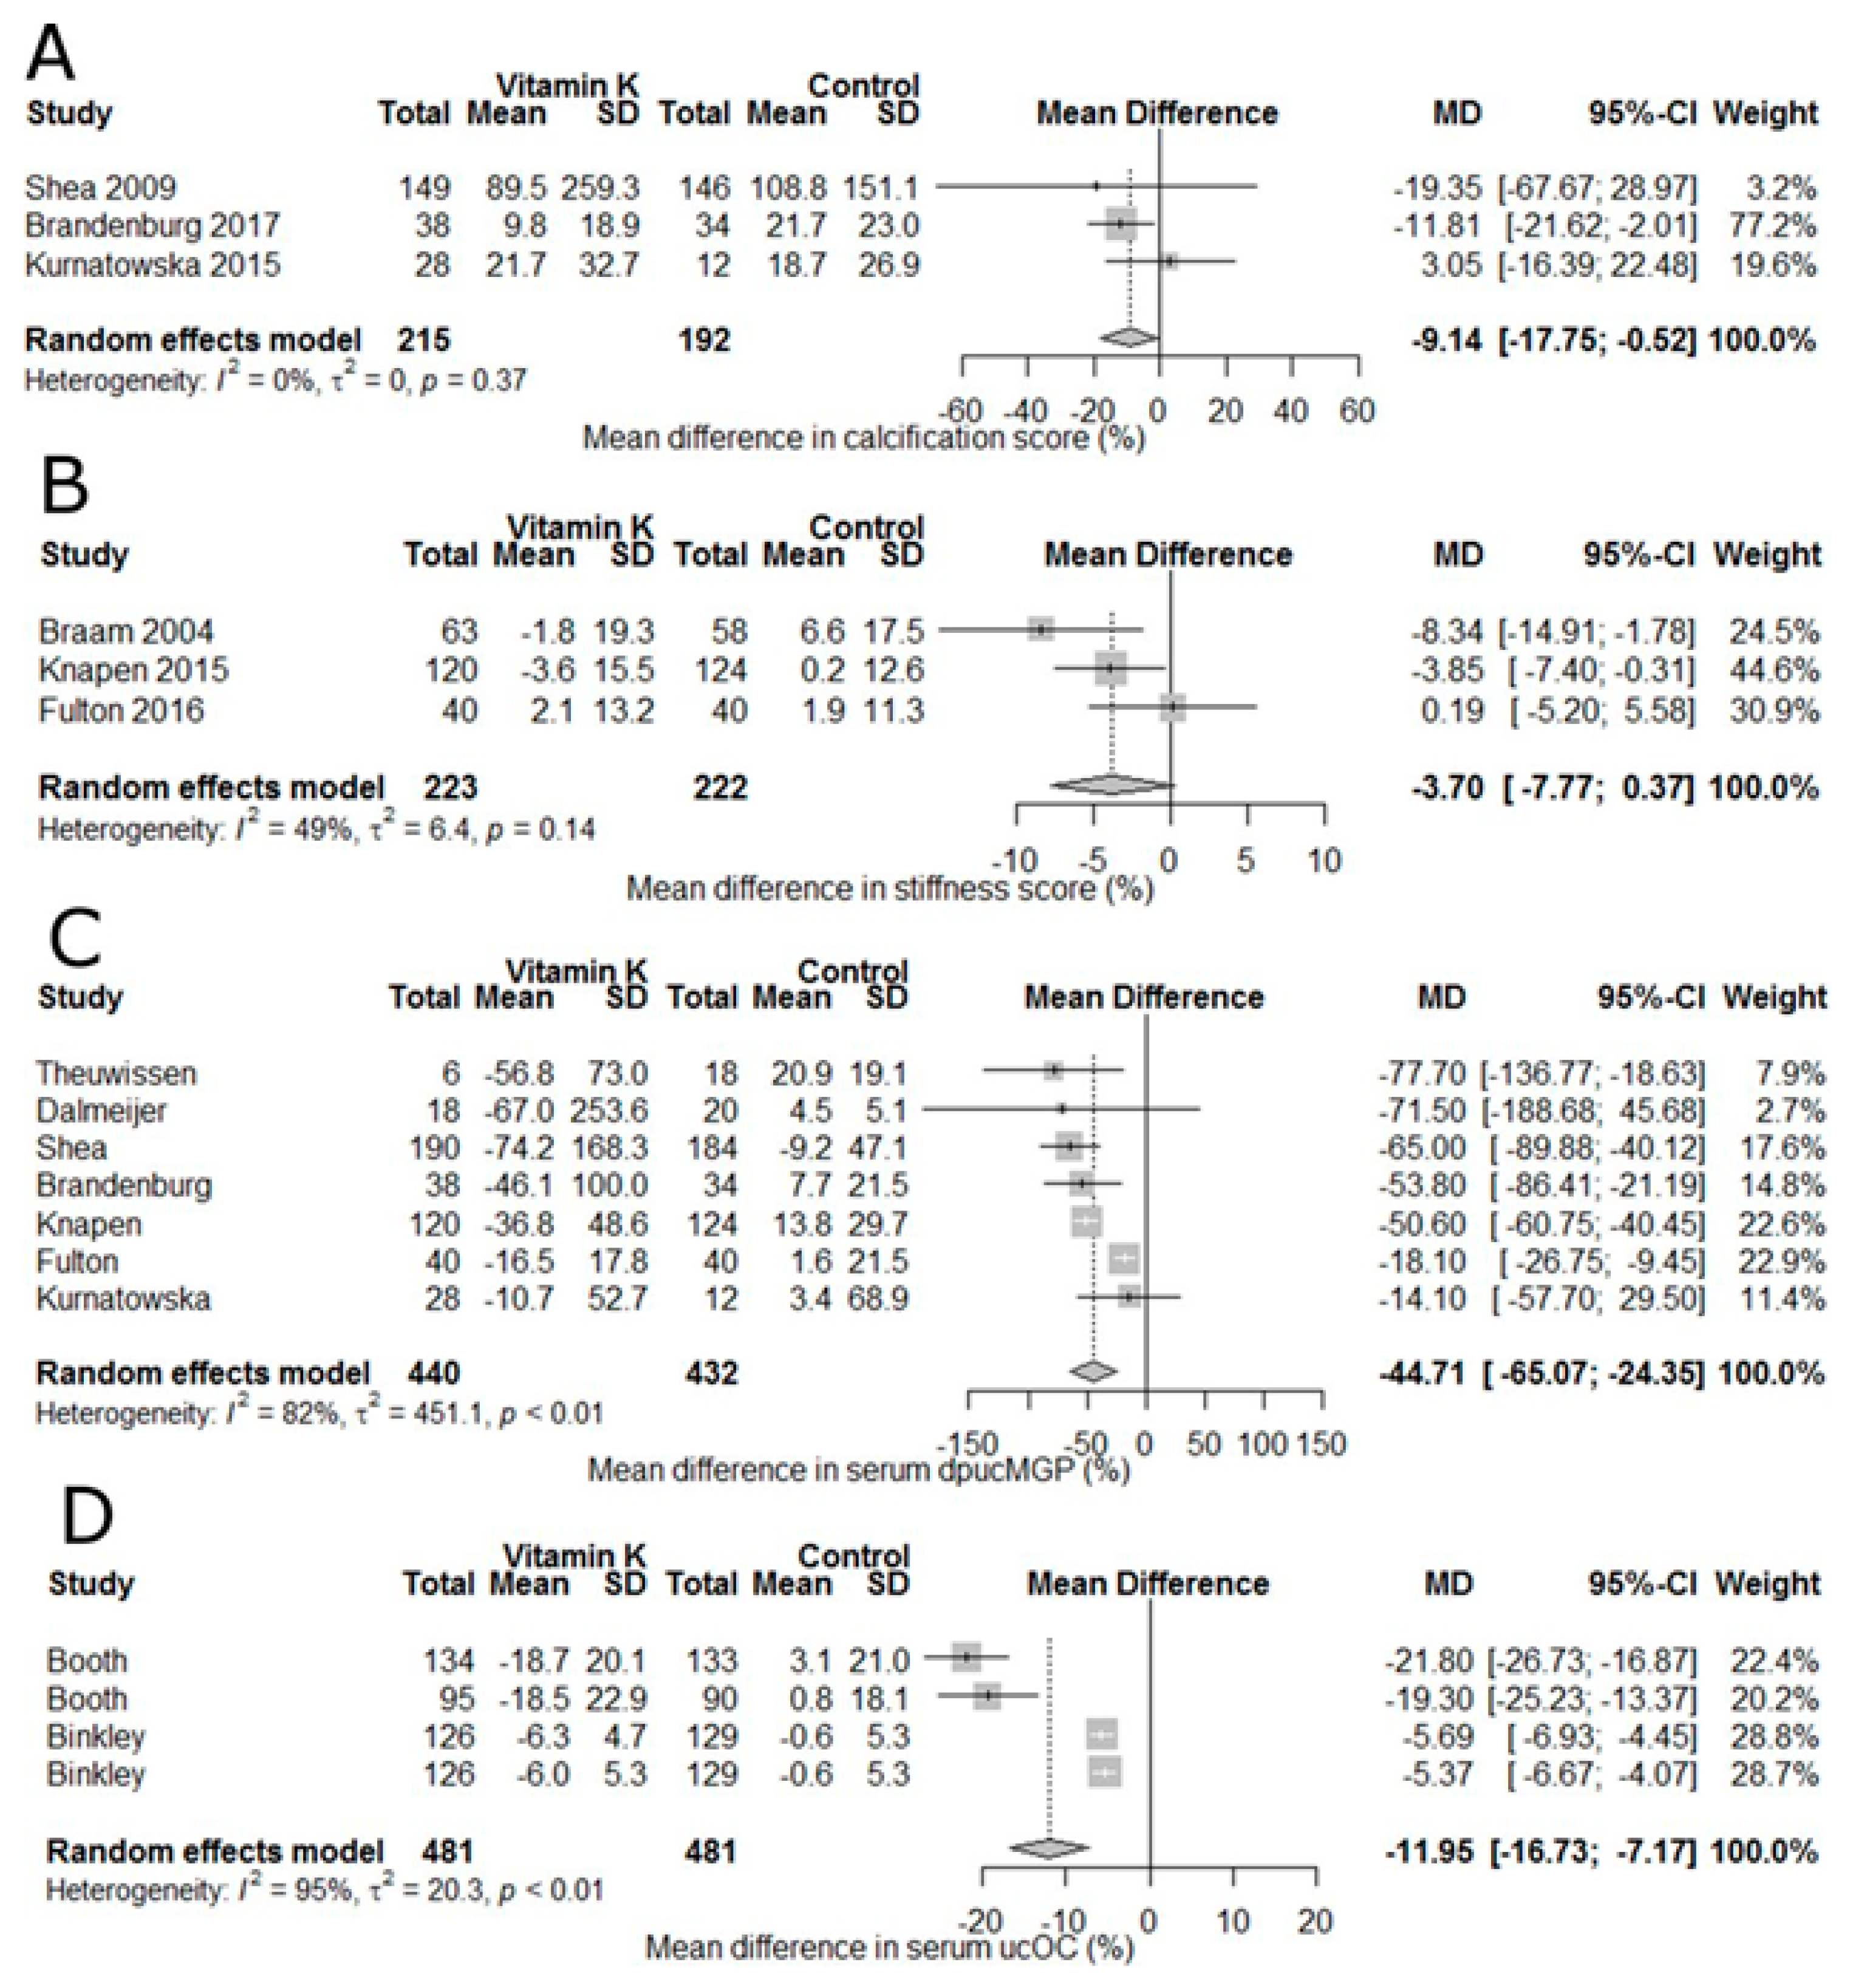
9. Vitamin K
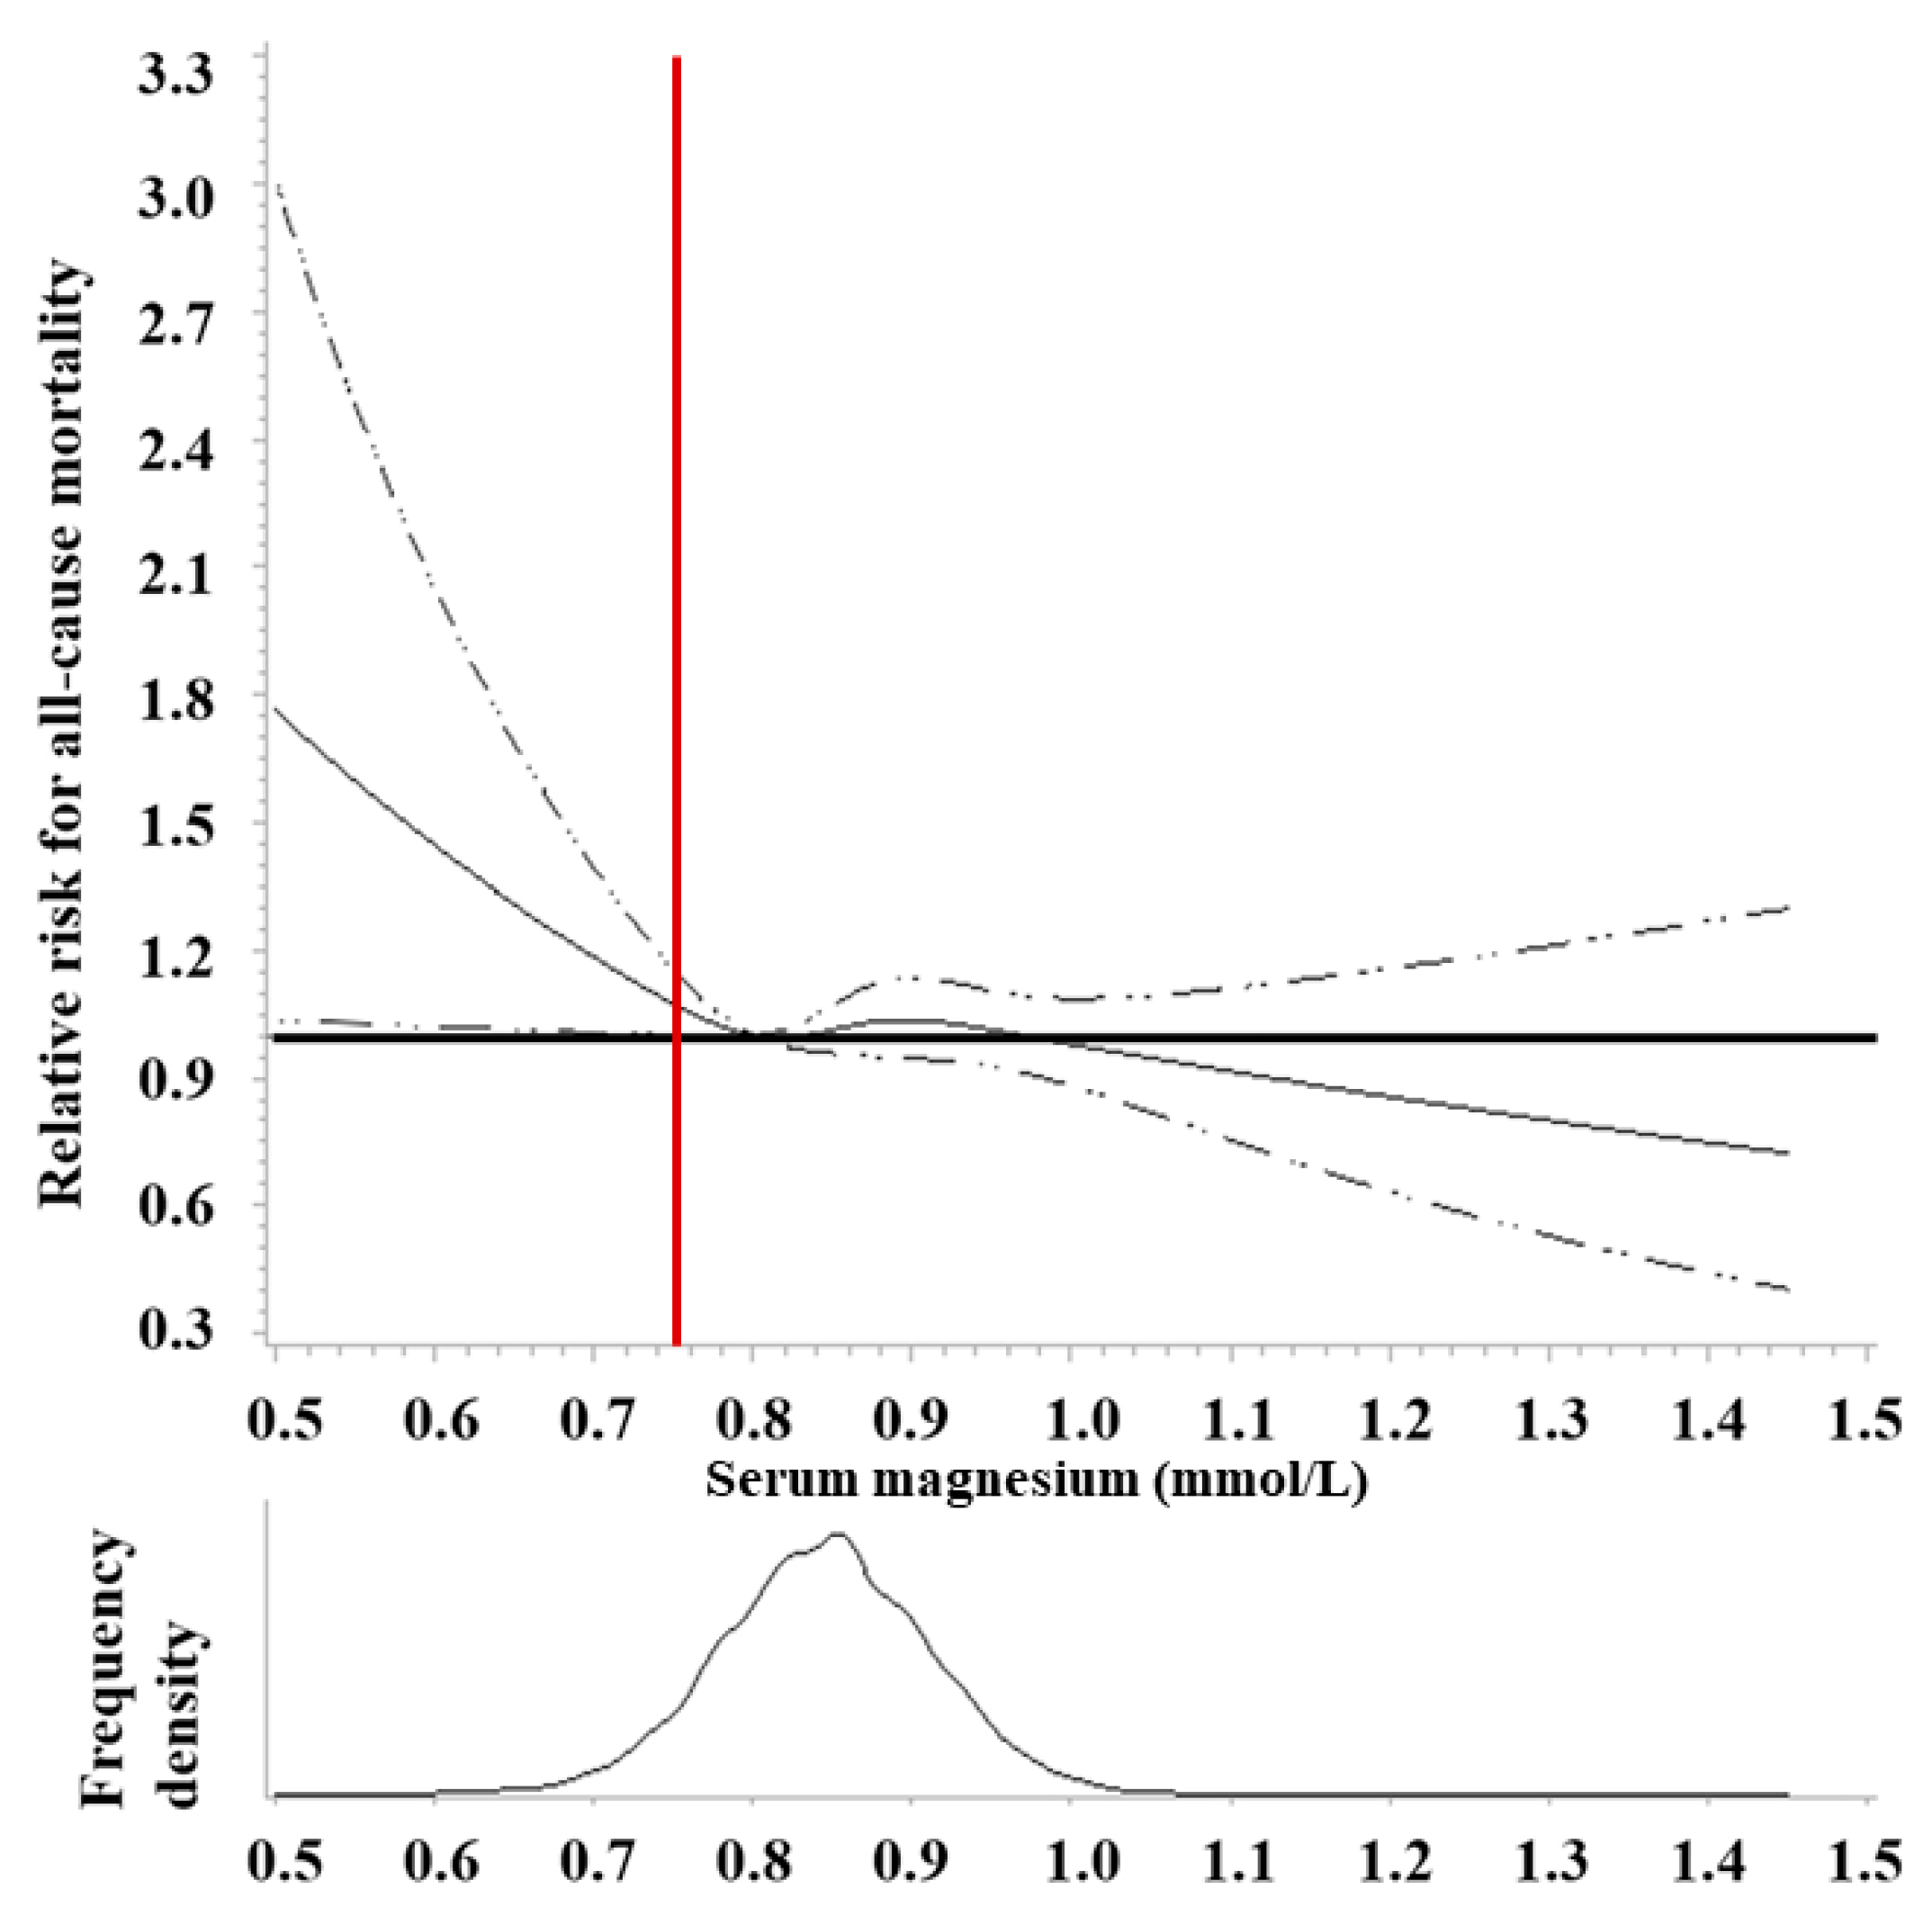
10. Magnesium (Mg)
11. Personalizing Nutrition Guidance and Improving Population-Based Assessment
12. Conclusions
Author Contributions
Funding
Institutional Review Board Statement
Informed Consent Statement
Acknowledgments
Conflicts of Interest
References
- U.S. Department of Agriculture; U.S. Department of Health and Human Services. 1980 Dietary Guidelines for Americans; Agricultural Research Service: Washington, DC, USA, 1980; p. 18.
- U.S. Department of Agriculture; U.S. Department of Health and Human Services. Dietary Guidelines for Americans, 2020–2025; Agricultural Research Service: Washington, DC, USA, 2020; p. 164.
- U.S. Department of Agriculture; U.S. Department of Health and Human Services. 1985 Dietary Guidelines for Americans; Agricultural Research Service: Washington, DC, USA, 1985; p. 13.
- CDC. Recommendations for the Use of Folic Acid to Reduce the Number of Cases of Spina Bifida and Other Neural Tube Defects. MMWR 1992, 41, 1–7. [Google Scholar]
- FDA. Food Labeling: Revision of the Nutrition and Supplement Facts Label. Fed. Regist. 2016, 81, 33741–33999. [Google Scholar]
- FDA. Food Labeling: Revision of the Nutrition and Supplement Facts Labels and Serving Sizes of Foods That Can Reasonably Be Consumed at One Eating Occasion; Dual-Column Labeling; Updating, Modifying, and Establishing Certain Reference Amounts Customarily Consumed; Serving Size for Breath Mints; and Technical Amendments; Extension of Compliance Dates. Available online: https://www.federalregister.gov/documents/2018/05/04/2018-09476/food-labeling-revision-of-the-nutrition-and-supplement-facts-labels-and-serving-sizes-of-foods-that (accessed on 10 May 2019).
- FDA. Food Labeling: Requirements for Nutrient Content Claims for Dietary Supplements of Vitamins, Minerals, Herbs, and Other Similar Nutritional Substances. Fed. Regist. 1994, 59, 354–395. [Google Scholar]
- FDA. Food Labeling: Health Claims and Label Statements; Folate and Neural Tube Defects. Fed. Regist. 1993, 58, 53254–53295. [Google Scholar]
- FDA. Food Standards: Amendment of Standards of Identity for Enriched Grain Products to Require Addition of Folic Acid. Fed. Regist. 1996, 61, 8781–8796. [Google Scholar]
- FDA. Food Additives Permitted for Direct Addition to Food for Human Consumption: Folic Acid. Fed. Regist. 2016, 81, 22176–22183. [Google Scholar]
- Hatch, O.G. S.784 Dietary Supplement Health and Education Act of 1994. Available online: https://www.congress.gov/103/bills/s784/BILLS-103s784enr.pdf (accessed on 17 December 2020).
- U.S. Department of Agriculture; U.S. Department of Health and Human Services. 1995 Dietary Guidelines for Americans. Available online: https://www.dietaryguidelines.gov/sites/default/files/2019-05/1995%20Dietary%20Guidelines%20for%20Americans.pdf (accessed on 18 October 2020).
- U.S. Department of Agriculture; U.S. Department of Health and Human Services. 2000 Dietary Guidelines for Americans. Available online: https://health.gov/sites/default/files/2020-01/DGA2000.pdf (accessed on 18 October 2020).
- Jahns, L.; Davis-Shaw, W.; Lichtenstein, A.H.; Murphy, S.P.; Conrad, Z.; Nielsen, F. The History and Future of Dietary Guidance in America. Adv. Nutr. 2018, 9, 136–147. [Google Scholar] [CrossRef] [PubMed] [Green Version]
- Obbagy, J.E.; Blum-Kemelor, D.M.; Essery, E.V.; Lyon, J.M.; Spahn, J.M. USDA Nutrition Evidence Library: Methodology Used to Identify Topics and Develop Systematic Review Questions for the Birth-to–24-Mo Population. Am. J. Clin. Nutr. 2014, 99, 692S–696S. [Google Scholar] [CrossRef] [Green Version]
- U.S. Department of Agriculture; U.S. Department of Health and Human Services. 2015–2020 Dietary Guidelines for Americans; Agricultural Research Service: Washington, DC, USA, 2015; p. 144.
- Dietary Guidelines Advisory Committee. Scientific Report of the 2020 Dietary Guidelines Advisory Committee: Advisory Report to the Secretary of Agriculture and the Secretary of Health and Human Services; Agricultural Research Service: Washington, DC, USA, 2020. [Google Scholar]
- NIH. Notice of Intent to Publish a Funding Opportunity Announcement for Nutrition for Precision Health, Powered by the All of Us Research Program: Metabolomics and Clinical Assays Center (U24). Available online: https://grants.nih.gov/grants/guide/notice-files/NOT-RM-21-002.html (accessed on 17 November 2020).
- O’Dell, B.L.; Sunde, R.A. Handbook of Nutritionally Essential Mineral Elements; Marcel Dekker, Inc.: New York, NY, USA, 1997; ISBN 0-8247-9312-9. [Google Scholar]
- Hou, Y.; Yin, Y.; Wu, G. Dietary Essentiality of “Nutritionally Non-Essential Amino Acids” for Animals and Humans. Exp. Biol. Med. 2015, 240, 997–1007. [Google Scholar] [CrossRef] [Green Version]
- Vickery, H.B.; Schmidt, C.L.A. The History of the Discovery of the Amino Acids. Chem. Rev. 1931, 9, 169–318. [Google Scholar] [CrossRef]
- Eggersdorfer, M.; Laudert, D.; Létinois, U.; McClymont, T.; Medlock, J.; Netscher, T.; Bonrath, W. One Hundred Years of Vitamins: A Success Story of the Natural Sciences. Angew. Chem. Int. Ed. 2012, 51, 12960–12990. [Google Scholar] [CrossRef] [PubMed]
- National Research Council. Recommended Dietary Allowances; National Academies Press: Washington, DC, USA, 1941; p. 13286. ISBN 978-0-309-22234-1. [Google Scholar]
- Institute of Medicine. Dietary Reference Intakes: The Essential Guide to Nutrient Requirements; The National Academies Press: Washington, DC, USA, 2006; ISBN 978-0-309-15742-1. [Google Scholar]
- National Research Council (U.S.). Recommended Dietary Allowances, 10th ed.; The National Academies Press: Washington, DC, USA, 1989; p. 1349. ISBN 978-0-309-04633-6. [Google Scholar]
- Institute of Medicine (Ed.) Dietary Reference Intakes for Calcium, Vitamin D; The National Academies Press: Washington, DC, USA, 2011; ISBN 978-0-309-16394-1. [Google Scholar]
- Institute of Medicine (U.S.). Dietary Reference Intakes for Vitamin A, Vitamin K, Arsenic, Boron, Chromium, Copper, Iodine, Iron, Manganese, Molybdenum, Nickel, Silicon, Vanadium, and Zinc; The National Academies Press: Washington, DC, USA, 2001. [Google Scholar]
- Institute of Medicine. Dietary Reference Intakes for Vitamin C, Vitamin E, Selenium, and Carotenoids; The National Academies Press: Washington, DC, USA, 2000. [Google Scholar]
- Institute of Medicine. Dietary Reference Intakes for Thiamin, Riboflavin, Niacin, Vitamin B6, Folate, Vitamin B12, Pantothenic Acid, Biotin, and Choline; The National Academies Press: Washington, DC, USA, 1998. [Google Scholar]
- Institute of Medicine. Dietary Reference Intakes for Energy, Carbohydrate, Fiber, Fat, Fatty Acids, Cholesterol, Protein, and Amino Acids (Macronutrients); The National Academies Press: Washington, DC, USA, 2005; ISBN 978-0-309-08525-0. [Google Scholar]
- Biesalski, H.-K.; Dragsted, L.O.; Elmadfa, I.; Grossklaus, R.; Müller, M.; Schrenk, D.; Walter, P.; Weber, P. Bioactive Compounds: Definition and Assessment of Activity. Nutrition 2009, 25, 1202–1205. [Google Scholar] [CrossRef] [PubMed]
- Kantor, E.D.; Rehm, C.D.; Du, M.; White, E.; Giovannucci, E.L. Trends in Dietary Supplement Use among US Adults from 1999–2012. JAMA 2016, 316, 1464. [Google Scholar] [CrossRef]
- Cowan, A.E.; Jun, S.; Tooze, J.A.; Dodd, K.W.; Gahche, J.J.; Eicher-Miller, H.A.; Guenther, P.M.; Dwyer, J.T.; Moshfegh, A.J.; Rhodes, D.G.; et al. Comparison of 4 Methods to Assess the Prevalence of Use and Estimates of Nutrient Intakes from Dietary Supplements among US Adults. J. Nutr. 2019, nxz306. [Google Scholar] [CrossRef] [Green Version]
- Li, J.; Li, X.; Gathirua-Mwangi, W.; Song, Y. Prevalence and Trends in Dietary Supplement Use among US Adults with Diabetes: The National Health and Nutrition Examination Surveys, 1999–2014. BMJ Open Diab. Res. Care. 2020, 8, e000925. [Google Scholar] [CrossRef] [Green Version]
- Gahche, J.J.; Bailey, R.L.; Potischman, N.; Dwyer, J.T. Dietary Supplement Use Was Very High among Older Adults in the United States in 2011–2014. J. Nutr. 2017, 147, 1968–1976. [Google Scholar] [CrossRef] [PubMed] [Green Version]
- Bailey, R.L.; Gahche, J.J.; Miller, P.E.; Thomas, P.R.; Dwyer, J.T. Why US Adults Use Dietary Supplements. JAMA Intern. Med. 2013, 173, 355. [Google Scholar] [CrossRef] [Green Version]
- Bailey, R.L.; Fulgoni, V.L.; Keast, D.R.; Dwyer, J.T. Examination of Vitamin Intakes among US Adults by Dietary Supplement Use. J. Acad. Nutr. Diet. 2012, 112, 657–663. [Google Scholar] [CrossRef] [PubMed] [Green Version]
- Bailey, R.L.; Pac, S.G.; Fulgoni, V.L.; Reidy, K.C.; Catalano, P.M. Estimation of Total Usual Dietary Intakes of Pregnant Women in the United States. JAMA Netw. Open 2019, 2, e195967. [Google Scholar] [CrossRef] [Green Version]
- Blumberg, J.; Frei, B.; Fulgoni, V.; Weaver, C.; Zeisel, S. Contribution of Dietary Supplements to Nutritional Adequacy in Various Adult Age Groups. Nutrients 2017, 9, 1325. [Google Scholar] [CrossRef] [PubMed] [Green Version]
- Cowan, A.E.; Jun, S.; Tooze, J.A.; Eicher-Miller, H.A.; Dodd, K.W.; Gahche, J.J.; Guenther, P.M.; Dwyer, J.T.; Potischman, N.; Bhadra, A.; et al. Total Usual Micronutrient Intakes Compared to the Dietary Reference Intakes among U.S. Adults by Food Security Status. Nutrients 2019, 12, 38. [Google Scholar] [CrossRef] [Green Version]
- Troesch, B.; Hoeft, B.; McBurney, M.; Eggersdorfer, M.; Weber, P. Dietary Surveys Indicate Vitamin Intakes below Recommendations Are Common in Representative Western Countries. Br. J. Nutr. 2012, 108, 692–698. [Google Scholar] [CrossRef]
- CDC. Poor Nutrition. Available online: https://www.cdc.gov/chronicdisease/resources/publications/factsheets/nutrition.htm (accessed on 18 October 2020).
- CDC. Chronic Diseases in America. Available online: https://www.cdc.gov/chronicdisease/pdf/infographics/chronic-disease-H.pdf (accessed on 26 May 2021).
- American Chemical Society. American Chemical Society National Historic Chemical Landmarks. The Discovery of Vitamin C by Albert Szent-Gyorgyi. Available online: https://www.acs.org/content/acs/en/education/whatischemistry/landmarks/szentgyorgyi.html (accessed on 19 October 2020).
- WHO. WHO Guideline on the Use of Ferritin Concentrations to Assess Iron Status in Individual Populations; World Health Organization: Geneva, Switzerland, 2020. [Google Scholar]
- Institute of Medicine (Ed.) Dietary Reference Intakes for Calcium, Phosphorus, Magnesium, Vitamin D, and Fluoride; The National Academies Press: Washington, DC, USA, 1997; ISBN 978-0-309-06350-0. [Google Scholar]
- Bischoff-Ferrari, H.A.; Giovannucci, E.; Willett, W.C.; Dietrich, T.; Dawson-Hughes, B. Estimation of Optimal Serum Concentrations of 25-Hydroxyvitamin D for Multiple Health Outcomes. Am. J. Clin. Nutr. 2006, 84, 18–28. [Google Scholar] [CrossRef]
- Phinney, K.W.; Bedner, M.; Tai, S.S.-C.; Vamathevan, V.V.; Sander, L.C.; Sharpless, K.E.; Wise, S.A.; Yen, J.H.; Schleicher, R.L.; Chaudhary-Webb, M.; et al. Development and Certification of a Standard Reference Material for Vitamin D Metabolites in Human Serum. Anal. Chem. 2012, 84, 956–962. [Google Scholar] [CrossRef] [Green Version]
- Van Schoor, N.M.; Heymans, M.W.; Lips, P. Vitamin D Status in Relation to Physical Performance, Falls and Fractures in the Longitudinal Aging Study Amsterdam—A Reanalysis of Previous Findings Using Standardized Serum 25-Hydroxyvitamin D Values. J. Steroid Biochem. Mol. Biol. 2018, 177, 255–260. [Google Scholar] [CrossRef]
- Pan, K.; Tu, R.; Yao, X.; Zhu, Z. Associations between Serum Calcium, 25(OH)D Level and Bone Mineral Density in Adolescents. Adv. Rheumatol. 2021, 61, 16. [Google Scholar] [CrossRef]
- Teshome, A.; Adane, A.; Girma, B.; Mekonnen, Z.A. The Impact of Vitamin D Level on COVID-19 Infection: Systematic Review and Meta-Analysis. Front. Public Health 2021, 9, 624559. [Google Scholar] [CrossRef] [PubMed]
- Hodges, R.E.; Hood, J.; Canham, J.E.; Sauberlich, H.E.; Baker, E.M. Clinical Manifestations of Ascorbic Acid Deficiency in Man. Am. J. Clin. Nutr. 1971, 24, 432–443. [Google Scholar] [CrossRef] [PubMed] [Green Version]
- Carr, A.C.; Lykkesfeldt, J. Discrepancies in Global Vitamin C Recommendations: A Review of RDA Criteria and Underlying Health Perspectives. Crit. Rev. Food Sci. Nutr. 2020, 1–14. [Google Scholar] [CrossRef] [PubMed] [Green Version]
- Carr, A.C.; Bozonet, S.M.; Pullar, J.M.; Simcock, J.W.; Vissers, M.C. Human Skeletal Muscle Ascorbate Is Highly Responsive to Changes in Vitamin C Intake and Plasma Concentrations. Am. J. Clin. Nutr. 2013, 97, 800–807. [Google Scholar] [CrossRef] [Green Version]
- Loria, C.M.; Klag, M.J.; Caulfield, L.E.; Whelton, P.K. Vitamin C Status and Mortality in US Adults. Am. J. Clin. Nutr. 2000, 72, 139–145. [Google Scholar] [CrossRef]
- Jayedi, A.; Rashidy-Pour, A.; Parohan, M.; Zargar, M.S.; Shab-Bidar, S. Dietary and Circulating Vitamin C, Vitamin E, β-Carotene and Risk of Total Cardiovascular Mortality: A Systematic Review and Dose–Response Meta-Analysis of Prospective Observational Studies. Public Health Nutr. 2019, 22, 1872–1887. [Google Scholar] [CrossRef]
- Rowe, S.; Carr, A.C. Global Vitamin C Status and Prevalence of Deficiency: A Cause for Concern? Nutrients 2020, 12, 2008. [Google Scholar] [CrossRef]
- Weaver, C.M. Bioactive Foods and Ingredients for Health. Adv. Nutr. 2014, 5, 306S. [Google Scholar] [CrossRef] [PubMed] [Green Version]
- Wallace, T.C.; Blumberg, J.B.; Johnson, E.J.; Shao, A. Dietary Bioactives: Establishing a Scientific Framework for Recommended Intakes. Adv. Nutr. Int. Rev. J. 2015, 6, 1–4. [Google Scholar] [CrossRef] [PubMed] [Green Version]
- Lupton, J.R.; Atkinson, S.A.; Chang, N.; Fraga, C.G.; Levy, J.; Messina, M.; Richardson, D.P.; van Ommen, B.; Yang, Y.; Griffiths, J.C.; et al. Exploring the Benefits and Challenges of Establishing a DRI-like Process for Bioactives. Eur. J. Nutr. 2014, 53, S1–S9. [Google Scholar] [CrossRef] [PubMed] [Green Version]
- Lupton, J.R.; Blumberg, J.B.; L’Abbe, M.; LeDoux, M.; Rice, H.B.; von Schacky, C.; Yaktine, A.; Griffiths, J.C. Nutrient Reference Value: Non-Communicable Disease Endpoints—A Conference Report. Eur. J. Nutr. 2016, 55, 1–10. [Google Scholar] [CrossRef] [Green Version]
- U.S. Department of Health and Human Services. Nutrient Assessment for DRI Review. Available online: https://health.gov/our-work/food-nutrition/dietary-reference-intakes-dris/nutrient-assessment-dri-review (accessed on 20 October 2020).
- MacFarlane, A.J.; Cogswell, M.E.; de Jesus, J.M.; Greene-Finestone, L.S.; Klurfeld, D.M.; Lynch, C.J.; Regan, K.; Yamini, S.; Joint Canada-US Dietary Reference Intakes Working Group. A Report of Activities Related to the Dietary Reference Intakes from the Joint Canada-US Dietary Reference Intakes Working Group. Am. J. Clin. Nutr. 2019, 109, 251–259. [Google Scholar] [CrossRef] [PubMed] [Green Version]
- National Academies of Sciences, Engineering, and Medicine. Dietary Reference Intakes for Sodium and Potassium; The National Academies Press: Washington, DC, USA, 2019; p. 25353. ISBN 978-0-309-48834-1. [Google Scholar]
- National Academies of Sciences, Engineering, and Medicine. Evidence Scanning for Riboflavin. Available online: https://www.nationalacademies.org/our-work/evidence-scanning-for-riboflavin (accessed on 20 October 2020).
- Ranard, K.M.; Jeon, S.; Mohn, E.S.; Griffiths, J.C.; Johnson, E.J.; Erdman, J.W. Dietary Guidance for Lutein: Consideration for Intake Recommendations Is Scientifically Supported. Eur. J. Nutr. 2017, 56, 37–42. [Google Scholar] [CrossRef] [PubMed] [Green Version]
- Akbulut, A.C.; Pavlic, A.; Petsophonsakul, P.; Halder, M.; Maresz, K.; Kramann, R.; Schurgers, L. Vitamin K2 Needs an RDI Separate from Vitamin K1. Nutrients 2020, 12, 1852. [Google Scholar] [CrossRef] [PubMed]
- Turck, D.; Bresson, J.-L.; Burlingame, B.; Dean, T.; Fairweather-Tait, S.; Heinonen, M.; Hirsch-Ernst, K.I.; Mangelsdorf, I.; McArdle, H.J.; Naska, A.; et al. Dietary Reference Values for Vitamin K. EFSA J. 2017, 15, e04780. [Google Scholar] [CrossRef] [PubMed]
- Institute of Medicine. Dietary Reference Intakes: Proposed Definition and Plan for Review of Dietary Antioxidants and Related Compounds; The National Academies Press: Washington, DC, USA, 1998; p. 6252. ISBN 978-0-309-06187-2. [Google Scholar]
- Mortensen, A. Carotenoids and Other Pigments as Natural Colorants. Pure Appl. Chem. 2006, 78, 1477–1491. [Google Scholar] [CrossRef]
- Thomas, J.B.; Duewer, D.L.; Mugenya, I.O.; Phinney, K.W.; Sander, L.C.; Sharpless, K.E.; Sniegoski, L.T.; Tai, S.S.; Welch, M.J.; Yen, J.H. Preparation and Value Assignment of Standard Reference Material 968e Fat-Soluble Vitamins, Carotenoids, and Cholesterol in Human Serum. Anal. Bioanal. Chem. 2012, 402, 749–762. [Google Scholar] [CrossRef] [PubMed]
- U.S. Department of Agriculture. F.S.R.G. WWEIA/NHANES and FNDDS—List of Nutrients/Food Components (Unit): USDA ARS. Available online: https://www.ars.usda.gov/northeast-area/beltsville-md-bhnrc/beltsville-human-nutrition-research-center/food-surveys-research-group/docs/wweianhanes-and-fndds-list-of-nutrientsfood-components-unit/ (accessed on 1 November 2020).
- Johnson, E.J.; Vishwanathan, R.; Johnson, M.A.; Hausman, D.B.; Davey, A.; Scott, T.M.; Green, R.C.; Miller, L.S.; Gearing, M.; Woodard, J.; et al. Relationship between Serum and Brain Carotenoids, α-Tocopherol, and Retinol Concentrations and Cognitive Performance in the Oldest Old from the Georgia Centenarian Study. J. Aging Res. 2013, 2013, 951786. [Google Scholar] [CrossRef] [PubMed] [Green Version]
- Vishwanathan, R.; Kuchan, M.J.; Sen, S.; Johnson, E.J. Lutein and Preterm Infants with Decreased Concentrations of Brain Carotenoids. J. Pediatr. Gastroenterol. Nutr. 2014, 59, 659–665. [Google Scholar] [CrossRef]
- Erdman, J.; Smith, J.; Kuchan, M.; Mohn, E.; Johnson, E.; Rubakhin, S.; Wang, L.; Sweedler, J.; Neuringer, M. Lutein and Brain Function. Foods 2015, 4, 547–564. [Google Scholar] [CrossRef] [Green Version]
- Stringham, J.M.; Johnson, E.J.; Hammond, B.R. Lutein across the Lifespan: From Childhood Cognitive Performance to the Aging Eye and Brain. Curr. Dev. Nutr. 2019, 3, nzz066. [Google Scholar] [CrossRef] [Green Version]
- Moran, N.E.; Mohn, E.S.; Hason, N.; Erdman, J.W.; Johnson, E.J. Intrinsic and Extrinsic Factors Impacting Absorption, Metabolism, and Health Effects of Dietary Carotenoids. Adv. Nutr. 2018, 9, 465–492. [Google Scholar] [CrossRef] [Green Version]
- Chew, E.Y.; Clemons, T.; SanGiovanni, J.P.; Danis, R.; Domalpally, A.; McBee, W.; Sperduto, R.; Ferris, F.L. The Age-Related Eye Disease Study 2 (AREDS2). Opthalmology 2012, 119, 2282–2289. [Google Scholar] [CrossRef] [Green Version]
- Leung, I.Y.-F.; Sandstrom, M.M.; Zucker, C.L.; Neuringer, M.; Snodderly, D.M. Nutritional Manipulation of Primate Retinas, II: Effects of Age, n–3 Fatty Acids, Lutein, and Zeaxanthin on Retinal Pigment Epithelium. Investig. Ophthalmol. Vis. Sci. 2004, 45, 3244. [Google Scholar] [CrossRef]
- Barker, F.M.; Snodderly, D.M.; Johnson, E.J.; Schalch, W.; Koepcke, W.; Gerss, J.; Neuringer, M. Nutritional Manipulation of Primate Retinas, V: Effects of Lutein, Zeaxanthin, and n-3 Fatty Acids on Retinal Sensitivity to Blue-Light-Induced Damage. Investig. Ophthalmol. Vis. Sci. 2011, 52, 3934–3942. [Google Scholar] [CrossRef] [Green Version]
- Böhm, V.; Lietz, G.; Olmedilla-Alonso, B.; Phelan, D.; Reboul, E.; Bánati, D.; Borel, P.; Corte-Real, J.; de Lera, A.R.; Desmarchelier, C.; et al. From Carotenoid Intake to Carotenoid Blood and Tissue Concentrations—Implications for Dietary Intake Recommendations. Nutr. Rev. 2020, nuaa008. [Google Scholar] [CrossRef] [PubMed]
- Rosenthal, J.M.; Kim, J.; de Monastario, F.; Thompson, D.J.S.; Bone, R.A.; Landrum, J.T.; de Moura, F.F.; Khachik, F.; Chen, H.; Schleicher, R.L.; et al. Dose-Ranging Study of Lutein Supplementation in Persons Aged 60 Years or Older. Investig. Ophthalmol. Vis. Sci. 2006, 47, 5227. [Google Scholar] [CrossRef]
- Bone, R.A.; Landrum, J.T. Dose-Dependent Response of Serum Lutein and Macular Pigment Optical Density to Supplementation with Lutein Esters. Arch. Biochem. Biophys. 2010, 504, 50–55. [Google Scholar] [CrossRef] [PubMed] [Green Version]
- Renzi, L.M.; Hammond, B.R. The Relation between the Macular Carotenoids, Lutein and Zeaxanthin, and Temporal Vision: Macular Pigment and Temporal Vision. Opthalmol. Physiol. Opt. 2010, 30, 351–357. [Google Scholar] [CrossRef] [PubMed]
- Obana, A.; Tanito, M.; Gohto, Y.; Okazaki, S.; Gellermann, W.; Bernstein, P.S. Changes in Macular Pigment Optical Density and Serum Lutein Concentration in Japanese Subjects Taking Two Different Lutein Supplements. PLoS ONE 2015, 10, e0139257. [Google Scholar] [CrossRef]
- Machida, N.; Kosehira, M.; Kitaichi, N. Clinical Effects of Dietary Supplementation of Lutein with High Bio-Accessibility on Macular Pigment Optical Density and Contrast Sensitivity: A Randomized Double-Blind Placebo-Controlled Parallel-Group Comparison Trial. Nutrients 2020, 12, 2966. [Google Scholar] [CrossRef] [PubMed]
- Wong, J.C.; Kaplan, H.S.; Hammond, B.R. Lutein and Zeaxanthin Status and Auditory Thresholds in a Sample of Young Healthy Adults. Nutr. Neurosci. 2017, 20, 1–7. [Google Scholar] [CrossRef] [PubMed]
- Weikel, K.A.; Garber, C.; Baburins, A.; Taylor, A. Nutritional Modulation of Cataract. Nutr. Rev. 2014, 72, 30–47. [Google Scholar] [CrossRef] [PubMed]
- Age-Related Eye Disease Study 2 Research Group. Lutein + Zeaxanthin and Omega-3 Fatty Acids for Age-Related Macular Degeneration: The Age-Related Eye Disease Study 2 (AREDS2) Randomized Clinical Trial. JAMA 2013, 309, 2005–2015. [Google Scholar] [CrossRef]
- Ma, L.; Dou, H.-L.; Wu, Y.-Q.; Huang, Y.-M.; Huang, Y.-B.; Xu, X.-R.; Zou, Z.-Y.; Lin, X.-M. Lutein and Zeaxanthin Intake and the Risk of Age-Related Macular Degeneration: A Systematic Review and Meta-Analysis. Br. J. Nutr. 2012, 107, 350–359. [Google Scholar] [CrossRef]
- Johnson, E.J.; Avendano, E.E.; Mohn, E.S.; Raman, G. The Association between Macular Pigment Optical Density and Visual Function Outcomes: A Systematic Review and Meta-Analysis. Eye 2020. [Google Scholar] [CrossRef] [PubMed]
- Li, B.; Vachali, P.; Frederick, J.M.; Bernstein, P.S. Identification of StARD3 as a Lutein-Binding Protein in the Macula of the Primate Retina. Biochemistry 2011, 50, 2541–2549. [Google Scholar] [CrossRef] [PubMed] [Green Version]
- Salem, N.; Wegher, B.; Mena, P.; Uauy, R. Arachidonic and Docosahexaenoic Acids Are Biosynthesized from Their 18-Carbon Precursors in Human Infants. Proc. Natl. Acad. Sci. USA 1996, 93, 49–54. [Google Scholar] [CrossRef] [PubMed] [Green Version]
- Gabbs, M.; Leng, S.; Devassy, J.G.; Aukema, H.M. Advances in Our Understanding of Oxylipins Derived from Dietary PUFAs. Adv. Nutr. 2015, 6, 513–540. [Google Scholar] [CrossRef] [PubMed] [Green Version]
- Mozaffarian, D.; Wu, J.H.Y. Omega-3 Fatty Acids and Cardiovascular Disease. J. Am. Coll. Cardiol. 2011, 58, 2047–2067. [Google Scholar] [CrossRef] [Green Version]
- Burdge, G.C.; Calder, P.C. Conversion of Alpha-Linolenic Acid to Longer-Chain Polyunsaturated Fatty Acids in Human Adults. Reprod. Nutr. Dev. 2005, 45, 581–597. [Google Scholar] [CrossRef]
- Chen, C.T.; Bazinet, R.P. β-Oxidation and Rapid Metabolism, but Not Uptake Regulate Brain Eicosapentaenoic Acid Levels. Prostaglandins Leukot. Essent. Fatty Acids 2015, 92, 33–40. [Google Scholar] [CrossRef]
- Ghasemi Fard, S.; Wang, F.; Sinclair, A.J.; Elliott, G.; Turchini, G.M. How Does High DHA Fish Oil Affect Health? A Systematic Review of Evidence. Crit. Rev. Food Sci. Nutr. 2018, 1–44. [Google Scholar] [CrossRef] [PubMed] [Green Version]
- Hibbeln, J.R.; Nieminen, L.R.; Blasbalg, T.L.; Riggs, J.A.; Lands, W.E. Healthy Intakes of N−3 and N−6 Fatty Acids: Estimations Considering Worldwide Diversity. Am. J. Clin. Nutr. 2006, 83, 1483S–1493S. [Google Scholar] [CrossRef] [PubMed]
- Collison, M.W. Official Methods and Recommended Practices of the AOCS: Fatty Acids in Edible Oils and Fats Official Method C3 1a-13, 7th ed.; American Oil Chemists Society: Urbana, IL, USA, 2017. [Google Scholar]
- Richter, C.K.; Bowen, K.J.; Mozaffarian, D.; Kris-Etherton, P.M.; Skulas-Ray, A.C. Total Long-Chain n-3 Fatty Acid Intake and Food Sources in the United States Compared to Recommended Intakes: NHANES 2003–2008. Lipids 2017, 52, 917–927. [Google Scholar] [CrossRef] [PubMed]
- U.S. Department of Agriculture; U.S. Department of Health and Human Services. 2005 Dietary Guidelines for Americans. Available online: https://health.gov/sites/default/files/2020-01/DGA2005.pdf (accessed on 26 October 2020).
- Kris-Etherton, P.M.; Grieger, J.A.; Etherton, T.D. Dietary Reference Intakes for DHA and EPA. Prostaglandins Leukot. Essent. Fat. Acids 2009, 81, 99–104. [Google Scholar] [CrossRef]
- Harris, W.S.; Mozaffarian, D.; Lefevre, M.; Toner, C.D.; Colombo, J.; Cunnane, S.C.; Holden, J.M.; Klurfeld, D.M.; Morris, M.C.; Whelan, J. Towards Establishing Dietary Reference Intakes for Eicosapentaenoic and Docosahexaenoic Acids. J. Nutr. 2009, 139, 804S–819S. [Google Scholar] [CrossRef] [PubMed] [Green Version]
- Bernasconi, A.A.; Wiest, M.M.; Lavie, C.J.; Milani, R.V.; Laukkanen, J.A. Effect of Omega-3 Dosage on Cardiovascular Outcomes. Mayo Clin. Proc. 2021, 96, 304–313. [Google Scholar] [CrossRef] [PubMed]
- U.S. Department of Agriculture. FoodData Central. Available online: https://ndb.nal.usda.gov/fdc-app.html#/?query=lutein (accessed on 21 October 2020).
- Maki, K.C. Long-Chain Omega-3 Fatty Acid Bioavailability: Implications for Understanding the Effects of Supplementation on Heart Disease Risk. J. Nutr. 2018, 148, 1701–1703. [Google Scholar] [CrossRef]
- West, A.L.; Kindberg, G.M.; Hustvedt, S.O.; Calder, P.C. A Novel Self-Micro-Emulsifying Delivery System Enhances Enrichment of Eicosapentaenoic Acid and Docosahexaenoic Acid after Single and Repeated Dosing in Healthy Adults in a Randomized Trial. J. Nutr. 2018. [Google Scholar] [CrossRef] [PubMed] [Green Version]
- West, A.L.; Burdge, G.C.; Calder, P.C. Lipid Structure Does Not Modify Incorporation of EPA and DHA into Blood Lipids in Healthy Adults: A Randomised-Controlled Trial. Br. J. Nutr. 2016, 116, 788–797. [Google Scholar] [CrossRef] [Green Version]
- Yurko-Mauro, K.; Kralovec, J.; Bailey-Hall, E.; Smeberg, V.; Stark, J.G.; Salem, N. Similar Eicosapentaenoic Acid and Docosahexaenoic Acid Plasma Levels Achieved with Fish Oil or Krill Oil in a Randomized Double-Blind Four-Week Bioavailability Study. Lipids Health Dis. 2015, 14, 99. [Google Scholar] [CrossRef] [Green Version]
- Metcalf, R.G.; James, M.J.; Gibson, R.A.; Edwards, J.R.; Stubberfield, J.; Stuklis, R.; Roberts-Thomson, K.; Young, G.D.; Cleland, L.G. Effects of Fish-Oil Supplementation on Myocardial Fatty Acids in Humans. Am. J. Clin. Nutr. 2007, 85, 1222–1228. [Google Scholar] [CrossRef] [Green Version]
- Pawlosky, R.J.; Hibbeln, J.R.; Novotny, J.A.; Salem, N. Physiological Compartmental Analysis of α-Linolenic Acid Metabolism in Adult Humans. J. Lipid Res. 2001, 42, 1257–1265. [Google Scholar] [CrossRef]
- Innis, S.M. Essential Fatty Acids in Growth and Development. Progr. Lipid Res. 1991, 30, 39–103. [Google Scholar] [CrossRef]
- Innis, S.M. Dietary (n-3) Fatty Acids and Brain Development. J. Nutr. 2007, 137, 855–859. [Google Scholar] [CrossRef] [Green Version]
- Arellanes, I.C.; Choe, N.; Solomon, V.; He, X.; Kavin, B.; Martinez, A.E.; Kono, N.; Buennagel, D.P.; Hazra, N.; Kim, G.; et al. Brain Delivery of Supplemental Docosahexaenoic Acid (DHA): A Randomized Placebo-Controlled Clinical Trial. EBioMedicine 2020, 59, 102883. [Google Scholar] [CrossRef]
- Johnson, E.J.; Schaefer, E.J. Potential Role of Dietary N-3 Fatty Acids in the Prevention of Dementia and Macular Degeneration. Am. J. Clin. Nutr. 2006, 83, 149S–158S. [Google Scholar] [CrossRef]
- Hames, K.C.; Morgan-Bathke, M.; Harteneck, D.A.; Zhou, L.; Port, J.D.; Lanza, I.R.; Jensen, M.D. Very-Long-Chain ω-3 Fatty Acid Supplements and Adipose Tissue Functions: A Randomized Controlled Trial. Am. J. Clin. Nutr. 2017, ajcn148114. [Google Scholar] [CrossRef] [PubMed] [Green Version]
- Katan, M.B.; Deslypere, J.P.; van Birgelen, A.P.; Penders, M.; Zegwaard, M. Kinetics of the Incorporation of Dietary Fatty Acids into Serum Cholesteryl Esters, Erythrocyte Membranes, and Adipose Tissue: An 18-Month Controlled Study. J. Lipid Res. 1997, 38, 2012–2022. [Google Scholar] [CrossRef]
- Harris, W.S.; von Schacky, C. The Omega-3 Index: A New Risk Factor for Death from Coronary Heart Disease? Prev. Med. 2004, 39, 212–220. [Google Scholar] [CrossRef] [PubMed]
- Albert, C.M.; Campos, H.; Stampfer, M.J.; Ridker, P.M.; Manson, J.E.; Willett, W.C.; Ma, J. Blood Levels of Long-Chain n–3 Fatty Acids and the Risk of Sudden Death. N. Engl. J. Med. 2002, 346, 1113–1118. [Google Scholar] [CrossRef] [Green Version]
- Stark, K.D.; Aristizabal Henao, J.J.; Metherel, A.H.; Pilote, L. Translating Plasma and Whole Blood Fatty Acid Compositional Data into the Sum of Eicosapentaenoic and Docosahexaenoic Acid in Erythrocytes. Prostaglandins Leukot. Essent. Fatty Acids 2016, 104, 1–10. [Google Scholar] [CrossRef]
- Hu, X.F.; Sandhu, S.K.; Harris, W.S.; Chan, H.M. Conversion Ratios of N-3 Fatty Acids between Plasma and Erythrocytes: A Systematic Review and Meta-Regression. Br. J. Nutr. 2017, 117, 1162–1173. [Google Scholar] [CrossRef]
- Brenna, J.T.; Plourde, M.; Stark, K.D.; Jones, P.J.H.; Lin, Y.-H. Best Practices for the Design, Laboratory Analysis, and Reporting of Trials Involving Fatty Acids. Am. J. Clin. Nutr. 2018, 108, 1–17. [Google Scholar] [CrossRef]
- Flock, M.R.; Skulas-Ray, A.C.; Harris, W.S.; Etherton, T.D.; Fleming, J.A.; Kris-Etherton, P.M. Determinants of Erythrocyte Omega-3 Fatty Acid Content in Response to Fish Oil Supplementation: A Dose–Response Randomized Controlled Trial. J. Am. Heart Assoc. 2013, 2, e000513. [Google Scholar] [CrossRef] [Green Version]
- Demmelmair, H.; MacDonald, A.; Kotzaeridou, U.; Burgard, P.; Gonzalez-Lamuno, D.; Verduci, E.; Ersoy, M.; Gokcay, G.; Alyanak, B.; Reischl, E.; et al. Determinants of Plasma Docosahexaenoic Acid Levels and Their Relationship to Neurological and Cognitive Functions in PKU Patients: A Double Blind Randomized Supplementation Study. Nutrients 2018, 10, 1944. [Google Scholar] [CrossRef] [PubMed] [Green Version]
- Chang, C.-H.; Tseng, P.-T.; Chen, N.-Y.; Lin, P.-C.; Lin, P.-Y.; Chang, J.P.-C.; Kuo, F.-Y.; Lin, J.; Wu, M.-C.; Su, K.-P. Safety and Tolerability of Prescription Omega-3 Fatty Acids: A Systematic Review and Meta-Analysis of Randomized Controlled Trials. Prostaglandins Leukot. Essent. Fatty Acids 2018, 129, 1–12. [Google Scholar] [CrossRef] [PubMed] [Green Version]
- Yurko-Mauro, K.; Alexander, D.D.; Elswyk, M.E.V. Docosahexaenoic Acid and Adult Memory: A Systematic Review and Meta-Analysis. PLoS ONE 2015, 10, e0120391. [Google Scholar] [CrossRef] [PubMed] [Green Version]
- Mozaffarian, D.; Lemaitre, R.N.; King, I.B.; Song, X.; Huang, H.; Sacks, F.M.; Rimm, E.B.; Wang, M.; Siscovick, D.S. Plasma Phospholipid Long-Chain ω-3 Fatty Acids and Total and Cause-Specific Mortality in Older Adults. Ann. Intern. Med. 2013, 158, 515–525. [Google Scholar] [CrossRef]
- Harris, W.S.; Tintle, N.L.; Imamura, F.; Qian, F.; Ardisson Korat, A.V.; Marklund, M.; Djoussé, L.; Bassett, J.K.; Carmichael, P.-H.; Chen, Y.-Y.; et al. Blood N-3 Fatty Acid Levels and Total and Cause-Specific Mortality from 17 Prospective Studies. Nat. Commun. 2021, 12, 1–9. [Google Scholar] [CrossRef] [PubMed]
- Hu, Y.; Hu, F.B.; Manson, J.E. Marine Omega-3 Supplementation and Cardiovascular Disease: An Updated Meta-analysis of 13 Randomized Controlled Trials Involving 127,477 Participants. J. Am. Heart Assoc. 2019, 8. [Google Scholar] [CrossRef]
- Alexander, D.D.; Miller, P.E.; Van Elswyk, M.E.; Kuratko, C.N.; Bylsma, L.C. A Meta-Analysis of Randomized Controlled Trials and Prospective Cohort Studies of Eicosapentaenoic and Docosahexaenoic Long-Chain Omega-3 Fatty Acids and Coronary Heart Disease Risk. Mayo Clin. Proc. 2017, 92, 15–29. [Google Scholar] [CrossRef] [Green Version]
- Aung, T.; Halsey, J.; Kromhout, D.; Gerstein, H.C.; Marchioli, R.; Tavazzi, L.; Geleijnse, J.M.; Rauch, B.; Ness, A.; Galan, P.; et al. Associations of Omega-3 Fatty Acid Supplement Use with Cardiovascular Disease Risks: Meta-Analysis of 10 Trials Involving 77,917 Individuals. JAMA Cardiol. 2018, 3, 225. [Google Scholar] [CrossRef] [PubMed] [Green Version]
- Abdelhamid, A.S.; Brown, T.J.; Brainard, J.S.; Biswas, P.; Thorpe, G.C.; Moore, H.J.; Deane, K.H.; Summerbell, C.D.; Worthington, H.V.; Song, F.; et al. Omega-3 Fatty Acids for the Primary and Secondary Prevention of Cardiovascular Disease. Cochrane Database Syst. Rev. 2020. [Google Scholar] [CrossRef] [PubMed]
- Chowdhury, R.; Warnakula, S.; Kunutsor, S.; Crowe, F.; Ward, H.A.; Johnson, L.; Franco, O.H.; Butterworth, A.S.; Forouhi, N.G.; Thompson, S.G.; et al. Association of Dietary, Circulating, and Supplement Fatty Acids with Coronary Risk. Ann. Intern. Med. 2014, 160, 398–407. [Google Scholar] [CrossRef] [PubMed]
- Del Gobbo, L.C.; Imamura, F.; Aslibekyan, S.; Marklund, M.; Virtanen, J.K.; Wennberg, M.; Yakoob, M.Y.; Chiuve, S.E.; dela Cruz, L.; Frazier-Wood, A.C.; et al. ω-3 Polyunsaturated Fatty Acid Biomarkers and Coronary Heart Disease: Pooling Project of 19 Cohort Studies. JAMA Intern. Med. 2016, 176, 1155. [Google Scholar] [CrossRef] [PubMed] [Green Version]
- de Groot, R.H.M.; Meyer, B.J. ISSFAL Official Statement Number 6: The Importance of Measuring Blood Omega-3 Long Chain Polyunsaturated Fatty Acid Levels in Research. Prostaglandins Leukot. Essent. Fatty Acids 2020, 157, 1–4. [Google Scholar] [CrossRef]
- Harris, W.S.; Luo, J.; Pottala, J.V.; Espeland, M.A.; Margolis, K.L.; Manson, J.E.; Wang, L.; Brasky, T.M.; Robinson, J.G. Red Blood Cell Polyunsaturated Fatty Acids and Mortality in the Women’s Health Initiative Memory Study. J. Clin. Lipidol. 2017, 11, 250–259.e5. [Google Scholar] [CrossRef] [Green Version]
- Harris, W.S.; Del Gobbo, L.; Tintle, N.L. The Omega-3 Index and Relative Risk for Coronary Heart Disease Mortality: Estimation from 10 Cohort Studies. Atherosclerosis 2017, 262, 51–54. [Google Scholar] [CrossRef]
- Hosseini, M.; Poljak, A.; Braidy, N.; Crawford, J.; Sachdev, P. Blood Fatty Acids in Alzheimer’s Disease and Mild Cognitive Impairment: A Meta-Analysis and Systematic Review. Ageing Res. Rev. 2020, 60, 101043. [Google Scholar] [CrossRef]
- Croft, D. Do Elevated Blood Levels of Omega-3 Fatty Acids Modify Effects of Particulate Air Pollutants on Fibrinogen? Air. Qual. Atmos. Health 2018, 11, 791–799. [Google Scholar] [CrossRef] [PubMed] [Green Version]
- Chen, C.; Xun, P.; Kaufman, J.D.; Hayden, K.M.; Espeland, M.A.; Whitsel, E.A.; Serre, M.L.; Vizuete, W.; Orchard, T.; Harris, W.S.; et al. Erythrocyte Omega-3 Index, Ambient Fine Particle Exposure, and Brain Aging. Neurology 2020, 95, e995–e1007. [Google Scholar] [CrossRef] [PubMed]
- Schurgers, L.J.; Vermeer, C. Determination of Phylloquinone and Menaquinones in Food. Pathol. Haem. Thromb. 2000, 30, 298–307. [Google Scholar] [CrossRef] [PubMed]
- Shea, M.K.; Booth, S.L. Update on the Role of Vitamin K in Skeletal Health. Nutr. Rev. 2008, 66, 549–557. [Google Scholar] [CrossRef]
- McKee, R.W.; Binkley, S.B.; MacCorquodale, D.W.; Thayer, S.A.; Doisy, E.A. The Isolation of Vitamins K1 and K2. J. Am. Chem. Soc. 1939, 61, 1295. [Google Scholar] [CrossRef]
- Dam, H.; Schonheyder, F. The Occurrence and Chemical Nature of Vitamin K. Bioch. J. 1936, 30, 897–901. [Google Scholar] [CrossRef] [PubMed] [Green Version]
- Suttie, J.W. Synthesis of Vitamin K-dependent Proteins. FASEB J. 1993, 7, 445–452. [Google Scholar] [CrossRef]
- Shearer, M.J. Vitamin K Metabolism and Nutriture. Blood Rev. 1992, 6, 92–104. [Google Scholar] [CrossRef]
- Schurgers, L.J.; Teunissen, K.J.F.; Hamulyák, K.; Knapen, M.H.J.; Vik, H.; Vermeer, C. Vitamin K–Containing Dietary Supplements: Comparison of Synthetic Vitamin K1 and Natto-Derived Menaquinone-7. Blood 2007, 109, 3279–3283. [Google Scholar] [CrossRef] [Green Version]
- Szulc, P.; Chapuy, M.C.; Meunier, P.J.; Delmas, P.D. Serum Undercarboxylated Osteocalcin Is a Marker of the Risk of Hip Fracture in Elderly Women. J. Clin. Investig. 1993, 91, 1769–1774. [Google Scholar] [CrossRef] [Green Version]
- Rønn, S.H.; Harsløf, T.; Pedersen, S.B.; Langdahl, B.L. Vitamin K2 (Menaquinone-7) Prevents Age-Related Deterioration of Trabecular Bone Microarchitecture at the Tibia in Postmenopausal Women. Eur. J. Endocrinol. 2016, 175, 541–549. [Google Scholar] [CrossRef] [Green Version]
- Murshed, M. Unique Coexpression in Osteoblasts of Broadly Expressed Genes Accounts for the Spatial Restriction of ECM Mineralization to Bone. Genes Devel. 2005, 19, 1093–1104. [Google Scholar] [CrossRef] [PubMed] [Green Version]
- Cockayne, S.; Adamson, J.; Lanham-New, S.; Shearer, M.J.; Gilbody, S.; Torgerson, D.J. Vitamin K and the Prevention of Fractures: Systematic Review and Meta-Analysis of Randomized Controlled Trials. Arch. Intern. Med. 2006, 166, 1256–1261. [Google Scholar] [CrossRef]
- Schurgers, L.J.; Spronk, H.M.H.; Soute, B.A.M.; Schiffers, P.M.; DeMey, J.G.R.; Vermeer, C. Regression of Warfarin-Induced Medial Elastocalcinosis by High Intake of Vitamin K in Rats. Blood 2007, 109, 2823–2831. [Google Scholar] [CrossRef]
- McCabe, K.M.; Booth, S.L.; Fu, X.; Shobeiri, N.; Pang, J.J.; Adams, M.A.; Holden, R.M. Dietary Vitamin K and Therapeutic Warfarin Alter the Susceptibility to Vascular Calcification in Experimental Chronic Kidney Disease. Kidney Intern. 2013, 83, 835–844. [Google Scholar] [CrossRef] [Green Version]
- Thijssen, H.H.W.; Vervoort, L.M.T.; Schurgers, L.J.; Shearer, M.J. Menadione Is a Metabolite of Oral Vitamin K. Br. J. Nutr. 2006, 95, 260–266. [Google Scholar] [CrossRef] [Green Version]
- Haugsgjerd, T.R.; Egeland, G.M.; Nygård, O.K.; Vinknes, K.J.; Sulo, G.; Lysne, V.; Igland, J.; Tell, G.S. Association of Dietary Vitamin K and Risk of Coronary Heart Disease in Middle-Age Adults: The Hordaland Health Study Cohort. BMJ Open 2020, 10, e035953. [Google Scholar] [CrossRef]
- Knapen, M.H.J.; Braam, L.A.J.L.M.; Drummen, N.E.; Bekers, O.; Hoeks, A.P.G.; Vermeer, C. Menaquinone-7 Supplementation Improves Arterial Stiffness in Healthy Postmenopausal Women: A Double-Blind Randomised Clinical Trial. Thromb. Haemost. 2015, 113, 1135–1144. [Google Scholar] [CrossRef]
- Braam, L.A.J.L.M.; Knapen, M.H.J.; Geusens, P.; Brouns, F.; Hamulyk, K.; Gerichhausen, M.J.W.; Vermeer, C. Vitamin K1 Supplementation Retards Bone Loss in Postmenopausal Women between 50 and 60 Years of Age. Calc. Tissue Internat. 2003, 73, 21–26. [Google Scholar] [CrossRef] [PubMed]
- Schurgers, L.J.; Knapen, M.H.J.; Vermeer, C. Vitamin K2 Improves Bone Strength in Postmenopausal Women. Int. Congr. Ser. 2007, 1297, 179–187. [Google Scholar] [CrossRef]
- Krüger, T.; Oelenberg, S.; Kaesler, N.; Schurgers, L.J.; van de Sandt, A.M.; Boor, P.; Schlieper, G.; Brandenburg, V.M.; Fekete, B.C.; Veulemans, V.; et al. Warfarin Induces Cardiovascular Damage in Mice. Arterioscler. Thromb. Vasc. Biol. 2013, 33, 2618–2624. [Google Scholar] [CrossRef] [PubMed]
- Westenfeld, R.; Krueger, T.; Schlieper, G.; Cranenburg, E.C.M.; Magdeleyns, E.J.; Heidenreich, S.; Holzmann, S.; Vermeer, C.; Jahnen-Dechent, W.; Ketteler, M.; et al. Effect of Vitamin K2 Supplementation on Functional Vitamin K Deficiency in Hemodialysis Patients: A Randomized Trial. Am. J. Kidney Dis. 2012, 59, 186–195. [Google Scholar] [CrossRef] [PubMed]
- Huang, Z.-B.; Wan, S.-L.; Lu, Y.-J.; Ning, L.; Liu, C.; Fan, S.-W. Does Vitamin K2 Play a Role in the Prevention and Treatment of Osteoporosis for Postmenopausal Women: A Meta-Analysis of Randomized Controlled Trials. Osteoporos. Int. 2015, 26, 1175–1186. [Google Scholar] [CrossRef]
- Alexopoulos, N.; Raggi, P. Calcification in Atherosclerosis. Nat. Rev. Cardiol. 2009, 6, 681–688. [Google Scholar] [CrossRef] [PubMed]
- Alexopoulos, N.; Raggi, P. Coronary Artery Calcium Is a Better Risk Marker than HsCRP. Nat. Rev. Cardiol. 2011, 8, 616–618. [Google Scholar] [CrossRef]
- Rennenberg, R.; Kessels, A.G.H.; Schurgers, L.J.; Van Engelshoven, J.M.A.; de Leeuw, P.; Kroon, A.A. Vascular Calcifications as a Marker of Increased Cardiovascular Risk: A Meta-Analysis. Vasc. Health Risk Manag. 2009, 5, 185–197. [Google Scholar] [CrossRef] [Green Version]
- van Summeren, M.J.H.; Braam, L.A.J.L.M.; Lilien, M.R.; Schurgers, L.J.; Kuis, W.; Vermeer, C. The Effect of Menaquinone-7 (Vitamin K2) Supplementation on Osteocalcin Carboxylation in Healthy Prepubertal Children. Br. J. Nutr. 2009, 102, 1171–1178. [Google Scholar] [CrossRef] [PubMed] [Green Version]
- Knapen, M.H.J.; Jardon, K.M.; Vermeer, C. Vitamin K-Induced Effects on Body Fat and Weight: Results from a 3-Year Vitamin K2 Intervention Study. Eur. J. Clin. Nutr. 2018, 72, 136–141. [Google Scholar] [CrossRef]
- Lees, J.S.; Chapman, F.A.; Witham, M.D.; Jardine, A.G.; Mark, P.B. Vitamin K Status, Supplementation and Vascular Disease: A Systematic Review and Meta-Analysis. Heart 2018, 105, 938–945. [Google Scholar] [CrossRef]
- Zhang, S.; Guo, L.; Bu, C. Vitamin K Status and Cardiovascular Events or Mortality: A Meta-Analysis. Eur. J. Prev. Cardiol. 2019, 26, 549–553. [Google Scholar] [CrossRef]
- de Baaji, J.H.F.; Hoenderp, J.G.J.; Bindels, R.J.M. Magnesium in Man: Implications for Health and Disease. Physiol. Rev. 2015, 95, 1–46. [Google Scholar] [CrossRef] [PubMed]
- Laires, M.J. Role of Cellular Magnesium in Health and Human Disease. Front. Biosci. 2004, 9, 262. [Google Scholar] [CrossRef] [PubMed] [Green Version]
- Ford, E.S.; Mokdad, A.H. Dietary Magnesium Intake in a National Sample of U.S. Adults. J. Nutr. 2003, 133, 2879–2882. [Google Scholar] [CrossRef] [Green Version]
- Cowan, A.; Jun, S.; Bhadra, A.; Dodd, K.; Dwyer, J.; Eicher-Miller, H.; Gahche, J.; Potischman, N.; Tooze, J.; Bailey, R. Dietary Supplements Contributed Substantially to Total Intakes and Nutritional Adequacy of Several Micronutrients among U.S. Adults, NHANES 2011–2014 (OR14-07-19). Curr. Dev. Nutr. 2019, 3. [Google Scholar] [CrossRef] [Green Version]
- U.S. Department of Agriculture; U.S. Department of Health and Human Services. Dietary Guidelines for Americans, 2010; U.S. Government Printing Office: Washington, DC, USA, 2010.
- Papanikolaou, Y.; Brooks, J.; Reider, C.; Fulgoni, V.L. Comparison of Inadequate Nutrient Intakes in Non-Hispanic Blacks vs. Non-Hispanic Whites: An Analysis of NHANES 2007–2010 in U.S. Children and Adults. J. Health Care Poor Underserved 2015, 26, 726–736. [Google Scholar] [CrossRef] [PubMed]
- Jun, S.; Cowan, A.E.; Bhadra, A.; Dodd, K.W.; Dwyer, J.T.; Eicher-Miller, H.A.; Gahche, J.J.; Guenther, P.M.; Potischman, N.; Tooze, J.A.; et al. Older Adults with Obesity Have Higher Risks of Some Micronutrient Inadequacies and Lower Overall Dietary Quality Compared to Peers with a Healthy Weight, National Health and Nutrition Examination Surveys (NHANES), 2011–2014. Public Health Nutr. 2020, 23, 2268–2279. [Google Scholar] [CrossRef]
- Liu, J.; Zhu, X.; Fulda, K.G.; Chen, S.; Tao, M.-H. Comparison of Dietary Micronutrient Intakes by Body Weight Status among Mexican-American and Non-Hispanic Black Women Aged 19–39 Years: An Analysis of NHANES 2003–2014. Nutrients 2019, 11, 2846. [Google Scholar] [CrossRef] [Green Version]
- Schuchardt, J.P.; Hahn, A. Intestinal Absorption and Factors Influencing Bioavailability of Magnesium- An Update. Curr. Nutr. Food Sci. 2017, 13. [Google Scholar] [CrossRef] [PubMed]
- Nielsen, F.H. The Problematic Use of Dietary Reference Intakes to Assess Magnesium Status and Clinical Importance. Biol. Trace Elem. Res. 2019, 188, 52–59. [Google Scholar] [CrossRef]
- Cheung, M.M.; DeLuccia, R.; Ramadoss, R.K.; Aljahdali, A.; Volpe, S.L.; Shewokis, P.A.; Sukumar, D. Low Dietary Magnesium Intake Alters Vitamin D—Parathyroid Hormone Relationship in Adults Who Are Overweight or Obese. Nutr. Res. 2019, 69, 82–93. [Google Scholar] [CrossRef]
- Reddy, P.; Edwards, L.R. Magnesium Supplementation in Vitamin D Deficiency. Am. J. Therapeut. 2019, 26, e124–e132. [Google Scholar] [CrossRef]
- Hunt, C.D.; Johnson, L.K. Magnesium Requirements: New Estimations for Men and Women by Cross-Sectional Statistical Analyses of Metabolic Magnesium Balance Data. Am. J. Clin. Nutr. 2006, 84, 843–852. [Google Scholar] [CrossRef] [Green Version]
- Rosanoff, A. Perspective: US Adult Magnesium Requirements Need Updating: Impacts of Rising Body Weights and Data-Derived Variance. Adv. Nutr. 2021, 12, 298–304. [Google Scholar] [CrossRef]
- Williamson, M.A.; Snyder, L.M.; Wallach, J.B. Wallach’s Interpretation of Diagnostic Tests, 9th ed.; Wolters Kluwer; Lippincott Williams & Wilkins: Philadelphia, PA, USA, 2011; Volume XVI. [Google Scholar]
- Lowenstein, F.W.; Stanton, M.F. Serum Magnesium Levels in the United States, 1971–1974. J. Am. Coll. Nutr. 1986, 5, 399–414. [Google Scholar] [CrossRef] [PubMed]
- Costello, R.B.; Elin, R.J.; Rosanoff, A.; Wallace, T.C.; Guerrero-Romero, F.; Hruby, A.; Lutsey, P.L.; Nielsen, F.H.; Rodriguez-Moran, M.; Song, Y.; et al. Perspective: The Case for an Evidence-Based Reference Interval for Serum Magnesium: The Time Has Come. Adv. Nutr. 2016, 7, 977–993. [Google Scholar] [CrossRef] [PubMed]
- Al Alwi, A.M.; Majoni, S.W.; Falhammar, H. Magnesium and Human Health: Perspectives and Research Directions. Int. J. Endocrinol. 2018, 2018, 1–17. [Google Scholar] [CrossRef] [PubMed] [Green Version]
- Costello, R.B.; Nielsen, F. Interpreting Magnesium Status to Enhance Clinical Care—Key Indicators. Curr. Opin. Clin. Nutr. Metab. Care 2018, 504–511. [Google Scholar] [CrossRef]
- Institute of Medicine. Evaluation of Biomarkers and Surrogate Endpoints in Chronic Disease; The National Academies Press: Washington, DC, USA, 2010; ISBN 978-0-309-15129-0. [Google Scholar]
- Zhang, X.; Xia, J.; Del Gobbo, L.C.; Hruby, A.; Dai, Q.; Song, Y. Serum Magnesium Concentrations and All-Cause, Cardiovascular, and Cancer Mortality among U.S. Adults: Results from the NHANES I Epidemiologic Follow-up Study. Clin. Nutr. 2018, 37, 1541–1549. [Google Scholar] [CrossRef] [Green Version]
- Bertinato, J.; Wang, K.; Hayward, S. Serum Magnesium Concentrations in the Canadian Population and Associations with Diabetes, Glycemic Regulation, and Insulin Resistance. Nutrients 2017, 9, 296. [Google Scholar] [CrossRef] [PubMed]
- Basiotis, P.P.; Welsh, S.O.; Cronin, F.J.; Kelsay, J.L.; Mertz, W. Number of Days of Food Intake Records Required to Estimate Individual and Group Nutrient Intakes with Defined Confidence. J. Nutr. 1987, 117, 1638–1641. [Google Scholar] [CrossRef]
- Rollo, M.E.; Williams, R.L.; Burrows, T.; Kirkpatrick, S.I.; Bucher, T.; Collins, C.E. What Are They Really Eating? A Review on New Approaches to Dietary Intake Assessment and Validation. Curr. Nutr. Rep. 2016, 5, 307–314. [Google Scholar] [CrossRef]
- Bush, C.L.; Blumberg, J.B.; El-Sohemy, A.; Minich, D.M.; Ordovás, J.M.; Reed, D.G.; Behm, V.A.Y. Toward the Definition of Personalized Nutrition: A Proposal by the American Nutrition Association. J. Am. Coll. Nutr. 2020, 39, 5–15. [Google Scholar] [CrossRef] [Green Version]
- Srinivasan, B.; Lee, S.; Erickson, D.; Mehta, S. Precision Nutrition—Review of Methods for Point-of-Care Assessment of Nutritional Status. Curr. Opin. Biotechnol. 2017, 44, 103–108. [Google Scholar] [CrossRef] [Green Version]


| Food Component | Life Stage | Dietary Intake Metric | Biochemical or Clinical Indicator | Associated Health Condition | Last DRI Review |
|---|---|---|---|---|---|
| Potassium 1 | ≥1 y, including pregnant or lactating women | % > AI | 24 h urinary excretion | Hypertension and cardiovascular disease | 2019 |
| Sodium | ≥1 y, including pregnant or lactating women | % > CDRR 2 | 24 h urinary excretion | Hypertension and cardiovascular disease | 2019 |
| Calcium 1 | ≥1 y, including pregnant or lactating women | % < EAR | No reliable biochemical marker exists | Impaired peak bone mass accrual; low bone mass and osteoporosis | 2011 |
| Vitamin D 1 | ≥1 y, including pregnant or lactating women | % < EAR | Serum 25(OH)D concentrations | Impaired peak bone mass accrual; low bone mass and osteoporosis | 2011 |
| Iron 1 | Infants fed human milk; adolescent, pre-menopausal, pregnant women | % < EAR | Serum ferritin, soluble transferrin receptor, hemoglobin | Iron deficiency and iron deficiency anemia | 2001 |
| Iodine | Pregnant women | % < EAR | Urinary iodine concentrations | Impaired neurocognitive development | 2001 |
| Folic Acid | Pregnant women, 1st trimester | % < EAR | Serum and red blood cell folate | Neural tube defects | 1998 |
| Criterion | Additional Information |
|---|---|
| Commonly used definition of the substance | Definition matches method of analysis |
| A method of analyzing the substance consistent with the definition | Preferably validated by multi-center analysis |
| Database of the amount of the nutrient or bioactive in food (and supplements) | Preferably global and regularly updated |
| Prospective Cohort studies | Both sexes and showing relationship between outcome and dietary intake, or preferably biochemical or clinical indicator |
| Clinical trials on digestion, absorption, transport, and excretion of the substance | Important to understand level of intake, factors affecting absorption, metabolism, and excretion |
| Clinical trials on efficacy and dose–response | Conducted in healthy populations with bioactive being measured along with accepted endpoint or biomarker |
| Safety data at anticipated level of intake | Should include data from special populations, e.g., children, pregnant or lactating women |
| Systematic reviews and/or meta-analyses showing efficacy | Required by IOM for setting DRI and inclusion in DGA recommendations |
| A plausible biological explanation for efficacy | Not required but nevertheless important |
Publisher’s Note: MDPI stays neutral with regard to jurisdictional claims in published maps and institutional affiliations. |
© 2021 by the authors. Licensee MDPI, Basel, Switzerland. This article is an open access article distributed under the terms and conditions of the Creative Commons Attribution (CC BY) license (https://creativecommons.org/licenses/by/4.0/).
Share and Cite
McBurney, M.I.; Blumberg, J.B.; Costello, R.B.; Eggersdorfer, M.; Erdman, J.W., Jr.; Harris, W.S.; Johnson, E.J.; Hazels Mitmesser, S.; Post, R.C.; Rai, D.; et al. Beyond Nutrient Deficiency—Opportunities to Improve Nutritional Status and Promote Health Modernizing DRIs and Supplementation Recommendations. Nutrients 2021, 13, 1844. https://doi.org/10.3390/nu13061844
McBurney MI, Blumberg JB, Costello RB, Eggersdorfer M, Erdman JW Jr., Harris WS, Johnson EJ, Hazels Mitmesser S, Post RC, Rai D, et al. Beyond Nutrient Deficiency—Opportunities to Improve Nutritional Status and Promote Health Modernizing DRIs and Supplementation Recommendations. Nutrients. 2021; 13(6):1844. https://doi.org/10.3390/nu13061844
Chicago/Turabian StyleMcBurney, Michael I., Jeffrey B. Blumberg, Rebecca B. Costello, Manfred Eggersdorfer, John W. Erdman, Jr., William S. Harris, Elizabeth J. Johnson, Susan Hazels Mitmesser, Robert C. Post, Deshanie Rai, and et al. 2021. "Beyond Nutrient Deficiency—Opportunities to Improve Nutritional Status and Promote Health Modernizing DRIs and Supplementation Recommendations" Nutrients 13, no. 6: 1844. https://doi.org/10.3390/nu13061844