
Association of Coffee Consumption and Its Types According to Addition of Sugar and Creamer with Metabolic Syndrome Incidence in a Korean Population from the Health Examinees (HEXA) Study

 , , , ,
  , ,
, , 
Abstract
:1. Introduction
2. Materials and Methods
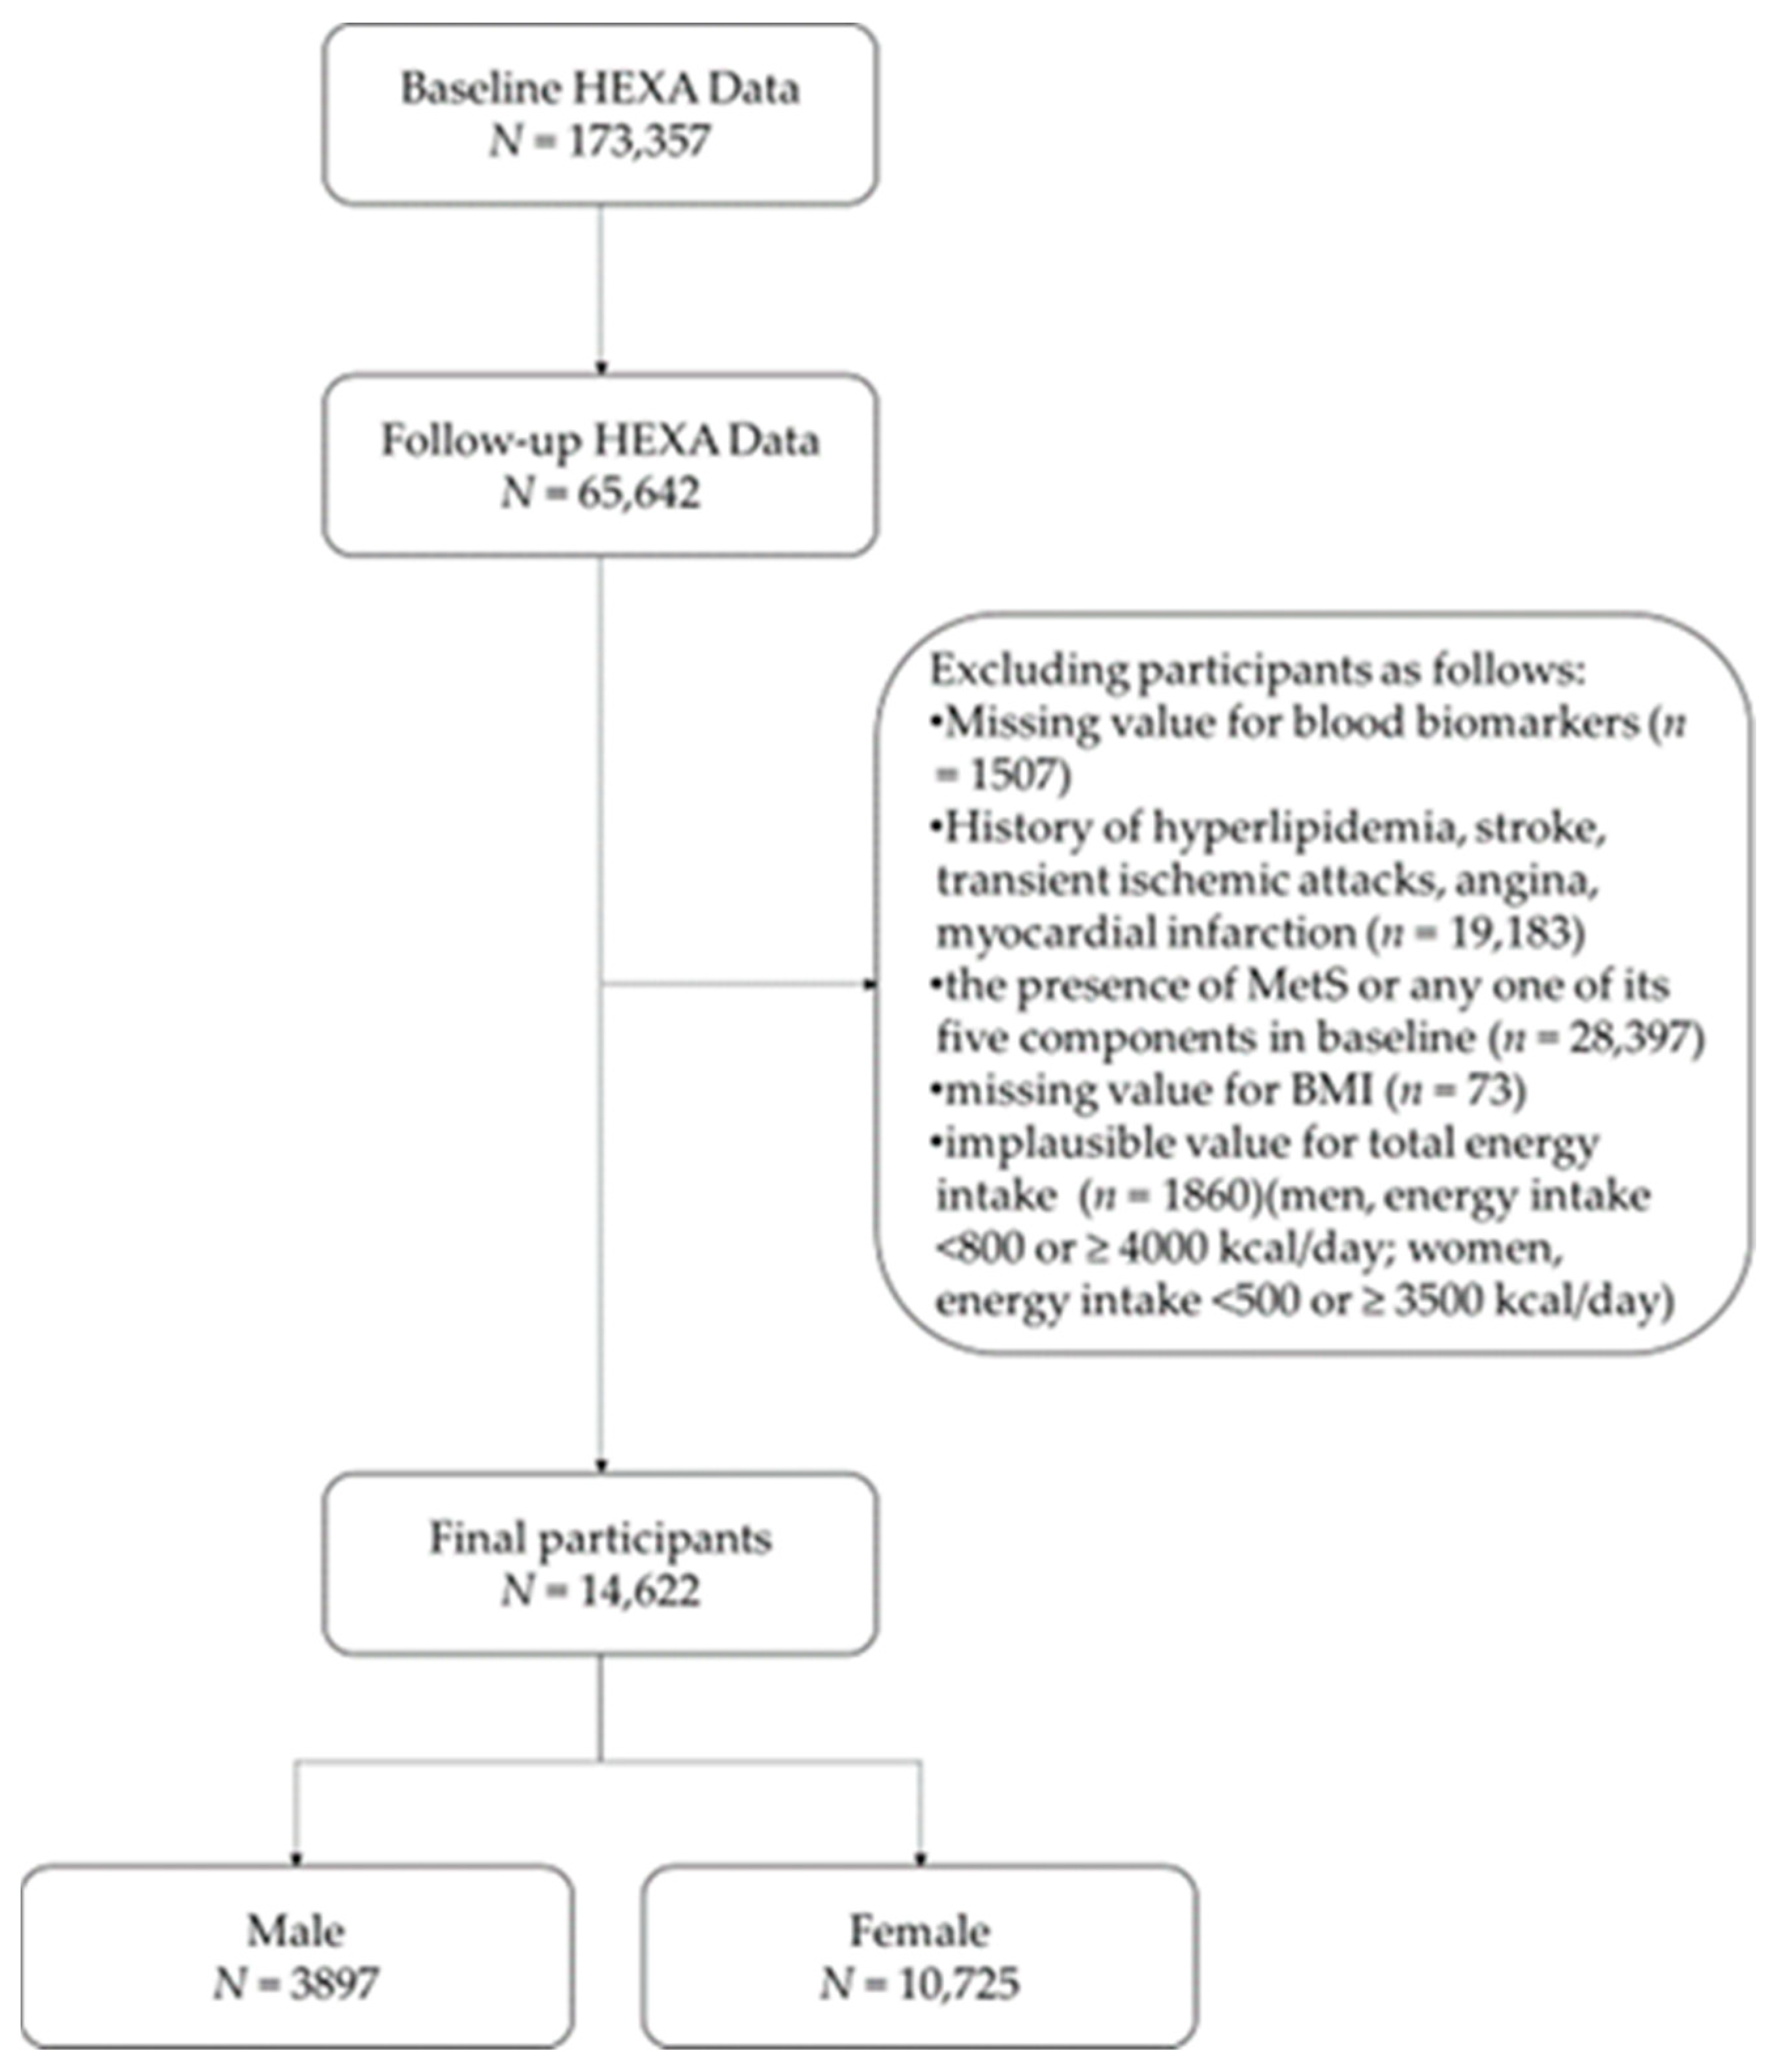
2.1. Study Population
2.2. Assessment of Coffee Consumption
2.3. Definition of Metabolic Syndrome
2.4. Other Variables
2.5. Statistical Analysis
3. Results
4. Discussion
5. Conclusions
Supplementary Materials
Author Contributions
Funding
Institutional Review Board Statement
Informed Consent Statement
Data Availability Statement
Acknowledgments
Conflicts of Interest
References
- International Coffee Organization. Coffee Market Report June 2016—Coffee Consumption Increases as Market Hits 14-Month High. Available online: http://www.ico.org/show_news.asp?id=553 (accessed on 4 January 2021).
- Lee, J.; Lee, J.E.; Kim, Y. Relationship between coffee consumption and stroke risk in Korean population: The Health Examinees (HEXA) Study. Nutr. J. 2017, 16, 7. [Google Scholar] [CrossRef] [Green Version]
- Nieber, K. The impact of coffee on health. Planta Med. 2017, 83, 1256–1263. [Google Scholar] [CrossRef] [PubMed] [Green Version]
- Martini, D.; Del Bo, C.; Tassotti, M.; Riso, P.; Del Rio, D.; Brighenti, F.; Porrini, M. Coffee Consumption and Oxidative Stress: A Review of Human Intervention Studies. Molecules 2016, 21, 979. [Google Scholar] [CrossRef] [PubMed] [Green Version]
- Clifford, M.N. Chlorogenic acids and other cinnamates—Nature, occurrence, dietary burden, absorption and metabolism. J. Sci. Food Agric. 2000, 80, 1033–1043. [Google Scholar] [CrossRef]
- Akash, M.S.; Rehman, K.; Chen, S. Effects of coffee on type 2 diabetes mellitus. Nutrition 2014, 30, 755–763. [Google Scholar] [CrossRef]
- Park, S.Y.; Freedman, N.D.; Haiman, C.A.; Le Marchand, L.; Wilkens, L.R.; Setiawan, V.W. Association of Coffee Consumption With Total and Cause-Specific Mortality Among Nonwhite Populations. Ann. Intern. Med. 2017, 167, 228–235. [Google Scholar] [CrossRef]
- Cory, H.; Passarelli, S.; Szeto, J.; Tamez, M.; Mattei, J. The Role of Polyphenols in Human Health and Food Systems: A Mini-Review. Front. Nutr. 2018, 5, 87. [Google Scholar] [CrossRef] [Green Version]
- Scalbert, A.; Manach, C.; Morand, C.; Remesy, C.; Jimenez, L. Dietary polyphenols and the prevention of diseases. Crit. Rev. Food Sci. Nutr. 2005, 45, 287–306. [Google Scholar] [CrossRef] [PubMed]
- Rezaianzadeh, A.; Namayandeh, S.M.; Sadr, S.M. National Cholesterol Education Program Adult Treatment Panel III Versus International Diabetic Federation Definition of Metabolic Syndrome, Which One is Associated with Diabetes Mellitus and Coronary Artery Disease? Int. J. Prev. Med. 2012, 3, 552–558. [Google Scholar]
- Lee, S.E.; Han, K.; Kang, Y.M.; Kim, S.O.; Cho, Y.K.; Ko, K.S.; Park, J.Y.; Lee, K.U.; Koh, E.H.; Taskforce Team of Diabetes Fact Sheet of the Korean Diabetes Association. Trends in the prevalence of metabolic syndrome and its components in South Korea: Findings from the Korean National Health Insurance Service Database (2009–2013). PLoS ONE 2018, 13, e0194490. [Google Scholar] [CrossRef] [Green Version]
- Jung, J.; Kim, A.S.; Ko, H.J.; Choi, H.I.; Hong, H.E. Association between Breakfast Skipping and the Metabolic Syndrome: The Korea National Health and Nutrition Examination Survey, 2017. Medicina (Kaunas) 2020, 56, 396. [Google Scholar] [CrossRef]
- Huh, J.H.; Kang, D.R.; Jang, J.Y.; Shin, J.H.; Kim, J.Y.; Choi, S.; Cho, E.J.; Park, J.S.; Sohn, I.S.; Jo, S.H.; et al. Metabolic syndrome epidemic among Korean adults: Korean survey of Cardiometabolic Syndrome (2018). Atherosclerosis 2018, 277, 47–52. [Google Scholar] [CrossRef]
- Heald, A.; Pendlebury, J.; Anderson, S.; Narayan, V.; Guy, M.; Gibson, M.; Haddad, P.; Livingston, M. Lifestyle factors and the metabolic syndrome in Schizophrenia: A cross-sectional study. Ann. Gen. Psychiatry 2017, 16, 12. [Google Scholar] [CrossRef] [Green Version]
- Perez-Martinez, P.; Mikhailidis, D.P.; Athyros, V.G.; Bullo, M.; Couture, P.; Covas, M.I.; de Koning, L.; Delgado-Lista, J.; Diaz-Lopez, A.; Drevon, C.A.; et al. Lifestyle recommendations for the prevention and management of metabolic syndrome: An international panel recommendation. Nutr. Rev. 2017, 75, 307–326. [Google Scholar] [CrossRef] [Green Version]
- Garralda-Del-Villar, M.; Carlos-Chilleron, S.; Diaz-Gutierrez, J.; Ruiz-Canela, M.; Gea, A.; Martinez-Gonzalez, M.A.; Bes-Rastrollo, M.; Ruiz-Estigarribia, L.; Kales, S.N.; Fernandez-Montero, A. Healthy Lifestyle and Incidence of Metabolic Syndrome in the SUN Cohort. Nutrients 2018, 11, 65. [Google Scholar] [CrossRef] [Green Version]
- Suliga, E.; Koziel, D.; Ciesla, E.; Rebak, D.; Gluszek, S. Dietary Patterns in Relation to Metabolic Syndrome among Adults in Poland: A Cross-Sectional Study. Nutrients 2017, 9, 1366. [Google Scholar] [CrossRef] [Green Version]
- Baspinar, B.; Eskici, G.; Ozcelik, A.O. How coffee affects metabolic syndrome and its components. Food Funct. 2017, 8, 2089–2101. [Google Scholar] [CrossRef]
- Hino, A.; Adachi, H.; Enomoto, M.; Furuki, K.; Shigetoh, Y.; Ohtsuka, M.; Kumagae, S.; Hirai, Y.; Jalaldin, A.; Satoh, A.; et al. Habitual coffee but not green tea consumption is inversely associated with metabolic syndrome: An epidemiological study in a general Japanese population. Diabetes Res. Clin. Pract. 2007, 76, 383–389. [Google Scholar] [CrossRef]
- Matsuura, H.; Mure, K.; Nishio, N.; Kitano, N.; Nagai, N.; Takeshita, T. Relationship between coffee consumption and prevalence of metabolic syndrome among Japanese civil servants. J. Epidemiol. 2012, 22, 160–166. [Google Scholar] [CrossRef] [Green Version]
- Lee, J.-S.; Park, H.-S.; Han, S.; Tana, G.; Chang, M.-J. Study on relationship between caffeine intake level and metabolic syndrome and related diseases in Korean adults: 2013~2016 Korea National Health and Nutrition Examination Survey. J. Nutr. Health 2019, 52, 227. [Google Scholar] [CrossRef]
- Shin, S.; Lim, J.; Lee, H.-W.; Kim, C.E.; Kim, S.-A.; Lee, J.-k.; Kang, D. Association between the prevalence of metabolic syndrome and coffee consumption among Korean adults: Results from the Health Examinees study. Appl. Physiol. Nutr. Metab. 2019, 44, 1371–1378. [Google Scholar] [CrossRef]
- Health Examinees Study Group. The Health Examinees (HEXA) study: Rationale, study design and baseline characteristics. Asian Pac. J. Cancer Prev. 2015, 16, 1591–1597. [Google Scholar] [CrossRef] [PubMed] [Green Version]
- Kim, S.; Song, S.; Kim, Y.S.; Yang, S.Y.; Lee, J.E. The association between predicted inflammatory status and colorectal adenoma. Sci. Rep. 2020, 10, 2433. [Google Scholar] [CrossRef] [PubMed] [Green Version]
- Ahn, Y.; Kwon, E.; Shim, J.E.; Park, M.K.; Joo, Y.; Kimm, K.; Park, C.; Kim, D.H. Validation and reproducibility of food frequency questionnaire for Korean genome epidemiologic study. Eur. J. Clin. Nutr. 2007, 61, 1435–1441. [Google Scholar] [CrossRef]
- Lee, Y.H.; Bang, H.; Park, Y.M.; Bae, J.C.; Lee, B.W.; Kang, E.S.; Cha, B.S.; Lee, H.C.; Balkau, B.; Lee, W.Y.; et al. Non-laboratory-based self-assessment screening score for non-alcoholic fatty liver disease: Development, validation and comparison with other scores. PLoS ONE 2014, 9, e107584. [Google Scholar] [CrossRef] [PubMed]
- Ministry of Food and Drug Safety. BMI Calculator. Available online: http://www.foodsafetykorea.go.kr/portal/healthyfoodlife/bmiCalcurator.do?menu_no=3071&menu_grp=MENU_NEW03 (accessed on 4 January 2021).
- Kim, Y.; Je, Y. Moderate coffee consumption is inversely associated with the metabolic syndrome in the Korean adult population. Br. J. Nutr. 2018, 120, 1279–1287. [Google Scholar] [CrossRef] [PubMed] [Green Version]
- Kim, S.A.; Shin, S. The Association between Coffee Consumption Pattern and Prevalence of Metabolic Syndrome in Korean Adults. Nutrients 2019, 11, 2992. [Google Scholar] [CrossRef] [Green Version]
- Shin, H.; Linton, J.A.; Kwon, Y.; Jung, Y.; Oh, B.; Oh, S. Relationship between Coffee Consumption and Metabolic Syndrome in Korean Adults: Data from the 2013–2014 Korea National Health and Nutrition Examination Survey. Korean J. Fam. Med. 2017, 38, 346–351. [Google Scholar] [CrossRef] [Green Version]
- Uto-Kondo, H.; Ayaori, M.; Ogura, M.; Nakaya, K.; Ito, M.; Suzuki, A.; Takiguchi, S.; Yakushiji, E.; Terao, Y.; Ozasa, H.; et al. Coffee consumption enhances high-density lipoprotein-mediated cholesterol efflux in macrophages. Circ. Res. 2010, 106, 779–787. [Google Scholar] [CrossRef] [PubMed] [Green Version]
- Ihim, A.C.; Nwanua, M.I.; Ogbodo, E.C.; Meludu, S.C. Effect of Coffee Consumption on Blood Glucose and Lipid Profile Levels in Male Students at Nnamdi Azikiwe University, Nnewi Campus, Anambra State. J. Med. Lab. Sci. 2019, 29, 10–20. [Google Scholar]
- Kempf, K.; Herder, C.; Erlund, I.; Kolb, H.; Martin, S.; Carstensen, M.; Koenig, W.; Sundvall, J.; Bidel, S.; Kuha, S.; et al. Effects of coffee consumption on subclinical inflammation and other risk factors for type 2 diabetes: A clinical trial. Am. J. Clin. Nutr. 2010, 91, 950–957. [Google Scholar] [CrossRef] [Green Version]
- Ricci, E.; Vigano, P.; Cipriani, S.; Somigliana, E.; Chiaffarino, F.; Bulfoni, A.; Parazzini, F. Coffee and caffeine intake and male infertility: A systematic review. Nutr. J. 2017, 16, 37. [Google Scholar] [CrossRef] [Green Version]
- Salazar-Martinez, E.; Willett, W.C.; Ascherio, A.; Manson, J.E.; Leitzmann, M.F.; Stampfer, M.J.; Hu, F.B. Coffee Consumption and Risk for Type 2 Diabetes Mellitus. Ann. Intern. Med. 2004, 140, 1–8. [Google Scholar] [CrossRef]
- Zhang, Z.; Jiang, Y.; Zhou, Z.; Huang, J.; Chen, S.; Zhou, W.; Yang, Q.; Bai, H.; Zhang, H.; Ben, J.; et al. Scavenger receptor A1 attenuates aortic dissection via promoting efferocytosis in macrophages. Biochem. Pharmacol. 2019, 168, 392–403. [Google Scholar] [CrossRef]
- Mirmiran, P.; Carlstrom, M.; Bahadoran, Z.; Azizi, F. Long-term effects of coffee and caffeine intake on the risk of pre-diabetes and type 2 diabetes: Findings from a population with low coffee consumption. Nutr. Metab. Cardiovasc. Dis. 2018, 28, 1261–1266. [Google Scholar] [CrossRef]
- van Dam, R.M.; Dekker, J.M.; Nijpels, G.; Stehouwer, C.D.; Bouter, L.M.; Heine, R.J.; Hoorn, S. Coffee consumption and incidence of impaired fasting glucose, impaired glucose tolerance, and type 2 diabetes: The Hoorn Study. Diabetologia 2004, 47, 2152–2159. [Google Scholar] [CrossRef] [Green Version]
- Moisey, L.L.; Kacker, S.; Bickerton, A.C.; Robinson, L.E.; Graham, T.E. Caffeinated coffee consumption impairs blood glucose homeostasis in response to high and low glycemic index meals in healthy men. Am. J. Clin. Nutr. 2008, 87, 1254–1261. [Google Scholar] [CrossRef] [PubMed]
- Robertson, T.M.; Clifford, M.N.; Penson, S.; Williams, P.; Robertson, M.D. Postprandial glycaemic and lipaemic responses to chronic coffee consumption may be modulated by CYP1A2 polymorphisms. Br. J. Nutr. 2018, 119, 792–800. [Google Scholar] [CrossRef] [PubMed] [Green Version]
- Gunes, A.; Dahl, M.L. Variation in CYP1A2 activity and its clinical implications: Influence of environmental factors and genetic polymorphisms. Pharmacogenomics 2008, 9, 625–637. [Google Scholar] [CrossRef] [PubMed]
- Hattori, T.; Konno, S.; Munakata, M. Gender Differences in Lifestyle Factors Associated with Metabolic Syndrome and Preliminary Metabolic Syndrome in the General Population: The Watari Study. Intern. Med. 2017, 56, 2253–2259. [Google Scholar] [CrossRef] [PubMed] [Green Version]
- Yu, S.; Guo, X.; Li, G.; Yang, H.; Sun, G.; Zheng, L.; Sun, Y. Gender discrepancy of incidence and risk factors of metabolic syndrome among rural Chinese from 2012–2013 to 2015–2017. Diabetol. Metab. Syndr. 2020, 12, 48. [Google Scholar] [CrossRef]
- Rhee, J.J.; Qin, F.; Hedlin, H.K.; Chang, T.I.; Bird, C.E.; Zaslavsky, O.; Manson, J.E.; Stefanick, M.L.; Winkelmayer, W.C. Coffee and caffeine consumption and the risk of hypertension in postmenopausal women. Am. J. Clin. Nutr. 2016, 103, 210–217. [Google Scholar] [CrossRef] [Green Version]
- Lee, J.; Kim, H.Y.; Kim, J. Coffee Consumption and the Risk of Obesity in Korean Women. Nutrients 2017, 9, 1340. [Google Scholar] [CrossRef] [PubMed] [Green Version]
- Je, Y.; Jeong, S.; Park, T. Coffee consumption patterns in Korean adults: The Korean National Health and Nutrition Examination Survey (2001–2011). Asia Pac. J. Clin. Nutr. 2014, 23, 691–702. [Google Scholar] [CrossRef] [PubMed]
- Park, Y.; Oh, Y. Coffee Market Brief Update; USDA Foreign Agricultural Service: Washington, DC, USA, 2013. [Google Scholar]
- Kim, H.; Kim, Y.J.; Lim, Y.; Kwon, O. Association of coffee consumption with health-related quality of life and metabolic syndrome in Korean adults: Based on 2013~2016 Korea National Health and Nutrition Examination Survey. J. Nutr. Health 2018, 51, 538. [Google Scholar] [CrossRef]
- Lee, B.-E.; Lee, H.-J.; Cho, E.-A.; Hwang, K.-T. Fatty Acid Compositions of Fats in Commercial Coffee Creamers and Instant Coffee Mixes and Their Sensory Characteristics. J. Korean Soc. Food Sci. Nutr. 2012, 41, 362–368. [Google Scholar] [CrossRef]
- Santos, H.O.; Howell, S.; Earnest, C.P.; Teixeira, F.J. Coconut oil intake and its effects on the cardiometabolic profile—A structured literature review. Prog. Cardiovasc. Dis. 2019, 62, 436–443. [Google Scholar] [CrossRef]
- Kander, M.C.; Cui, Y.; Liu, Z. Gender difference in oxidative stress: A new look at the mechanisms for cardiovascular diseases. J. Cell Mol. Med. 2017, 21, 1024–1032. [Google Scholar] [CrossRef]
- Yeasmin, N.; Akhter, Q.S.; Mahmuda, S.; Banu, N.; Yeasmin, S.; Akhter, S.; Nahar, S. Association of Hypertension with Serum Estrogen Level in Postmenopausal Women. Mymensingh Med. J. 2017, 26, 635–641. [Google Scholar] [PubMed]
- Nurminen, M.L.; Niittynen, L.; Korpela, R.; Vapaatalo, H. Coffee, caffeine and blood pressure: A critical review. Eur. J. Clin. Nutr. 1999, 53, 831–839. [Google Scholar] [CrossRef] [Green Version]


| Coffee Type | |||||
|---|---|---|---|---|---|
| None | Black | 3-in-1 | Others | p Value | |
| Men (N = 3897) | |||||
| N (incidence %) | 276 (3.99%) | 90 (3.33%) | 610 (5.41%) | 2921 (5.20%) | |
| Age (years) | 55.69 ± 0.50 a | 53.94 ± 0.94 b | 52.37 ± 0.33 c | 53.71 ± 0.16 bc | 0.0006 |
| 40–49 | 68 (5.16%) | 31 (2.35%) | 243 (18.42%) | 977 (74.07%) | 0.0004 |
| 50–59 | 107 (7.28%) | 31 (2.11%) | 233 (15.86%) | 1098 (74.74%) | |
| 60–69 | 95 (9.07%) | 26 (2.48%) | 127 (12.13%) | 799 (76.31%) | |
| 70–79 | 6 (9.68%) | 2 (3.23%) | 7 (11.29%) | 47 (75.81%) | |
| BMI (kg/m2) | 21.85 ± 0.13 b | 22.89 ± 0.22 a | 22.91 ± 0.09 a | 22.68 ± 0.04 a | <0.0001 |
| <18.5 | 23 (8.33%) | 2 (2.22%) | 15 (2.46%) | 95 (3.25%) | <0.0001 |
| 18.5–25 | 227 (82.25%) | 80 (88.89%) | 472 (77.38%) | 2328 (79.70%) | |
| ≥25 | 26 (9.42%) | 8 (8.89%) | 123 (20.16%) | 498 (17.05%) | |
| Waist circumference (cm) | 79.00 ± 0.36 b | 80.37 ± 0.54 a | 80.84 ± 0.21 a | 80.37 ± 0.10 a | 0.0003 |
| Smoking | <0.0001 | ||||
| Non-smoker | 145 (52.54%) | 34 (37.78%) | 223 (36.56%) | 982 (33.62%) | |
| Past smoker | 110 (39.86%) | 32 (35.56%) | 223 (36.56%) | 1132 (38.75%) | |
| Current smoker | 18 (6.52%) | 24 (26.67%) | 162 (26.56%) | 795 (27.22%) | |
| Physical activity (yes, %) | 128 (46.38%) | 38 (42.22%) | 244 (40.00%) | 1142 (39.10%) | 0.1440 |
| Educational level | <0.0001 | ||||
| Under middle school | 49 (17.75%) | 17 (18.89%) | 65 (10.66%) | 627 (21.47%) | |
| High school | 106 (38.41%) | 33 (36.67%) | 208 (34.10%) | 1118 (38.27%) | |
| College or above | 117 (42.39%) | 40 (44.44%) | 333 (54.59%) | 1149 (39.34%) | |
| Alcohol consumption (yes, %) | 150 (54.35%) | 64 (71.11%) | 472 (77.38%) | 2112 (72.30%) | <0.0001 |
| Biomarkers | |||||
| TG (mg/dL) | 83.42 ± 1.72 b | 91.16 ± 3.34 a | 88.48 ± 1.15 ab | 87.94 ± 0.56 ab | 0.1802 |
| HDL-C (mg/dL) | 54.80 ± 0.69 a | 55.12 ± 1.15 a | 55.21 ± 0.41 a | 54.60 ± 0.20 a | 0.6240 |
| FPG (mg/dL) | 87.92 ± 0.42 a | 88.06 ± 0.82 a | 87.95 ± 0.28 a | 88.28 ± 0.12 a | 0.5657 |
| SBP (mmHg) | 115.05 ± 0.51 a | 114.59 ± 0.86 a | 114.91 ± 0.34 a | 114.74 ± 0.16 a | 0.8810 |
| DBP (mmHg) | 72.53 ± 0.42 a | 72.37 ± 0.66 a | 72.79 ± 0.27 a | 72.18 ± 0.13 a | 0.3093 |
| Women (N = 10,725) | |||||
| N (incidence %) | 1119 (3.13%) | 548 (2.55%) | 1130 (2.39%) | 7928 (3.33%) | |
| Age (years) | 52.37 ± 0.21 a | 48.63 ± 0.29 bc | 48.44 ± 0.19 c | 49.08 ± 0.07 b | <0.0001 |
| 40–49 | 401 (6.95%) | 319 (5.53%) | 669 (11.60%) | 4379 (75.92%) | <0.0001 |
| 50–59 | 523 (12.93%) | 184 (4.55%) | 390 (9.64%) | 2948 (72.88%) | |
| 60–69 | 188 (21.20%) | 44 (4.96%) | 68 (7.67%) | 587 (66.18%) | |
| 70–79 | 7 (28.00%) | 1 (4.00%) | 3 (12.00%) | 14 (56.00%) | |
| BMI (kg/m2) | 21.20 ± 0.06 c | 21.62 ± 0.08 b | 21.90 ± 0.06 a | 21.74 ± 0.02 ab | <0.0001 |
| <18.5 | 97 (8.67%) | 24 (4.38%) | 35 (3.10%) | 382 (4.82%) | <0.0001 |
| 18.5–25 | 980 (87.58%) | 487 (88.87%) | 985 (87.17%) | 6902 (87.06%) | |
| ≥25 | 42 (3.75%) | 37 (6.75%) | 110 (9.73%) | 644 (8.12%) | |
| Waist circumference (cm) | 71.59 ± 0.15 b | 80.37 ± 0.54 b | 72.13 ± 0.14 a | 71.83 ± 0.05 ab | 0.0046 |
| Smoking status | 0.0005 | ||||
| Non-smoker | 1107 (98.93%) | 523 (95.44%) | 1104 (97.70%) | 7670 (96.75%) | |
| Past smoker | 5 (0.45%) | 10 (1.82%) | 5 (0.44%) | 78 (0.98%) | |
| Current smoker | 5 (0.45%) | 13 (2.37%) | 20 (1.77%) | 140 (1.77%) | |
| Physical activity (yes, %) | 476 (42.54%) | 233 (42.52%) | 413 (36.55%) | 3155 (39.80%) | 0.0092 |
| Educational level | <0.0001 | ||||
| Under middle school | 339 (30.29%) | 106 (19.34%) | 155 (13.72%) | 1619 (20.42%) | |
| High school | 492 (43.97%) | 267 (48.72%) | 561 (49.65%) | 3933 (49.61%) | |
| College or above | 272 (24.31%) | 174 (31.75%) | 405 (35.84%) | 2316 (29.21%) | |
| Alcohol consumption (yes, %) | 174 (15.55%) | 232 (42.34%) | 466 (41.24%) | 3032 (38.24%) | <0.0001 |
| Biomarkers | |||||
| TG (mg/dL) | 77.43 ± 0.84 a | 74.07 ± 1.09 b | 73.31 ± 0.84 b | 74.91 ± 0.31 b | 0.0636 |
| HDL-C (mg/dL) | 63.41 ± 0.31 b | 64.83 ± 0.46 a | 64.06 ± 0.31 ab | 64.20 ± 0.12 ab | 0.3941 |
| FPG (mg/dL) | 86.13 ± 0.21 a | 86.00 ± 0.29 a | 85.86 ± 0.20 a | 86.02 ± 0.08 a | 0.8706 |
| SBP (mmHg) | 111.63 ± 0.30 a | 110.99 ± 0.40 ab | 110.64 ± 0.28 b | 111.15 ± 0.11 ab | 0.3168 |
| DBP (mmHg) | 69.66 ± 0.22 a | 68.79 ± 0.30 b | 69.45 ± 0.22 a | 69.47 ± 0.08 a | 0.1263 |
| Coffee Consumption, Cups/Day | p for Trend | ||||
|---|---|---|---|---|---|
| 0 | ≤1 | 1–3 | >3 | ||
| Men (N = 3897) | 276 | 1071 | 1853 | 697 | |
| Median, range (cups/day) | 0, 0–0 | 0.75, 0.01–1.00 | 1.50, 1.04–3.00 | 3.50, 3.25–8.50 | |
| MetS | 11 (3.99%) | 53 (4.95%) | 101 (5.45%) | 34 (4.88%) | |
| Ref | 0.771 (0.399–1.491) | 0.823 (0.437–1.550) | 0.620 (0.305–1.258) | 0.1844 | |
| Abdominal obesity | 16 (5.80%) | 78 (7.28%) | 188 (10.15%) | 68 (9.76%) | |
| Ref | 0.870 (0.503–1.504) | 1.207 (0.717–2.031) | 1.120 (0.634–1.978) | 0.3118 | |
| High triglyceride | 24 (8.70%) | 123 (11.48%) | 263 (14.19%) | 101 (14.49%) | |
| Ref | 0.975 (0.628–1.514) | 1.117 (0.732–1.704) | 0.987 (0.625–1.559) | 0.8609 | |
| High blood pressure | 66 (23.91%) | 258 (24.09%) | 475 (25.63%) | 165 (23.67%) | |
| Ref | 0.788 (0.600–1.035) | 0.874 (0.673–1.136) | 0.855 (0.636–1.149) | 0.9718 | |
| Low HDL-cholesterol | 18 (6.52%) | 41 (3.83%) | 74 (3.99%) | 36 (5.16%) | |
| Ref | 0.445 (0.254–0.780) | 0.507 (0.299–0.859) | 0.611 (0.335–1.113) | <0.0001 | |
| High fasting plasma glucose | 78 (28.26%) | 271 (25.30%) | 505 (27.25%) | 192 (27.55%) | |
| 0.694 (0.538–0.895) | 0.763 (0.598–0.972) | 0.783 (0.596–1.030) | 0.9599 | ||
| Women (N = 10,725) | 1119 | 3390 | 5234 | 982 | |
| Median, range (cups/day) | 0, 0–0 | 0.75, 0.01–1.00 | 1.50, 1.07–3.00 | 3.50, 3.25–8.50 | |
| MetS | 35 (3.13%) | 99 (2.92%) | 171 (3.27%) | 35 (3.56%) | |
| Ref | 0.703 (0.475–1.041) | 0.935 (0.639–1.367) | 1.200 (0.730–1.972) | 0.0509 | |
| Abdominal obesity | 164 (14.66%) | 624 (18.41%) | 985 (18.82%) | 192 (19.55%) | |
| Ref | 0.974 (0.818–1.159) | 1.108 (0.934–1.315) | 1.234 (0.992–1.535) | 0.0043 | |
| High triglyceride | 96 (8.58%) | 277 (8.17%) | 377 (7.20%) | 58 (5.91%) | |
| Ref | 0.838 (0.662–1.061) | 0.850 (0.673–1.074) | 0.720 (0.511–1.013) | 0.1173 | |
| High blood pressure | 160 (14.30%) | 463 (13.66%) | 739 (14.12%) | 160 (16.29%) | |
| Ref | 0.885 (0.737–1.062) | 1.151 (0.964–1.374) | 1.588 (1.260–2.000) | <0.0001 | |
| Low HDL-cholesterol | 83 (7.42%) | 233 (6.87%) | 348 (6.65%) | 55 (5.60%) | |
| Ref | 0.828 (0.642–1.068) | 0.977 (0.762–1.252) | 0.883 (0.618–1.261) | 0.8671 | |
| High fasting plasma glucose | 135 (12.06%) | 451 (13.30%) | 697 (13.32%) | 145 (14.77%) | |
| Ref | 1.027 (0.845–1.248) | 1.248 (1.032–1.510) | 1.526 (1.193–1.953) | <0.0001 | |
| COFFEE TYPE | ||||
|---|---|---|---|---|
| None | Black | 3-in-1 | Others | |
| Men (N = 3897) | 276 | 90 | 610 | 2921 |
| MetS | 11 (3.99%) | 3 (3.33%) | 33 (5.41%) | 152 (5.20%) |
| Ref | 0.649 (0.179–2.357) | 0.806 (0.398–1.635) | 0.776 (0.416–1.448) | |
| Abdominal obesity | 16 (5.80%) | 6 (6.67%) | 52 (8.52%) | 276 (9.45%) |
| Ref | 1.001 (0.388–2.583) | 1.011 (0.566–1.807) | 1.093 (0.654–1.826) | |
| High triglyceride | 24 (8.70%) | 14 (15.56%) | 82 (13.44%) | 391 (13.39%) |
| Ref | 1.609 (0.829–3.121) | 1.040 (0.654–1.654) | 1.038 (0.685–1.574) | |
| High blood pressure | 66 (23.91%) | 30 (33.33%) | 148 (24.26%) | 720 (24.65%) |
| Ref | 1.519 (0.984–2.343) | 0.848 (0.630–1.142) | 0.823 (0.637–1.063) | |
| Low HDL-cholesterol | 18 (6.52%) | 7 (7.78%) | 19 (3.11%) | 125 (4.28%) |
| Ref | 1.358 (0.561–3.288) | 0.423 (0.218–0.824) | 0.493 (0.298–0.817) | |
| High fasting plasma glucose | 78 (28.26%) | 24 (26.67%) | 147 (24.10%) | 797 (27.29%) |
| Ref | 1.008 (0.637–1.596) | 0.659 (0.497–0.874) | 0.749 (0.592–0.949) | |
| Women (N = 10,725) | 1119 | 548 | 1130 | 7928 |
| MetS | 35 (3.13%) | 14 (2.55%) | 27 (2.39%) | 264 (3.33%) |
| Ref | 0.652 (0.335–1.269) | 0.653 (0.390–1.093) | 0.864 (0.600–1.243) | |
| Abdominal obesity | 164 (14.66%) | 91 (16.61%) | 212 (18.76%) | 1498 (18.90%) |
| Ref | 0.946 (0.721–1.240) | 1.077 (0.874–1.327) | 1.055 (0.895–1.244) | |
| High triglyceride | 96 (8.58%) | 35 (6.39%) | 79 (6.99%) | 598 (7.54%) |
| Ref | 0.952 (0.642–1.411) | 0.798 (0.588–1.084) | 0.836 (0.670–1.045) | |
| High blood pressure | 160 (14.30%) | 77 (14.05%) | 165 (14.60%) | 1120 (14.13%) |
| Ref | 1.442 (1.094–1.900) | 1.111 (0.888–1.388) | 1.019 (0.860–1.208) | |
| Low HDL-cholesterol | 83 (7.42%) | 32 (5.84%) | 72 (6.37%) | 532 (6.71%) |
| Ref | 1.085 (0.717–1.641) | 0.895 (0.647–1.237) | 0.894 (0.705–1.135) | |
| High fasting plasma glucose | 135 (12.06%) | 73 (13.32%) | 142 (12.57%) | 1078 (13.60%) |
| Ref | 1.558 (1.167–2.081) | 1.102 (0.866–1.403) | 1.147 (0.955–1.378) | |
| Non–Non | Non–Coffee | Coffee–Non | Coffee–Coffee | |
|---|---|---|---|---|
| Men (N = 3897) | 276 | 262 | 200 | 3159 |
| MetS | 11 (3.99%) | 18 (6.87%) | 11 (5.50%) | 159 (5.03%) |
| Ref | 1.241 (0.582–2.649) | 0.941 (0.397–2.229) | 0.724 (0.388–1.354) | |
| Abdominal obesity | 16 (5.80%) | 22 (8.40%) | 13 (6.50%) | 299 (9.47%) |
| Ref | 1.208 (0.629–2.321) | 0.895 (0.421–1.904) | 1.085 (0.648–1.815) | |
| High triglyceride | 24 (8.70%) | 35 (13.36%) | 23 (11.50%) | 429 (13.58%) |
| Ref | 1.063 (0.631–1.791) | 1.063 (0.599–1.888) | 1.048 (0.691–1.589) | |
| High blood pressure | 66 (23.91%) | 67 (25.57%) | 50 (25.00%) | 781 (24.72%) |
| Ref | 0.745 (0.529–1.049) | 0.839 (0.578–1.217) | 0.853 (0.660–1.101) | |
| Low HDL-cholesterol | 18 (6.52%) | 9 (3.44%) | 13 (6.50%) | 129 (4.08%) |
| Ref | 0.379 (0.169–0.849) | 0.832 (0.405–1.709) | 0.488 (0.293–0.811) | |
| High fasting plasma glucose | 78 (28.26%) | 73 (27.86%) | 47 (23.50%) | 848 (26.84%) |
| Ref | 0.683 (0.495–0.941) | 0.665 (0.461–0.959) | 0.754 (0.595–0.955) | |
| Women (N = 10,725) | 1119 | 697 | 729 | 8180 |
| MetS | 35 (3.13%) | 19 (2.73%) | 23 (3.16%) | 263 (3.22%) |
| Ref | 0.715 (0.408–1.251) | 0.821 (0.483–1.396) | 0.856 (0.593–1.237) | |
| Abdominal obesity | 164 (14.66%) | 127 (18.22%) | 129 (17.70%) | 1545 (18.89%) |
| Ref | 1.027 (0.814–1.295) | 1.000 (0.792–1.261) | 1.064 (0.902–1.257) | |
| High triglyceride | 96 (8.58%) | 61 (8.75%) | 55 (7.54%) | 596 (7.29%) |
| Ref | 0.943 (0.683–1.301) | 0.761 (0.545–1.062) | 0.834 (0.666–1.043) | |
| High blood pressure | 160 (14.30%) | 103 (14.78%) | 108 (14.81%) | 1151 (14.07%) |
| Ref | 0.978 (0.763–1.254) | 0.935 (0.732–1.195) | 1.070 (0.901–1.270) | |
| Low HDL-cholesterol | 83 (7.42%) | 44 (6.31%) | 54 (7.41%) | 538 (6.58%) |
| Ref | 0.812 (0.563–1.172) | 0.885 (0.627–1.249) | 0.916 (0.720–1.164) | |
| High fasting plasma glucose | 135 (12.06%) | 94 (13.49%) | 100 (13.72%) | 1099 (13.44%) |
| Ref | 1.084 (0.832–1.412) | 1.022 (0.788–1.325) | 1.189 (0.988–1.430) |
Publisher’s Note: MDPI stays neutral with regard to jurisdictional claims in published maps and institutional affiliations. |
© 2021 by the authors. Licensee MDPI, Basel, Switzerland. This article is an open access article distributed under the terms and conditions of the Creative Commons Attribution (CC BY) license (http://creativecommons.org/licenses/by/4.0/).
Share and Cite
Tan, L.-J.; Jeon, H.J.; Park, S.; Kim, S.-A.; Lim, K.; Chung, S.; Chang, P.-S.; Lee, J.-k.; Kang, D.; Shin, S. Association of Coffee Consumption and Its Types According to Addition of Sugar and Creamer with Metabolic Syndrome Incidence in a Korean Population from the Health Examinees (HEXA) Study. Nutrients 2021, 13, 920. https://doi.org/10.3390/nu13030920
Tan L-J, Jeon HJ, Park S, Kim S-A, Lim K, Chung S, Chang P-S, Lee J-k, Kang D, Shin S. Association of Coffee Consumption and Its Types According to Addition of Sugar and Creamer with Metabolic Syndrome Incidence in a Korean Population from the Health Examinees (HEXA) Study. Nutrients. 2021; 13(3):920. https://doi.org/10.3390/nu13030920
Chicago/Turabian StyleTan, Li-Juan, Hye Joo Jeon, SoHyun Park, Seong-Ah Kim, Kyungjoon Lim, Sangwon Chung, Pahn-Shick Chang, Jong-koo Lee, Daehee Kang, and Sangah Shin. 2021. "Association of Coffee Consumption and Its Types According to Addition of Sugar and Creamer with Metabolic Syndrome Incidence in a Korean Population from the Health Examinees (HEXA) Study" Nutrients 13, no. 3: 920. https://doi.org/10.3390/nu13030920