Australian Consumers Are Willing to Pay for the Health Star Rating Front-of-Pack Nutrition Label

 , , , , , and
Abstract
:1. Introduction
2. Materials and Methods
2.1. Data Collection
2.2. Willingness to Pay
2.3. Ethics
3. Results
4. Discussion
4.1. Study Limitations
4.2. Policy Implications
5. Conclusions
Author Contributions
Funding
Acknowledgments
Conflicts of Interest
Appendix A
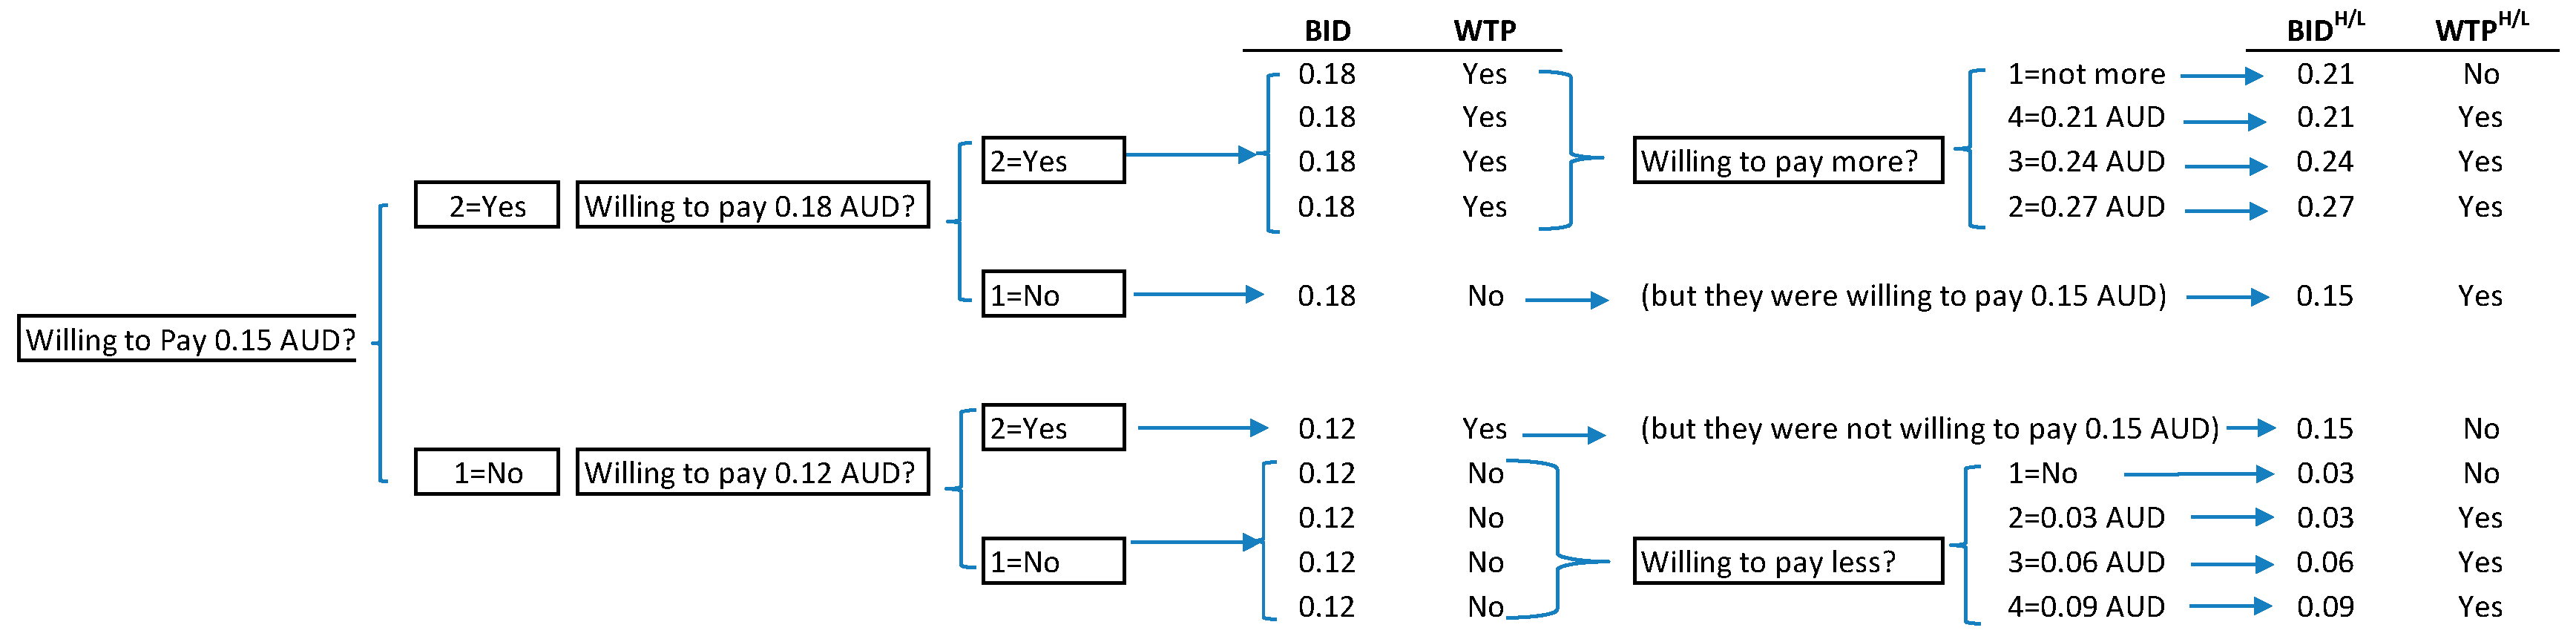
| Q1: Since there are costs to the manufacturers to test and determine the star rating of each food product, would you be willing to pay more for having a health star rating at the front of the food package? Suppose the price of the box of cookies without the health star rating is $3, would you be willing to pay an additional 5% (or 15c) for the same product with the health star rating? | |||
| Yes | No | ||
| Q2: Given that you would pay an additional 5% (or 15c) for the same product with the health star rating, would you be willing to pay a little bit more, say 6% (or 18c)? | Q2: Given that you would not pay an additional 5% (or 15c) for the same product with the health star rating, would you be willing to pay a little bit less, say 4% (or 12c)? | ||
| Yes | No | Yes | No |
| Q3: How much would you be willing to pay for the additional health star rating? 7% (or 21c) 8% (or 24c) 9% (or 27c) Not willing to pay more | Q3: How much extra would you be willing to pay? 3% (or 9c) 2% (or 6c) 1% (or 3c) Not willing to pay more | ||
References
- Cecchini, M.; Warin, L. Impact of food labelling systems on food choices and eating behaviours: A systematic review and meta-analysis of randomized studies. Obes. Rev. 2016, 17, 201–210. [Google Scholar] [CrossRef]
- Institute of Medicine. Front-of-Package Nutrition Rating Systems and Symbols: Promoting Healthier Choices; The National Academies Press: Washington, DC, USA, 2012; p. 180. [Google Scholar] [CrossRef]
- Hawkes, C.; Smith, T.G.; Jewell, J.; Wardle, J.; Hammond, R.A.; Friel, S.; Thow, A.M.; Kain, J. Smart food policies for obesity prevention. Lancet 2015, 385, 2410–2421. [Google Scholar] [CrossRef]
- Webster, J.; Trieu, K.; Dunford, E.; Nowson, C.; Jolly, K.A.; Greenland, R.; Reimers, J.; Bolam, B. Salt reduction in Australia: From advocacy to action. Cardiovasc. Diagn. Ther. 2015, 5, 207–218. [Google Scholar] [CrossRef]
- Institute of Medicine. Front-of-Package Nutrition Rating Systems and Symbols: Phase I Report; The National Academies Press: Washington, DC, USA, 2010; p. 140. [Google Scholar] [CrossRef]
- Louie, J.C.; Flood, V.; Rangan, A.; Hector, D.J.; Gill, T. A comparison of two nutrition signposting systems for use in Australia. N. S. W. Public Health Bull. 2008, 19, 121–126. [Google Scholar] [CrossRef] [PubMed]
- Hamlin, R.; McNeill, L. Does the Australasian “Health Star Rating” Front of Pack Nutritional Label System Work? Nutrients 2016, 8, 327. [Google Scholar] [CrossRef] [PubMed] [Green Version]
- Australian Government Department of Health. Health Star Rating System. Available online: http://www.healthstarrating.gov.au/ (accessed on 24 October 2019).
- Mpconsulting. Health Star Rating System: Five Year Review Report. Available online: http://www.healthstarrating.gov.au/internet/healthstarrating/publishing.nsf/Content/formal-review-of-the-system-after-five-years (accessed on 22 March 2020).
- World Health Organisation. Nutrition Topics: Nutrient Profiling. Available online: http://www.who.int/nutrition/topics/profiling/en/ (accessed on 27 November 2019).
- Australian Government Department of Health. Guide for Industry to the Health Star Rating Calculator (HSRC) Version 6. Available online: http://healthstarrating.gov.au/internet/healthstarrating/publishing.nsf/Content/guide-for-industry-document (accessed on 24 October 2019).
- PricewaterhouseCoopers. Health Star Rating System Cost Benefit Analysis. Available online: https://foodregulation.gov.au/internet/fr/publishing.nsf/Content/E6C6919B62C492BCCA257F720076F4C8/$File/Health%20Star%20Rating%20Cost%20Benefit%20Analysis%20Report.pdf (accessed on 24 October 2019).
- Miller, K.; Hofstetter, R.; Krohmer, H.; Zhang, Z. Measuring Consumers’ Willingness to Pay. Which Method Fits Best? Mark. Intell. Rev. 2014, 4. [Google Scholar] [CrossRef] [Green Version]
- Miller, K.; Hofstetter, R.; Krohmer, H.; Zhang, Z. How should consumers’ willingness to pay be measured? An empirical comparison of state-of-the-art approaches. J. Mark. Res. 2011, 48, 172–184. [Google Scholar] [CrossRef]
- Voelckner, F. An empirical comparison of methods for measuring consumers’ willingness to pay. Mark. Lett. 2006, 17, 137–149. [Google Scholar] [CrossRef]
- Hanemann, M.; Loomis, J.; Kanninen, B. Statistical efficiency of double-bounded dichotomous choice contingent valuation. Am. J. Agric. Econ. 1991, 73, 1255–1263. [Google Scholar] [CrossRef]
- Buzby, J.C.; Ready, R.C.; Skees, J.R. Contingent valuation in food policy analysis: A case study of a pesticide-residue risk reduction. J. Agric. Appl. Econ. 1995, 27, 613–625. [Google Scholar] [CrossRef] [Green Version]
- Goldberg, I.; Roosen, J. Scope insensitivity in health risk reduction studies: A comparison of choice experiments and the contingent valuation method for valuing safer food. J. Risk Uncertain. 2007, 34, 123–144. [Google Scholar] [CrossRef]
- Loureiro, M.; Gracia, A.; Nayga, R. Do consumers value nutritional labels? Eur. Rev. Agric. Econ. 2006, 33, 249–268. [Google Scholar] [CrossRef]
- McCluskey, J.; Loureiro, M. Consumer preferences and willingness to pay for food labeling: A discussion of empirical studies. J. Food Distrib. Res. 2003, 34, 95–102. [Google Scholar]
- Wongprawmas, R.; Canavari, M. Consumers’ willingness-to-pay for food safety labels in an emerging market: The case of fresh produce in Thailand. Food Policy 2017, 69, 25–34. [Google Scholar] [CrossRef]
- Gao, Z.; Schroeder, T. Effects of label information on consumer willingness-to-pay for food attributes. Am. J. Agric. Econ. 2009, 91, 795–809. [Google Scholar] [CrossRef]
- Ran, T.; Yue, C.; Rihn, A. Does Nutrition Information Contribute to Grocery Shoppers’ Willingness to Pay? J. Food Prod. Mark. 2017, 23, 591–608. [Google Scholar] [CrossRef]
- Verbeke, W.; Rutsaert, P.; Bonne, K.; Vermeir, I. Credence quality coordination and consumers’ willingness-to-pay for certified halal labelled meat. Meat Sci. 2013, 95, 790–797. [Google Scholar] [CrossRef]
- Roy, A.N.; Madhavan, S.S.; Lloyd, A. A Discrete Choice Experiment to Elicit Patient Willingness to Pay for Attributes of Treatment-Induced Symptom Relief in Comorbid. Insomnia. Manag. Care 2015, 24, 42–48. [Google Scholar]
- Carlsson, F.; Martinsson, P. Design techniques for stated preference methods in health economics. Health Econ. 2003, 12, 281–294. [Google Scholar] [CrossRef]
- Talati, Z.; Norman, R.; Pettigrew, S.; Neal, B.; Kelly, B.; Dixon, H.; Ball, K.; Miller, C.; Shilton, T. The impact of interpretive and reductive front-of-pack labels on food choice and willingness to pay. Int. J. Behav. Nutr. Phys. Act. 2017, 14, 171. [Google Scholar] [CrossRef] [Green Version]
- Australia and New Zealand Ministerial Forum on Food Regulation. The Australia and New Zealand Ministerial Forum on Food Regulation Response to the Health Star Rating System Five Year Review. Available online: http://www.healthstarrating.gov.au/internet/healthstarrating/publishing.nsf/Content/D1562AA78A574853CA2581BD00828751/$File/V1-Forum-Health%20Star%20Rating%20System%20five%20year%20review%20response%202019-12.pdf (accessed on 1 May 2020).
- Markandya, A.; Ortiz, R.A.; Chiabai, A. Estimating Environmental Health Costs: General Introduction to Valuation of Human Health Risks. In Encyclopedia of Environmental Health, 2nd ed.; Nriagu, J., Ed.; Elsevier: Amsterdam, The Netherlands, 2019; pp. 719–727. [Google Scholar] [CrossRef]
- Watson, W.L.; Kelly, B.; Hector, D.; Hughes, C.; King, L.; Crawford, J.; Sergeant, J.; Chapman, K. Can front-of-pack labelling schemes guide healthier food choices? Australian shoppers’ responses to seven labelling formats. Appetite 2014, 72, 90–97. [Google Scholar] [CrossRef] [PubMed]
- Australian Bureau of Statistics. Australian Demographic Statistics, December 2014. Available online: https://www.abs.gov.au/AUSSTATS/[email protected]/Lookup/3101.0Main+Features1Dec+2014 (accessed on 16 November 2019).
- United States Department of Agriculture Economic Research Service. Survey Tools: Six-Item Short form of the Food Security Survey Module. Available online: https://www.ers.usda.gov/topics/food-nutrition-assistance/food-security-in-the-us/survey-tools/ (accessed on 16 November 2019).
- Blumberg, S.J.; Bialostosky, K.; Hamilton, W.L.; Briefel, R.R. The effectiveness of a short form of the Household Food Security Scale. Am. J. Public Health 1999, 89, 1231–1234. [Google Scholar] [CrossRef] [PubMed] [Green Version]
- Butcher, L.M.; O’Sullivan, T.A.; Ryan, M.M.; Lo, J.; Devine, A. Utilising a multi-item questionnaire to assess household food security in Australia. Health Promot. J. Aust. 2019, 30, 9–17. [Google Scholar] [CrossRef] [PubMed]
- Cranfield, J.A.L.; Magnusson, E. Canadian consumer’s willingness-to-pay for pesticide free food products: An ordered probit analysis. Int. Food Agribus. Manag. Rev. 2003, 6. [Google Scholar] [CrossRef]
- Loureiro, M.L.; Hine, S. Preferences and willingness to pay for GM labeling policies. Food Policy 2004, 29, 467–483. [Google Scholar] [CrossRef]
- Mostafa, M.M. Egyptian consumers’ willingness to pay for carbon-labeled products: A contingent valuation analysis of socio-economic factors. J. Clean. Prod. 2016, 135, 821–828. [Google Scholar] [CrossRef]
- R Core Team. R: A Language and Environment for Statistical Computing. Available online: https://www.R-project.org/ (accessed on 10 November 2019).
- Nakatani, T.; Aizaki, H.; Sato, K. DCchoice: An R Package for Analyzing Dichotomous Choice Contingent Valuation Data. Available online: https://rdrr.io/cran/DCchoice/ (accessed on 12 December 2019).
- Krinsky, I.; Robb, A. On approximating the statistical properties of elasticities: A correction. Rev. Econ. Stat. 1990, 72, 189–190. [Google Scholar] [CrossRef]
- Bateman, I.; Carson, R.; Day, B.; Hanemann, M.; Hanley, N.; Hett, T.; Jones-Lee, M.; Loomes, G. Economic Valuation with Stated Preference Techniques; Edward Elgar: Cheltenham, UK, 2002. [Google Scholar]
- Gregori, D.; Ballali, S.; Vogele, C.; Galasso, F.; Widhalm, K.; Berchialla, P.; Baldi, I. What is the value given by consumers to nutritional label information? Results from a large investigation in Europe. J. Am. Coll Nutr. 2015, 34, 120–125. [Google Scholar] [CrossRef]
- Butcher, L.M.; Ryan, M.M.; O’Sullivan, T.A.; Lo, J.; Devine, A. Food-Insecure Household’s Self-Reported Perceptions of Food Labels, Product Attributes and Consumption Behaviours. Nutrients 2019, 11, 828. [Google Scholar] [CrossRef] [Green Version]
- Suratkar, S.; Gittelsohn, J.; Song, H.; Anliker, J.; Sharma, S.; Mattingly, M. Food insecurity is associated with food-related psychosocial factors and behaviors among low-income African American adults in Baltimore City. J. Hunger Environ. Nutr. 2010, 5, 100–119. [Google Scholar] [CrossRef]
- Pot, G.K.; Prynne, C.J.; Almoosawi, S.; Kuh, D.; Stephen, A.M. Trends in food consumption over 30 years: Evidence from a British birth cohort. Eur. J. Clin. Nutr. 2015, 69, 817–823. [Google Scholar] [CrossRef] [Green Version]
- Crawford, P.; Brown, B.; Nerlich, B.; Koteyko, N. Nutritional altruism and functional food: Lay discourses on probiotics. Sociol. Health Illn. 2010, 32, 745–760. [Google Scholar] [CrossRef]
- Campos, S.; Doxey, J.; Hammond, D. Nutrition labels on pre-packaged foods: A systematic review. Public Health Nutr. 2011, 14, 1496–1506. [Google Scholar] [CrossRef] [PubMed] [Green Version]
- Storcksdieck genannt Bonsmann, S.; Wills, J.M. Nutrition Labeling to Prevent Obesity: Reviewing the Evidence from Europe. Curr. Obes. Rep. 2012, 1, 134–140. [Google Scholar] [CrossRef] [PubMed] [Green Version]
- Jones, A.; Thow, A.; Mhurchu, C.; Sacks, G.; Neal, B. The performance and potential of the Australasian Health Star Rating system: A four-year review using the RE-AIM framework. Aust. N. Z. J. Public Health 2019, 43, 355–365. [Google Scholar] [CrossRef] [PubMed] [Green Version]
- Loomis, J. What’s to know about hypothetical bias in stated preference valuation studies? J. Econ. Surv. 2011, 25, 363–370. [Google Scholar] [CrossRef]
- Jones, A.; Radholm, K.; Neal, B. Defining ‘Unhealthy’: A Systematic Analysis of Alignment between the Australian Dietary Guidelines and the Health Star Rating System. Nutrients 2018, 10, 501. [Google Scholar] [CrossRef] [Green Version]
- Lawrence, M.A.; Dickie, S.; Woods, J.L. Do Nutrient-Based Front-of-Pack Labelling Schemes Support or Undermine Food-Based Dietary Guideline Recommendations? Lessons from the Australian Health Star Rating System. Nutrients 2018, 10, 32. [Google Scholar] [CrossRef] [PubMed] [Green Version]
- Pulker, C.E.; Scott, J.A.; Pollard, C.M. Ultra-processed family foods in Australia: Nutrition claims, health claims and marketing techniques. Public Health Nutr. 2018, 21, 38–48. [Google Scholar] [CrossRef] [PubMed] [Green Version]
- Landrigan, T.J.; Kerr, D.A.; Dhaliwal, S.S.; Savage, V.; Pollard, C.M. Removing the Australian tax exemption on healthy food adds food stress to families vulnerable to poor nutrition. Aust. N. Z. J. Public Health 2017, 41, 591–597. [Google Scholar] [CrossRef] [PubMed]
- Landrigan, T.; Pollard, C. Food Access and Cost Survey Western Australia; Department of Health: Perth, Australia, 2010. [Google Scholar]
- Cooper, S.L.; Pelly, F.E.; Lowe, J.B. Construct and criterion-related validation of nutrient profiling models: A systematic review of the literature. Appetite 2016, 100, 26–40. [Google Scholar] [CrossRef] [PubMed]
- Townsend, M.S. Where is the science? What will it take to show that nutrient profiling systems work? Am. J. Clin. Nutr. 2010, 91, 1109s–1115s. [Google Scholar] [CrossRef] [PubMed] [Green Version]
- Lawrence, M.A.; Pollard, C.M.; Vidgen, H.A.; Woods, J.L. The Health Star Rating system—Is its reductionist (nutrient) approach a benefit or risk for tackling dietary risk factors? Public Health Res. Pract. 2019, 29. [Google Scholar] [CrossRef] [PubMed] [Green Version]
- Australian Government Department of Health. Health Star Rating System Style Guide. Version 5. Available online: http://www.healthstarrating.gov.au/internet/healthstarrating/publishing.nsf/Content/style-guide (accessed on 27 November 2019).
- World Health Organisation/International Association for the Study of Obesity. Nutrient Profiling: Report of a WHO/IASO Technical Meeting. Available online: http://www.who.int/nutrition/publications/profiling/WHO_IASO_report2010/en/index.html (accessed on 21 October 2020).
- Arambepola, C.; Scarborough, P.; Rayner, M. Validating a nutrient profile model. Public Health Nutr. 2008, 11, 371–378. [Google Scholar] [CrossRef] [PubMed] [Green Version]
- Cooper, S.L.; Pelly, F.E.; Lowe, J.B. Assessment of the construct validity of the Australian Health Star Rating: A nutrient profiling diagnostic accuracy study. Eur. J. Clin. Nutr. 2017, 71, 1353–1359. [Google Scholar] [CrossRef] [PubMed]
- Pulker, C.E.; Trapp, G.S.A.; Scott, J.A.; Pollard, C.M. Alignment of Supermarket Own Brand Foods’ Front-of-Pack Nutrition Labelling with Measures of Nutritional Quality: An Australian Perspective. Nutrients 2018, 10, 1465. [Google Scholar] [CrossRef] [Green Version]
- Dickie, S.; Woods, J.L.; Lawrence, M. Analysing the use of the Australian Health Star Rating system by level of food processing. Int. J. Behav. Nutr. Phys. Act. 2018, 15, 128. [Google Scholar] [CrossRef]
- Monteiro, C.A.; Cannon, G.; Moubarac, J.C.; Levy, R.B.; Louzada, M.L.C.; Jaime, P.C. The UN Decade of Nutrition, the NOVA food classification and the trouble with ultra-processing. Public Health Nutr. 2018, 21, 5–17. [Google Scholar] [CrossRef] [Green Version]
- Monteiro, C.A.; Cannon, G.; Lawrence, M.; Costa Louzada, M.L.; Pereira Machado, P. Ultra-Processed Foods, Diet Quality, and Health Using the NOVA Classification System; FAO: Rome, Italy, 2019. [Google Scholar]
- Dickie, S.; Woods, J.L.; Baker, P.; Elizabeth, L.; Lawrence, M. Evaluating nutrient-based indices against food- and diet-based indices to assess the health potential of foods: How does the Australian Health Star Rating System perform after five years? Nutrients 2020, 12, 1463. [Google Scholar] [CrossRef]
- Drewnowski, A.; Fulgoni, V.L. New Nutrient Rich Food Nutrient Density Models That Include Nutrients and MyPlate Food Groups. Front. Nutr. 2020, 7. [Google Scholar] [CrossRef]
- Labonte, M.E.; Poon, T.; Gladanac, B.; Ahmed, M.; Franco-Arellano, B.; Rayner, M.; L’Abbe, M.R. Nutrient Profile Models with Applications in Government-Led Nutrition Policies Aimed at Health Promotion and Noncommunicable Disease Prevention: A Systematic Review. Adv. Nutr. 2018, 9, 741–788. [Google Scholar] [CrossRef] [PubMed] [Green Version]
- Friel, S.; Barosh, L.; Lawrence, M. Towards healthy and sustainable food consumption: An Australian case study. Public Health Nutr. 2013, 17, 1156–1166. [Google Scholar] [CrossRef] [PubMed] [Green Version]
- Food and Agriculture Organization of the United Nations. Sustainable Diets and Biodiversity. Directions and Solutions for Policy, Research and Action; FAO Headquarters: Rome, Italy, 2012. [Google Scholar]
- Cooper, S.L.; Pelly, F.E.; Lowe, J.B. Health and Sustainable Diets: How valid are nutrient profiling models? In Proceedings of the 17th International Congress of Dietetics (ICD): Going to Sustainable Eating, Granada, Spain, 7–10 September 2016; pp. 213–214. [Google Scholar]


| Variable | Description | Type | Levels/Range |
|---|---|---|---|
| WTP | Dependent variable accounting for the willingness to pay or not of the proposed bid amount | Binary | (Yes, No) |
| BID | Hypothetical additional amount proposed for the Health Star Rating | Numeric | (0.03 AUD~0.27 AUD) |
| Explanatory variables: Socio-demographic characteristics | |||
| Age group | Age bracket of the respondent in years | Ordinal | (19–24, 25–34, 35–44,45–54, 55–64, 65–84) |
| Gender | The gender of the respondent | Binary | (Male, Female) |
| Family size | The sum of adults and children (<18 years) living in the household | Numeric | (1~9) |
| Education | Highest level of education completed. | Ordinal | (Secondary or less, Vocational, University, Others) |
| Income level | Level of income (i.e., wages/salaries, government benefits, pensions, allowances and other). | Ordinal | (Low, Mid, High) |
| Explanatory variables: Food and dietary factors | |||
| Healthy diet | Level of perceived diet healthiness (How healthy would you say your diet was?) | Ordinal | (Very Unhealthy, Unhealthy, Healthy, Very Healthy) |
| Health Star Rating | Level of agreement with statement: ‘A Health Star Rating would make it easier for me to make selections when shopping’. | Ordinal | (Strongly Disagree, Disagree, Neither Agree or Disagree, Agree, Strongly Agree) |
| Food security | Level of food security | Ordinal | (High-Marginal food security, Low food security, Very Low food security) |
| Variable | Category | N (%) a | Model Result | ||
|---|---|---|---|---|---|
| Estimate ± SE | z-Value | p-Value | |||
| BID (AUD) | Range 0.03–0.27 | 0.11 ± 0.08 | −12.52 ± 0.49 | −25.62 | <0.001 *** |
| Gender | Male | 320 (31%) | 1.00 (Ref) | ||
| Female | 704 (69%) | 0.08 ± 0.13 | 0.64 | 0.521 | |
| Age | 19–24 | 77 (8%) | −0.35 ± 0.28 | −1.26 | 0.208 |
| 25–34 | 189 (18%) | 0.09 ± 0.22 | 0.42 | 0.674 | |
| 35–44 | 204 (20%) | −0.46 ± 0.22 | −2.04 | 0.041 ** | |
| 45–54 | 215 (21%) | −0.12 ± 0.20 | −0.62 | 0.538 | |
| 55–64 | 175 (17%) | 0.01 ± 0.20 | 0.05 | 0.964 | |
| 65–84 | 164 (16%) | 1.00 (Ref) | |||
| Family size | Range 1–9 | 3.64 ± 1.32 | 0.10 ± 0.06 | 1.76 | 0.078 |
| Education | Secondary or less | 275 (27%) | 1.00 (Ref) | ||
| Vocational | 380 (37%) | 0.09 ± 0.15 | 0.60 | 0.551 | |
| University | 360 (35%) | −0.04 ± 0.16 | −0.27 | 0.790 | |
| Other | 9 (1%) | 0.77 ± 0.62 | 1.24 | 0.213 | |
| Income level (AUD) b | Low | 322 (31%) | 1.00 (Ref) | ||
| Middle | 253 (25%) | 0.22 ± 0.16 | 1.36 | 0.174 | |
| High | 244 (24%) | 0.17 ± 0.16 | 1.03 | 0.305 | |
| Healthy diet c | Very unhealthy | 17 (2%) | 1.00 (Ref) | ||
| Unhealthy | 202 (20%) | 1.88 ± 0.66 | 2.83 | 0.005 *** | |
| Healthy | 746 (73%) | 1.91 ± 0.66 | 2.91 | 0.004 *** | |
| Very healthy | 59 (6%) | 1.56 ± 0.70 | 2.24 | 0.025 ** | |
| Health Star Rating d | Strongly disagree | 30 (3%) | 1.00 (Ref) | ||
| Disagree | 132 (13%) | −0.09 ± 0.42 | −0.22 | 0.828 | |
| Neither agree or disagree | 376 (37%) | 0.63 ± 0.40 | 1.59 | 0.111 | |
| Agree | 356 (35%) | 1.34 ± 0.40 | 3.38 | 0.001 *** | |
| Strongly agree | 130 (13%) | 1.68 ± 0.42 | 4.04 | <0.001 *** | |
| Food security e | Very Low | 171 (17%) | −0.11 ± 0.16 | −0.65 | 0.518 |
| Low | 204 (20%) | 0.17 ± 0.15 | 1.15 | 0.248 | |
| High-Marginal | 649 (63%) | 1.00 (Ref) | |||
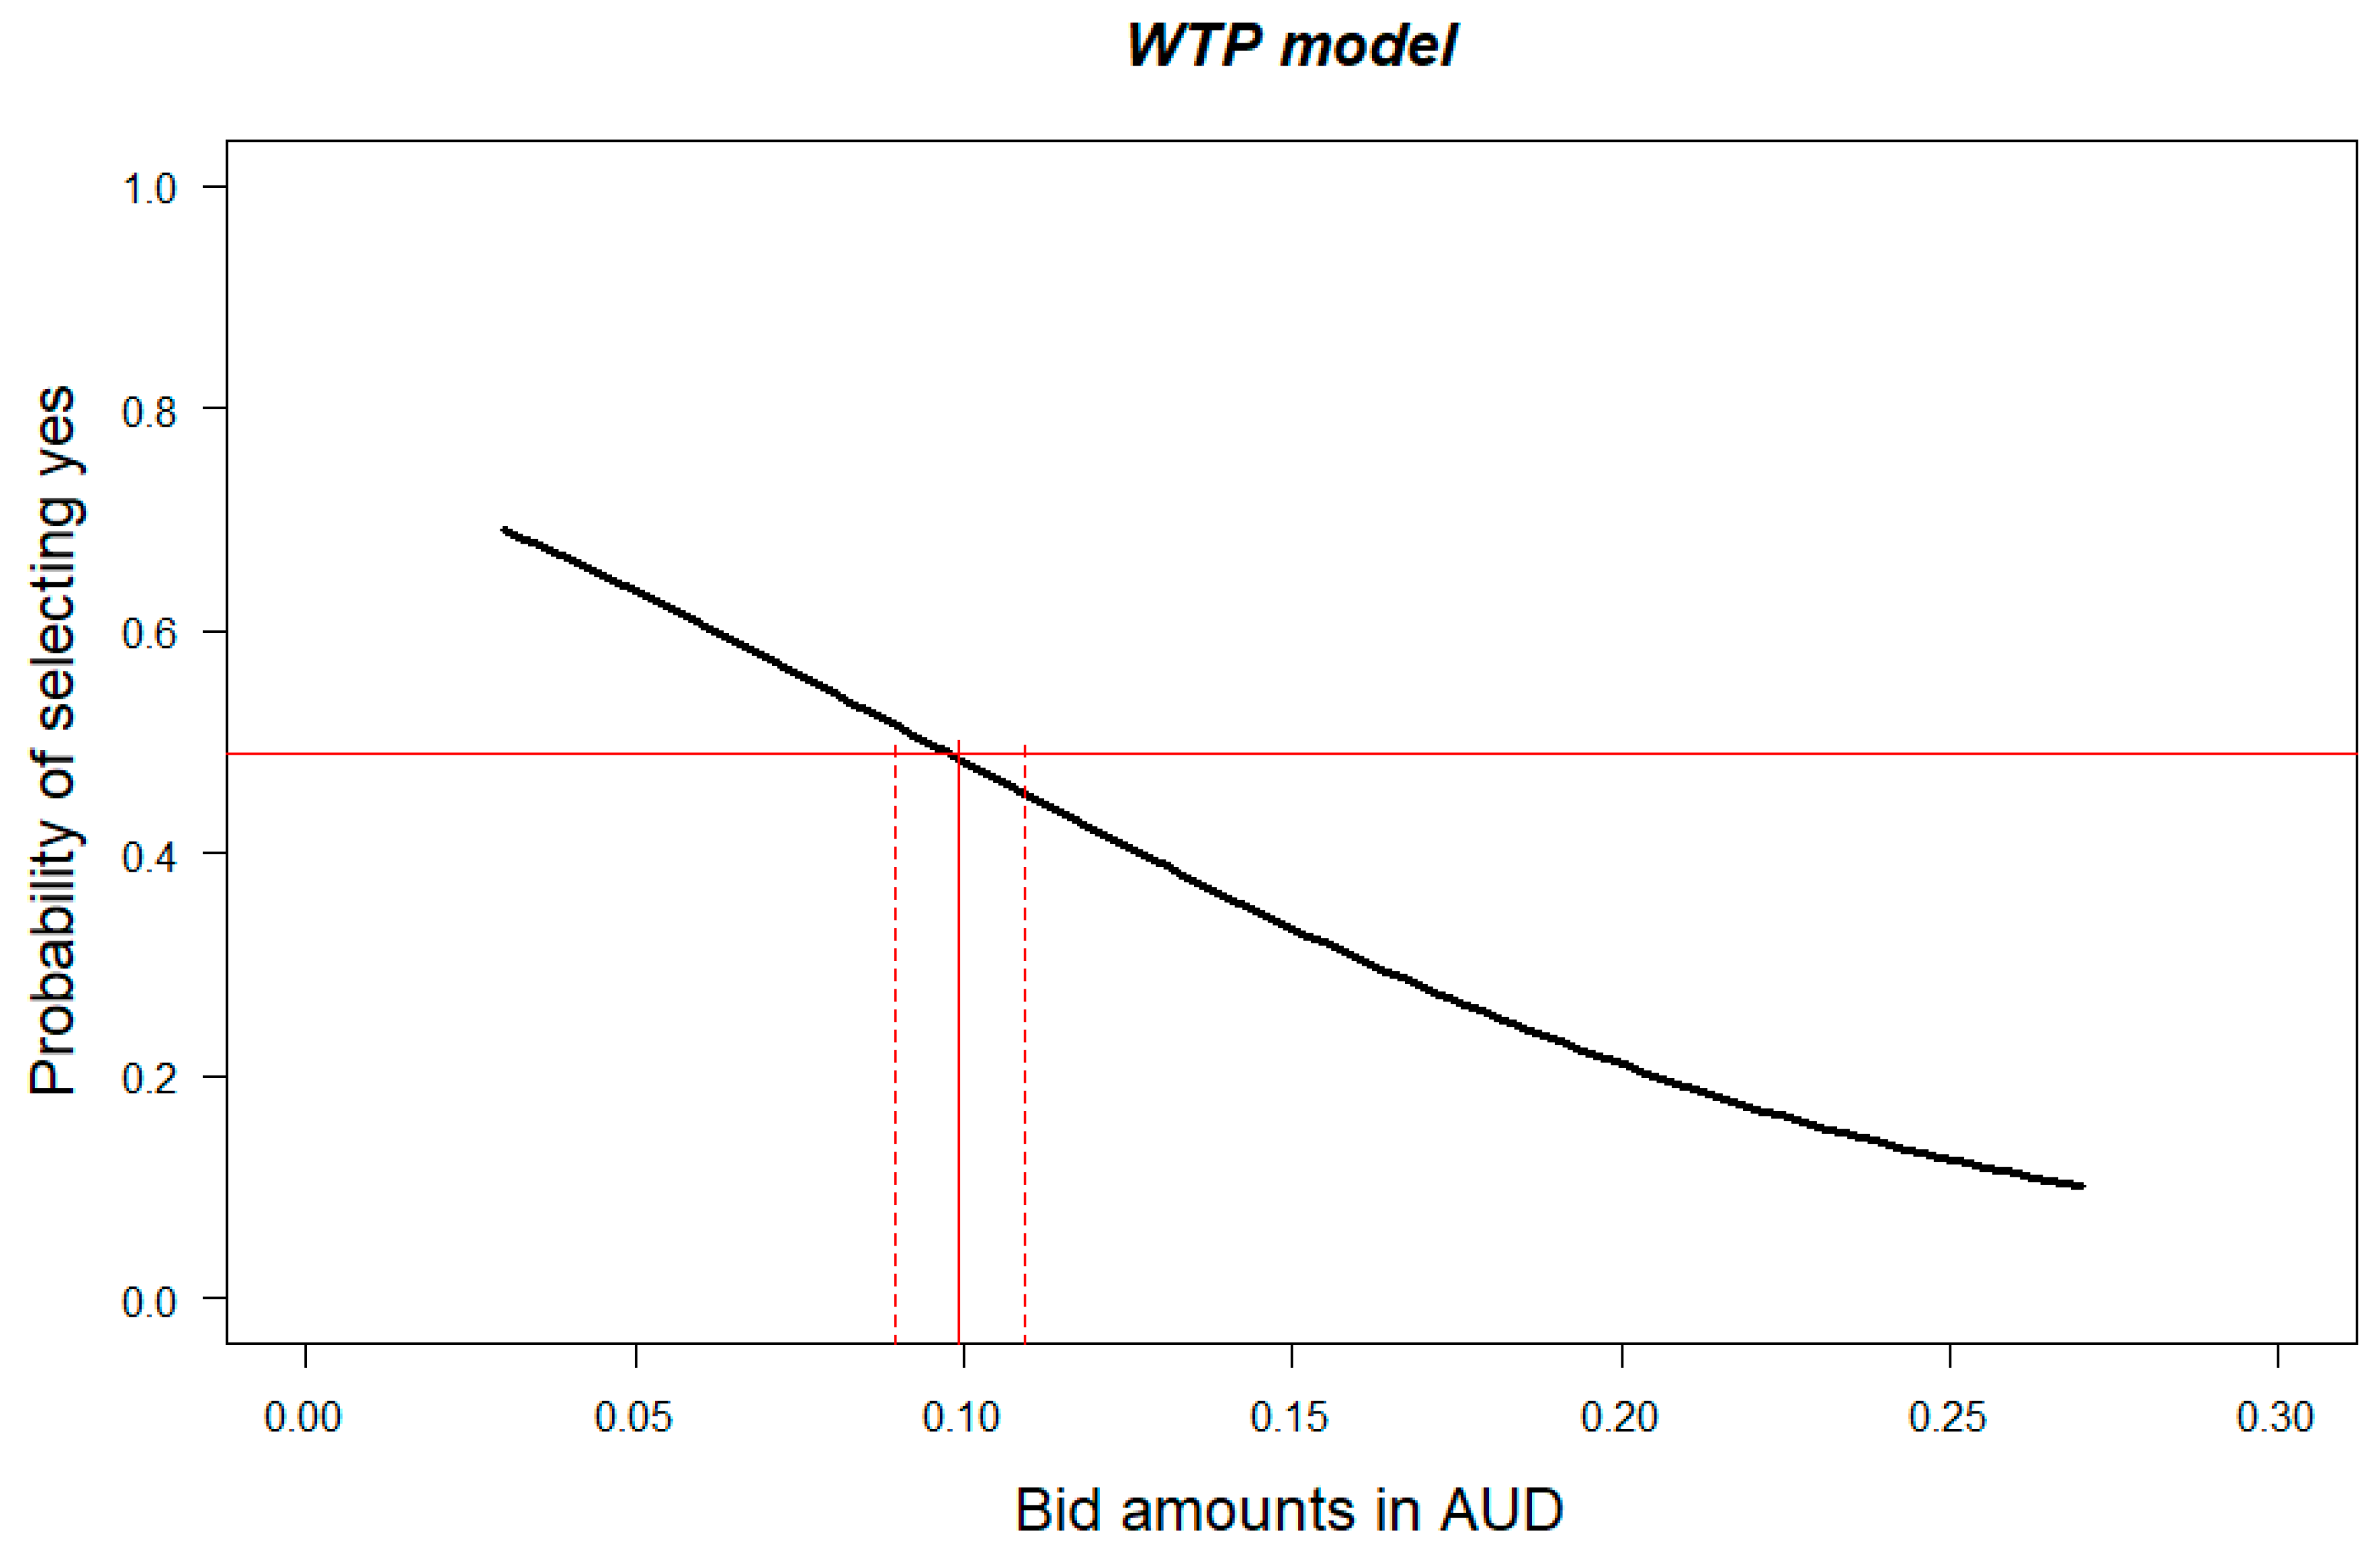
| Estimate (AUD) | 95% Confidence Interval [40] | 95% Confidence Interval (Bootstrapping) | |||
|---|---|---|---|---|---|
| Lower Boundary (AUD) | Upper Boundary (AUD) | Lower Boundary (AUD) | Upper Boundary (AUD) | ||
| Mean | 0.11 (3.67%) | 0.10 (3.34%) | 0.12 (4.00%) | 0.10 (3.34%) | 0.12 (4.00%) |
| Median | 0.10 (3.34%) | 0.09 (3.00%) | 0.11 (3.67%) | 0.09 (2.67%) | 0.11 (3.67%) |
Publisher’s Note: MDPI stays neutral with regard to jurisdictional claims in published maps and institutional affiliations. |
© 2020 by the authors. Licensee MDPI, Basel, Switzerland. This article is an open access article distributed under the terms and conditions of the Creative Commons Attribution (CC BY) license (http://creativecommons.org/licenses/by/4.0/).
Share and Cite
Cooper, S.L.; Butcher, L.M.; Scagnelli, S.D.; Lo, J.; Ryan, M.M.; Devine, A.; O’Sullivan, T.A. Australian Consumers Are Willing to Pay for the Health Star Rating Front-of-Pack Nutrition Label. Nutrients 2020, 12, 3876. https://doi.org/10.3390/nu12123876
Cooper SL, Butcher LM, Scagnelli SD, Lo J, Ryan MM, Devine A, O’Sullivan TA. Australian Consumers Are Willing to Pay for the Health Star Rating Front-of-Pack Nutrition Label. Nutrients. 2020; 12(12):3876. https://doi.org/10.3390/nu12123876
Chicago/Turabian StyleCooper, Sheri L., Lucy M. Butcher, Simone D. Scagnelli, Johnny Lo, Maria M. Ryan, Amanda Devine, and Therese A. O’Sullivan. 2020. "Australian Consumers Are Willing to Pay for the Health Star Rating Front-of-Pack Nutrition Label" Nutrients 12, no. 12: 3876. https://doi.org/10.3390/nu12123876