Gallic Acid Inhibits Lipid Accumulation via AMPK Pathway and Suppresses Apoptosis and Macrophage-Mediated Inflammation in Hepatocytes

 , ,
, ,
Abstract
:
1. Introduction
2. Materials and Methods
2.1. Reagents
2.2. Cell Culture and Treatment
2.3. Cell Viability
2.4. Oil Red O Staining
2.5. Real-Time PCR
2.6. Western Blot Analysis
2.7. Caspase 3/7 Activity
2.8. Co-Culture of Hepatocytes and Macrophages
2.9. Statistical Analysis
3. Results
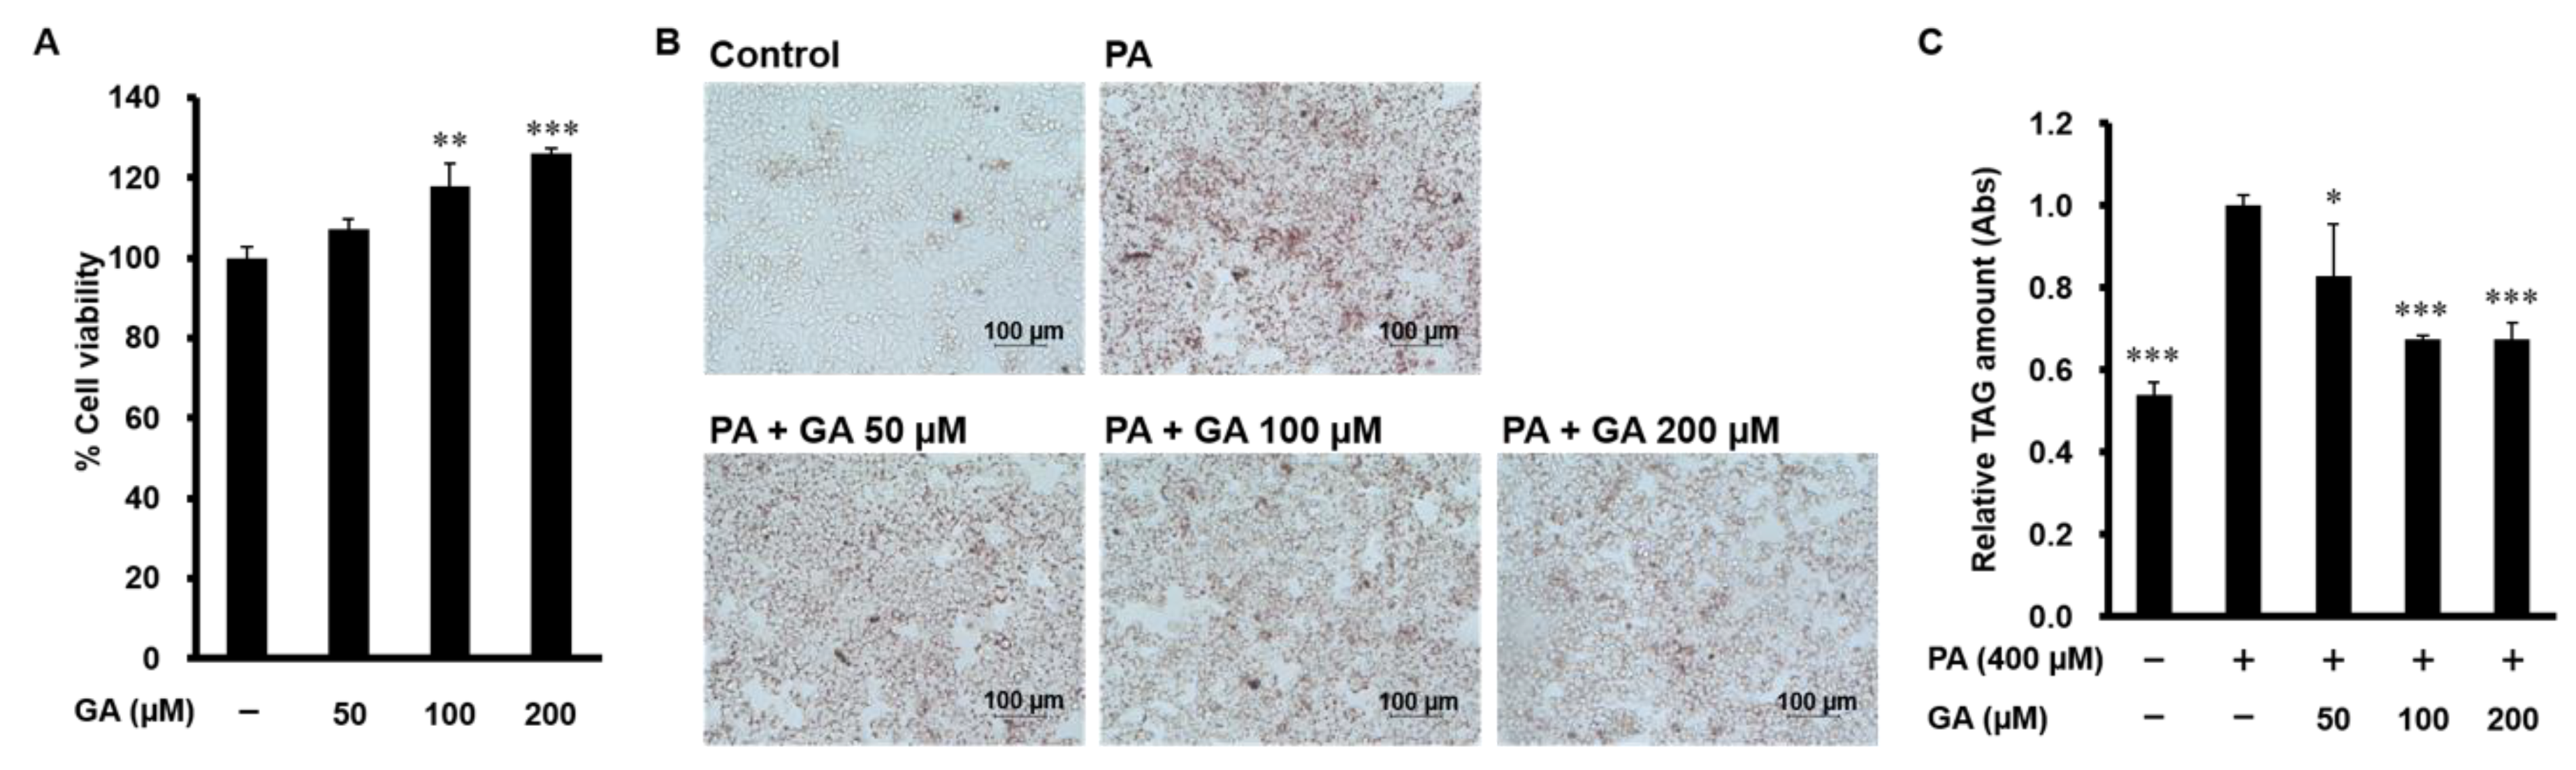
3.1. GA Inhibited Lipid Accumulation in HepG2 Cells
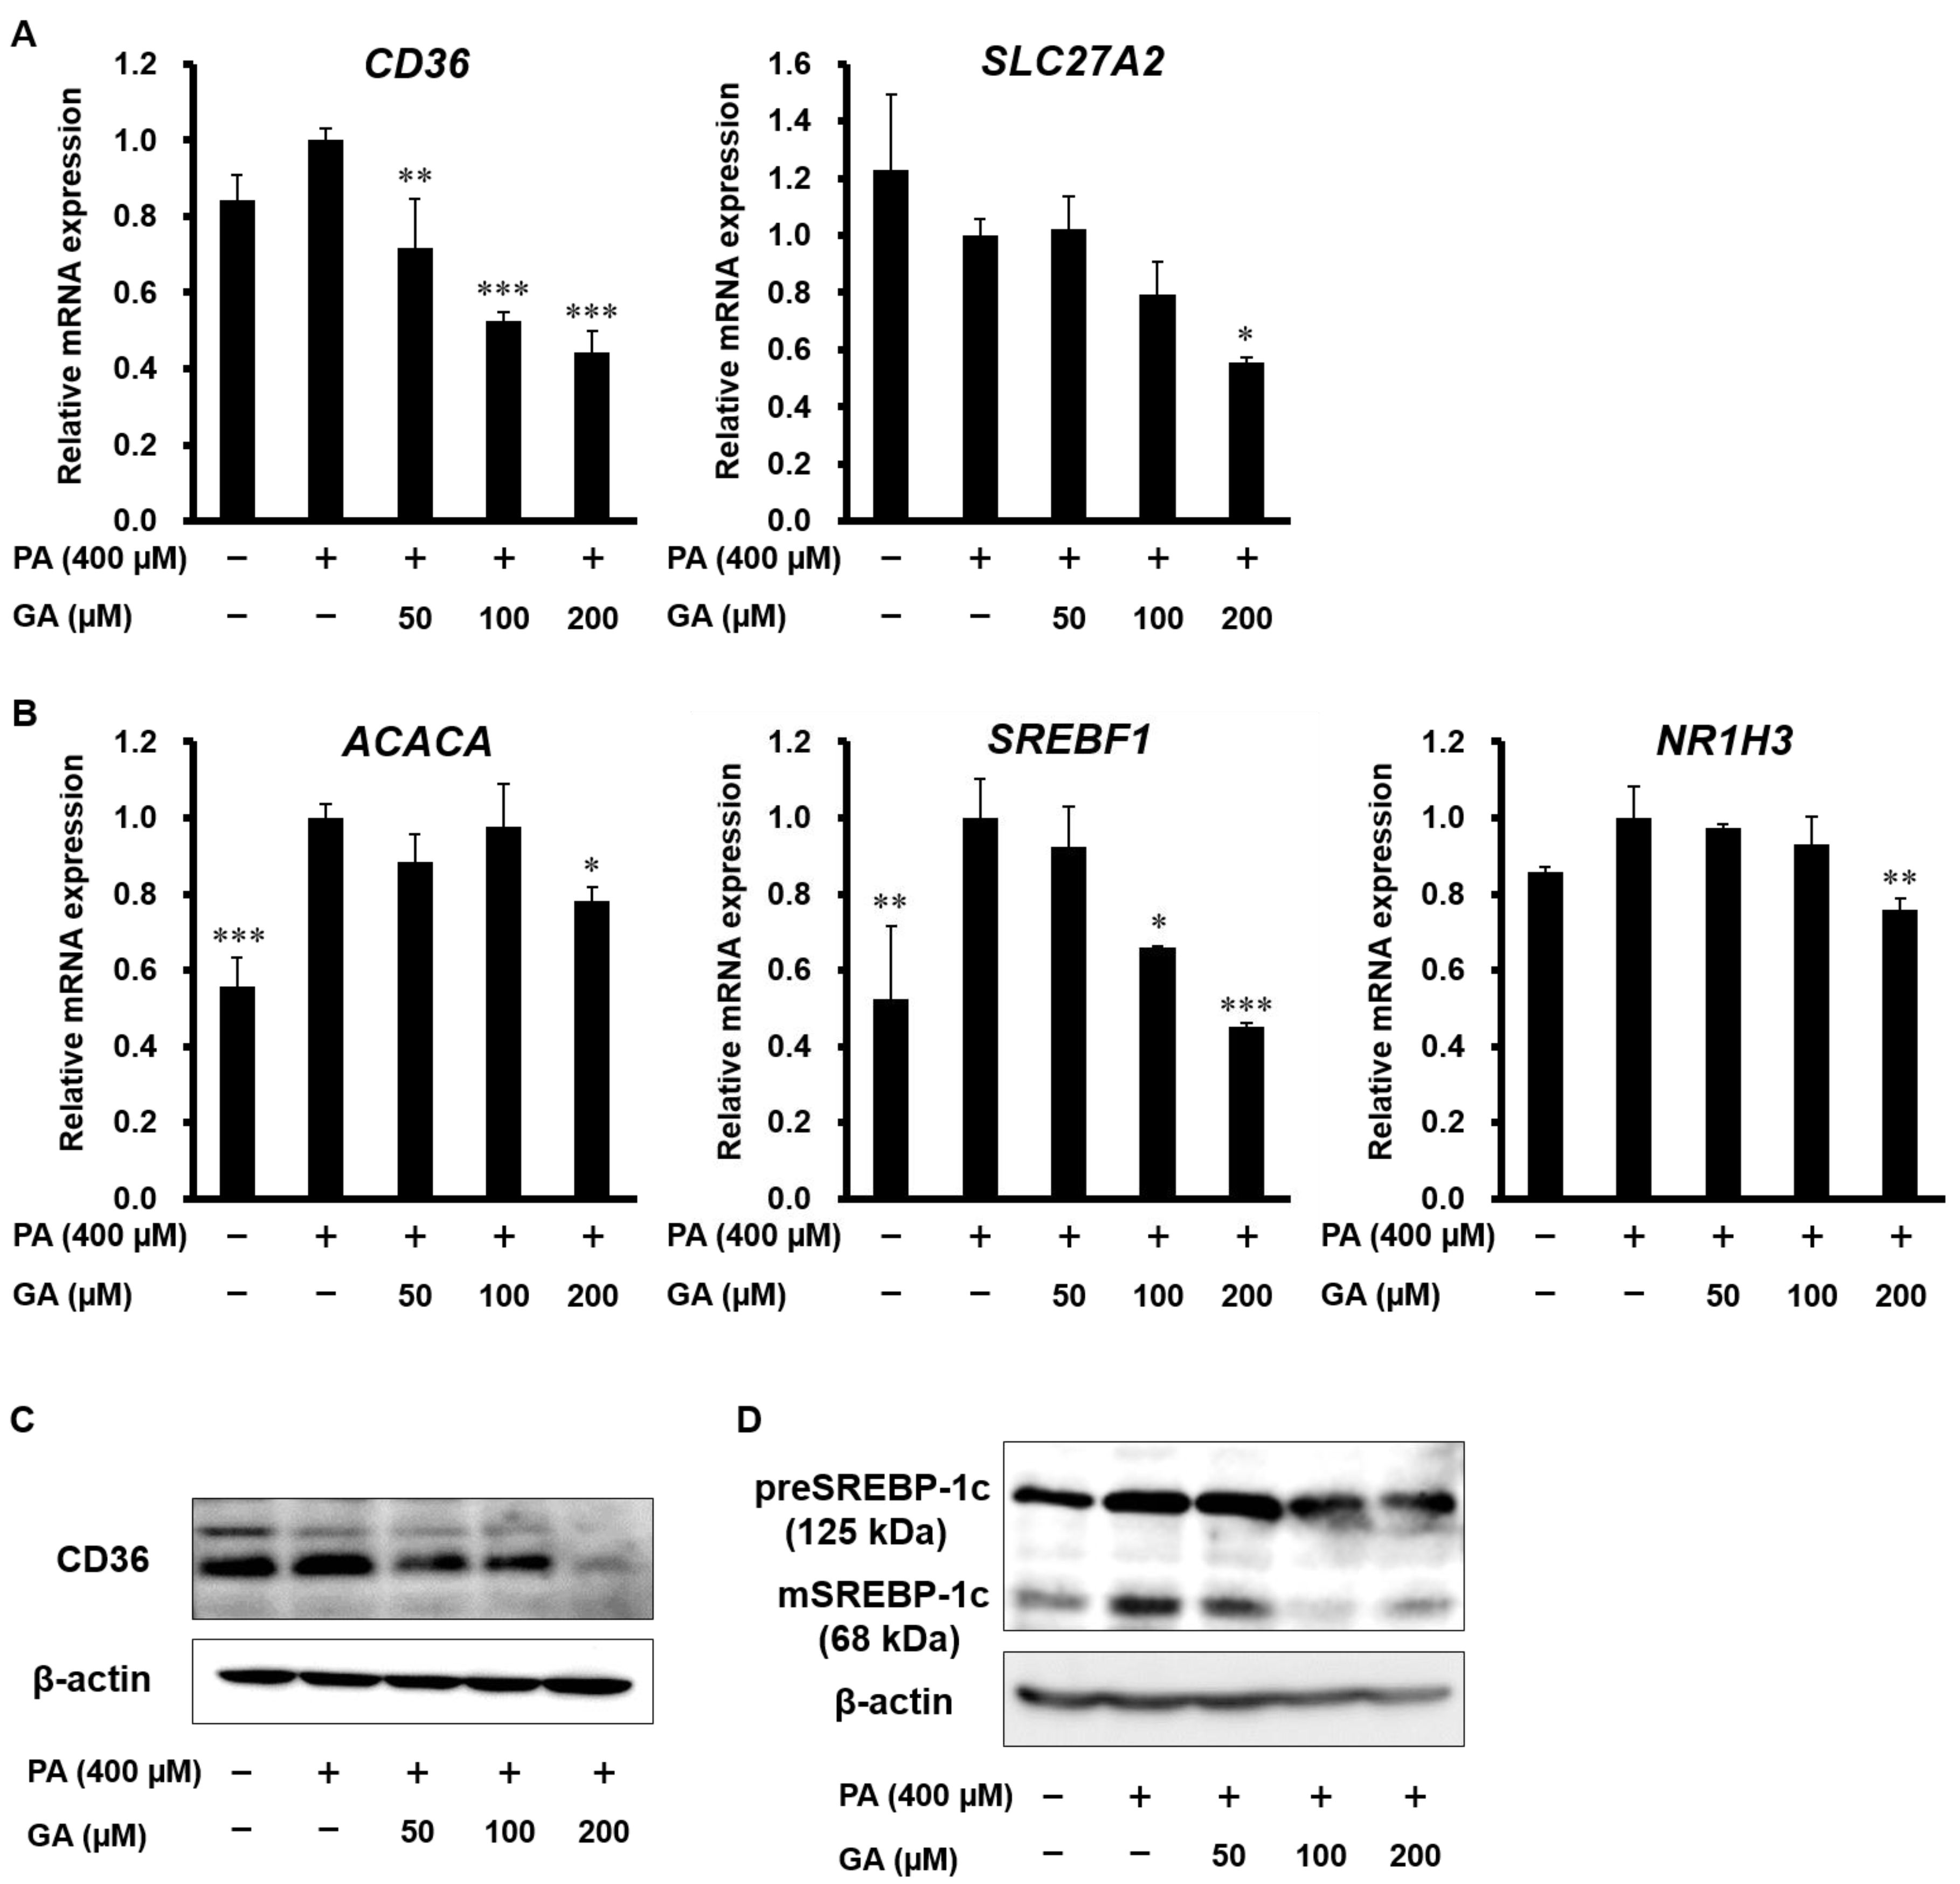
3.2. Effect of GA on Steatosis-Related Gene and Protein Expression in HepG2 Cells
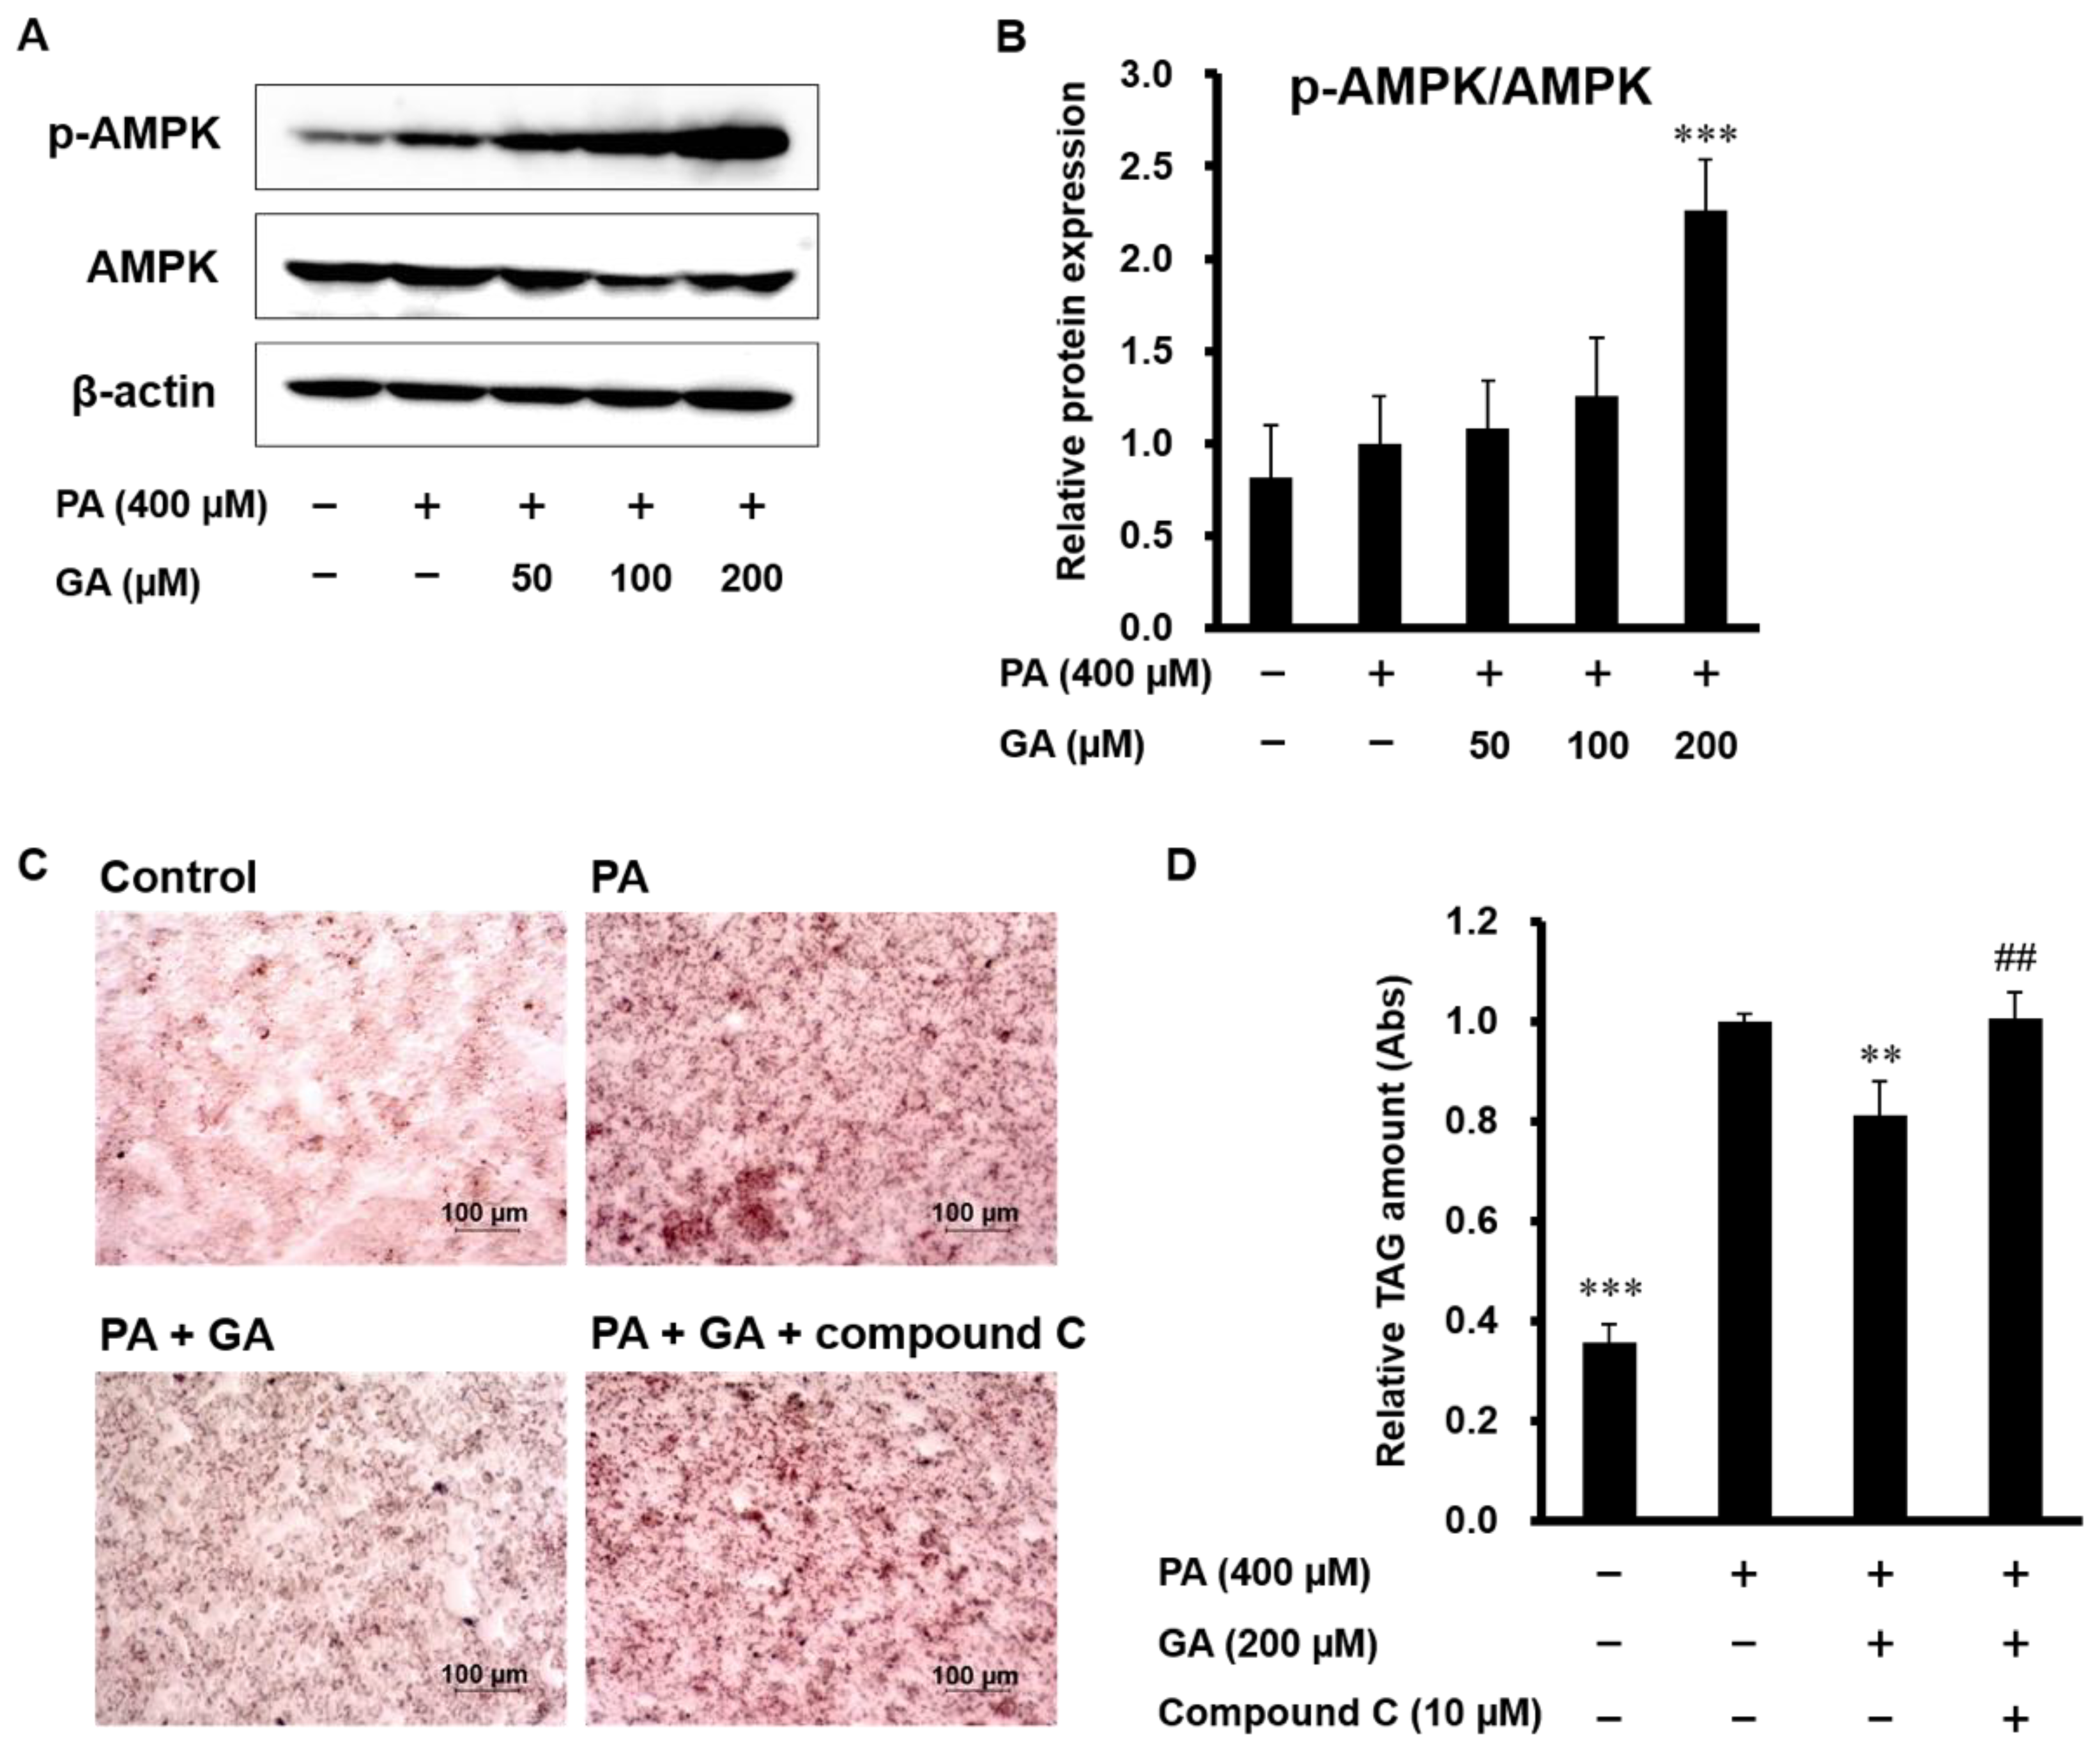
3.3. Blocking AMPK Signaling Inhibited GA-Mediated Reduction of Lipid Accumulation in HepG2 Cells
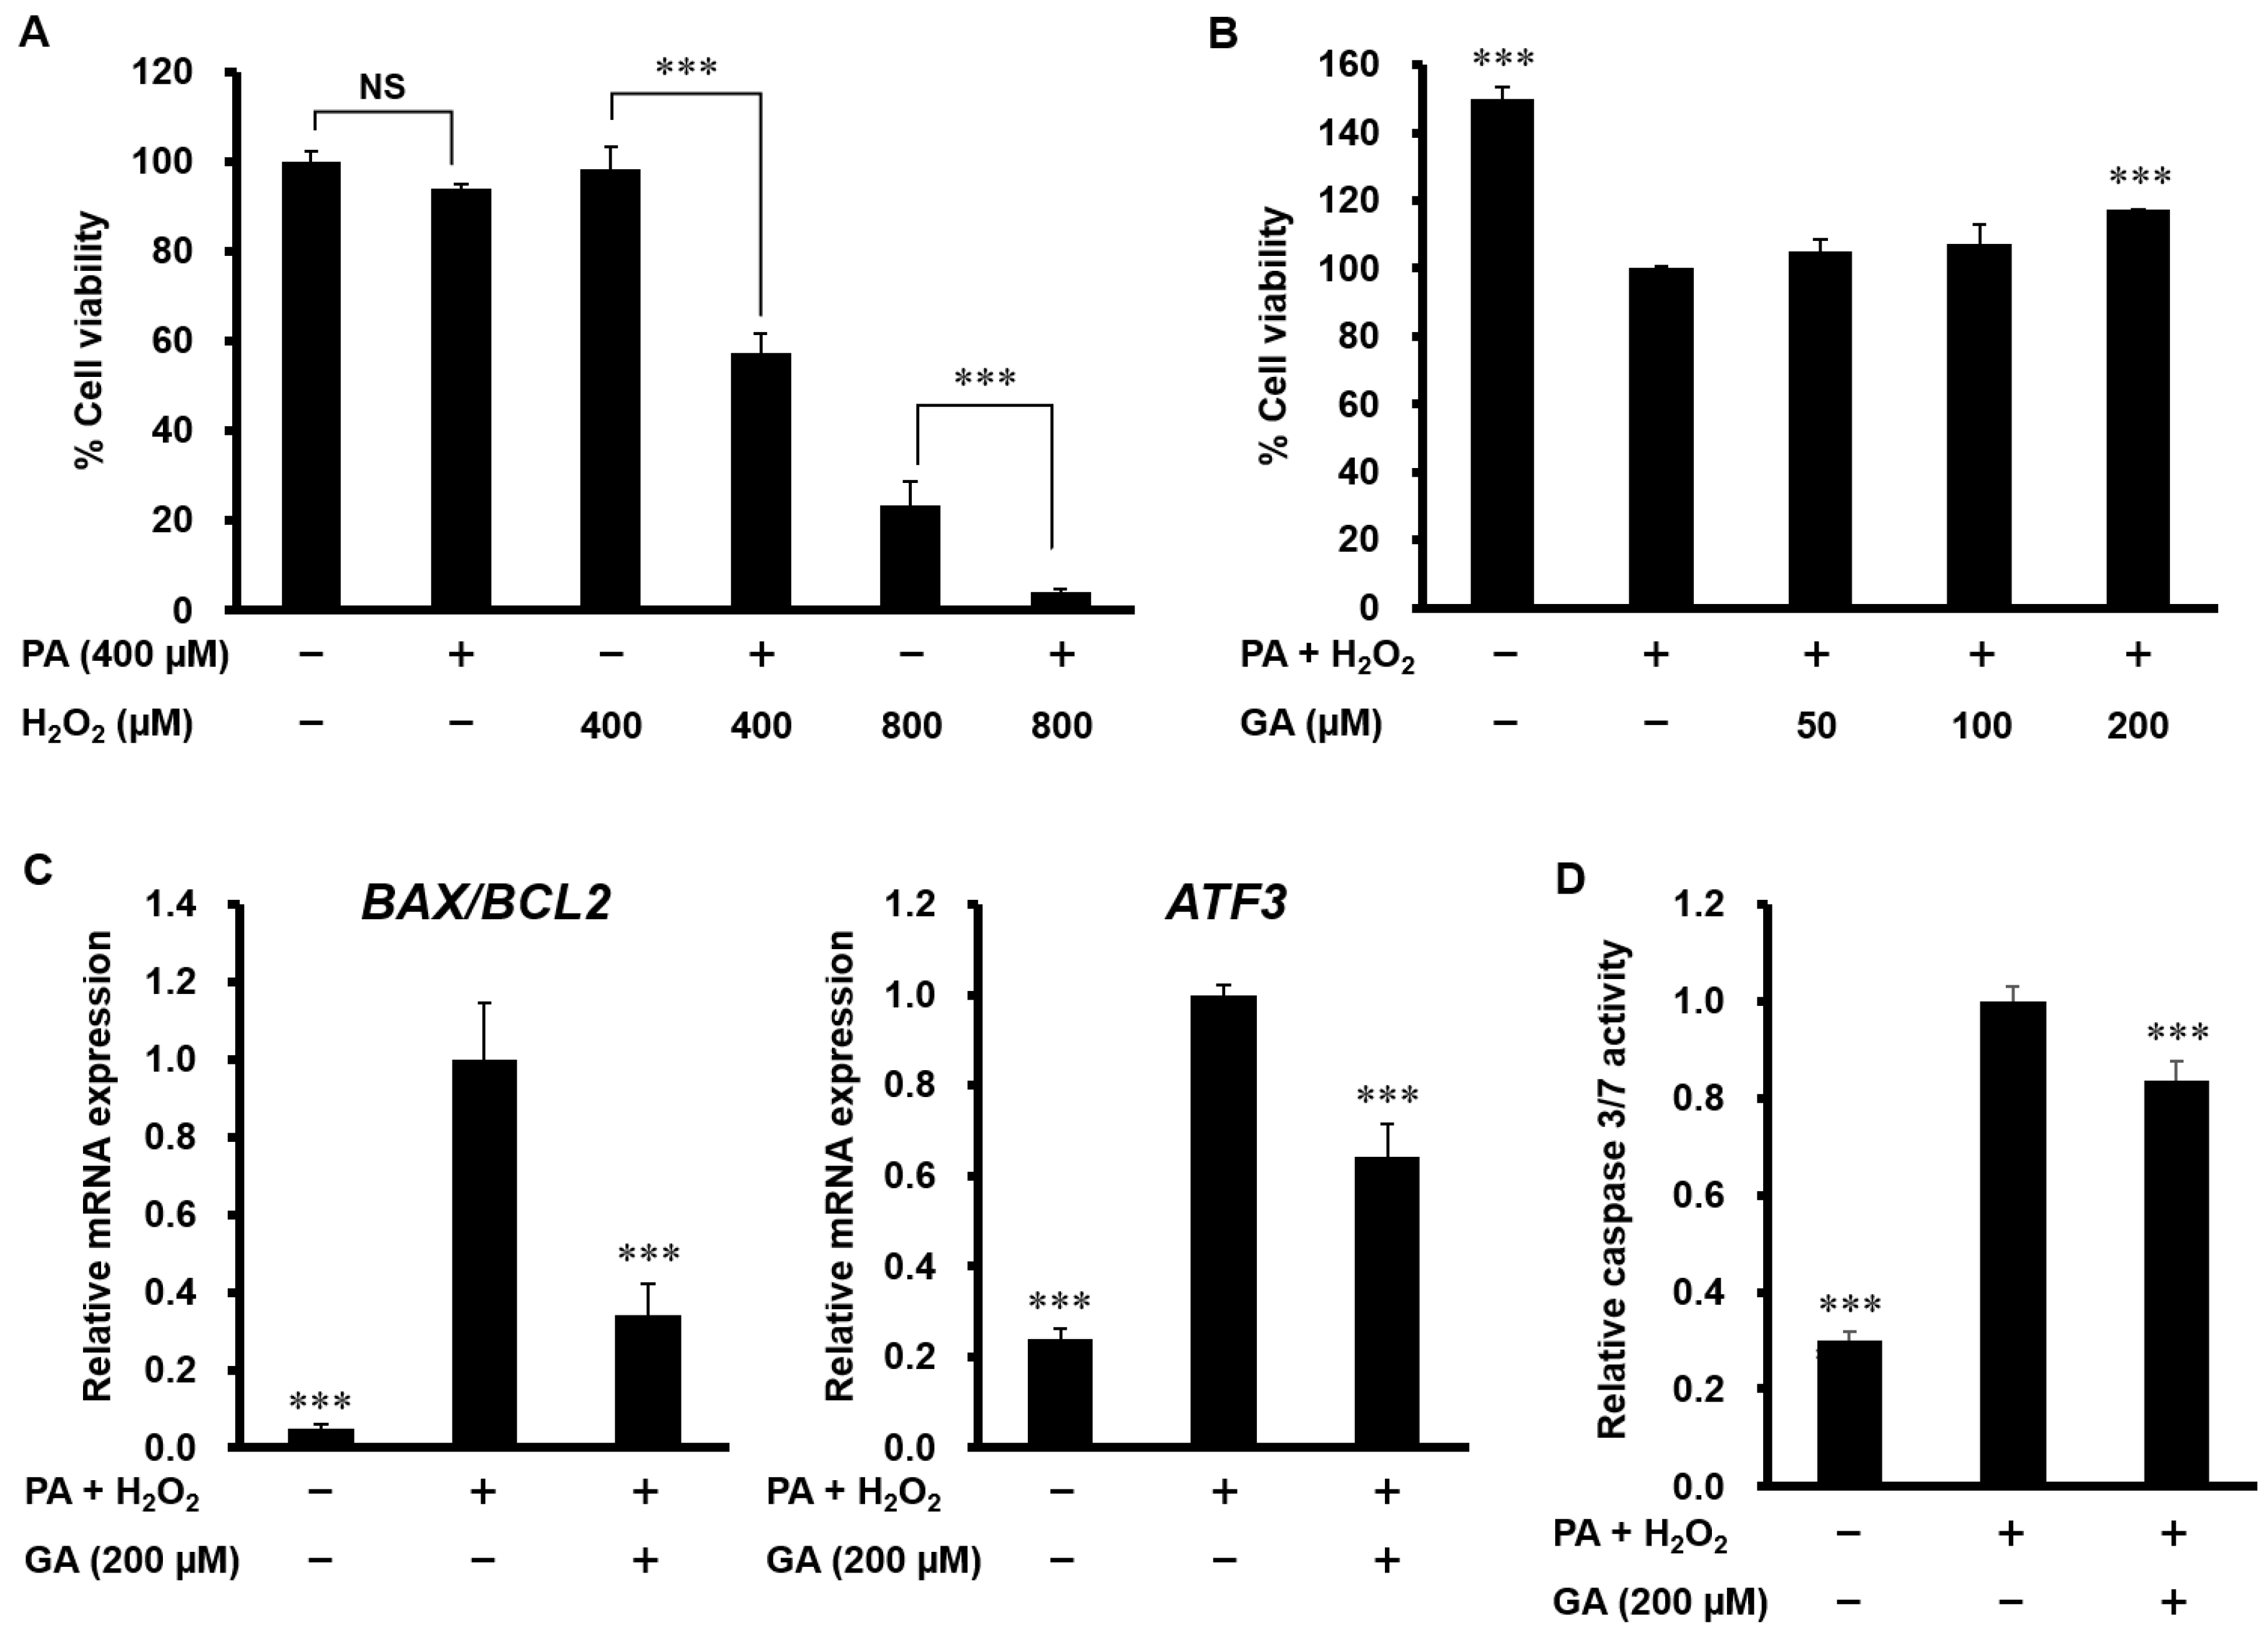
3.4. GA Attenuated Apoptosis Induced by PA and H2O2 in HepG2 Cells
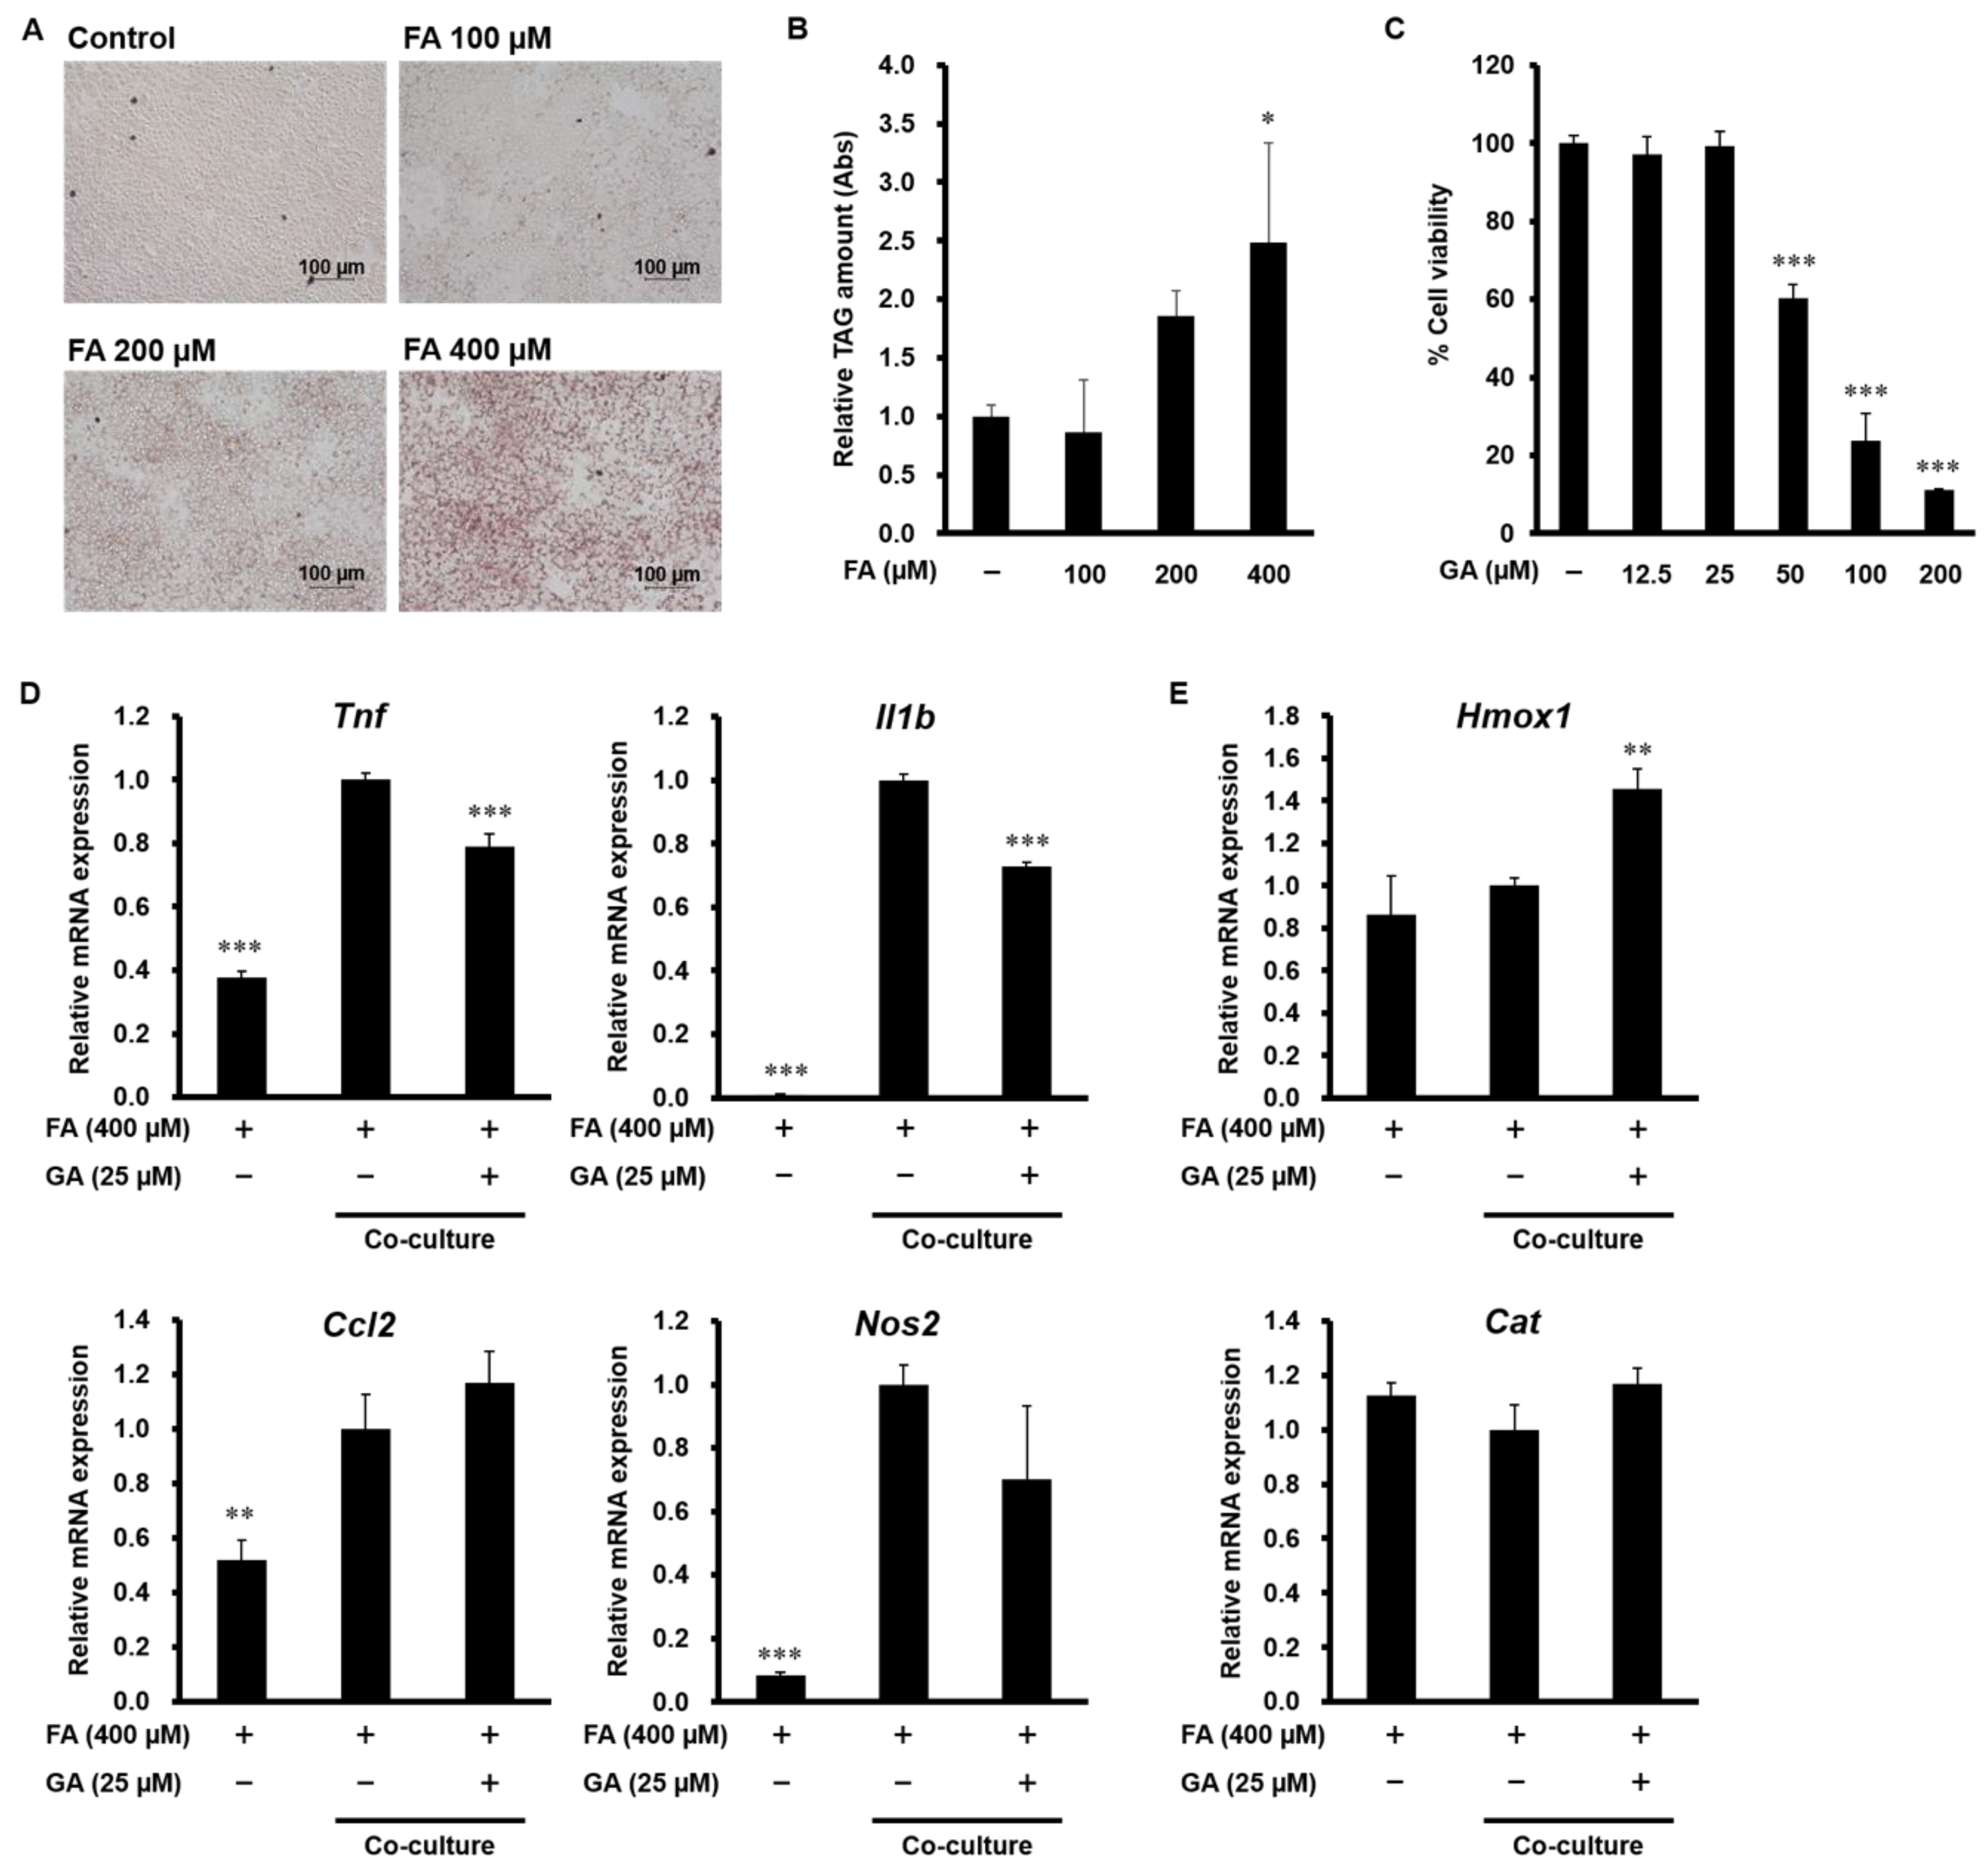
3.5. Effect of GA on Inflammatory Mediator and Antioxidant Enzyme Expression in a Co-Culture of Hepa 1-6 Cells and RAW 264 Macrophages
4. Discussion
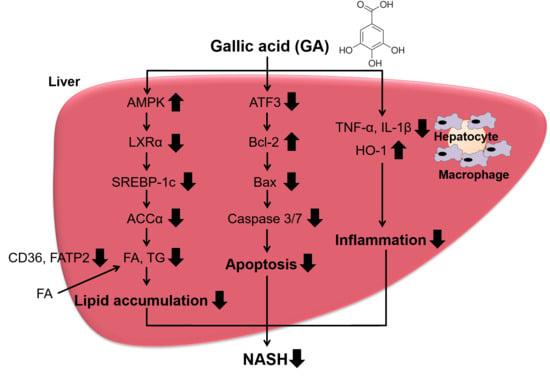
5. Conclusions
Author Contributions
Funding
Conflicts of Interest
References
- Angulo, P. Nonalcoholic fatty liver disease. N. Engl. J. Med. 2002, 346, 1221–1231. [Google Scholar] [CrossRef] [PubMed] [Green Version]
- Duseja, A.; Chalasani, N. Epidemiology and risk factors of nonalcoholic fatty liver disease (NAFLD). Hepatol. Int. 2013, 7 (Suppl. 2), 755–764. [Google Scholar] [CrossRef] [PubMed]
- Araujo, A.R.; Rosso, N.; Bedogni, G.; Tiribelli, C.; Bellentani, S. Global epidemiology of non-alcoholic fatty liver disease/non-alcoholic steatohepatitis: What we need in the future. Liver Int. 2018, 38 (Suppl. 1), 47–51. [Google Scholar] [CrossRef] [PubMed] [Green Version]
- Diehl, A.M.; Day, C. Cause, Pathogenesis, and Treatment of Nonalcoholic Steatohepatitis. N. Engl. J. Med. 2017, 377, 2063–2072. [Google Scholar] [CrossRef]
- Patil, R.; Sood, G.K. Non-alcoholic fatty liver disease and cardiovascular risk. World J. Gastrointest. Pathophysiol. 2017, 8, 51–58. [Google Scholar] [CrossRef]
- Tilg, H.; Moschen, A.R. Evolution of inflammation in nonalcoholic fatty liver disease: The multiple parallel hits hypothesis. Hepatology 2010, 52, 1836–1846. [Google Scholar] [CrossRef]
- Donnelly, K.L.; Smith, C.I.; Schwarzenberg, S.J.; Jessurun, J.; Boldt, M.D.; Parks, E.J. Sources of fatty acids stored in liver and secreted via lipoproteins in patients with nonalcoholic fatty liver disease. J. Clin. Investig. 2005, 115, 1343–1351. [Google Scholar] [CrossRef] [Green Version]
- Zambo, V.; Simon-Szabo, L.; Szelenyi, P.; Kereszturi, E.; Banhegyi, G.; Csala, M. Lipotoxicity in the liver. World J. Hepatol. 2013, 5, 550–557. [Google Scholar] [CrossRef] [Green Version]
- Canbay, A.; Friedman, S.; Gores, G.J. Apoptosis: The nexus of liver injury and fibrosis. Hepatology 2004, 39, 273–278. [Google Scholar] [CrossRef]
- Hamidzadeh, K.; Christensen, S.M.; Dalby, E.; Chandrasekaran, P.; Mosser, D.M. Macrophages and the Recovery from Acute and Chronic Inflammation. Annu. Rev. Physiol. 2017, 79, 567–592. [Google Scholar] [CrossRef] [Green Version]
- Cinti, S.; Mitchell, G.; Barbatelli, G.; Murano, I.; Ceresi, E.; Faloia, E.; Wang, S.; Fortier, M.; Greenberg, A.S.; Obin, M.S. Adipocyte death defines macrophage localization and function in adipose tissue of obese mice and humans. J. Lipid Res. 2005, 46, 2347–2355. [Google Scholar] [CrossRef] [PubMed] [Green Version]
- Suganami, T.; Nishida, J.; Ogawa, Y. A paracrine loop between adipocytes and macrophages aggravates inflammatory changes: Role of free fatty acids and tumor necrosis factor alpha. Arterioscler. Thromb. Vasc. Biol. 2005, 25, 2062–2068. [Google Scholar] [CrossRef] [PubMed] [Green Version]
- Tanaka, M.; Ikeda, K.; Suganami, T.; Komiya, C.; Ochi, K.; Shirakawa, I.; Hamaguchi, M.; Nishimura, S.; Manabe, I.; Matsuda, T.; et al. Macrophage-inducible C-type lectin underlies obesity-induced adipose tissue fibrosis. Nat. Commun. 2014, 5, 4982. [Google Scholar] [CrossRef] [PubMed] [Green Version]
- Itoh, M.; Kato, H.; Suganami, T.; Konuma, K.; Marumoto, Y.; Terai, S.; Sakugawa, H.; Kanai, S.; Hamaguchi, M.; Fukaishi, T.; et al. Hepatic crown-like structure: A unique histological feature in non-alcoholic steatohepatitis in mice and humans. PLoS ONE 2013, 8, e82163. [Google Scholar] [CrossRef] [PubMed] [Green Version]
- Abdelwahed, A.; Bouhlel, I.; Skandrani, I.; Valenti, K.; Kadri, M.; Guiraud, P.; Steiman, R.; Mariotte, A.M.; Ghedira, K.; Laporte, F.; et al. Study of antimutagenic and antioxidant activities of gallic acid and 1,2,3,4,6-pentagalloylglucose from Pistacia lentiscus. Confirmation by microarray expression profiling. Chem. Biol. Interact. 2007, 165, 1–13. [Google Scholar] [CrossRef] [PubMed]
- BenSaad, L.A.; Kim, K.H.; Quah, C.C.; Kim, W.R.; Shahimi, M. Anti-inflammatory potential of ellagic acid, gallic acid and punicalagin A&B isolated from Punica granatum. BMC Complement. Altern. Med. 2017, 17, 47. [Google Scholar]
- Huang, D.W.; Chang, W.C.; Wu, J.S.; Shih, R.W.; Shen, S.C. Gallic acid ameliorates hyperglycemia and improves hepatic carbohydrate metabolism in rats fed a high-fructose diet. Nutr. Res. 2016, 36, 150–160. [Google Scholar] [CrossRef]
- Hsu, C.L.; Yen, G.C. Effect of gallic acid on high fat diet-induced dyslipidaemia, hepatosteatosis and oxidative stress in rats. Br. J. Nutr. 2007, 98, 727–735. [Google Scholar] [CrossRef] [Green Version]
- Chao, J.; Huo, T.I.; Cheng, H.Y.; Tsai, J.C.; Liao, J.W.; Lee, M.S.; Qin, X.M.; Hsieh, M.T.; Pao, L.H.; Peng, W.H. Gallic acid ameliorated impaired glucose and lipid homeostasis in high fat diet-induced NAFLD mice. PLoS ONE 2014, 9, e96969. [Google Scholar] [CrossRef] [Green Version]
- Tung, Y.T.; Huang, C.Z.; Lin, J.H.; Yen, G.C. Effect of Phyllanthus emblica L. fruit on methionine and choline-deficiency diet-induced nonalcoholic steatohepatitis. J. Food Drug Anal. 2018, 26, 1245–1252. [Google Scholar] [CrossRef] [Green Version]
- Tanaka, M.; Sugama, A.; Sumi, K.; Shimizu, K.; Kishimoto, Y.; Kondo, K.; Iida, K. Gallic acid regulates adipocyte hypertrophy and suppresses inflammatory gene expression induced by the paracrine interaction between adipocytes and macrophages in vitro and in vivo. Nutr. Res. 2019, 73, 58–66. [Google Scholar] [CrossRef] [PubMed]
- Smith, B.K.; Marcinko, K.; Desjardins, E.M.; Lally, J.S.; Ford, R.J.; Steinberg, G.R. Treatment of nonalcoholic fatty liver disease: Role of AMPK. Am. J. Physiol. Endocrinol. Metab. 2016, 311, E730–E740. [Google Scholar] [CrossRef] [Green Version]
- Yap, F.; Craddock, L.; Yang, J. Mechanism of AMPK suppression of LXR-dependent Srebp-1c transcription. Int. J. Biol. Sci. 2011, 7, 645–650. [Google Scholar] [CrossRef] [Green Version]
- Zhang, X.; Fitzsimmons, R.L.; Cleland, L.G.; Ey, P.L.; Zannettino, A.C.; Farmer, E.A.; Sincock, P.; Mayrhofer, G. CD36/fatty acid translocase in rats: Distribution, isolation from hepatocytes, and comparison with the scavenger receptor SR-B1. Lab. Investig. 2003, 83, 317–332. [Google Scholar] [CrossRef] [PubMed] [Green Version]
- Wilson, C.G.; Tran, J.L.; Erion, D.M.; Vera, N.B.; Febbraio, M.; Weiss, E.J. Hepatocyte-Specific Disruption of CD36 Attenuates Fatty Liver and Improves Insulin Sensitivity in HFD-Fed Mice. Endocrinology 2016, 157, 570–585. [Google Scholar] [CrossRef] [PubMed] [Green Version]
- Sanders, F.W.; Griffin, J.L. De novo lipogenesis in the liver in health and disease: More than just a shunting yard for glucose. Biol. Rev. Camb. Philos. Soc. 2016, 91, 452–468. [Google Scholar] [CrossRef] [Green Version]
- Thampy, K.G.; Wakil, S.J. Regulation of acetyl-coenzyme A carboxylase. I. Purification and properties of two forms of acetyl-coenzyme A carboxylase from rat liver. J. Biol. Chem. 1988, 263, 6447–6453. [Google Scholar]
- Mao, J.; DeMayo, F.J.; Li, H.; Abu-Elheiga, L.; Gu, Z.; Shaikenov, T.E.; Kordari, P.; Chirala, S.S.; Heird, W.C.; Wakil, S.J. Liver-specific deletion of acetyl-CoA carboxylase 1 reduces hepatic triglyceride accumulation without affecting glucose homeostasis. Proc. Natl. Acad. Sci. USA 2006, 103, 8552–8557. [Google Scholar] [CrossRef] [Green Version]
- Dentin, R.; Girard, J.; Postic, C. Carbohydrate responsive element binding protein (ChREBP) and sterol regulatory element binding protein-1c (SREBP-1c): Two key regulators of glucose metabolism and lipid synthesis in liver. Biochimie 2005, 87, 81–86. [Google Scholar] [CrossRef]
- Bengoechea-Alonso, M.T.; Ericsson, J. SREBP in signal transduction: Cholesterol metabolism and beyond. Curr. Opin. Cell Biol. 2007, 19, 215–222. [Google Scholar] [CrossRef]
- Deng, Q.; Li, X.; Fu, S.; Yin, L.; Zhang, Y.; Wang, T.; Wang, J.; Liu, L.; Yuan, X.; Sun, G.; et al. SREBP-1c gene silencing can decrease lipid deposits in bovine hepatocytes cultured in vitro. Cell. Physiol. Biochem. 2014, 33, 1568–1578. [Google Scholar] [CrossRef] [PubMed]
- Yoshikawa, T.; Shimano, H.; Amemiya-Kudo, M.; Yahagi, N.; Hasty, A.H.; Matsuzaka, T.; Okazaki, H.; Tamura, Y.; Iizuka, Y.; Ohashi, K.; et al. Identification of liver X receptor-retinoid X receptor as an activator of the sterol regulatory element-binding protein 1c gene promoter. Mol. Cell. Biol. 2001, 21, 2991–3000. [Google Scholar] [CrossRef] [PubMed] [Green Version]
- Higuchi, N.; Kato, M.; Shundo, Y.; Tajiri, H.; Tanaka, M.; Yamashita, N.; Kohjima, M.; Kotoh, K.; Nakamuta, M.; Takayanagi, R.; et al. Liver X receptor in cooperation with SREBP-1c is a major lipid synthesis regulator in nonalcoholic fatty liver disease. Hepatol. Res. 2008, 38, 1122–1129. [Google Scholar] [CrossRef] [PubMed]
- Zhou, J.; Febbraio, M.; Wada, T.; Zhai, Y.; Kuruba, R.; He, J.; Lee, J.H.; Khadem, S.; Ren, S.; Li, S.; et al. Hepatic fatty acid transporter Cd36 is a common target of LXR, PXR, and PPARgamma in promoting steatosis. Gastroenterology 2008, 134, 556–567. [Google Scholar] [CrossRef]
- Li, Y.; Xu, S.; Mihaylova, M.M.; Zheng, B.; Hou, X.; Jiang, B.; Park, O.; Luo, Z.; Lefai, E.; Shyy, J.Y.; et al. AMPK phosphorylates and inhibits SREBP activity to attenuate hepatic steatosis and atherosclerosis in diet-induced insulin-resistant mice. Cell Metab. 2011, 13, 376–388. [Google Scholar] [CrossRef] [Green Version]
- Feldstein, A.E.; Canbay, A.; Angulo, P.; Taniai, M.; Burgart, L.J.; Lindor, K.D.; Gores, G.J. Hepatocyte apoptosis and fas expression are prominent features of human nonalcoholic steatohepatitis. Gastroenterology 2003, 125, 437–443. [Google Scholar] [CrossRef]
- Videla, L.A. Oxidative stress signaling underlying liver disease and hepatoprotective mechanisms. World J. Hepatol. 2009, 1, 72–78. [Google Scholar] [CrossRef]
- Su, L.J.; Zhang, J.H.; Gomez, H.; Murugan, R.; Hong, X.; Xu, D.; Jiang, F.; Peng, Z.Y. Reactive Oxygen Species-Induced Lipid Peroxidation in Apoptosis, Autophagy, and Ferroptosis. Oxid. Med. Cell. Longev. 2019, 2019, 5080843. [Google Scholar] [CrossRef] [Green Version]
- Kim, B.J.; Ryu, S.W.; Song, B.J. JNK-and p38 kinase-mediated phosphorylation of Bax leads to its activation and mitochondrial translocation and to apoptosis of human hepatoma HepG2 cells. J. Biol. Chem. 2006, 281, 21256–21265. [Google Scholar] [CrossRef] [Green Version]
- Xia, Z.; Dickens, M.; Raingeaud, J.; Davis, R.J.; Greenberg, M.E. Opposing effects of ERK and JNK-p38 MAP kinases on apoptosis. Science 1995, 270, 1326–1331. [Google Scholar] [CrossRef]
- Yamamoto, K.; Ichijo, H.; Korsmeyer, S.J. BCL-2 is phosphorylated and inactivated by an ASK1/Jun N-terminal protein kinase pathway normally activated at G(2)/M. Mol. Cell. Biol. 1999, 19, 8469–8478. [Google Scholar] [CrossRef] [PubMed] [Green Version]
- Witek, R.P.; Stone, W.C.; Karaca, F.G.; Syn, W.K.; Pereira, T.A.; Agboola, K.M.; Omenetti, A.; Jung, Y.; Teaberry, V.; Choi, S.S.; et al. Pan-caspase inhibitor VX-166 reduces fibrosis in an animal model of nonalcoholic steatohepatitis. Hepatology 2009, 50, 1421–1430. [Google Scholar] [CrossRef] [PubMed]
- Anstee, Q.M.; Concas, D.; Kudo, H.; Levene, A.; Pollard, J.; Charlton, P.; Thomas, H.C.; Thursz, M.R.; Goldin, R.D. Impact of pan-caspase inhibition in animal models of established steatosis and non-alcoholic steatohepatitis. J. Hepatol. 2010, 53, 542–550. [Google Scholar] [CrossRef] [PubMed]
- Tanaka, M.; Kishimoto, Y.; Sasaki, M.; Sato, A.; Kamiya, T.; Kondo, K.; Iida, K. Terminalia bellirica (Gaertn.) Roxb. Extract and Gallic Acid Attenuate LPS-Induced Inflammation and Oxidative Stress via MAPK/NF-kappaB and Akt/AMPK/Nrf2 Pathways. Oxid. Med. Cell. Longev. 2018, 2018, 9364364. [Google Scholar] [CrossRef] [Green Version]
- Tanaka, M.; Kishimoto, Y.; Saita, E.; Suzuki-Sugihara, N.; Kamiya, T.; Taguchi, C.; Iida, K.; Kondo, K. Terminalia bellirica Extract Inhibits Low-Density Lipoprotein Oxidation and Macrophage Inflammatory Response in Vitro. Antioxidants (Basel) 2016, 5, 20. [Google Scholar] [CrossRef] [Green Version]
- Thompson, M.R.; Xu, D.; Williams, B.R. ATF3 transcription factor and its emerging roles in immunity and cancer. J. Mol. Med. (Berl.) 2009, 87, 1053–1060. [Google Scholar] [CrossRef] [Green Version]
- Jiang, X.; Kim, K.J.; Ha, T.; Lee, S.H. Potential Dual Role of Activating Transcription Factor 3 in Colorectal Cancer. Anticancer Res. 2016, 36, 509–516. [Google Scholar]
- Li, X.; Zang, S.; Cheng, H.; Li, J.; Huang, A. Overexpression of activating transcription factor 3 exerts suppressive effects in HepG2 cells. Mol. Med. Rep. 2019, 19, 869–876. [Google Scholar] [CrossRef] [Green Version]
- Suganami, T.; Tanimoto-Koyama, K.; Nishida, J.; Itoh, M.; Yuan, X.; Mizuarai, S.; Kotani, H.; Yamaoka, S.; Miyake, K.; Aoe, S.; et al. Role of the Toll-like receptor 4/NF-kappaB pathway in saturated fatty acid-induced inflammatory changes in the interaction between adipocytes and macrophages. Arterioscler. Thromb. Vasc. Biol. 2007, 27, 84–91. [Google Scholar] [CrossRef] [Green Version]
- Araujo, J.A.; Zhang, M.; Yin, F. Heme oxygenase-1, oxidation, inflammation, and atherosclerosis. Front. Pharmacol. 2012, 3, 119. [Google Scholar] [CrossRef] [Green Version]


| Species | Gene | Forward Primer (5′ to 3′) | Reverse Primer (5′ to 3′) |
|---|---|---|---|
| Human | CD36 | CAATTAAAAAGCAAGTTGTCCTCGA | ATCACTTCCTGTGGATTTTGCA |
| SLC27A2 | TCTTGGATGACACAGCAAAAATGT | TCAGAGTTTCAGGGTTTTAGCACTT | |
| ACACA | TCGCTTTGGGGGAAATAAAGTG | ACCACCTACGGATAGACCGC | |
| SREBF1 | GAGCCATGGATTGCACTTTC | AGCATAGGGTGGGTCAAATAGG | |
| NR1H3 | AGAAGAACAGATCCGCCTGAAG | TTGCCGCTTCAGTTTCTTCA | |
| BAX | GACGAACTGGACAGTAACATGGA | GCAAAGTAGAAAAGGGCGACA | |
| BCL2 | GAGTACCTGAACCGGCACCT | GAGACAGCCAGGAGAAATCAAAC | |
| ATF3 | TTCTCCCAGCGTTAACACAAAA | AGAGGACCTGCCATCATGCT | |
| GAPDH | TGCACCACCAACTGCTTAGC | GGCATGGACTGTGGTCATGAG | |
| Mouse | Tnf | CAAATGGCCTCCCTCTCATC | CTCCAGCTGCTCCTCCACTT |
| Il1b | TGAGCACCTTCTTTTCCTTCATC | TGTCTAATGGGAACGTCACACAC | |
| Ccl2 | ATGCTTCTGGGCCTGCTGT | GGATCATCTTGCTGGTGAATGAG | |
| Nos2 | AGGACCACCTCTATCAGGAAGAAA | CAGCTGCTTTTGCAGGATGT | |
| Hmox1 | AAGGGTCAGGTGTCCAGAGAAG | GGGAAGTAGAGTGGGGCATAGA | |
| Cat | TATTGCCGTTCGATTCTCCAC | CCCACAAGATCCCAGTTACCA | |
| Gapdh | TGACGTGCCGCCTGGAGAAA | AGTGTAGCCCAAGATGCCCTTCAG |
© 2020 by the authors. Licensee MDPI, Basel, Switzerland. This article is an open access article distributed under the terms and conditions of the Creative Commons Attribution (CC BY) license (http://creativecommons.org/licenses/by/4.0/).
Share and Cite
Tanaka, M.; Sato, A.; Kishimoto, Y.; Mabashi-Asazuma, H.; Kondo, K.; Iida, K. Gallic Acid Inhibits Lipid Accumulation via AMPK Pathway and Suppresses Apoptosis and Macrophage-Mediated Inflammation in Hepatocytes. Nutrients 2020, 12, 1479. https://doi.org/10.3390/nu12051479
Tanaka M, Sato A, Kishimoto Y, Mabashi-Asazuma H, Kondo K, Iida K. Gallic Acid Inhibits Lipid Accumulation via AMPK Pathway and Suppresses Apoptosis and Macrophage-Mediated Inflammation in Hepatocytes. Nutrients. 2020; 12(5):1479. https://doi.org/10.3390/nu12051479
Chicago/Turabian StyleTanaka, Miori, Akari Sato, Yoshimi Kishimoto, Hideaki Mabashi-Asazuma, Kazuo Kondo, and Kaoruko Iida. 2020. "Gallic Acid Inhibits Lipid Accumulation via AMPK Pathway and Suppresses Apoptosis and Macrophage-Mediated Inflammation in Hepatocytes" Nutrients 12, no. 5: 1479. https://doi.org/10.3390/nu12051479