The results of the current study show that LP methodology can provide optimized food baskets for Ethiopia which are (i) nutritionally adequate, (ii) build on locally available foods, (iii) are affordable for a lowest-income family, and (iv) are, within the given cost constraint, optimised for highest possible similarity to national food supply patterns. The cost of such FBs with highest affordability in rural and urban areas was about 44% and 53% of the maximum cost assumed to be spent for food by a family with lowest income. These low-cost FBs, however, differed on average by more than 100% from the reported Ethiopian food group supply (FBS). Linear programming was also shown to be effective to minimize the average deviation from the reported food group supply to less than 20% when the FBs were allowed to cost the maximum of what can be afforded by a family with lowest income.
In 2016, more than one third (38%) of the children under five were stunted ([
1]. Stunting is less common in Addis Ababa (15%), but more common in rural areas (up to 46%). Also, children from the poorest households and whose mothers have no education are more likely to be stunted (45% and 42% respectively) [
1]. Stunting is an indication of chronic undernutrition which leads to increased risk of NCDs in adulthood, along with poor socio-economic development [
3,
36]. Stunting can be largely prevented if the family food eaten meets nutrient and dietary diversity recommendations.
4.1. Food Balance Sheet Data
Diet diversity in Ethiopia is in general extremely low, and while some regions have slightly higher dietary diversity than others, the limited diversity and overdependence on starchy staples is a nationwide problem in both rural and urban populations. Ethiopia scores the lowest of 125 countries according to the food quality dimension of the Oxfam “Good Enough to Eat” index, which measures diet diversification [
37]. The results of this study show that the list of foods reported in the Ethiopian food supply (
Table 1) [
33] is deficient in PUFAs, iron, folate, iodine, calcium, and in vitamins A and C. These results are consistent with data from the Ethiopian food consumption survey [
4] where only just over one third (38%) of children aged 6–23 months consumed foods rich in vitamin A and less than one quarter (22%) consumed foods rich in iron the day before the survey was conducted.
A more than six-fold regional variation exists between intakes of vitamin A rich foods in rural areas (11%) compared urban ones, e.g., Addis Ababa (69%) [
4]. The intake of both vitamin A and iron-rich foods increase with household wealth and maternal education so that the prevalence of anaemia is more common in poorest households (68%), where women have no education (58%); and in rural (58%) compared with urban areas (49%) [
1].
Most of the iron in the Ethiopian food supply (
Table 1) comes from plant food sources which have low iron bioavailability [
38]. Bioavailability can be improved by parallel consumption of meat or foods rich in vitamin C [
39]. Therefore, an important recommendation within Ethiopian dietary guidelines would be to ensure that foods rich in vitamin C, such as citrus fruits, mango, papaya, and watermelon, are consumed at the same time as cereals in order to improve iron bioavailability.
According to the analyzed FBS data, iodine in Ethiopian food supply (
Table 1) is insufficient. In contrast, the EDHS reported in 2016 that iodized salt is widespread and there are no large differences in quantities consumed by household wealth or residence [
1]. Nine in ten families have iodized salt in their household and its use has greatly improved between 2011 and 2016 (15 to 89% households). However the concentration levels may be inadequate given the high number of women (36%) and children (40%) suffering from iodine deficiency [
4] and optimum iodization of salt should be considered important in Ethiopia’s dietary guidelines.
4.2. Low Cost Food Baskets with Little Diversity
Given that the risk of chronic malnutrition is high in low income families [
15], this study attempts to find the most cost effective nutritionally adequate food baskets (
Table 3). Using the LP methodology with minimized cost as the goal function, a list of foods (16 and 19, respectively, for rural and urban) that fulfilled all nutritional recommendations for a family of five was calculated (
Table 3), costing 31.0 and 38.1 ETB per day, respectively. These food baskets contained around (i) 58% cereals and grains, (ii) 18% roots and tubers, (iii) 10% legumes, (iv) about 8% of vitamin A-rich fruits, and (v) vegetables, plus the urban basket contained 4% dairy products.
However, these least costly nutritionally adequate food baskets (
Table 3), being calculated for one day, contain only a low number of foods and thus a lack of dietary diversity. Moreover, there is a high deviation from the reported Ethiopian food supply (FBS) [
33]. Thus, these baskets are unlikely to be acceptable in the long term. In order to design baskets that are more acceptable, it has been suggested to calculate examples where the foods selected are as similar as possible to either national dietary intakes or national FBS [
13,
19]. When local eating preferences are applied from the start as constraints into LP, it might not be possible to meet all RNIs by 100%. In a study aiming to develop a food guide for Benin that included local eating habits into the LP model, the lower thresholds of calcium, zinc, iron, and folic acid had to be reduced to 64–70% of the RNI recommended by the World Health Organization [
40]. In contrast to this approach, the current paper suggests to improve a nutritionally adequate FB with highest affordability (
Table 3), which is very distinct from prevailing food supply patterns, towards a FB that is as similar as possible to the FBS profile within the given maximum cost (
Table 5).
4.3. Similarity to Food Balance Sheets
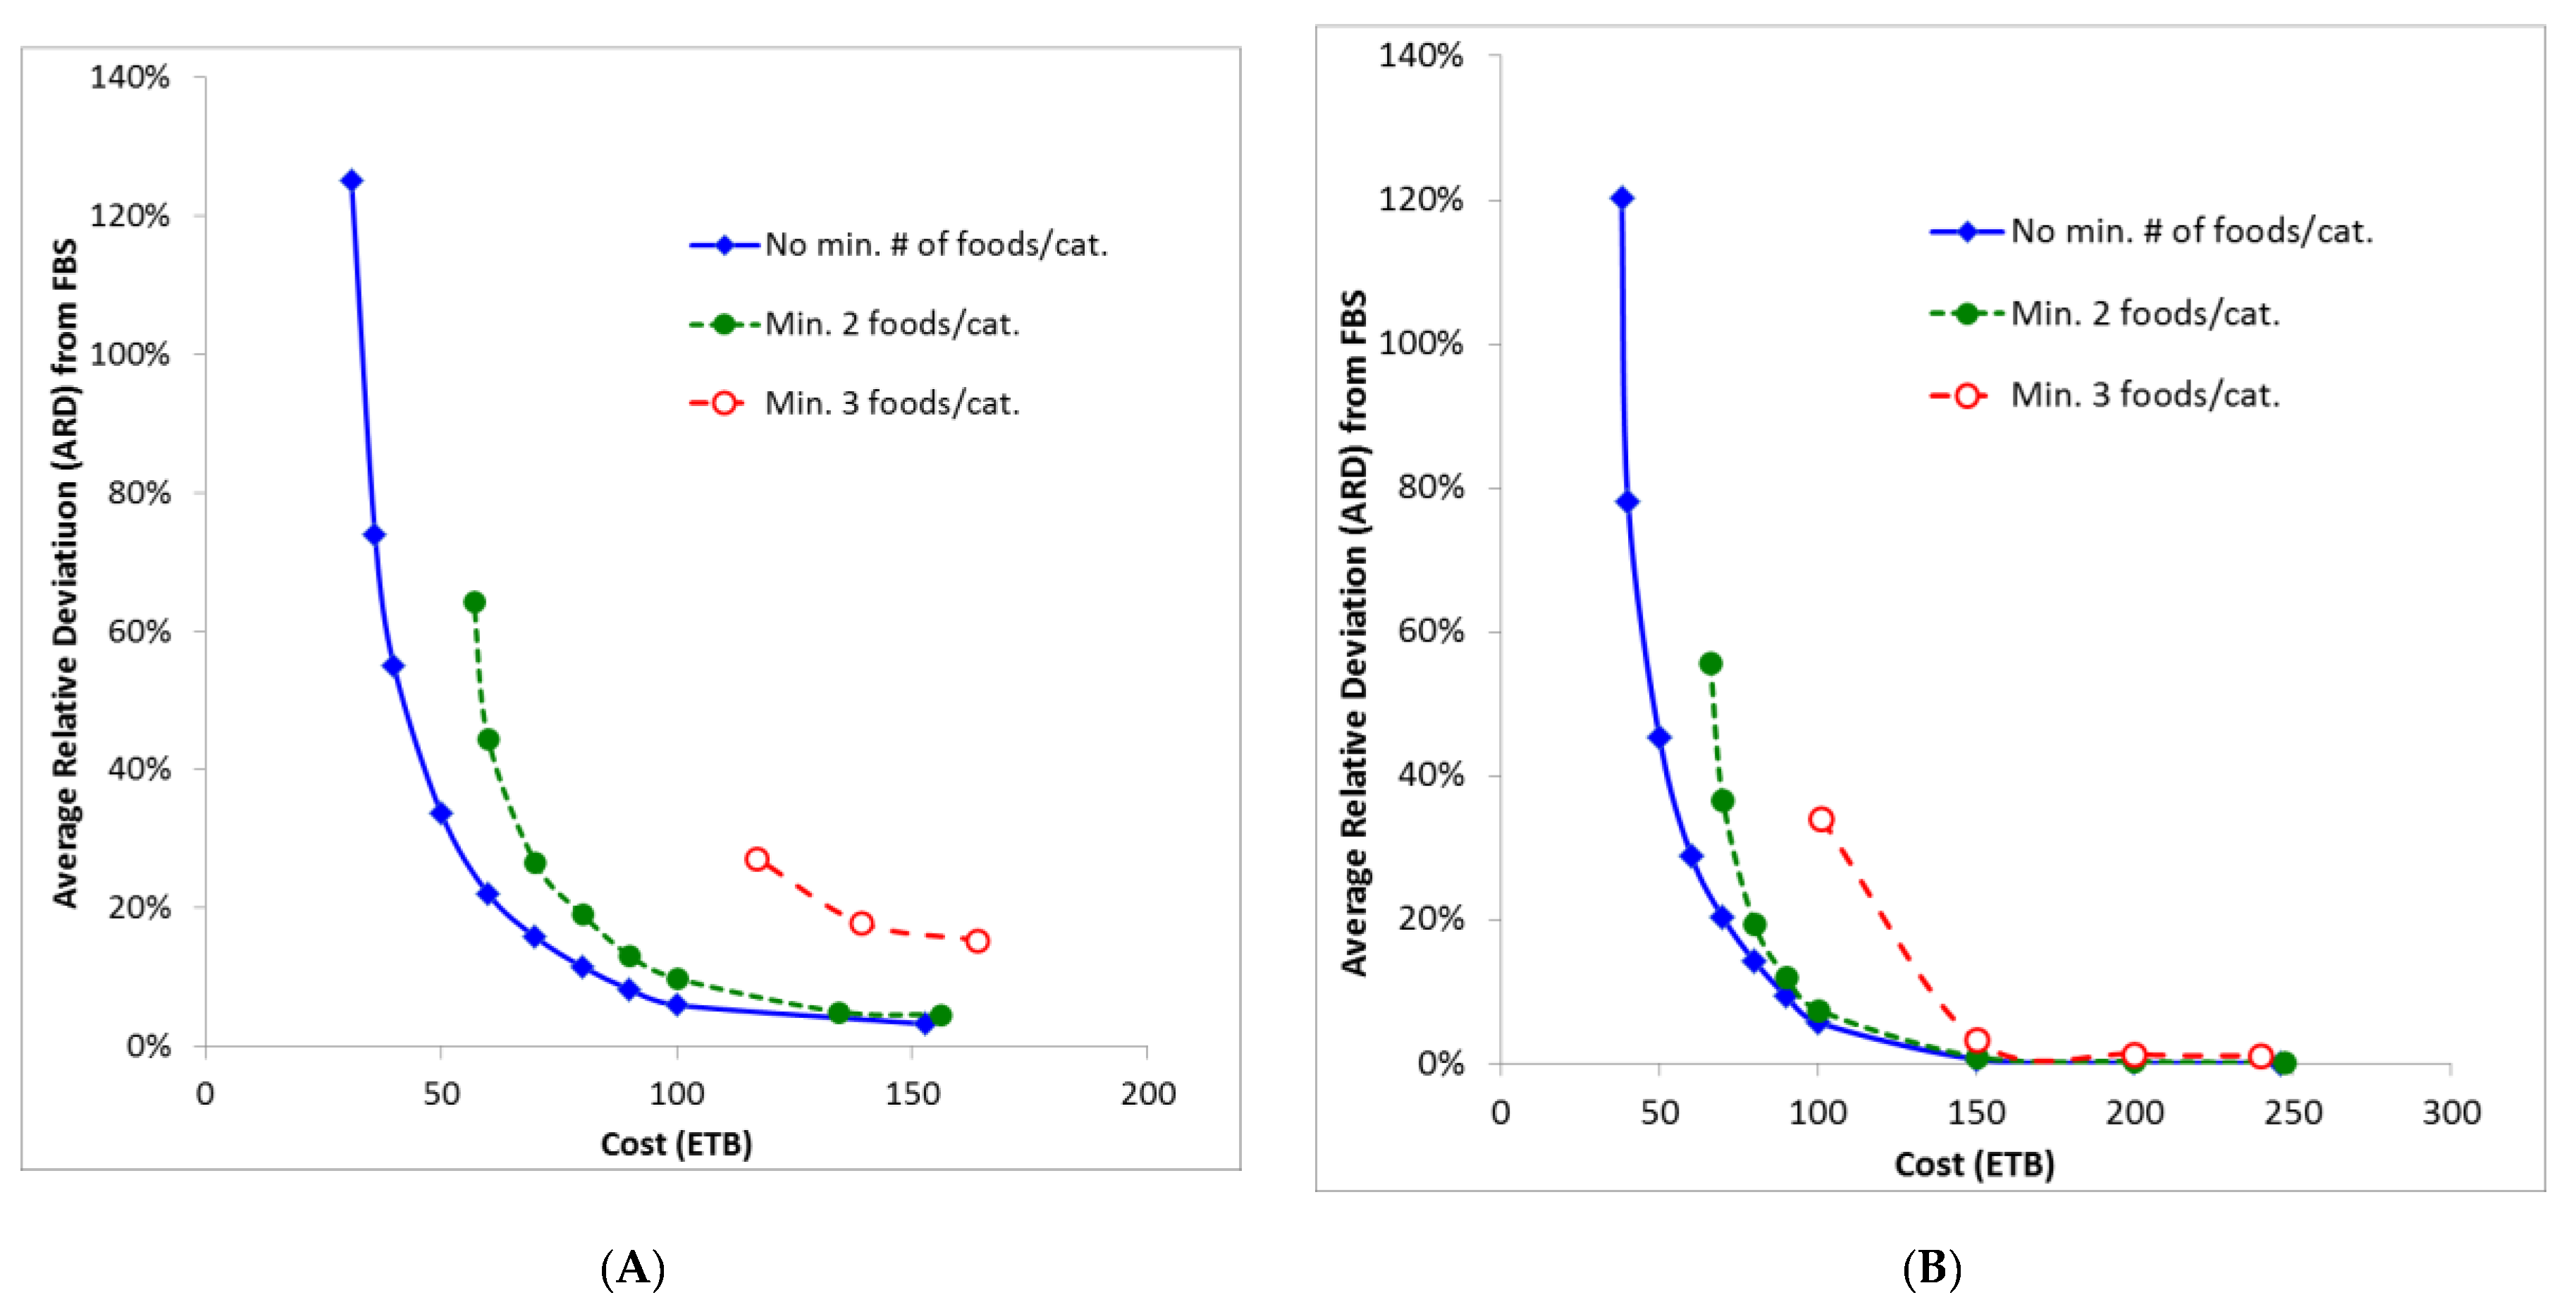
When baskets were optimized to mirror as closely as possible the food balance sheets, the number of foods increased to 64 and 79 and to an ETB cost of 153 and 246 per day for rural and urban baskets, respectively. Clearly, this cost is prohibitive for the majority of low income families. Even with a calculated average deviation from the food balance sheets of around 10%, the cost is still high at ETB 84 and 90 per day, respectively.
In this study, the optimized baskets discussed so far are either prohibitively costly or, if affordable, they are lacking in dietary diversity and so, in the long term, chronic malnutrition will develop. This is in line with results from the Ethiopian food intake survey [
4] where children and women are reported to have insufficient intakes of several micronutrients. The authors recommend improved dietary diversity, including increased consumption of animal products, legumes, fruits, and vegetables. Moreover, they suggest increasing intakes of protein, vitamin A, vitamin C, zinc, iron, calcium, and folate. Indeed, according to WHO the minimum dietary diversity recommended for children is that their intake should come from at least four out of seven food groups [
1,
41] containing at least one fruit or vegetable in addition to cereals [
41].
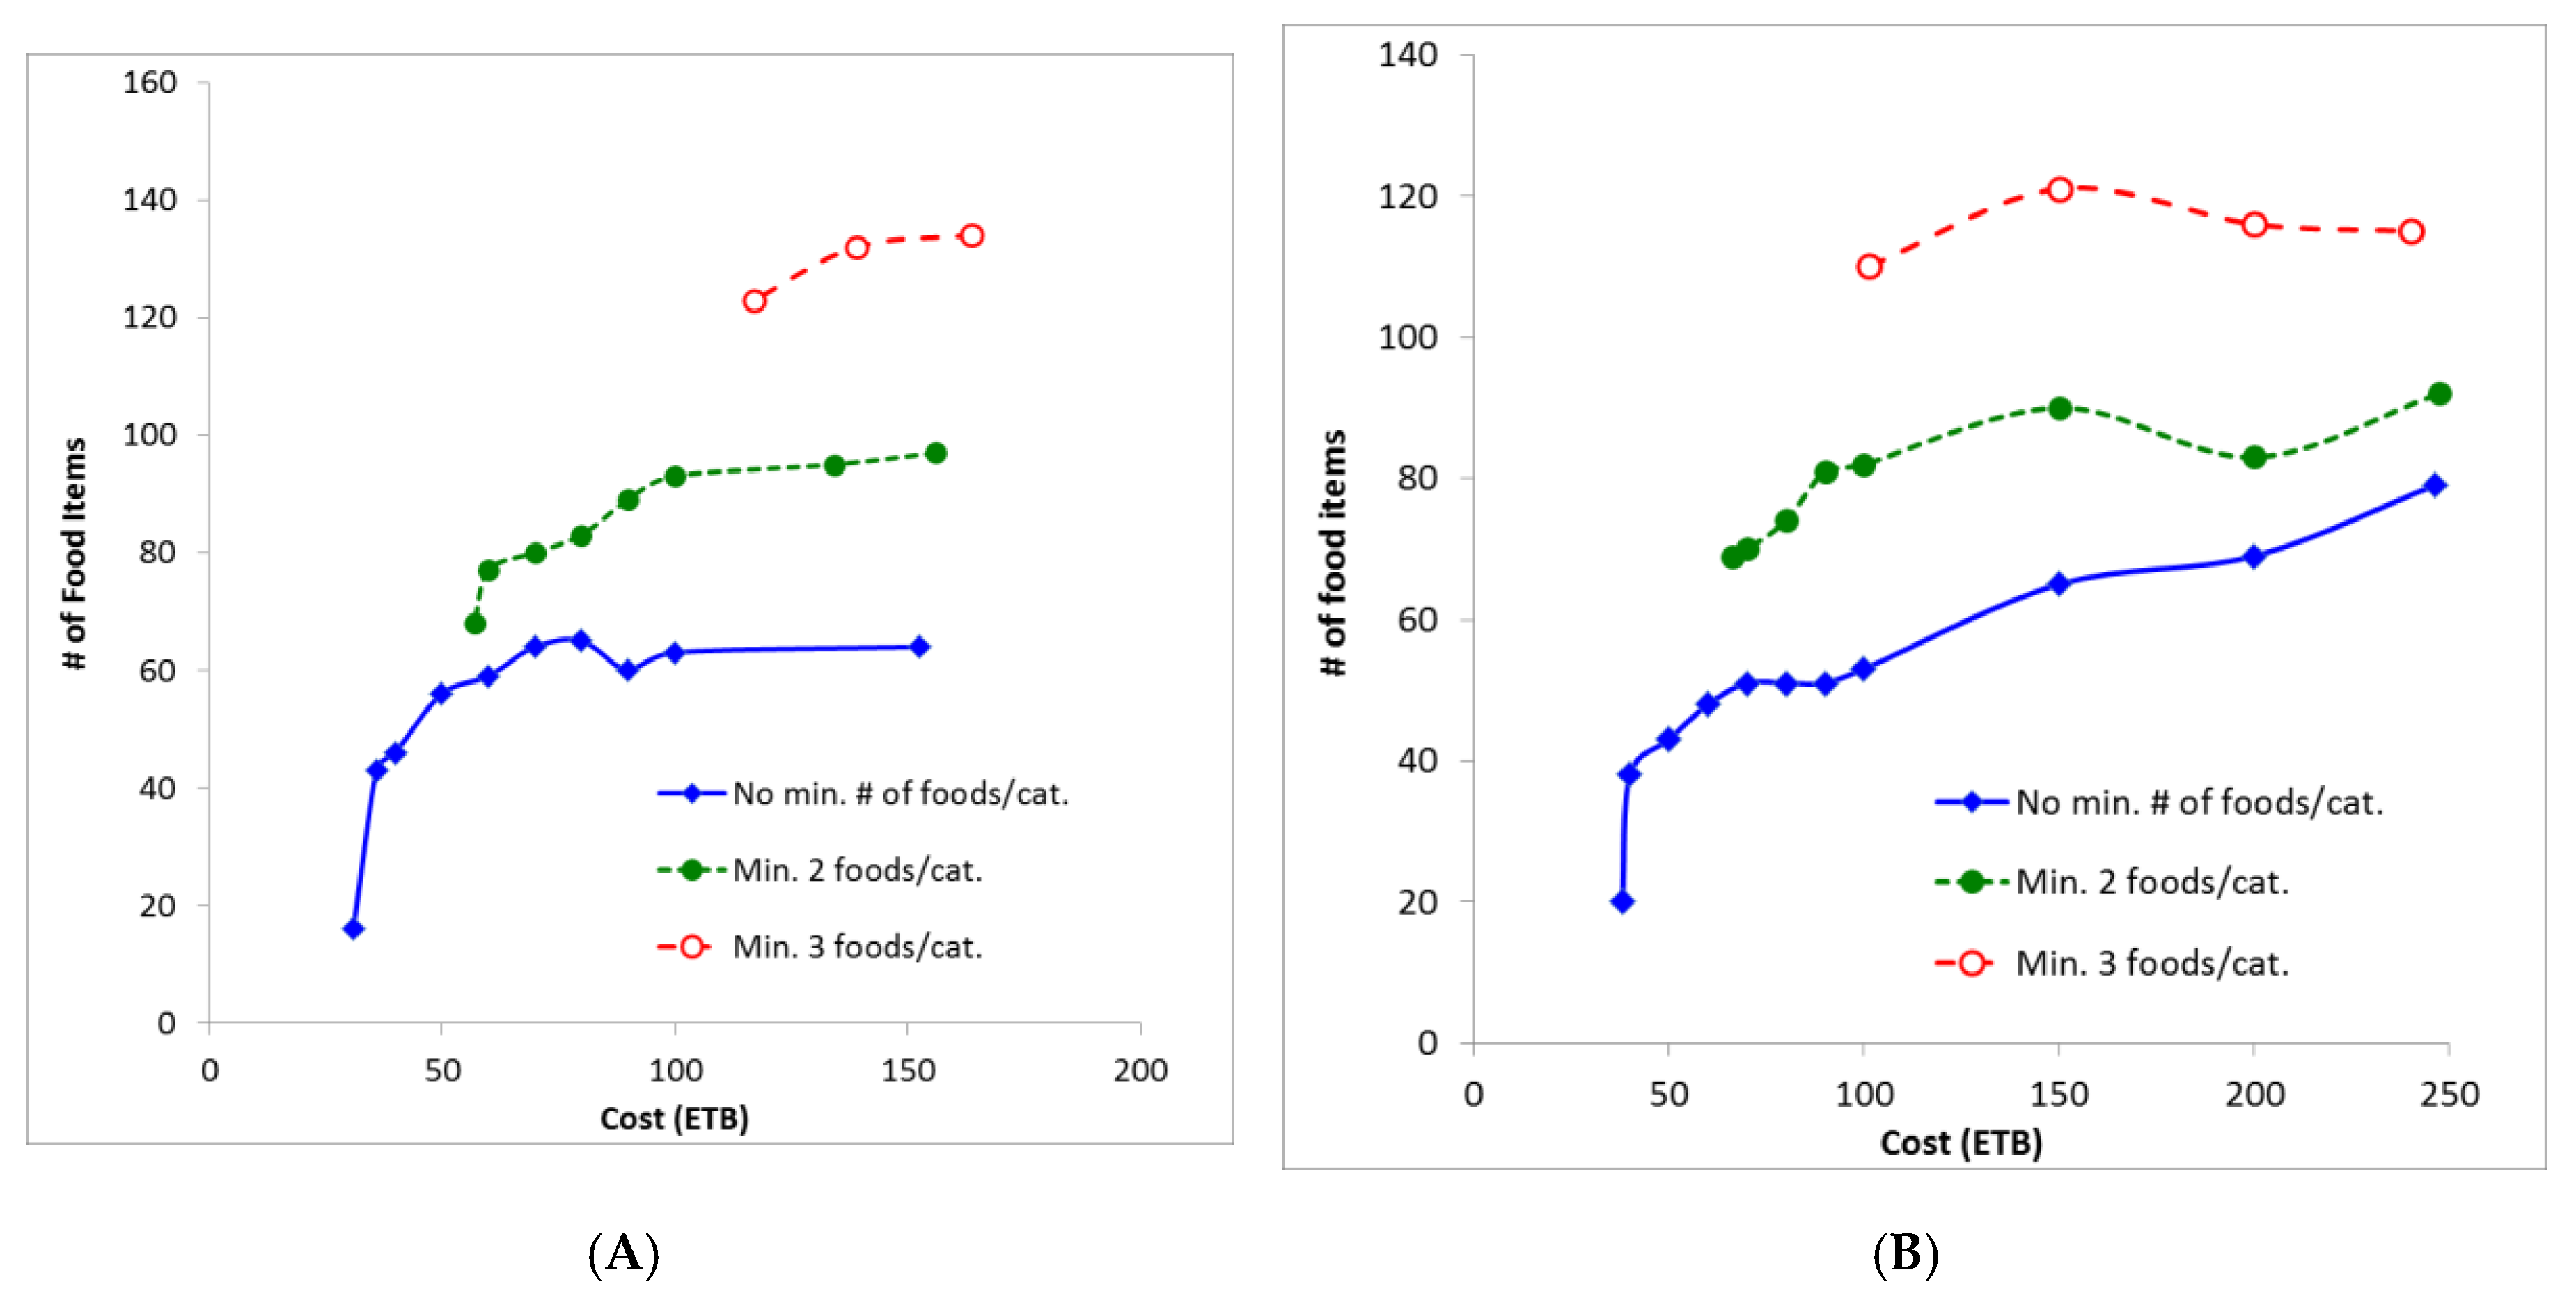
As shown in
Figure 2, the cost-neutral steep increase of food items in the FBs is first effective at a cost around 70 ETB in both FBs. Thus, families not earning enough to cover this (i.e., those spending a maximum of 71.4 ETB) required further consideration in this study.
Given that 50% of Ethiopians have only on average ETB 71.4 per household/day to spend on food and non-alcoholic beverages, nutritionally adequate food baskets were optimized using a cost constraint corresponding to this amount. A list of 64 and 48 foods were generated for the rural and urban baskets, respectively (
Table 5). The World Health Organization recommends, within the time frame of a week, a minimum of 20 to 30 biologically distinct food types, with an emphasis on plant foods, as a basis for dietary guidelines [
42]. This WHO recommendation, even for Ethiopian households living on the lowest income, is fulfilled (
Table 5). However, the deviation from the FBS is high (ARD values of 15% and 19%), indicating that the list of foods generated for these lowest income Ethiopians is not similar to their available food supply.
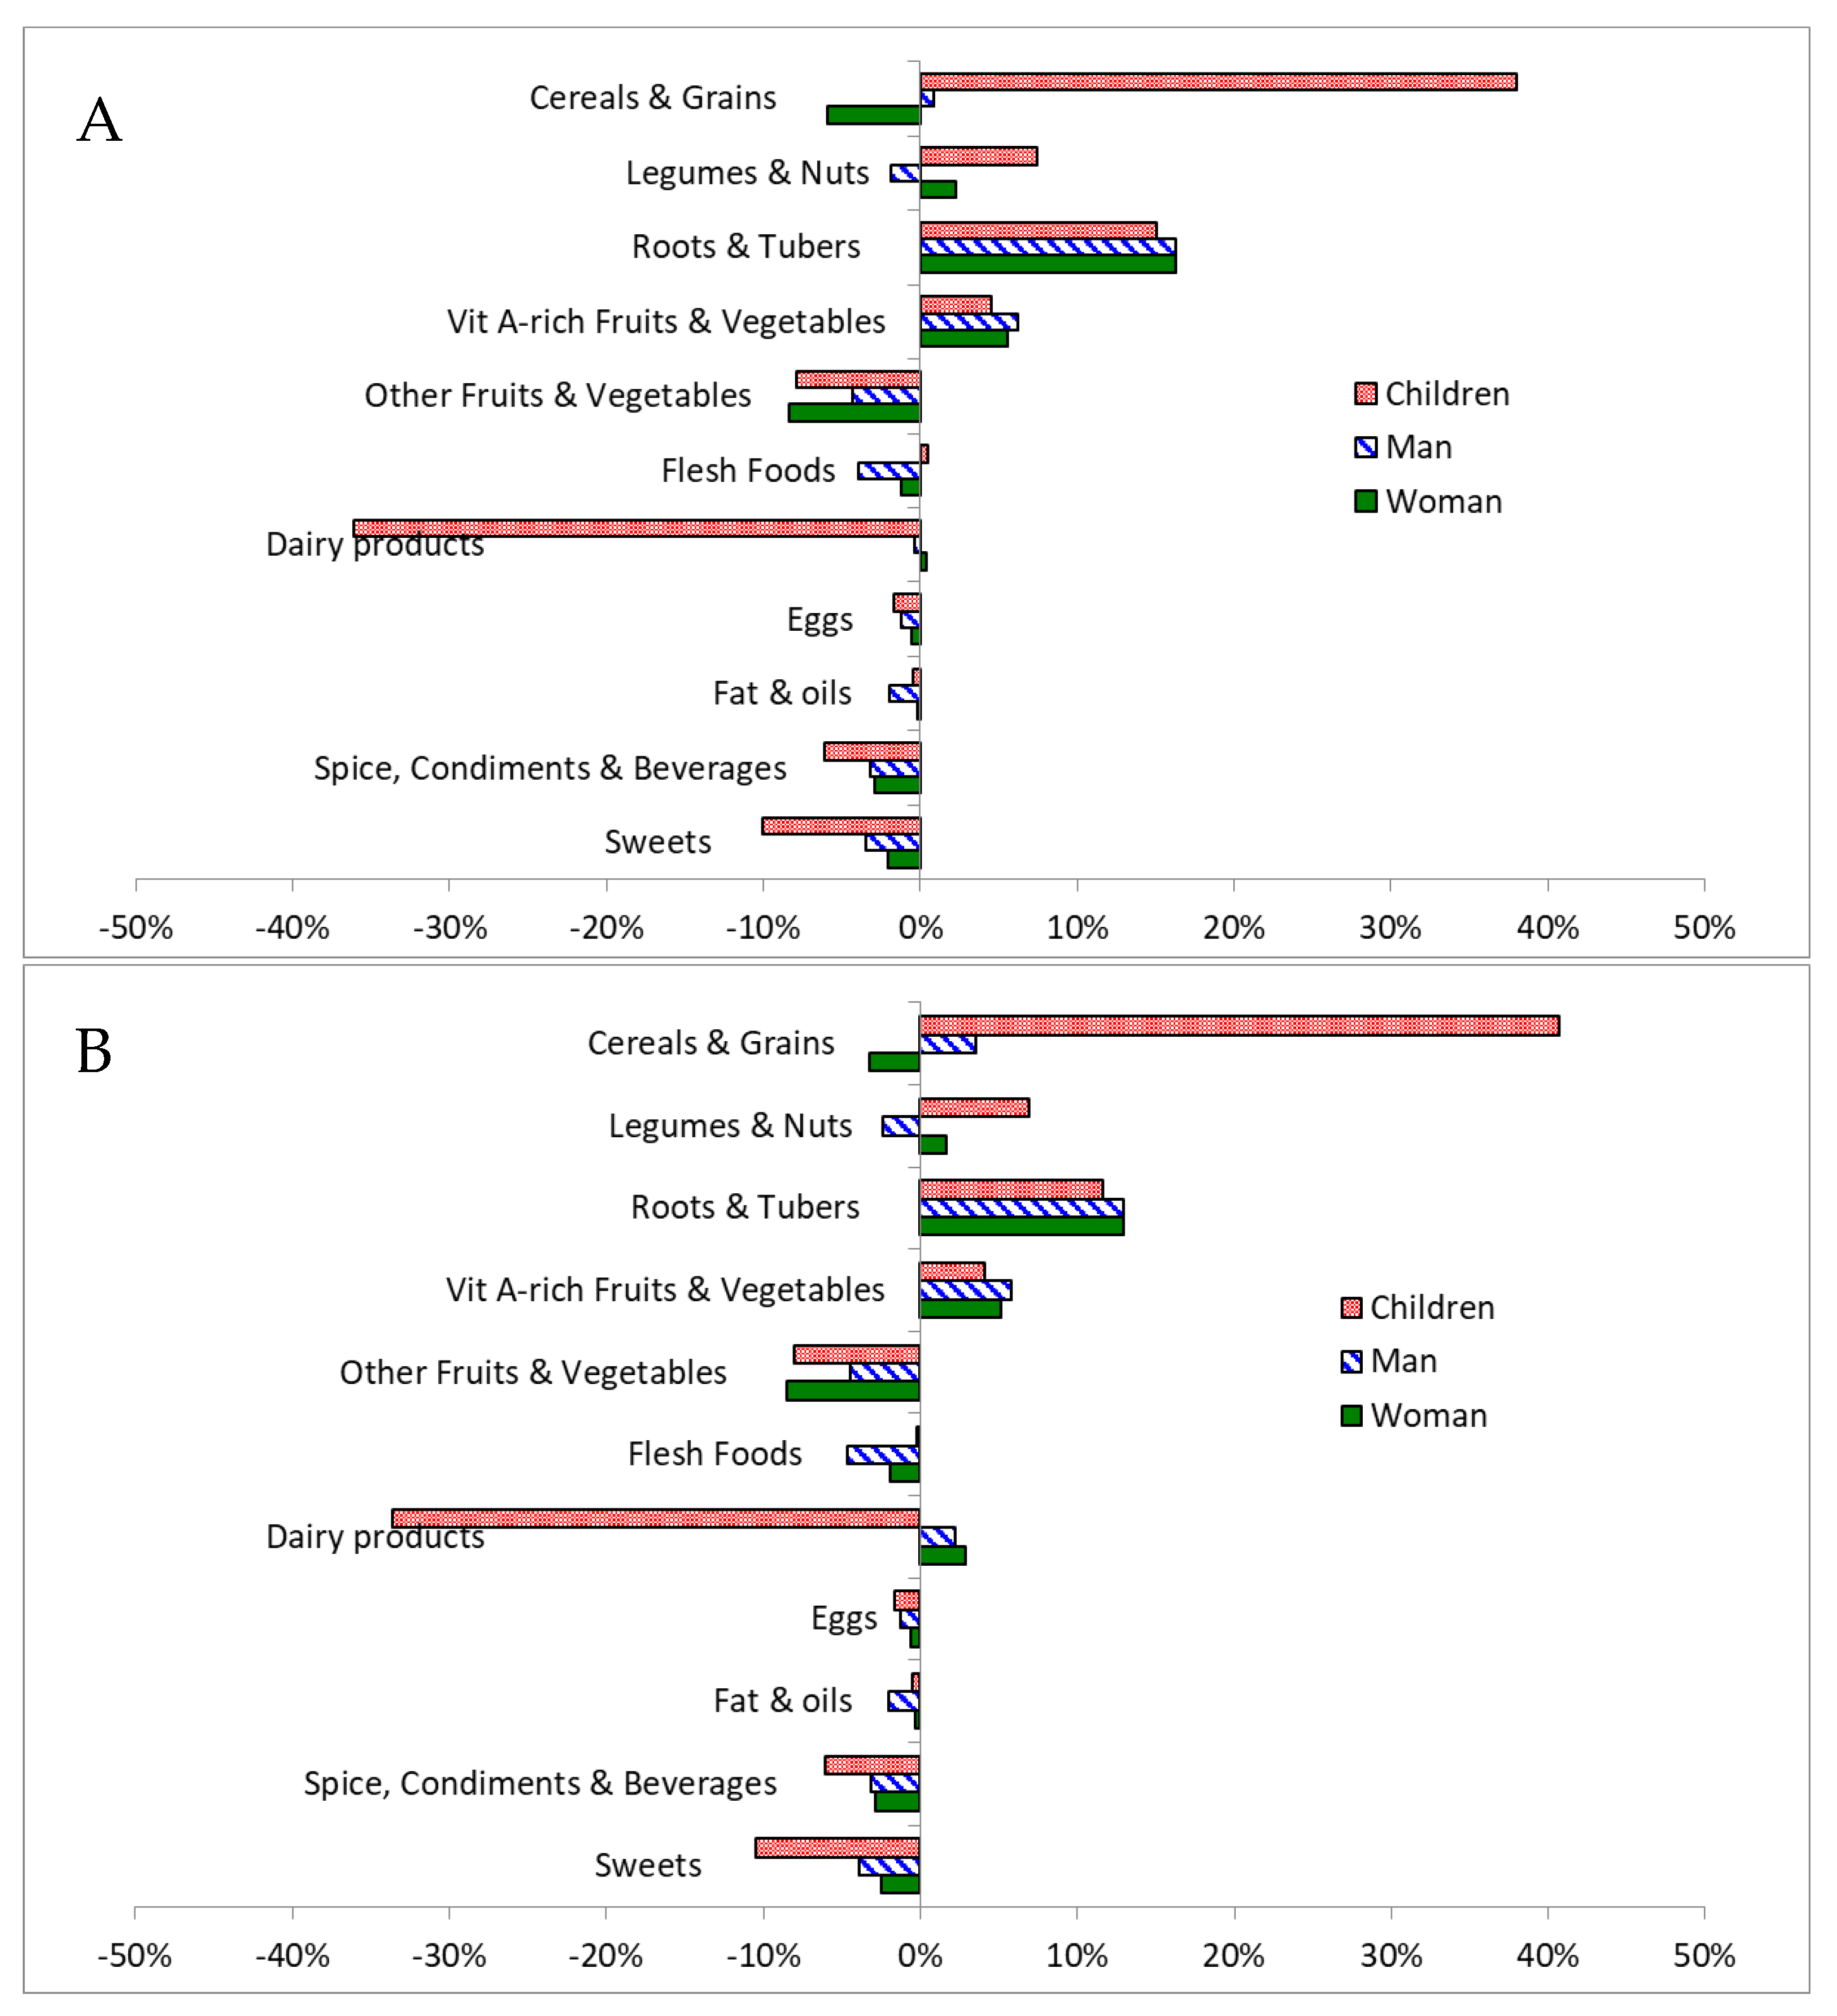
Compared with the most affordable nutritionally adequate baskets (rural: ETB 31, urban 38.1), the FBs affordable for ETB 71.4 contained (i) less legumes and nuts (10% vs. 18% and 15%, rural and urban, resp.), (ii) more roots and tubers (18% and 15% vs. none), (iii) similar proportions of vitamin A-rich fruits and vegetables (8% vs. 11% in both baskets), and (iv) less grains and cereals (58% and 61% vs. 67% in both FBs). Additionally, the urban basket contained more dairy products (4% vs. none) (
Table 3 and
Table 5). Thus, when the ETB amount used as cost constraint is higher, the LP optimization algorithm calculates a more diverse range of foods that matches more closely food availability and food intake (
Figure 1) [
33].
Clearly there is a large discrepancy between the amounts of ETB Ethiopian families have to spend compared with the cost of a nutritionally adequate, sufficiently diverse diet. For example, over half the vegetables and fruits are bought in local markets at relatively high prices [
12]. Possibly as a consequence, none of the nutritionally optimized FBs contain anywhere near the WHO’s dietary guideline of at least 400 g of fruits and vegetables per day [
42]. Indeed, Ethiopia scores lowest among 187 countries for fruit consumption, and second lowest for vegetable consumption [
43]; for example, only 14% of women report consuming dark leafy vegetables on the previous day, only 10% any other vitamin A–rich vegetable or fruit, and only 18% other vegetables [
4].
It is not clear why this intake is so low, and through Ethiopia’s Productive Safety Net Program [
44], health and agricultural extension workers are promoting homestead gardens which, if adopted at scale, could improve the affordability of vegetables and fruit. Indeed, many rural families in Ethiopia produce their own food and therefore may be able to provide parts of the recommended FBs at lower cost, i.e., when focusing on foods that can provide micronutrients that are critical for the cost of the FB such as fruits and vegetables. A higher availability of fruits and vegetables would lead to falling prices, making these foods more readily available for everyone.
In the short term, it is practically unlikely that Ethiopians can implement a dietary guideline of at least 400 g of vegetable and fruit per day. This may exacerbate the risk of double burden of malnutrition where increasing rates of obesity, combined with the high prevalence of stunting [
45] will lead to more NCDs. Indeed the prevalence of diabetes is estimated to double between 2011 and 2030, from 1.4 million to 2.7 million in Ethiopia [
46]. To help prevent this escalation in NCDs, Ethiopian dietary guidelines are needed. The use of LP can help develop, especially for low income families, dietary guidelines and household practices that meet micronutrient and fibre recommendations while being as close as possible to the availability and reported intake of food in Ethiopia.
4.5. Limitations
The cost of the food baskets in this study only applies to the purchase of food, and it does not cover expenses related to food preparation such as energy, transport, cooking equipment, and time. The FBs are designed for a reference Ethiopian family of five and do not apply to people with special nutritional needs such as pregnant women, older people, and people with food intolerance or allergy.
As indicated previously, food balance sheets only provide per capita estimates and do not contain information necessary to tailor individual solutions segregated by sex, age, and socio-economic status [
47]. Also, FBS may lead to overestimation of food consumption and nutrient intake as they do not take into account avoidable food waste. However, unavoidable food waste has been considered by using yield information for each commodity, and previous studies have shown a close correlation between FBS data and food consumption estimates [
47].
Ethiopia is a large country and food prices and availability may vary beyond the data used in this study. Additionally, the collected food prices may vary depending on the season. More than half of Ethiopians are Orthodox Christians [
1] who practice fasting, which can last over two thirds of one year (250 days) [
48], when they do not consume animal products such as meat or dairy. Therefore, more studies are needed to investigate the extent of veganism and religious fasting and its impact on malnutrition. Investigations, such as those proposed by Ethiopian Public Health Institute and Wageningen University in the Netherlands [
49], are needed to look into what kind of Food Based Dietary Guidelines are needed and how they can be disseminated the best in areas where nutrition deficiencies are most prevalent. Such studies should also include home-grown food originating from, e.g., home gardens, which was not done in this study.

 ,
, 


