Preparation of Fe3O4@polyoxometalates Nanocomposites and Their Efficient Adsorption of Cationic Dyes from Aqueous Solution


Henan Key Laboratory of Polyoxometalates, Institute of Molecular and Crystal Engineering, College of Chemistry and Chemical Engineering, Henan University, Kaifeng 475004, China
*
Authors to whom correspondence should be addressed.
Nanomaterials 2019, 9(4), 649; https://doi.org/10.3390/nano9040649
Submission received: 10 March 2019
/
Revised: 15 April 2019
/
Accepted: 16 April 2019
/
Published: 23 April 2019
Abstract
:In this work, two magnetic adsorbents Fe3O4@1 and Fe3O4@2 were prepared by combining Fe3O4 nanoparticles and polyoxometalate hybrids [Ni(HL)2]2H2[P2Mo5O23]·4H2O (1), [H2L]5H[P2Mo5O23]·12H2O (2) (HL = 2-acetylpyridine-thiosemicarbazone). The temperature-dependent zero-field-cooled (ZFC) and field-cooled (FC) measurements indicated the blocking temperature at 160 K and 180 K, respectively. The Brunauer–Emmett–Teller (BET) surface area of Fe3O4@1 and Fe3O4@2 is 8.106 m2/g and 1.787 m2/g, respectively. Cationic dye methylene blue (MB) and anionic dye methyl orange (MO) were investigated for selective dye adsorption on Fe3O4@1 and Fe3O4@2. The two adsorbents were beneficial for selective adsorption of cationic dyes. The adsorption efficiency of MB was 94.8% for Fe3O4@1, 97.67% for Fe3O4@2. Furthermore, the two adsorbents almost maintained the same adsorption efficiency after seven runs. The maximum MB adsorption capacity of Fe3O4@1 and Fe3O4@2 is 72.07 and 73.25 mg/g, respectively. The fourier transform infrared (FT-IR) and X-ray photoelectron spectroscopy (XPS) spectra of the adsorbents collected after adsorption of MB are very similar to the initial as-synthesized Fe3O4@polyoxometalates indicating the high stability of the two adsorbents. The adsorption kinetics indicated that the MB removal followed the pseudo-second-order model. These results showed that the two adsorbents had a potential application in treating wastewater.
1. Introduction
With industrial development, organic dyes have been one of the major water pollutants that cause serious environmental problems and threaten human health due to their toxicity [1,2]. Therefore, it is very urgent to develop advanced materials for dye removal. To date, two main strategies have been broadly explored. One strategy is photocatalytic degradation [3,4,5]. The process is an advanced oxidation, which is carried out under light irradiation. However, the activity of photocatalytic materials depends on their surface area, band gap, and electron pair generation to degrade dyes [6,7,8,9]. The other strategy is the adsorption process, which is recognized as the most simple, efficient and economic method for dye removal from water [10]. Activated carbon and silica, with large porous surface area, have been widely used in liquid-phase purification processes [11]. However, slow kinetics of adsorption, inadequate adsorption capacity, dye specificity and insufficient potential for recycling limit the use of traditional dye adsorbents.
Polyoxometalate hybrid systems provide a new pathway for combining multiple functional groups in a nano structure, which demonstrates great potential for application in selective adsorption [12]. Phosphomolybdates are a unique class of polyoxometalates, which have attracted increasing attention owing to its unique structure and potential application in the removal of dyes [13,14]. In particular, Strandberg-type phosphomolybdate [P2Mo5O23]6− has been extensively studied. Thiosemicarbazones are of special application in efficient dye removal due to their amine and pyridyl, which are beneficial for the formation of hydrogen bonds and π–π stacking interactions [15]. Transition metal ions have been used for the removal of dyes due to coordination with most of organic dyes containing –C=C–, –N=N– and heterocyclic compounds [16]. Thus, it is possible to form a polyoxometalate hybrid to enhance the adsorption efficiency by combining [P2Mo5O23]6− with nickel (II) and HL. Nevertheless, there is a problem separating them from water. In order to resolve this problem, it will be a good choice to load the complex on to the nanocarriers. Fe3O4 magnetic nanoparticles are widely explored due to their exceptional physicochemical properties, low cost, simple preparation process and easy isolation [17,18].
Herein, two nanocomposites, Fe3O4@1 and Fe3O4@2 were synthesized by combining Fe3O4 nanoparticles and pre-synthesized polyoxometalate hybrids 1, 2. Fe3O4@1 and Fe3O4@2 were explored in the adsorption of methylene blue (MB) and methyl orange (MO), and it turned out that the two nanocomposites had high efficiency for selective adsorption of cationic dyes. Furthermore, the stability and recyclability of Fe3O4@1 and Fe3O4@2 were also studied. The two nanocomposites could be isolated easily from the sample solution by applying an external magnetic field. These results proved that the two magnetic nanocomposites could be of interest in treating wastewater.
2. Experiment Section
2.1. Materials and Measurements
All chemicals were used as purchased without purification. The Fe3O4 nanoparticles were synthesized as previously described [19]. The structures and grain sizes of two nanocomposites were analyzed by X-ray diffraction (XRD, X’Pert Pro, Bruker, Karlsruhe, Germany) using Cu Kα radiation and transmission electron microscopy (TEM, JEOL 2010F, JEOL Ltd., Tokyo, Japan) including the mode of high resolution (HRTEM). Elemental analyses (C, H and N) were implemented on a Flash 2000 analyzer (Elementar, Hessia, Germany). Inductively coupled plasma analysis was performed on an Optima 2100 DV (PerkinElemer, Waltham, MA, USA). The fourier transform infrared (FT-IR) spectra were measured on a VERTEX 70 (Bruker, Karlsruhe, Germany) using KBr pellets in the range of 4000–500 cm−1. The ultraviolet–visible (UV–vis) absorption spectra were obtained with a TU–1900 spectrometer (Beijing Purkinje General Instrument Co., Ltd., Beijing, China) at room temperature. The magnetic property was investigated by a vibrating sample magnetometer (VSM) and physical property measurement system (PPMS) (Lakeshore 7300, Quantum Design, San Diego, CA, USA). X-ray photoelectron spectroscopy (XPS) was observed on a Thermo ESCALAB 250XI photoelectron spectrometer with Al Kα X-ray as the excitation source (ThermoFisher Scientific, Waltham, MA, USA). The N2 absorption-desorption isotherms for determining the Brunauer–Emmett–Teller (BET) surface area were obtained with an ASAP 2460 Micromeritics instrument (Micromeritics, Norcross, Georgia) at 77 K.
2.2. Preparation of [Ni(HL)2]2H2[P2Mo5O23]·4H2O (1)
A mixture of Ni(ClO4)2·6H2O (0.093 g, 0.25 mmol), HL (0.098 g, 0.5 mmol), methanol (10 mL) and H2O (15 mL) was stirred at 60 °C for 30 min. After cooling to room temperature, a 10 mL aqueous solution of Na2MoO4·2H2O (0.242 g, 1.0 mmol) was added, then the pH value was adjusted from 6.57 to 3.0 with H3PO4 (85%) under continuous stirring. The mixture was stirred for another 30 min at 60 °C, cooled and filtered. The filtrate was allowed to stand for slow evaporation at room temperature. Brown blocky crystals of 1 were collected in about 63.9% yield (based on Ni) after five days. Elemental analysis for C32H50Mo5N16Ni2O27P2S4: calcd (%): C 20.46, H 2.68, Mo 25.54, N 11.93, Ni 6.25, P 3.30; Found (%): C 20.56, H 2.60, Mo 25.74, N 12.01, Ni 6.45, P 3.37. IR (KBr, cm−1): 3442 (w), 3278 (w), 3165 (w), 1615 (s), 1477 (w), 1377 (s), 1315 (w), 1187(w), 1107(w), 1056 (m), 928 (s), 873 (w), 780 (w), 703 (s).
2.3. Preparation of [H2L]5H[P2Mo5O23]·12H2O (2)
A 25 mL solution (Vmethanol/Vwater = 2/3) containing HL (0.098 g, 0.5 mmol) was stirred at 60 °C for 30 min. After cooling to room temperature, a 10 mL aqueous solution of Na2MoO4·2H2O (0.242 g, 1.0 mmol) was added, then the pH value was adjusted from 7.48 to 3.0 with H3PO4 (85%) under continuous stirring. The mixture was stirred for another 30 min at 60 °C, cooled and filtered. The filtrate was allowed to stand for slow evaporation at room temperature. After three days grass green crystals of 2 were collected in about 53.6% yield (based on Mo). Elemental analysis for C40H80Mo5N20O35P2S5: calcd (%): C 22.84, H 3.83, Mo 22.81, N 13.32, P 2.95; Found (%): C 22.94, H 3.78, Mo 22.68, N 13.77, P 2.88. IR (KBr, cm−1): 3400 (w), 3272 (w), 3173 (w), 1621 (s), 1454 (w), 1370 (w), 1245 (m), 1151(m), 917 (s), 837 (w), 693 (s).
2.4. Preparation of Nanocomposites Fe3O4@1 and Fe3O4@2
Fe3O4@1 was synthesized by ultrasonic method. A mixture of reactants was obtained by adding 1 (50 mg) and Fe3O4 (7.5 mg) into a 25 mL beaker containing water (5 mL) and ethanol (5 mL). After ultrasound for 10 h, a uniform and turbid liquid was obtained. Then the resulting products were collected using a magnet putting on one side of the beaker to separate them from the turbid liquid. The production was washed with water several times. The weight ratio of 1 in Fe3O4@1 was 96.68% (Figure S1).
The preparation process of Fe3O4@2 was similar to Fe3O4@1 except that 1 (50 mg) was replaced by 2 (50 mg). The weight ratio of 2 in Fe3O4@2 was 96.50% (Figure S1).
2.5. X-ray Crystallographic Study
The suitable single crystals of two hybrids 1–2 were selected and encapsulated in two glass tubes, respectively, then transferred to a X-ray single crystal diffractometer (SMART APEX-II CCD) at 296(2) K. Routine Lorentz and polarization corrections were used. Absorption correction was on the basis of multiple and symmetry equivalent reflections in data set with the SADABS program. The structures were solved by direct methods and refined by full-matrix least-squares on F2 using the SHELXL program package [20,21]. No hydrogen atoms related to the water molecules were located from the disparate Fourier map. The crystallographic data and structure refinements for hybrids 1–2 were summarized in Table 1. The CCDC number of 1 and 2 is 1872074 and 1872075, respectively.
2.6. Adsorption Experiments
The typical adsorption process is as follows: the adsorbent (25.0 mg) were added to the MB aqueous solution (15 mL) at a concentration of 15 mg/L. The solutions were magnetically stirred (800 rpm) at room temperature in the dark. At several time intervals, the 4 mL solution was removed and analyzed using a UV–vis spectrophotometer at the calibrated maximum wavelength of 664 nm. The supernatant was collected at different time intervals for a kinetic study. The percentages of MB removal and equilibrium adsorption capacity (qe) of the two nanocomposites were calculated using Equations (1) and (2) as follows [22,23]:
where C0 and Ce are the initial and equilibrium concentrations of MB in the water, Ct is the concentration of MB at any specified time t, A0 and At represent the initial and the time t absorbance of MB at 664 nm, V is the volume of MB solution and W is the mass of adsorbent.
3. Results and Discussion
3.1. Crystal Structure Descriptions of Hybrids 1–2
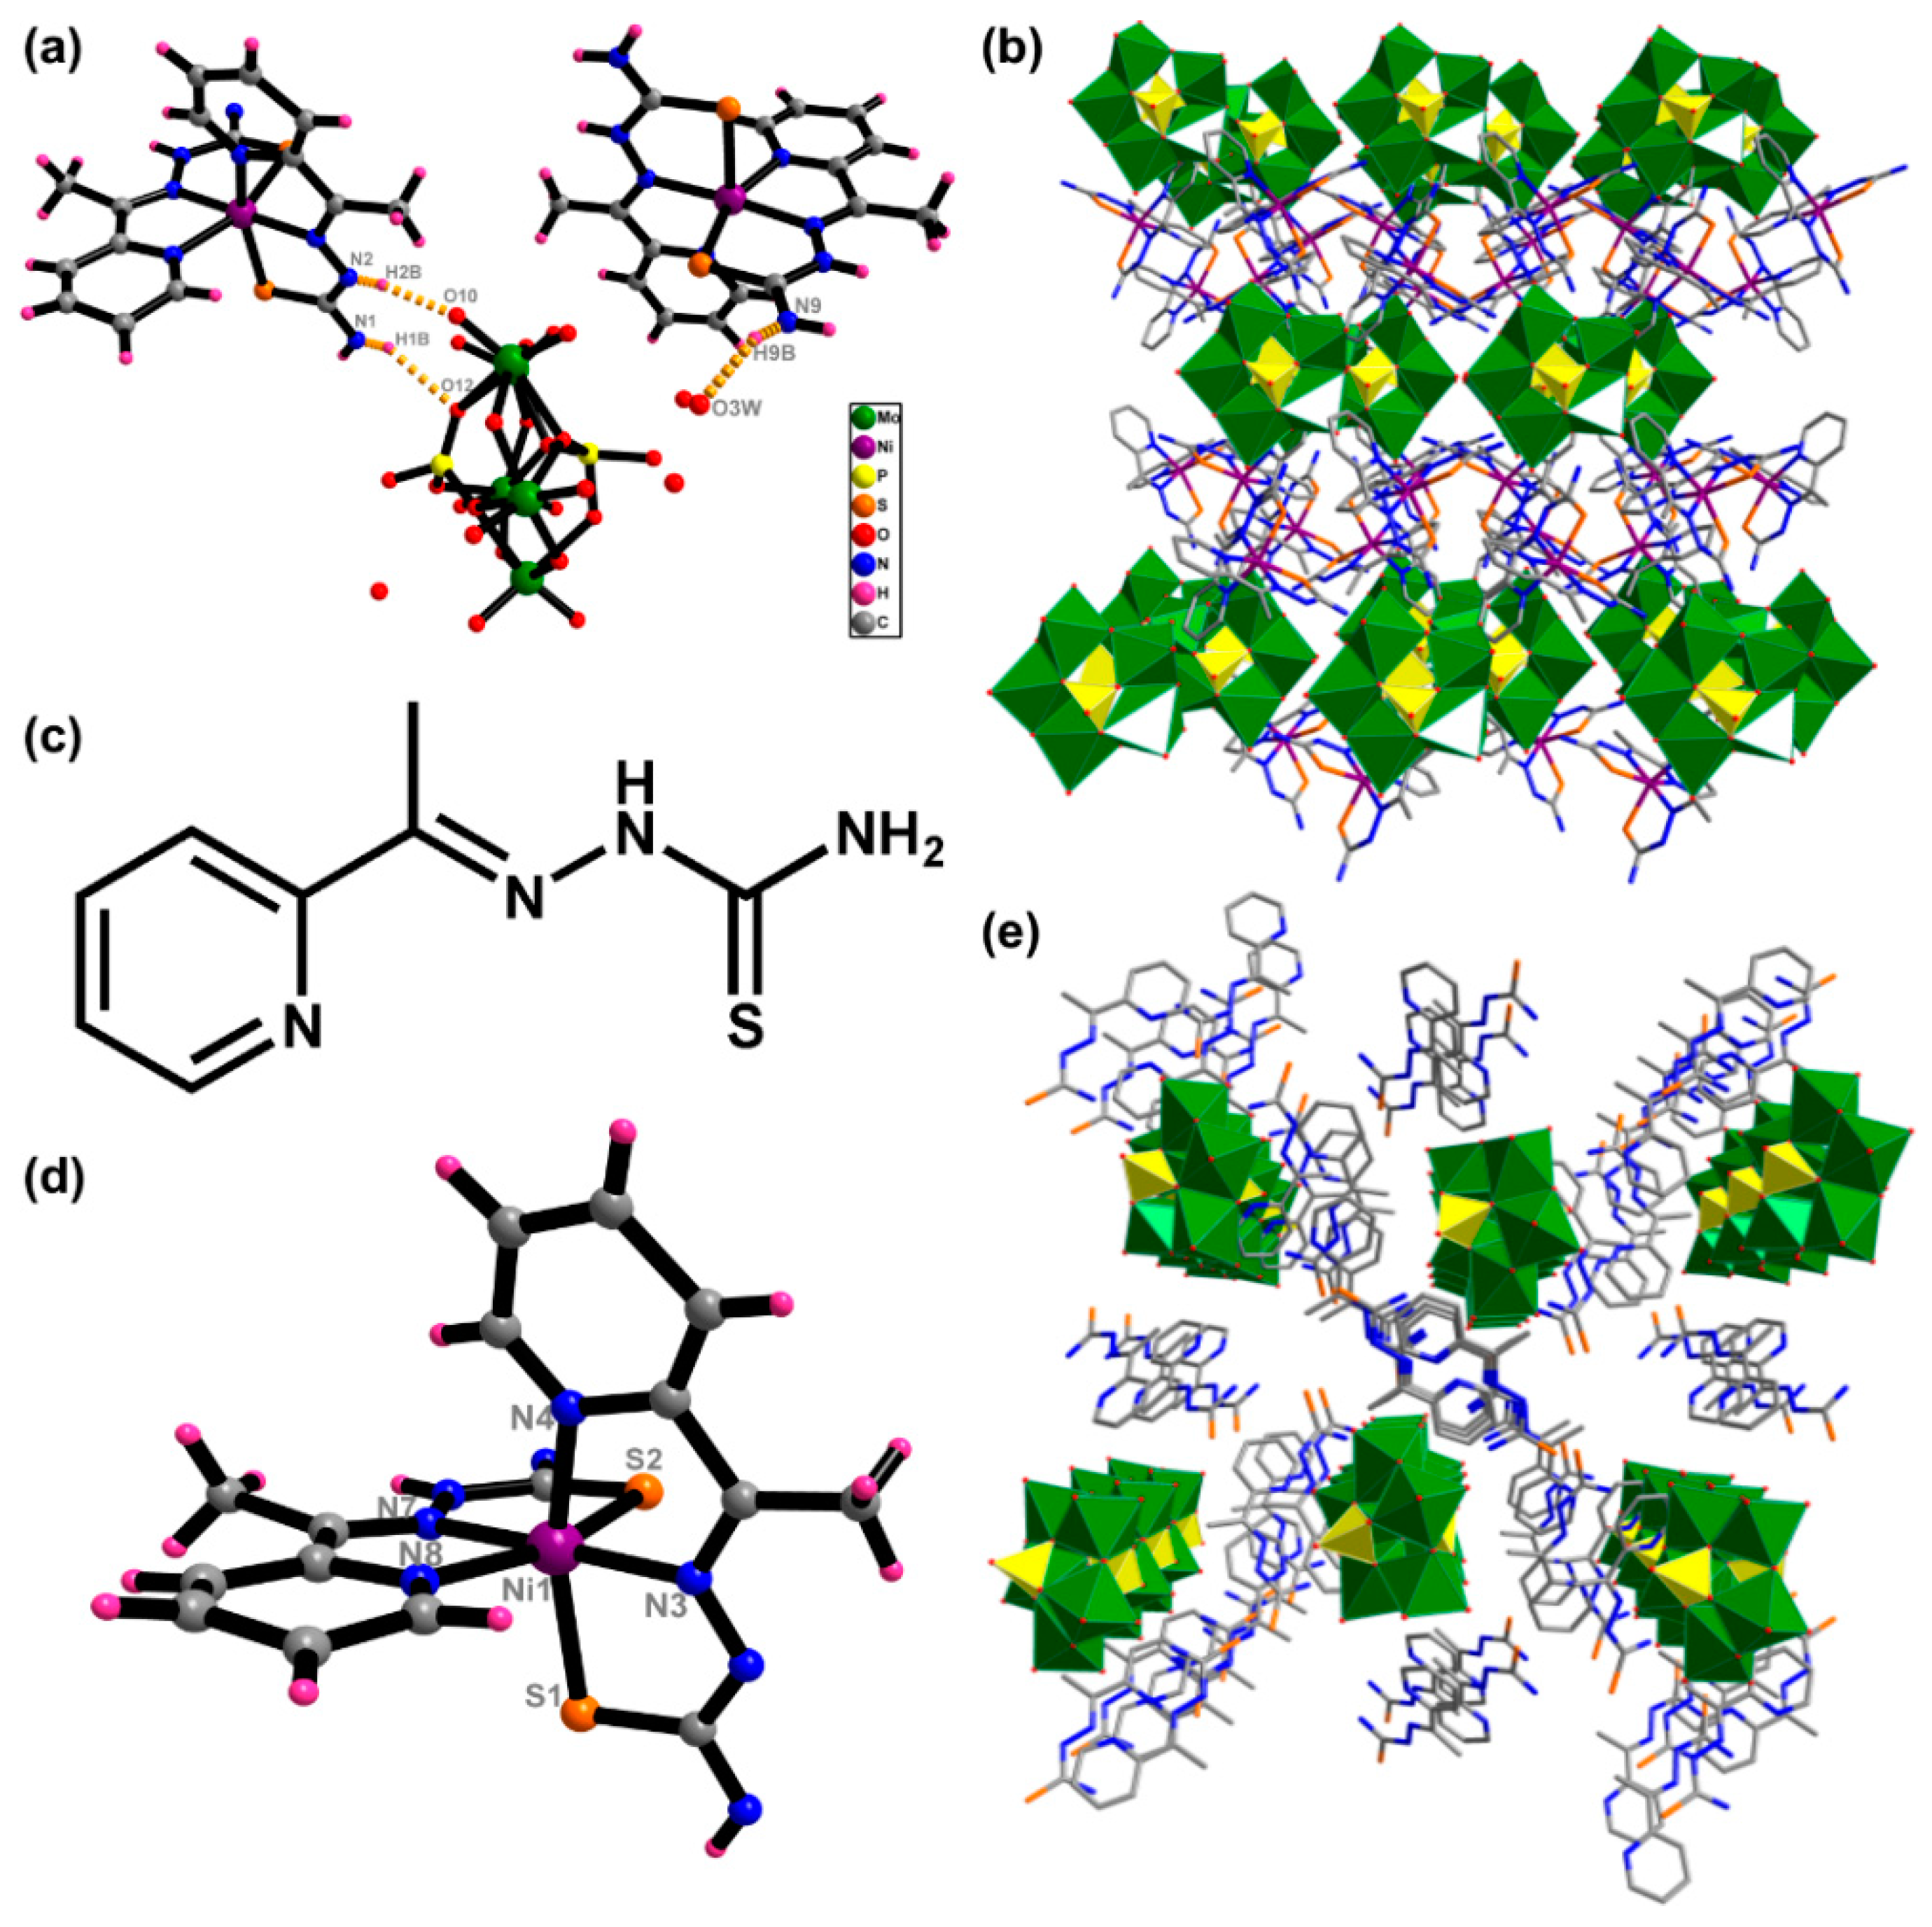
Both hybrids 1 and 2 consist of a typical Strandberg-type [P2Mo5O23]6− unit [24]. [P2Mo5O23]6− comprises two tetrahedral {PO4} and five octahedral {MoO6}, which can be seen as a pentagonal ring formed by octahedra in edge- and corner-sharing mode. In hybrid 1 (Figure 1a), there are a [P2Mo5O23]6− unit, two [Ni(HL)2]2+ cations, two protons and four crystal water molecules. The anion [P2Mo5O23]6− and cationic [Ni(HL)2]2+ are combined by electrostatic interaction and hydrogen bonds (dotted light orange lines in Figure 1a). In [Ni(HL)2]2+ cations, each Ni(II) is coordinated by two S atoms and four N atoms from two ligands HL (Figure 1d). The bond lengths ranges of Ni–S and Ni–N are 2.377(2)–2.43(1) and 2.009(2)–2.100(2), respectively. The ligand HL contains primary amine, secondary amine and pyridine groups (Figure 1c), which are beneficial for the formation of hydrogen bonds and π–π stacking interactions with dyes. In addition, the hydrogen bonds involved the terminal nitrogen atoms with the oxygen atoms of [P2Mo5O23]6− were observed. The bond lengths and bond angles of N(1)–H(1B)···O(12), N(2)–H(2B)···O(10) are 3.083(17), 2.754(16) and 145.5(8)°, 165.4(7)°, respectively. Then the molecules generate a three-dimensional network with hydrogen bonds and π–π stacking interactions (Figure 1b). As a reference, hybrid 2 was synthesized, in which the metal ions are excluded. 2 consists of five [H2L]+, a [P2Mo5O23]6− anions, one proton and 12 crystal water molecules. Figure 1e exhibits the polyhedral/wire-stick representation of the 3D network of hybrid 2. The coexistence of a large amount of negative charge on the surface of [P2Mo5O23]6− and amino-incorporated ligands will provide a way to accelerate the selective adsorption of cationic organic dyes by hydrogen bonds and π–π stacking interactions.
3.2. Fourier Transform Infrared (FT-IR) Spectroscopy
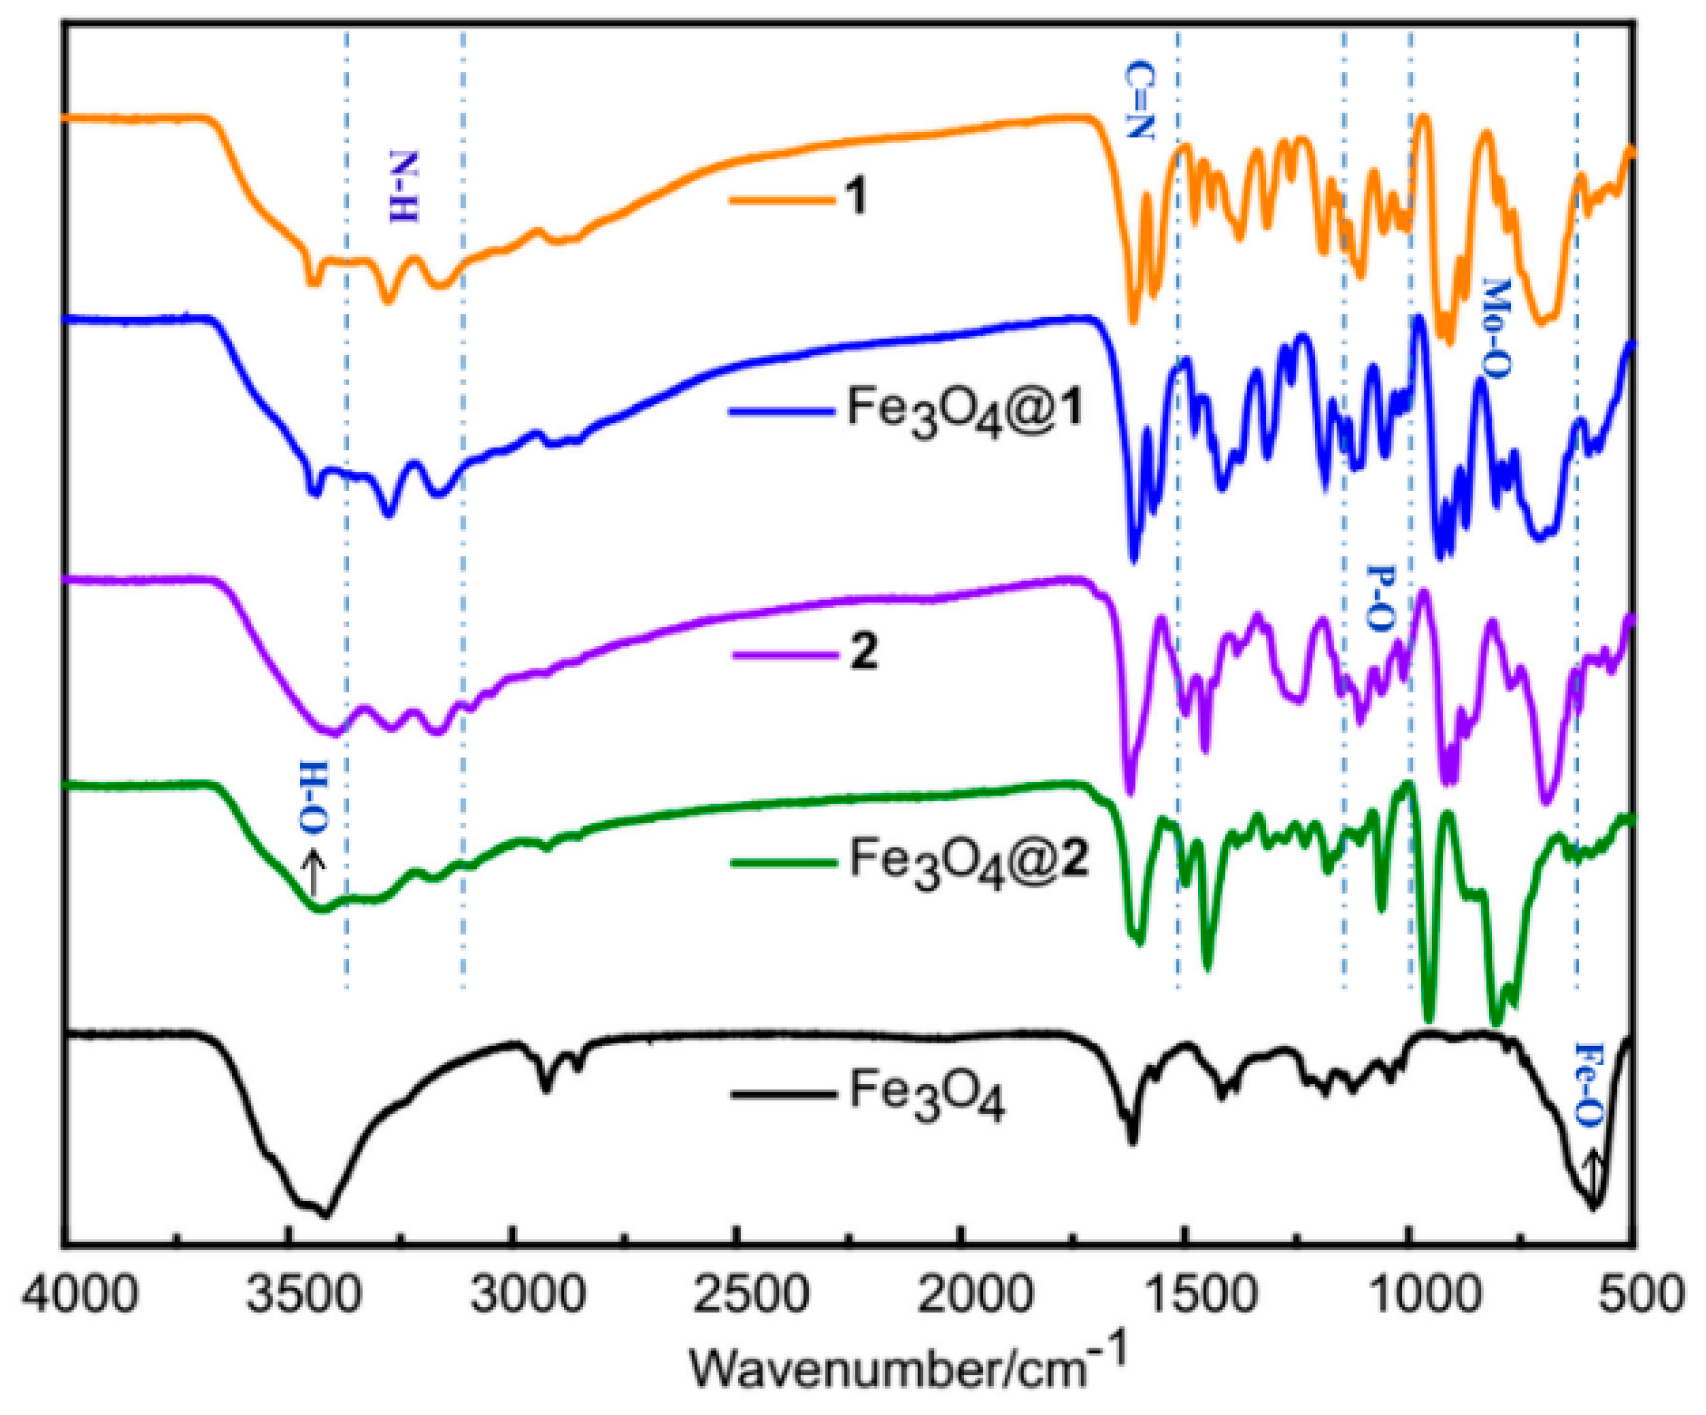
The fourier transform infrared (FT-IR) spectra were recorded in the range of 4000–500 cm−1 for 1, Fe3O4@1, 2, Fe3O4@2 and Fe3O4 (Figure 2). The broad peak at 3429 cm−1 is associated with the covalent O–H stretching vibrations of water molecules [25]. The bands in the range 3278–3164 cm−1 are associated with the stretching vibrations of the ν(N–H) bonds. The peaks between 1620 and 1561 cm−1 are attributed to the presence of ν(C=N) bonds [26]. The scope of the characteristic peak of the P–O band is in the range of 1051–1121 cm−1. Additionally, the strong bands between 672 and 960 cm−1 are attributed to the ν(Mo–Ob) and ν(Mo–Ot) modes of the [P2Mo5O23]6− [27]. The IR spectra of Fe3O4@1, Fe3O4@2 and Fe3O4 all exhibit the same characteristic peaks at ca 590 cm−1 assigned to the Fe–O, indicating the presence of Fe3O4.
3.3. Ultraviolet–visible (UV–vis) Spectroscopy
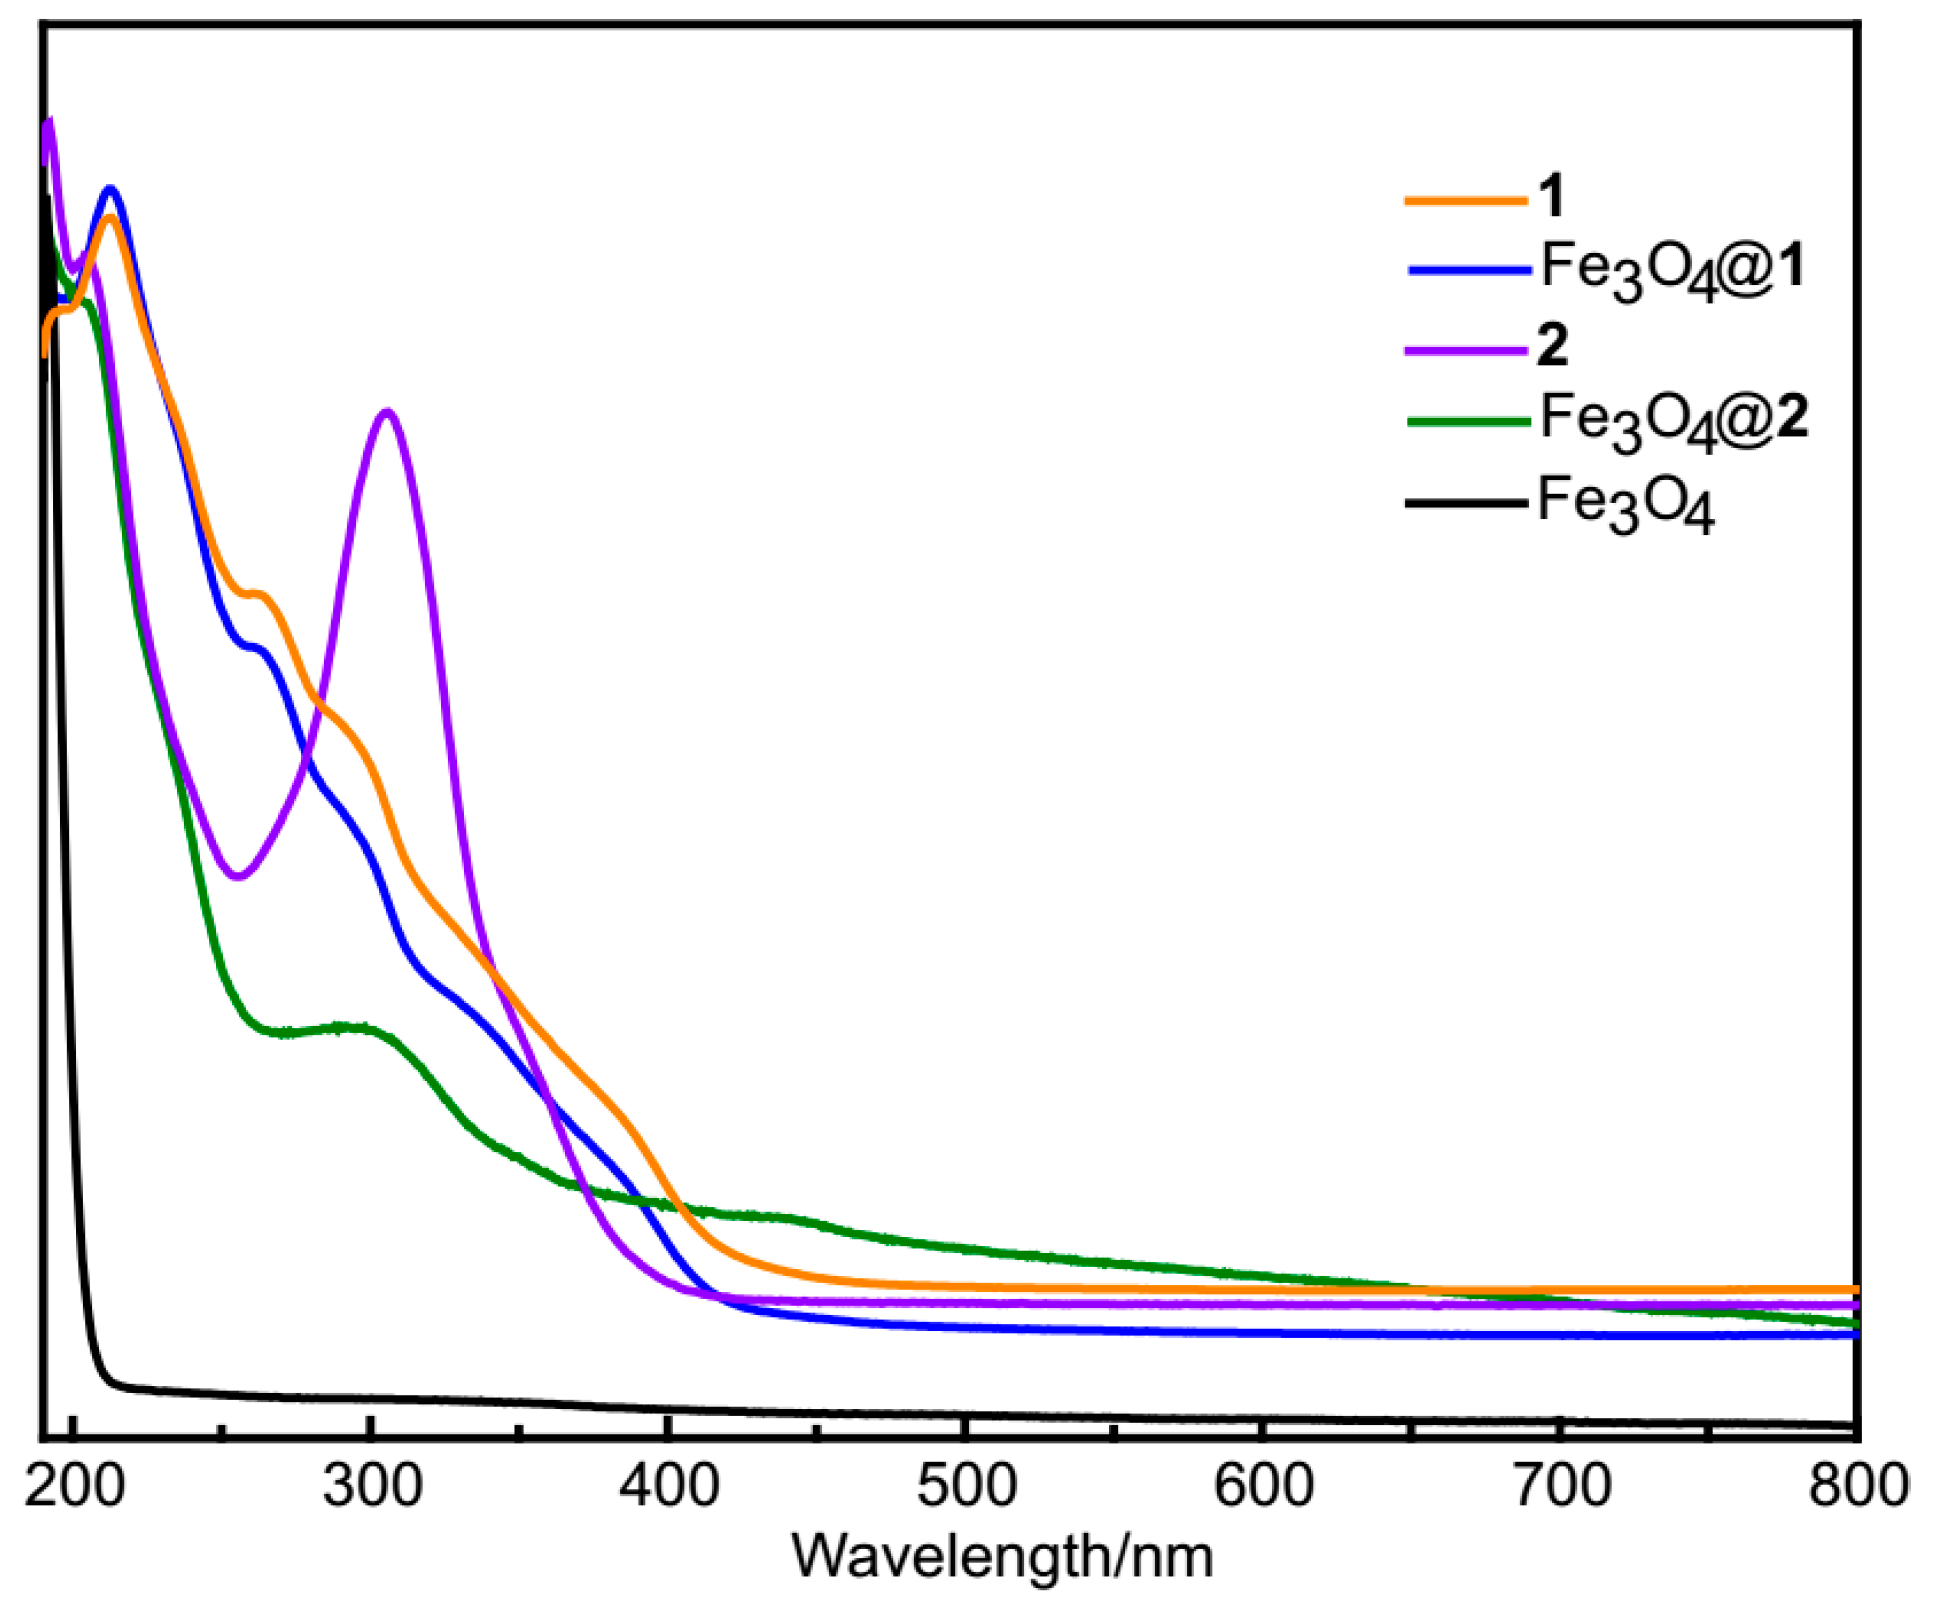
As shown in Figure 3, the UV–vis spectra of 1 and Fe3O4@1 show the same absorption peaks in aqueous solution at 212 and 262 nm, 2 and Fe3O4@2 exhibit the same adsorption peaks at 208 and 306 nm, which are all attributed to Ot→Mo and Ob→Mo charge-transfer transition [28]. As a comparison, no absorption peak is observed for Fe3O4 nanoparticles.
3.4. Magnetic Properties of Fe3O4@1 and Fe3O4@2
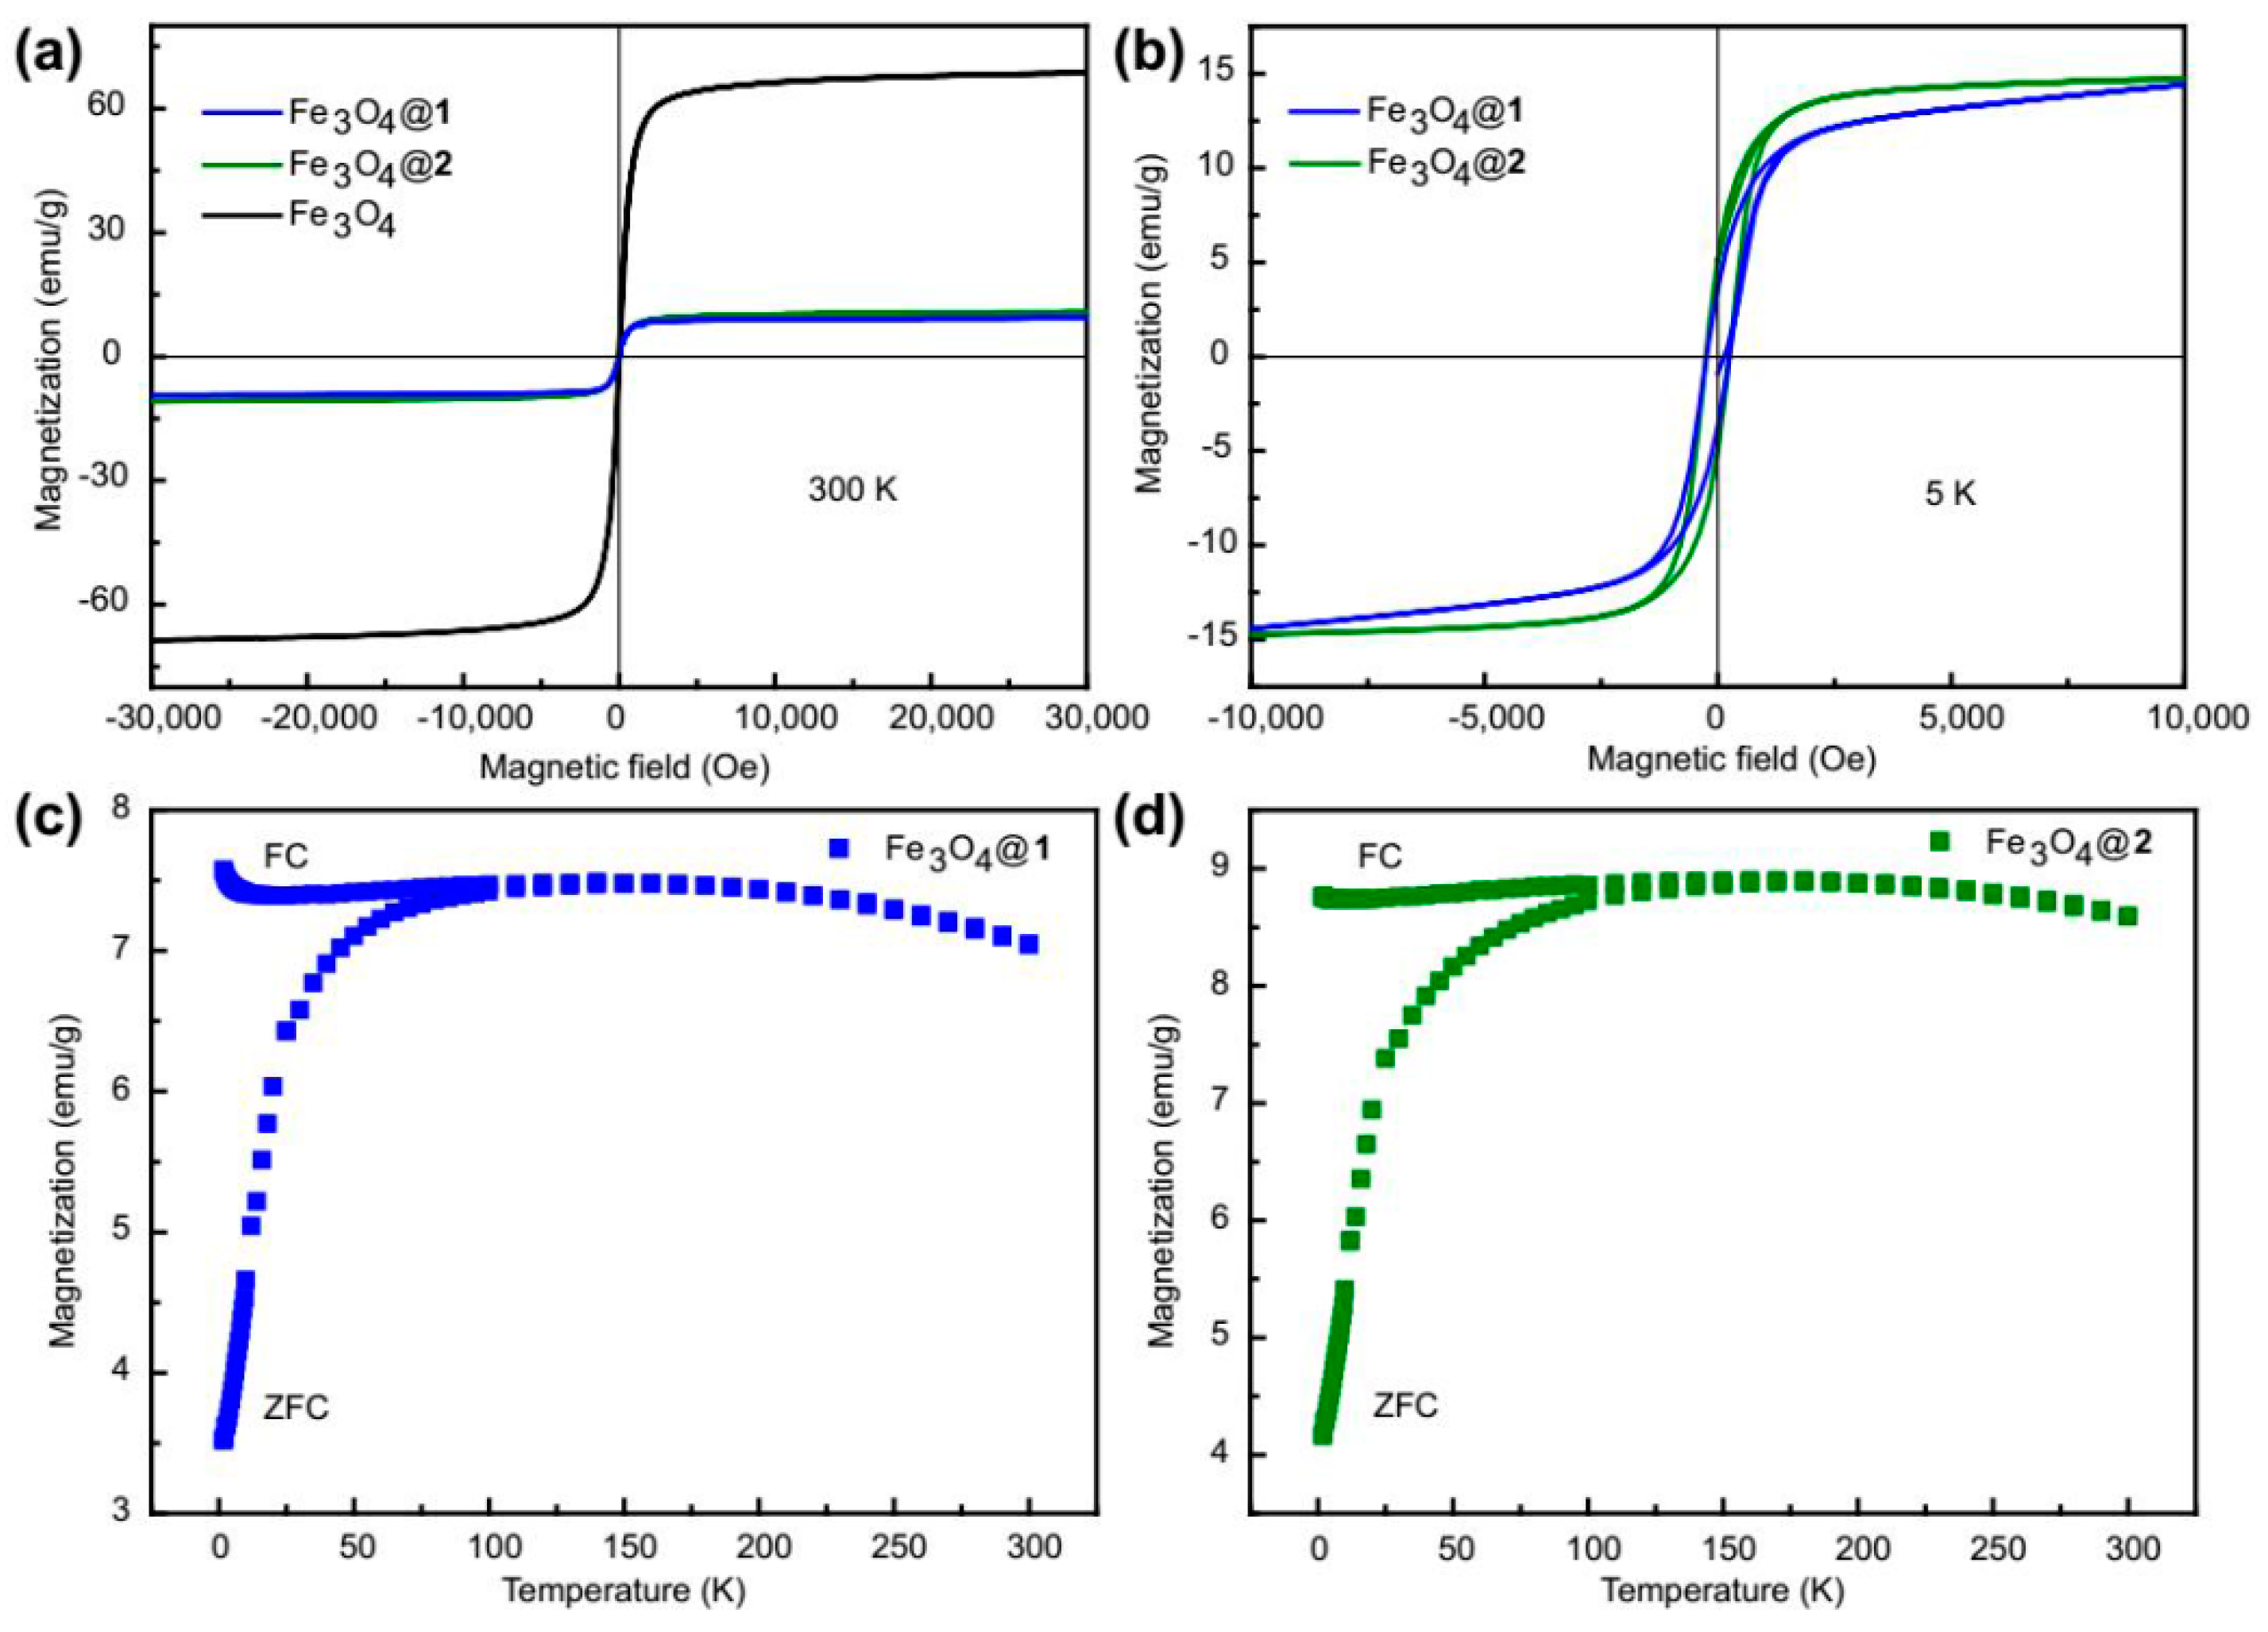
The magnetic properties of Fe3O4@1 and Fe3O4@2 were investigated by VSM and PPMS. Figure 4a represents the hysteresis curves of Fe3O4@1, Fe3O4@2 and Fe3O4. At 300 K, Fe3O4 shows a coercivity tend to ~23 Oe and the magnetization of ~68 emu/g under ~30,000 Oe, while Fe3O4@1 and Fe3O4@2 show the coercivity tend to ~32 Oe and ~47 Oe, the magnetization of ~11 emu/g and ~10 emu/g, respectively. The magnetization decreases due to the combination of the polyoxometalate on the surface of Fe3O4 nanoparticles [29]. At 5 K, Fe3O4@1 and Fe3O4@2 show the coercivity tend to ~240 Oe and ~255 Oe, the magnetization of ~14.4 emu/g and ~14.7 emu/g under ∼10,000 Oe, respectivey (Figure 4b). The coercivity increases with decreasing temperature, which is the result of a thermal effect. The hysteresis curves of Fe3O4@1 and Fe3O4@2 indicate that Fe3O4@1 and Fe3O4@2 behave soft ferromagnetic at 300 K and become ferromagnetic at 5 K, with a significant enhancement in magnetization as the temperature decreases.
Figure 4c,d subsequently show the magnetization-temperature curves in two modes of field-cooled (FC) and zero-field-cooled (ZFC) in the temperature range of 2–300 K under a given applied magnetic field of 500 Oe, revealing the superparamagnetic response of Fe3O4@1 and Fe3O4@2. It should be mentioned that the two samples exhibited quite similar thermal relaxation behavior of nanoparticles’ magnetic moment. The average blocking temperature is estimated to be ~160 K and ~180 K for Fe3O4@1 and Fe3O4@2, respectively [30]. Below the blocking temperature, the ZFC magnetization falls sharply down to 2 K whereas FC magnetization decreases very little.
3.5. Separation and Redispersion Process of Fe3O4@1 and Fe3O4@2
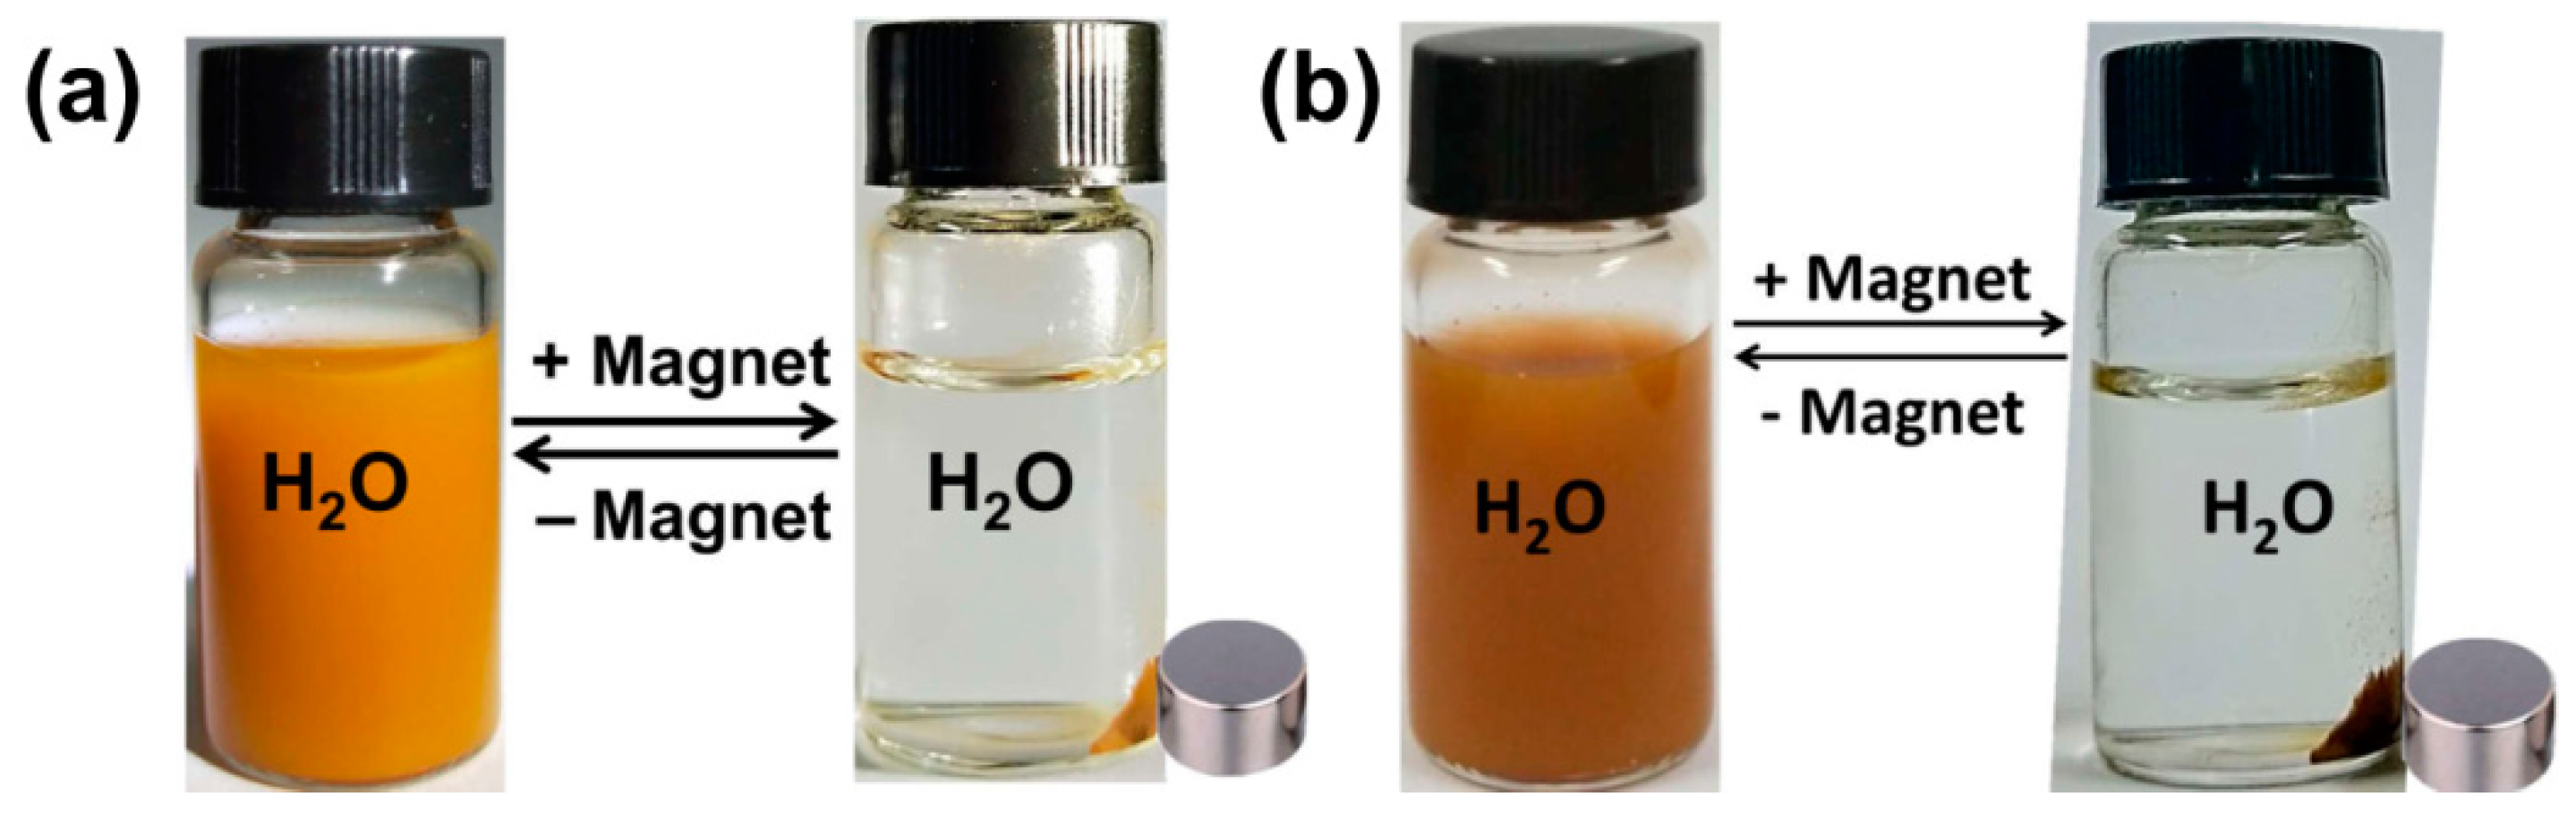
As shown in Figure 5a, under the influence of an external magnetic field, Fe3O4@1 in water rapidly changed from a yellow homogeneous dispersion to colourless transparent solution. The collected nanocomposites can be easily and reversibly dispersed by agitation after removing the magnetic field and the above process can be repeated many times. A similar process happens to Fe3O4@2 (Figure 5b). The aggregation and dispersion experiments show that there is no compound left after the two nanocomposites are collected by magnet, which indicates that polyoxometalates hybrids and Fe3O4 are successfully combined together as the hybrids 1 and 2 are non-magnetic. Furthermore, these experiments also suggest that Fe3O4@1 and Fe3O4@2 possess strong magnetic responsiveness and redispersibility, which are distinct advantageous to their adsorption application.
3.6. The Morphology and Particle Size Distribution of Fe3O4@1 and Fe3O4@2
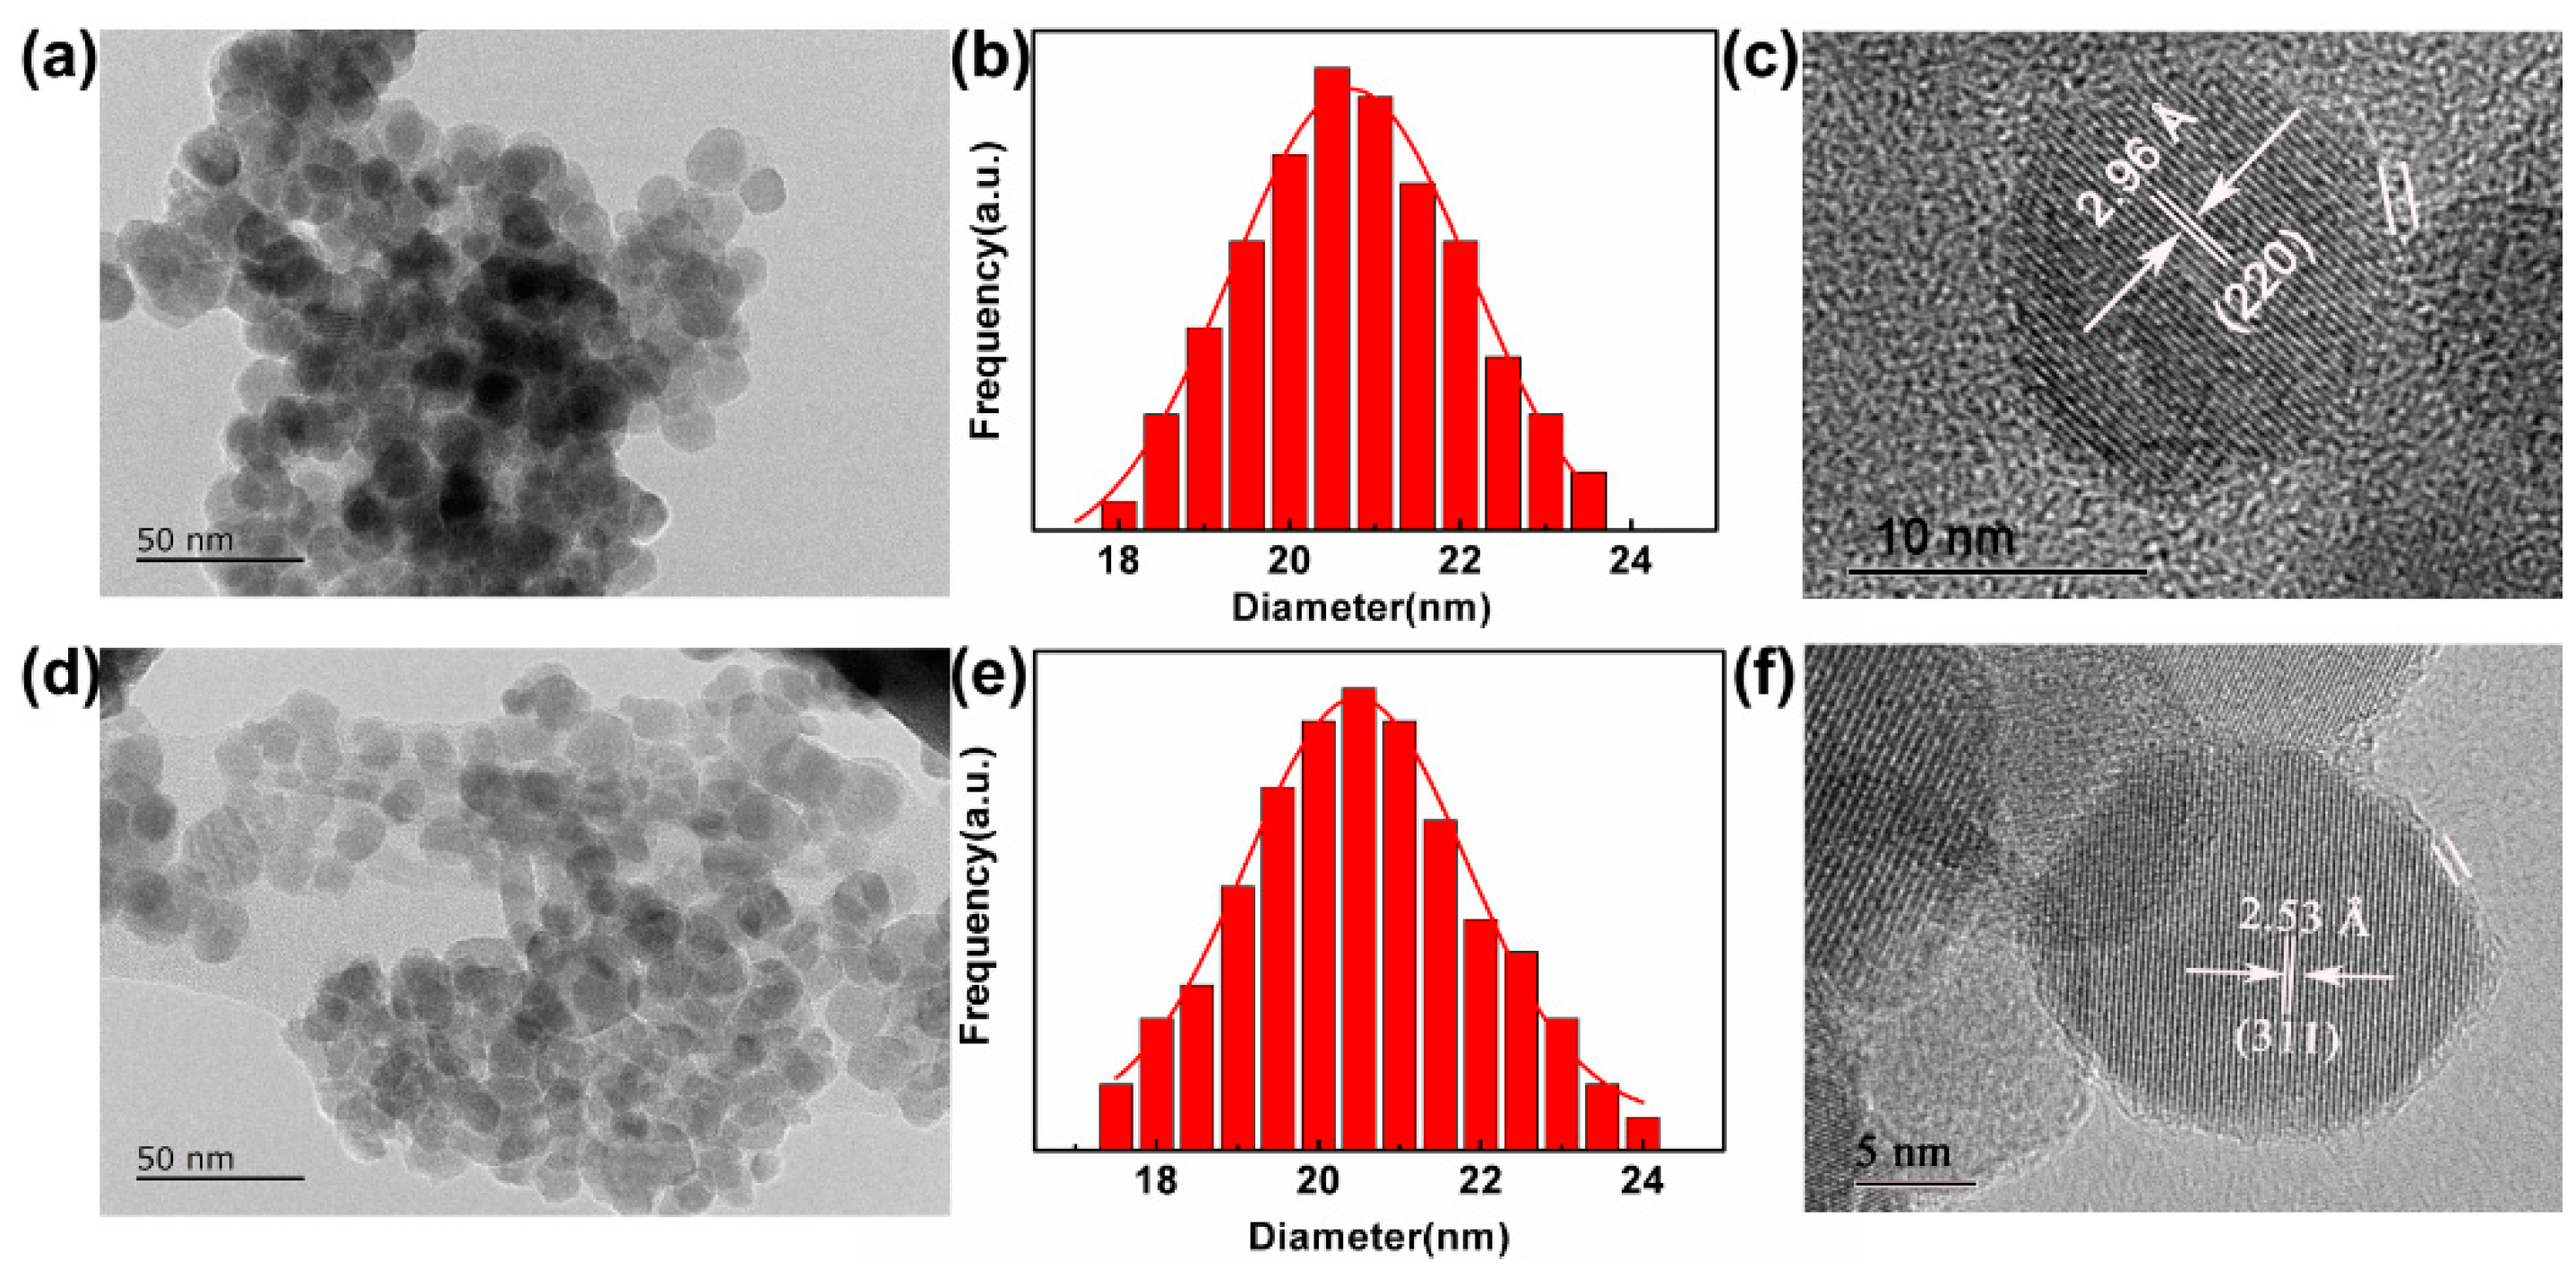
In order to investigate the morphology, particle sizes and size distributions of the two nanocomposites, TEM, HRTEM and XRD experiments were tested. As shown in Figure 6a,d, the two nanocomposites are high levels of crystallization, virtually uniform and nearly round in shape. The size distributions of two nanocomposites were obtained from the size counting of a series of TEM photos, in which the histograms showed average size of 20.70 nm and 20.40 nm corresponding to Fe3O4@1 and Fe3O4@2, respectively. The distribution of the two nanocomposites can be reasonably described by the curve of Gaussian function (Figure 6b,e). Figure 6c,f exhibit the HRTEM images of two nanocomposites, the clear crystal lattices of Fe3O4@1 and Fe3O4@2 correspond to the (311) and (220) reflection of the Fe3O4, respectively. Meantime, it can be found that an obvious interface line (marked with white line) delimitate the regions of Fe3O4@1 and Fe3O4@2. The HRTEM images indicate that parts of polyoxometalates are successfully covered in the surface of Fe3O4 [31], which are in agreement with the aggregation and dispersion experiments.
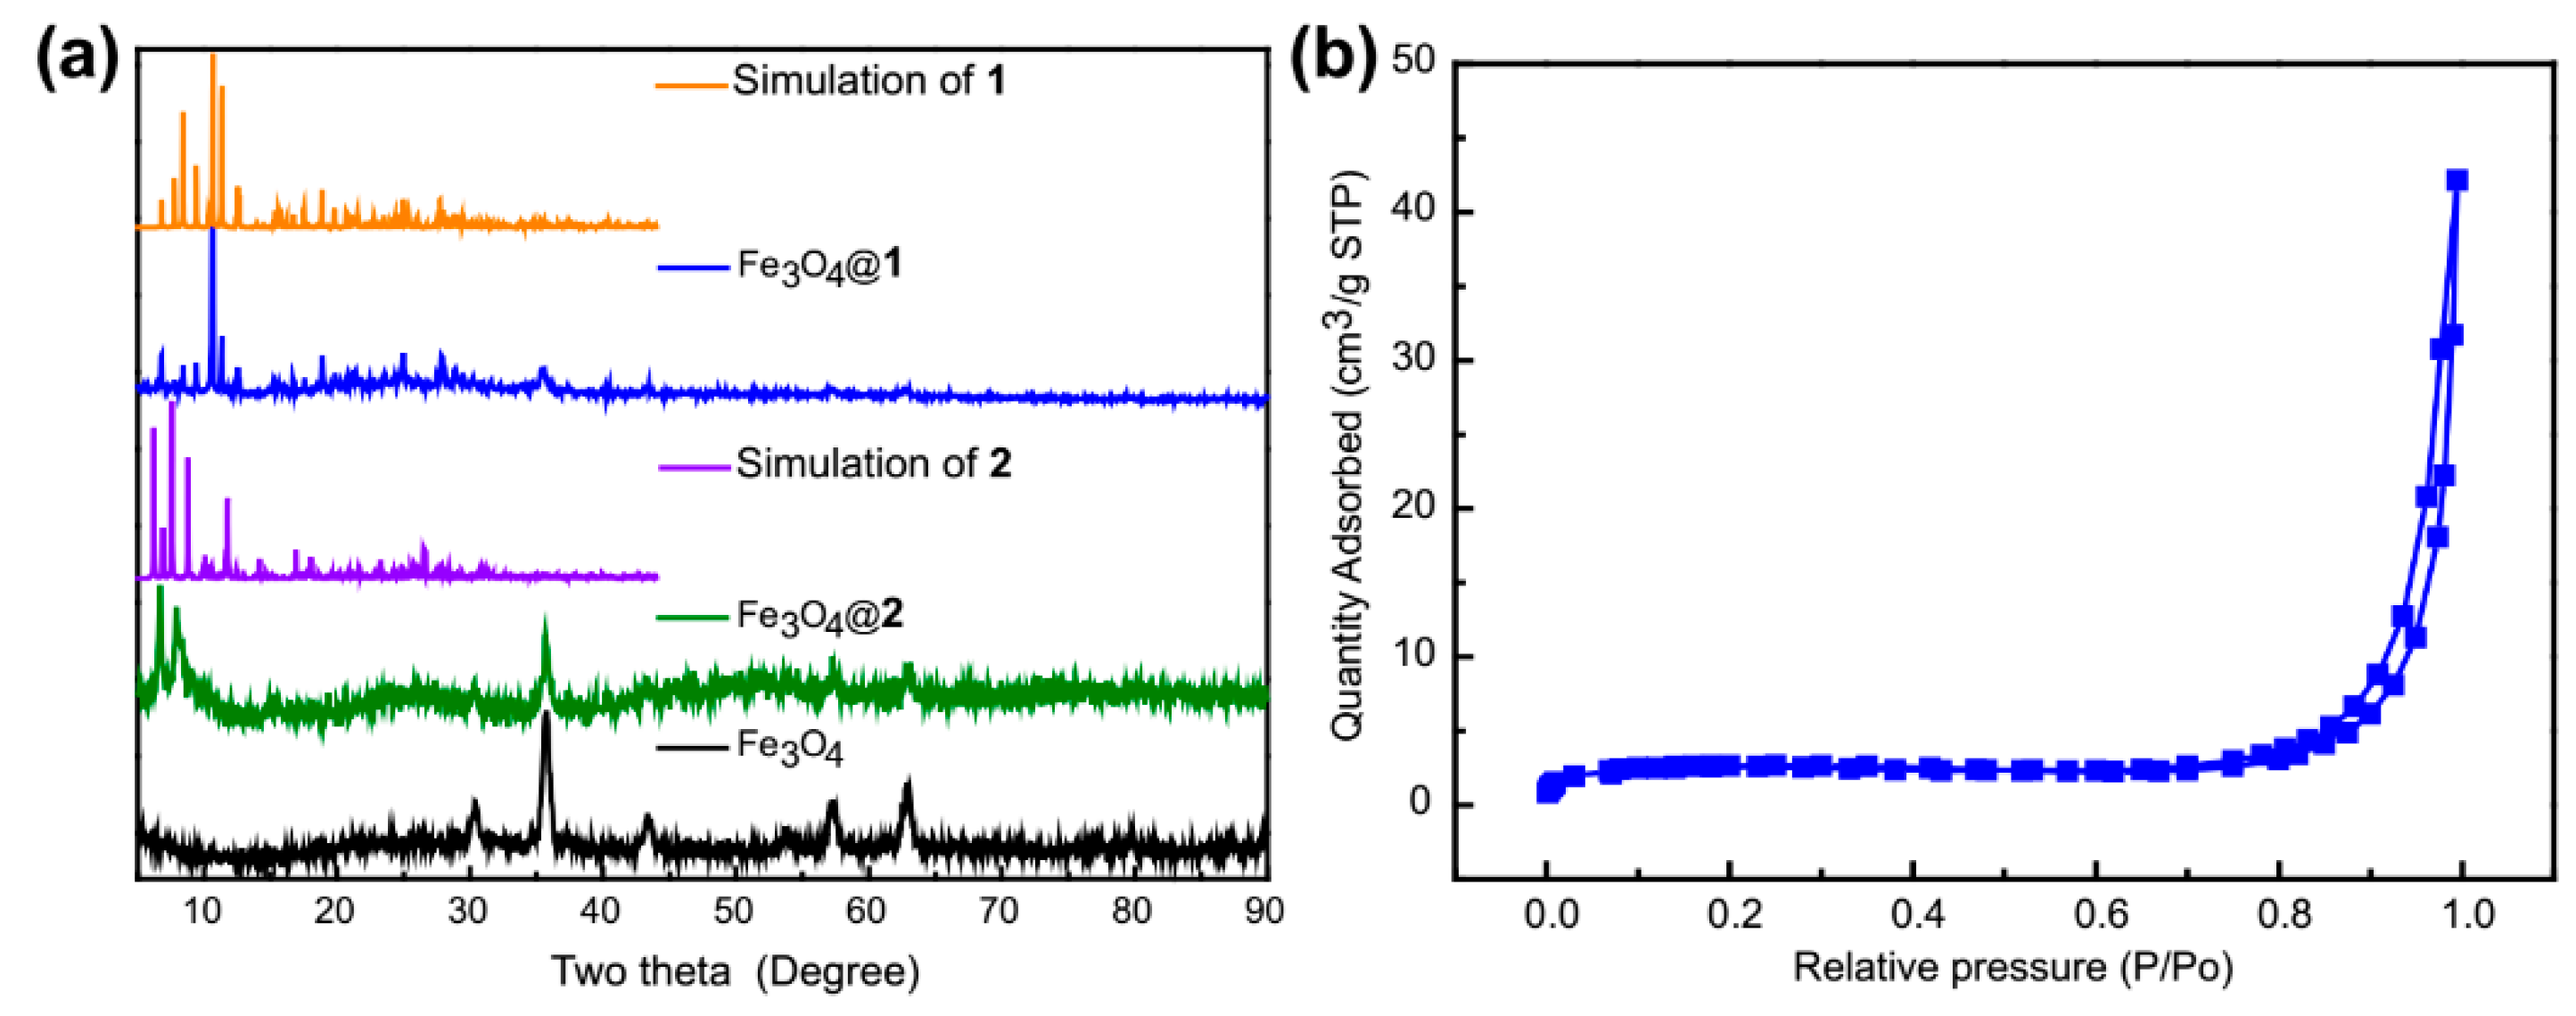
XRD patterns of simulation of 1 and 2, Fe3O4@1, Fe3O4@2 and Fe3O4 are listed in Figure 7a. Fe3O4 exhibited a round structure that fitted to JCPDS No. 75-0449. The peaks at 30.43°, 35.7°, 43.3°, 53.7°, 57.3°, 62.9° and 74.3° (as labeled by the asterisk) are corresponding to the (220), (311), (400), (422), (511), (440) and (533) plans of the Fe3O4, respectively. The average particle sizes of Fe3O4@1 and Fe3O4@2 were 20.3 nm and 19.6 nm, which were evaluated by Debye-Scherrer equation. The result of XRD analysis agrees well with that of TEM analysis. The simulated peak positions of 1 and 2 match with those of Fe3O4@1 and Fe3O4@2, indicating that nanocomposites Fe3O4@1 and Fe3O4@2 were successfully synthesized. The specific surface area of the samples was confirmed by N2 adsorption-desorption isotherms. It turns out that the BET surface area of Fe3O4@1 and Fe3O4@2 are 8.106 m2/g and 1.787 m2/g, respectively. Figure 7b shows the N2 adsorption-desorption isotherms of the Fe3O4@1 sample.
3.7. Dye Adsorption Properties
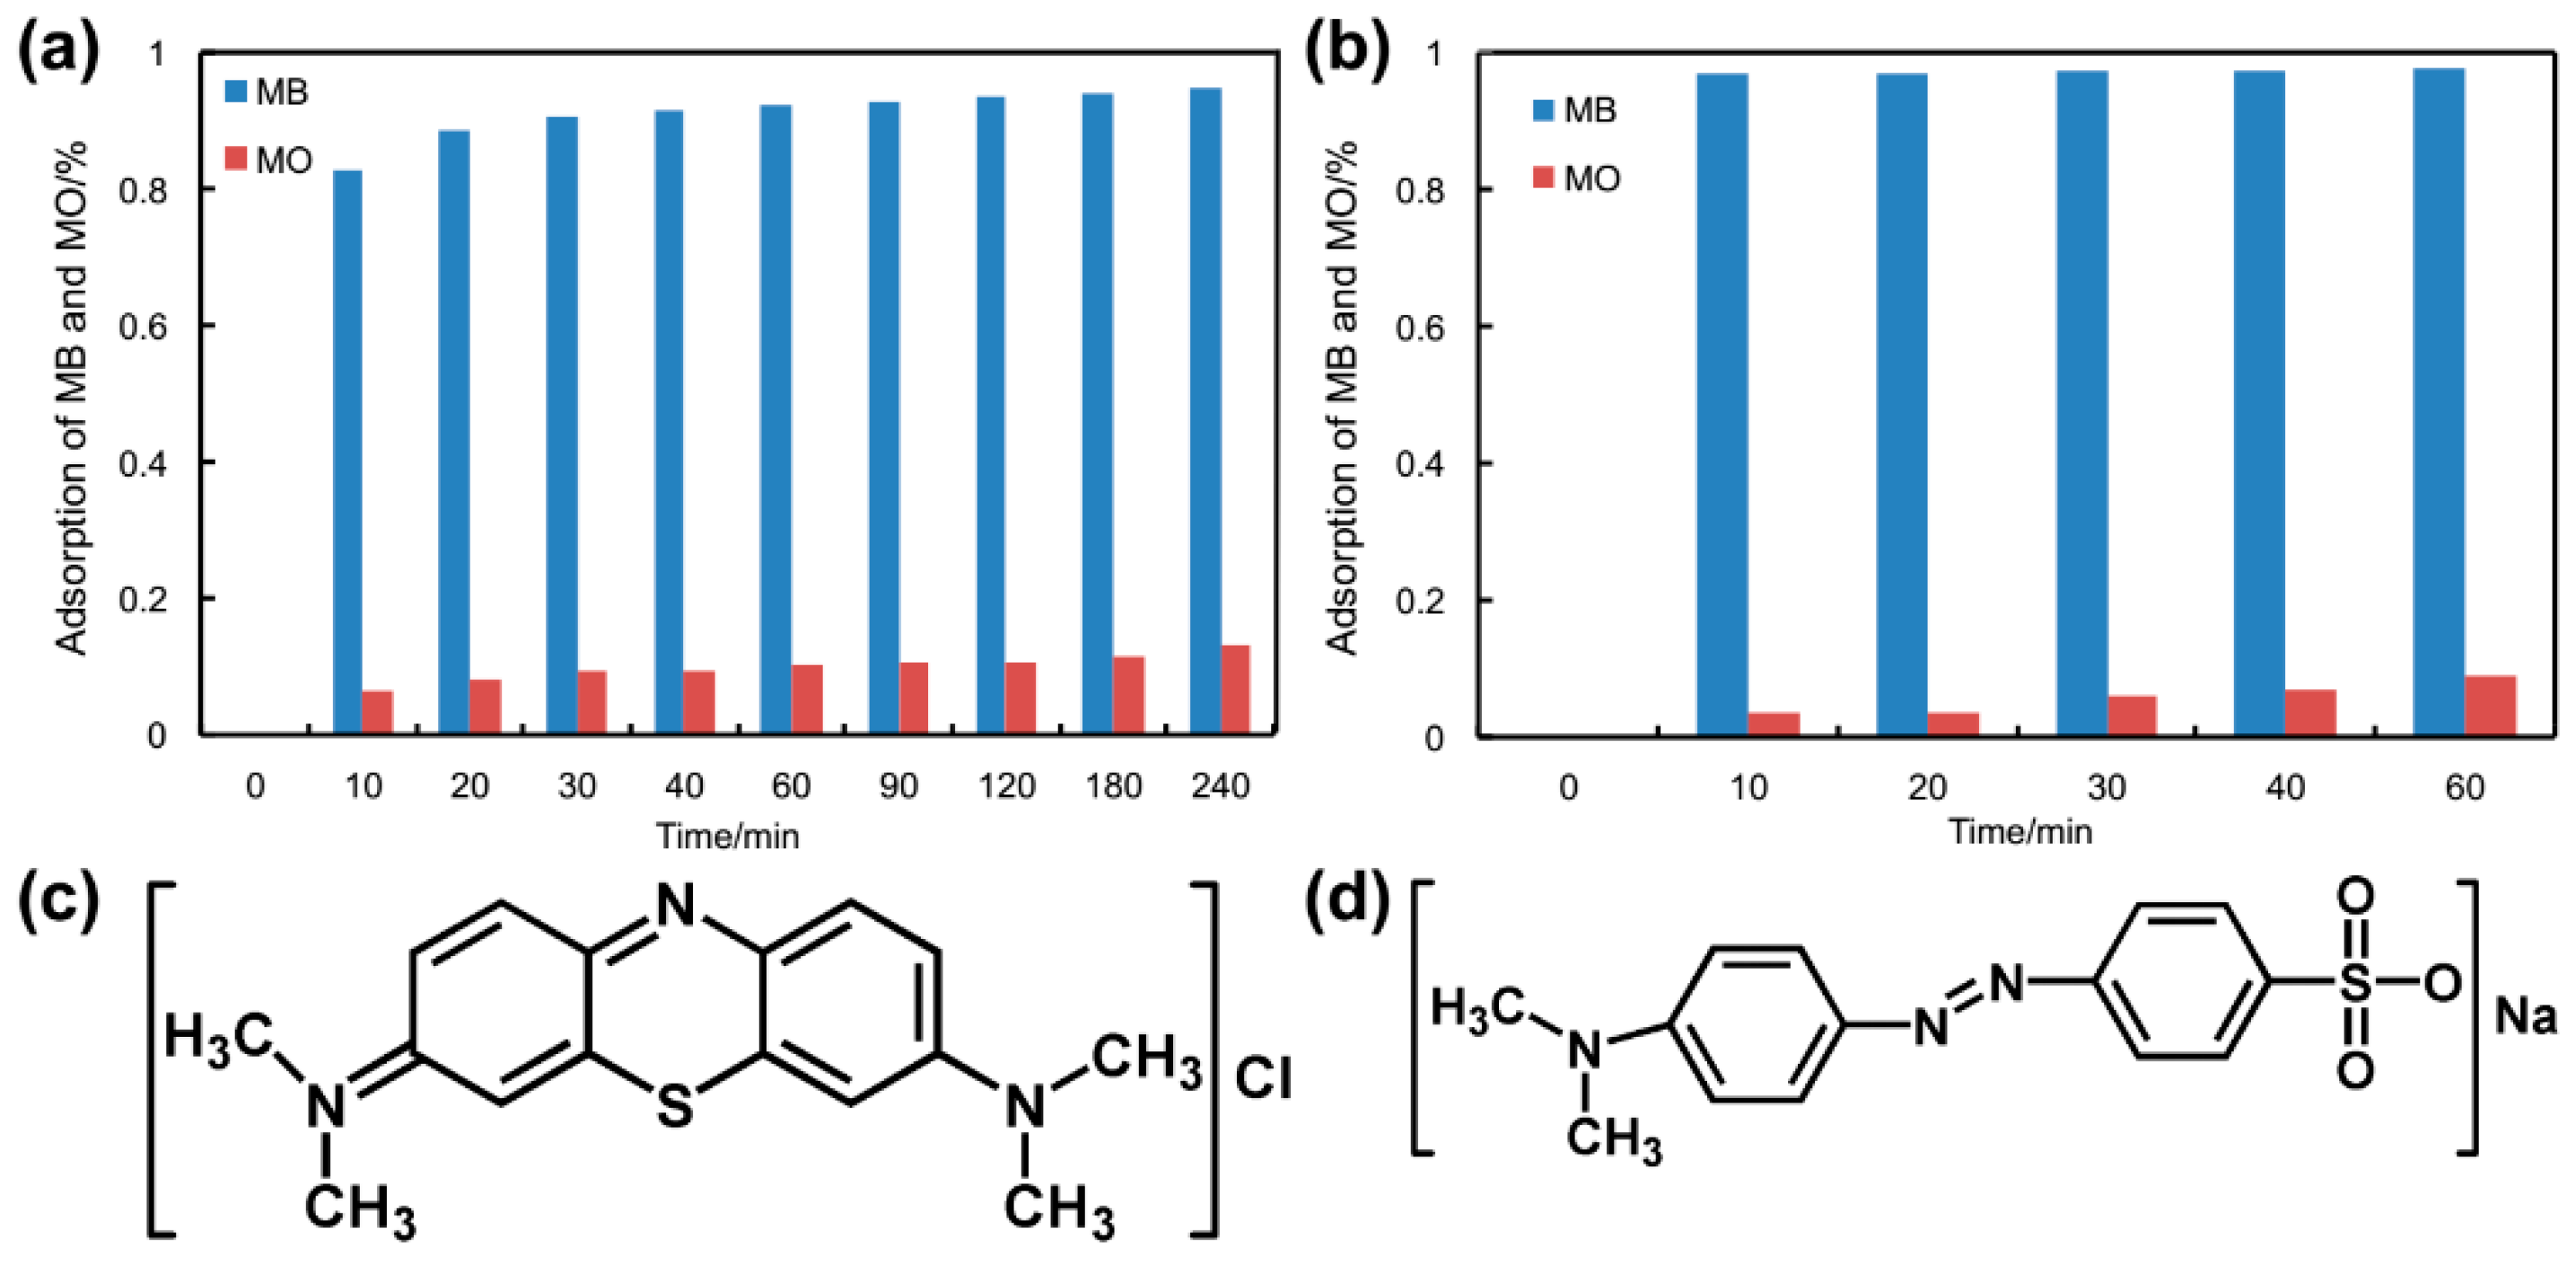
In recent decades, much attention has been devoted to adsorb organic dyes from wastewater with Fe3O4-based nanocomposites. The adsorption activities of Fe3O4@1 and Fe3O4@2 were explored by removing cationic dye MB and anionic dye MO from wastewater. As exhibited in Figure 8a,b, Fe3O4@1 and Fe3O4@2 displayed interesting adsorbent properties for cationic dye MB and little absorption activity for anionic dye MO. The adsorption efficiency of MB was 94.8% for Fe3O4@1 in 240 min, 97.67% for Fe3O4@2 in 60 min. However, the adsorption efficiency of MO was only 13.13% for Fe3O4@1 and 8.84% for Fe3O4@2. The maximum MB adsorption capacity of Fe3O4@1 and Fe3O4@2 is 72.07 and 73.25 mg/g, respectively. In comparison with the other Fe3O4-based adsorbents Fe3O4/PPC MPs [32], our prepared adsorbents displayed a higher adsorption capacity. Due to the similar size of MB and MO (Figure 8c,d), the selective adsorption for MB might be attributed to the electrostatic interactions between adsorbents and cationic dye molecules.
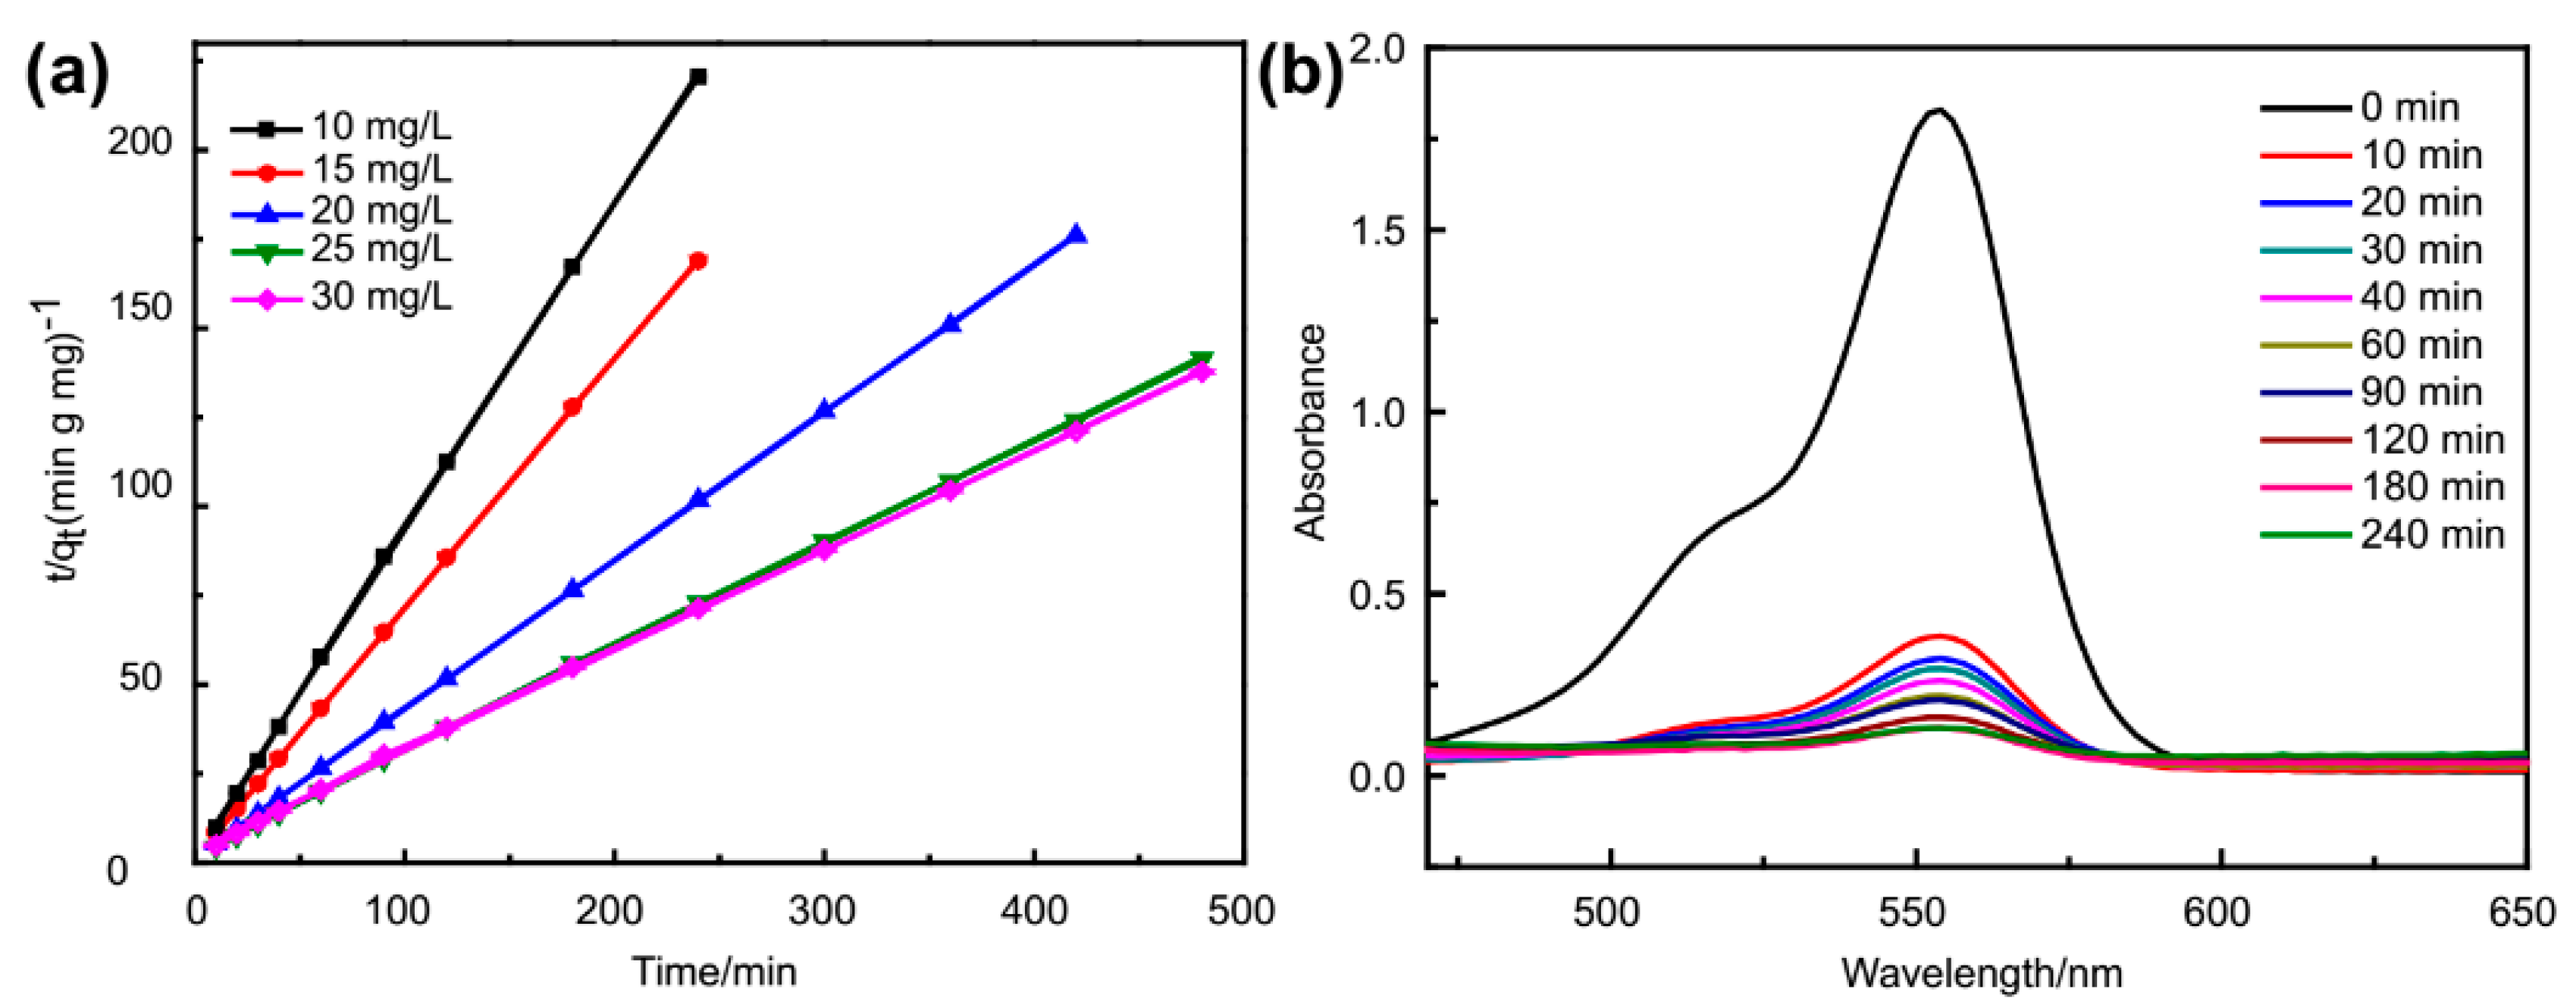
To confirm this hypothesis, adsorption kinetic studies of the removal of MB were carried out. As a proof-of-concept experiment, only the adsorption activity of Fe3O4@1 was systematically studied as an example. In order to explore the adsorption kinetics precisely, 10 mg/L, 20 mg/L, 25 mg/L and 30 mg/L of MB were prepared for parallel experiments. A pseudo-first-order model and pseudo-second-order kinetic model [22,33] have been used to fit the experimental data of Fe3O4@1.
where k1 is the rate constant of pseudo-first-order, k2 is the rate constant of pseudo-second-order, qt is the amount of adsorbed MB at time t.
As expected, the values of correlation coefficient (R2) described the pseudo-second-order model very well (Table 2, Figure 9a), indicating that the adsorption process of Fe3O4@1 toward MB obeyed the pseudo-second-order kinetics. These results strongly demonstrated that the adsorption capacity of Fe3O4@1 was due to the electron transfer [34]. In order to further confirm the hypothesis, the other cationic dye rhodamine B (RhB) was also used to test the selective adsorption of Fe3O4@1, which turned out that the adsorption efficiency of RhB was 95.98% in 240 min (Figure 9b).
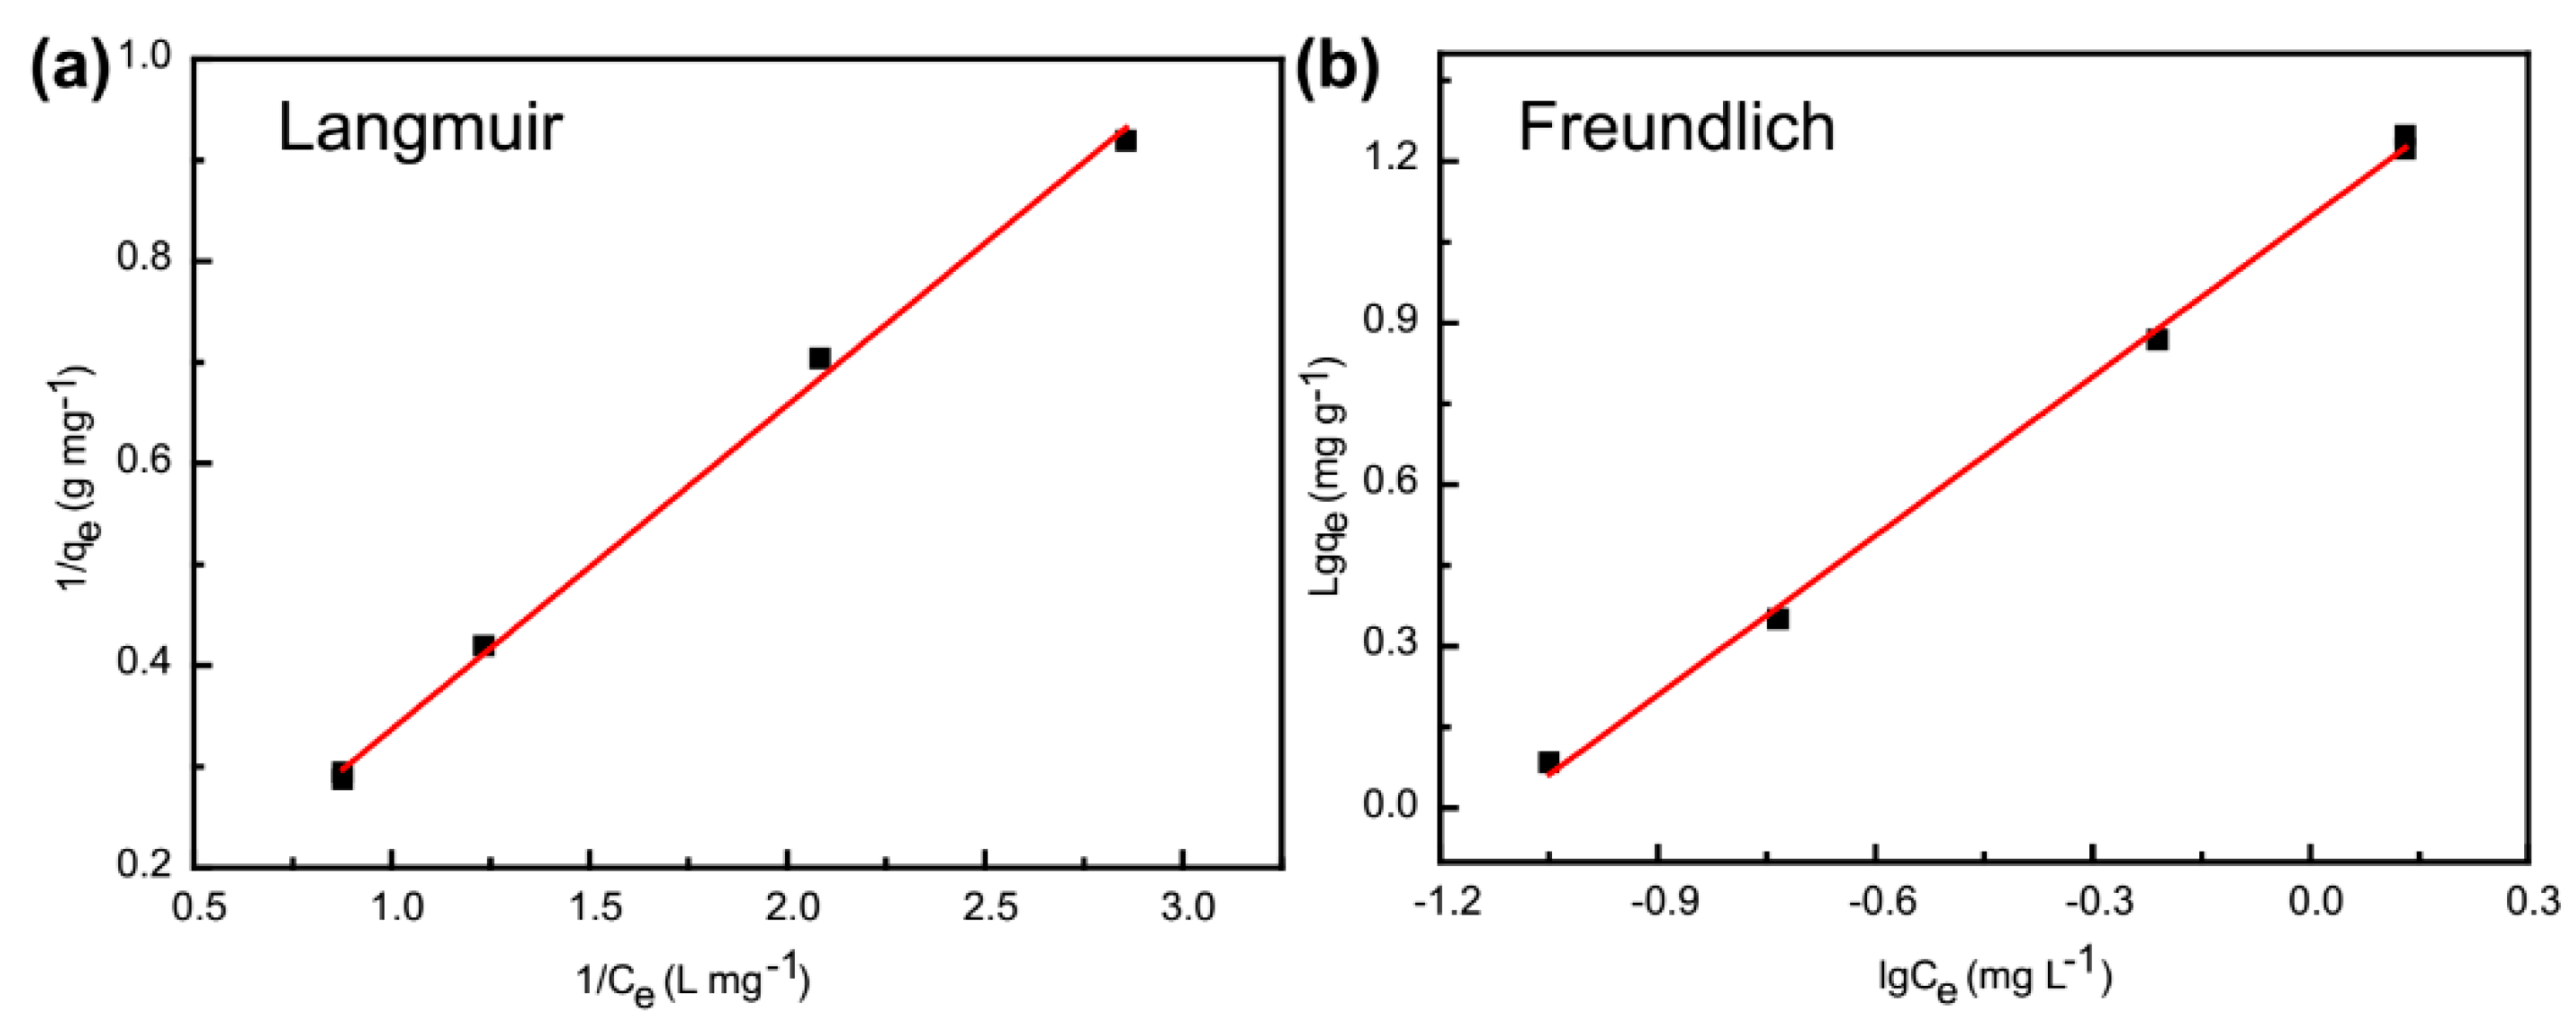
The two isotherms of Langmuir and Freundlich were used to further study the adsorption experimental data. Thus a linear equation for each model of the two isotherms was introduced to confirm the equilibrium characteristics of adsorption between Fe3O4@1 and MB. The two isotherm equations are listed as follows [35]:
where qmax is the maximum adsorption capacity. Ce is the equilibrium concentration of MB in the solution. KL and KF are the constant of the Langmuir and Freundlich model. n is the adsorption intensity.
The adsorption isotherms of MB are shown in Figure 10, and their detailed parameters are exhibited in Table 3. The Langmuir and Freundlich isotherms fitted the experimental data for Fe3O4@1 with R2 values of 0.9968 and 0.9977, respectively. These results indicated that the Langmuir and Freundlich isotherm provided the highest fit to the adsorption process.
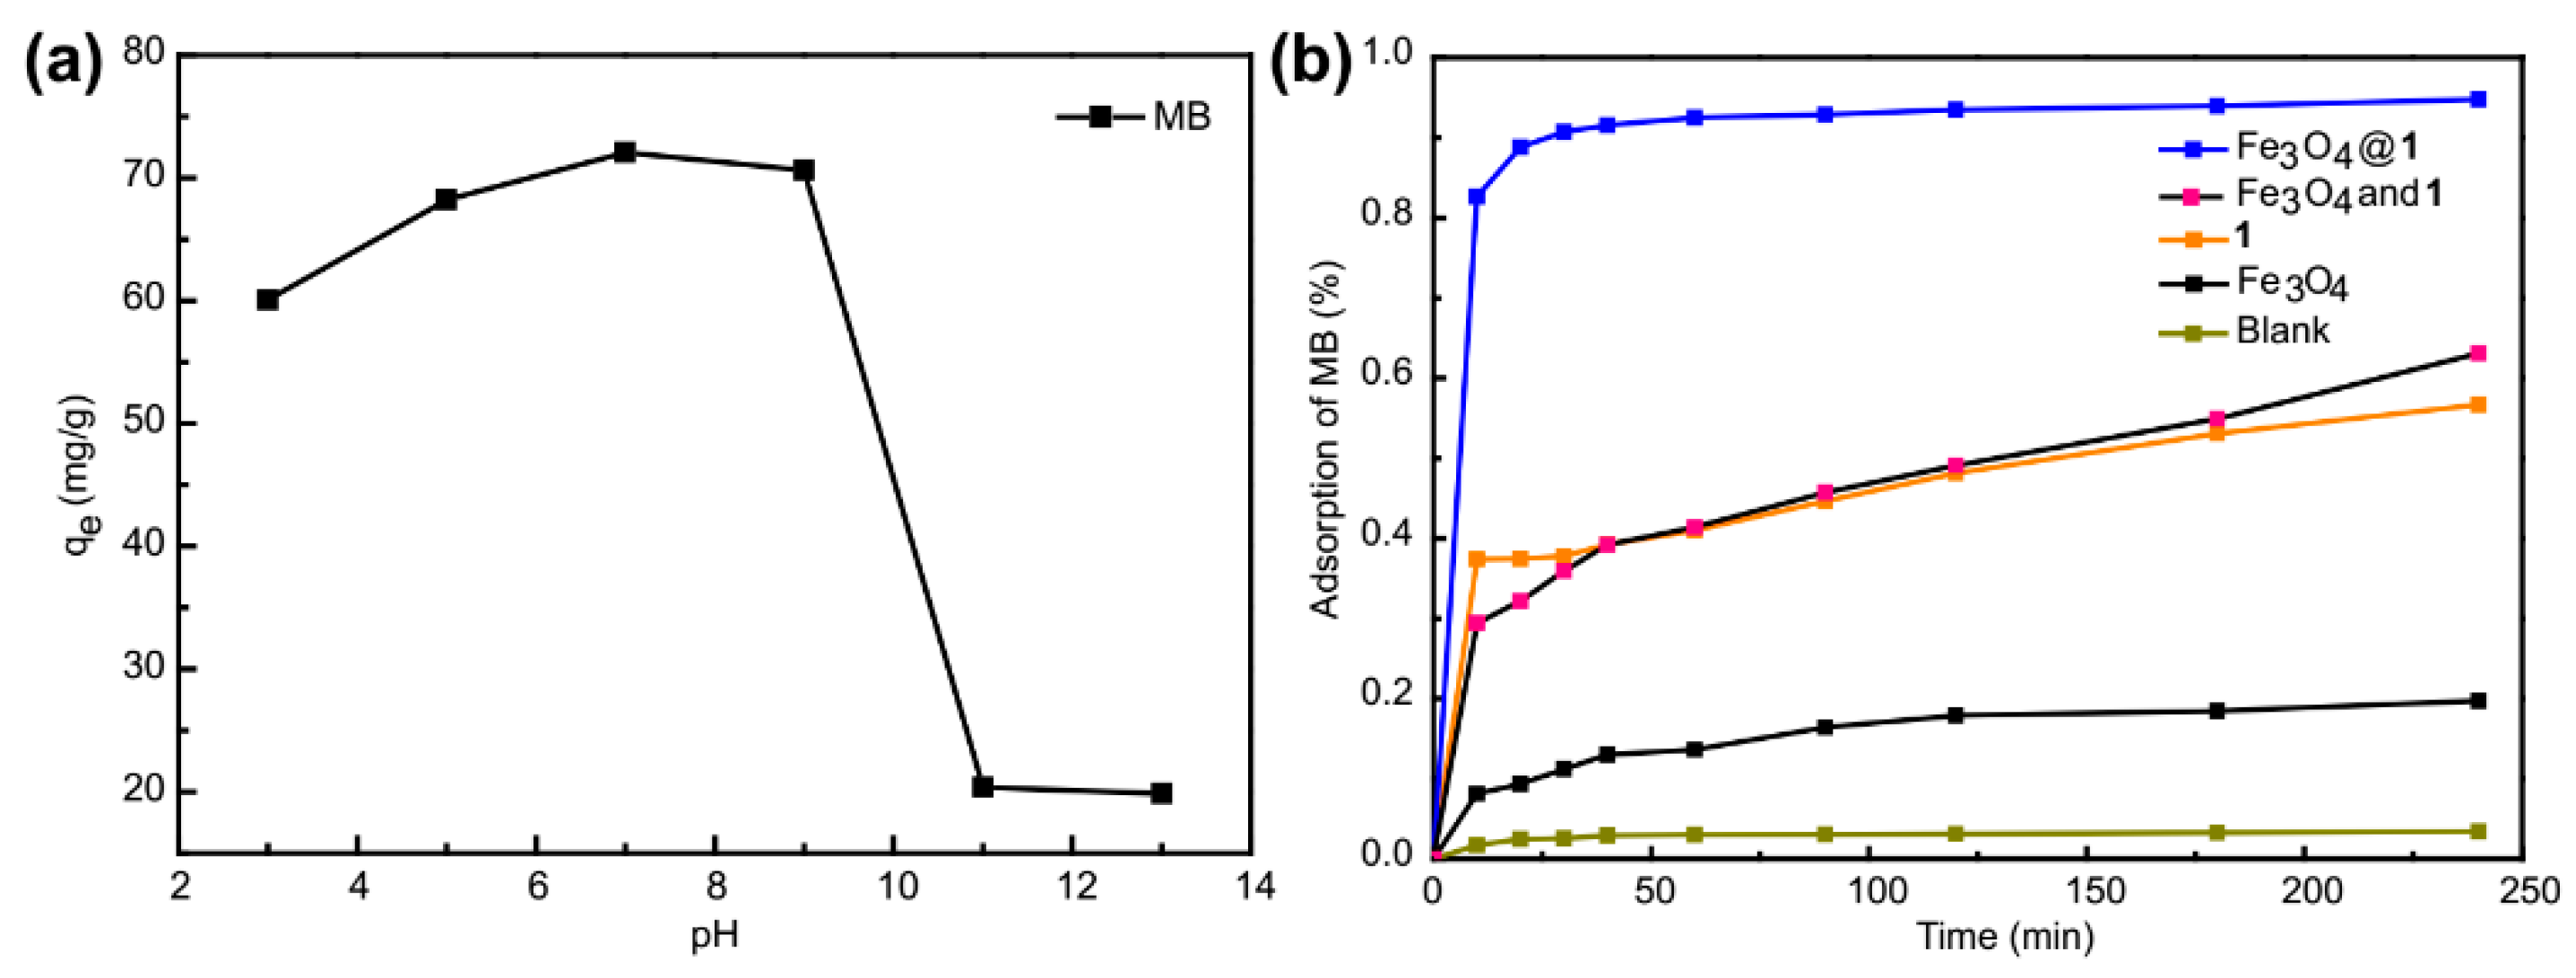
The effect of initial pH values on MB adsorption over the Fe3O4@1 was studied by adjusting the solution pH to 3, 5, 7, 9, 11 and 13 (Figure 11a). It can be found that the initial pH is important for the adsorption of MB. When the initial pH values were in the range of 3~7, the adsorption equilibrium amount of Fe3O4@1 shows an obvious increase. However, it dropped sharply when the initial pH values ranging from 9 to 13 because Fe3O4@1 will decompose above pH 9. The MB adsorption capability retained a relatively high condition when the initial pH values were ca. 7, which was used in the experiments.
For comparison with Fe3O4@1, effect of blank, Fe3O4, 1, Fe3O4 and 1 were tested, respectively. (Figure 11b). Blank experiment indicated the MB aqueous solution hardly changed after 4 h. Under the same condition, the adsorption efficiency of Fe3O4, 1, Fe3O4 and 1, Fe3O4@1 was 19.70%, 56.66%, 63.1%, 94.80%, respectively. Thus, the active site of adsorption reaction of Fe3O4@1 might concentrate on polyoxometalate hybrid 1 and the Fe3O4@1 showed a better adsorption performance when Fe3O4 and 1 were bound together.
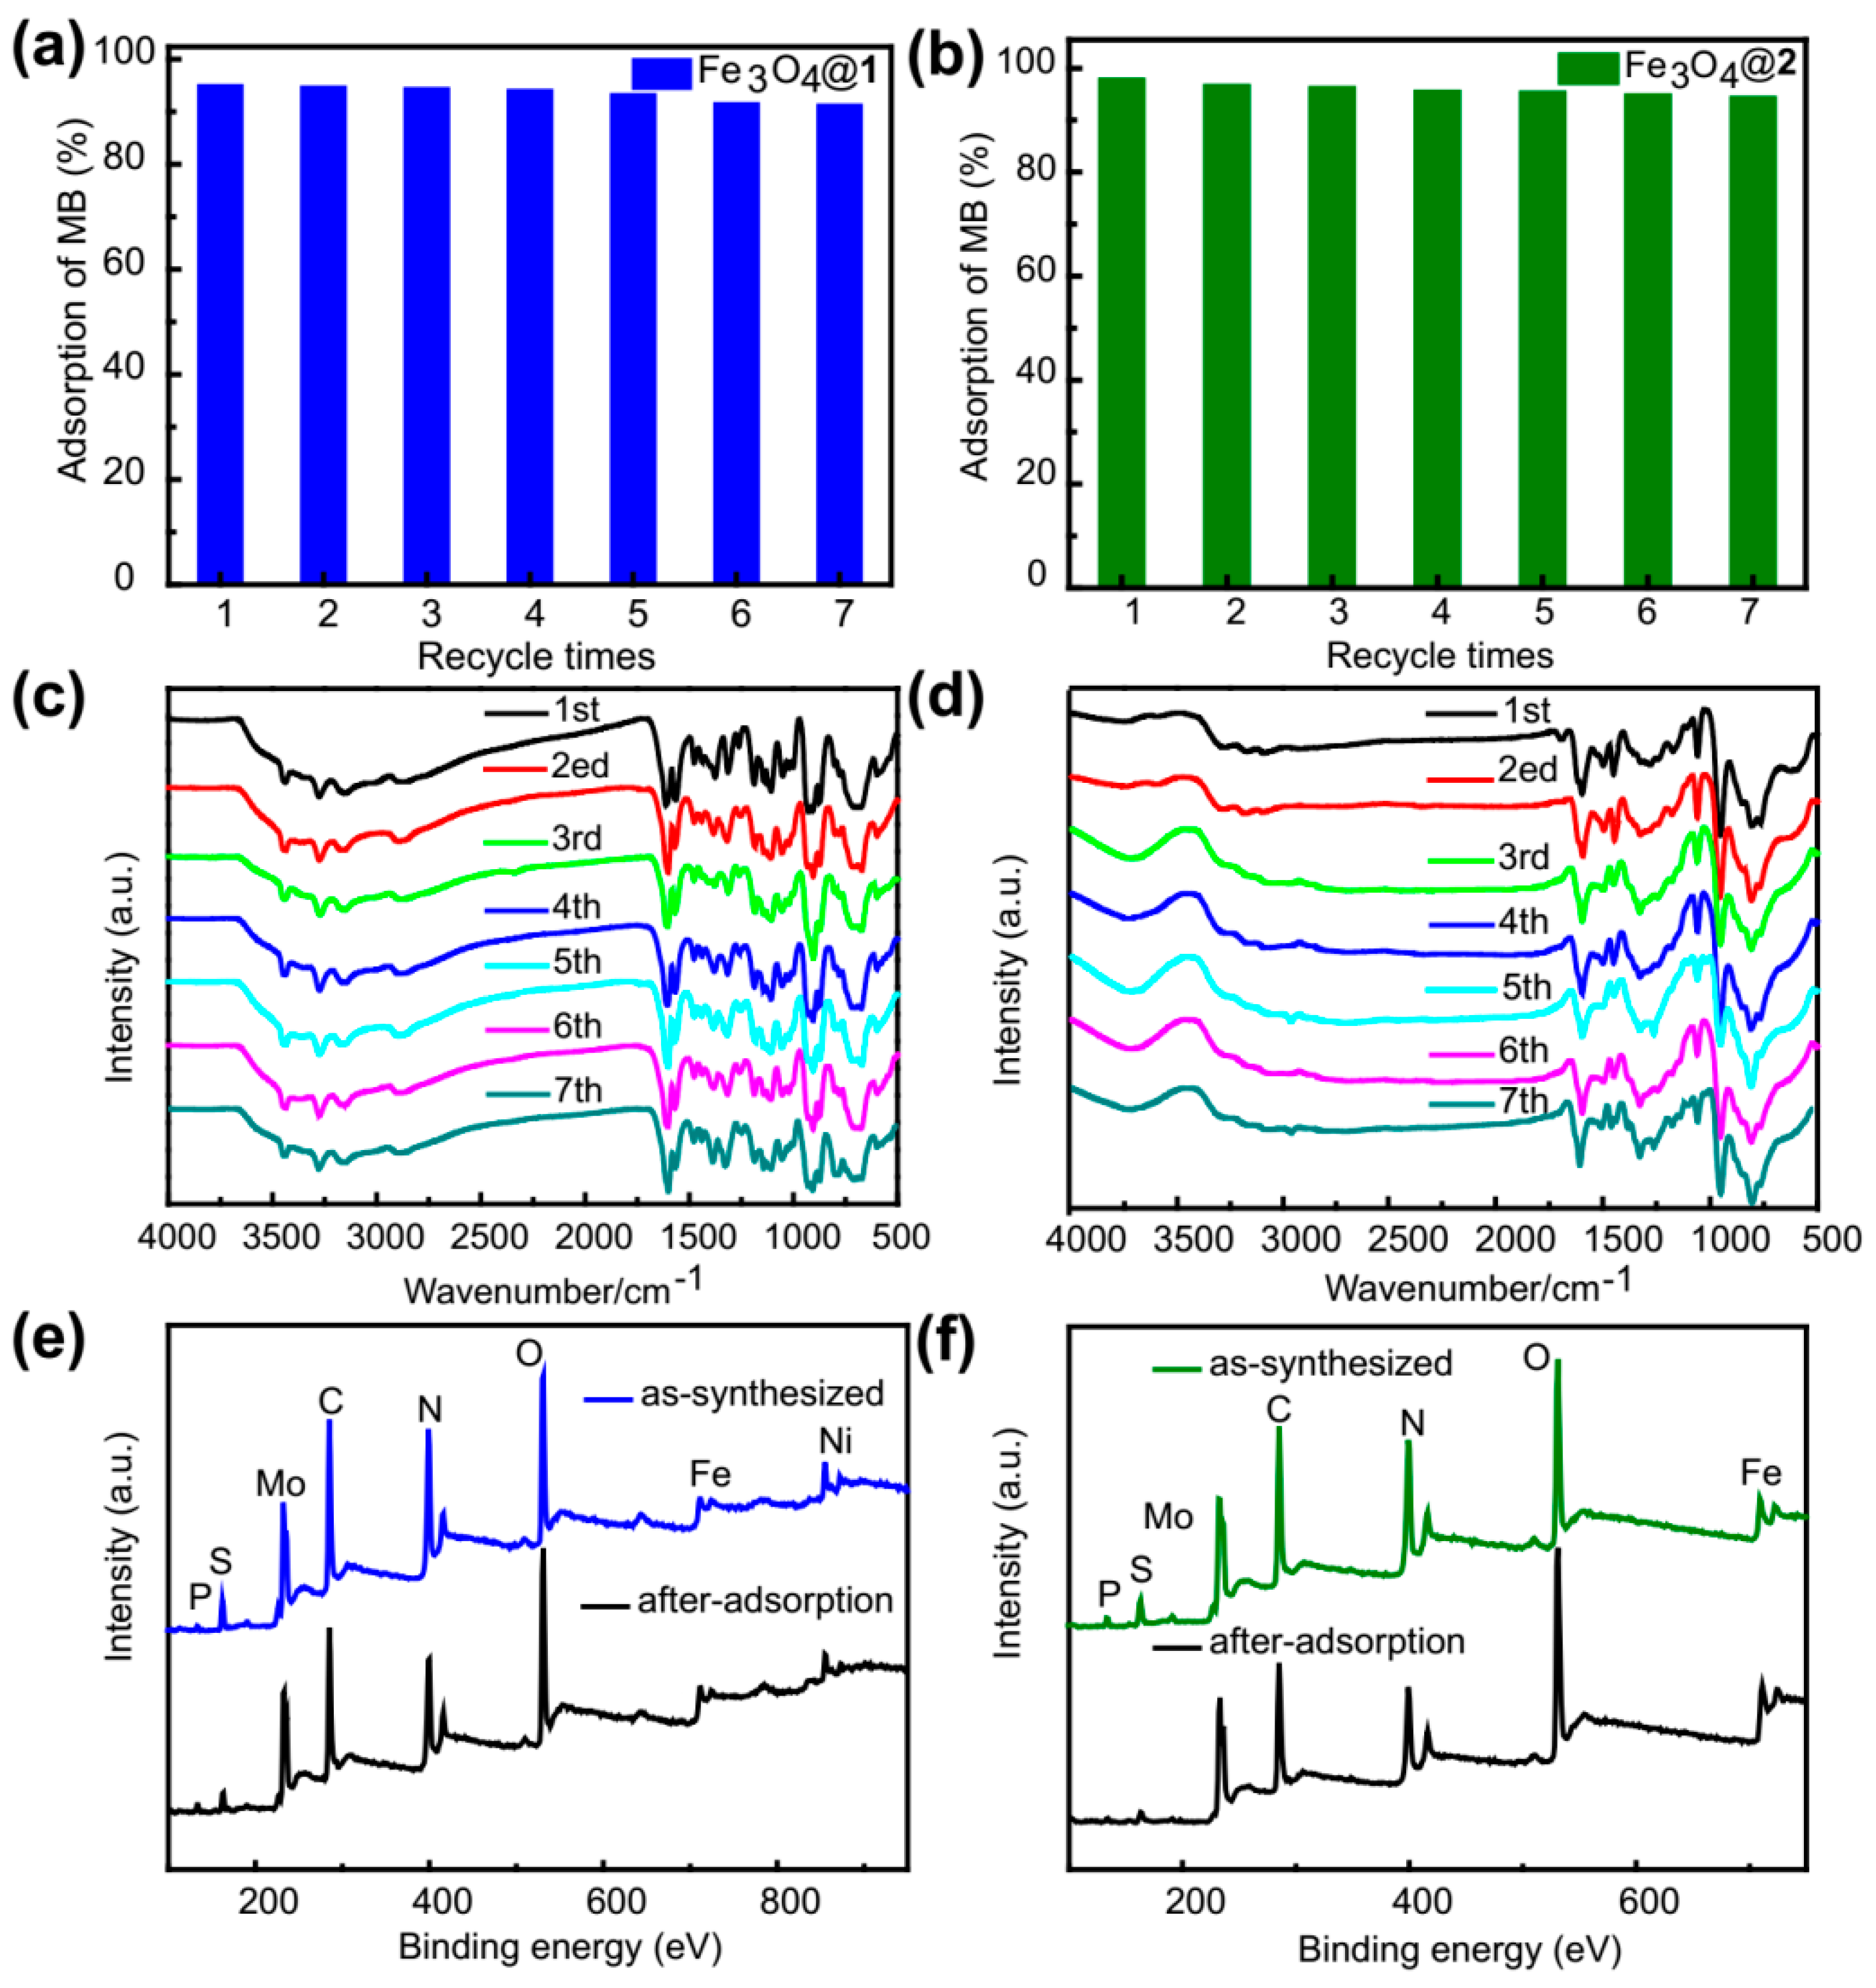
The reusability and stability of adsorbents are very important factors for their practical application [36,37]. The reusability of the two adsorbents was studied via seven repeated experiments under constant experimental conditions (initial MB concentration of 15 mg/L). For this purpose, the adsorbents were collected by a magnet putting on one side of the beaker, and washed with ethanol in an ultrasonic environment. These processes were repeated seven times. After the fifth washing, the collected adsorbents were dried in an oven at 60 °C. Then the recovered adsorbents were used in another adsorption run. The results exhibited that the adsorption capacities decreased only about 3.73% for Fe3O4@1 and 3.5% for Fe3O4@2 after seven runs (Figure 12a,b), indicating that the two nanocomposites could be reused as efficient adsorbents for wastewater. During recycling, the two adsorbents almost maintained the same adsorption capacity. The slight decline might correspond to the loss of adsorbents for washing and FT-IR testing. The FT-IR spectra of the adsorbents collected after adsorption of MB are very similar to that observed for the initial as-synthesized (Figure 12c,d). Moreover, in order to further investigate the stability of Fe3O4@1 and Fe3O4@2, the XPS of as-synthesized and after-adsorption were tested (Figure 12e,f). These results clearly indicated the high stability of the two adsorbents. It should be noted that the XPS of as-synthesized nanocomposites indicated that Fe3O4 and 1, 2 were successfully bound together again. Consequently, Fe3O4@1 and Fe3O4@2 were almost restored to its original adsorption property and showed excellent stability, which indicated a great possibility for water treatment.
4. Conclusions
In conclusion, two magnetic adsorbents Fe3O4@1 and Fe3O4@2 were synthesized by the ultrasonic method with Fe3O4 and polyoxometalate hybrids 1, 2. The ZFC and FC measurements indicated the blocking temperatures at 160 K and 180 K, respectively. The BET surface areas of Fe3O4@1 and Fe3O4@2 were 8.106 m2/g and 1.787 m2/g, respectively. The two adsorbents were highly efficient for selective removal of cationic dyes from aqueous solution. The adsorption efficiency of MB solution was 94.8% for Fe3O4@1 and 97.67% for Fe3O4@2. The maximum MB adsorption capacities of Fe3O4@1 and Fe3O4@2 were 72.07 and 73.25 mg/g, respectively. The adsorption kinetics indicated that the MB removal followed the pseudo-second-order model. More importantly, the two adsorbents exhibited good recyclability and high stability. After seven cycles, the two adsorbents almost maintained the same adsorption capacity. The FT-IR and XPS spectra of the two adsorbents collected from the adsorption experiments agreed well with the fresh samples indicating their high stability. These results clearly indicate that the two nanocomposites have potential applications in wastewater treatment.
Supplementary Materials
The following are available online at https://www.mdpi.com/2079-4991/9/4/649/s1: Figure S1: Thermogravimetric analyses of (a) Fe3O4@1 and (b) Fe3O4@2.
Author Contributions
M.L., Q.H. and H.L. designed experiments and revised manuscript. J.L., H.Z. and C.M. performed the experiments and analyzed the data. J.L. wrote the manuscript. All authors have read and approved the final manuscript.
Funding
This research was funded by the National Natural Science Foundation of China (21671055). The project was supported by Open Research Fund of Henan Key Laboratory of Polyoxometalate Chemistry (HNPOMKF1601).
Conflicts of Interest
The authors declare no conflict of interest.
References
- Zhang, L.; Zhao, Y.; Zhong, L.L.; Wang, Y.; Chai, S.N.; Yang, T.; Han, X.L. Cu2S-Cu-TiO2 mesoporous carbon composites for the degradation of high concentration of methyl orange under visible light. Appl. Surf. Sci. 2017, 422, 1093–1101. [Google Scholar] [CrossRef]
- Jing, F.F.; Liang, R.W.; Xiong, J.H.; Chen, R.; Zhang, S.Y.; Li, Y.H.; Wu, L. MIL-68(Fe) as an efficient visible-light-driven photocatalyst for the treatment of a simulated waste-water contain Cr(VI) and Malachite Green. Appl. Catal. B 2017, 206, 9–15. [Google Scholar] [CrossRef]
- Hoque, M.A.; Guzman, M.I. Photocatalytic activity: experimental features to report in heterogeneous photocatalysis. Materials 2018, 11, 1990. [Google Scholar] [CrossRef] [PubMed]
- Asahi, R.; Morikawa, T.; Ohwaki, T. Visible-light photocatalysis in nitrogendoped titanium oxides. Science 2001, 293, 269–271. [Google Scholar] [CrossRef]
- Tong, H.; Ouyang, S.X.; Bi, Y.P. Nano-photocatalytic materials: Possibilities and challenges. Adv. Mater. 2012, 24, 229–251. [Google Scholar] [CrossRef]
- Lv, H.; Liu, Y.M.; Tang, H.B. Synergetic effect of MoS2 and graphene as cocatalysts for enhanced photocatalytic activity of BiPO4 nanoparticles. Appl. Surf. Sci. 2017, 425, 100–106. [Google Scholar] [CrossRef]
- Chen, X.B.; Mao, S.S. Titanium dioxide nanomaterials: synthesis, properties, modifications, and applications. Chem. Rev. 2007, 107, 2891–2959. [Google Scholar] [CrossRef]
- Chen, X.B.; Shen, S.H.; Guo, L.J.; Mao, S.S. Semiconductor-based photocatalytic hydrogen generation. Chem. Rev. 2010, 110, 6503–6570. [Google Scholar] [CrossRef]
- Kudo, A.; Miseki, Y. Heterogeneous photocatalyst materials for watersplitting. Chem. Soc. Rev. 2009, 38, 253–278. [Google Scholar] [CrossRef]
- Anastopoulos, I.; Bhatnagar, A.; Hameed, B.H.; Ok, Y.S.; Omirou, M. A review on waste-derived adsorbents from sugar industry for pollutant removal in water and wastewater. J. Mol. Liq. 2017, 240, 179–188. [Google Scholar] [CrossRef]
- Ahmed, M.J. Application of agricultural based activated carbons by microwave and conventional activations for basic dye adsorption: Review. J. Environ. Chem. Eng. 2016, 4, 89–99. [Google Scholar] [CrossRef]
- Zou, C.; Zhang, Z.J.; Xu, X.; Gong, Q.H.; Li, J.; Wu, C.D. A multifunctional organic-inorganic hybrid structure based on MnIII-porphyrin and polyoxometalate as a highly effective dye scavenger and heterogenous catalyst. J. Am. Chem. Soc. 2012, 134, 87–90. [Google Scholar] [CrossRef] [PubMed]
- Ji, Y.M.; Ma, C.G.; Li, J.; Zhao, H.Y.; Chen, Q.Q.; Li, M.X.; Liu, H.L. A magnetic adsorbent for the removal of cationic dyes from wastewater. Nanomaterials 2018, 8, 710. [Google Scholar] [CrossRef] [PubMed]
- Paul, L.; Dolai, M.; Panja, A.; Ali, M. Hydrothermal synthesis of two supramolecular inorganic–organic hybrid phosphomolybdates based on Ni(II) and Co(II) ions: Structural diversity and heterogeneous catalytic activities. New J. Chem. 2016, 40, 6931–6938. [Google Scholar] [CrossRef]
- Krishna, P.M.; Reddy, N.B.G.; Kottam, N.; Yallur, B.C.; Katreddi, H.R. Design and synthesis of metal complexes of (2E)-2-[(2E)-3-phenylprop-2-en-1-ylidene]hydrazinecarbothioamide and their photocatalytic degradation of methylene blue. Sci. World J. 2013, 2013, 828313. [Google Scholar] [CrossRef] [PubMed]
- Reddy, N.B.G.; Krishna, P.M.; Kottam, N. Novelmetal-organic photocatalysts: Synthesis, characterization and decomposition of organic dyes. Spectrochim. Acta A 2015, 137, 371–377. [Google Scholar] [CrossRef] [PubMed]
- Yavuz, E.; Tokalıoğlu, Ş.; Patat, Ş. Core–shell Fe3O4 polydopamine nanoparticles as sorbent for magnetic dispersive solid-phase extraction of copper from food samples. Food Chem. 2018, 263, 232–239. [Google Scholar] [CrossRef] [PubMed]
- Sricharoen, P.; Limchoowong, N.; Areerob, Y.; Nuengmatcha, P.; Techawongstienc, S.; Chanthai, S. Fe3O4/hydroxyapatite/graphene quantum dots as a novel nano-sorbent for preconcentration of copper residue in Thai food ingredients: Optimization of ultrasound-assisted magnetic solid phase extraction. Ultrason. Sonochem. 2017, 37, 83–93. [Google Scholar] [CrossRef] [PubMed]
- Liu, H.L.; Wu, J.H.; Min, J.H.; Zhang, X.Y.; Kim, Y.K. Tunable synthesis and multifunctionalities of Fe3O4–ZnO hybrid core-shell nanocrystals. Mater. Res. Bull. 2013, 48, 551–558. [Google Scholar] [CrossRef]
- Sheldrick, G.M. A short history of SHELX. Acta Cryst. 2008, A64, 112–122. [Google Scholar] [CrossRef]
- Caffrey, M. A comprehensive review of the lipid cubic phase or in meso method for crystallizing membrane and soluble proteins and complexes. Acta Cryst. 2015, F71, 3–18. [Google Scholar]
- Wei, X.; Huang, T.; Nie, J.; Yang, J.H.; Qi, X.D.; Zhou, Z.W.; Wang, Y. Bio-inspired functionalization of microcrystalline cellulose aerogel with high adsorption performance toward dyes. Carbohyd. Polym. 2018, 198, 546–555. [Google Scholar] [CrossRef]
- Wu, H.J.; Gao, H.Y.; Yang, Q.X.; Zhang, H.L.; Wang, D.S.; Zhang, W.J.; Yang, X.F. Removal of typical organic contaminants with a recyclable calcined chitosan-supported layered double hydroxide adsorbent: Kinetics and equilibrium isotherms. J. Chem. Eng. Data 2018, 63, 159–168. [Google Scholar] [CrossRef]
- Strandberg, R. The molecular and crystal structure of Na6Mo5P2O23(H2O)13, a compound containing sodium-coordinated pentamolybdodiphosphate anions. Acta Chem. Scand. 1973, 27, 1004–1018. [Google Scholar] [CrossRef]
- Han, M.D.; Niu, Y.J.; Wan, R.; Xu, Q.F.; Lu, J.K.; Ma, P.T.; Zhang, C.; Niu, J.Y.; Wang, J.P. A crown-shaped Ru-substituted arsenotungstate for selective oxidation of sulfides with hydrogen peroxide. Chem. Eur. J. 2018, 24, 11059–11066. [Google Scholar] [CrossRef]
- Li, J.; Guo, J.P.; Jia, J.G.; Ma, P.T.; Zhang, D.D.; Wang, J.P.; Niu, J.Y. Isopentatungstate-supported metal carbonyl derivative: Synthesis, characterization, and catalytic properties for alkene epoxidation. Dalton Trans. 2016, 45, 6726–6731. [Google Scholar] [CrossRef]
- Li, Z.L.; Wang, Y.; Zhang, L.C.; Wang, J.P.; You, W.S.; Zhu, Z.M. Three molybdophosphates based on Strandbergtype anions and Zn(II)-H2biim/H2O subunits: Syntheses, structures and catalytic properties. Dalton Trans. 2014, 43, 5840–5846. [Google Scholar] [CrossRef] [PubMed]
- Liang, Y.F.; Li, S.Z.; Yang, D.H.; Ma, P.T.; Niu, J.Y.; Wang, J.P. Controllable assembly of multicarboxylic acids functionalized heteropolyoxomolybdates and allochroic properties. J. Mater. Chem. C 2015, 3, 4632–4639. [Google Scholar] [CrossRef]
- Shi, Y.L.; Qiu, W.; Zheng, Y. Synthesis and characterization of a POM-based nanocomposite as a novel magnetic photocatalyst. J. Phys. Chem. Solids 2006, 67, 2409–2418. [Google Scholar] [CrossRef]
- Castellanos-Rubio, I.; Insausti, M.; Garaio, E.; de Muro, I.G.; Plazaola, F.; Rojo, T.; Lezama, L. Fe3O4 nanoparticles prepared by the seeded-growth route for hyperthermia: Electronmagnetic resonance as a key tool to evaluate size distribution in magnetic nanoparticles. Nanoscale 2014, 6, 7542–7552. [Google Scholar] [CrossRef]
- Fang, N.; Ji, Y.M.; Li, C.Y.; Wu, Y.Y.; Ma, C.G.; Liu, H.L.; Li, M.X. Synthesis and adsorption properties of [Cu(L)2(H2O)]H2[Cu(L)2(P2Mo5O23)]•4H2O/Fe3O4 nanocomposites. RSC Adv. 2017, 7, 25325–25333. [Google Scholar] [CrossRef]
- Hua, Y.N.; Xiao, J.; Zhang, Q.Q.; Cui, C.; Wang, C. Facile synthesis of surface-functionalized magnetic nanocomposites for effectively selective adsorption of cationic dyes. Nanoscale Res. Lett. 2018, 13, 99. [Google Scholar] [CrossRef] [Green Version]
- Ho, Y.S.; Mckay, G. Pseudo-second order model for sorption processes. Process Biochem. 1999, 34, 451–465. [Google Scholar] [CrossRef]
- He, J.C.; Li, J.; Du, W.; Han, Q.X.; Wang, Z.L.; Li, M.X. A mesoporous metal-organic framework: Potential advances in selective dye adsorption. J. Alloy. Compd. 2018, 750, 360–367. [Google Scholar] [CrossRef]
- Fu, N.J.; Li, L.T.; Liu, K.J.; Kim, C.K.; Li, J.; Zhu, T.; Li, J.H.; Tang, B.K. A choline chloride-acrylic acid deep eutectic solvent polymer based on Fe3O4 particles and MoS2 sheets (poly(ChCl-AA DES)@Fe3O4@MoS2) with specific recognition and good antibacterial properties for β-lactoglobulin in milk. Talanta 2019, 197, 567–577. [Google Scholar] [CrossRef] [PubMed]
- Schaepertoens, M.; Didaskalou, C.; Kim, J.F.; Livingston, A.G.; Szekely, G. Solvent recycle with imperfect membranes: A semi-continuous workaround for diafiltration. J. Membr. Sci. 2016, 514, 646–658. [Google Scholar] [CrossRef] [Green Version]
- Fodi, T.; Didaskalou, C.; Kupai, J.; Balogh, G.T.; Huszthy, P.; Szekely, G. Nanofiltration-enabled in situ solvent and reagent recycle for sustainable continuous-flow synthesis. Chem. Sustain. 2017, 10, 3435–3444. [Google Scholar] [CrossRef]
Figure 1.
The structure of (a) 1 and (c) HL. Coordination patterns of (d) Ni2+ ion. Polyhedral/wire-stick representation of the 3D network of (b) 1 and (e) 2.
Figure 1.
The structure of (a) 1 and (c) HL. Coordination patterns of (d) Ni2+ ion. Polyhedral/wire-stick representation of the 3D network of (b) 1 and (e) 2.

Figure 2.
The fourier transform infrared (FT-IR) spectra of 1, Fe3O4@1, 2, Fe3O4@2 and Fe3O4.

Figure 3.
The Ultraviolet–visible) (UV–vis) spectra of 1, Fe3O4@1, 2, Fe3O4@2 and Fe3O4.

Figure 4.
Magnetic measurements. Hysteresis curves of Fe3O4@1, Fe3O4@2 and Fe3O4 recorded at (a) 300 K and (b) 5 K. FC and ZFC curves of (c) Fe3O4@1 and (d) Fe3O4@2 under the magnetic field of 500 Oe.
Figure 4.
Magnetic measurements. Hysteresis curves of Fe3O4@1, Fe3O4@2 and Fe3O4 recorded at (a) 300 K and (b) 5 K. FC and ZFC curves of (c) Fe3O4@1 and (d) Fe3O4@2 under the magnetic field of 500 Oe.

Figure 5.
The dispersion-collection process of (a) Fe3O4@1 and (b) Fe3O4@2.

Figure 6.
Transmission electron microscope (TEM) images of (a) Fe3O4@1, (d) Fe3O4@2. Particle size histogram with Gaussian fit of (b) Fe3O4@1, (e) Fe3O4@2. HRTEM of (c) Fe3O4@1, (f) Fe3O4@2.
Figure 6.
Transmission electron microscope (TEM) images of (a) Fe3O4@1, (d) Fe3O4@2. Particle size histogram with Gaussian fit of (b) Fe3O4@1, (e) Fe3O4@2. HRTEM of (c) Fe3O4@1, (f) Fe3O4@2.

Figure 7.
(a) The X-ray diffraction (XRD) analyses of simulation of 1 and 2, Fe3O4@1, Fe3O4@2 and Fe3O4. (b) the N2 adsorption-desorption isotherms of Fe3O4@1 sample.
Figure 7.
(a) The X-ray diffraction (XRD) analyses of simulation of 1 and 2, Fe3O4@1, Fe3O4@2 and Fe3O4. (b) the N2 adsorption-desorption isotherms of Fe3O4@1 sample.

Figure 8.
Absorption of MB and MO aqueous solution in the presence of (a) Fe3O4@1, (b) Fe3O4@2 and the chemical structure of (c) MB, (d) MO.
Figure 8.
Absorption of MB and MO aqueous solution in the presence of (a) Fe3O4@1, (b) Fe3O4@2 and the chemical structure of (c) MB, (d) MO.

Figure 9.
(a) Plots of pseudo-second-order kinetics for the adsorption of methylene blue (MB) over adsorbent Fe3O4@1; (b) absorption spectra of rhodamine B (RhB) aqueous solution in the presence of Fe3O4@1.
Figure 9.
(a) Plots of pseudo-second-order kinetics for the adsorption of methylene blue (MB) over adsorbent Fe3O4@1; (b) absorption spectra of rhodamine B (RhB) aqueous solution in the presence of Fe3O4@1.

Figure 10.
Isotherms of (a) Langmuir and (b) Freundlich model of MB adsorption on the Fe3O4@1.

Figure 11.
(a) Effect of pH on MB adsorption over the Fe3O4@1 (initial solutions, 15 mg L−1; temperature, 298 K). (b) Adsorption activity comparison of blank, Fe3O4, 1, Fe3O4 and 1, Fe3O4@1.
Figure 11.
(a) Effect of pH on MB adsorption over the Fe3O4@1 (initial solutions, 15 mg L−1; temperature, 298 K). (b) Adsorption activity comparison of blank, Fe3O4, 1, Fe3O4 and 1, Fe3O4@1.

Figure 12.
Reusability studies of (a) Fe3O4@1 and (b) Fe3O4@2. The FT-IR spectra of (c) Fe3O4@1 and (d) Fe3O4@2 for adsorption of MB. The as-synthesized and after-adsorption X-ray photoelectron spectroscopy (XPS) of (e) Fe3O4@1 and (f) Fe3O4@2.
Figure 12.
Reusability studies of (a) Fe3O4@1 and (b) Fe3O4@2. The FT-IR spectra of (c) Fe3O4@1 and (d) Fe3O4@2 for adsorption of MB. The as-synthesized and after-adsorption X-ray photoelectron spectroscopy (XPS) of (e) Fe3O4@1 and (f) Fe3O4@2.


Table 1.
Summary of crystal data and refinement results for hybrids 1 and 2.
| Hybrids | 1 | 2 |
|---|---|---|
| Empirical formula | C32H50Ni2Mo5N16O27P2S4 | C40H80Mo5N20O35P2S5 |
| Formula weight | 1878.13 | 2103.15 |
| Temperature | 296(2) | 296(2) |
| Crystal system | Monoclinic | Monoclinic |
| space group | C/c | P2(1)/c |
| a/[Å] | 29.786(10) | 10.8531(6) |
| b/[Å] | 12.676(4) | 28.4792(16) |
| c/[Å] | 19.097(7) | 25.8460(15) |
| β[°] | 119.353(5) | 96.9100(10) |
| Z | 4 | 4 |
| Volume/[Å3] | 6285.0(4) | 7930.7(8) |
| Calculated density/[g·cm−3] | 1.972 | 1.745 |
| μ/[mm−1] | 1.825 | 1.034 |
| F(000) | 3672 | 4160 |
| Crystal size/mm3 | 0.21 × 0.18 × 0.17 | 0.23 × 0.23 × 0.20 |
| Theta range for data collection | 2.16–25.00 | 1.59–25.00 |
| Limiting indices | −35 ≤ h ≤ 32, −15 ≤ k ≤ 12, −21 ≤ l ≤ 22 | −12 ≤ h ≤ 12, −30 ≤ k ≤ 33, −27 ≤ l ≤ 30 |
| Data/restraints/parameters | 7788/398/788 | 13927/0/959 |
| Reflections collected/unique | 12,785/7788 [R(int) = 0.0261] | 40,316/13,927 [R(int) = 0.0328] |
| Goodness-of-fit on F2 | 1.100 | 1.020 |
| Final R indices [I ≥ 2σ(I)] | 0.0611, 0.1596 | 0.0468, 0.1451 |
| R indices (all data) | 0.1053, 0.2299 | 0.0610, 0.1539 |
| Largest diff. peak and hole/[e·Å−3] | 2.251, −1.288 | 2.951, −1.150 |
Table 2.
Fitting parameters (R2) by pseudo-second-order models.
| MB (mg/L) | 10 | 15 | 20 | 25 | 30 |
|---|---|---|---|---|---|
| R2 | 0.99978 | 0.99996 | 0.99996 | 0.99979 | 0.9997 |
Table 3.
Parameters of isothermal for the adsorption of MB on the Fe3O4@1.
| Equations | Parameters | ||
|---|---|---|---|
| Langmuir | qm (mg g−1) | KL | R2 |
| 71.0 | 19.53 | 0.9968 | |
| Freundlich | n | KF | R2 |
| 0.90 | 17.82 | 0.9977 | |
© 2019 by the authors. Licensee MDPI, Basel, Switzerland. This article is an open access article distributed under the terms and conditions of the Creative Commons Attribution (CC BY) license (http://creativecommons.org/licenses/by/4.0/).
Share and Cite
MDPI and ACS Style
Li, J.; Zhao, H.; Ma, C.; Han, Q.; Li, M.; Liu, H. Preparation of Fe3O4@polyoxometalates Nanocomposites and Their Efficient Adsorption of Cationic Dyes from Aqueous Solution. Nanomaterials 2019, 9, 649. https://doi.org/10.3390/nano9040649
AMA Style
Li J, Zhao H, Ma C, Han Q, Li M, Liu H. Preparation of Fe3O4@polyoxometalates Nanocomposites and Their Efficient Adsorption of Cationic Dyes from Aqueous Solution. Nanomaterials. 2019; 9(4):649. https://doi.org/10.3390/nano9040649
Chicago/Turabian StyleLi, Jie, Haiyan Zhao, Chenguang Ma, Qiuxia Han, Mingxue Li, and Hongling Liu. 2019. "Preparation of Fe3O4@polyoxometalates Nanocomposites and Their Efficient Adsorption of Cationic Dyes from Aqueous Solution" Nanomaterials 9, no. 4: 649. https://doi.org/10.3390/nano9040649
Note that from the first issue of 2016, this journal uses article numbers instead of page numbers. See further details here.