Article

Transparent Sol-Gel Oxyfluoride Glass-Ceramics with High Crystalline Fraction and Study of RE Incorporation

1
Instituto de Cerámica y Vidrio, CSIC, 28049 Madrid, Spain
2
FunGlass—Centre for Functional and Surface Functionalized Glass, Alexander Dubček University of Trenčín, Trenčín 91150, Slovakia
3
SpLine, Spanish CRG Beamline—European Synchrotron Radiation Facility (ESRF), 38043 Grenoble, France
4
Instituto de Ciencia de Materiales de Madrid, CSIC, 28049 Madrid, Spain
5
Departamento Física de Materiales, Facultad de Ciencias, Universidad Autónoma de Madrid (UAM), 28049 Madrid, Spain
6
Departamento Física Aplica I, Escuela Superior de Ingeniería, Universidad del País Vasco (UPV-EHU), 48013 Bilbao, Spain
7
Centro de Física de Materiales, (UPV/EHU-CSIC), 20018 San Sebastian, Spain
8
Donostia International Physics Center (DIPC), 20018 San Sebastian, Spain
*
Author to whom correspondence should be addressed.
Nanomaterials 2019, 9(4), 530; https://doi.org/10.3390/nano9040530
Submission received: 28 February 2019 / Revised: 20 March 2019 / Accepted: 26 March 2019 / Published: 3 April 2019
(This article belongs to the Special Issue Rare Earth Doped Materials at the Nanoscale)

Abstract

:
Transparent oxyfluoride glass-ceramic films and self-supported layers with composition 80SiO2-20LaF3 doped with Er3+ have been successfully synthesized by sol-gel process for the first time. Crack-free films and self-supported layer with a maximum thickness up to 1.4 µm were obtained after heat treatment at the low temperature of 550 °C for 1 min, resulting in a LaF3 crystal fraction of 18 wt%, as confirmed by quantitative Rietveld refinement. This is the highest value reported up to now for transparent oxyfluoride glass-ceramics prepared by sol-gel. This work provides a new synthesis strategy and opens the way to a wide range of potential applications of oxyfluoride glass-ceramics. The characterization by a wide range of techniques revealed the homogeneous precipitation of LaF3 nanocrystals into the glass matrix. X-ray absorption spectroscopy and electron paramagnetic resonance confirmed that the Er3+ ions are preferentially embedded in the low phonon-energy LaF3 nanocrystals. Moreover, photoluminescence (PL) measurements confirmed the incorporation of dopants in the LaF3 nanocrystals. The effective concentration of rare-earth ions in the LaF3 nanocrystals is also estimated by X-ray absorption spectroscopy.

Graphical Abstract

1. Introduction

Oxyfluoride glass-ceramics (OxGCs) have attracted great interest in the field of photonics since the pioneering work of Wang and Ohwaki [1]. OxGCs are polycrystalline materials containing fluoride nano-crystals (NCs) that crystallize in a glass matrix during a controlled heat treatment of the precursor glass. Alumina-silicate glass matrices are suitable, due to their excellent mechanical, thermal and chemical properties compared to phosphate or fluoride glasses. In addition, OxGCs may host Rare-Earth (RE) ions in the low-phonon energy fluoride crystals (300–450 cm−1), thereby increasing the luminescence efficiency with respect to the corresponding oxide glasses [2,3,4,5,6,7,8,9,10,11,12,13,14]. The melt-quenching (MQ) method has been routinely used to prepare OxGCs that showed excellent optical properties and a significant enhancement of photoluminescence with respect to the precursor glasses. Moreover, the possibility to draw fibers and convert the core into a GC revealed the importance of this method for the preparation of novel devices with new or improved optical efficiencies [15,16,17,18,19,20]. However, the high melting temperatures (1400–1700 °C) greatly affect the fluoride content, limiting the crystal phase content to 10 wt% or less for some crystal phases, such as LaF3 [7,9,10]. Furthermore, phase separation and spontaneous fluoride crystallization are usually present, due to fluorine immiscibility at high temperature in oxide-glass matrices. For these reasons, this method still has to overcome some problems and efforts are required to improve the quality and processing of these materials. Another crucial point concerns the incorporation of dopants into the fluoride NCs. In fact, it is known that in melted glasses there is a portion of RE ions that remain outside the fluoride NCs even after heat treatment for prolonged periods [10,12]. This phenomenon is explained considering the high glass viscosity at typical crystallization temperatures (Tg + 20–100 °C) that limits ionic diffusion. Moreover, due to the depletion of crystal formers in the glass matrix, a viscous Si-enriched shell forms around the crystals, which further limits ionic diffusion. A challenging goal is to obtain homogeneous materials with much higher fluoride contents and with higher dopant incorporation in the NCs, thus improving the optical efficiency.
The sol-gel (SG) route appears to be a promising alternative to prepare OxGC films and bulk materials for different applications, such as planar waveguides or integrated optics [21,22,23,24,25,26,27,28,29,30,31,32,33,34,35,36]. Ballato et al. [35] proposed to use LaF3 into planar photonic devices, such as planar confined waveguide and Kumar et al. [36] described Er3+ doped LaF3 transparent gels for its use in the infrared (IR) waveguide amplifiers at 1.5 μm.
The SG process is a cheap and extremely flexible chemical method for obtaining pure and very homogenous materials, as well as offering a wide range of possible nano/micro-structures at relatively low sintering temperatures (100–600 °C). Synthesis classically involves the hydrolysis and polycondensation of metal salts or metal-organic precursors, such as tetraethyl orthosilicate (TEOS), in alcoholic media [37]. In the late nineties, Fujihara et al. prepared the first OxGC SG materials in a two-step process [21] involving preparation of silica sol using the classical route followed by mixing of fluoride and RE-ion precursors (acetates, nitrates, chlorides etc.) dissolved in ethanol or acidic medium. The mixing of both solutions, with subsequent controlled crystallization, leads to the precipitation of fluoride crystals in the silica-glass matrix. However, the literature mostly describes the preparation of OxGC materials with a nominal content of 5 mol% active crystal phase, and with the final crystal fraction not being estimated [38]. For example, Szpikowska-Sroka reported 3 wt% of the crystallized phase for a nominal concentration of 5 mol% [34] Such concentrations are even lower than those obtained by MQ [2,10,12]. Other authors have attempted to increase the crystal content up to 15 mol% but opaque materials were obtained [21]. Moreover, high treatment temperatures (800–1000 °C) are used to obtain OxGCs from the amorphous precursors, even though the typical crystallization temperature of fluorides is between 280–350 °C. To date, the use of sol-gel to obtain OxGCs has not been widely investigated because no significant improvement in structural and optical properties has been achieved since the earliest papers. There is still much work to be performed on correlating the crystallization mechanism of these materials with the structure, dopant incorporation and optical properties.
In this work, novel OxGC materials with a much higher active crystal phase content and sintered at a much lower temperature than previously reported have been prepared by taking advantage of the particular benefits of the SG process. In addition, it was demonstrated how this method leads to precipitation of RE-doped NCs using short heat treatment times. Moreover, it is shown how most RE ions are incorporated into the NCs during the crystallization process.

2. Materials and Methods

2.1. Materials Preparation

Sols of composition (mol%) 80SiO2-20LaF3 doped with 0.1 and 0.5 Er3+ were prepared by partially replacing TEOS (Sigma Aldrich, St. Louis, MO, USA) with methyl-trimethoxy-silane (MTES, abcr, Karlsruhe, Germany) as a precursor with a TEOS/MTES molar ratio of 40/60. The synthesis was performed in two- step process starting from a silica sol with molar ratio: 0.4TEOS:0.6MTES:2.5CH3CH2OH:1H2O(0.1HCl):0.2CH3COOH (Merck, Darmstadt, Germany) stirred for 2 h at room temperature. Subsequently, La(CH3COO)3 (Sigma Aldrich), ethanol (EtOH), H2O and trifluoroacetic acid (TFA, Sigma Aldrich) in the molar ratio 1:5:4:4 was stirred for 2 h at 40 °C and then mixed with the silica sol in the ratio 0.8(TEOS + MTES):0.2La.
Thin films on silica and silicon wafers (111) were prepared by dip coating using withdrawal rates of 10–35 cm/min. Finally, the films were treated at 550 °C for 1 min and 1 h using a heating rate of 10 °C/min.
Moreover, self-supported layers (bulk-like monoliths 1–2 mm thick) of 80SiO2-20LaF3 composition doped with 0.1 and 0.5 Er3+ were prepared with TEOS and TEOS-MTES using the molar ratio 1TEOS:3EtOH:2H2O(0.1HCl) and 0.4TEOS:0.6MTES:3EtOH:2H2O(0.1HCl), respectively. An acetate dissolution, similar to that used for thin films, was added, raising the H2O content to obtain a total molar ratio 1TEOS:10H2O or 1(TEOS+MTES):10H2O.
Then, the sol was deposited into Petri dishes, covered, sealed and kept at 50 °C for 1 week to obtain the xerogel samples. GC samples were obtained by heating the xerogels at 550 °C for 1 min up to 1 h, with an intermediate step at 150 °C to remove water and solvents. Samples prepared with only TEOS were treated up to 650 °C for 1 h using a heating rate of 1 °C/min. The samples will be labelled with the composition followed by the silica precursor used for their preparation (TEOS) or (TEOS-MTES).

2.2. Characterization of Coatings and Self-supported Layers

Thin films deposited onto a silica and silicon wafer were characterized by spectroscopic ellipsometry in the range 250–1000 nm using an M-2000UTM ellipsometer (J.A. Woollam Co., Lincoln, NE, USA). The incident angles were set to 50° and 60° and the acquisition time to 10 s. The data were fitted using the CompleteEASE software (version 5.20, J.A. Woollam Co.) representing the film as a Cauchy layer deposited onto the corresponding substrate.
Differential thermal analysis (DTA) and thermogravimetry (TG) were measured using the SDT Q600 instrument (TA Instruments, New Castle, DE, USA). Around 20–30 mg of powder materials with a size of 1–1.25 mm, obtained after drying the sol at 50 °C, were measured in air and Argon using a heating rate of 10 °C/min.
X-Ray diffraction (XRD) patterns of 80SiO2-20LaF3-0.5Er3+ self-supported layers and grazing incidence XRD (GI-XRD) of 80SiO2-20LaF3 thin films were obtained at the BM25B-SpLine beamline of the ESRF (European Synchrotron Radiation Facility, Grenoble, France) [39], using an X-ray wavelength of 0.619 Å. For GI-XRD measurements, an incidence angle of 0.5° was used. The crystal size, ϕ, was estimated using the Scherrer’s equation:
ϕ = 0.94 λ cos θ   B m 2 B i 2 ,
where λ is the wavelength, Bm the full width half maximum of the peak and θ its diffraction angle. The instrumental broadening Bi was also taken into account. The diffraction-peak parameters were fit using a pseudo Voigt function.
Rietveld Refinement was performed using the FullProf software (FullProf Suite July 2017) [40], and the LaF3 crystal fraction was estimated using NaF as the internal weight standard in a similar manner to that described previously [12]. X-ray powder data were collected over the range 20° ≤ 2θ ≤ 120° in a step width of 0.0289° and a counting time of 4s per step employing a Bruker D8 high-resolution diffractometer (BRUKER, Billerica, MA, USA) equipped with a solid-state rapid LynxEye detector, and monochromatic Cu Kα1 radiation.
High Resolution Transmission Electron Microscopy (HRTEM) was performed using a JEOL 2100 field emission gun (Akishima, Tokyo, Japan) operating at 200 kV with a point resolution of 0.19 nm. The samples were obtained by scratching the films or milling the self-supported layers and dispersing in EtOH. Then, one or two drops of suspensions were depositing on the scaled fragments onto carbon-coated copper grids. The solvent was removed after drying the copper grids under a UV lamp.
Er3+ L3 edge X-Ray absorption spectroscopy (XAS, Grenoble, France) were used to characterize the 80SiO2-20LaF3 0.5Er3+ films treated at 150 °C for 1 h (xerogel) and at 550 °C for 1 min (GC) employing the BM25A-SpLine beamline (ESRF, Grenoble, France). XAS measurements were collected in fluorescence mode using a 13 element Si (Li) solid-state detector with the sample surface placed at an angle of 45° to the incident beam. The spectra represent an average of at least six scans; the XAS data were processed using the software ATHENA (Demeter 0.9.26) [41]. Both ErF3 and Er2O3 standards were also measured as references.
Electron Paramagnetic Resonance (EPR) spectra were obtained by a Bruker ESP 300E spectrometer (BRUKER) working in the X-band with field modulation of 100 kHz. The temperature was controlled with a continuous-flow helium cryostat ESR 900 (Oxford Instruments, Abingdon, UK) and the calibration of the resonance magnetic fields and microwave frequencies measured with an NMR Gauss-meter ER 035 M (BRUKER) and a frequency meter (Hewlett-Packard 5342A, Palo Alto, CA, USA), respectively. Self-supported layer samples (xerogel and GCs) doped with 0.1 and 0.5 Er3+ were milled and rolled in Teflon tape to perform the measurements.
The steady-state emission spectra were performed by exciting the 80SiO2-20LaF3 bulk samples and thin films doped with 0.1 and 0.5 Er3+ with a tunable Ti-sapphire ring laser (0.4 cm−1 linewidth) in the 770–920 nm spectral range. The fluorescence was analyzed with a 0.25 m monochromator, and the signal was detected by an extended IR Hamamatsu H10330A-75 photomultiplier (Hamamatsu, Shizuoka, Japan) and finally amplified by a standard lock-in technique. The sample temperature was varied between 9 and 300 K in a continuous flow cryostat.
Lifetime measurements were obtained by exciting the 80SiO2-20LaF3-0.1Er3+ (TEOS) bulk sample treated at 650 °C for 1 h with a Ti-sapphire laser pumped by a pulsed frequency-doubled Nd:YAG laser, 9 ns pulse width, (BM Industries, Paris, France), and detecting the emission with Hamamatsu H10330A-75 photomultiplier. Data were processed by a Tektronix oscilloscope (Tektronix Inc., Beaverton, OR, USA).

3. Results and Discussion

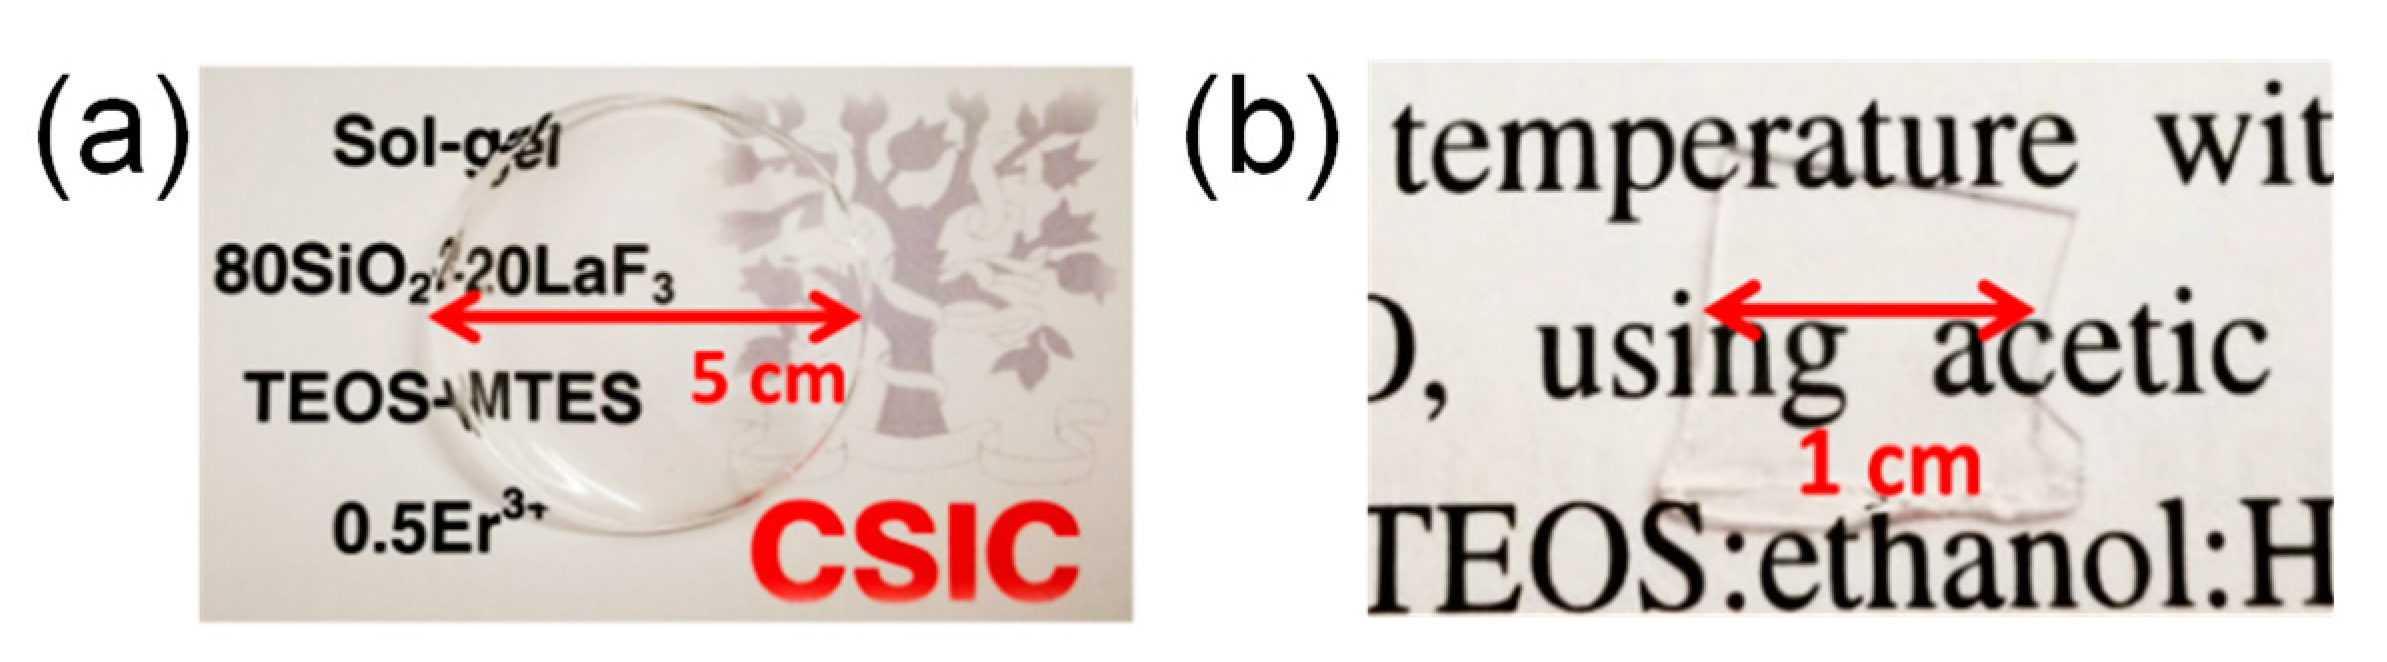
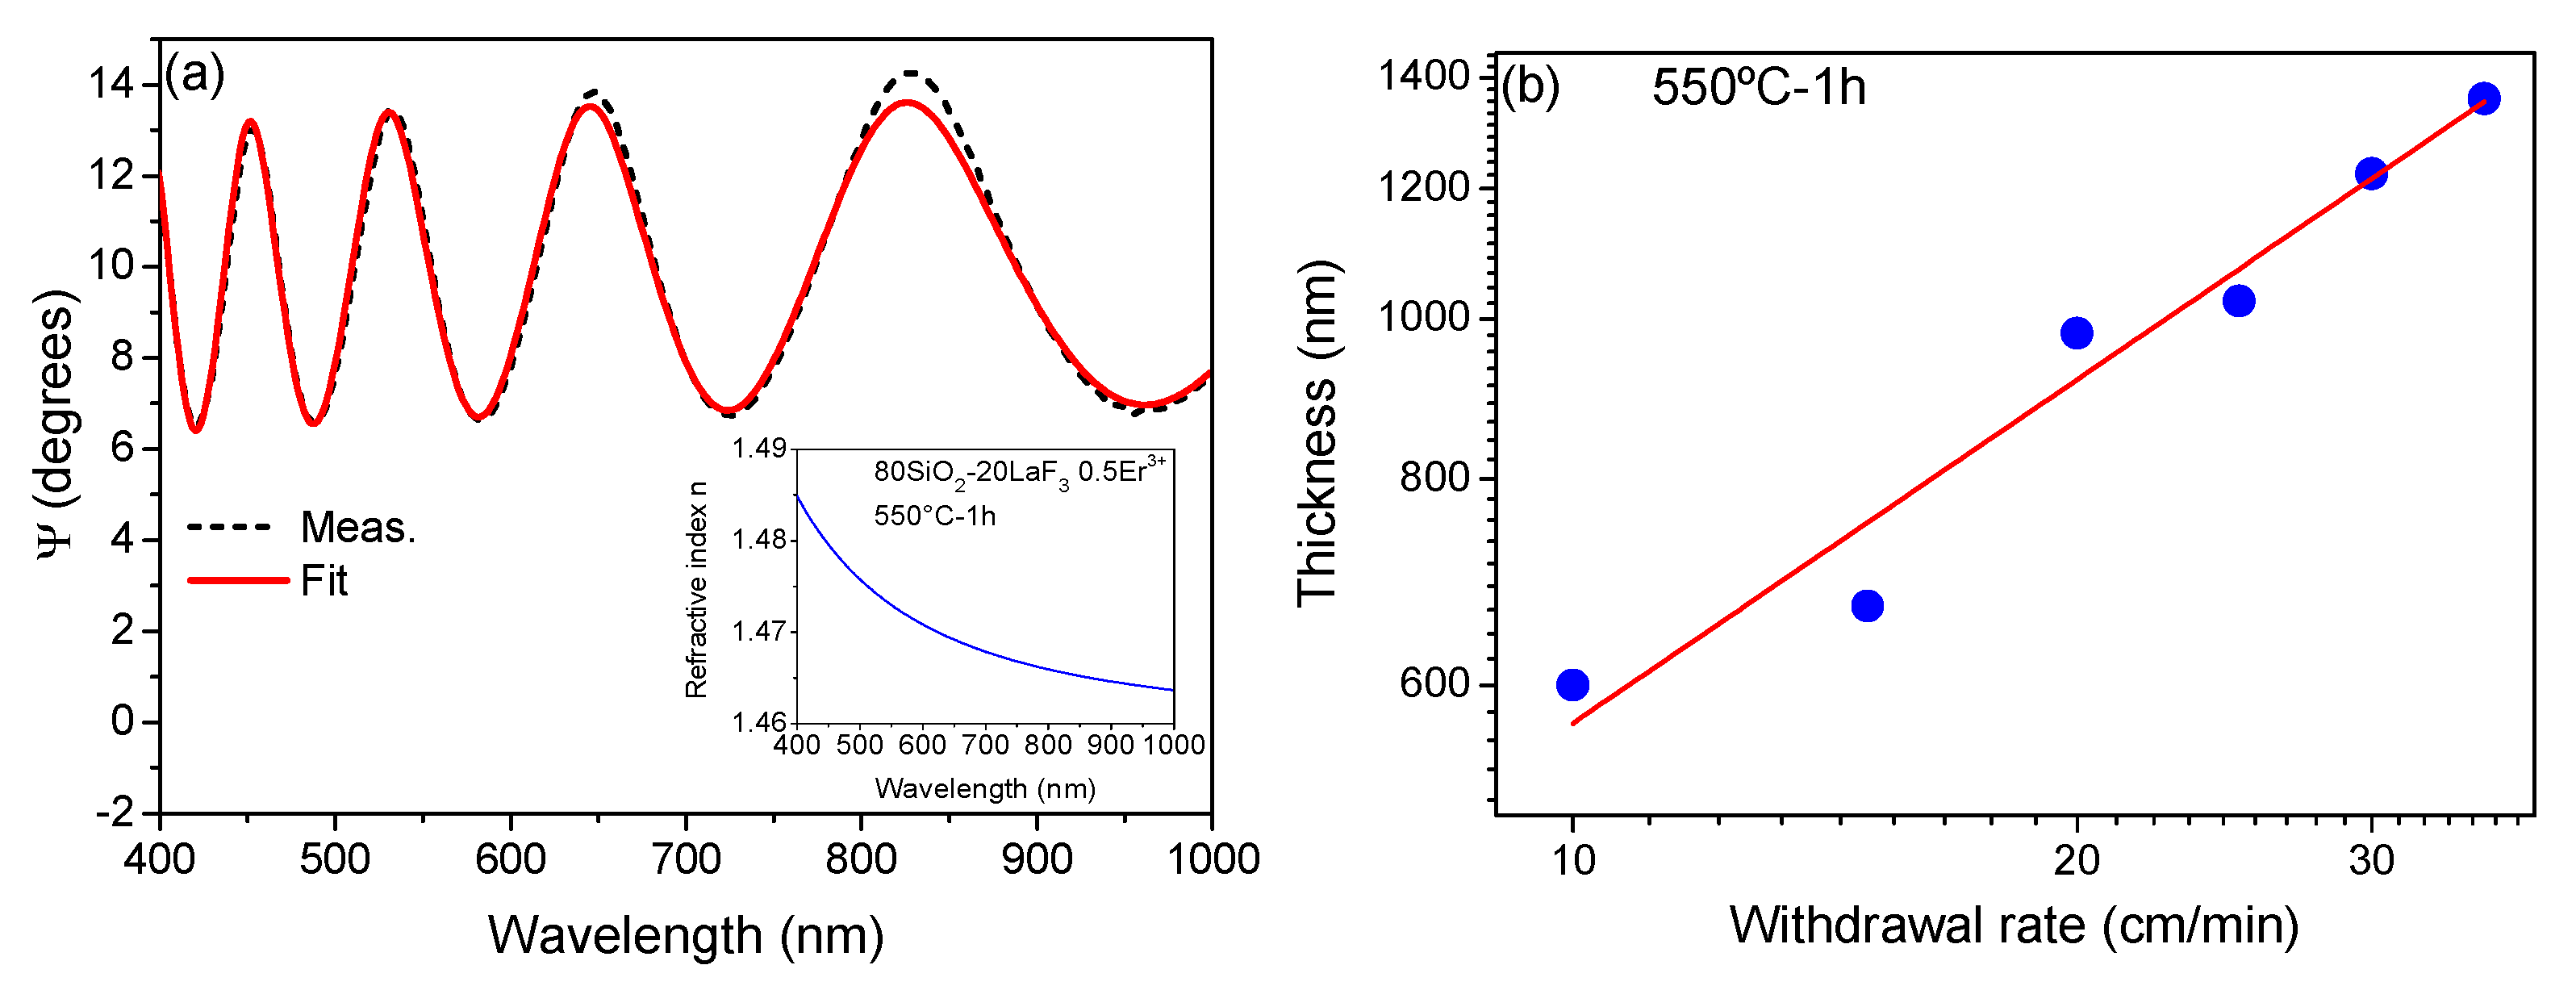
3.1. Self-supported Layers and Thin Films

Crack-free and homogeneous self-supported layers were obtained before and after heat treatment of the doped and undoped 80SiO2-20LaF3 samples at 550 °C for 1 min, Figure 1.
Homogeneous and transparent films with good adhesion were obtained for all the withdrawal rates used. The good agreement between measurement and fitted data, Figure 2a, demonstrated the good quality of the films. The inset of Figure 2a shows the variation of the refractive index as a function of the wavelength in the transparent region of the sample. The corresponding thickness varies almost linearly with the withdrawal rate, up to a thickness of ~1.4 µm in a single deposition and using a withdrawal rate of 35 cm/min, Figure 2b. The addition of MTES allows the thickness of films to be increased, compared to when only TEOS is used. In particular, according to [42], the TEOS/MTES ratio 0.4/0.6 produces the highest critical thickness. Moreover, the addition of MTES improves the mechanical strength of the self-supported layers. Such behavior is associated with the presence of CH3 groups which allow the porosity to be increased in the silica network reducing the stress [42]. The amount of OH groups is also reduced when MTES is added to TEOS because the surfaces become more hydrophobic [42,43].

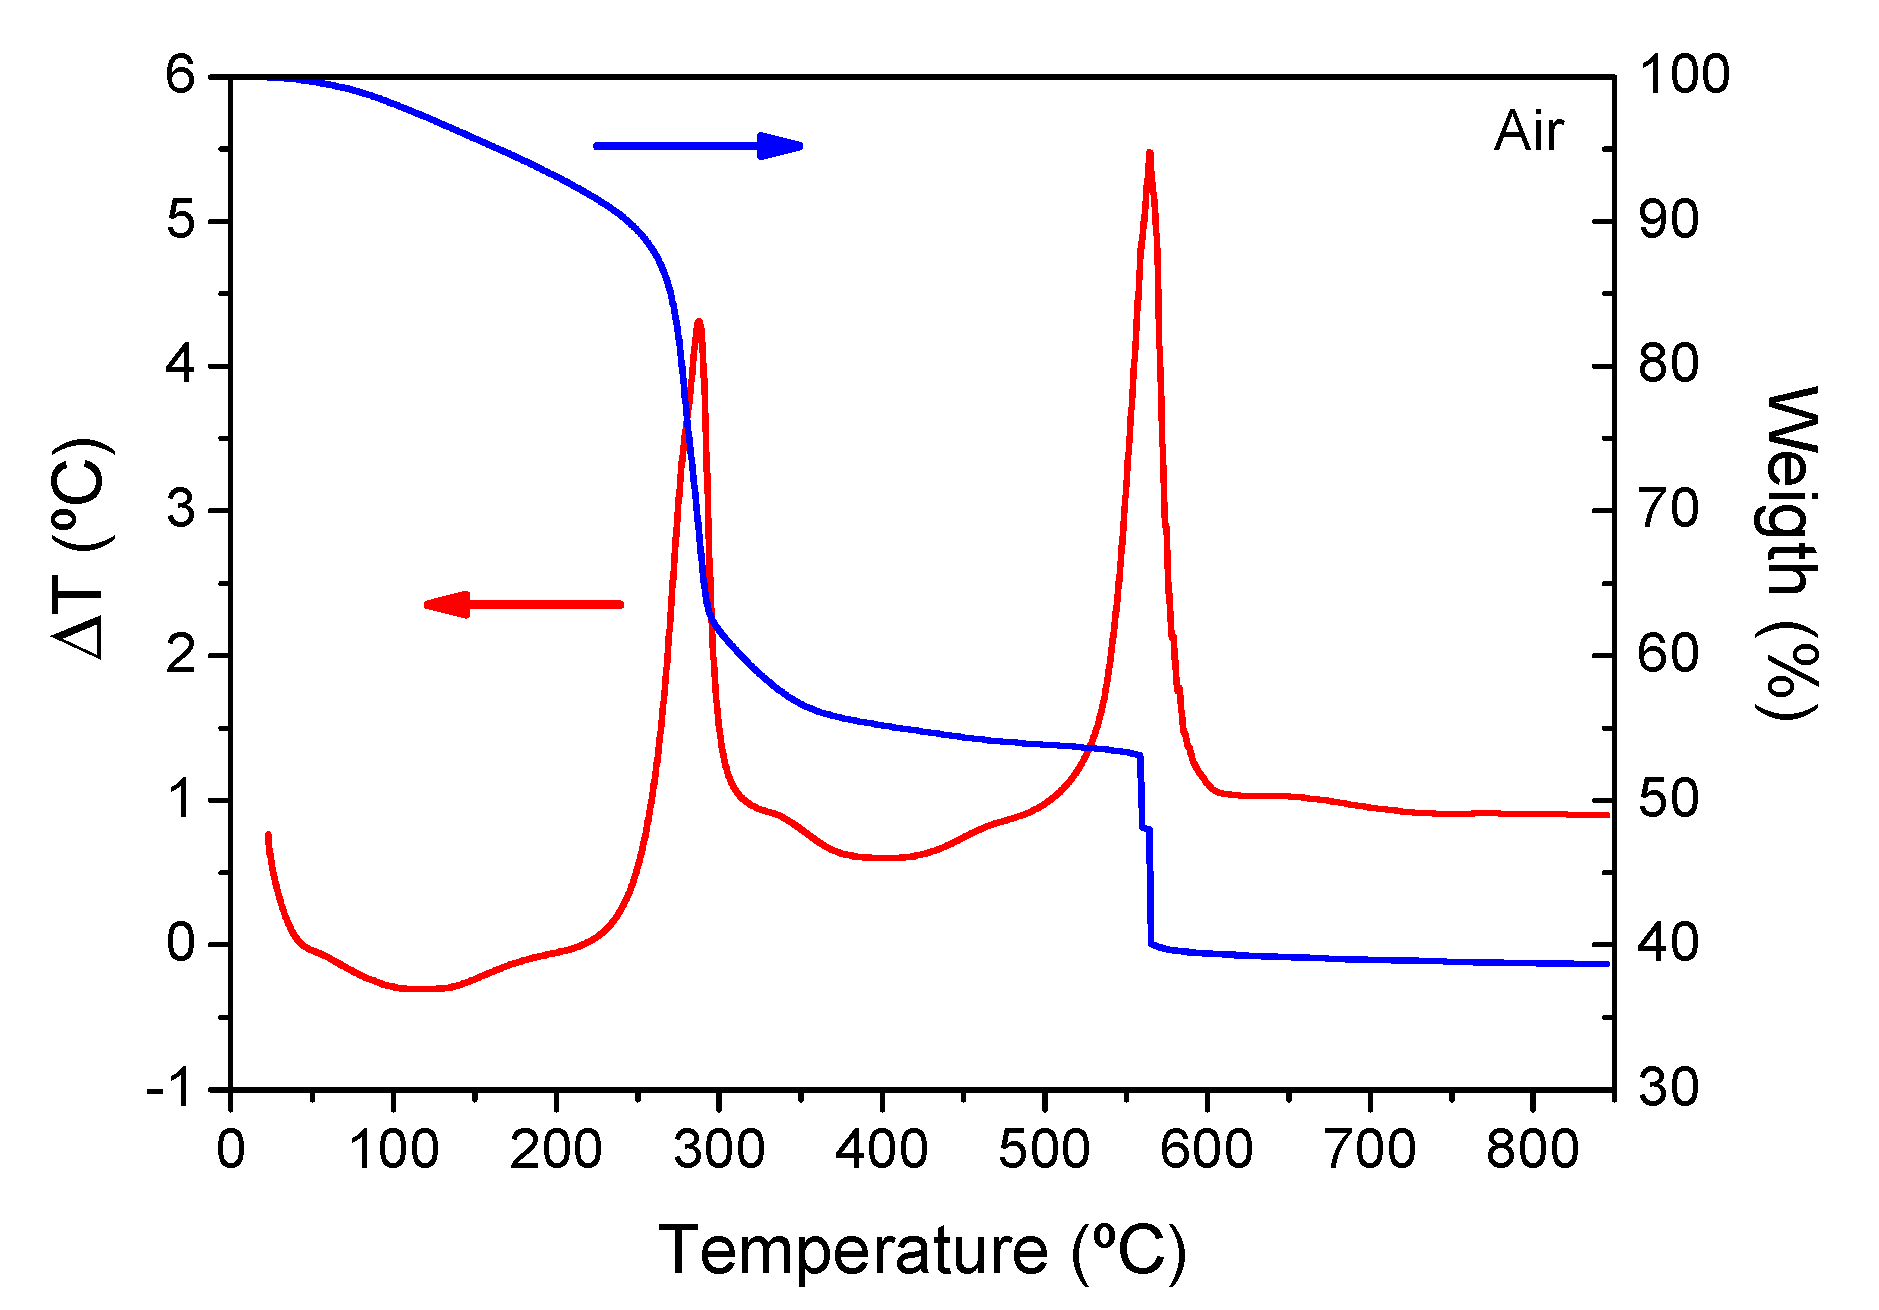
3.2. DTA and Crystallization

Figure 3 shows a DTA curve for self-supported layers measured in air with a heating rate of 10 °C/min. The endothermic process at ~100 °C corresponds to water and solvent removal. The first sharp exothermic peak at ~280 °C is associated with LaF3 crystallization and the corresponding mass loss (~30%) is due to decomposition reactions, as studied elsewhere [44]. The sharpness of the crystallization peak means that the process occurs very rapidly; in contrast, the LaF3 crystallization peak in the melted glasses is much broader and less intense [12]. Moreover, the Tg of these samples is higher than 1000 °C, as reported in a previous paper [44], and the crystallization of SG OxGCs occurs at much lower temperature than the Tg. The crystallization mechanism is, thus, clearly different with respect to that of MQ OxGCs [45,46,47,48,49]. The second exothermic process at ~575 °C, associated with oxidation of CH3 groups with a further mass loss of around 10%, does not appear in Ar atmosphere. Heat treatment at temperatures higher than that of CH3 elimination causes a sudden shrink of films and self-supported layers, leading to crack of the samples.

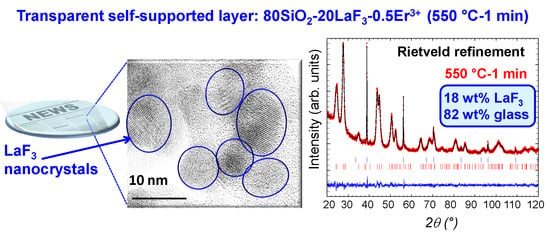
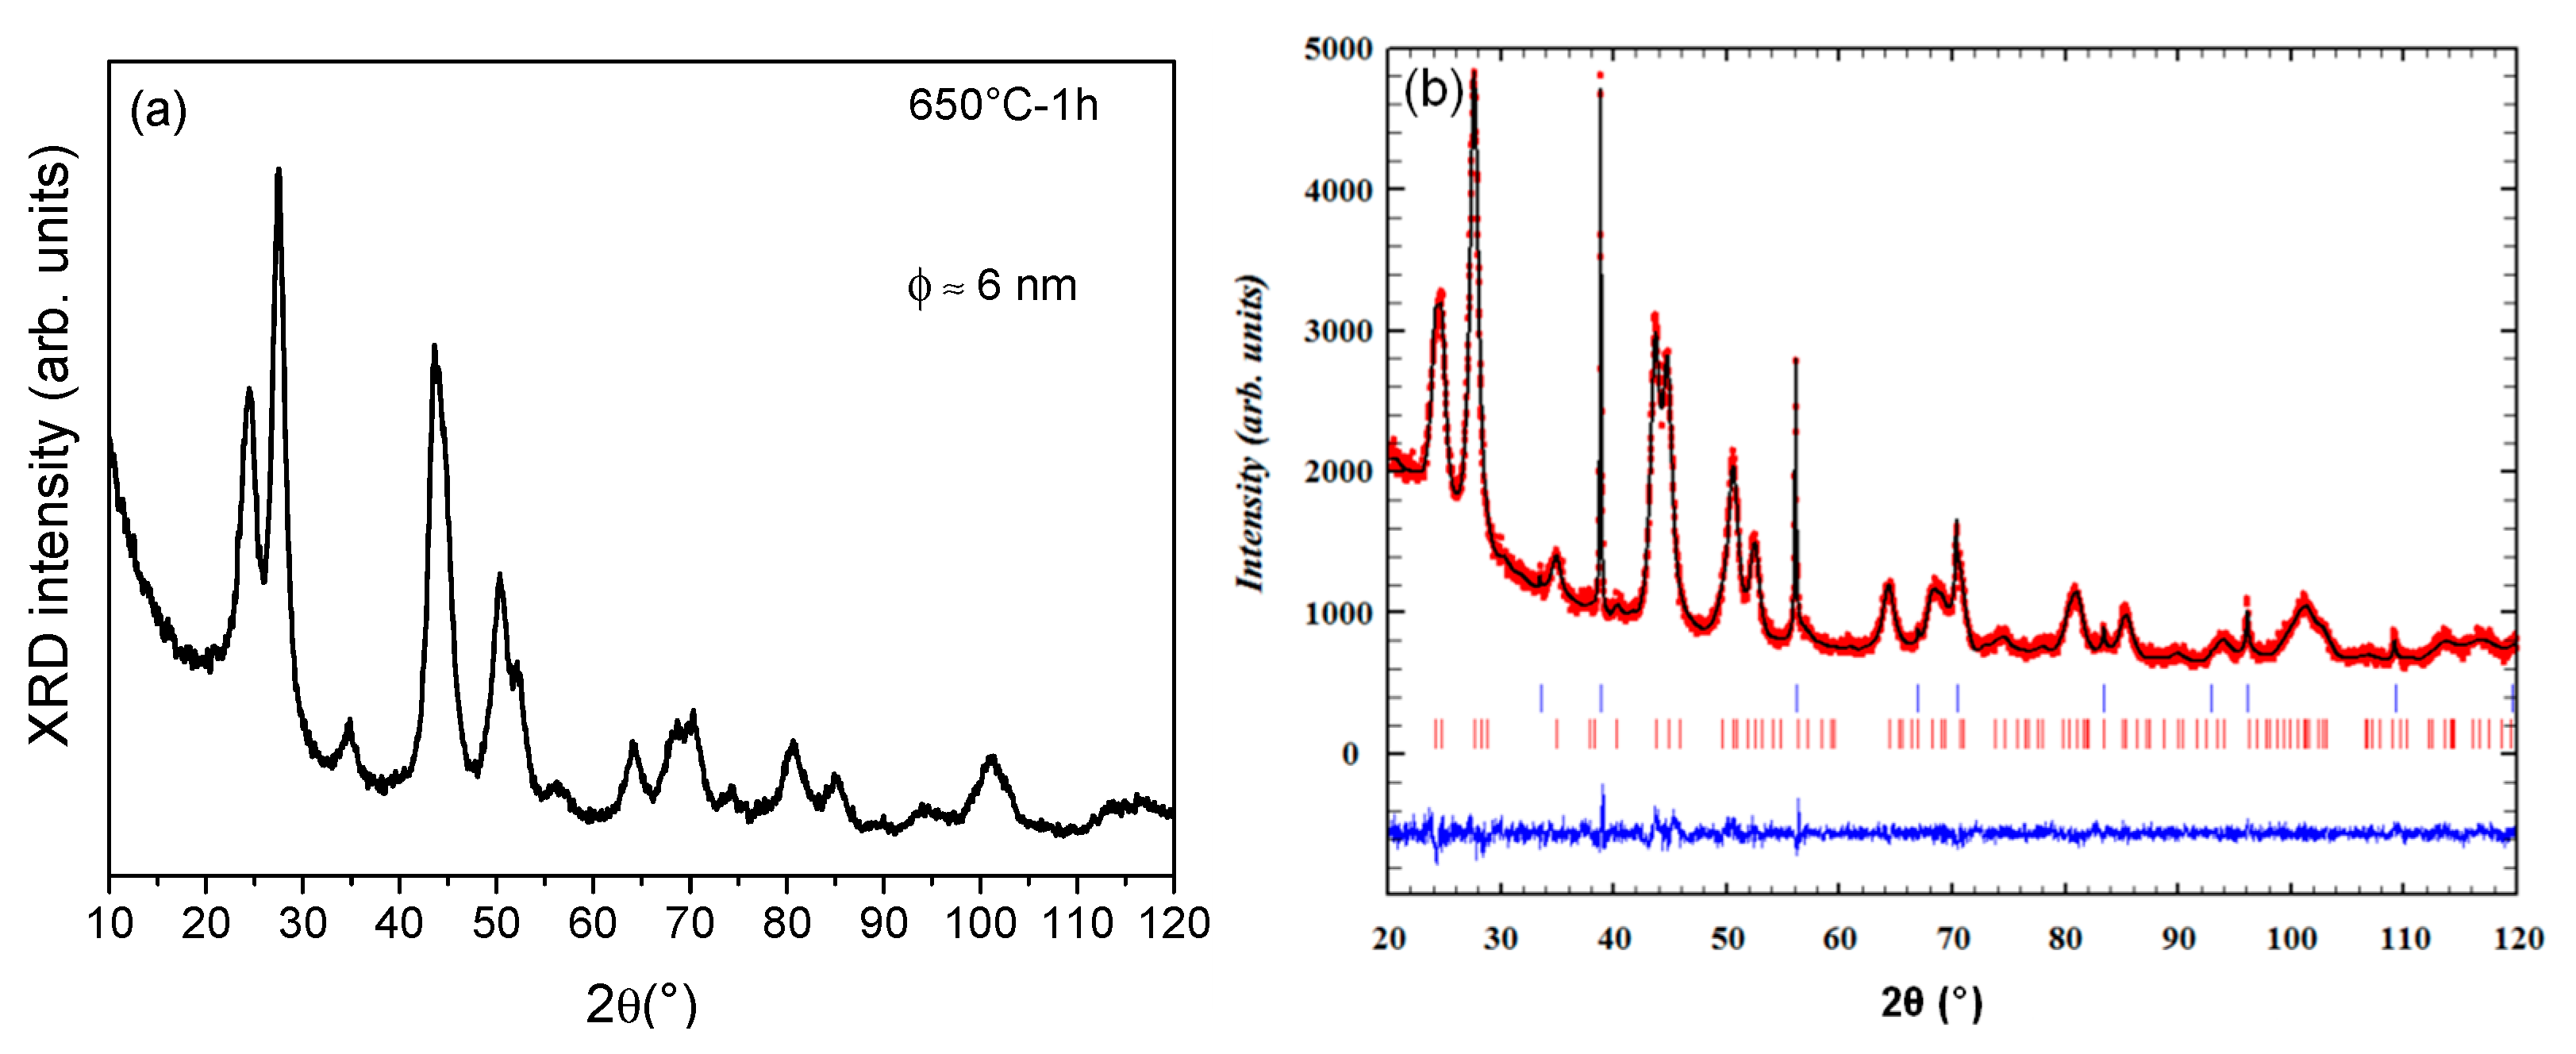
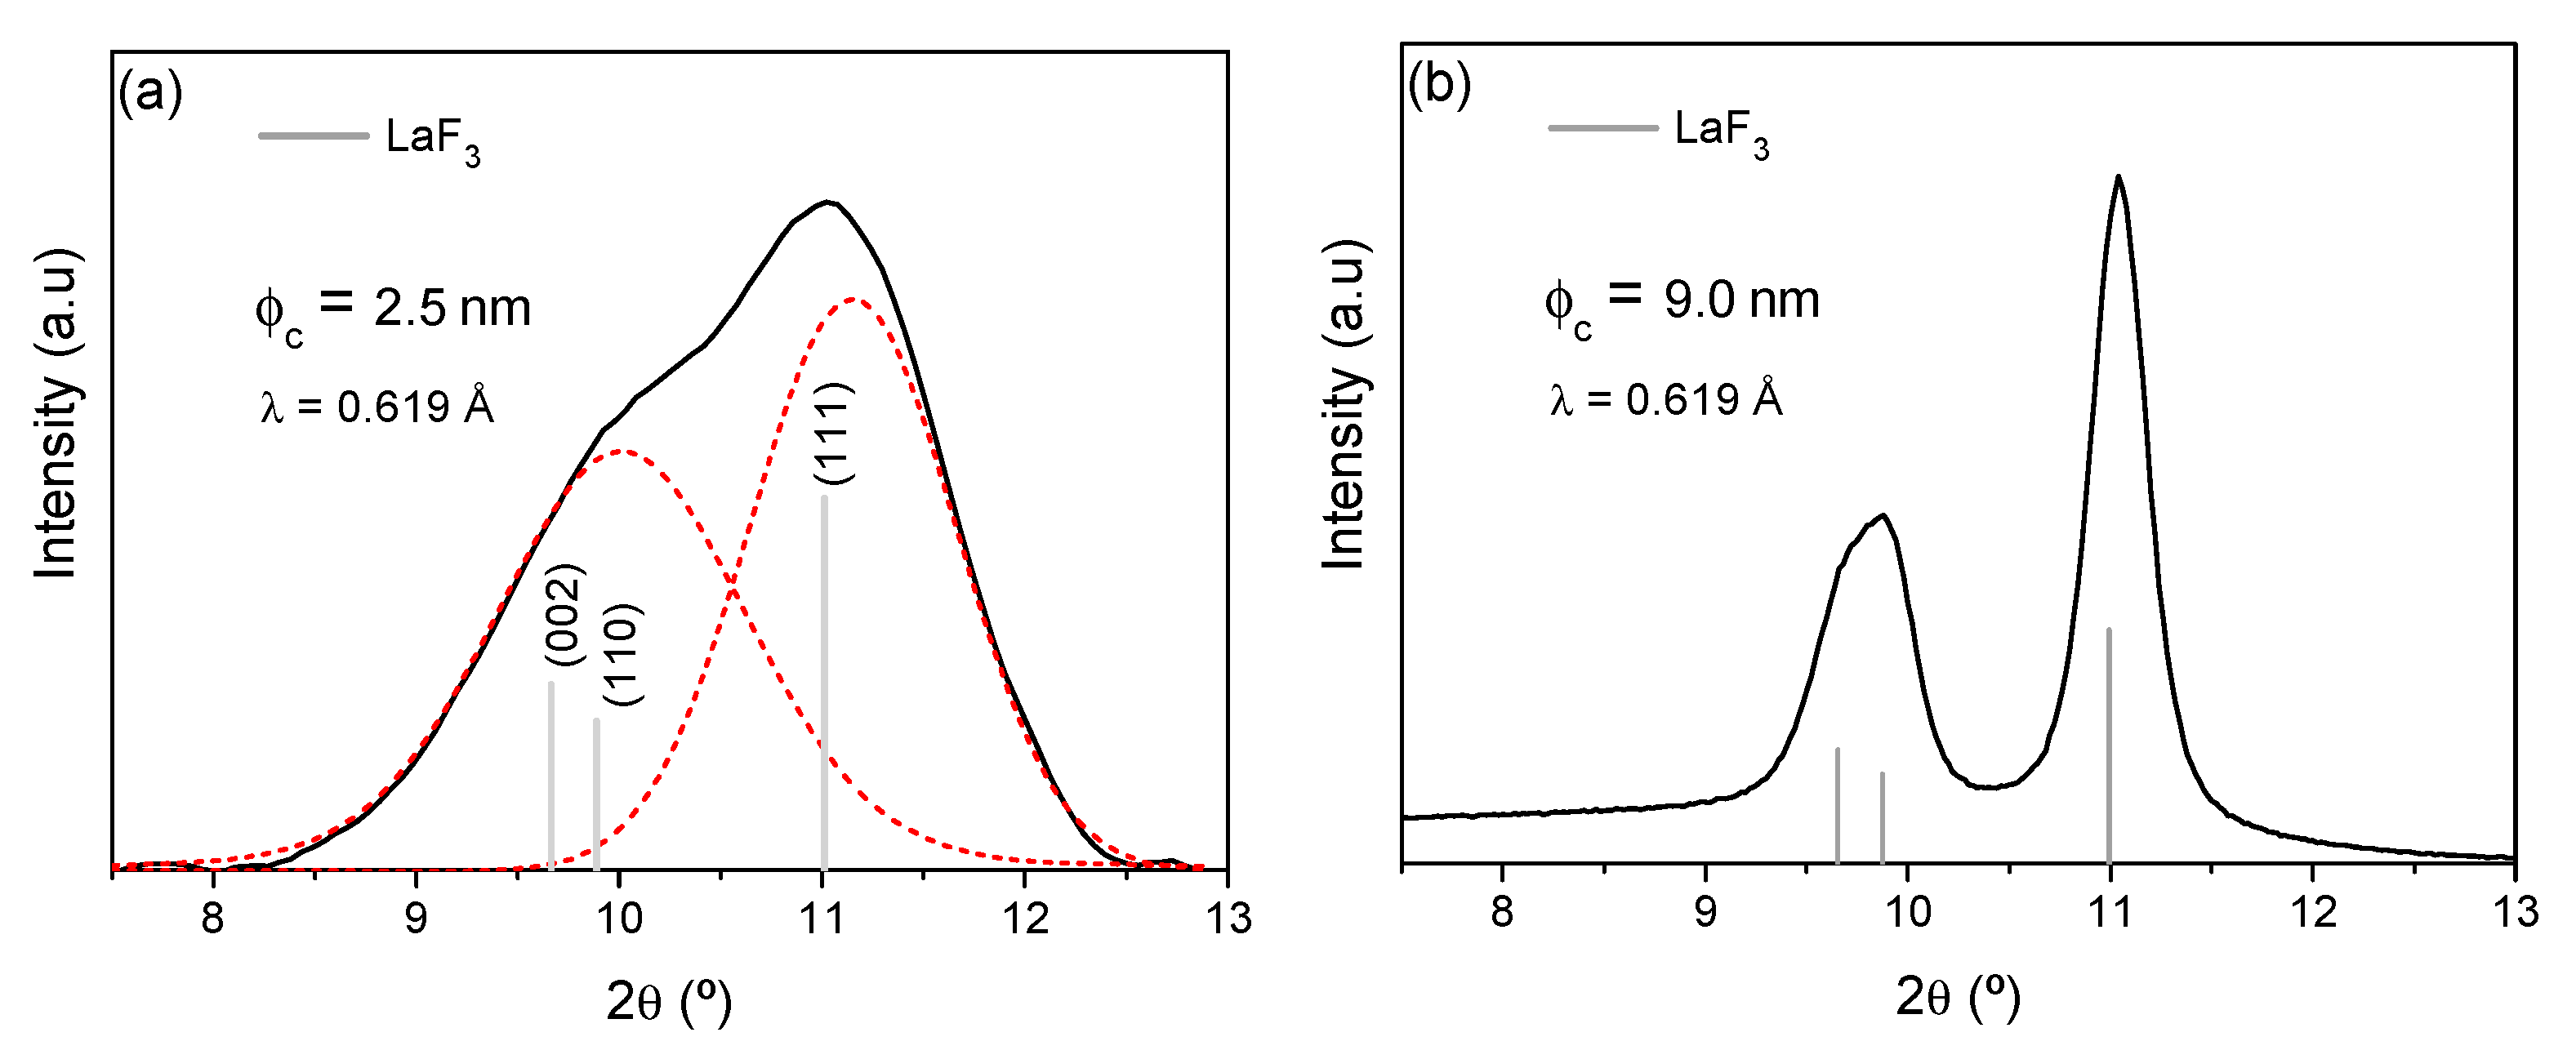
3.3. XRD, GI-XRD and Crystal Fraction

The XRD of 80SiO2-20LaF3-0.1Er3+ (TEOS) self-supported layer treated at 650 °C for 1 h is shown in Figure 4a. As can be seen, only LaF3 NCs, with a crystal size of 6 nm, are obtained. On the other hand, XRD patterns of 80SiO2-20LaF3-0.5Er3+ (TEOS-MTES) self-supported layer treated at 550 °C for 1 min exhibited well-defined peaks consistent with the crystallization of LaF3 (JCPDS 00-032-0483) with a crystallite size of 9.0 ± 0.5 nm, demonstrating that only 1 min is sufficient to crystallize the phase, Figure 4b. The difference of the crystal size with respect to the TEOS sample treated at 650 °C is associated with the higher heating rate (10 °C/min) used to crystallize the samples prepared with TEOS-MTES. The crystallization mechanism of similar GCs was extensively studied in previous papers [44,50], demonstrating how the decomposition reaction of lanthanide fluoroacetates leads to precipitation of NCs once the crystallization temperature is reached. The crystallization mechanism of these materials is, therefore, completely different from that of oxyfluoride glasses by MQ in which the crystal growth is a diffusion-controlled process. Chemical bonds between fluorine and the glass matrix were observed using 19F Nuclear Magnetic Resonance (NMR) [44]. Instead, for the xerogel samples, the fluorine environment is exactly the same as in the precursor TFA acid; almost all fluorine is then found in the form of LaF3 after the crystallization process [44]. Furthermore, it was demonstrated that an increase of treatment time does not increase the crystal size or the crystal fraction of bulk samples; in contrast, crystal dissolution is observed for very long heat treatment times. Such results are clearly inconsistent with a diffusion-controlled process.
Quantitative Rietveld refinement of the LaF3 crystalline fraction with NaF as the internal standard was carried out for 80SiO2-20LaF3 0.5Er3+ bulk GC treated at 550 °C for 1 min following the same procedure described in [49]. The observed diffraction pattern and the difference between observed and calculated diffraction patterns are shown in Figure 4b. Weight fractions (wt%) of 17.8% and 82.2% were determined for the LaF3 crystalline fraction and glassy phase, respectively. To our knowledge, this represents the highest crystal fraction reported in the literature for transparent OxGCs prepared by SG methods and it is the highest crystal fraction reported so far for LaF3-OxGCs prepared by both MQ and SG [38]. A small shift of the diffraction peaks towards higher 2θ was also observed for the Er3+-doped GC. This provides evidence of Er3+ incorporation, since the smaller Er3+ ions (1.17 Å) on the sites of the larger La3+ (1.31 Å) ion decrease the unit-cell volume (Table 1).
GI-XRD pattern of a thin film was obtained at the BM25B-SpLine beamline of the ESRF [39] and is shown in Figure 5a. The XRD of the bulk sample has also been acquired for comparison, Figure 5b. For the thin film, only a broad band, which could be deconvoluted into two peaks associated with LaF3 crystals (Figure 5a). In this case, the crystallite size was much smaller, ~2.5 ± 0.5 nm. The difference in crystallite size between bulk and film samples, is likely to be related to the synthesis and sintering conditions, since more diluted sols are necessary for film deposition with respect to bulk materials and during the sintering the coating densifies only by shrinkage normal to the substrate. Moreover, the fast evaporation of the solvent during the heat treatment may lead to the precipitation of such small NCs. This difference in crystal size between films and bulk-like materials has also been reported previously for similar systems, but a clear explanation is still necessary [52]. For comparison, Figure 5b shows the XRD of the bulk samples of the same composition treated under the same conditions.

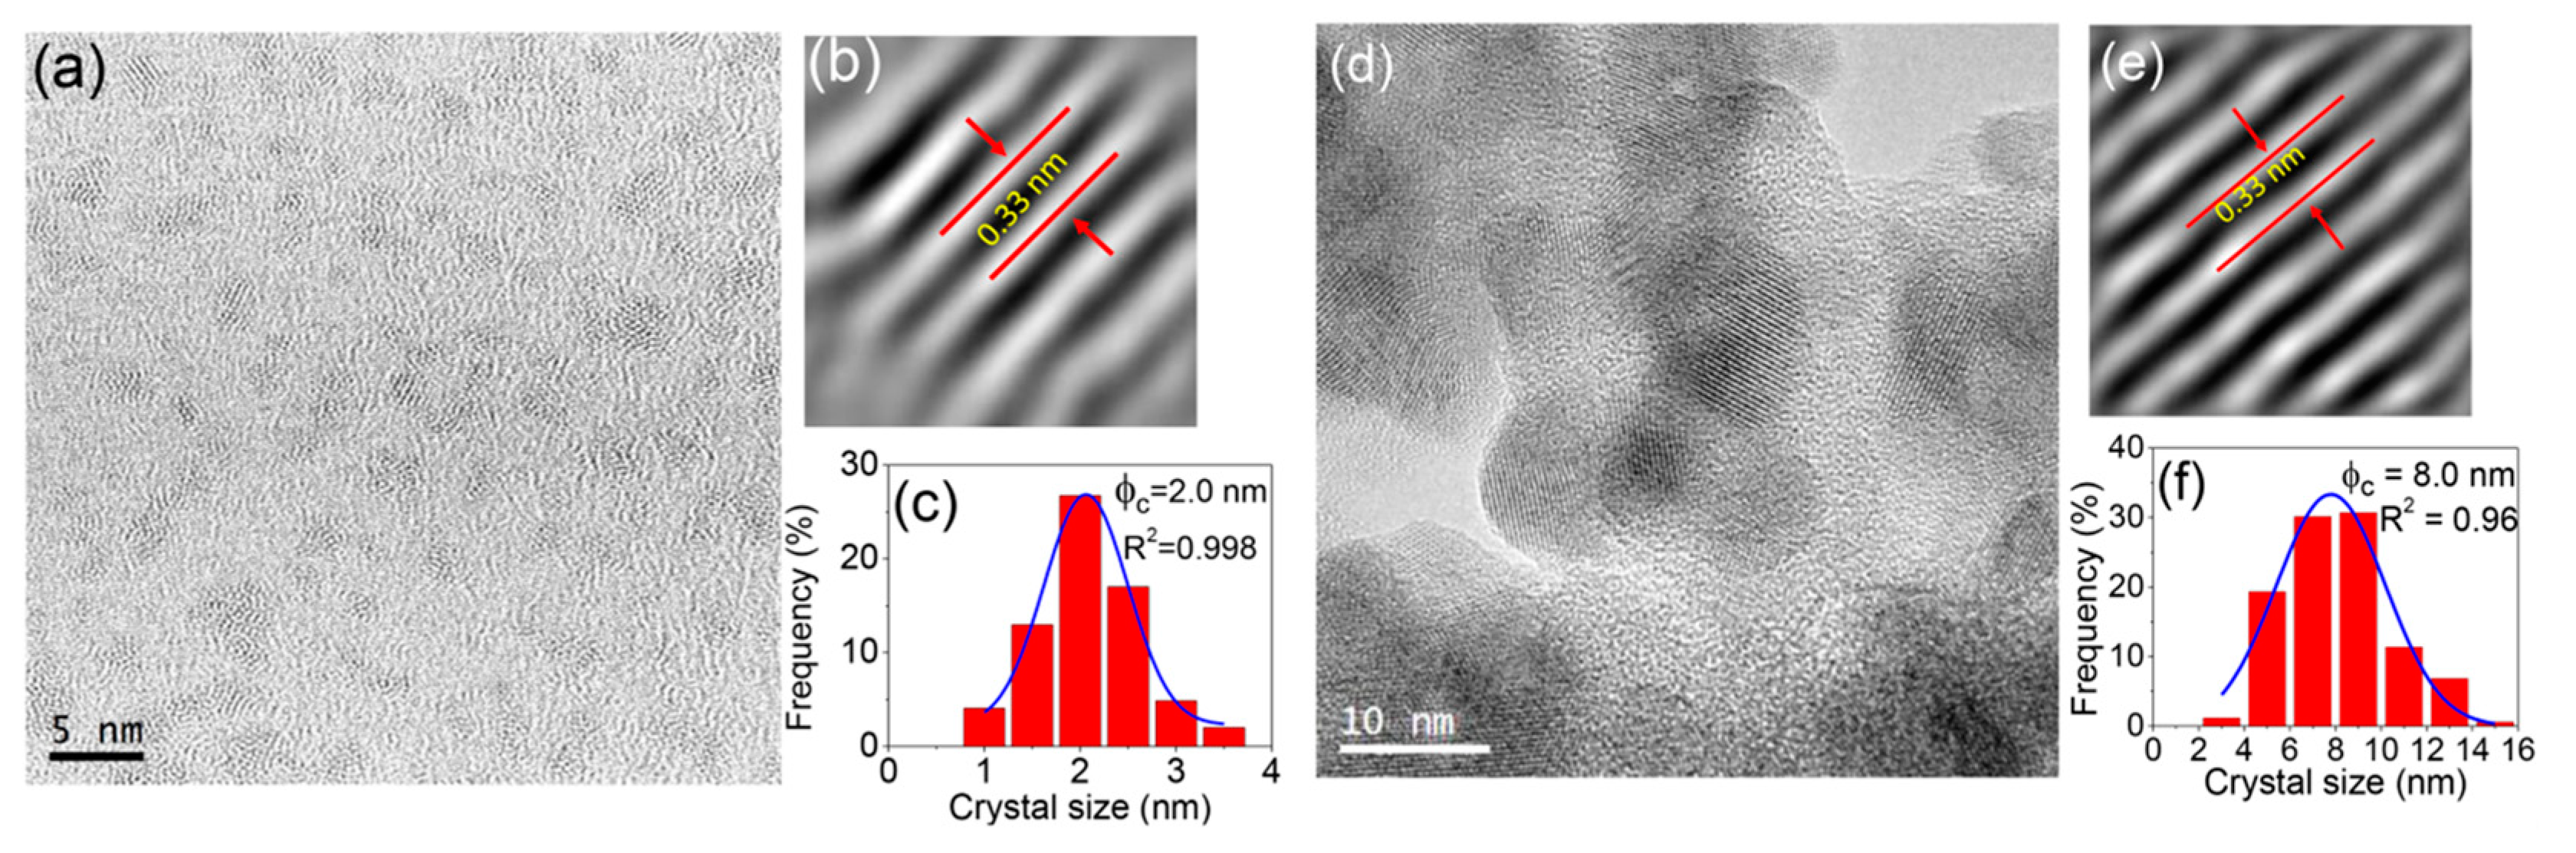
3.4. High Resolution Transmission Electron Microscopy (HRTEM) and Nanostructure Characterization

HRTEM was used to reveal the lattice planes and crystal-size distribution of LaF3 crystals in the thin films (Figure 6a–c) and self-supported layers (Figure 6d–f) treated at 550 °C for 1 min. Small crystals are homogeneously distributed in the glass matrix. The crystal size is around 2.0 ± 0.5 nm and 8.0 ± 0.5 nm for films and self-supported layers, respectively, in agreement with the GI-XRD and XRD results. A similar structure is observed in both samples, consisting of separated crystals surrounded by the residual SiO2 matrix. Fourier Transformation of the (111) crystal planes of the LaF3 Tysonite phase was employed to estimate an interplanar distance of 0.33 nm [53]. These results demonstrate the absence of clusters even for such short heat treatment times and further support the hypothesis that the crystallization mechanism involves chemical decomposition followed by crystal precipitation.

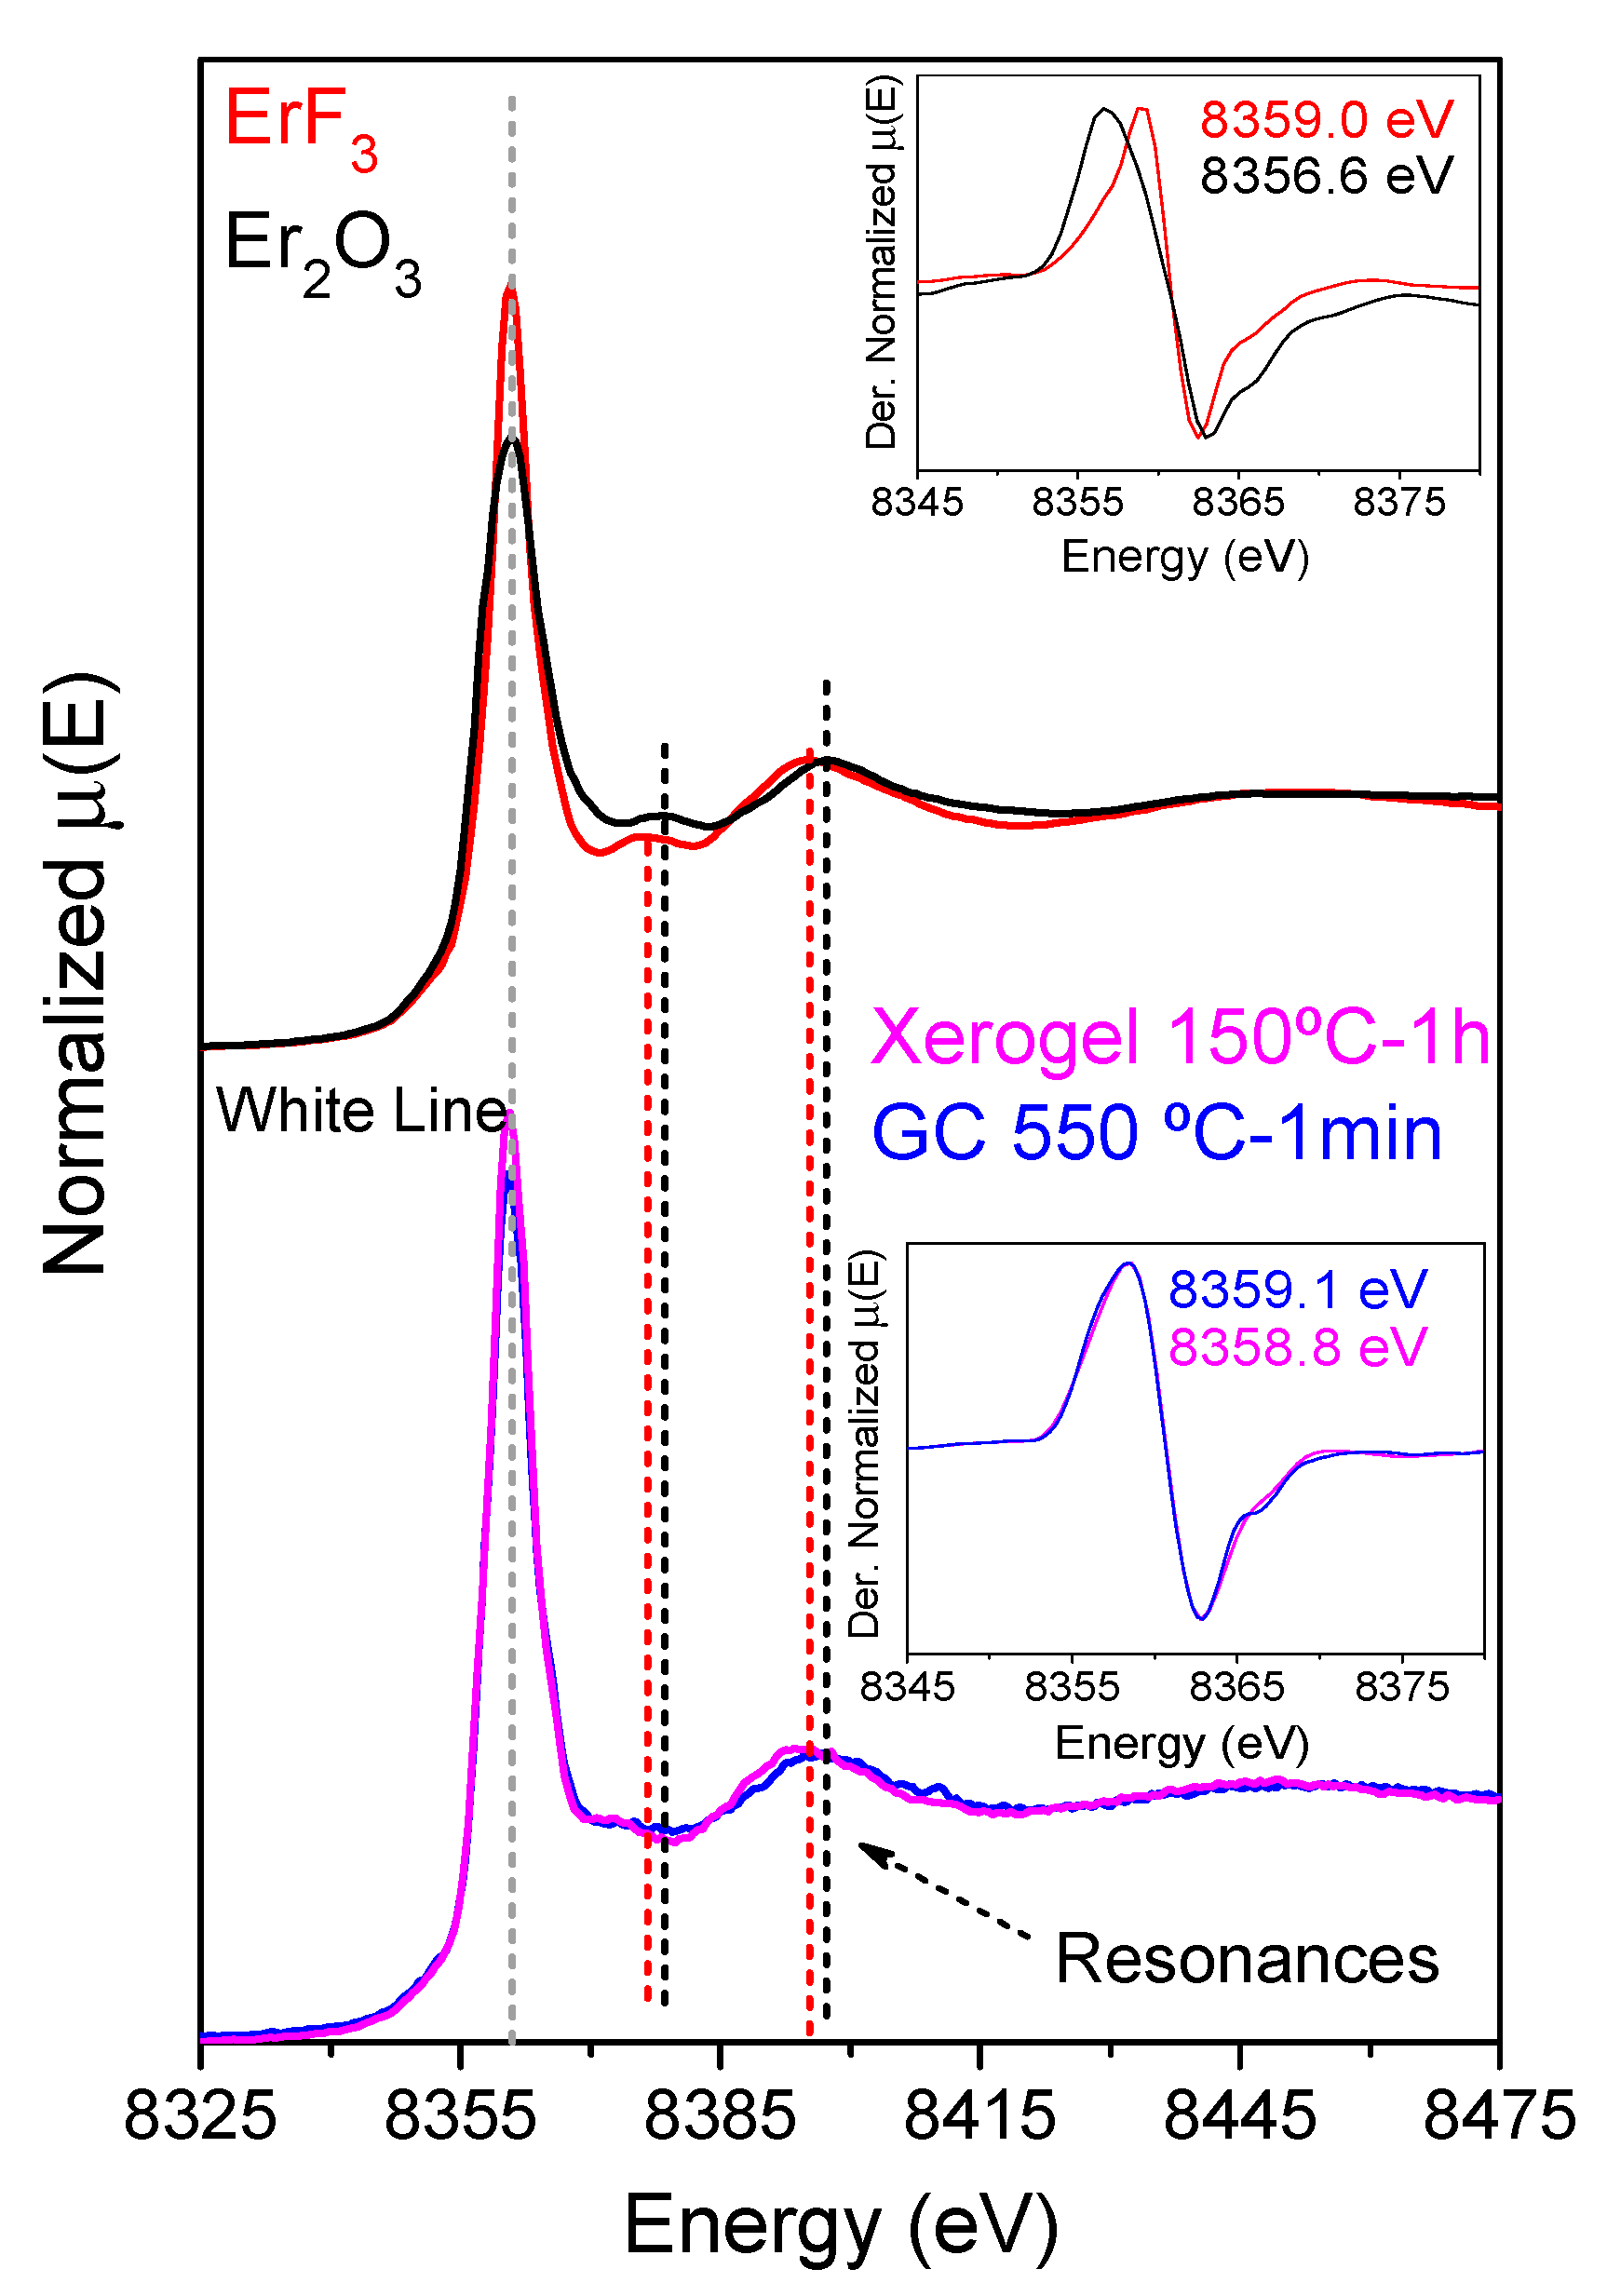
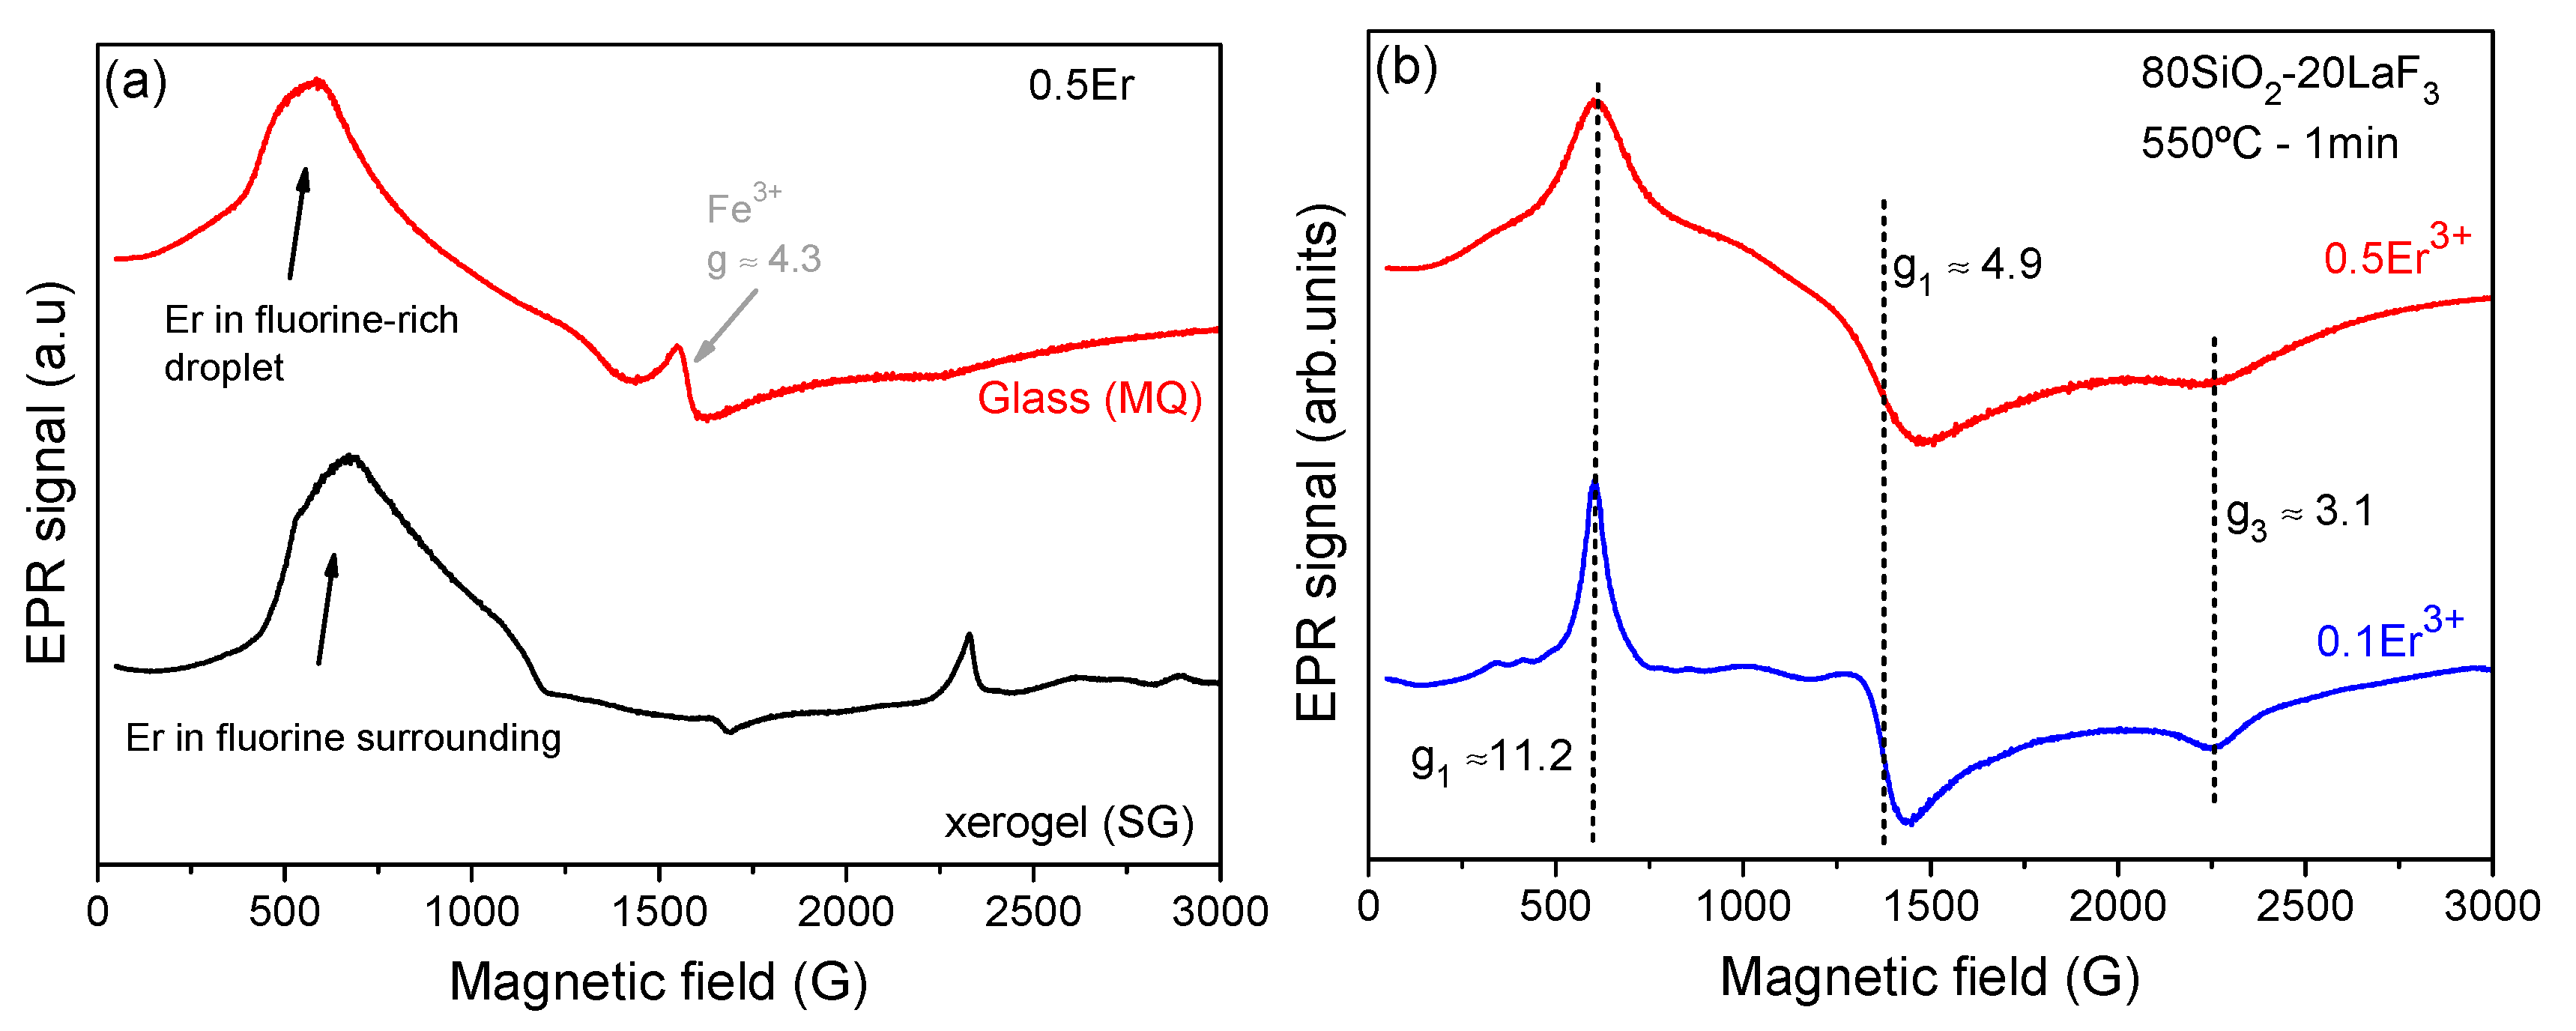
3.5. XAS, EPR and RE Environment

A crucial aspect of RE-doped OxGCs concerns the distribution of dopants and the mechanism of incorporation into the fluoride NCs. In fact, RE ions are much more efficient when are embedded in low-phonon-energy fluoride crystals. Evidence of RE incorporation is often obtained by optical spectroscopy but sometimes only indirectly, unless specific selective excitation measurements are carried out. Here, the RE-ion environment and its role in transforming the xerogel to the GCs have been studied in detail using the local structural techniques XAS and EPR.
XAS measurements of Er2O3 and ErF3 were used as a reference and compared to the results of thin films doped with 0.5Er3+, Figure 7. The presence of Er3+ is clearly indicated by the absorption edge centered around 8370 eV. However, small shifts of the edge are produced by different ligand fields. In general, for the same RE ion, the edge energy increases passing from oxides to fluorides, due to lesser hybridization of the chemical bonds in fluoride compounds attributable to a higher field strength [54,55,56]. In this case, the edge was obtained by the first derivative of the absorption spectrum and the edge shifts from 8356.6 to 8359 eV passing from Er2O3 to ErF3. More insights are obtained by a comparison of the post-edge region that contains information about the local structure. In particular, the X-Ray Absorption Near Edge Structure (XANES), shown in Figure 7 as red and black spectra, for ErF3 and Er2O3, respectively, show slight differences at the white line and at resonances of ~8375 and 8395 eV. The XANES spectra and derivative of the xerogel and OxGC thin film (bottom inset of Figure 7) exhibit an absorption edge centered at ~8359 eV, similar to pure ErF3. Hence, a fluorine-rich environment is already observed in the xerogel. Nevertheless, differences in the XANES region (8370–8415 eV) are observed compared to ErF3, which may indicate a change in the Er3+ environment for the xerogel and the OxGC samples. Fourier-Transform calculations indicate a narrowing of the first shell as the xerogel transforms to the OxGC, which is consistent with the development of a higher symmetry environment corresponding to the fluoride crystalline phase.
A linear combination of XANES spectra in the range 8325–8475 eV was performed for the OxGC sample using the standard ErF3 and Er2O3 materials. Employing the crystal fraction of LaF3 calculated by Rietveld refinement, approximate fractions of 91% and 9% were calculated for Er3+ in ErF3 and Er2O3-like environments, respectively. Thus, the Er3+ ions are likely to be situated near fluoride ions in the xerogel state, precipitating in fluoride-rich crystals after the heat treatment at 550 °C for 1 min. These results are explained considering that, in the starting sol, the La3+ and Er3+ ions are surrounded by TFA cations that are screened and impeded from bonding with Si atoms. Hence, in the xerogel sample, fluorine is still coordinated as in TFA acid [44] and Er3+ ions are principally coordinated by fluorine. During the heat treatment, decomposition promotes the precipitation of LaF3 crystals in which Er3+ ions become trapped. Other techniques, such as Energy Dispersive X-Ray Spectroscopy (EDXS), demonstrated an Eu enrichment in GdF3 NCs after just 1 min of treatment at 550 °C [50], further supporting the aforementioned conclusions.
Once the crystal fraction is obtained, an indication of the concentration of RE ions in LaF3 crystals may be obtained. Supposing that 91% of Er3+ ions are embedded in the crystal phase and that the crystalline fraction is ~18 wt% (XRD), the effective concentration of Er3+ ions in the crystal phase is around 6.5 mol%, representing an order of magnitude increase with respect to the nominal concentration (0.5 mol%). Similar values were obtained in previous studies of samples prepared by MQ, albeit with a lower fraction of RE ions incorporated in the crystal phase [57].
Further evidence supporting the mechanism for the incorporation RE ions is obtained by EPR of the self-supported layers. Figure 8 shows the EPR spectra of xerogel samples doped with 0.5 Er3+ (mol%) measured at 5 K. The EPR signal of a glass, prepared by MQ, containing 0.5 Er3+ in an amorphous fluorine-rich environment is also shown for comparison. Several resonances are observed for the xerogel samples, due to the presence of organic compounds which remain after heat treatment at 50 °C. Er3+ resonances are associated with the broad signals appearing in the range 500–1000 G. Other authors reported EPR measurements of Er3+ in oxyfluoride glasses showing the presence of broad signals at low magnetic fields (high g values) [58]. Moreover, such resonances disappear at room temperature (RT) and are only visible below 20 K, indicating that they are associated with Er3+ ions. Such broad signals are clearly related to an amorphous environment typical of glasses and liquids. The EPR signal of an oxyfluoride glass doped with 0.5 Er3+ prepared by MQ is also shown for comparison. The signal around 2300 G, observed only in the xerogel, is attributed to the presence of organic compounds. Interesting results are obtained for the GC samples, which display resonances associated with paramagnetic species with effective spin S’ = 1/2 in rhombic or lower symmetry after just 1 min of heat treatment; the resonances appear at g values of g1 = 11.2; g2 = 4.9 and g3 = 3.1. On comparison with the EPR results obtained for an Er3+-doped LaF3 single crystal [59,60], it can be unambiguously concluded that the resonances in the GC samples are those of Er3+ in LaF3 NCs. Broader signals are observed for the GC doped with 0.5 Er3+ and associated with stronger relaxation processes, due to a moderately high effective concentration.
For the composition with a lower concentration of dopant, the hyperfine structure is only partially resolved, due to the interaction of the electrons with nuclear spins. The low intensity of the hyperfine structure is due to the quantity of Er isotope nuclei with I = 7/2 (~23%), while the remaining nuclei (77%) with I = 0 do not produce any hyperfine interaction [58,61,62]. For the composition doped with 0.5 Er3+, the hyperfine structure is too broad to be resolved but its presence may be discerned from the shape of the resonance at g1 = 11.2 which presents broader sidebands. Another interesting result is the absence of any further Er3+ resonance other than that of Er3+ in the LaF3 NCs.
These results, together with the previous discussion of XAS measurements, indicate that dopant incorporation occurs with crystal precipitation. In contrast, in melted glasses, residual contributions of RE ions in an amorphous environment are still observed even after the crystallization process, confirming that some RE ions remain in the glass matrix or in phase-separation droplets.

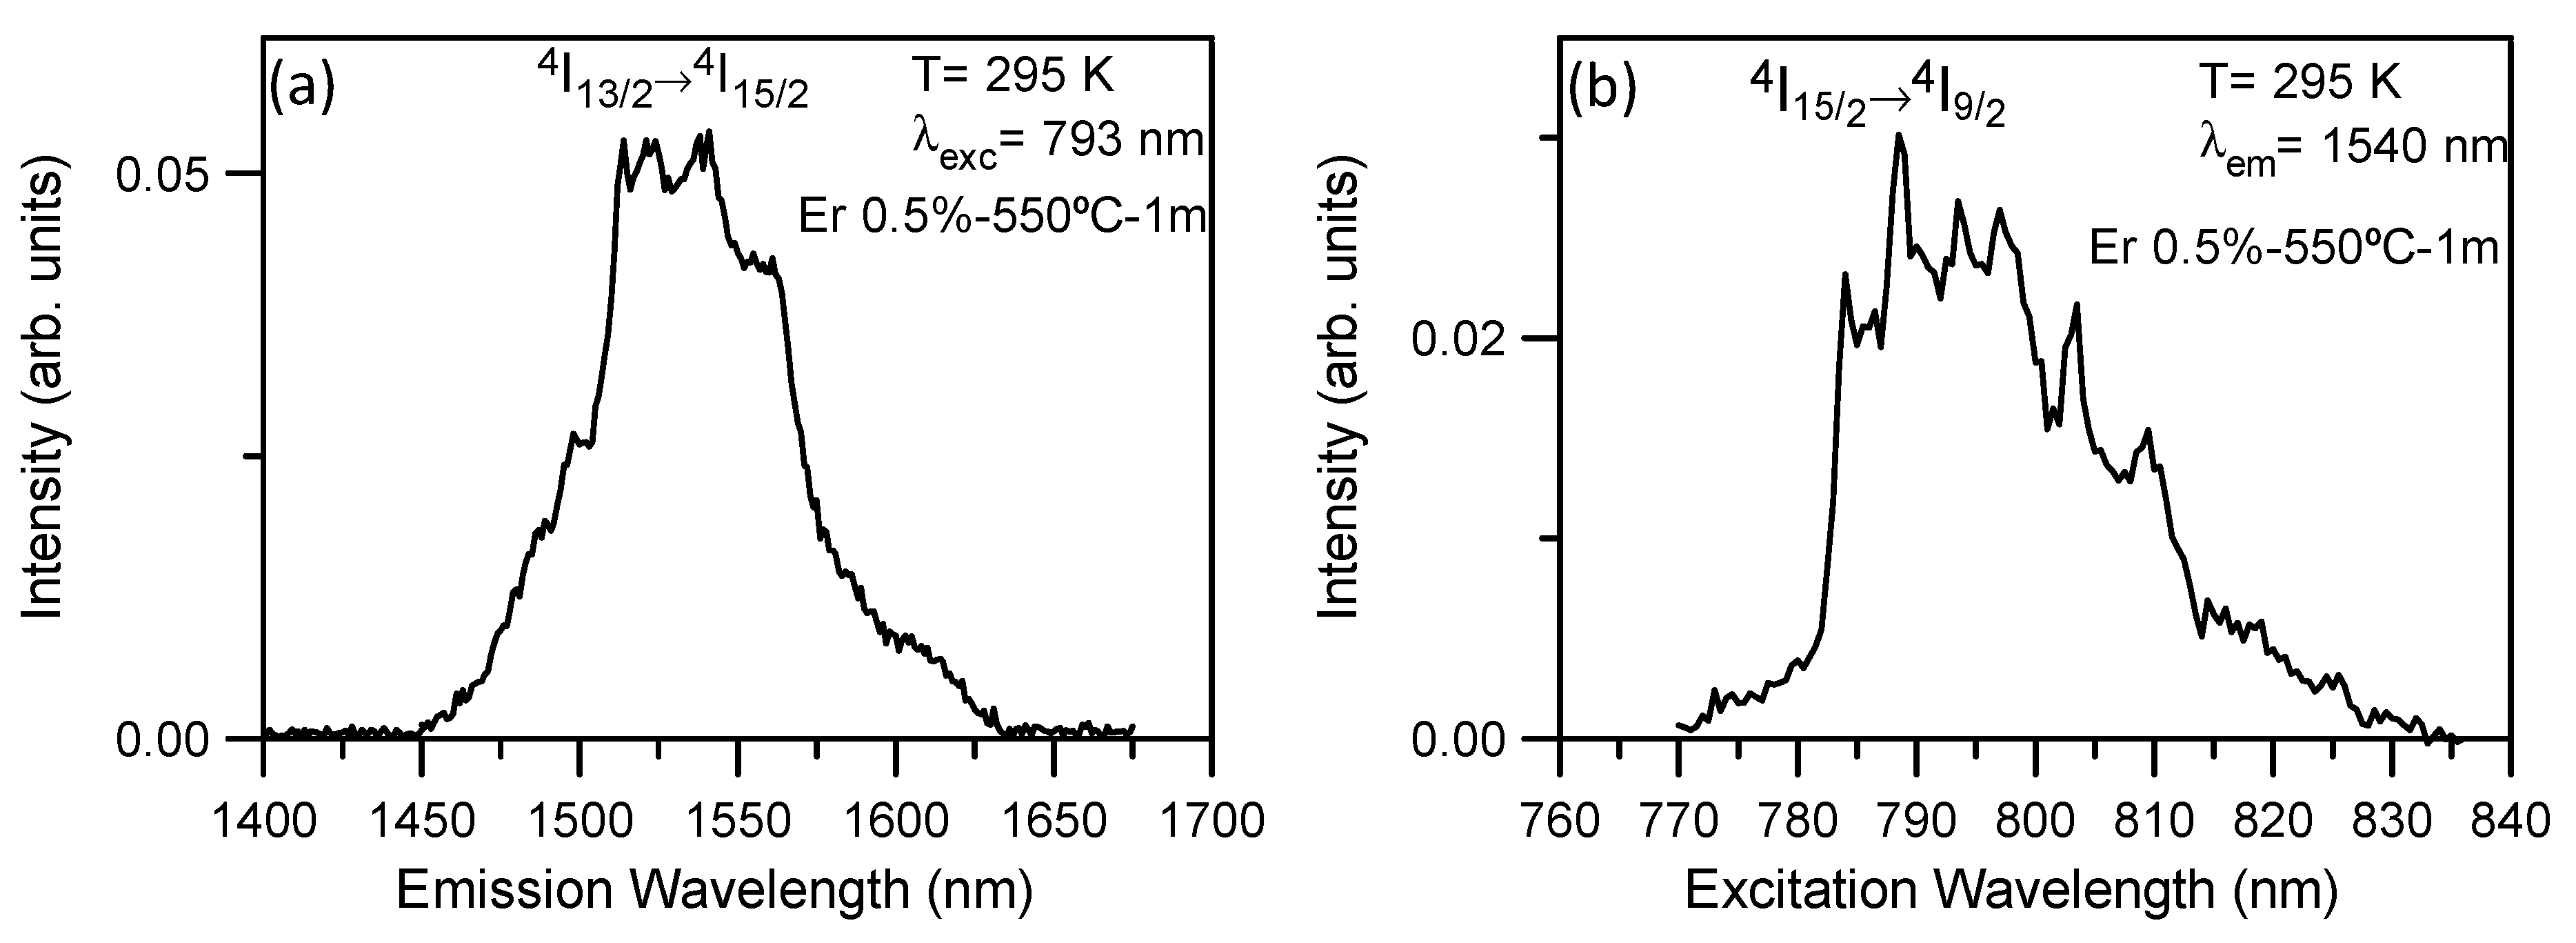
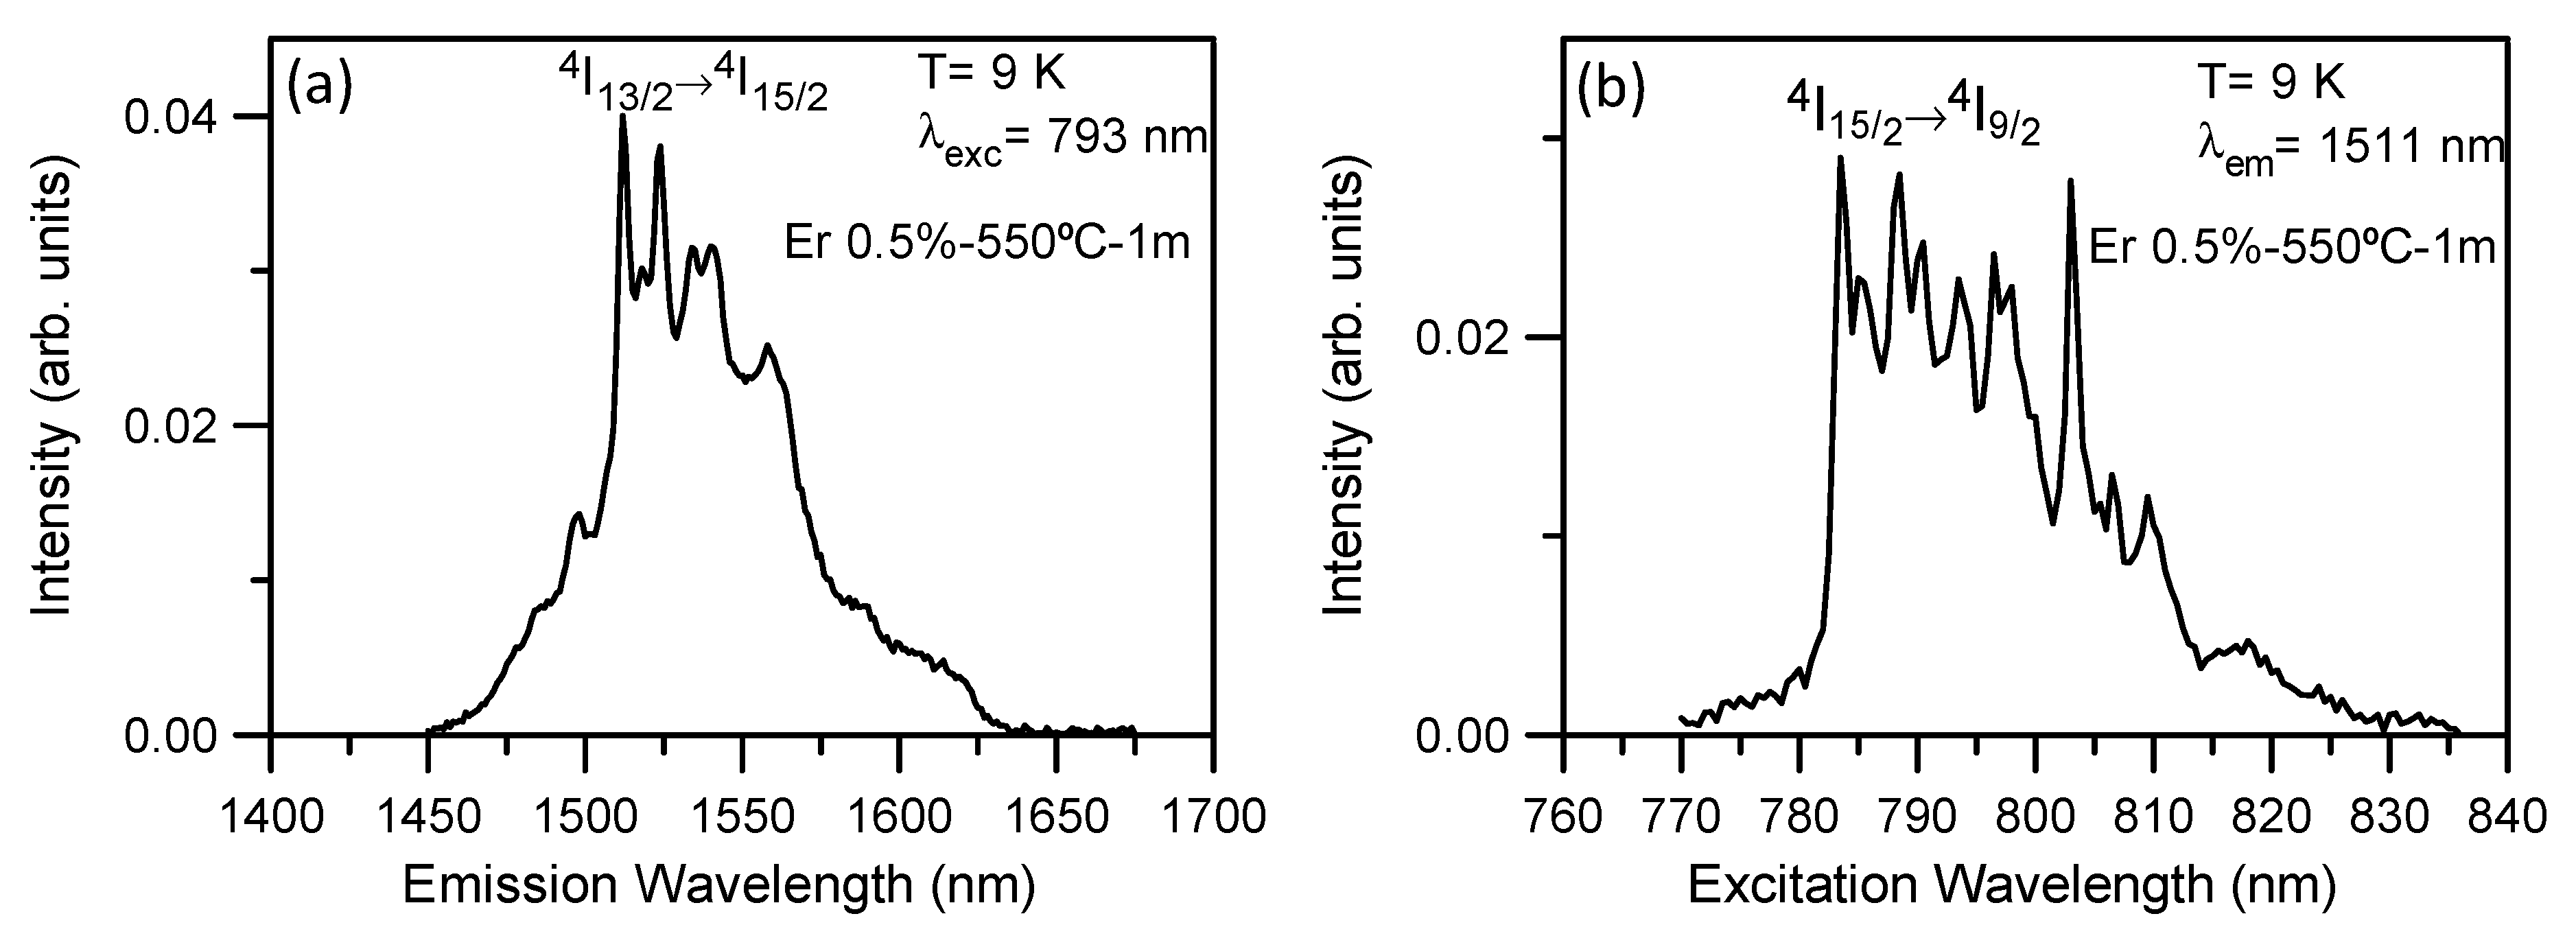
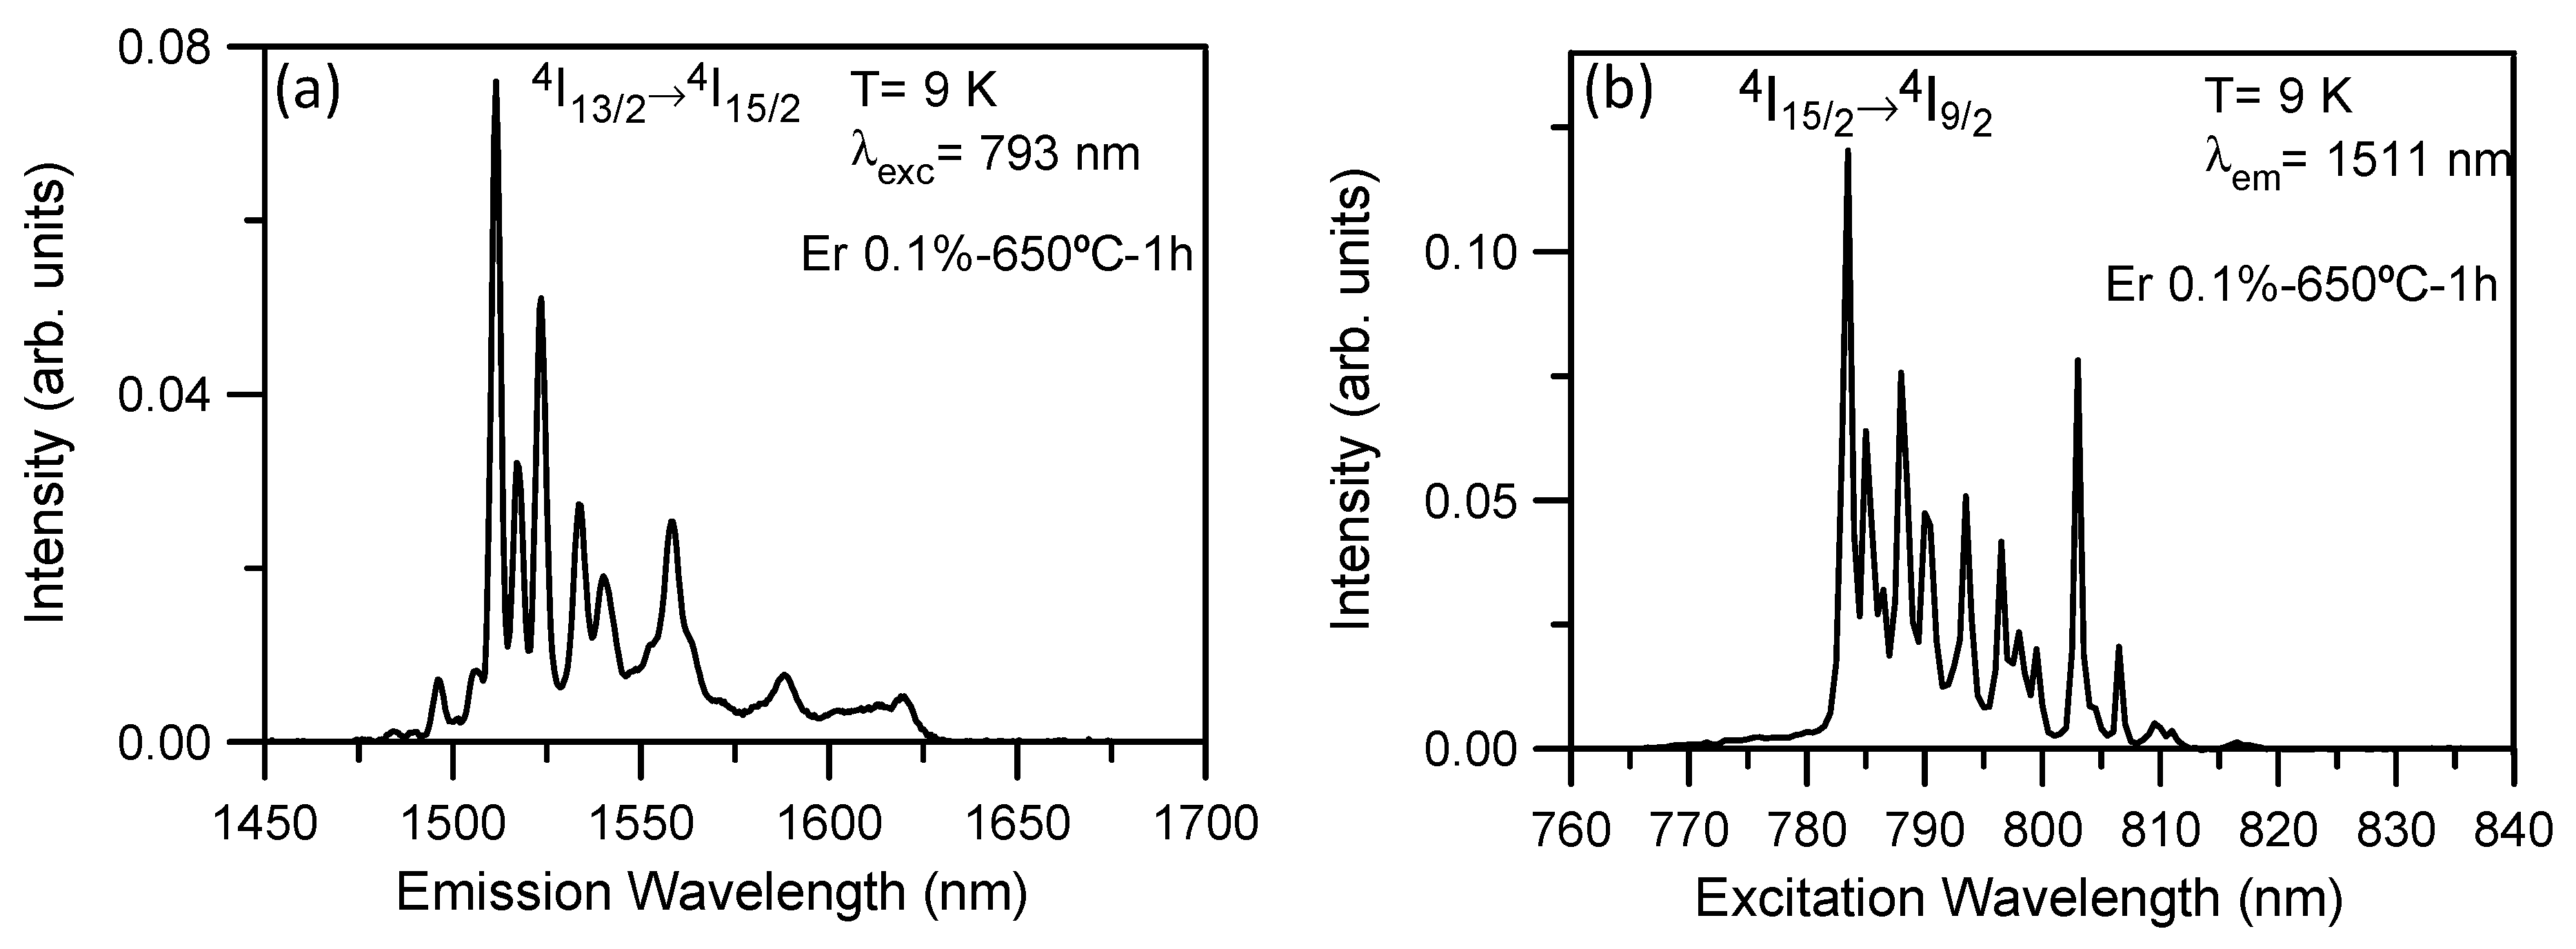
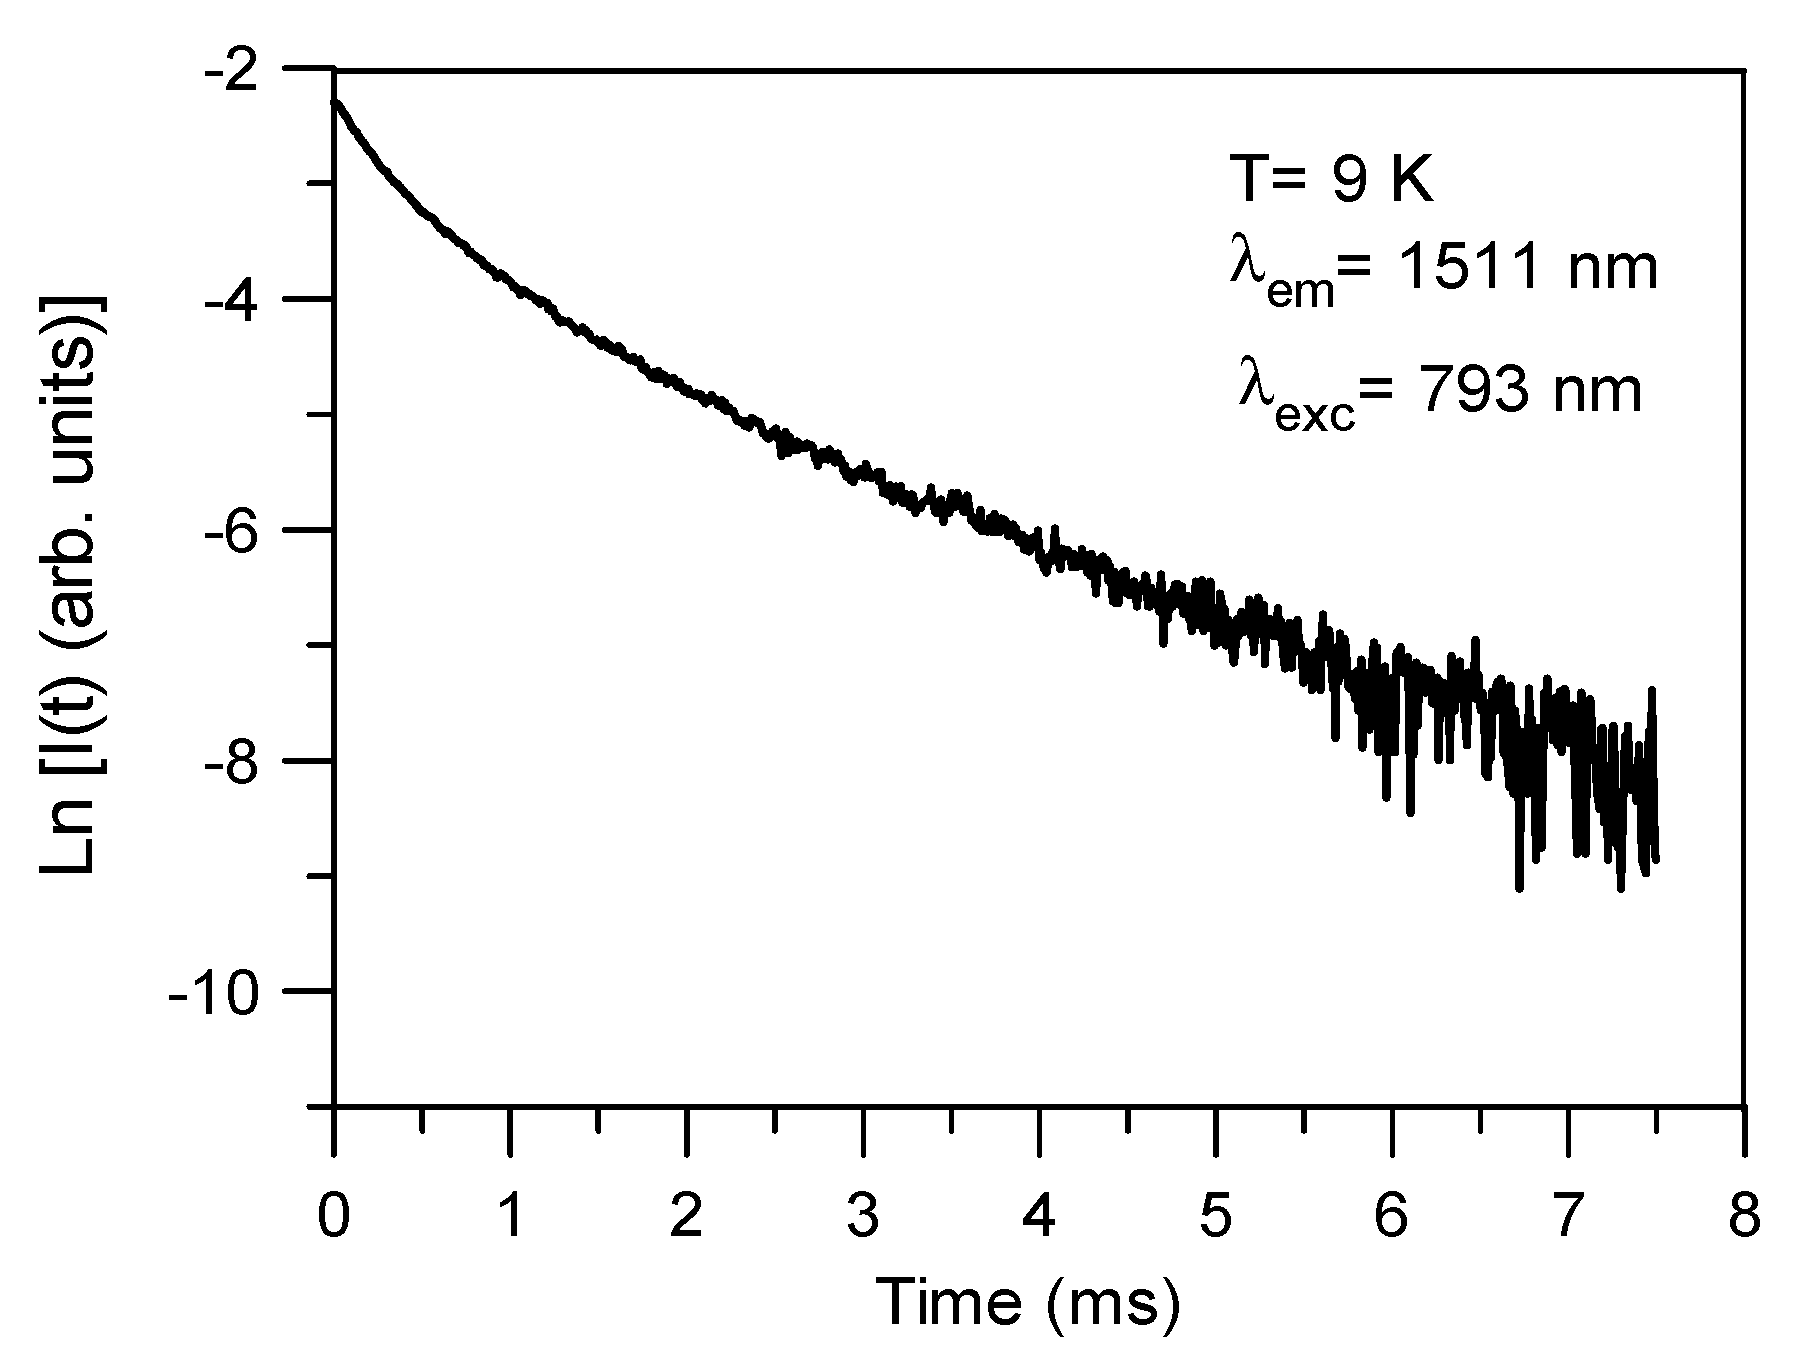
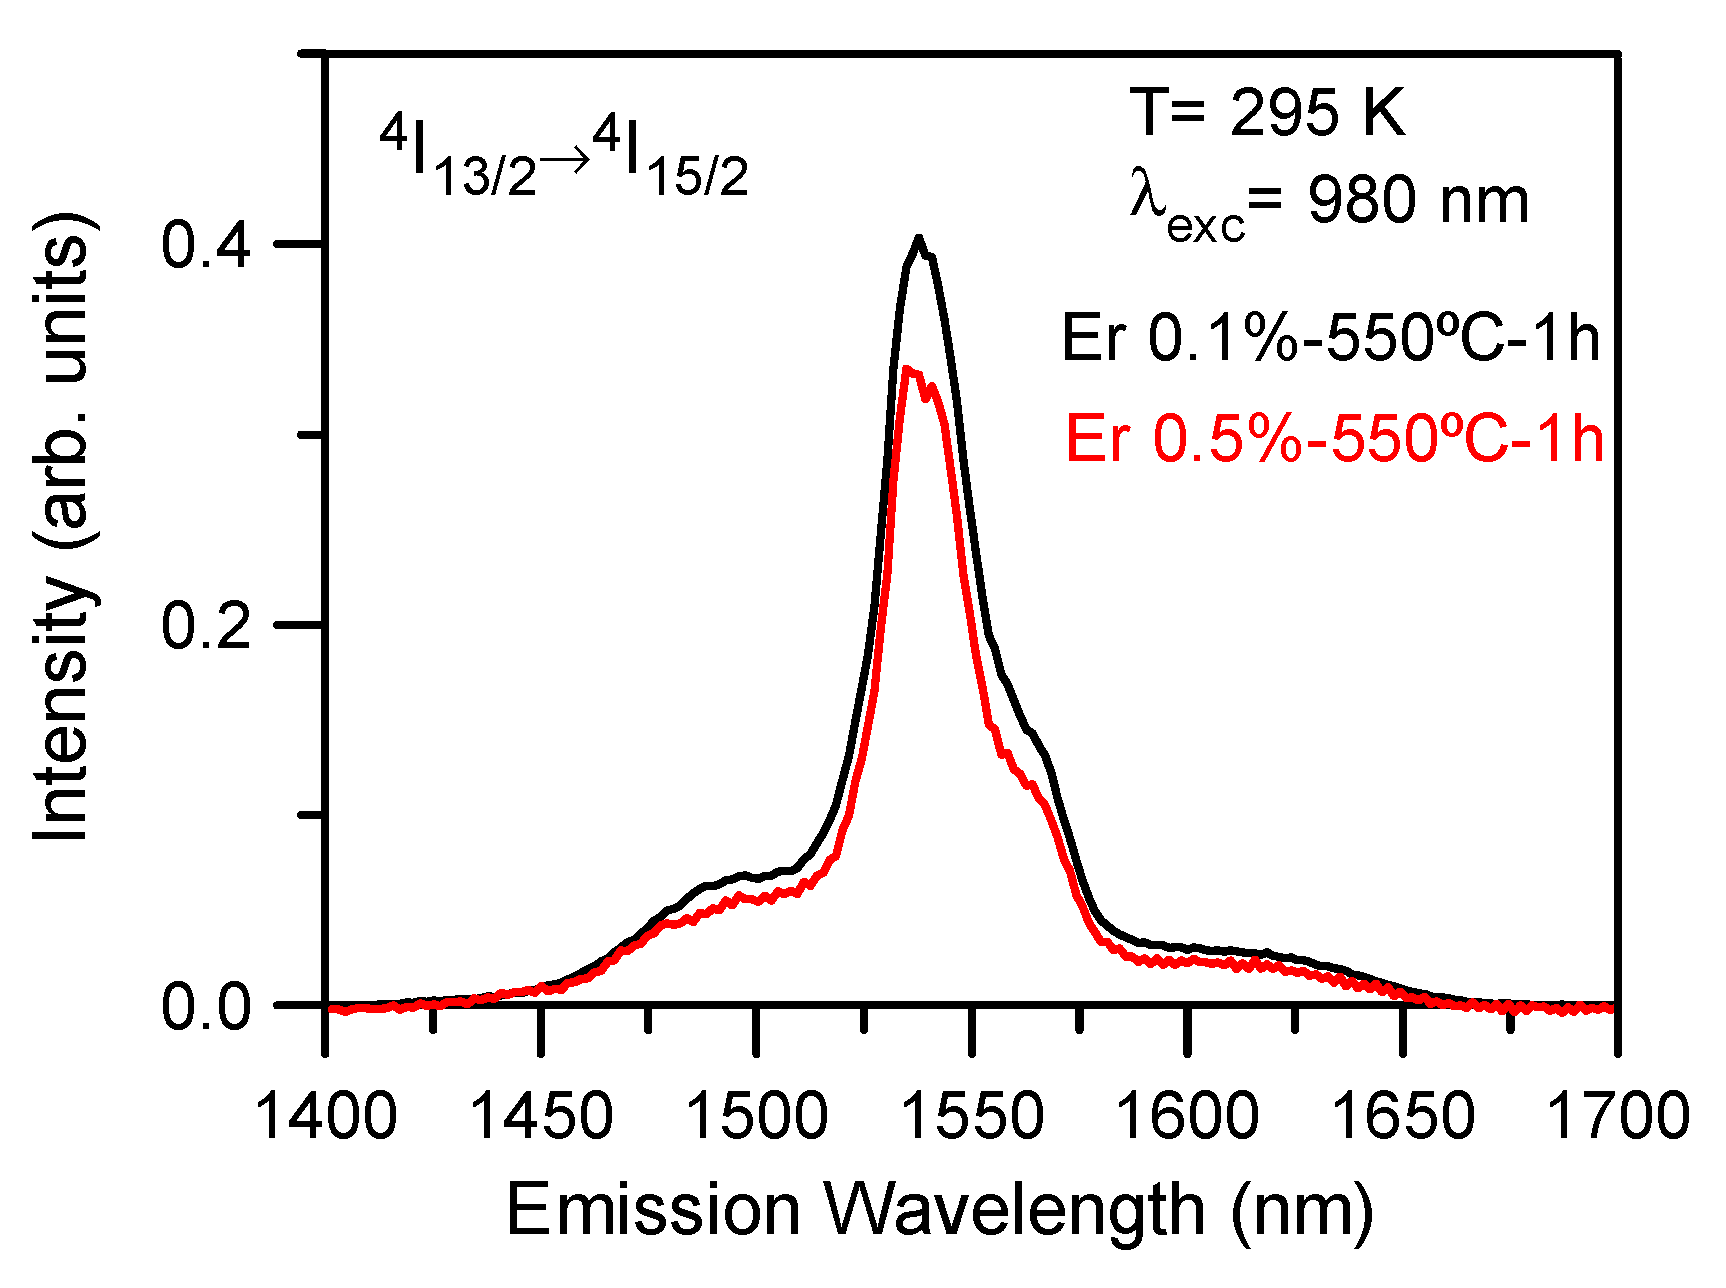
3.6. Photoluminescence (PL)

The near-infrared emission spectra corresponding to the 4I13/24I15/2 transition for 80SiO2-20LaF3-0.5Er3+ (TEOS-MTES) self-supported layer heat treated at 550 °C for 1 min were obtained at room temperature and at 9 K by exciting at 793 nm in the 4I15/24I9/2 absorption band. After excitation of this level, the next lower levels are populated by multiphonon relaxations. The room temperature emission spectrum (Figure 9a) shows a series of peaks with a maximum of around 1540 nm. Figure 9b shows the excitation spectrum corresponding to the 4I15/24I9/2 transition obtained by collecting the luminescence spectrum at 1540 nm, revealing well defined peaks which suggest the partial incorporation of Er3+ ions in the LaF3 NCs.
The incorporation of Er3+ ions into LaF3 NCs is unambiguously confirmed by measurements performed at low temperature. Figure 10 shows the emission and excitation spectra, respectively, obtained at 9 K. The emission spectrum shows sharp peaks superimposed on a broad band. The excitation spectrum obtained by collecting the luminescence at the emission maximum also shows very well defined peaks. The features exhibited by the low-temperature spectra confirm the partial incorporation of Er3+ ions in the NCs and provide evidence of the crystalline and amorphous Er3+ environments.
Measurements performed for the 80SiO2-20LaF3-0.1Er3+ (TEOS) bulk sample heat treated at 650 °C for 1 h suggest that Er3+ ions are mainly incorporated in LaF3 NCs. As an example, Figure 11a shows the low-temperature emission spectrum obtained on exciting at 793 nm. In this case, sharp and well-defined peaks are observed. Moreover, the excitation spectrum obtained by collecting the luminescence at the emission maximum corresponds to a crystalline environment for Er3+ ions. Similar emission spectra are obtained by exciting different peaks in the spectrum.
These results confirm that, in the 80SiO2-20LaF3-0.1Er3+ (TEOS) bulk sample, the Er3+ ions are mainly located in the LaF3 NCs. Although, the emission and excitation spectra of the 80SiO2-20LaF3-0.5Er3+(TEOS/MTES) bulk sample also show well-defined peaks, they are much broader and less well resolved than those of the less concentrated sample, suggesting the presence of both crystalline and amorphous Er3+ environments in the 0.5% Er3+-doped 80SiO2-20LaF3 sample.
Another important spectroscopic parameter to characterize the luminescent behavior of Er3+ ions is the decay time of the emitting level. The lifetime of the 4I13/2 level was obtained at 9K by exciting at 793 nm and collecting the luminescence at 1511 nm. The decay for the 80SiO2-20LaF3-0.1Er3+ (TEOS) bulk sample (Figure 12) deviates from a single exponential function and the lifetime is unexpectedly short. The average lifetime, calculated by:
τ = 0 t I ( t ) d t 0 I ( t ) d t ,
where I(t) represents the luminescence intensity at time t corrected for the background, is around 0.79 ms. This lifetime is nearly one order of magnitude shorter than those observed in bulk samples prepared by MQ [13]. Similar behavior has also been observed in Nd3+-doped 80SiO2-20LaF3 thin films, and attributed to the fact that the effective RE3+-ion concentration in the NCs differs by up to an order of magnitude from the theoretical (or nominal) value [12,52].
The room temperature emission spectra of 80SiO2-20LaF3 (TEOS-MTES) thin films doped with 0.1 and 0.5 Er3+ heat treated at 550 °C for 1 h corresponding to the 4I13/24I15/2 transition obtained by exciting at 980 nm reveal a glass-like behavior. Figure 13 shows the emission spectra for thin films doped with 0.1 and 0.5% Er3+. In both samples the spectrum shows an unresolved structure with a maximum at around 1540 nm which indicates the absence of a crystalline environment for Er3+ ions.

4. Conclusions

For the first time the preparation of transparent oxyfluoride glass ceramics of composition 80SiO2-20LaF3 containing Er3+-dopant have been prepared by sol-gel using TEOS and MTES as silica precursors. XRD and HRTEM showed the precipitation of LaF3 nanocrystals, with a size of 9 and 3 nm, after heat treatment at 550 °C for 1 min for bulk and thin film, respectively. Rietveld refinement indicated a LaF3 crystal fraction of ~18 wt% for the bulk glass ceramic. To our knowledge, this represents the highest crystal fraction reported in the literature for transparent oxyfluoride glass ceramics prepared by both melt-quenching and sol-gel methods. XAS and EPR shown a fluorine-rich amorphous environment in the xerogel and confirmed the presence of Er3+ in the LaF3 nanocrystals after crystallization, with a concentration around one order of magnitude higher than the nominal value. No XAS and EPR results have previously been reported for RE-doped oxyfluoride glass-ceramics prepared by sol-gel. The incorporation of Er3+ ions into LaF3 nanocrystals was unambiguously confirmed by measurements performed at low temperature. For doping levels higher than 0.1 mol%, contributions from crystalline and amorphous environments are observed. A clear difference is found between the emission spectra of thin films and bulk samples, likely related to the different crystal size.

Author Contributions

Conceptualization, G.G., J.J.V., J.M., R.B., J.F., A.D. and Y.C.; methodology, G.G., J.J.V., A.S, M.V., G.R.C., D.B. and R.B.; software, G.G., J.J.V., G.C.M., A.S., M.V. and R.B.; formal analysis, G.G., J.J.V., A.S., M.V., G.R.C., D.B. and R.B.; investigation, G.G., J.J.V., A.S., M.V., G.R.C., D.B. and R.B.; resources, A.D., Y.C., G.R.C., D.B., R.B. and J.F.; data curation, G.G., J.J.V., A.S., M.V., G.R.C., D.B. and R.B.; writing—original draft, G.G., J.J.V., J.M., A.S., M.V. and R.B.; writing—review and editing, G.G., J.J.V., G.C.M., G.R.C., D.B., R.B., J.F., A.D. and Y.C.; visualization, G.G., J.J.V., A.S., M.V., D.B., R.B. and J.F.; supervision, R.B., J.F., A.D. and Y.C.; project administration, R.B., J.F., J.M., A.D. and Y.C.; funding acquisition, R.B., J.F., A.D. and Y.C.

Funding

This research was funded by Spanish National projects MAT2017-87035-C2-1-P/2-P (AEI/FEDER, UE), MAT2016-75362-C3-1-R, and Basque Country University PPG17/07 and GIU17/014.

Acknowledgments

We acknowledge The European Synchrotron Radiation Facility (ESRF), MINECO, and CSIC for the provision of measurements using the BM25-SpLine beamline. This paper is a part of dissemination activities of project FunGlass. This project has received funding from the European Union’s Horizon 2020 research and innovation programme under grant agreement No 739566. A.S. acknowledges the financial support from the Comunidad de Madrid for an “Atracción de Talento Investigador” contract (No. 2017-t2/IND5395).

Conflicts of Interest

The authors declare no conflict of interest.

References

  1. Wang, Y.; Ohwaki, J. New transparent vitroceramics codoped with Er3+ and Yb3+ for efficient frequency upconversion. Appl. Phys. Lett. 1993, 63, 3268–3270. [Google Scholar] [CrossRef]
  2. Dejneka, M.J. The luminescence and structure of novel transparent oxyfluoride glass-ceramics. J. Non-Cryst. Solids 1998, 239, 149–155. [Google Scholar] [CrossRef]
  3. Tanabe, S.; Hayashi, H.; Hanada, T.; Onodera, N. Fluorescence properties of Er3+ ions in glass ceramics containing LaF3 nanocrystals. Opt. Mater. 2002, 19, 343–349. [Google Scholar] [CrossRef]
  4. Lavin, V.; Iparraguirre, I.; Azkargorta, J.; Mendioroz, A.; González-Plata, J.; Balda, R.; Fernández, J. Stimulated and upconverted emissions of Nd3+ in a transparent oxyfluoride glass-ceramic. Opt. Mater. (Amst.) 2004, 25, 201–208. [Google Scholar] [CrossRef]
  5. Mattarelli, M.; Tikhomirov, V.K.; Seddon, A.B.; Montagna, M.; Moser, E. Tm3+-activated transparent oxy-fluoride glass–ceramics: Structural and spectroscopic properties. J. Non-Cryst. Solids 2004, 346, 354–358. [Google Scholar] [CrossRef]
  6. Chen, D.; Wang, Y.; Yu, Y.; Huang, P.; Weng, F. Near-infrared quantum cutting in Ho3+/Yb3+ codoped nanostructured glass ceramic. Opt. Lett. 2011, 36, 876–878. [Google Scholar]
  7. de Pablos-Martín, A.; Durán, A.; Pascual, M.J. Nanocrystallization in oxyfluoride systems: Mechanisms of crystallization and photonic properties. Int. Mater. Rev. 2012, 57, 165–186. [Google Scholar] [CrossRef]
  8. Wei, Y.; Li, J.; Yang, J.; Chi, X.; Guo, H. Enhanced green upconversion in Tb3+-Yb3+ co-doped oxyfluoride glass ceramics containing LaF3 nanocrystals. J. Lumin. 2013, 137, 70–72. [Google Scholar] [CrossRef]
  9. de Pablos-Martín, A.; Ferrari, M.; Pascual, M.J.; Righini, G.C. Glass-ceramics: A class of nanostructured materials for photonics. Riv. Nuovo Cimento 2015, 38, 311–369. [Google Scholar]
  10. Fedorov, P.P.; Luginina, A.A.; Popov, A.I. Transparent oxyfluoride glass ceramics. J. Fluor. Chem. 2015, 172, 22–50. [Google Scholar] [CrossRef]
  11. Pascual, M.J.; Garrido, C.; Durán, A.; Pascual, L.; de Pablos-Martín, A.; Fernández, J.; Balda, R. Optical Properties of Transparent Glass–Ceramics Containing Er3+-Doped Sodium Lutetium Fluoride Nanocrystals. Int. J. Appl. Glass Sci. 2016, 40, 27–40. [Google Scholar] [CrossRef]
  12. Gorni, G.; Velázquez, J.J.; Mather, G.C.; Durán, A.; Chen, G.; Sundararajan, M.; Balda, R.; Fernández, J.; Pascual, M.J. Selective excitation in transparent oxyfluoride glass-ceramics doped with Nd3+. J. Eur. Ceram. Soc. 2017, 37, 1695–1706. [Google Scholar] [CrossRef]
  13. Gorni, G.; Balda, R.; Fernández, J.; Pascual, L.; Durán, A.; Pascual, M.J. Effect of the heat treatment on the spectroscopic properties of Er3+-Yb3+- doped transparent oxyfluoride nano-glass-ceramics. J. Lumin. 2018, 193, 51–60. [Google Scholar] [CrossRef]
  14. Velázquez, J.J.; Balda, R.; Fernández, J.; Gorni, G.; Pascual, L.; Chen, G.; Sundararajan, M.; Durán, A.; Pascual, M.J. Transparent oxy fl uoride glass-ceramics with NaGdF4 nanocrystals doped with Pr3+ and Pr3+-Yb3+. J. Lumin. 2018, 193, 61–69. [Google Scholar] [CrossRef]
  15. Samson, B.N.; Tick, P.A.; Borrelli, N.F. Efficient neodymium-doped glass-ceramic fiber laser and amplifier. Opt. Lett. 2001, 26, 145–147. [Google Scholar] [CrossRef]
  16. Reben, M.; Jaglarz, J. Nd3+-Doped Oxyfluoride Glass Ceramics Optical Fibre with SrF2 Nanocrystals. Opt. Appl. 2012, 42, 353–364. [Google Scholar]
  17. Lisiecki, R.; Augustyn, E.; Ryba-romanowski, W.; Zelechower, M. Er-doped and Er, Yb co-doped oxyfluoride glasses and glass–ceramics, structural and optical properties. Opt. Mater. 2011, 33, 1630–1637. [Google Scholar] [CrossRef]
  18. Kang, S.; Fang, Z.; Huang, X.; Chen, Z.; Yang, D.; Xiao, X.; Qiu, J.; Dong, G. Precisely controllable fabrication of Er3+-doped glass ceramic fibers: Novel mid-infrared fiber laser materials. J. Mater. Chem. C 2017, 5, 4549–4556. [Google Scholar] [CrossRef]
  19. Gorni, G.; Balda, R.; Fernández, J.; Iparraguirre, I.; Velázquez, J.J.; Castro, Y.; Pascual, L.; Chen, G.; Sundararajan, M.; Pascual, M.J.; et al. Oxyfluoride glass–ceramic fibers doped with Nd3+: Structural and optical characterization. CrystEngComm 2017, 19, 6620–6629. [Google Scholar] [CrossRef]
  20. Kang, S.; Yu, H.; Ouyang, T.; Chen, Q.; Huang, X.; Chen, Z.; Qiu, J.; Dong, G. Novel Er3+/Ho3+-codoped glass-ceramic fibers for broadband tunable mid-infrared fiber lasers. J. Am. Ceram. Soc. 2018, 101, 3956–3967. [Google Scholar] [CrossRef]
  21. Fujihara, S.; Mochizuki, C.; Kimura, T. Formation of LaF3 microcrystals in sol-gel silica. J. Non-Cryst. Solids 1999, 244, 267–274. [Google Scholar] [CrossRef]
  22. Biswas, A.; Maciel, G.S.; Friend, C.S.; Prasad, P.N. Upconversion properties of a transparent Er3+-Yb3+ co-doped LaF3-SiO2 glass-ceramics prepared by sol-gel method. J. Non-Cryst. Solids 2003, 316, 393–397. [Google Scholar] [CrossRef]
  23. Fujihara, S.; Koji, S.; Kimura, T. Structure and optical properties of (Gd,Eu)F3-nanocrystallized sol–gel silica films. J. Mater. Chem. 2004, 14, 1331–1335. [Google Scholar] [CrossRef]
  24. Ribeiro, S.J.L.; Araújo, C.C.; Bueno, L.A.; Gonçalves, R.R.; Messaddeq, Y. Sol-gel Eu3+/Tm3+ doped transparent glass-ceramic waveguides. J. Non-Cryst. Solids 2004, 348, 180–184. [Google Scholar] [CrossRef]
  25. Luo, W.; Wang, Y.; Bao, F.; Zhou, L.; Wang, X. Crystallization behavior of PbF2-SiO2based bulk xerogels. J. Non-Cryst. Solids 2004, 347, 31–38. [Google Scholar] [CrossRef]
  26. Zhou, L.; Chen, D.; Luo, W.; Wang, Y.; Yu, Y.; Liu, F. Transparent glass ceramic containing Er3+: CaF2 nano-crystals prepared by sol–gel method. Mater. Lett. 2007, 61, 3988–3990. [Google Scholar] [CrossRef]
  27. Velázquez, J.J.; Yanes, A.C.; Del-Castillo, J.; Méndez-Ramos, J.; Rodríguez, V.D. Optical properties of Ho3+-Yb3+ co-doped nanostructured SiO2-LaF3 glass-ceramics prepared by sol-gel method. Phys. Status Solidi 2007, 204, 1762–1768. [Google Scholar] [CrossRef]
  28. del-Castillo, J.; Yanes, A.C. Bright luminescence of Gd3+ sensitized RE3+-doped SiO2-BaGdF5 glass-ceramics for UV-LEDs colour conversion. J. Alloys Compd. 2017, 695, 3736–3743. [Google Scholar]
  29. Szpikowska-Sroka, B.; Pawlik, N.; Goryczka, T.; Pietrasik, E.; Bańczyk, M.; Pisarski, W.A. Lead fluoride β-PbF2 nanocrystals containing Eu3+ and Tb3+ ions embedded in sol-gel materials: Thermal, structural and optical investigations. Ceram. Int. 2017, 43, 8424–8432. [Google Scholar] [CrossRef]
  30. Szpikowska-Sroka, B.; Pawlik, N.; Goryczka, T.; Pisarski, W.A. Influence of silicate sol-gel host matrices and catalyst agents on the luminescent properties of Eu3+/Gd3+ under different excitation wavelengths. RSC Adv. 2015, 5, 98773–98782. [Google Scholar] [CrossRef]
  31. Secu, C.E.; Bartha, C.; Polosan, S.; Secu, M. Thermally activated conversion of a silicate gel to an oxyfluoride glass ceramic: Optical study using Eu3+ probe ion. J. Lumin. 2014, 146, 539–543. [Google Scholar] [CrossRef]
  32. Secu, C.E.; Negrea, R.F.; Secu, M. Eu3+ probe ion for rare-earth dopant site structure in sol–gel derived LiYF4 oxyfluoride glass–ceramic. Opt. Mater. 2013, 35, 2456–2460. [Google Scholar] [CrossRef]
  33. Santana-Alonso, A.; Méndez-Ramos, J.; Yanes, A.C.; Del-Castillo, J.; Rodríguez, V.D. Up-conversion in sol-gel derived nano-glass-ceramics comprising NaYF4 nano-crystals doped with Yb3+, Ho3+ and Tm3+. Opt. Mater. 2010, 32, 903–908. [Google Scholar] [CrossRef]
  34. Szpikowska-Sroka, B.; Zur, L.; Czoik, R.; Goryczka, T.; Swinarew, A.S.; Zadlo, M.; Pisarski, W.A. Long-lived emission from Eu3+:PbF2 nanocrystals distributed into sol–gel silica glass. J. Sol-Gel Sci. Technol. 2013, 68, 278–283. [Google Scholar] [CrossRef]
  35. Ballato, J.; Riman, R.E.; Snitzer, E. Sol–gel synthesis of fluoride optical materials for planar integrated photonic applications. J. Non-Cryst. Solids 1997, 213–214, 126–136. [Google Scholar] [CrossRef]
  36. Kumar, G.A.; Riman, R.; Snitzer, E. Solution synthesis and spectroscopic characterization of high Er3+ content LaF3 for broadband 1.5 μm amplification. J. Appl. Phys. 2004, 95, 40–44. [Google Scholar] [CrossRef]
  37. Hench, L.L.; West, J.K. The sol-gel process. Chem. Rev. 1990, 90, 33–72. [Google Scholar] [CrossRef]
  38. Gorni, G.; Velázquez, J.J.; Mosa, J.; Balda, R.; Fernández, J.; Durán, A.; Castro, Y. Transparent Glass-Ceramics Produced by Sol-Gel: A Suitable Alternative for Photonic Materials. Materials 2018, 11, 212. [Google Scholar] [CrossRef]
  39. Rubio-Zuazo, J.; Ferrer, P.; López, A.; Gutiérrez-León, A.; Silva, I.; Castro, G.R. Nuclear Instruments and Methods in Physics Research A The multipurpose X-ray diffraction end-station of the BM25B-SpLine synchrotron beamline at the ESRF. Nucl. Inst. Methods Phys. Res. A 2013, 716, 23–28. [Google Scholar] [CrossRef]
  40. Rodríguez-Carvajal, J. Recent advances in magnetic structure determination by neutron powder diffraction. Phys. B Condens. Matter 1993, 192, 55–69. [Google Scholar] [CrossRef]
  41. Ravel, B.; Newville, M. ATHENA, ARTEMIS, HEPHAESTUS: Data analysis for X-ray absorption spectroscopy using IFEFFIT. J. Synchrotron Radiat. 2005, 12, 537–541. [Google Scholar] [CrossRef] [PubMed]
  42. Innocenzi, P.; Abdirashid, M.O.; Guglielmi, M. Structure and properties of sol-gel coatings from methyltriethoxysilane and tetraethoxysilane. J. Sol-Gel Sci. Technol. 1994, 3, 47–55. [Google Scholar] [CrossRef]
  43. Ma, Y.; Lee, H.R.; Tsuru, T. Study on Preparation and Hydrophobicity of MTES Derived Silica Sol and Gel. Adv. Mater. Res. 2012, 535–537, 2563–2566. [Google Scholar] [CrossRef]
  44. Gorni, G.; Pascual, M.J.; Caballero, A.; Velázquez, J.J.; Mosa, J.; Castro, Y.; Durán, A. Crystallization mechanism in sol-gel oxyfluoride glass-ceramics. J. Non-Cryst. Solids 2018, 501, 145–152. [Google Scholar] [CrossRef]
  45. Yu, Y.; Chen, D.; Cheng, Y.; Wang, Y.; Hu, Z.; Bao, F. Investigation on crystallization and influence of Nd3+ doping of transparent oxyfluoride glass-ceramics. J. Eur. Ceram. Soc. 2006, 26, 2761–2767. [Google Scholar] [CrossRef]
  46. Bhattacharyya, S.; Bocker, C.; Heil, T.; Jinschek, R.; Höche, T.; Rüssel, C.; Kohl, H. Experimental Evidence of Self-Limited Growth of Nanocrystals in Glass Experimental Evidence of Self-Limited Growth of Nanocrystals in Glass. Nano Lett. 2009, 9, 2493–2496. [Google Scholar] [CrossRef]
  47. Bhattacharyya, S.; Höche, T.; Hemono, N.; Pascual, M.J.; van Aken, P.A. Nano-crystallization in LaF3-Na2O-Al2O3-SiO2 glass. J. Cryst. Growth 2009, 311, 4350–4355. [Google Scholar] [CrossRef]
  48. de Pablos-Martín, A.; Muñoz, F.; Mather, G.C.; Patzig, C.; Bhattacharyya, S.; Jinschek, J.R.; Höche, T.; Durán, A.; Pascual, M.J. KLaF4 nanocrystallization in oxyfluoride glass-ceramics. CrystEngComm 2013, 15, 10323–10332. [Google Scholar] [CrossRef]
  49. de Pablos-Martín, A.; Hémono, N.; Mather, G.C.; Bhattacharyya, S.; Höche, T.; Bornhöft, H.; Deubener, J.; Muñoz, F.; Durán, A.; Pascual, M.J. Crystallization kinetics of LaF3 nanocrystals in an oxyfluoride glass. J. Am. Ceram. Soc. 2011, 94, 2420–2428. [Google Scholar] [CrossRef]
  50. Velázquez, J.J.; Mosa, J.; Gorni, G.; Balda, R.; Fernández, J.; Pascual, L.; Durán, A.; Castro, Y. Transparent SiO2-GdF3 sol–gel nano-glass ceramics for optical applications. J. Sol-Gel Sci. Technol. 2019, 89, 322–332. [Google Scholar] [CrossRef]
  51. Jia, Y.Q. Crystal radii and effective ionic radii of the rare earth ions. J. Solid State Chem. 1991, 95, 184–187. [Google Scholar] [CrossRef]
  52. Gorni, G.; Balda, R.; Fernández, J.; Velázquez, J.J.; Pascual, L.; Mosa, J.; Durán, A.; Castro, Y. 80SiO2-20LaF3 oxyfluoride glass ceramic coatings doped with Nd3+ for optical applications. Int. J. Appl. Glass Sci. 2018, 9, 208–217. [Google Scholar] [CrossRef]
  53. Li, F.; Li, C.; Liu, X.; Bai, T.; Dong, W.; Zhang, X.; Shi, Z.; Feng, S. Microwave-assisted synthesis and up–down conversion luminescent properties of multicolor hydrophilic LaF3:Ln3+ nanocrystals. Dalt. Trans. 2013, 42, 2015–2022. [Google Scholar] [CrossRef]
  54. Agarwal, B.K.; Verma, L.P. A rule for chemical shifts of X-ray absorption edges. J. Phys. C Solid State Phys. 1970, 3, 535–537. [Google Scholar] [CrossRef]
  55. Choi, Y.G. Covalence of chemical bonds and white-line intensity of an L3-edge X-ray absorption near-edge structure of rare earth elements embedded in glass. Met. Mater. Int. 2009, 15, 993–999. [Google Scholar] [CrossRef]
  56. Figueroa, A.I.; van der Laan, G.; Harrison, S.E.; Cibin, G.; Hesjedal, T. Oxidation Effects in Rare Earth Doped Topological Insulator Thin Films. Sci. Rep. 2016, 6, 22935. [Google Scholar] [CrossRef] [PubMed] [Green Version]
  57. de Pablos-Martín, A.; García, M.A.; Muñoz-Noval, A.; Castro, G.R.; Pascual, M.J.; Durán, A. Analysis of the distribution of Tm3+ ions in LaF3 containing transparent glass-ceramics through X-ray absorption spectroscopy. J. Non-Cryst. Solids 2014, 384, 83–87. [Google Scholar] [CrossRef]
  58. Dantelle, G.; Mortier, M.; Vivien, D. EPR and optical studies of erbium-doped β-PbF2 single-crystals and nanocrystals in transparent glass–ceramics. Phys. Chem. Chem. Phys. 2007, 9, 5591–5598. [Google Scholar] [CrossRef] [PubMed]
  59. Baker, J.M.; Rubins, R.S. Electron Spin Resonance in Two Groups of Lanthanon Salts. Proc. Phys. Soc. 1961, 78, 1353–1360. [Google Scholar] [CrossRef]
  60. Schulz, M.B.; Jefries, C.D. Spin-Lattice Relaxation of Rare-Earth Ions in LaF3. Phys. Rev. 1966, 149, 270–288. [Google Scholar] [CrossRef]
  61. Budoyo, R.P.; Kakuyanagi, K.; Toida, H.; Matsuzaki, Y.; Munro, W.J.; Yamaguchi, H.; Saito, S. Electron paramagnetic resonance spectroscopy of Er3+:Y2SiO5 using a Josephson bifurcation amplifier: Observation of hyperfine and quadrupole structures. Phys. Rev. Mater. 2018, 2, 11403. [Google Scholar] [CrossRef]
  62. Yang, S.; Evans, S.M.; Halliburton, L.E.; Slack, G.A.; Schujman, S.B.; Morgan, K.E.; Bondokov, R.T.; Mueller, G.; Yang, S.; Evans, S.M.; et al. Electron paramagnetic resonance of ions in aluminum nitride Electron paramagnetic resonance of Er3+ ions in aluminum nitride. J. Appl. Phys. 2009, 105, 23714–23715. [Google Scholar] [CrossRef]
Figure 1. (a) Xerogel of composition 80SiO2-20LaF3- 0.5Er3+ (tetraethyl orthosilicate with methyl-trimethoxy-silane, TEOS-MTES) obtained at 150 °C for 24 h; (b) Oxyfluoride glass-ceramics (OxGC) of the same composition obtained at 550 °C for 1 min.
Nanomaterials 09 00530 g001
Figure 2. (a) Ellipsometric measurements and fit of 80SiO2-20LaF3-0.5Er3+ (TEOS-MTES) thin film treated at 550 °C for 1 min deposited onto silica substrate using a withdrawal rate of 35 cm/min. The inset shows the dispersion relation using the Cauchy model (b) Variation of thickness with the withdrawal rate.
Nanomaterials 09 00530 g002
Figure 3. Differential thermal analysis (DTA, red) and thermogravimetry (TG, blue) curve for 80SiO2-20LaF3-0.5Er3+ (TEOS-MTES) bulk sample treated in the air with a heating rate of 10 °C/min.
Nanomaterials 09 00530 g003
Figure 4. (a) X-Ray diffraction (XRD) of 80SiO2-20LaF3-01Er3+ (TEOS) self-supported layer treated at 650 °C for 1 h. (b) Observed (small red circles), calculated (continuous black line) and difference (continuous blue line at the bottom) XRD profiles of 80SiO2-20LaF3-0.5Er3+ (TEOS-MTES) self-supported layer treated at 550 °C mixed with 9 wt.% NaF as the internal standard. Bragg peaks of NaF and LaF3 are indicated by blue and red vertical bars, respectively.
Nanomaterials 09 00530 g004
Figure 5. (a) Grazing incidence XRD (GI-XRD) of thin film and (b) XRD of the bulk sample of composition 80SiO2-20LaF3 0.5Er3+ (TEOS-MTES) treated at 550 °C for 1 min. The crystal size is given together with the LaF3 reference shown with vertical bars (JCPDS 00-032-0483).
Nanomaterials 09 00530 g005
Figure 6. (a) High resolution transmission electron microscopy (HRTEM) micrograph, (b) lattice distance and (c) crystal-size distribution of 80SiO2-20LaF3 0.5Er3+ thin film treated at 550 °C for 1 min. (d) HRTEM micrograph, (e) lattice distance and (f) crystal-size distribution of 80SiO2-20LaF3 0.5Er3+ self-supported layer treated at 550 °C for 1 min.
Nanomaterials 09 00530 g006
Figure 7. X-Ray absorption spectroscopy (XAS) spectra and derivatives (inset) of Er2O3 and ErF3 references in black and red, respectively (top), and of XAS spectra and derivatives (inset) of 80SiO2-20LaF3-0.5Er3+ (TEOS-MTES) xerogel and GC thin film treated at 550 °C for 1 min, in pink and blue, respectively (bottom). The grey line indicates the white line and the red and black lines indicate resonance positions for ErF3 and Er2O3, respectively.
Nanomaterials 09 00530 g007
Figure 8. (a) Electron Paramagnetic Resonance (EPR) signals for the 80SiO2-20LaF3-0.5Er3+ (TEOS-MTES). xerogel and of an MQ glass doped with 0.5Er3+. (b) EPR signals of 80SiO2-20LaF3 (TEOS-MTES) GCs doped with 0.1 and 0.5Er3+ (mol%) treated at 550 °C for 1 min.
Nanomaterials 09 00530 g008
Figure 9. (a) Room temperature emission spectrum of 80SiO2-20LaF3-0.5Er3+ (TEOS-MTES) bulk sample heat treated at 550 °C for 1 min obtained on exciting at 793 nm. (b) Low-temperature excitation spectrum obtained at 1540 nm.
Nanomaterials 09 00530 g009
Figure 10. (a) Low temperature emission spectrum of 80SiO2-20LaF3-0.5Er3+ (TEOS-MTES) bulk sample heat treated at 550 °C for 1 min on exciting at 793 nm. (b) Low temperature excitation spectrum obtained at 1511 nm.
Nanomaterials 09 00530 g010
Figure 11. (a) Low-temperature emission spectrum of the 80SiO2-20LaF3-0.1Er3+ (TEOS) bulk sample heat treated at 650 °C for 1 h on exciting at 793 nm. (b) Low temperature excitation spectrum obtained at 1511 nm.
Nanomaterials 09 00530 g011
Figure 12. Semi-logarithmic plot of the fluorescence decay of the 4I13/2 level for the 80SiO2-20LaF3-0.1Er3+ (TEOS) bulk sample doped with 0.1% Er3+ obtained by exciting at 793 nm and collecting the luminescence at 1511 nm.
Nanomaterials 09 00530 g012
Figure 13. Room temperature emission spectrum of 80SiO2-20LaF3 (TEOS-MTES) thin films doped with 0.1% (black line) and 0.5% (red line) Er3+ heat treated at 550 °C for 1 h obtained on exciting at 980 nm.
Nanomaterials 09 00530 g013
Table 1. Lattice constants of 80SiO2-20LaF3-0.5Er3+ (TEOS-MTES) glass-ceramic bulk sample treated at 550 °C for 1 min.
Samplea (Å)c (Å)Unit Cell Volume (Å3)
Undoped LaF3 [JCPDS]17.1877.350328
Er3+ doped GCs 550°C 1 m7.16 ± 0.017.32 ± 0.01325 ± 1
1 JCPDS cards 00-032-0483. Ionic sizes in n-fold coordination for hexagonal phase: 1.31 Å for La3+ and 1.17 Å for Er3+ [51].

