
Unexpected Phonon Behaviour in BiFexCr1−xO3, a Material System Different from Its BiFeO3 and BiCrO3 Parents

 , , and
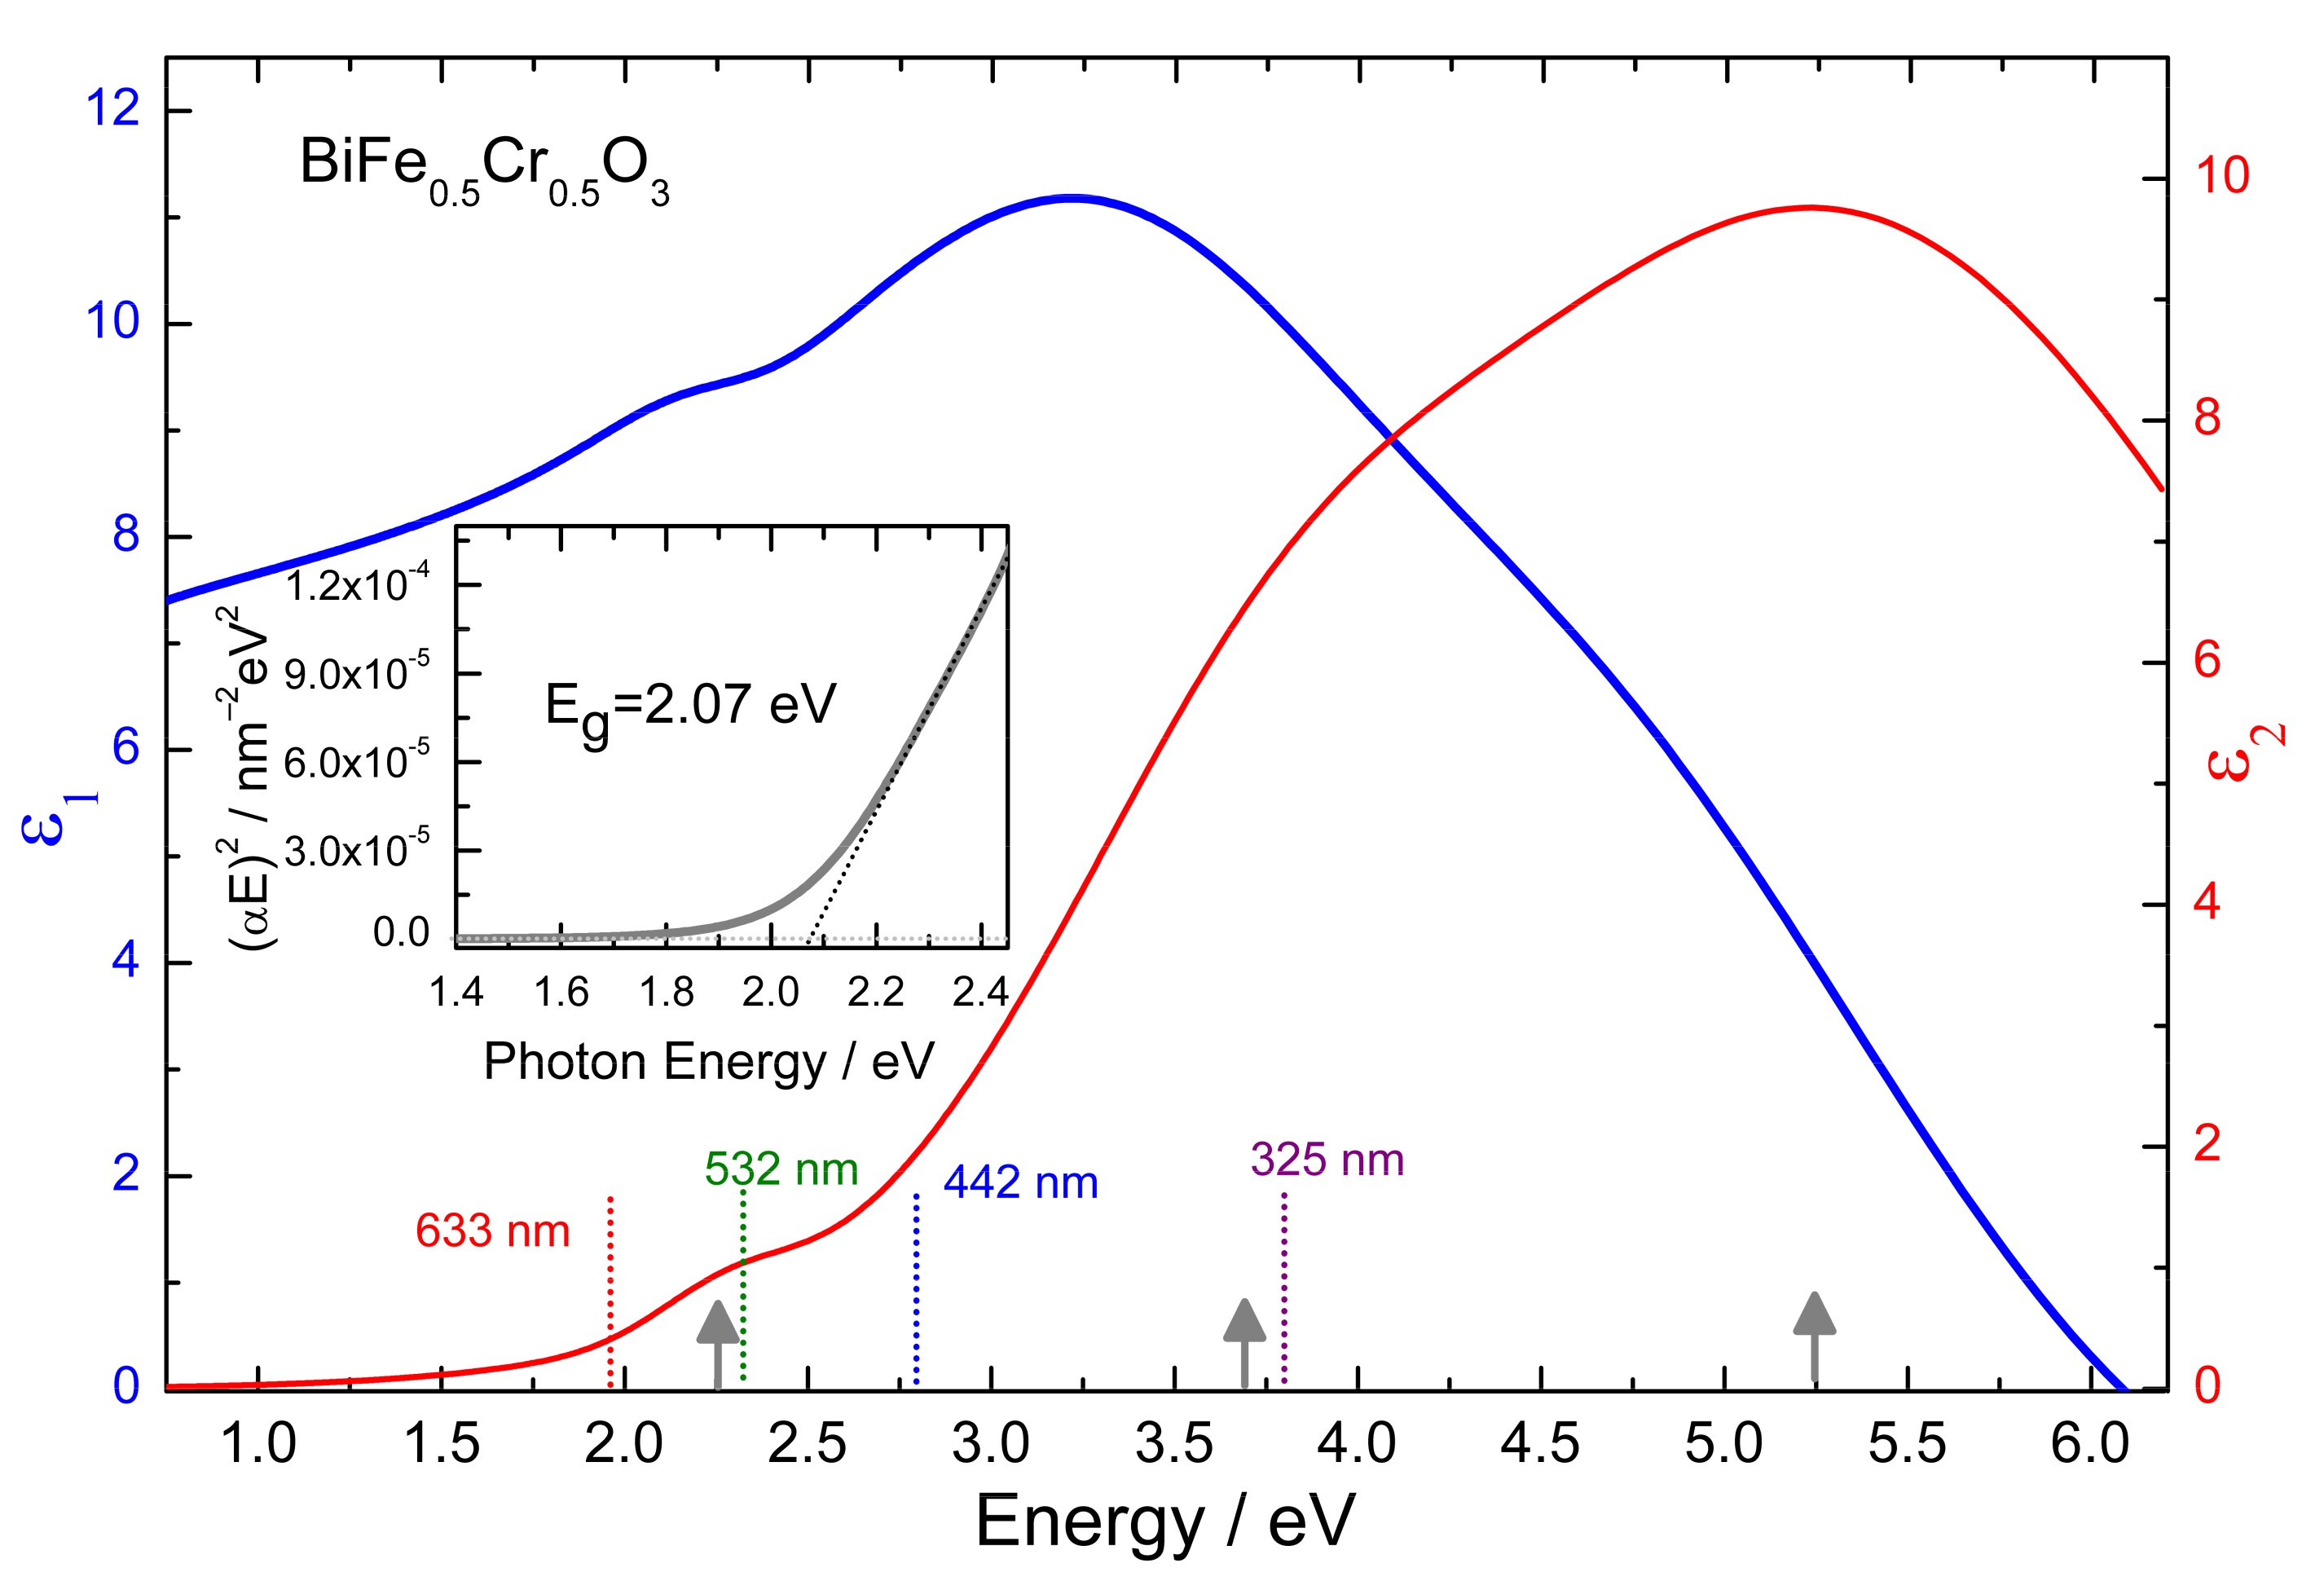
Abstract
:1. Introduction
2. Materials and Methods
3. Results and Discussions
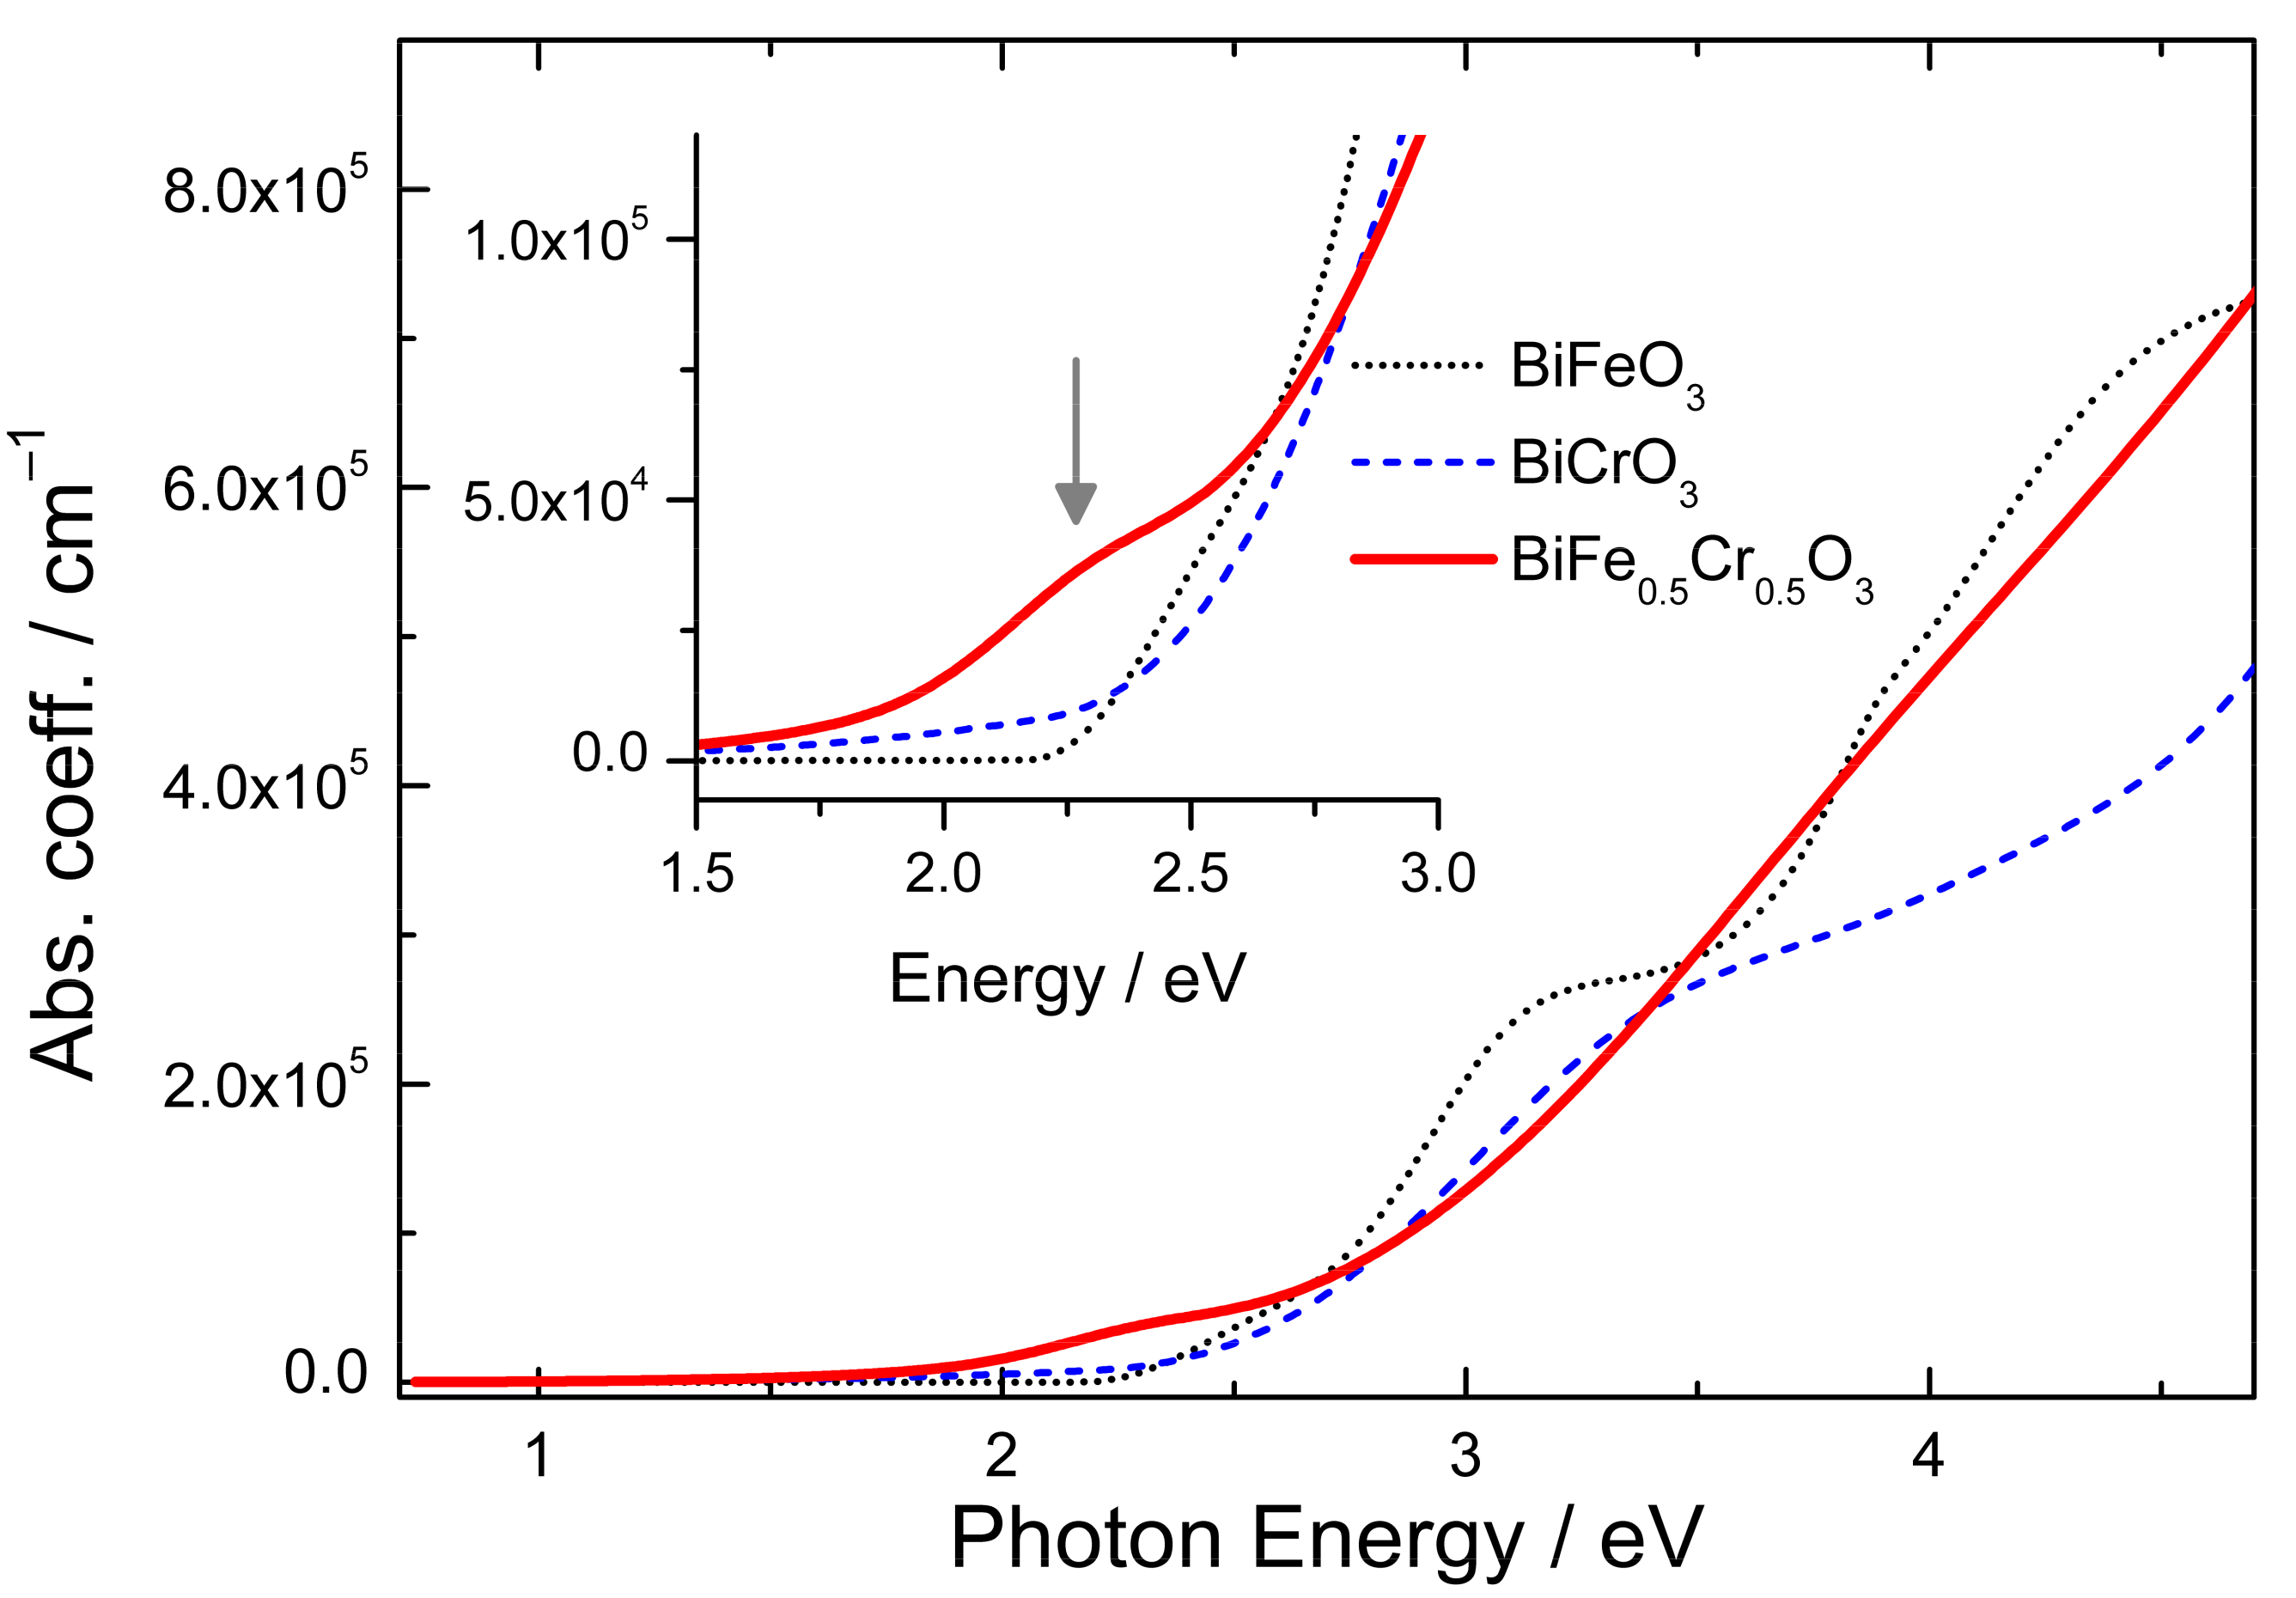
3.1. Ellipsometry Dielectric Function
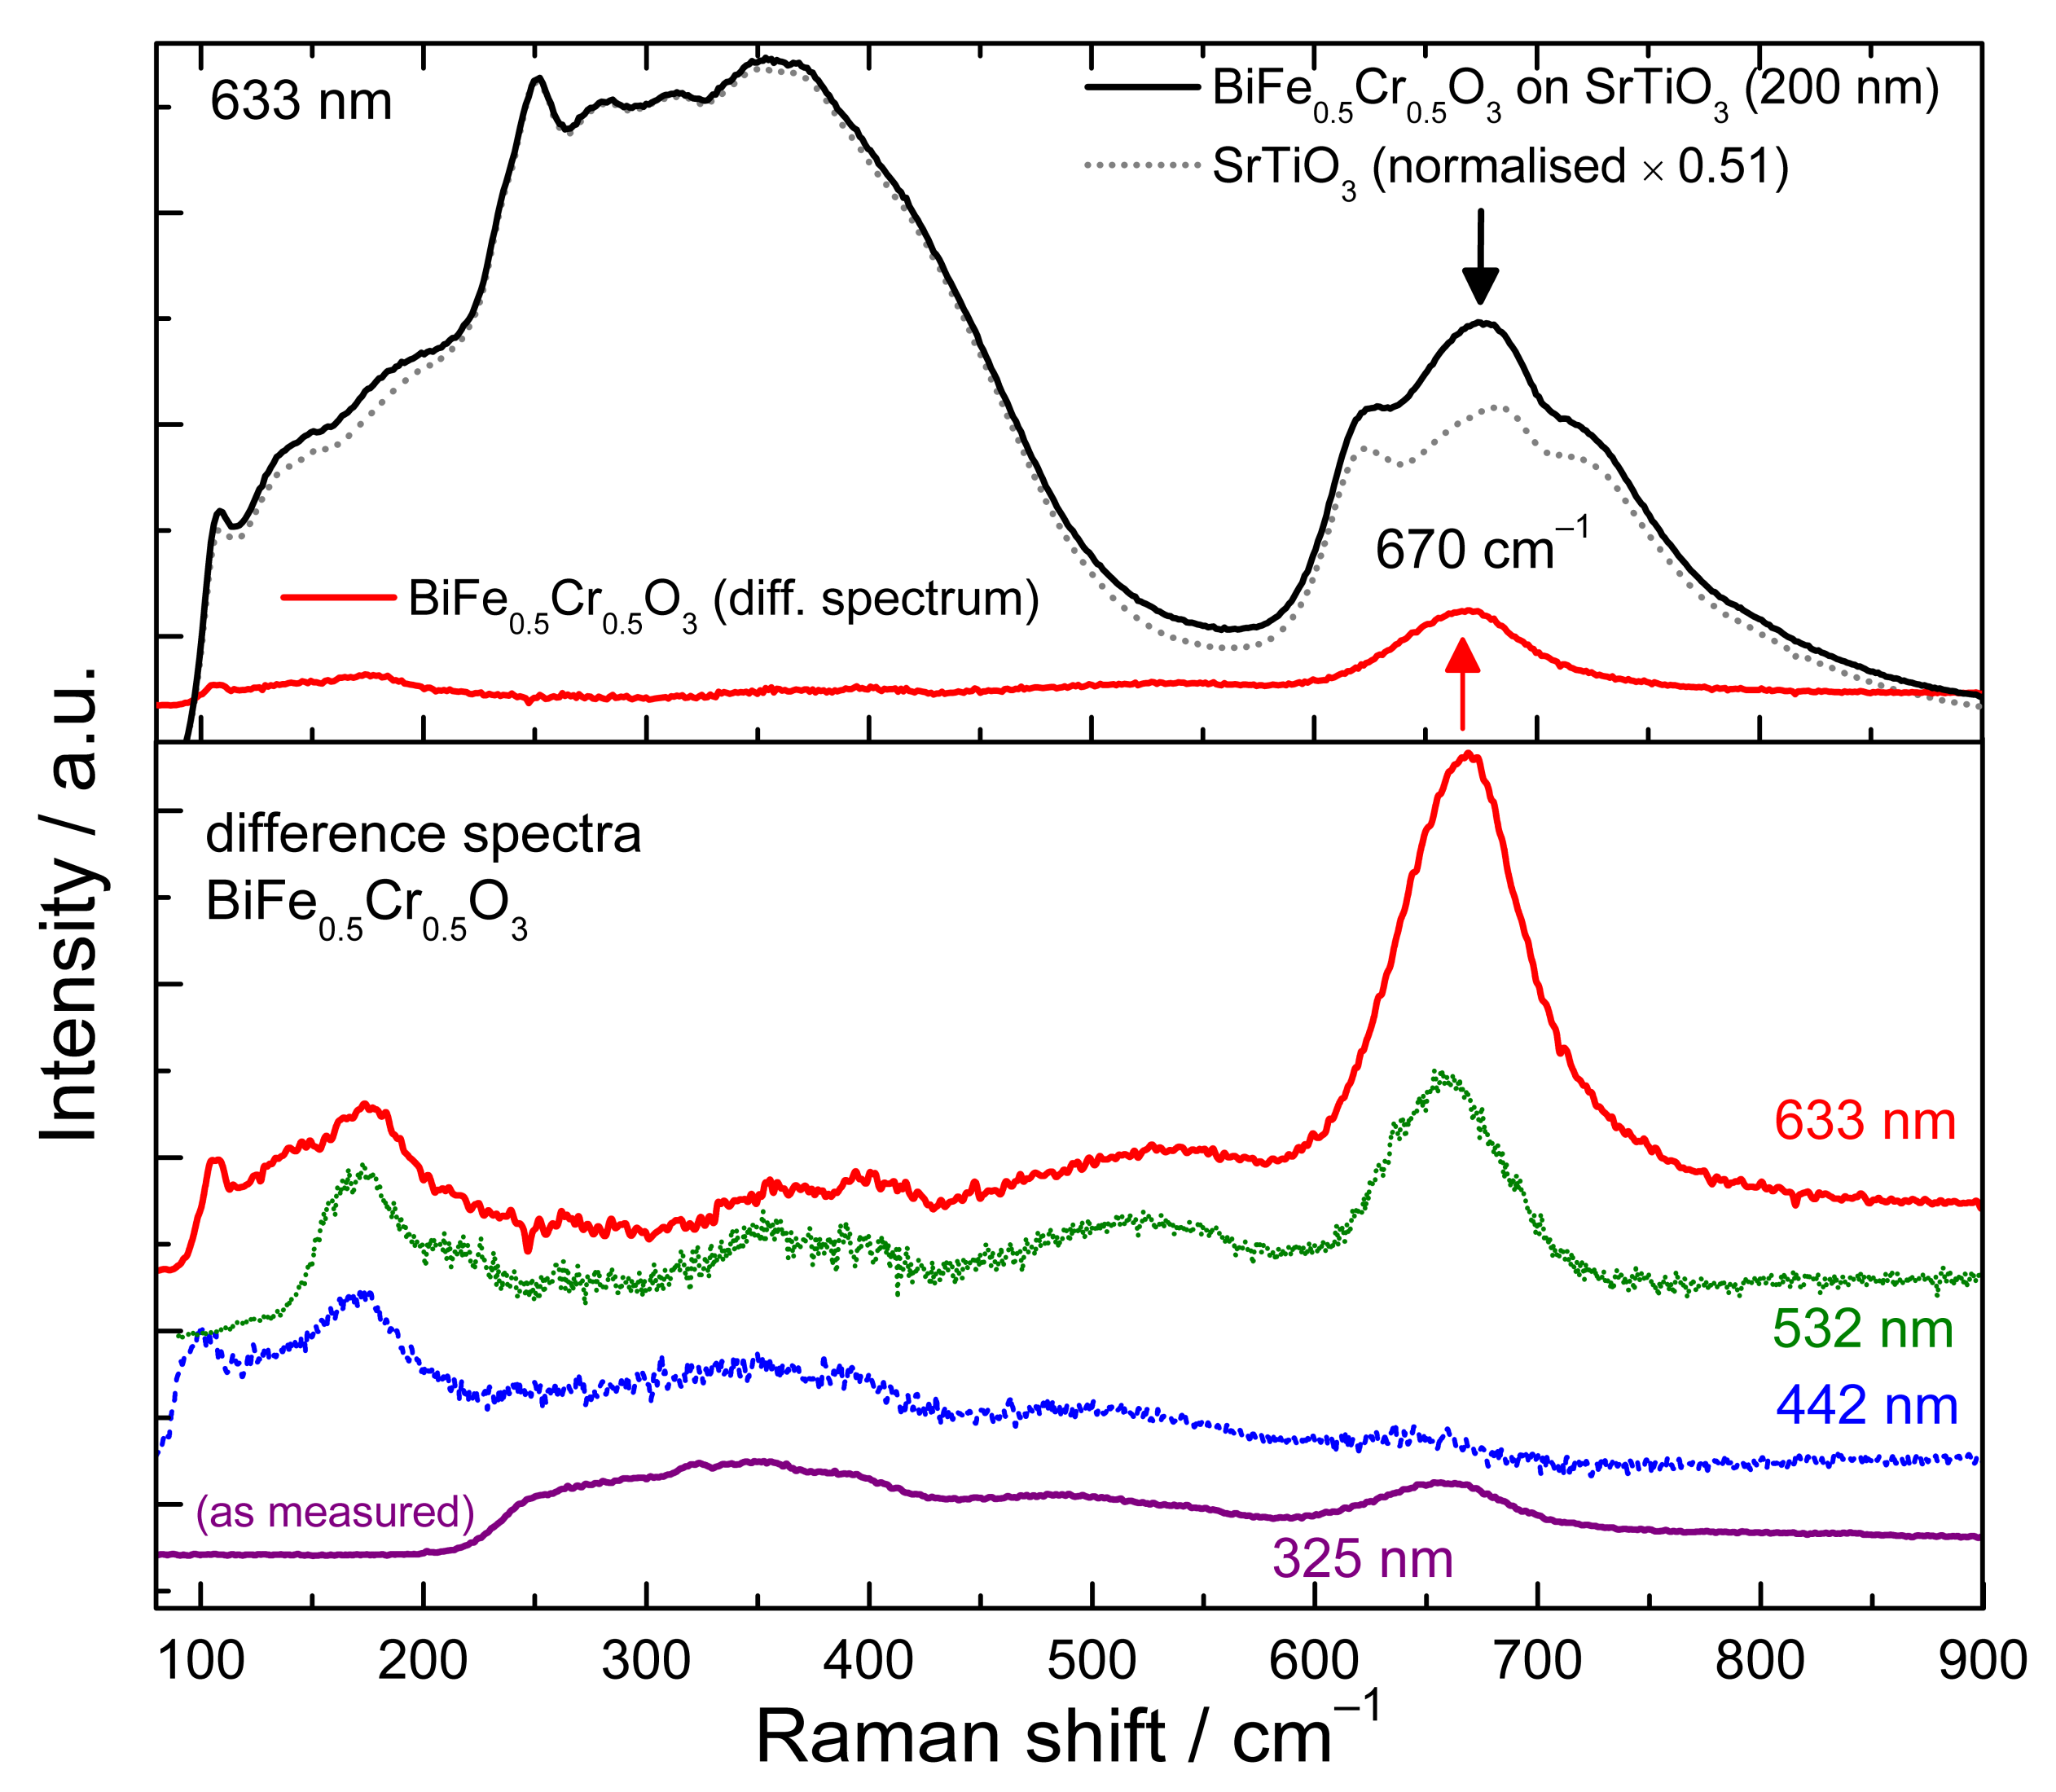
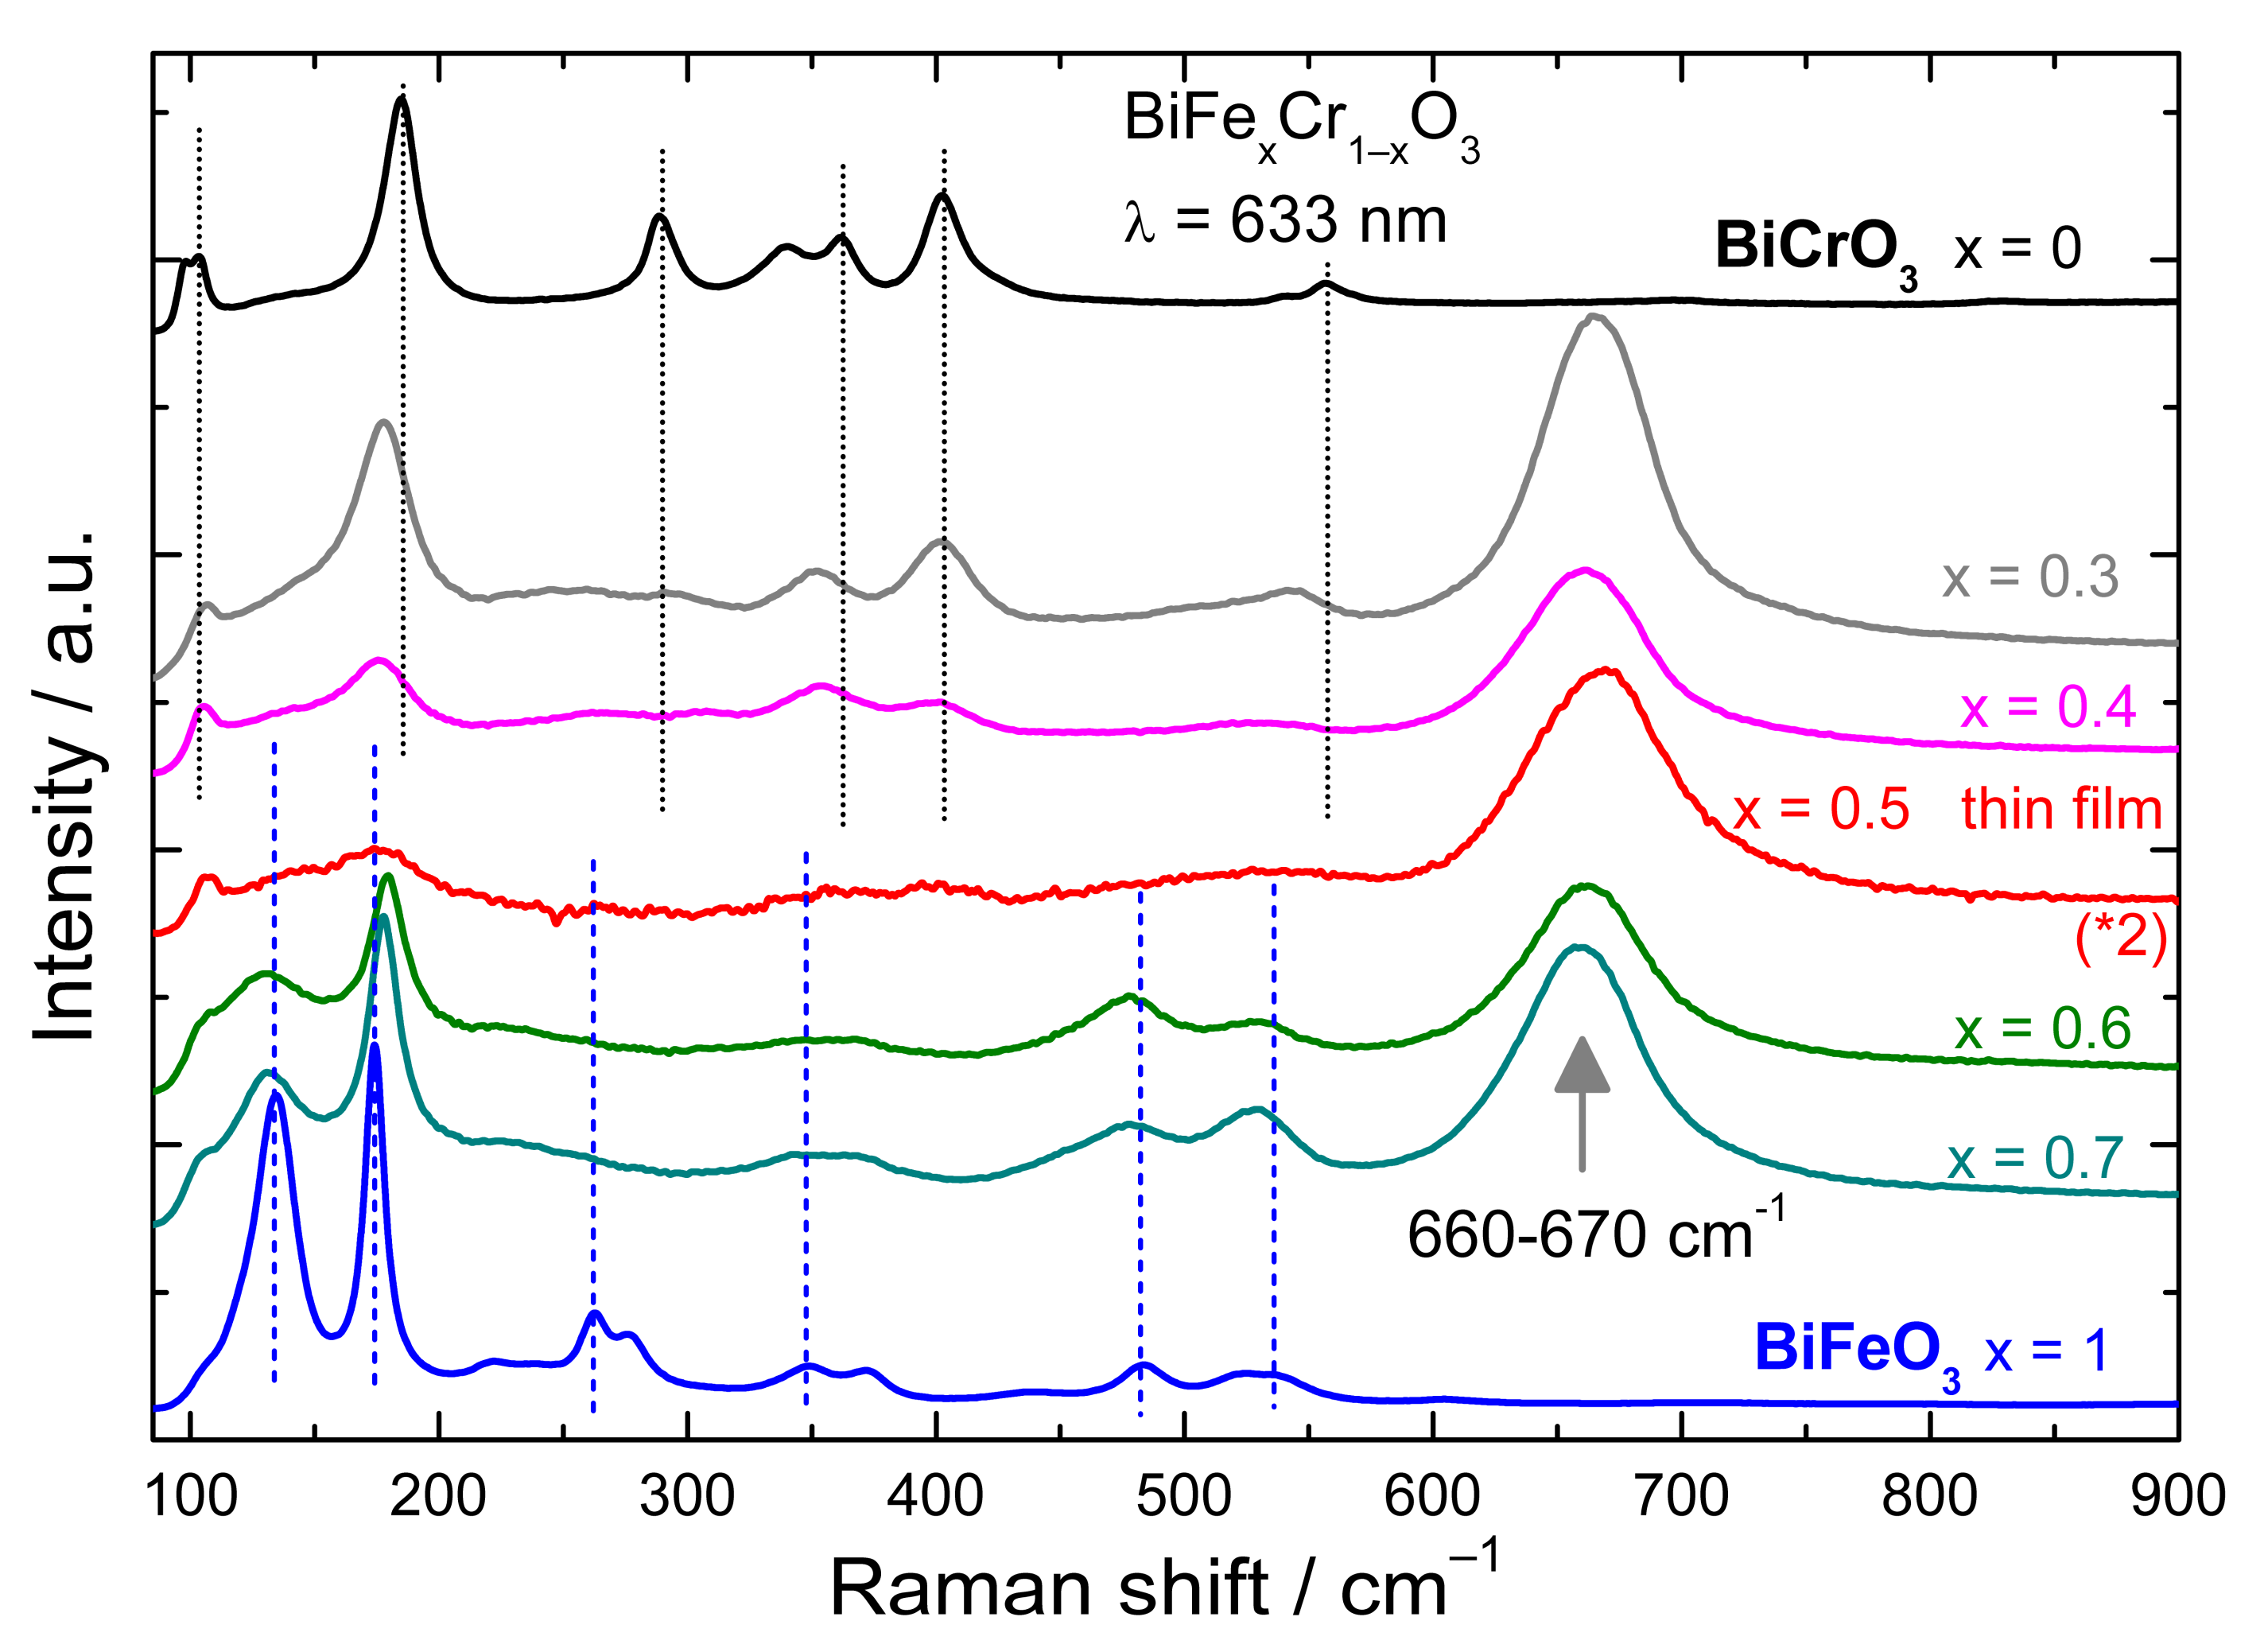
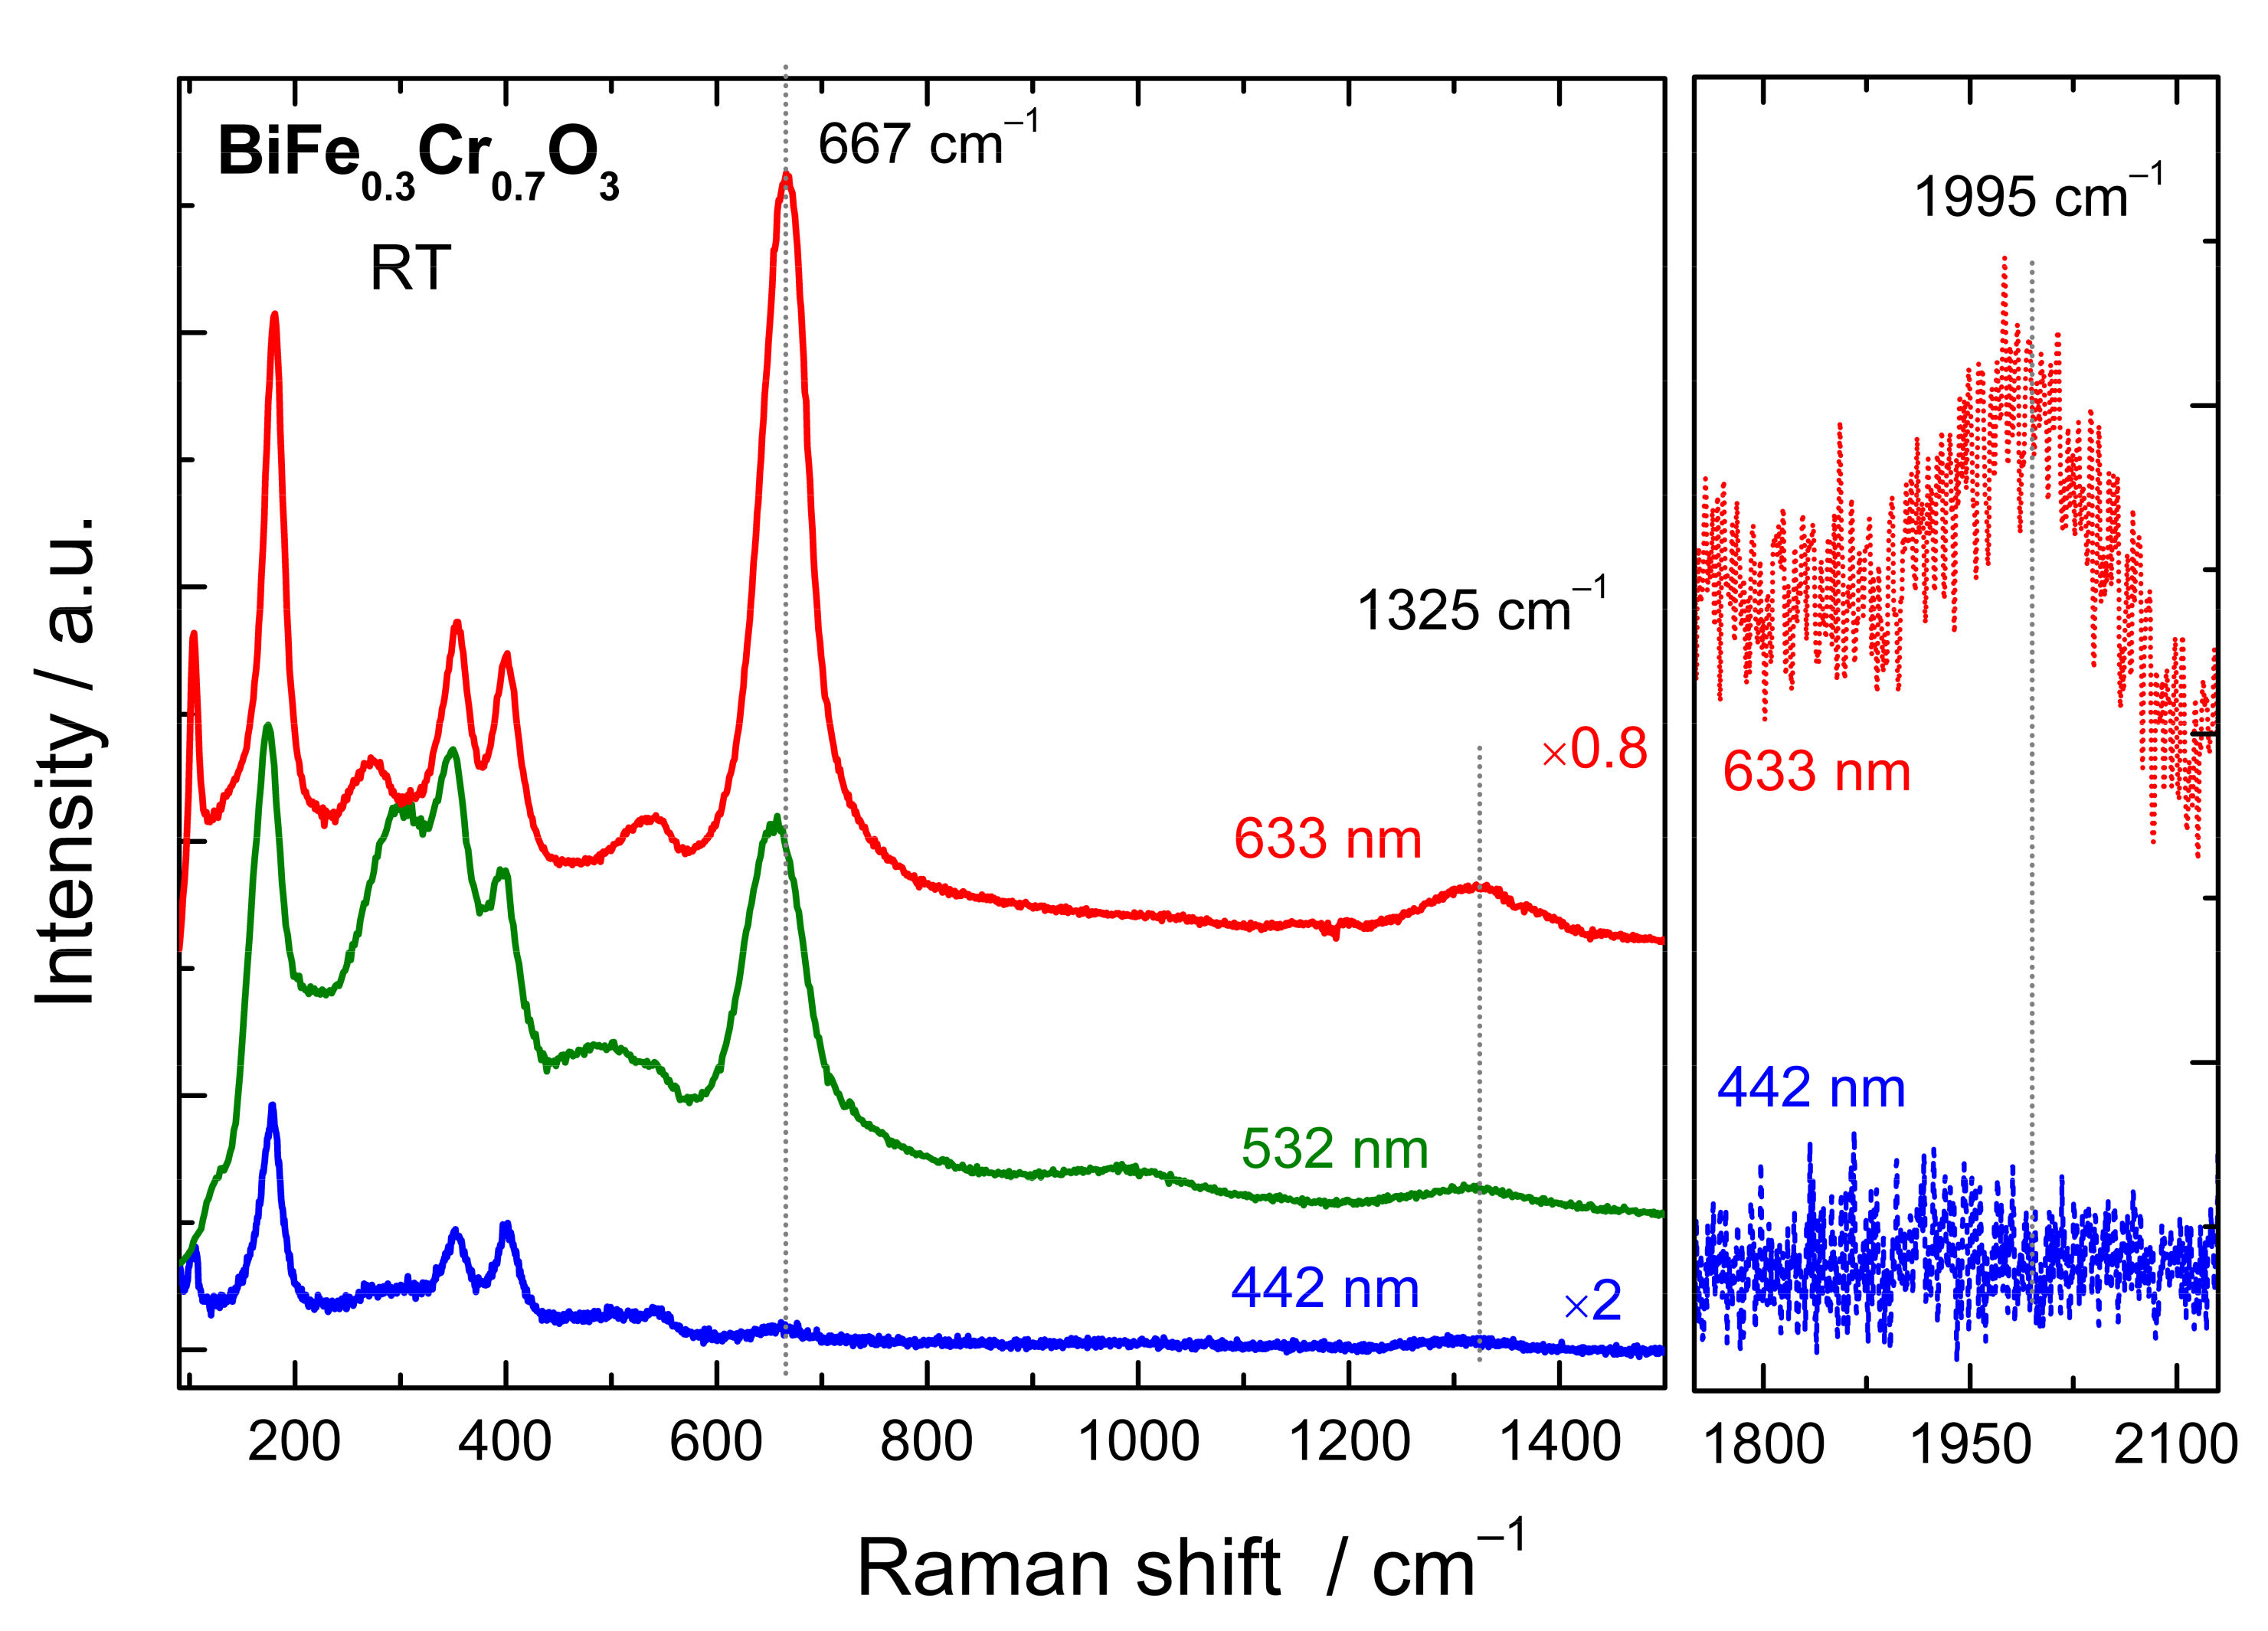
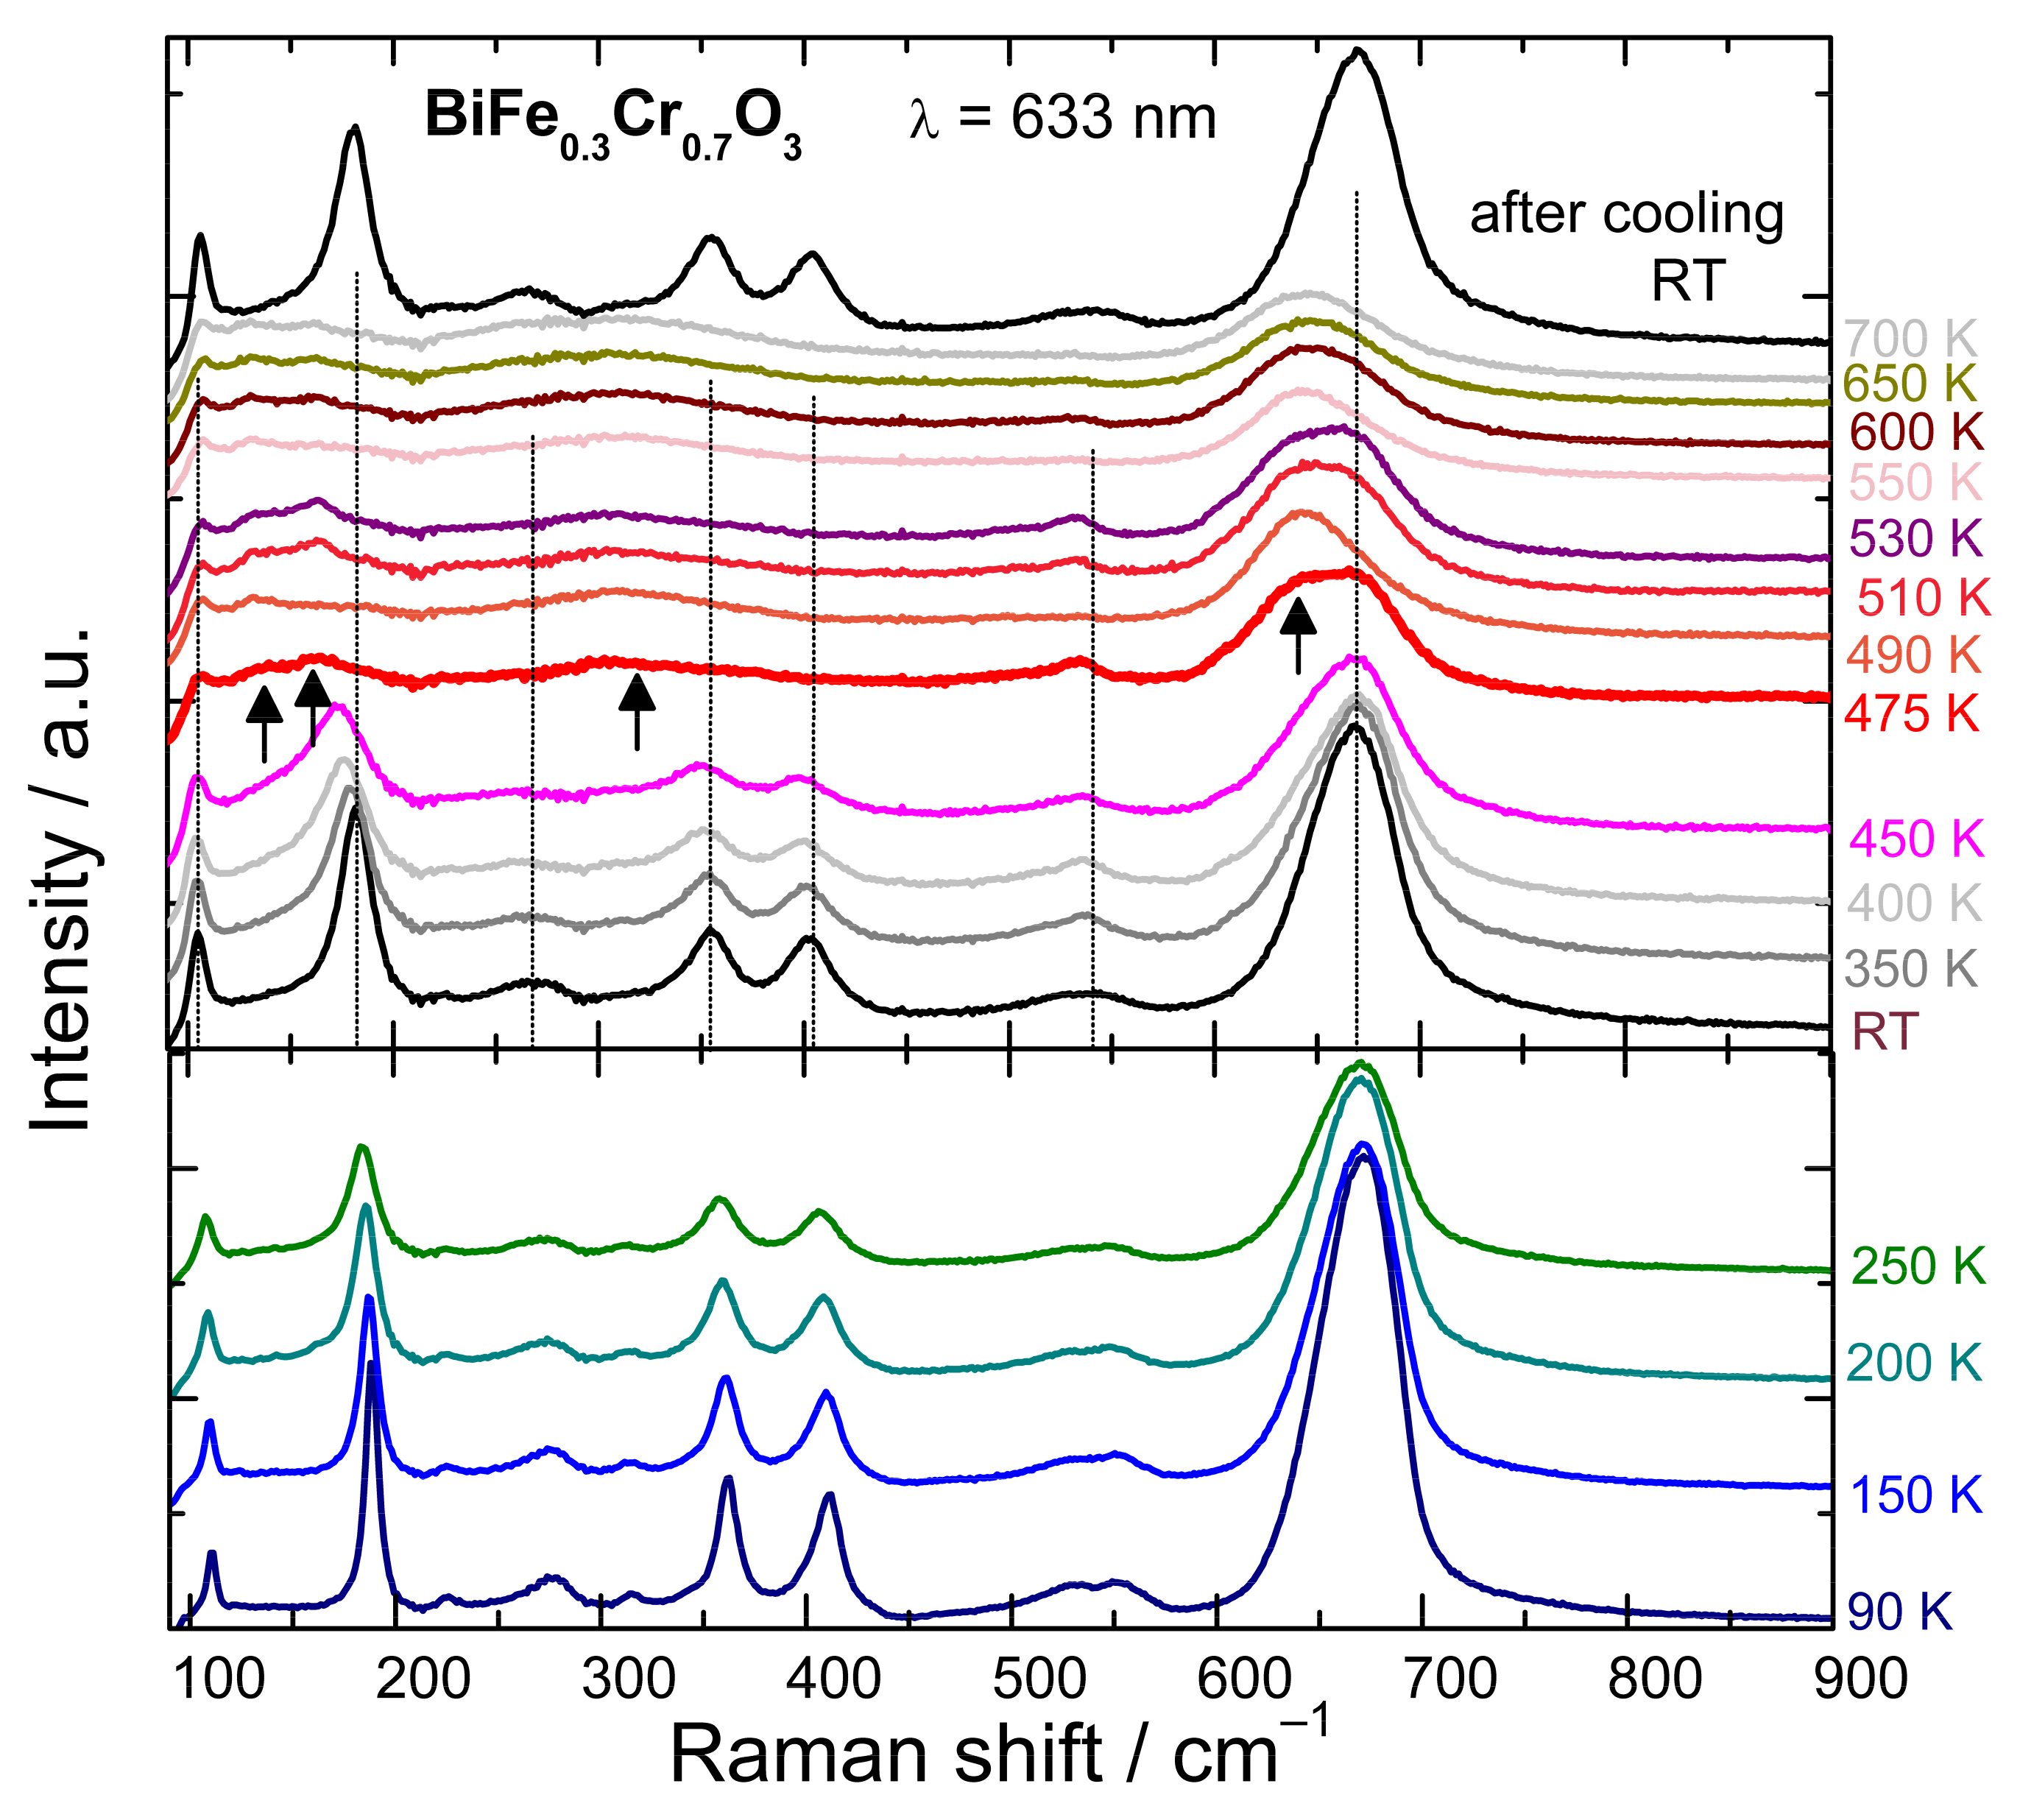
3.2. Raman Spectroscopy
4. Conclusions
Supplementary Materials
Author Contributions
Funding
Institutional Review Board Statement
Informed Consent Statement
Data Availability Statement
Acknowledgments
Conflicts of Interest
References
- Baettig, P.; Spaldin, N.A. Ab initio prediction of a multiferroic with large polarization and magnetization. Appl. Phys. Lett. 2005, 86, 012505. [Google Scholar] [CrossRef] [Green Version]
- Baettig, P.; Ederer, C.; Spaldin, N.A. First principles study of the multiferroics BiFeO3, Bi2FeCrO6, and BiCrO3: Structure, polarization, and magnetic ordering temperature. Phys. Rev. B 2005, 72, 214105. [Google Scholar] [CrossRef] [Green Version]
- Nechache, R.; Harnagea, C.; Pignolet, A.; Normandin, F.; Veres, T.; Carignan, L.P.; Ménard, D. Growth, structure, and properties of epitaxial thin films of first-principles predicted multiferroic Bi2FeCrO6. Appl. Phys. Lett. 2006, 89, 102902. [Google Scholar] [CrossRef] [Green Version]
- Nechache, R.; Harnagea, C.; Pignolet, A.; Carignan, L.P.; Ménard, D. Epitaxial Bi2FeCrO6 multiferroic thin films. Philos. Mag. Lett. 2007, 87, 231–240. [Google Scholar] [CrossRef] [Green Version]
- Nechache, R.; Harnagea, C.; Carignan, L.-P.; Gautreau, O.; Pintilie, L.; Singh, M.P.; Ménard, D.; Fournier, P.; Alexe, M.; Pignolet, A. Epitaxial thin films of the multiferroic double perovskite Bi2FeCrO6 grown on (100)-oriented SrTiO3 substrates: Growth, characterization, and optimization. J. Appl. Phys. 2009, 105, 061621. [Google Scholar] [CrossRef] [Green Version]
- Nechache, R.; Rosei, F. Recent progress in nanostructured multiferroic Bi2FeCrO6 thin films. J. Solid State Chem. 2012, 189, 13–20. [Google Scholar] [CrossRef]
- Sha, L.; Miao, J.; Wu, S.Z.; Xu, X.G.; Jiang, Y.; Qiao, L.J. Double-perovskite multiferroic Bi2FeCrO6 polycrystalline thin film: The structural, multiferroic, and ferroelectric domain properties. J. Alloys Compd. 2013, 554, 299–303. [Google Scholar] [CrossRef]
- Wu, H.; Pei, Z.; Xia, W.; Lu, Y.; Leng, K.; Zhu, X. Structural, magnetic, dielectric and optical properties of double-perovskite Bi2FeCrO6 ceramics synthesized under high pressure. J. Alloys Compd. 2020, 819, 153007. [Google Scholar] [CrossRef]
- Nechache, R.; Harnagea, C.; Li, S.; Cardenas, L.; Huang, W.; Chakrabartty, J.; Rosei, F. Bandgap tuning of multiferroic oxide solar cells. Nat. Photonics 2015, 9, 61–67. [Google Scholar] [CrossRef]
- Li, S.; AlOtaibi, B.; Huang, W.; Mi, Z.; Serpone, N.; Nechache, R.; Rosei, F. Epitaxial Bi2FeCrO6 Multiferroic Thin Film as a New Visible Light Absorbing Photocathode Material. Small 2015, 32, 4018–4026. [Google Scholar] [CrossRef]
- Nechache, R.; Huang, W.; Li, S.; Rosei, F. Photovoltaic properties of Bi2FeCrO6 films epitaxially grown on (100)-oriented silicon substrates. Nanoscale 2016, 8, 3237–3243. [Google Scholar] [CrossRef] [Green Version]
- Quattropani, A.; Stoeffler, D.; Fix, T.; Schmerber, G.; Lenertz, M.; Versini, G.; Rehspringer, J.L.; Slaoui, A.; Dinia, A.; Colis, S. Band-Gap Tuning in Ferroelectric Bi2FeCrO6 Double Perovskite Thin Films. J. Phys. Chem. C 2017, 122, 1070–1077. [Google Scholar] [CrossRef]
- Quattropani, A.; Makhort, A.S.; Rastei, M.V.; Versini, G.; Schmerber, G.; Barre, S.; Dinia, A.; Slaoui, A.; Rehspringer, J.-L.; Fix, T.; et al. Tuning photovoltaic response in Bi2FeCrO6 films by ferroelectric poling. Nanoscale 2018, 10, 13761–13766. [Google Scholar] [CrossRef] [Green Version]
- Tablero, C. Photovoltaic application of the multiferroic Bi2FeCrO6 double perovskite. Sol. Energy 2016, 137, 173–178. [Google Scholar] [CrossRef] [Green Version]
- Guo, K.; Wang, X.; Zhang, R.; Fu, Z.; Zhang, L.; Ma, G.; Deng, C. Multiferroic oxide BFCNT/BFCO heterojunction black silicon photovoltaic devices. Light Sci. Appl. 2021, 10, 201. [Google Scholar] [CrossRef]
- Zhang, S.; Xiao, H.Y.; Peng, S.M.; Yang, G.X.; Liu, Z.J.; Zu, X.T.; Li, S.; Singh, D.J.; Martin, L.W.; Qiao, L. Band-Gap Reduction in (BiCrO3)m/(BiFeO3)n Superlattices: Designing Low-Band-Gap Ferroelectrics. Phys. Rev. Appl. 2018, 10, 044004. [Google Scholar] [CrossRef] [Green Version]
- Kamba, S.; Nuzhnyy, D.; Nechache, R.; Závěta, K.; Nižňanský, D.; Šantavá, E.; Harnagea, C.; Pignolet, A. Infrared and magnetic characterization of multiferroic Bi2FeCrO6 thin films over a broad temperature range. Phys. Rev. B 2008, 77, 104111. [Google Scholar] [CrossRef] [Green Version]
- Meng, D.; Kang, T.; Bi, L.; Zhang, H.; Zhai, J.; Bai, F. Temperature-driven structural phase transition in double perovskite Bi2FeCrO6 films. Appl. Phys. Express 2020, 13, 011008. [Google Scholar] [CrossRef]
- Kolhatkar, G.; Ambriz-Vargas, F.; Thomas, R.; Ruediger, A. Microwave-Assisted Hydrothermal Synthesis of BiFexCr1–xO3 Ferroelectric Thin Films. Cryst. Growth Des. 2017, 17, 5697–5703. [Google Scholar] [CrossRef]
- Himcinschi, C.; Vrejoiu, I.; Friedrich, M.; Ding, L.; Cobet, C.; Esser, N.; Alexe, M.; Zahn, D.R.T. Optical characterisation of BiFeO3 epitaxial thin films grown by pulsed-laser deposition. Phys. Status Solidi C 2010, 7, 296–299. [Google Scholar] [CrossRef]
- Azzam, R.M.A.; Bashara, N.M. Ellipsometry and Polarized Light; Elsevier: Amsterdam, The Netherlands, 1987; pp. 269–275. [Google Scholar]
- Tauc, J.; Grigorovici, R.; Vancu, A. Optical Properties and Electronic Structure of Amorphous Germanium. Phys. Status Solidi B 1966, 15, 627–637. [Google Scholar] [CrossRef]
- Himcinschi, C.; Bhatnagar, A.; Talkenberger, A.; Barchuk, M.; Zahn, D.R.T.; Rafaja, D.; Kortus, J.; Alexe, M. Optical properties of epitaxial BiFeO3 thin films grown on LaAlO3. Appl. Phys. Lett. 2015, 106, 012908. [Google Scholar] [CrossRef] [Green Version]
- Himcinschi, C.; Vrejoiu, I.; Friedrich, M.; Nikulina, E.; Ding, L.; Cobet, C.; Esser, N.; Alexe, M.; Rafaja, D.; Zahn, D.R.T. Substrate influence on the optical and structural properties of pulsed laser deposited BiFeO3 epitaxial films. J. Appl. Phys. 2010, 107, 123524. [Google Scholar] [CrossRef]
- Himcinschi, C.; Vrejoiu, I.; Weißbach, T.; Vijayanandhini, K.; Talkenberger, A.; Röder, C.; Bahmann, S.; Zahn, D.R.T.; Belik, A.A.; Rafaja, D.; et al. Raman spectra and dielectric function of BiCrO3: Experimental and first-principles studies. J. Appl. Phys. 2011, 110, 073501. [Google Scholar] [CrossRef]
- Rastei, M.V.; Gellé, F.; Schmerber, G.; Quattropani, A.; Fix, T.; Dinia, A.; Slaoui, A.; Colis, S. Thickness Dependence and Strain Effects in Ferroelectric Bi2FeCrO6 Thin Films. ACS Appl. Energy Mater. 2019, 2, 8550–8559. [Google Scholar] [CrossRef]
- Huang, W.; Harnagea, C.; Benetti, D.; Chaker, M.; Rosei, F.; Nechache, R. Multiferroic Bi2FeCrO6 based p–i–n heterojunction photovoltaic devices. J. Mater. Chem. A 2017, 5, 10355–10364. [Google Scholar] [CrossRef]
- Meng, D.; Xiao, Y.; He, H.; Liao, Y.; Zhang, H.; Zhai, J.; Chen, Z.; Martin, L.W.; Bai, F. Enhanced spontaneous polarization in double perovskite Bi2FeCrO6 films. J. Am. Ceram. Soc. 2019, 102, 5234–5242. [Google Scholar] [CrossRef] [Green Version]
- Andreasson, J.; Holmlund, J.; Knee, C.S.; Käll, M.; Börjesson, L.; Naler, S.; Bäckström, J.; Rübhausen, M.; Azad, A.K.; Eriksson, S.G. Franck-Condon higher order lattice excitations in the LaFe1−xCrxO3 (x=0, 0.1, 0.5, 0.9, 1.0) perovskites due to Fe-Cr charge transfer effects. Phys. Rev. B 2007, 75, 104302. [Google Scholar] [CrossRef]
- Andreasson, J.; Holmlund, J.; Singer, S.G.; Knee, C.S.; Rauer, R.; Schulz, B.; Käll, M.; Rübhausen, M.; Eriksson, S.G.; Börjesson, L.; et al. Electron-lattice interactions in the perovskite LaFe0.5Cr0.5O3 characterized by optical spectroscopy and LDA+U calculations. Phys. Rev. B 2009, 80, 075103. [Google Scholar] [CrossRef]
- Kotnana, G.; Jammalamadaka, S.N. Band gap tuning and orbital mediated electron–phonon coupling in HoFe1−xCrxO3 (0 ≤ x ≤ 1). J. Appl. Phys. 2015, 118, 124101. [Google Scholar] [CrossRef] [Green Version]
- Suchomel, M.R.; Thomas, C.I.; Allix, M.; Rosseinsky, M.J.; Fogg, A.F.; Thomas, M.F. High pressure bulk synthesis and characterization of the predicted multiferroic Bi(Fe1∕2Cr1∕2)O3. Appl. Phys. Lett. 2007, 90, 112909. [Google Scholar] [CrossRef]
- McBride, B.R.; Lieschke, J.; Berlie, A.; Cortie, D.L.; Playford, H.Y.; Lu, T.; Narayanan, N.; Withers, R.L.; Yu, D.; Liu, Y. Study of the B-site ion behaviour in the multiferroic perovskite bismuth iron chromium oxide. J. Appl. Phys. 2018, 123, 154104. [Google Scholar] [CrossRef] [Green Version]
- Haumont, R.; Kreisel, J.; Bouvier, P. Raman scattering of the model multiferroic oxide BiFeO3: Effect of temperature, pressure and stress. Phase Transit. 2006, 79, 1043–1064. [Google Scholar] [CrossRef]
- Hlinka, J.; Pokorny, J.; Karimi, S.; Reaney, I.M. Angular dispersion of oblique phonon modes in BiFeO3 from micro-Raman scattering. Phys. Rev. B 2011, 83, 020101(R). [Google Scholar] [CrossRef]
- Himcinschi, C.; Rix, J.; Röder, C.; Rudolph, M.; Yang, M.-M.; Rafaja, D.; Kortus, J.; Alexe, M. Ferroelastic domain identification in BiFeO3 crystals using Raman spectroscopy. Sci. Rep. 2019, 9, 379. [Google Scholar] [CrossRef] [Green Version]
- Deng, H.; Deng, H.; Yang, P.; Chu, J. Effect of Cr doping on the structure, optical and magnetic properties of multiferroic BiFeO3 thin films. J. Mater. Sci. Mater. Electron. 2012, 23, 1215–1218. [Google Scholar] [CrossRef]
- Hardcastle, F.D.; Wachs, I.E. Raman spectroscopy of chromium oxide supported on Al2O3, TiO2 and SiO2: A comparative study. J. Mol. Catal. 1988, 46, 173–186. [Google Scholar] [CrossRef]
- Weckhuysen, B.M.; Wachs, I.E. Raman spectroscopy of supported chromium oxide catalysts. Determination of chromium-oxygen bond distances and bond orders. J. Chem. Soc. Faraday Trans. 1996, 92, 1969–1973. [Google Scholar] [CrossRef] [Green Version]
- Weckhuysen, B.M.; Wachs, I.E. In Situ Raman Spectroscopy of Supported Chromium Oxide Catalysts: 18O2-16O2 Isotopic Labeling Studies. J. Phys. Chem. B 1997, 101, 2793–2796. [Google Scholar] [CrossRef] [Green Version]
- Monnereau, O.; Tortet, L.; Grigorescu, C.; Savastru, D.; Iordanescu, C.R.; Guinneton, F.; Notonier, R.; Tonetto, A.; Zhang, T.; Mihailescu, I.; et al. Chromium oxides mixtures in PLD films investigated by Raman spectroscopy. J. Optoelectron. Adv. Mater. 2010, 12, 1752–1758. [Google Scholar]
- Talkenberger, A.; Himcinschi, C.; Weißbach, T.; Vijayanandhini, K.; Vrejoiu, I.; Röder, C.; Rafaja, D.; Kortus, J. Raman spectroscopic and X-ray diffraction investigations of epitaxial BiCrO3 thin films. Thin Solid Films 2012, 520, 4590–4594. [Google Scholar] [CrossRef]
- Andreasson, J.; Holmlund, J.; Rauer, R.; Käll, M.; Börjesson, L.; Knee, C.S.; Eriksson, A.K.; Eriksson, S.G.; Rübhausen, M.; Chaudhury, R.P. Electron-phonon interactions in perovskites containing Fe and Cr studied by Raman scattering using oxygen-isotope and cation substitution. Phys. Rev. B 2008, 78, 235103. [Google Scholar] [CrossRef]
- Allen, P.B.; Perebeinos, V. Self-Trapped Exciton and Franck-Condon Spectra Predicted in LaMnO3. Phys. Rev. Lett. 1999, 83, 4828–4831. [Google Scholar] [CrossRef] [Green Version]
- Krüger, R.; Schulz, B.; Naler, S.; Rauer, R.; Budelmann, D.; Bäckström, J.; Kim, K.H.; Cheong, S.W.; Perebeinos, V.; Rübhausen, M. Orbital ordering in LaMnO3 Investigated by Resonance Raman Spectroscopy. Phys. Rev. Lett. 2004, 92, 097203. [Google Scholar] [CrossRef]
- Iliev, M.N.; Hadjiev, V.G.; Litvinchuk, A.P.; Yen, F.; Wang, Y.Q.; Sun, Y.Y.; Jandl, S.; Laverdière, J.; Popov, V.N.; Gospodinov, M.M. Multiple-order Raman scattering from rare-earth manganites: Oxygen isotope and rare-earth substitution effects. Phys. Rev. B 2007, 75, 064303. [Google Scholar] [CrossRef]
- Izumi, F.; Ikeda, T. A Rietveld-analysis program RIETAN-98 and its applications to zeolites. Mater. Sci. Forum 2000, 321–324, 198–205. [Google Scholar] [CrossRef]
- Kawaguchi, S.; Takemoto, M.; Osaka, K.; Nishibori, E.; Moriyoshi, C.; Kubota, Y.; Kuroiwa, Y.; Sugimoto, K. High-throughput powder diffraction measurement system consisting of multiple MYTHEN detectors at beamline BL02B2 of SPring-8. Rev. Sci. Instrum. 2017, 88, 085111. [Google Scholar] [CrossRef]


Publisher’s Note: MDPI stays neutral with regard to jurisdictional claims in published maps and institutional affiliations. |
© 2022 by the authors. Licensee MDPI, Basel, Switzerland. This article is an open access article distributed under the terms and conditions of the Creative Commons Attribution (CC BY) license (https://creativecommons.org/licenses/by/4.0/).
Share and Cite
Himcinschi, C.; Drechsler, F.; Walch, D.S.; Bhatnagar, A.; Belik, A.A.; Kortus, J. Unexpected Phonon Behaviour in BiFexCr1−xO3, a Material System Different from Its BiFeO3 and BiCrO3 Parents. Nanomaterials 2022, 12, 1607. https://doi.org/10.3390/nano12091607
Himcinschi C, Drechsler F, Walch DS, Bhatnagar A, Belik AA, Kortus J. Unexpected Phonon Behaviour in BiFexCr1−xO3, a Material System Different from Its BiFeO3 and BiCrO3 Parents. Nanomaterials. 2022; 12(9):1607. https://doi.org/10.3390/nano12091607
Chicago/Turabian StyleHimcinschi, Cameliu, Felix Drechsler, David Sebastian Walch, Akash Bhatnagar, Alexei A. Belik, and Jens Kortus. 2022. "Unexpected Phonon Behaviour in BiFexCr1−xO3, a Material System Different from Its BiFeO3 and BiCrO3 Parents" Nanomaterials 12, no. 9: 1607. https://doi.org/10.3390/nano12091607