
How Structured Metadata Acquisition Contributes to the Reproducibility of Nanosafety Studies: Evaluation by a Round-Robin Test

 , , , , , , , and
Abstract
:
1. Introduction
2. Materials and Methods
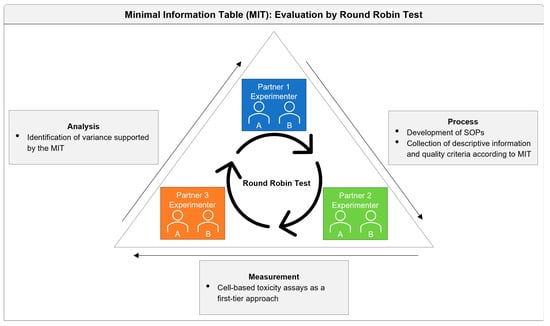
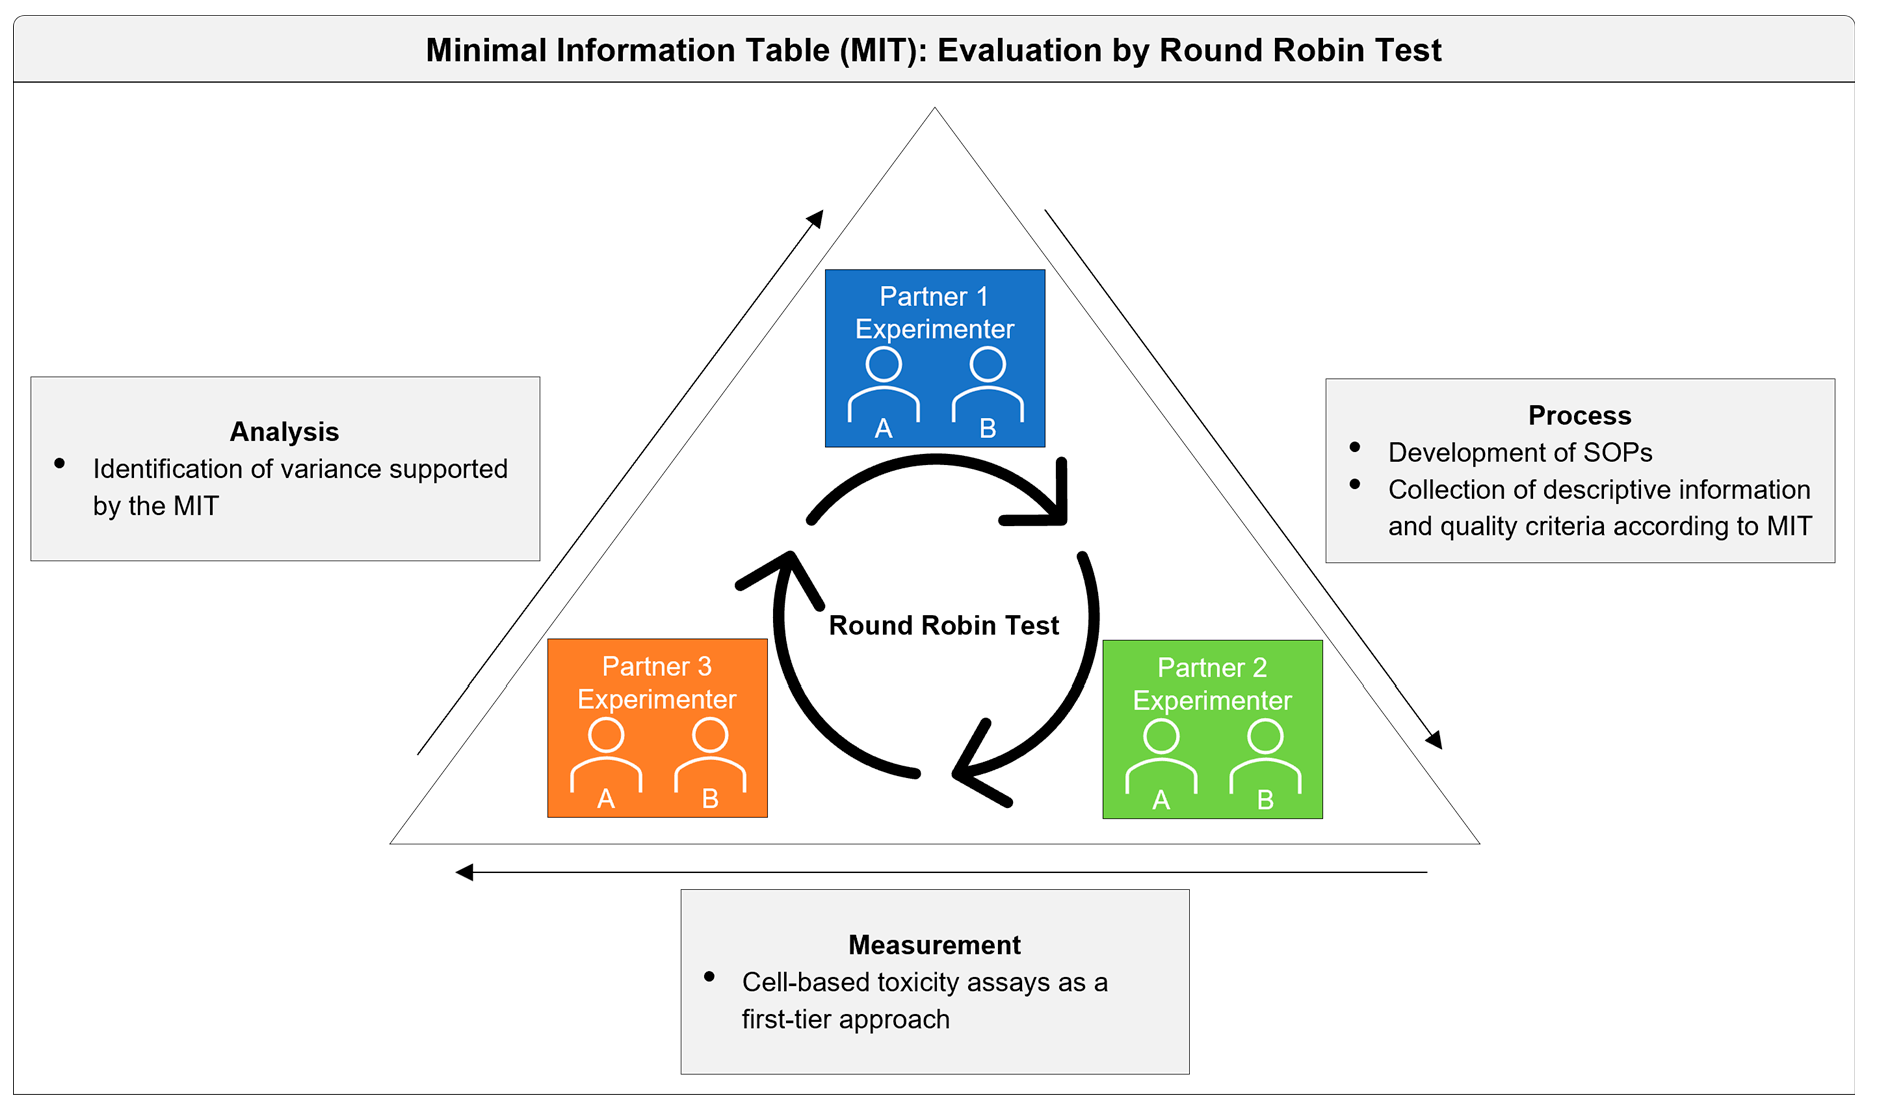
2.1. Study Design and SOP Development
2.2. Preparation of Test Materials
2.3. Sedimentation Analysis
2.4. Cell Culture
2.5. Exposure of Cells to ENMs
2.6. Viability (WST-1 Assay)
2.7. Analysis and Statistics
- Corrected absorption: To correct for unspecific medium and ENM absorption, the absorption of the medium and the ENM-containing (at the corresponding concentrations) medium at 450 nm was subtracted from the corresponding absorption values obtained in the presence of cells. The values at 450 nm were further corrected by subtraction of the reference absorption values obtained at 630 nm. To further correct for cell absorption (see SOP), the absorption of cells treated with the positive control (0.5% Triton X-100) was subtracted from the absorption values of the ENM-treated cells;
- Normalized values: The corrected quadruple ENM-treated cell sample values from each treatment group were converted to normalized values by the following equation and used for further statistical analyses:
3. Results
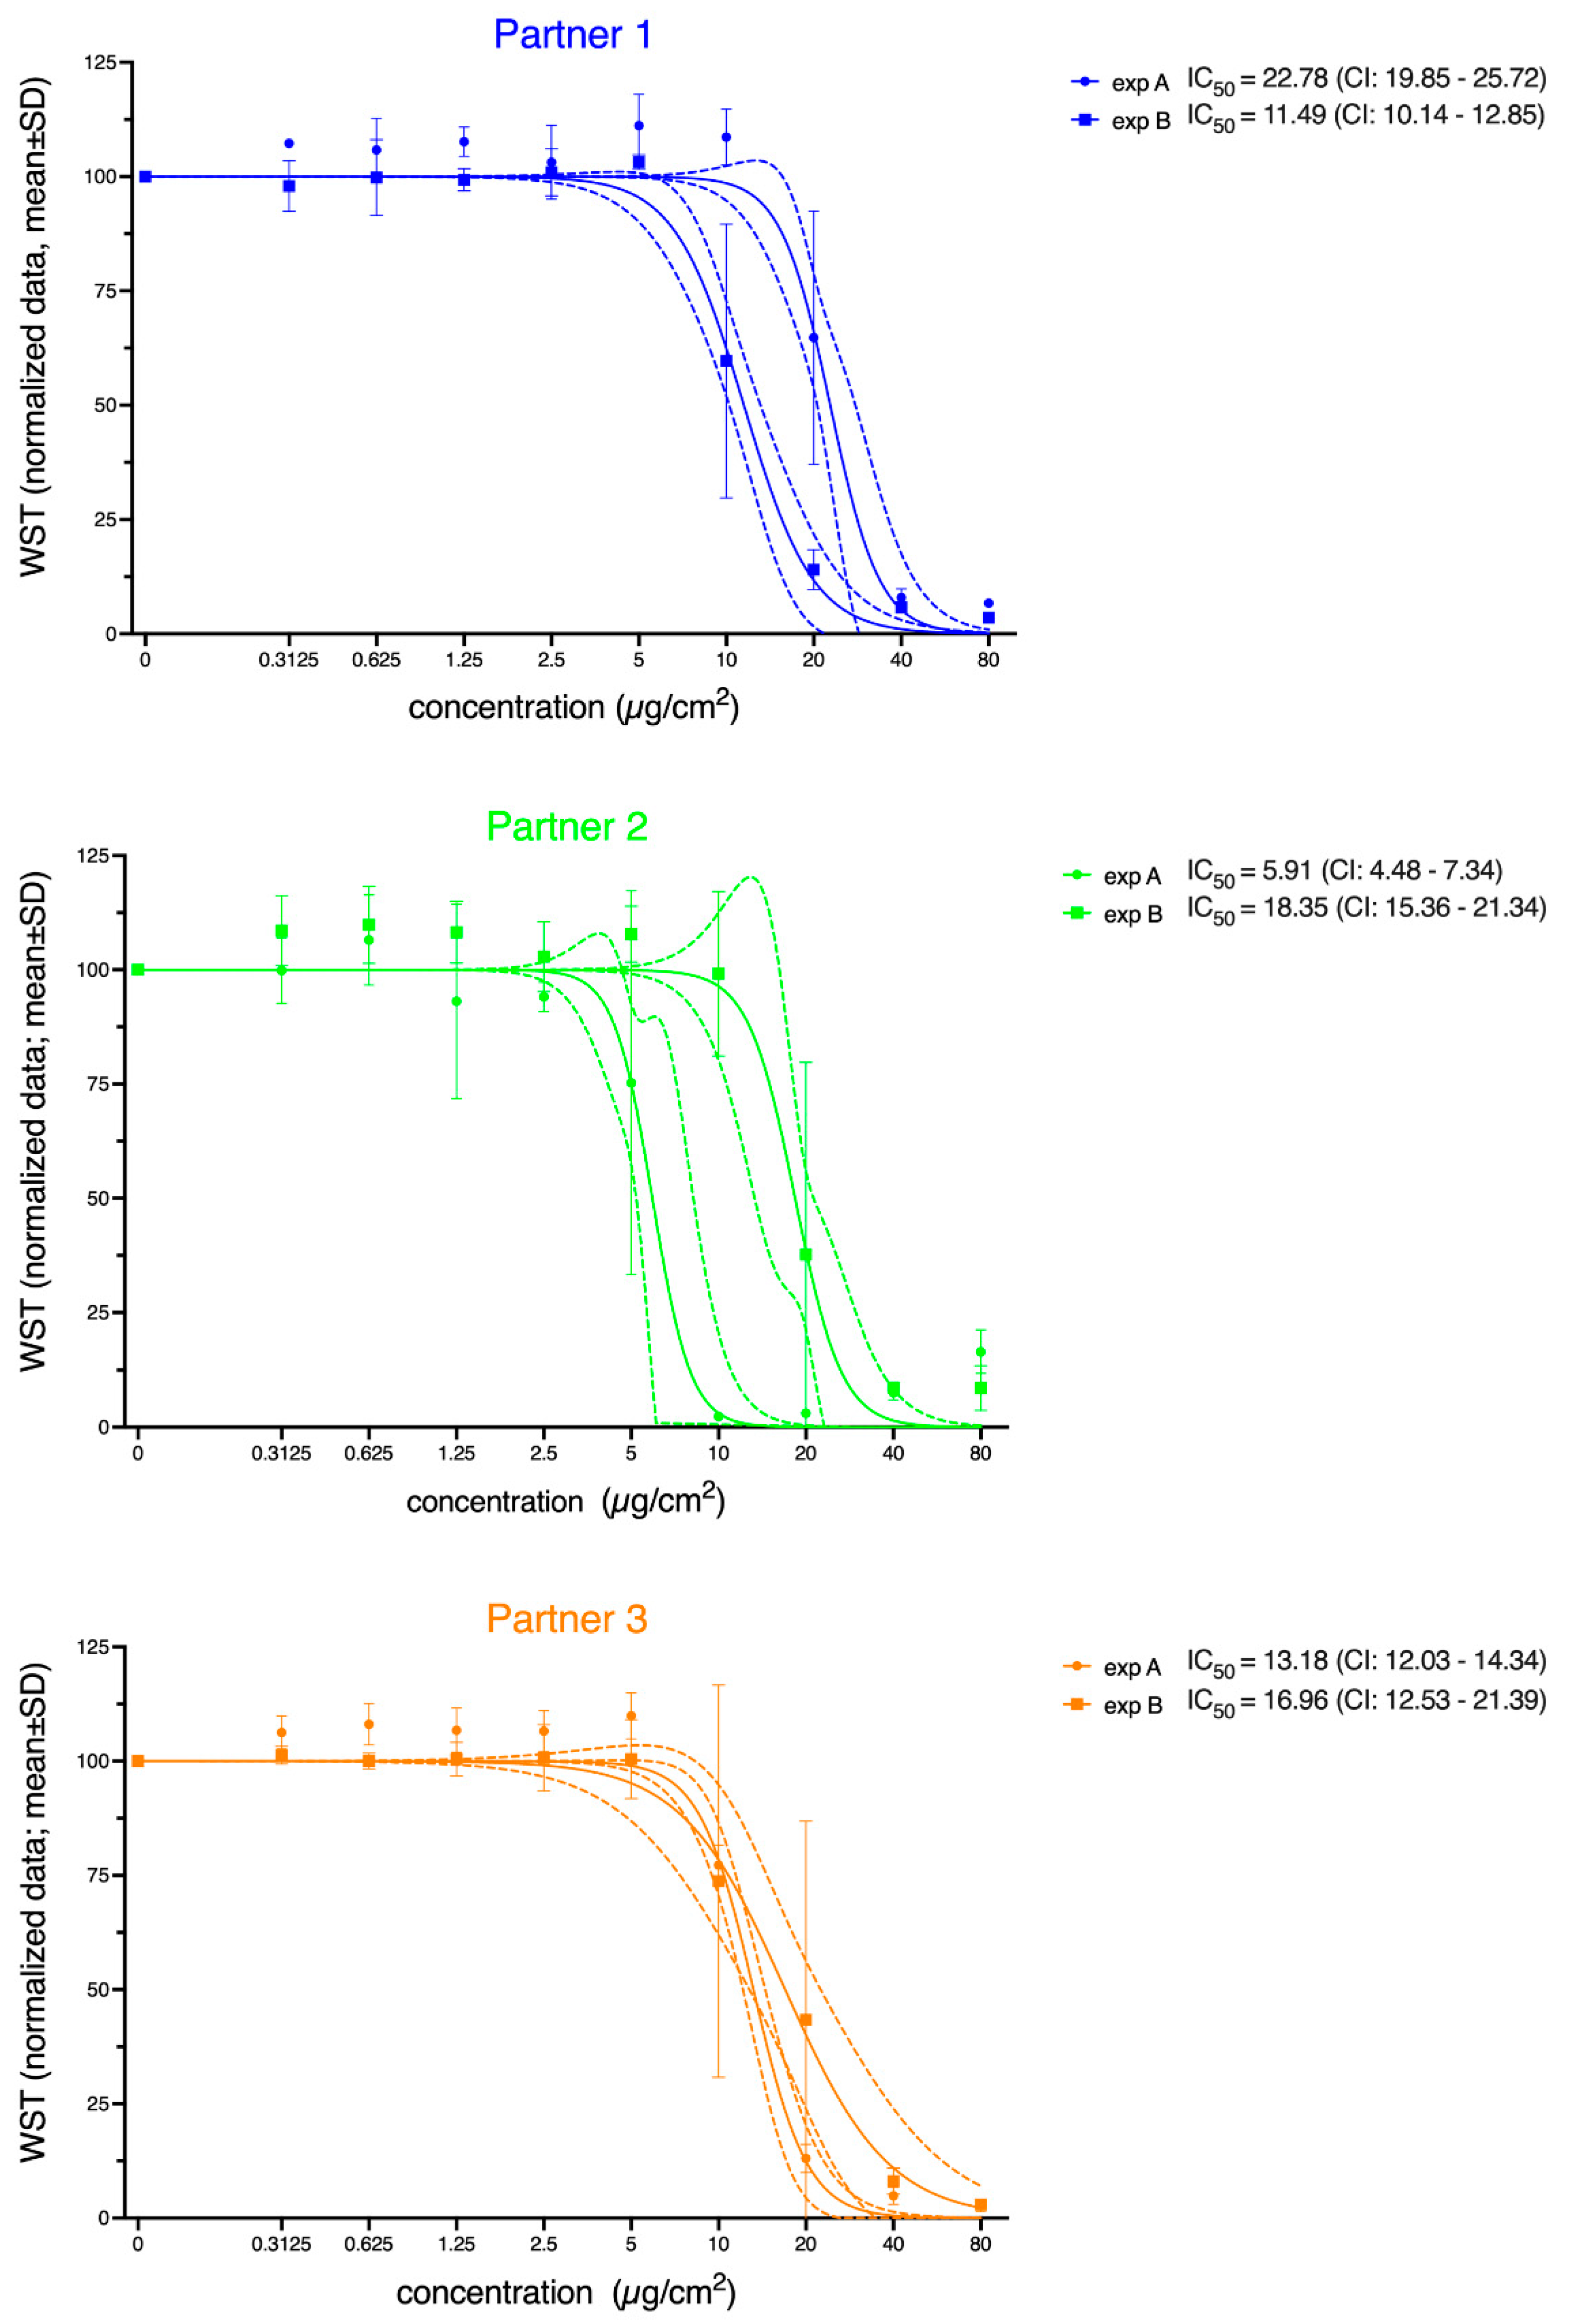
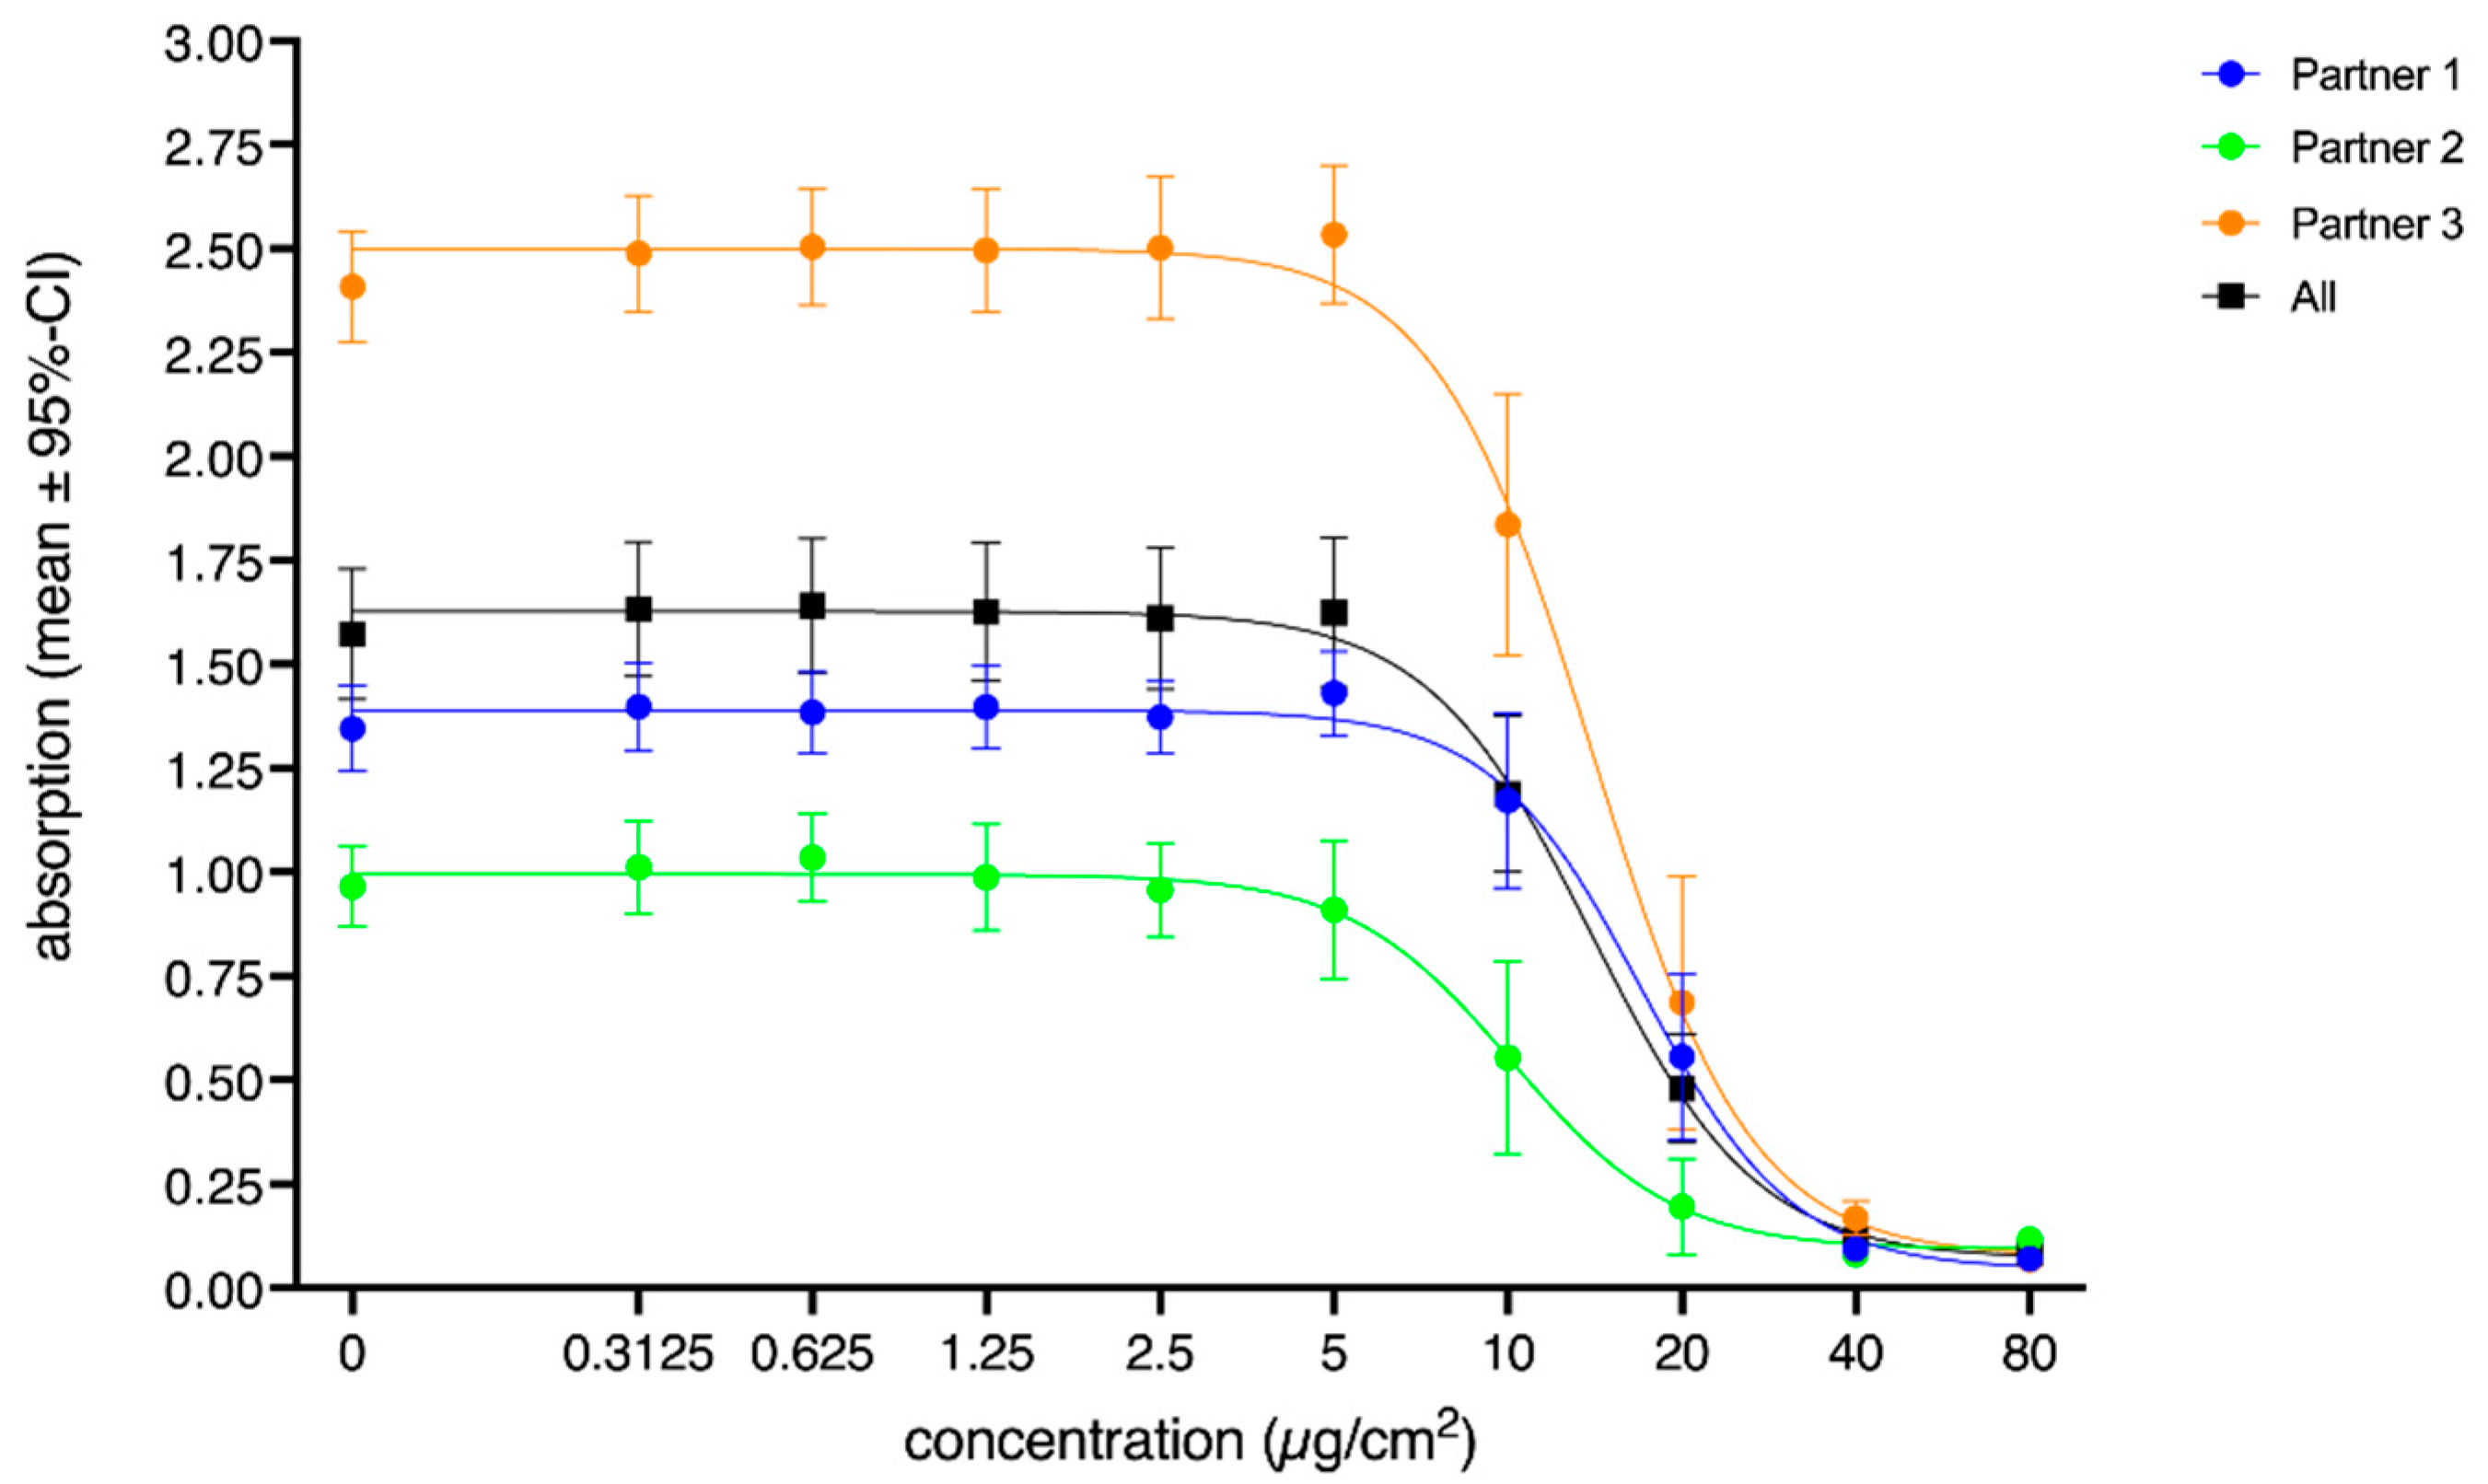
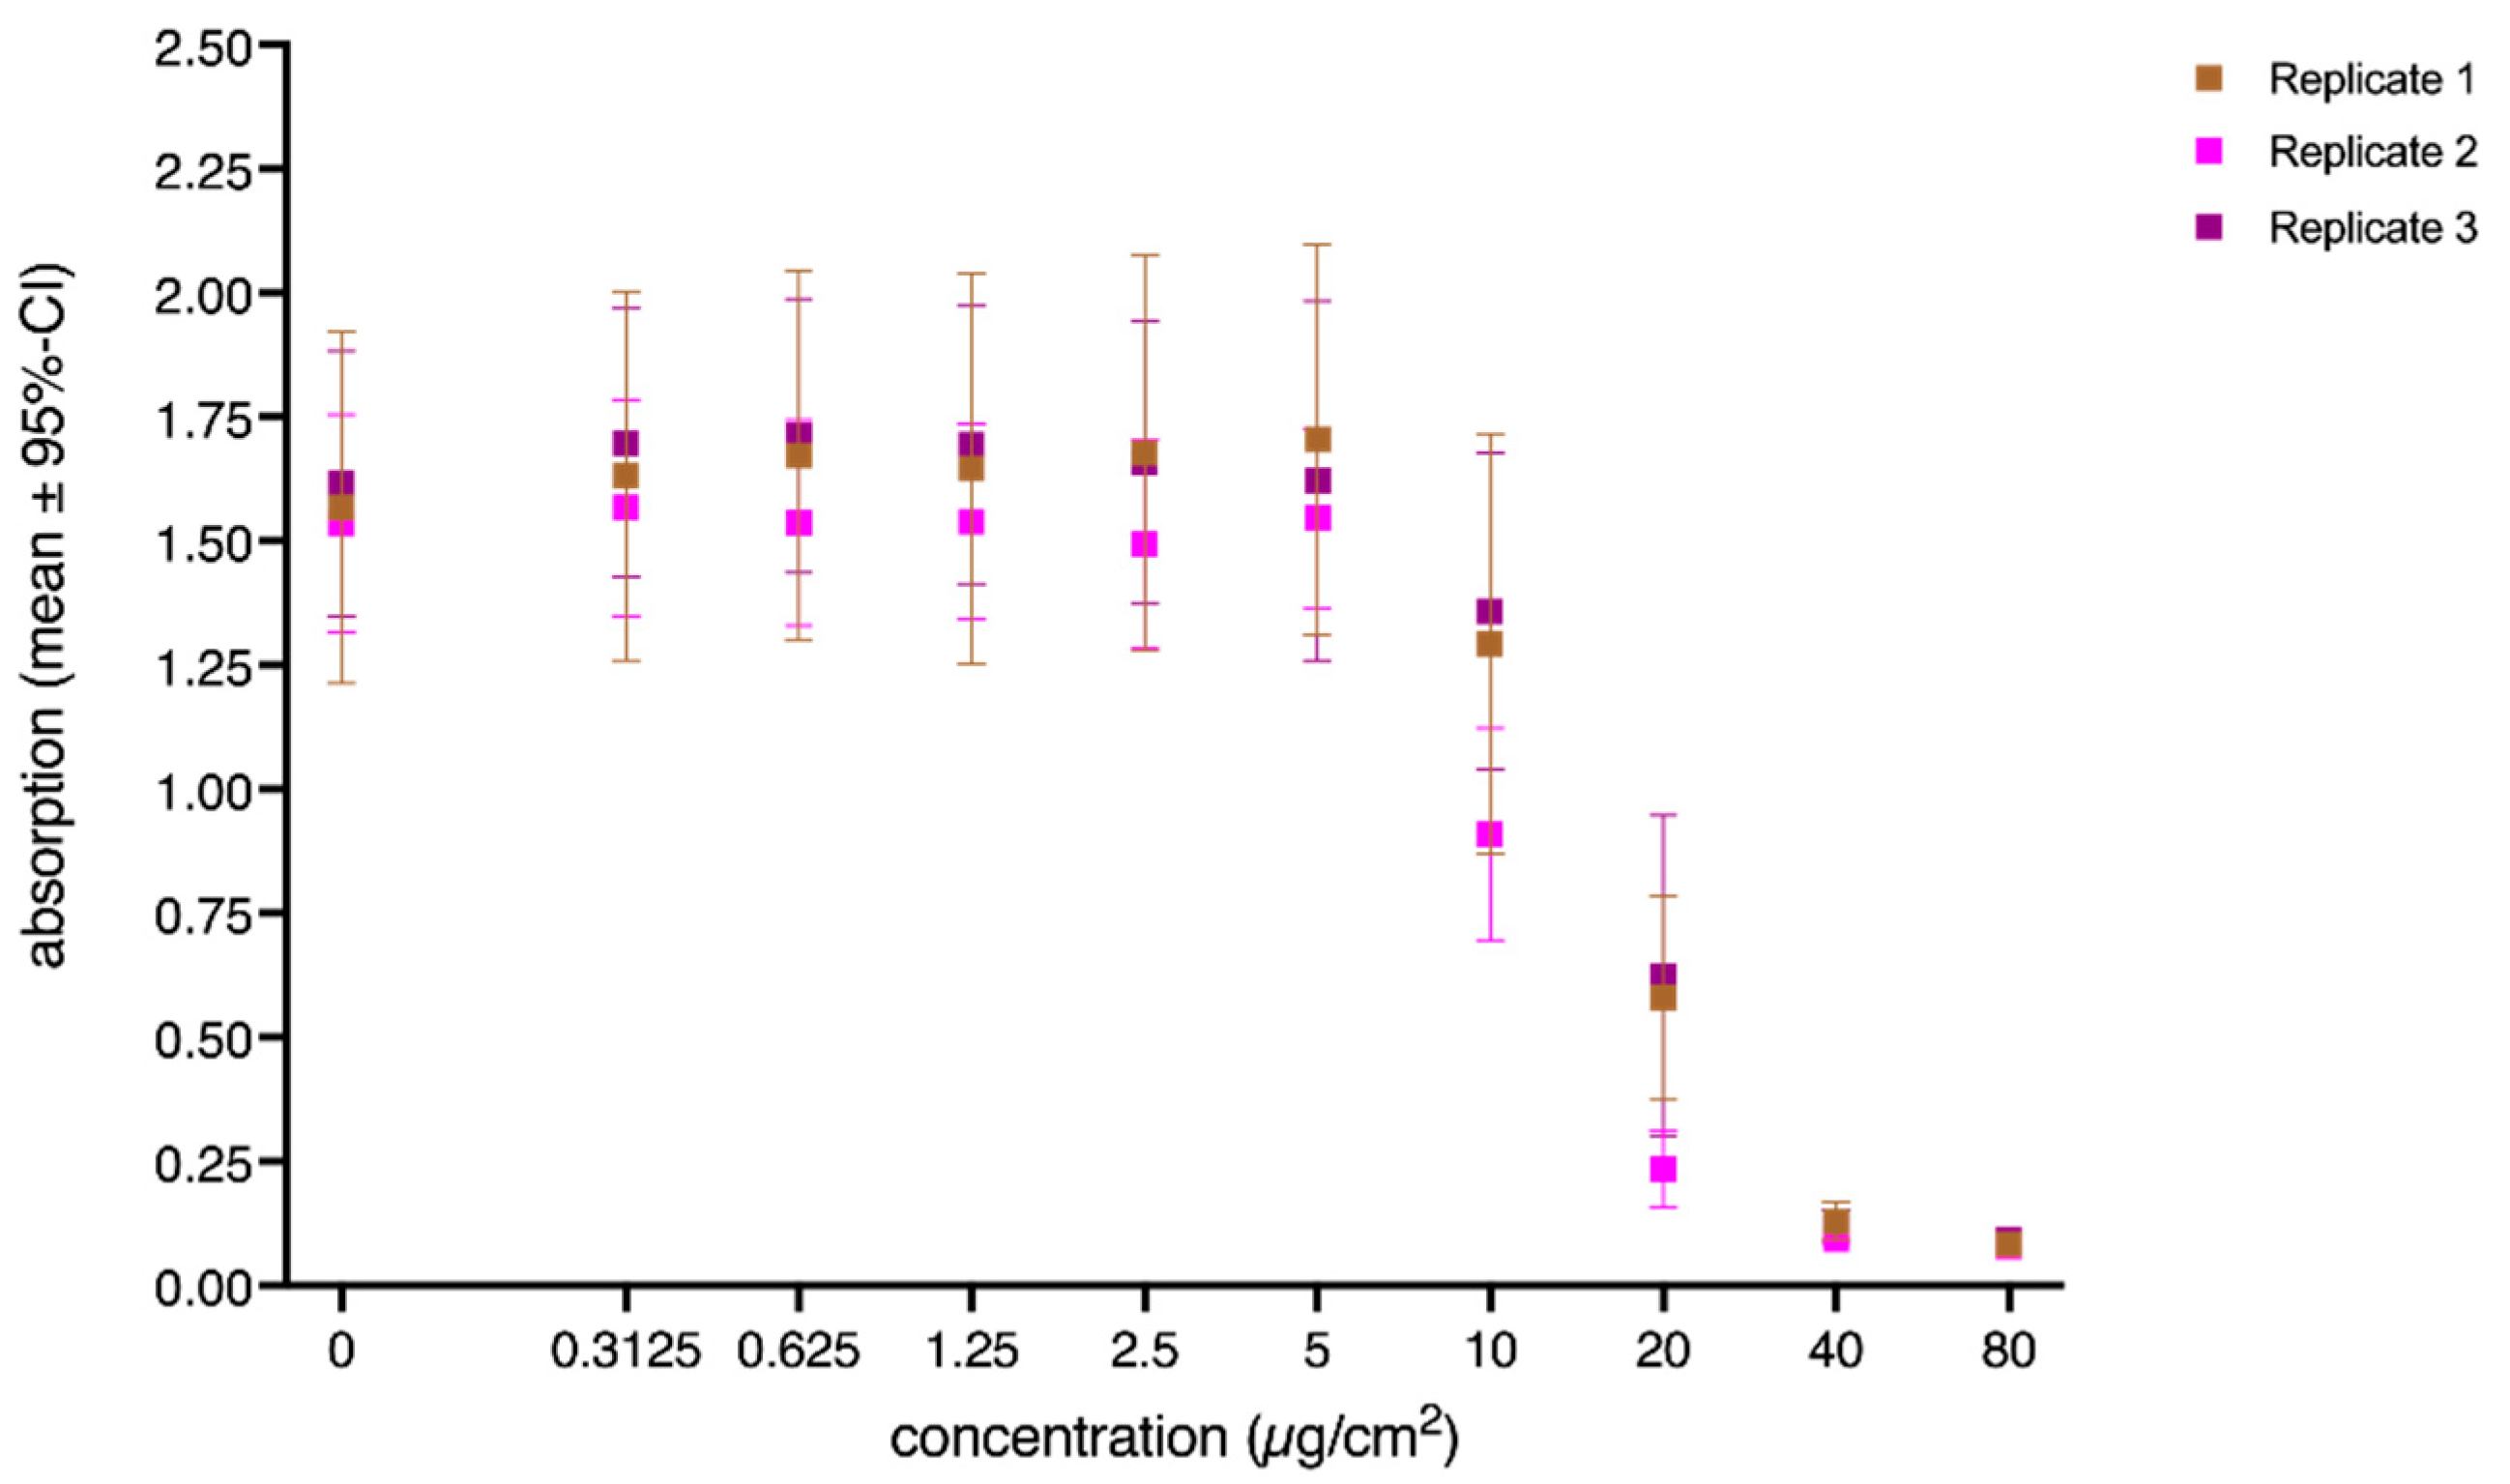
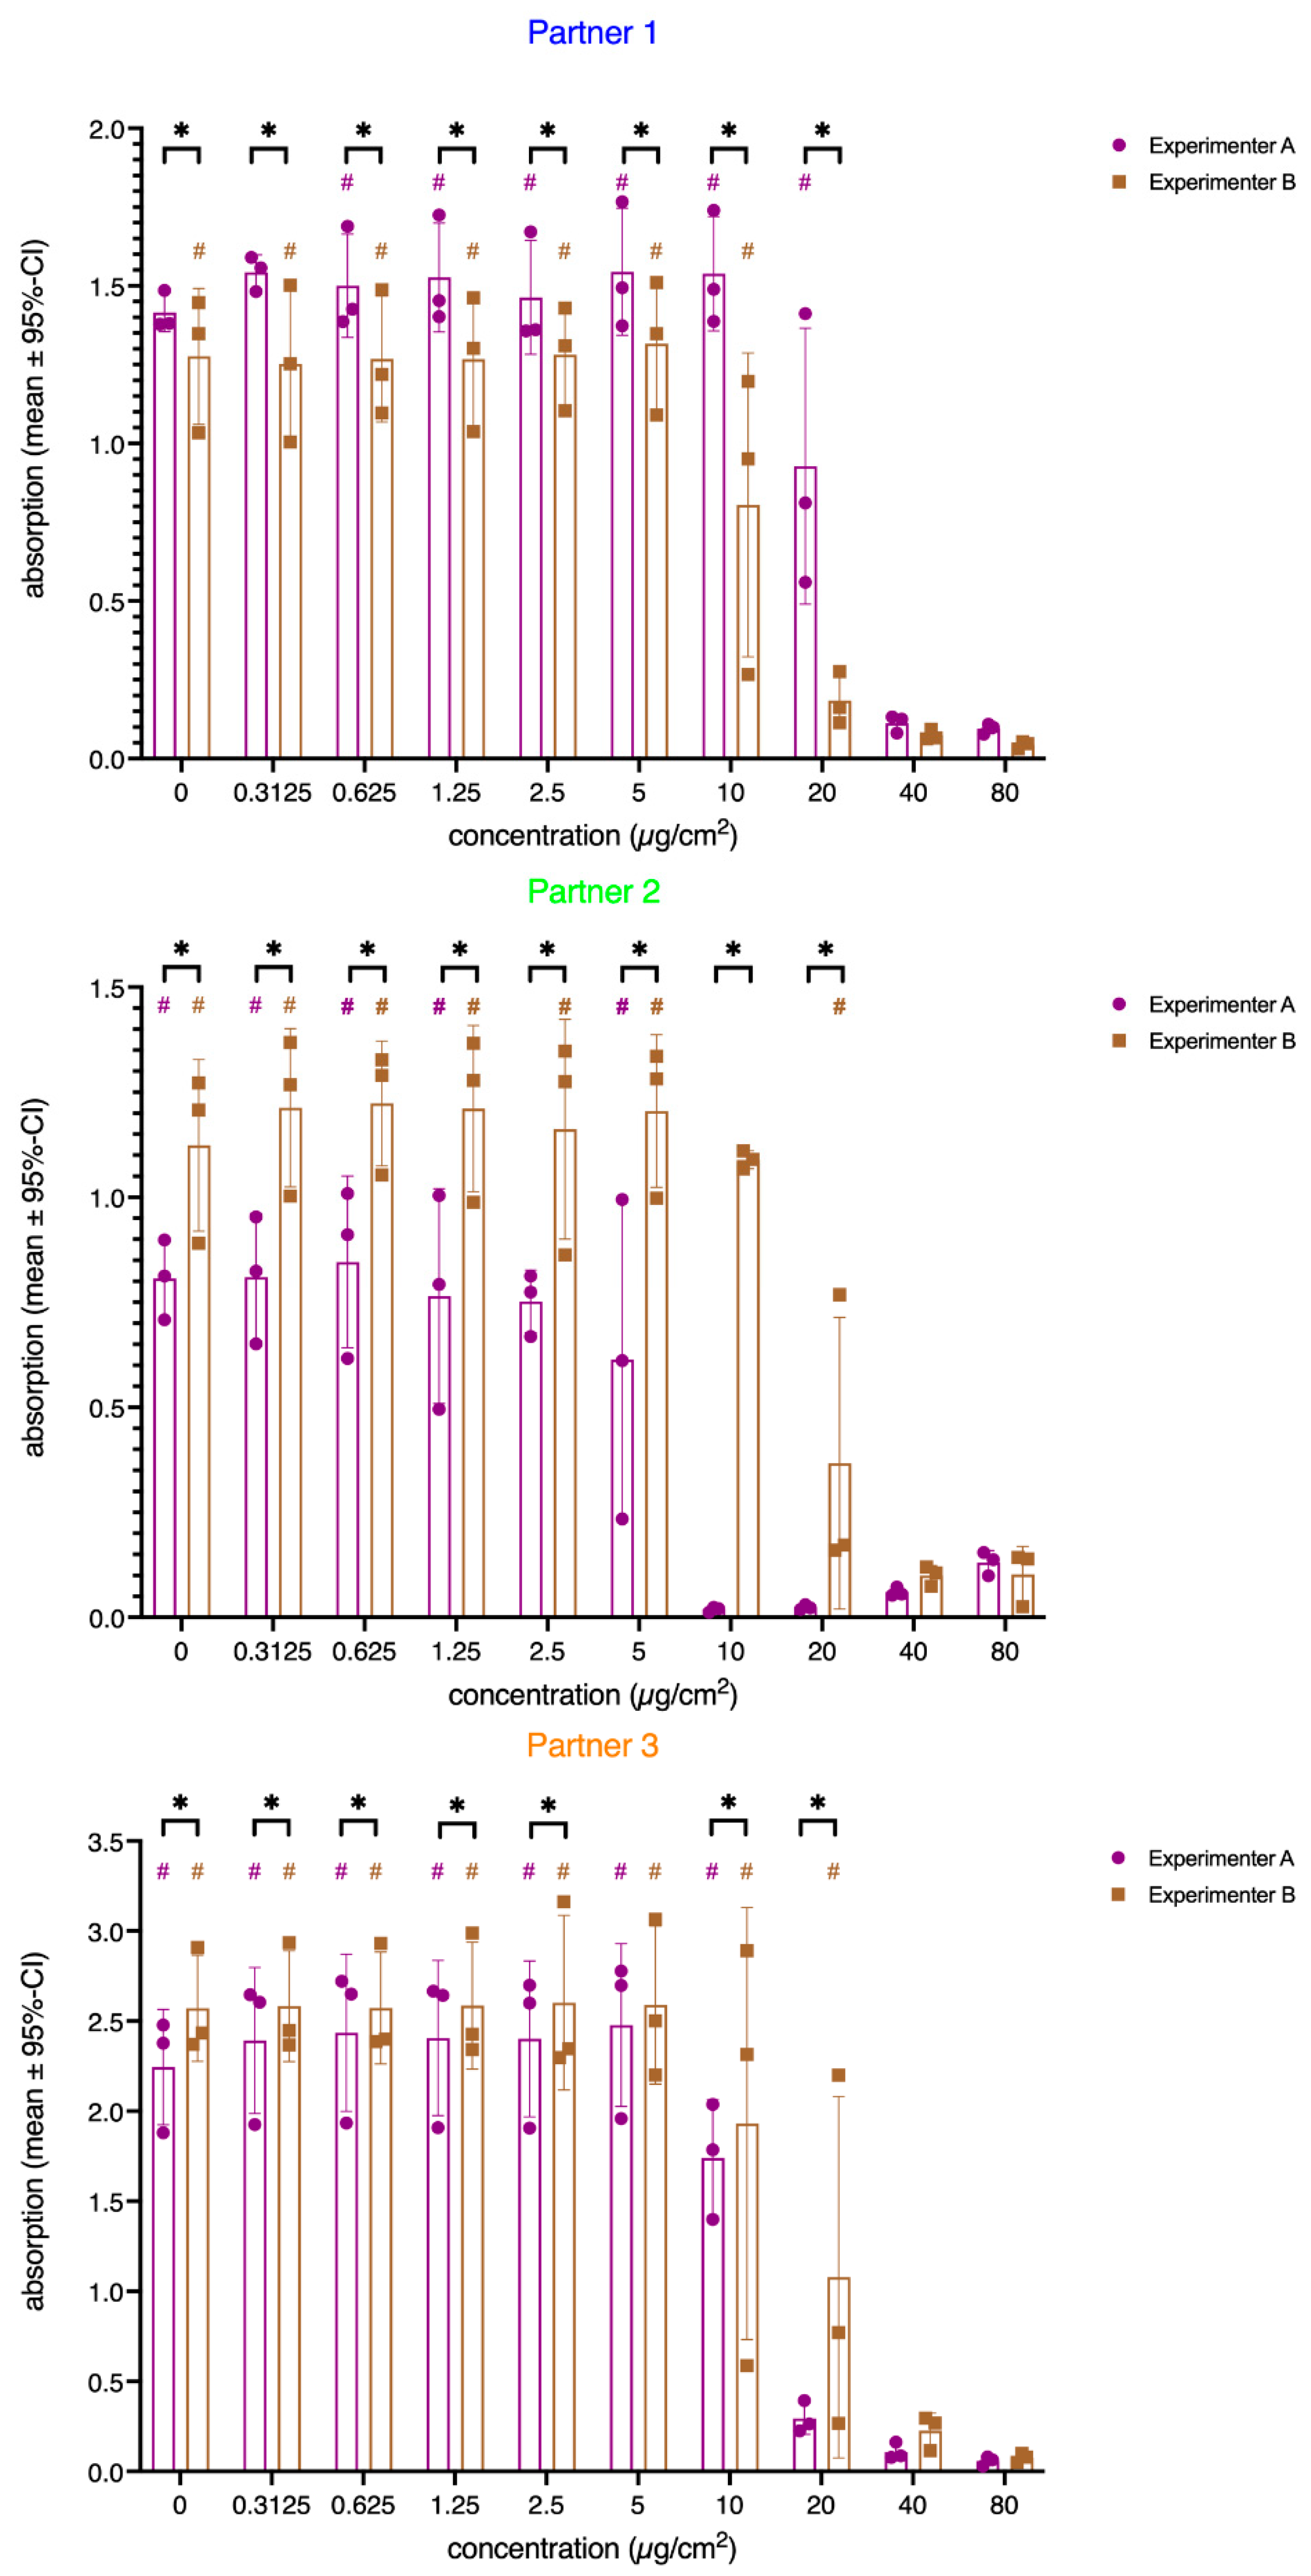
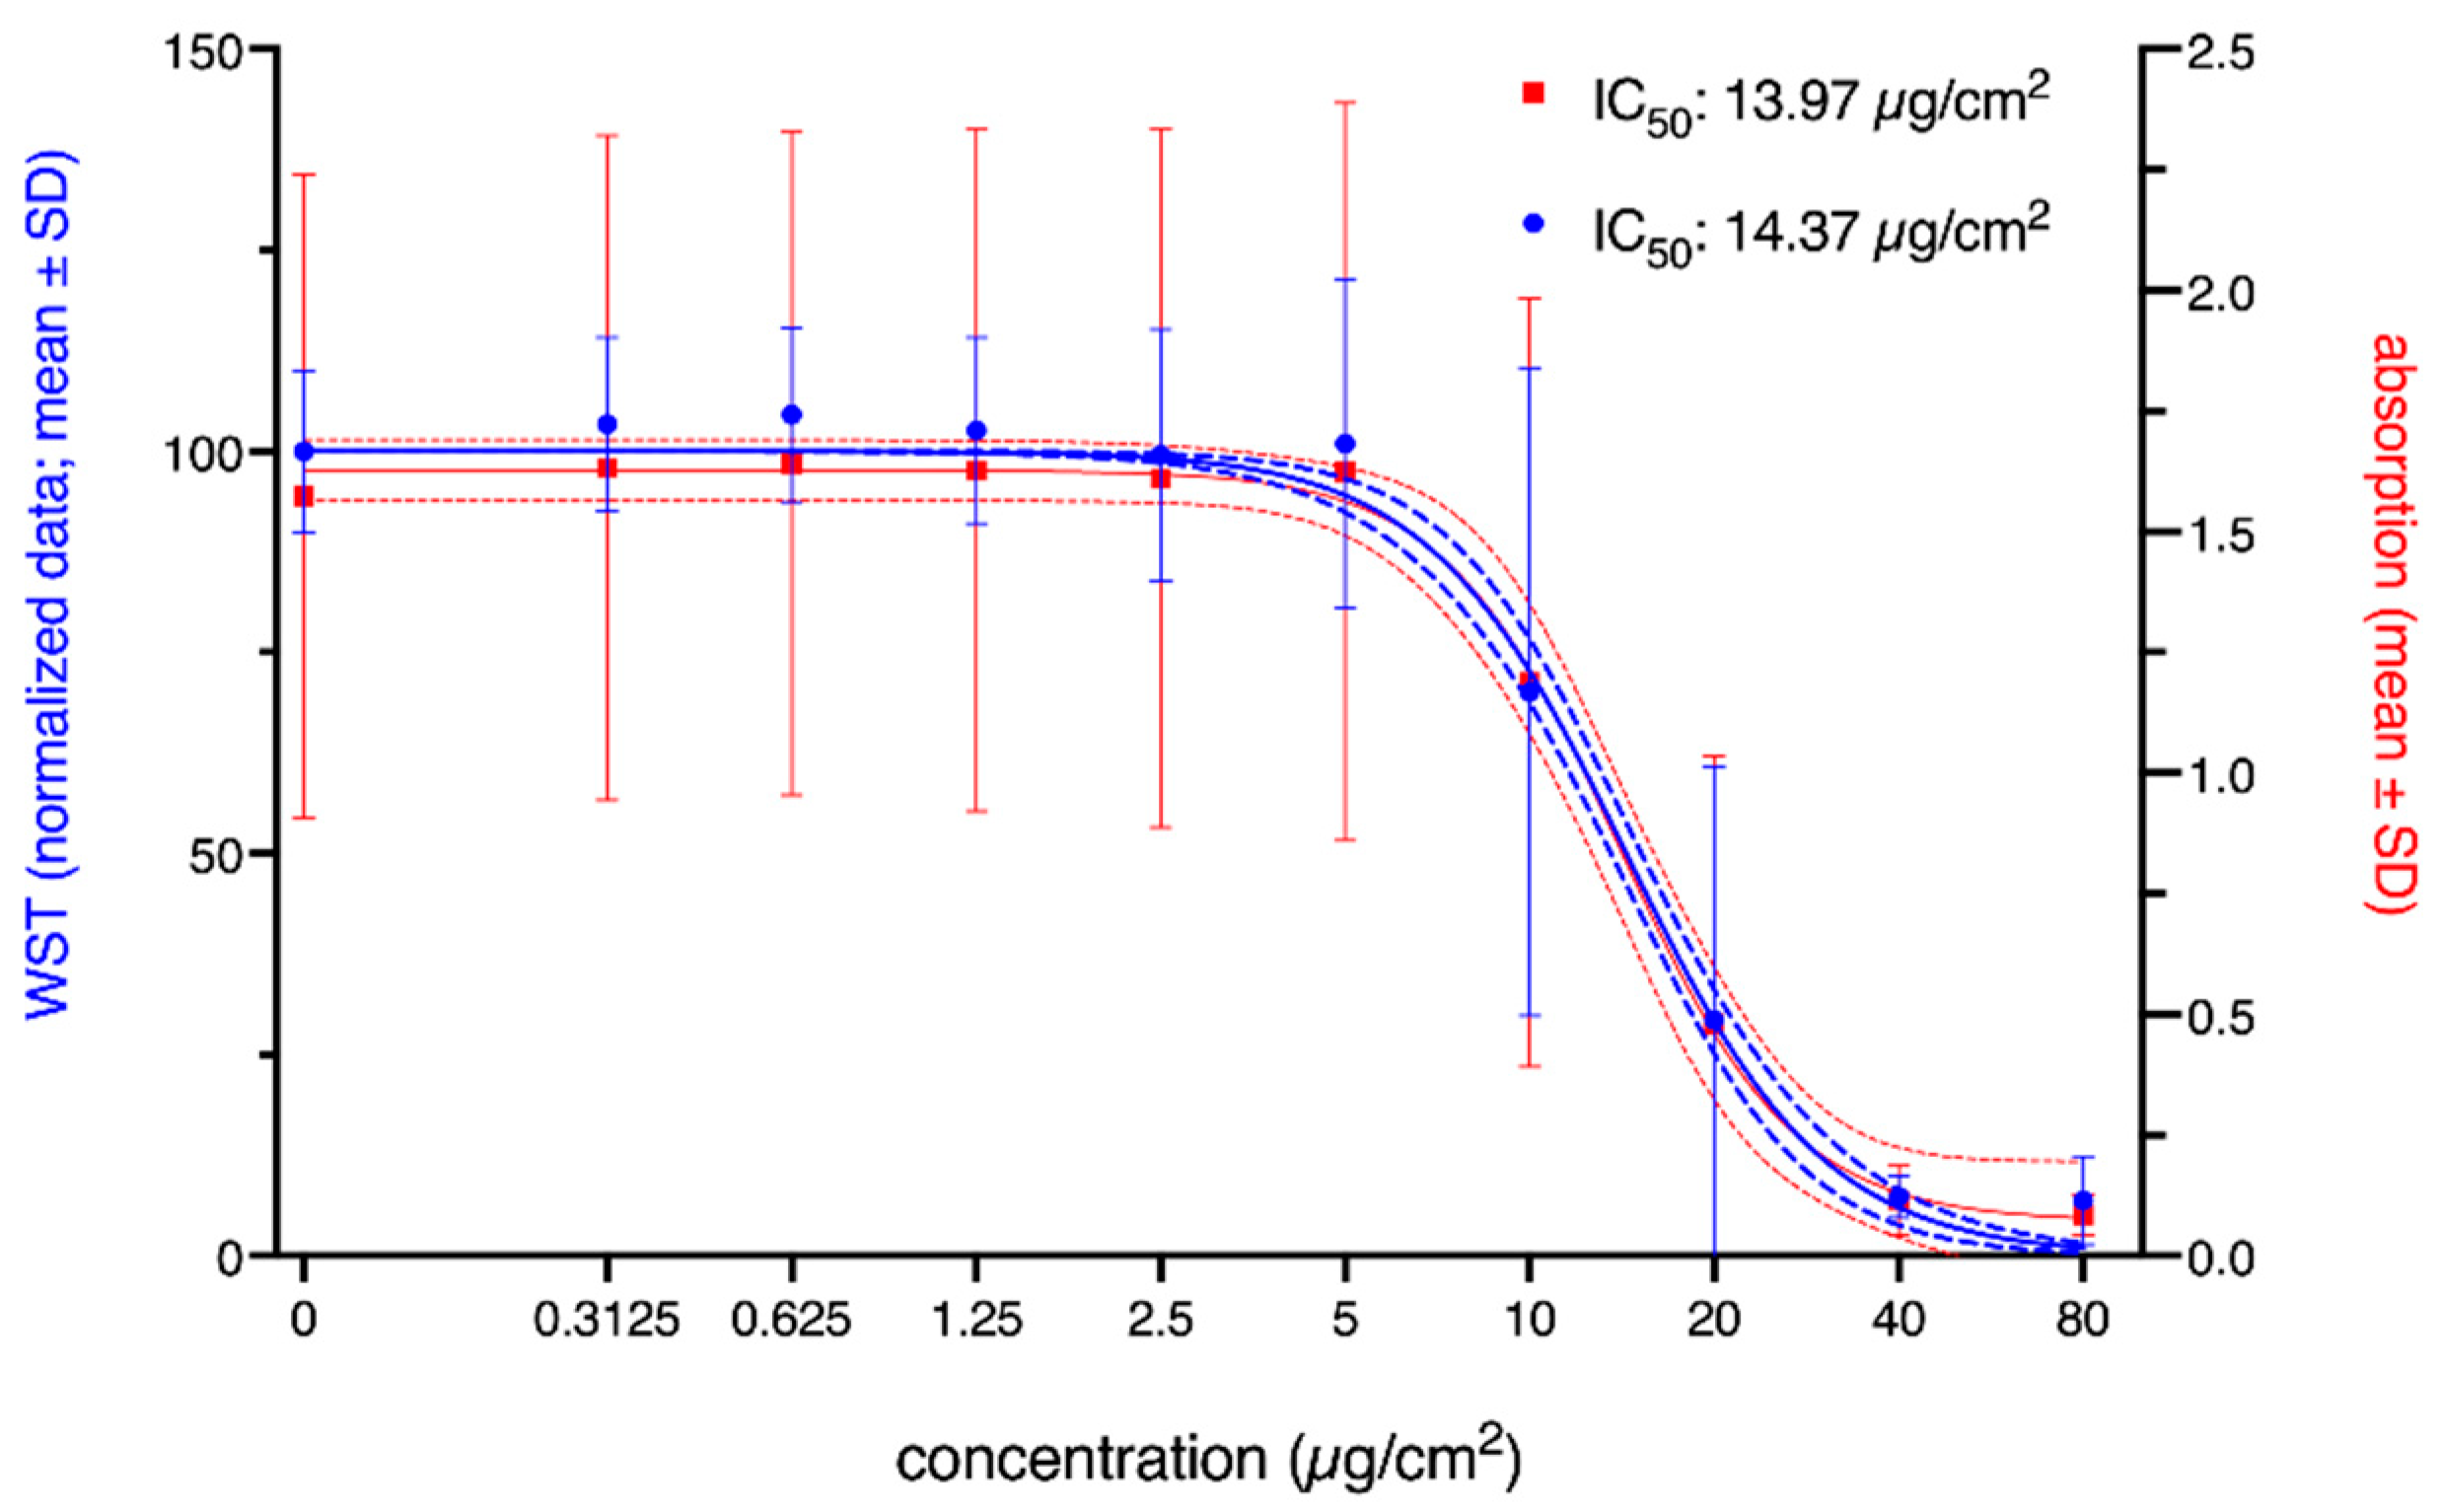
3.1. Cytotoxicity
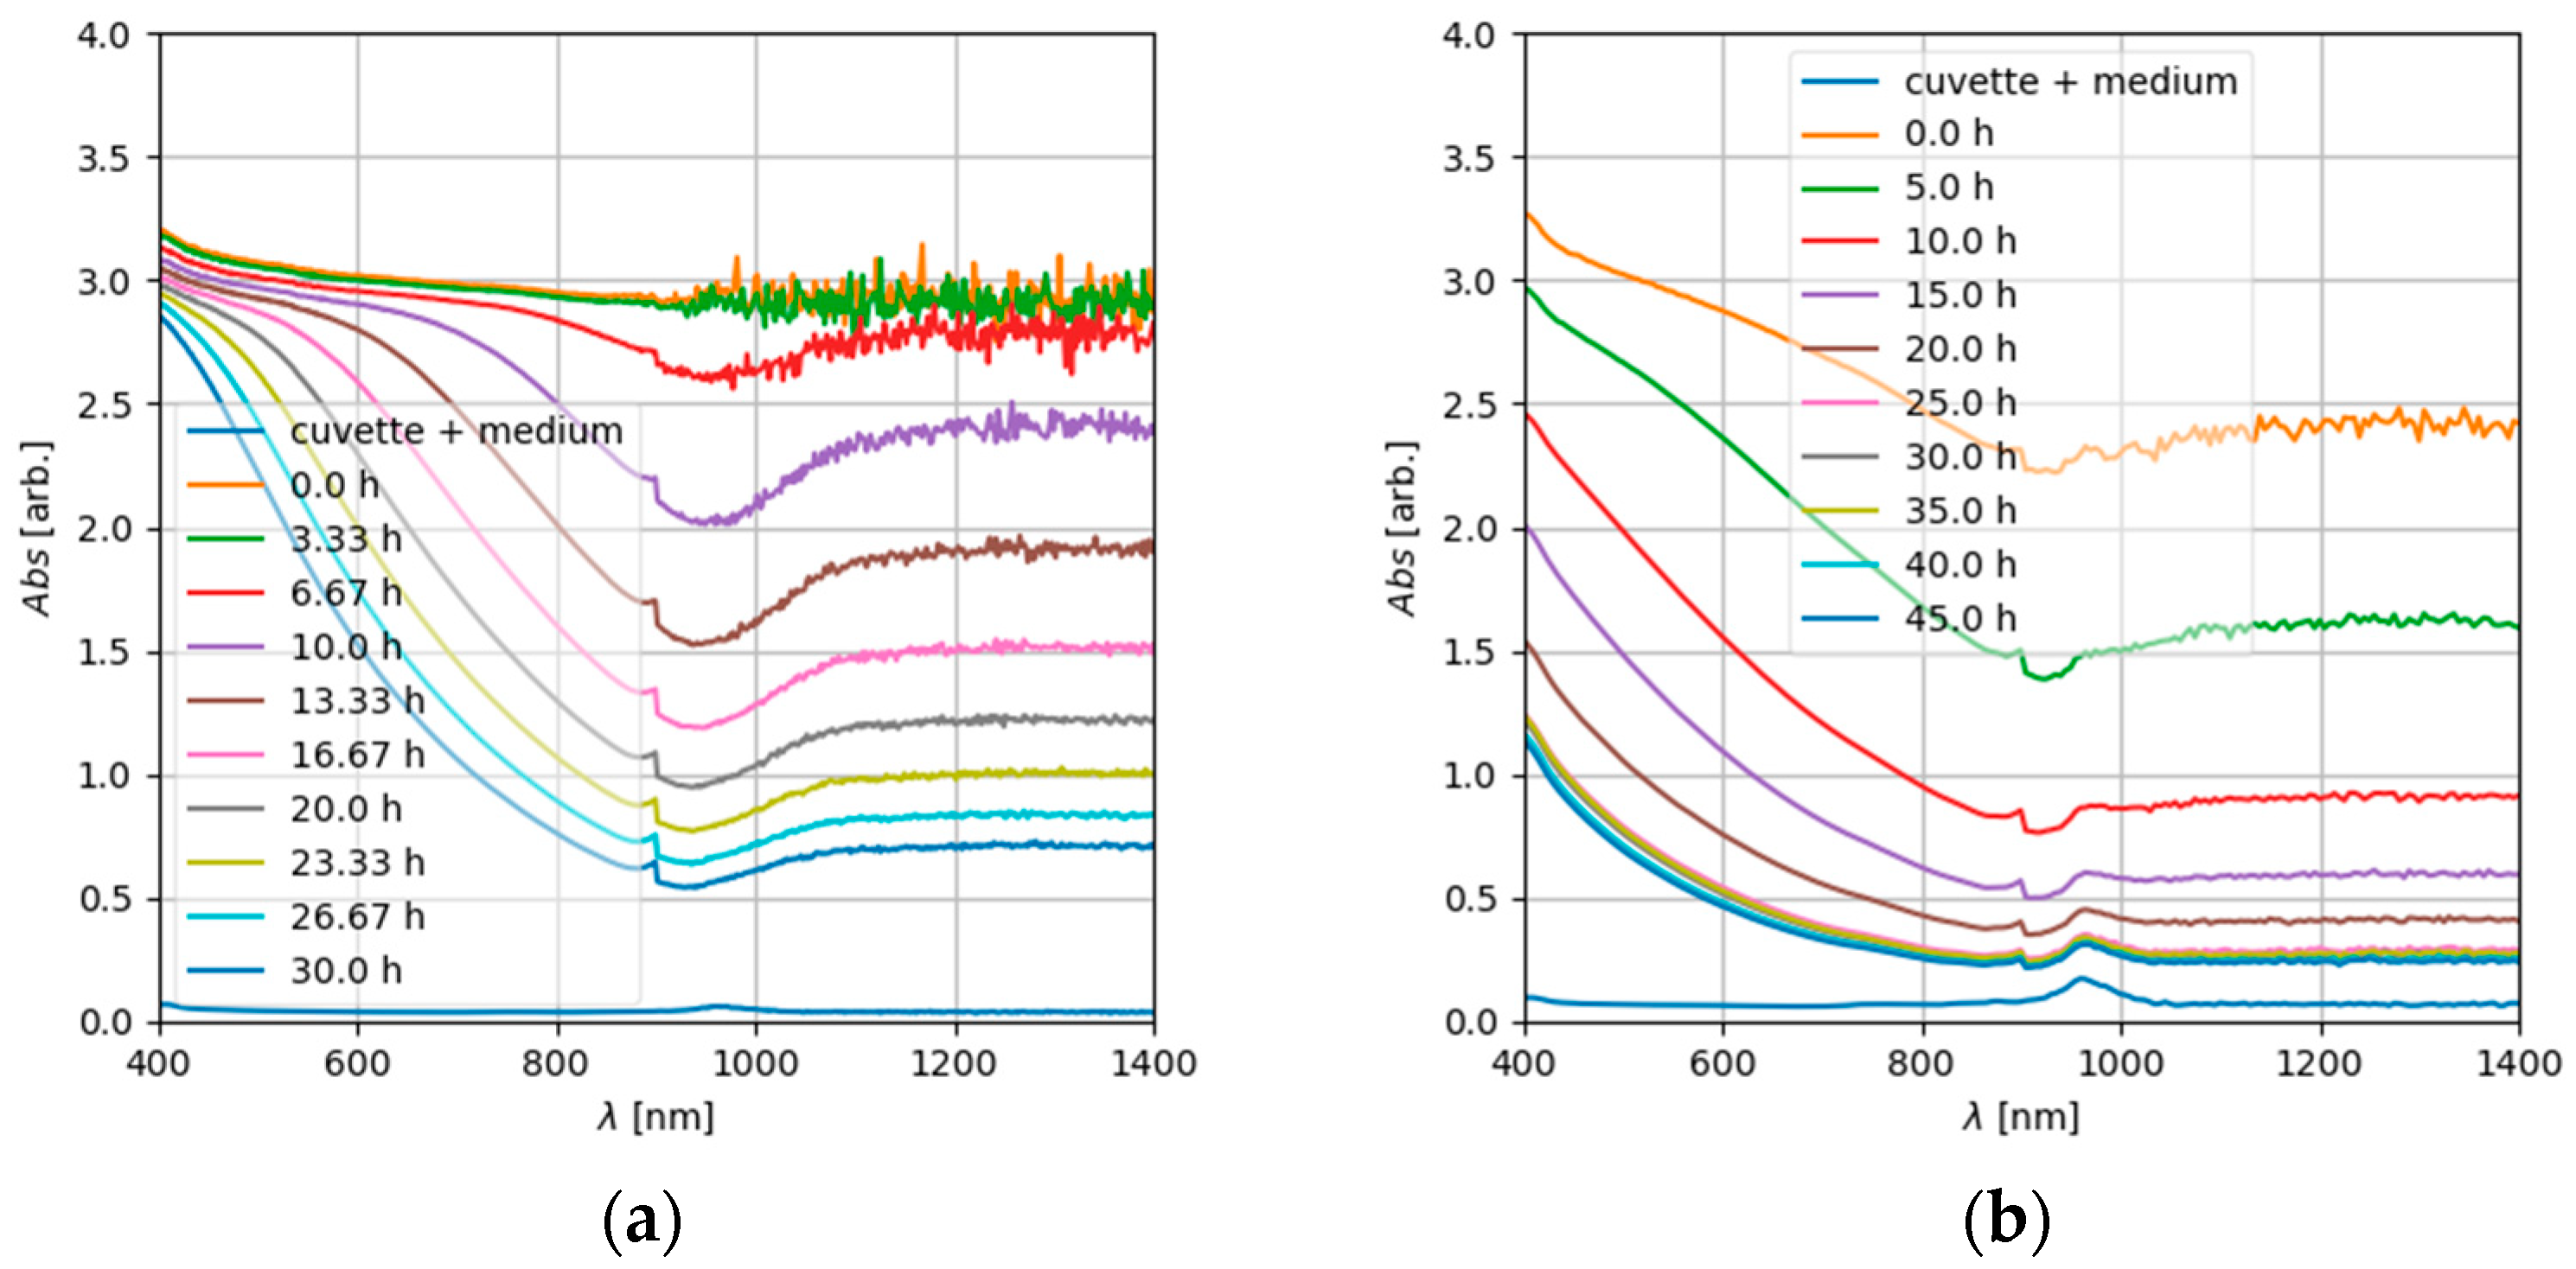
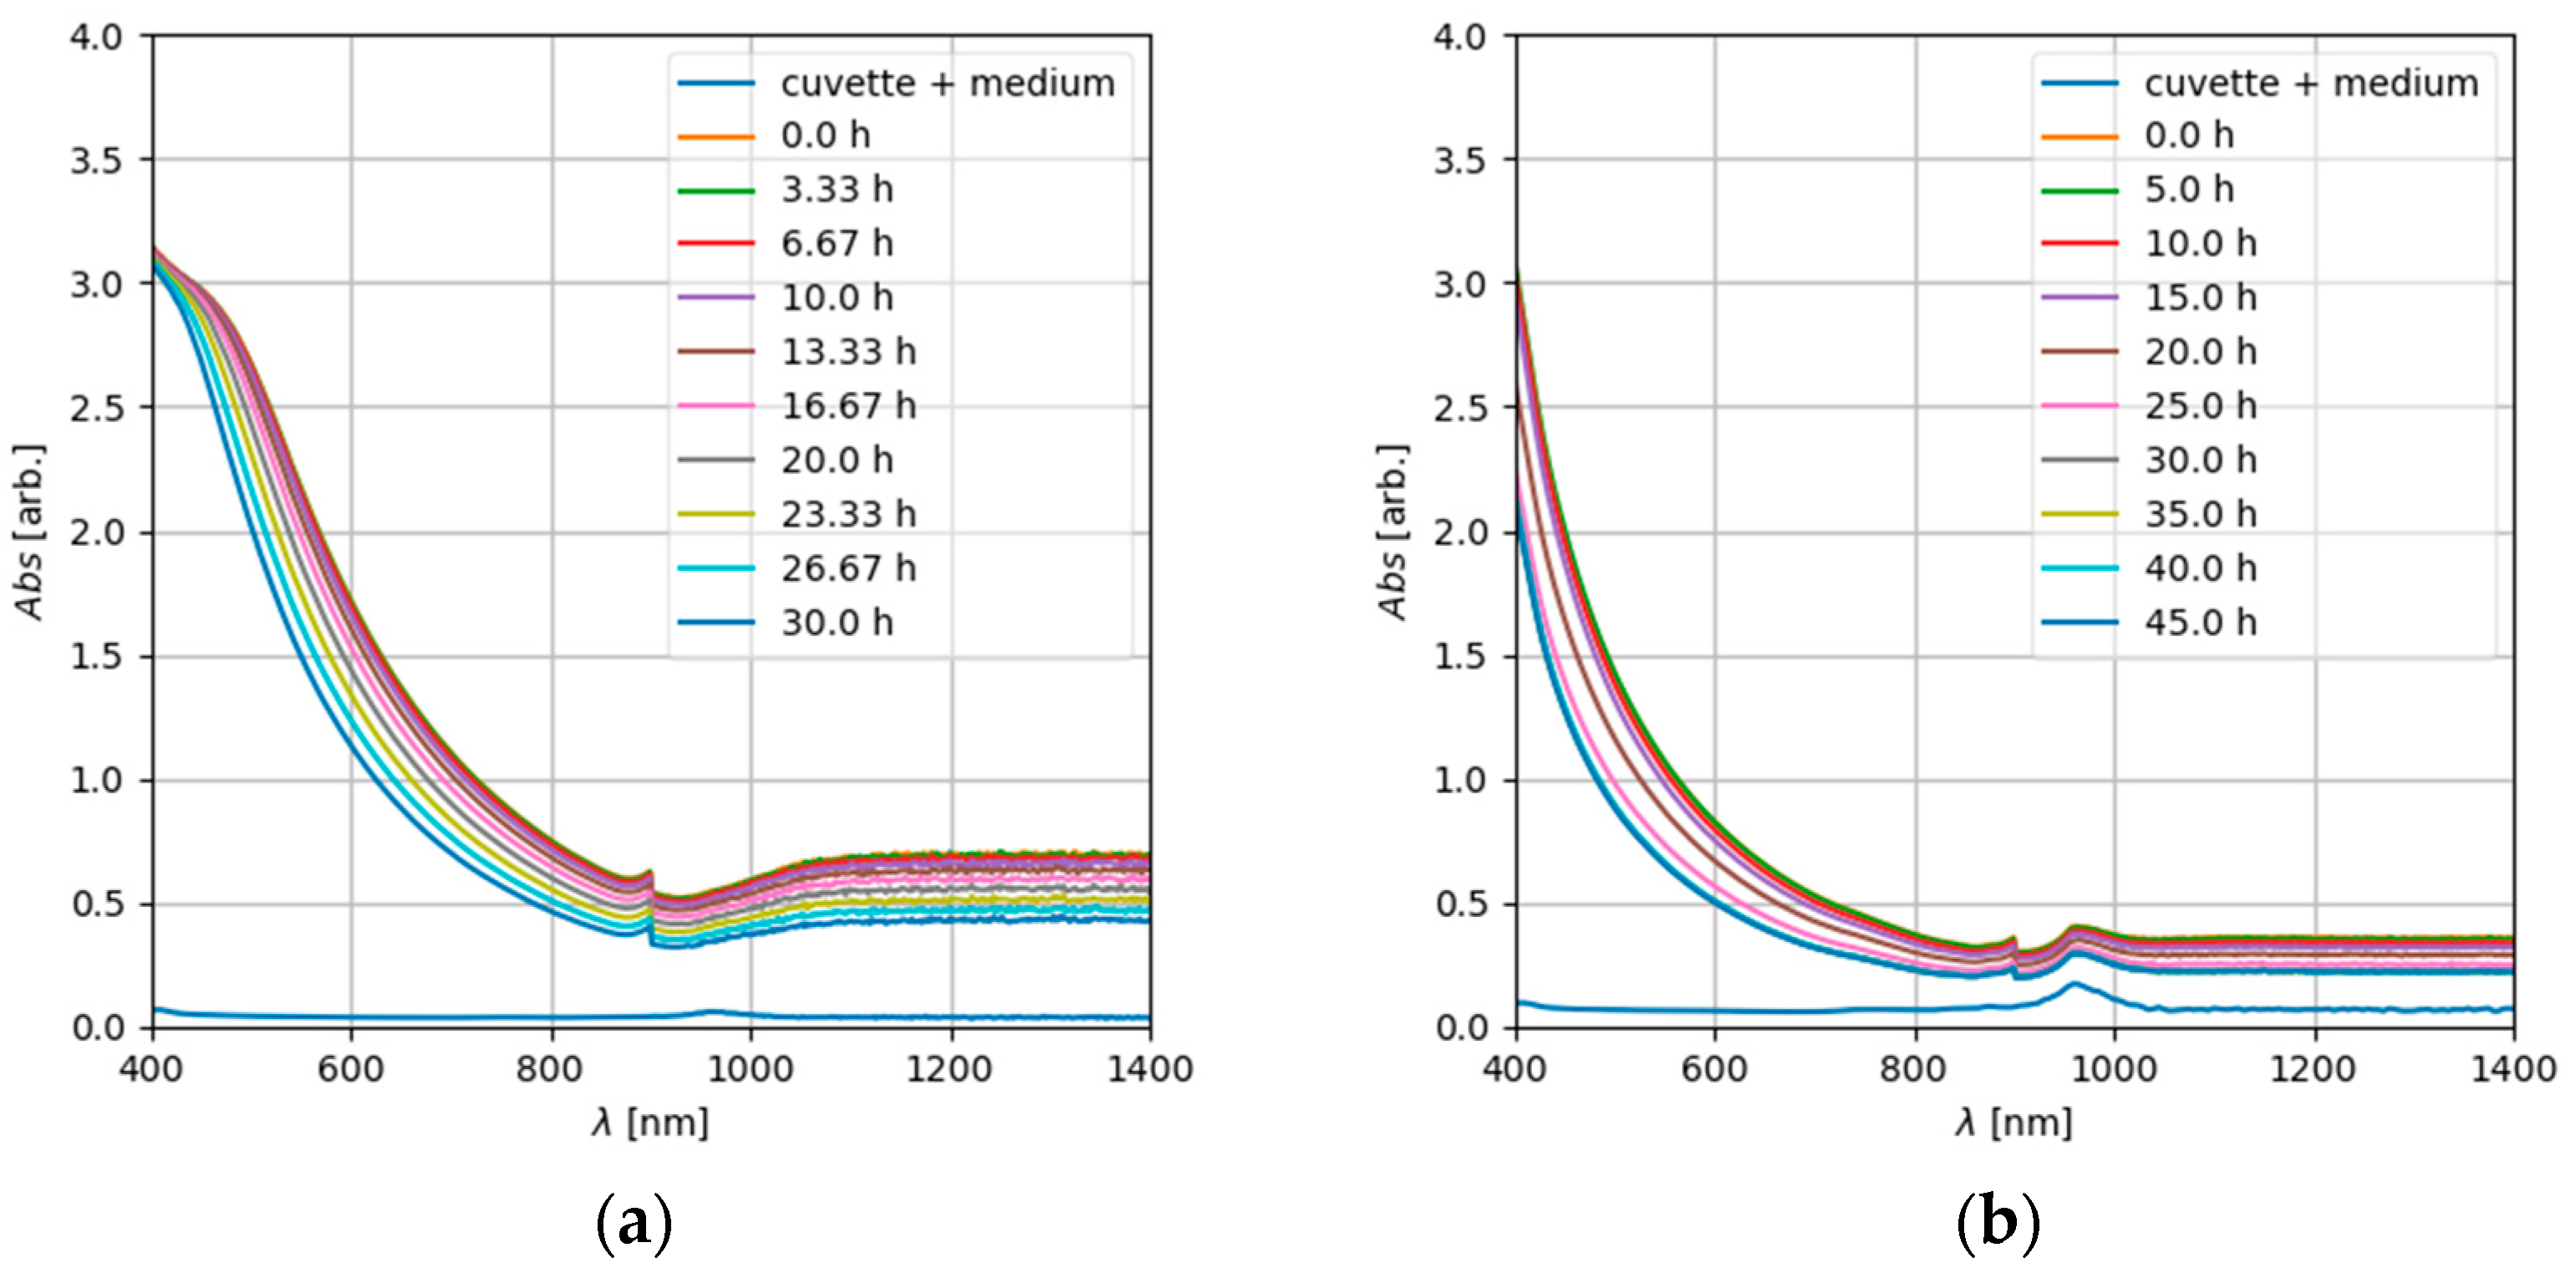
3.2. ENM Sedimentation
4. Discussion
4.1. Statistics
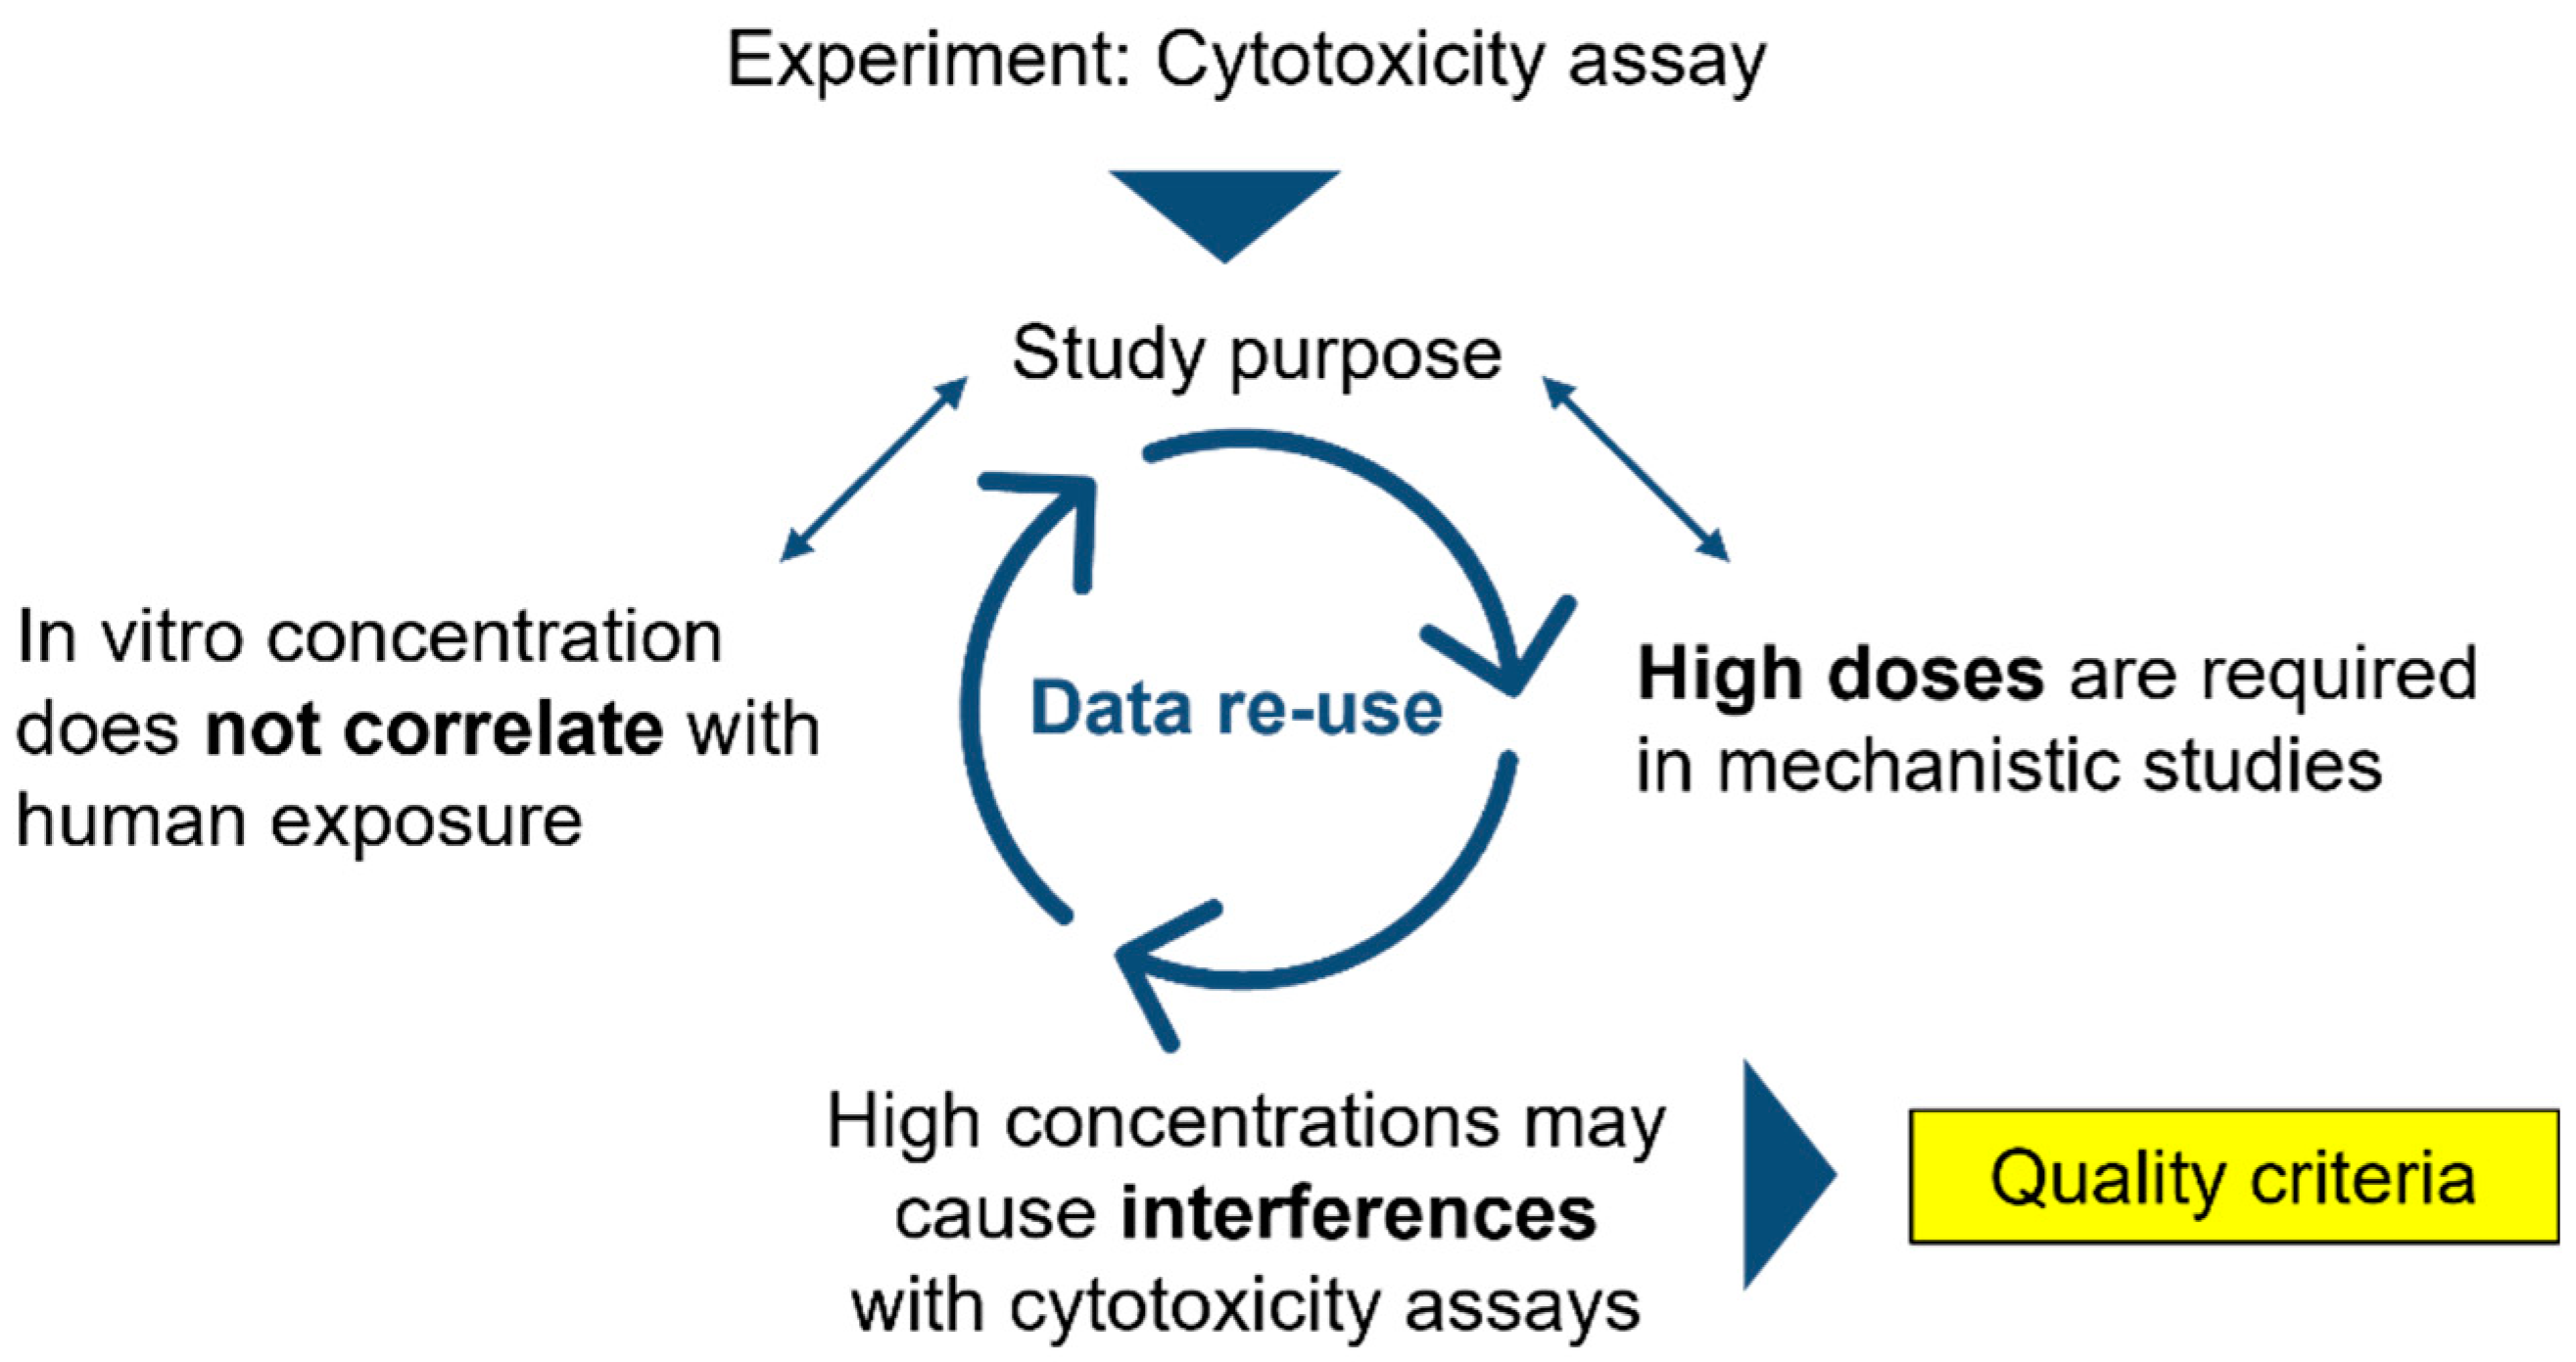
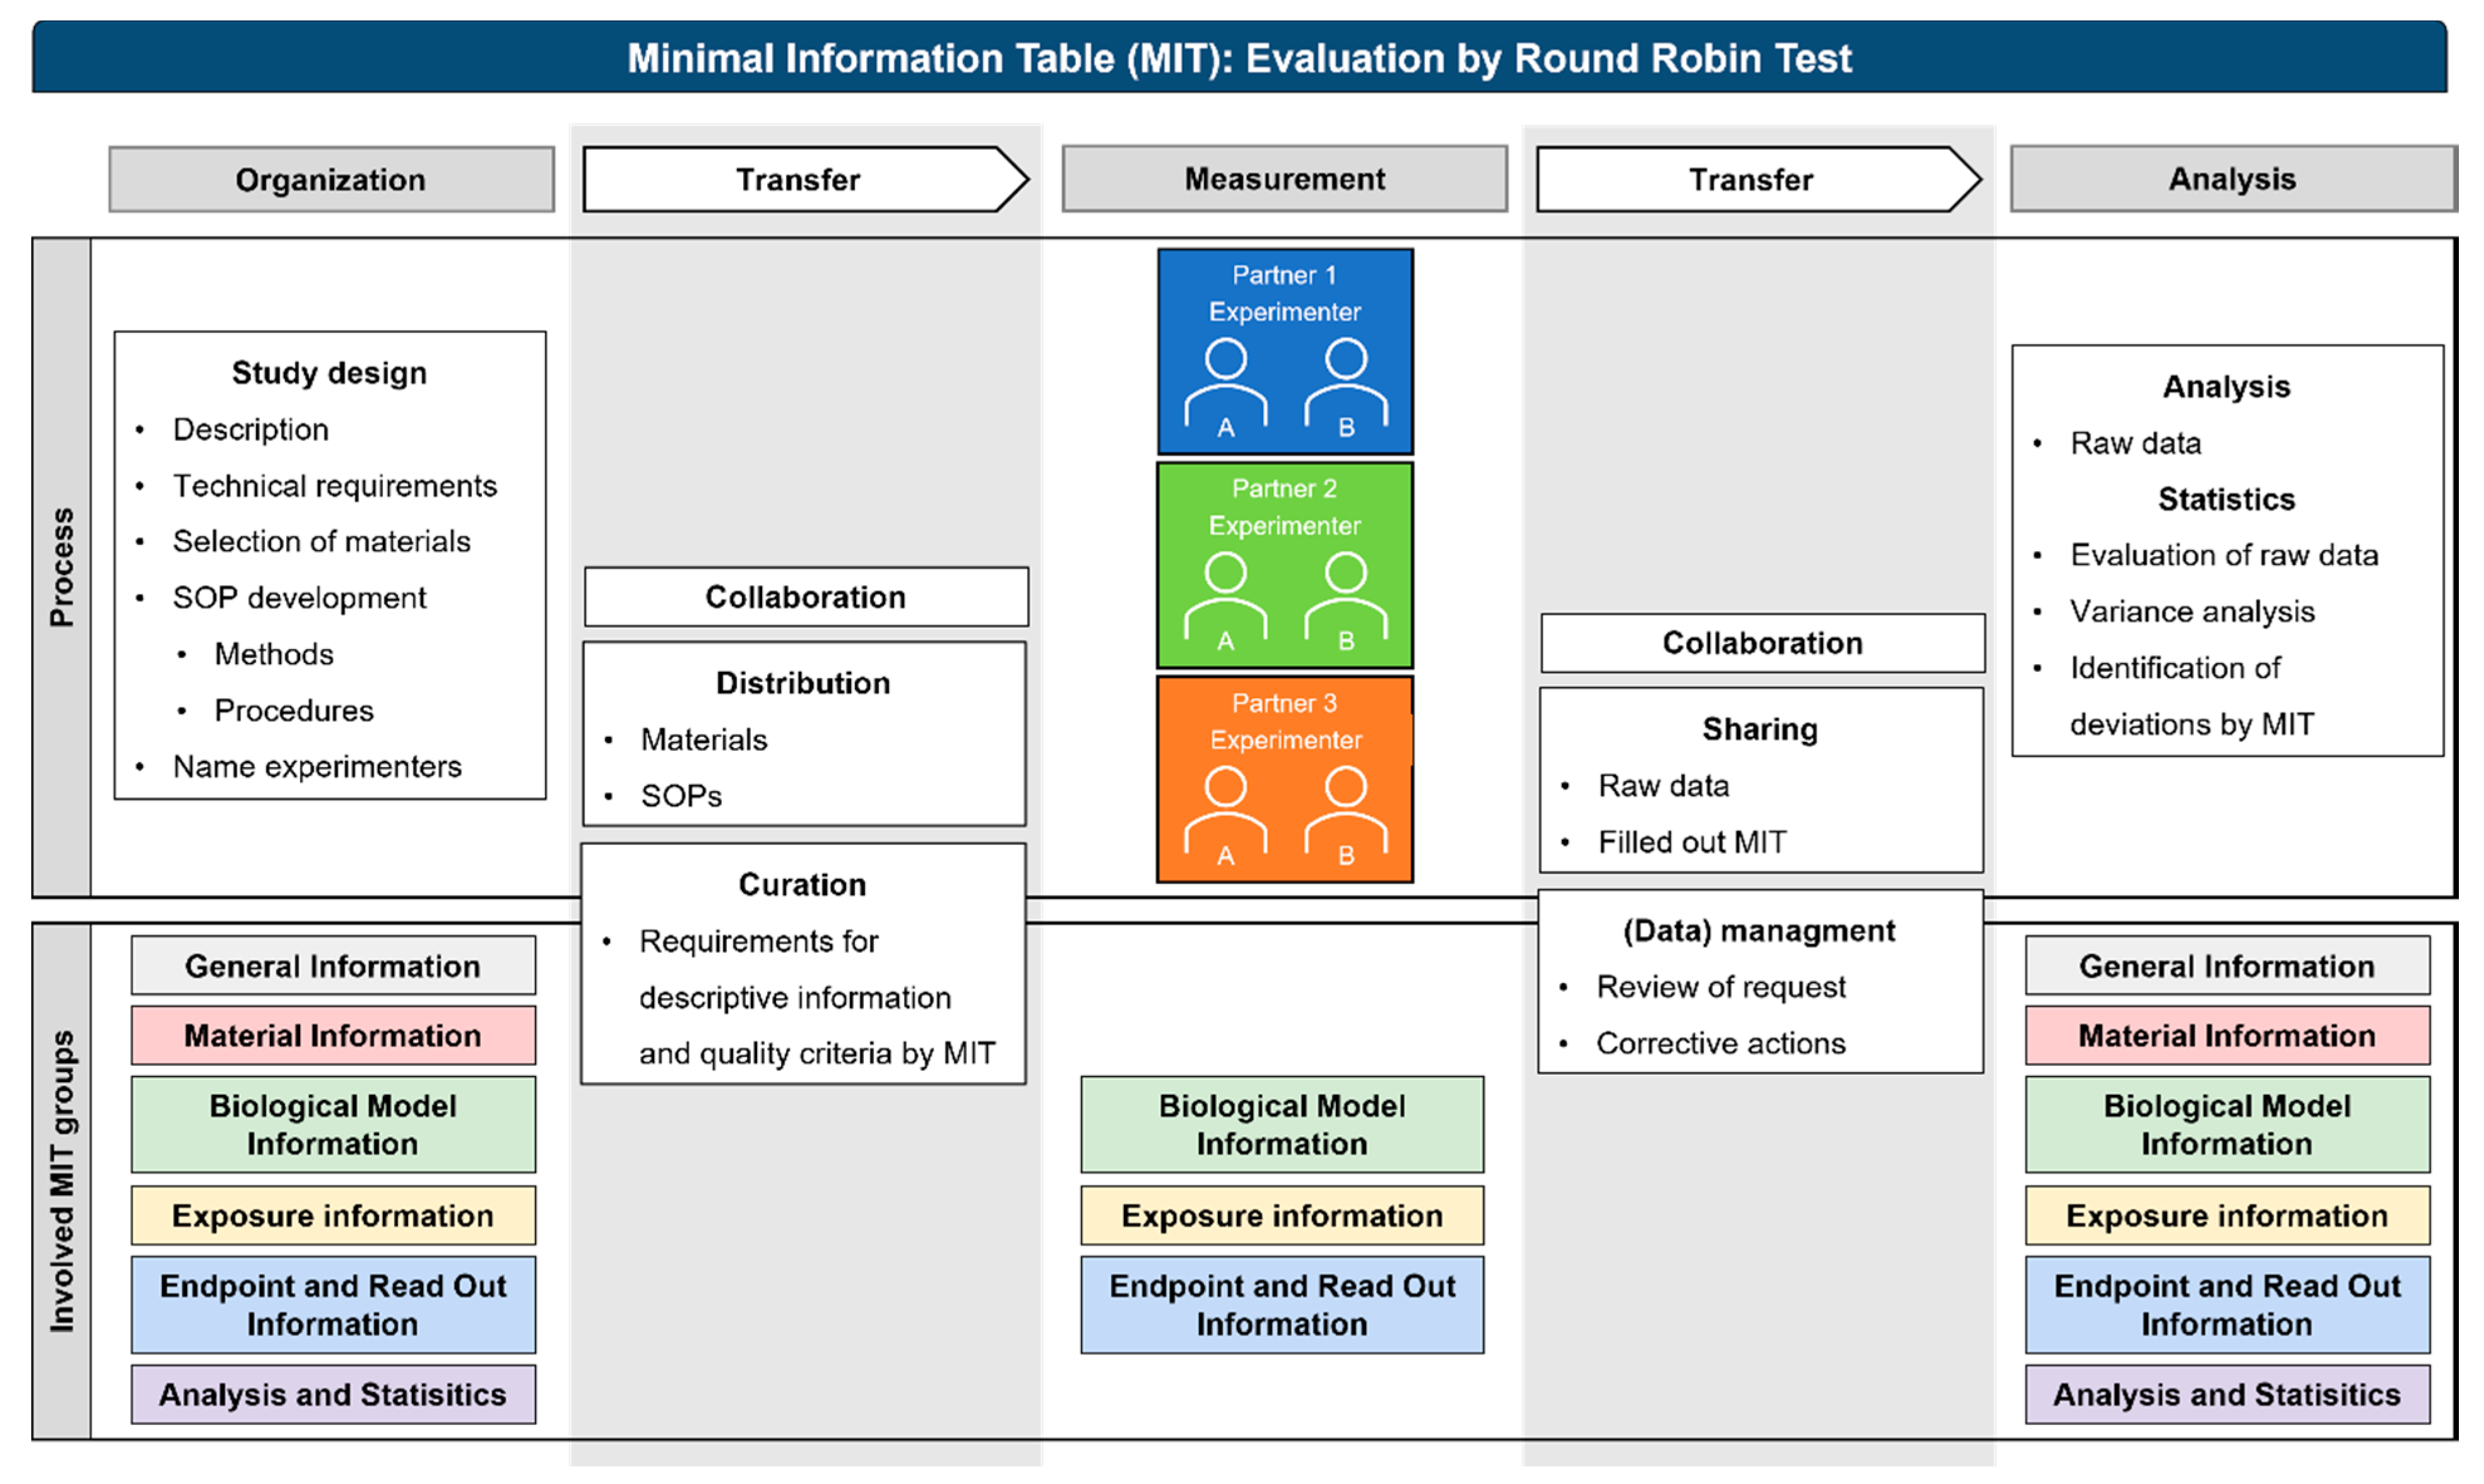
4.2. Metadata Acquisition
Supplementary Materials
Author Contributions
Funding
Institutional Review Board Statement
Informed Consent Statement
Data Availability Statement
Acknowledgments
Conflicts of Interest
References
- Warheit, D.B. Hazard and risk assessment strategies for nanoparticle exposures: How far have we come in the past 10 years? F1000Research 2018, 7, 376. [Google Scholar] [CrossRef] [PubMed] [Green Version]
- Johnston, L.J.; Gonzalez-Rojano, N.; Wilkinson, K.J.; Xing, B. Key challenges for evaluation of the safety of engineered nanomaterials. NanoImpact 2020, 18, 100219. [Google Scholar] [CrossRef]
- Arts, J.H.E.; Hadi, M.; Irfan, M.-A.; Keene, A.M.; Kreiling, R.; Lyon, D.; Maier, M.; Michel, K.; Petry, T.; Sauer, U.G.; et al. A decision-making framework for the grouping and testing of nanomaterials (DF4nanoGrouping). Regul. Toxicol. Pharmacol. 2015, 71, S1–S27. [Google Scholar] [CrossRef] [PubMed] [Green Version]
- Xia, T.; Hamilton, R.F.; Bonner, J.C.; Crandall, E.D.; Elder, A.; Fazlollahi, F.; Girtsman, T.A.; Kim, K.; Mitra, S.; Ntim, S.A.; et al. Interlaboratory Evaluation of in Vitro Cytotoxicity and Inflammatory Responses to Engineered Nanomaterials: The NIEHS Nano GO Consortium. Environ. Health Perspect. 2013, 121, 683–690. [Google Scholar] [CrossRef] [PubMed] [Green Version]
- Nelissen, I.; Haase, A.; Anguissola, S.; Rocks, L.; Jacobs, A.; Willems, H.; Riebeling, C.; Luch, A.; Piret, J.-P.; Toussaint, O.; et al. Improving Quality in Nanoparticle-Induced Cytotoxicity Testing by a Tiered Inter-Laboratory Comparison Study. Nanomaterials 2020, 10, 1430. [Google Scholar] [CrossRef]
- Haase; Klaessig. EU US Roadmap Nanoinformatics 2030. EU Nanosafety Cluster. 2018. Available online: https://zenodo.org/record/1486012#.YjrNfTYzaUk (accessed on 20 February 2022).
- Halappanavar, S.; Brule, S.V.D.; Nymark, P.; Gaté, L.; Seidel, C.; Valentino, S.; Zhernovkov, V.; Danielsen, P.H.; De Vizcaya-Ruiz, A.; Wolff, H.; et al. Adverse outcome pathways as a tool for the design of testing strategies to support the safety assessment of emerging advanced materials at the nanoscale. Part. Fibre Toxicol. 2020, 17, 16. [Google Scholar] [CrossRef]
- Landsiedel, R.; Ma-Hock, L.; Wiench, K.; Wohlleben, W.; Sauer, U.G. Safety assessment of nanomaterials using an advanced decision-making framework, the DF4nanoGrouping. J. Nanopart. Res. 2017, 19, 171. [Google Scholar] [CrossRef] [Green Version]
- Hirsch, C.; Roesslein, M.; Krug, H.F.; Wick, P. Nanomaterial cell interactions: Are current in vitro tests reliable? Nanomedicine 2011, 6, 837–847. [Google Scholar] [CrossRef]
- Krug, H.F. Nanosafety research-are we on the right track? Angew. Chem. Int. Ed. 2014, 53, 12304–12319. [Google Scholar] [CrossRef] [Green Version]
- Barosova, H.; Meldrum, K.; Karakocak, B.B.; Balog, S.; Doak, S.H.; Petri-Fink, A.; Clift, M.J.D.; Rothen-Rutishauser, B. Inter-laboratory variability of A549 epithelial cells grown under submerged and air-liquid interface conditions. Toxicol. Vitr. 2021, 75, 105178. [Google Scholar] [CrossRef]
- Elliott, J.T.; Rösslein, M.; Song, N.W.; Toman, B.; Kinsner-Ovaskainen, A.; Maniratanachote, R.; Salit, M.L.; Petersen, E.J.; Sequeira, F.; Romsos, E.L.; et al. Toward achieving harmonization in a nano-cytotoxicity assay measurement through an interlaboratory comparison study. ALTEX 2017, 34, 201–218. [Google Scholar] [CrossRef] [PubMed]
- Nymark, P.; Bakker, M.; Dekkers, S.; Franken, R.; Fransman, W.; García-Bilbao, A.; Greco, D.; Gulumian, M.; Hadrup, N.; Halappanavar, S.; et al. Toward Rigorous Materials Production: New Approach Methodologies Have Extensive Potential to Improve Current Safety Assessment Practices. Small 2020, 16, 1904749. [Google Scholar] [CrossRef] [PubMed]
- Llewellyn, S.V.; Conway, G.E.; Zanoni, I.; Jørgensen, A.K.; Shah, U.-K.; Seleci, D.A.; Keller, J.G.; Kim, J.W.; Wohlleben, W.; Jensen, K.A.; et al. Understanding the impact of more realistic low-dose, prolonged engineered nanomaterial exposure on genotoxicity using 3D models of the human liver. J. Nanobiotechnol. 2021, 19, 193. [Google Scholar] [CrossRef] [PubMed]
- Faria, M.; Björnmalm, M.; Thurecht, K.J.; Kent, S.J.; Parton, R.G.; Kavallaris, M.; Johnston, A.P.R.; Gooding, J.J.; Corrie, S.R.; Boyd, B.J.; et al. Minimum information reporting in bio–nano experimental literature. Nat. Nanotechnol. 2018, 13, 777–785. [Google Scholar] [CrossRef] [PubMed]
- Rasmussen, K.; Rauscher, H.; Kearns, P.; González, M.; Sintes, J.R. Developing OECD test guidelines for regulatory testing of nanomaterials to ensure mutual acceptance of test data. Regul. Toxicol. Pharmacol. 2019, 104, 74–83. [Google Scholar] [CrossRef]
- Seiler, J.P. Good Laboratory Practice—The Why and the How; Springer: Berlin/Heidelberg, Germany, 2005; ISBN 9783540282341. [Google Scholar]
- Papadiamantis, A.G.; Klaessig, F.C.; Exner, T.E.; Hofer, S.; Hofstaetter, N.; Himly, M.; Williams, M.A.; Doganis, P.; Hoover, M.D.; Afantitis, A.; et al. Metadata Stewardship in Nanosafety Research: Community-Driven Organisation of Metadata Schemas to Support FAIR Nanoscience Data. Nanomaterials 2020, 10, 2033. [Google Scholar] [CrossRef]
- Elberskirch, L.; Binder, K.; Riefler, N.; Sofranko, A.; Liebing, J.; Minella, C.B.; Mädler, L.; Razum, M.; van Thriel, C.; Unfried, K.; et al. Digital research data: From analysis of existing standards to a scientific foundation for a modular metadata schema in nanosafety. Part. Fibre Toxicol. 2022, 19, 1–19. [Google Scholar] [CrossRef]
- Ong, K.J.; MacCormack, T.J.; Clark, R.J.; Ede, J.D.; Ortega, V.A.; Felix, L.C.; Dang, M.K.M.; Ma, G.; Fenniri, H.; Veinot, J.G.C.; et al. Widespread Nanoparticle-Assay Interference: Implications for Nanotoxicity Testing. PLoS ONE 2014, 9, e90650. [Google Scholar] [CrossRef]
- Guadagnini, R.; Halamoda Kenzaoui, B.; Walker, L.; Pojana, G.; Magdolenova, Z.; Bilanicova, D.; Saunders, M.; Juillerat-Jeanneret, L.; Marcomini, A.; Huk, A.; et al. Toxicity screenings of nanomaterials: Challenges due to interference with assay processes and components of classicin vitrotests. Nanotoxicology 2015, 9, 13–24. [Google Scholar] [CrossRef]
- Kermanizadeh, A.; Gosens, I.; MacCalman, L.; Johnston, H.; Danielsen, P.H.; Jacobsen, N.R.; Lenz, A.G.; Fernandes, T.; Schins, R.P.F.; Cassee, F.R.; et al. A Multilaboratory Toxicological Assessment of a Panel of 10 Engineered Nanomaterials to Human Health—ENPRA Project—The Highlights, Limitations, and Current and Future Challenges. J. Toxicol. Environ. Health—Part B Crit. Rev. 2016, 19, 1–28. [Google Scholar] [CrossRef] [Green Version]
- Thongkam, W.; Gerloff, K.; Van Berlo, D.; Albrecht, C.; Schins, R.P. Oxidant generation, DNA damage and cytotoxicity by a panel of engineered nanomaterials in three different human epithelial cell lines. Mutagenesis 2017, 32, 105–115. [Google Scholar] [CrossRef] [PubMed]
- Rasmussen, K.; Mast, J.; De Temmerman, P.-J.; Verleysen, E.; Waegeneers, N.; Van Steen, F.; Pizzolon, J.C.; De Temmerman, L.; Van Doren, E.; Jensen, K.A.; et al. Titanium Dioxide, NM-100, NM-101, NM-102, NM-103, NM-104, NM-105: Characterisation and Physico-Chemical Properties; European Comission: Brussels, Belgium, 2014; ISBN 9789279381881. [Google Scholar]
- Singh, C.; Friedrichs, S.; Levin, M.; Birkedal, R.; Jensen, K.A.; Pojana, G.; Wohlleben, W.; Schulte, S.; Wiench, K.; Turney, T.; et al. NM-Series of Representative Manufactured Nanomaterials—Zinc Oxide NM-110, NM-111, NM-112, NM-113: Characterisation and Test Item Preparation; European Comission: Brussels, Belgium, 2011. [Google Scholar] [CrossRef]
- Taurozzi, J.S.; Hackley, V.A. Protocol for Preparation of Nanoparticle Dispersions From Powdered Material Using Ultrasonic Disruption. CEINT Natl. Inst. Standars Technol. 2010, 1200, 1200–1202. [Google Scholar] [CrossRef]
- Booth, A.; Jensen, K.A. NANoREG D4.12 SOP Probe Sonicator Calibration for Ecotoxicological Testing. Available online: https://www.rivm.nl/en/documenten/nanoreg-d412-sop-probe-sonicator-calibration-for-ecotoxicological-testing (accessed on 11 February 2022).
- Jensen, K.A.; Kembouche, Y.; Christiansen, E.; Jacobsen, N.R.; Wallin, H.; Guiot, C.; Spalla, O.; Witschger, O. Physicochemical Characterisation of Manufactured Nanomaterials (MNs) and Exposure Media (EMs) Deliverable 3: Final Protocol for Producing Suitable MN Exposure Media; The National Research Centre for the Working Environment: Copenhagen, Denmark, 2009. [Google Scholar]
- Teeguarden, J.G.; Hinderliter, P.M.; Orr, G.; Thrall, B.D.; Pounds, J.G. Particokinetics In Vitro: Dosimetry Considerations for In Vitro Nanoparticle Toxicity Assessments. Toxicol. Sci. 2007, 95, 300–312. [Google Scholar] [CrossRef]
- Lieber, M.; Todaro, G.; Smith, B.; Szakal, A.; Nelson-Rees, W. A continuous tumor-cell line from a human lung carcinoma with properties of type II alveolar epithelial cells. Int. J. Cancer 1976, 17, 62–70. [Google Scholar] [CrossRef] [PubMed]
- Leibrock, L.; Wagener, S.; Singh, A.V.; Laux, P.; Luch, A. Nanoparticle induced barrier function assessment at liquid–liquid and air–liquid interface in novel human lung epithelia cell lines. Toxicol. Res. 2019, 8, 1016–1027. [Google Scholar] [CrossRef] [PubMed] [Green Version]
- Vietti, G.; Ibouraadaten, S.; Palmai-Pallag, M.; Yakoub, Y.; Bailly, C.; Fenoglio, I.; Marbaix, E.; Lison, D.; van den Brule, S. Towards predicting the lung fibrogenic activity of nanomaterials: Experimental validation of an in vitro fibroblast proliferation assay. Part. Fibre Toxicol. 2013, 10, 52. [Google Scholar] [CrossRef] [Green Version]
- Krebs, A.; Waldmann, T.; Wilks, M.F.; van Vugt-Lussenburg, B.M.A.; van der Burg, B.; Terron, A.; Steger-Hartmann, T.; Ruegg, J.; Rovida, C.; Pedersen, E.; et al. Template for the description of cell-based toxicological test methods to allow evaluation and regulatory use of the data. ALTEX 2019, 36, 682–699. [Google Scholar] [CrossRef]
- Kim, J.A.; Åberg, C.; Salvati, A.; Dawson, K.A. Role of cell cycle on the cellular uptake and dilution of nanoparticles in a cell population. Nat. Nanotechnol. 2012, 7, 62–68. [Google Scholar] [CrossRef]
- Ivask, A.; Scheckel, K.G.; Kapruwan, P.; Stone, V.; Yin, H.; Voelcker, N.H.; Lombi, E. Complete transformation of ZnO and CuO nanoparticles in culture medium and lymphocyte cells during toxicity testing. Nanotoxicology 2017, 11, 150–156. [Google Scholar] [CrossRef]
- Lamon, L.; Asturiol, D.; Vilchez, A.; Cabellos, J.; Damásio, J.; Janer, G.; Richarz, A.; Worth, A. Physiologically based mathematical models of nanomaterials for regulatory toxicology: A review. Comput. Toxicol. 2019, 9, 133–142. [Google Scholar] [CrossRef]
- Izak-Nau, E.; Huk, A.; Reidy, B.; Uggerud, H.; Vadset, M.; Eiden, S.; Voetz, M.; Himly, M.; Duschl, A.; Dusinska, M.; et al. Impact of storage conditions and storage time on silver nanoparticles’ physicochemical properties and implications for their biological effects. RSC Adv. 2015, 5, 84172–84185. [Google Scholar] [CrossRef] [Green Version]
- Safar, R.; Doumandji, Z.; Saidou, T.; Ferrari, L.; Nahle, S.; Rihn, B.H.; Joubert, O. Cytotoxicity and global transcriptional responses induced by zinc oxide nanoparticles NM 110 in PMA-differentiated THP-1 cells. Toxicol. Lett. 2019, 308, 65–73. [Google Scholar] [CrossRef]
- Ding, Y.; Weindl, P.; Lenz, A.-G.; Mayer, P.; Krebs, T.; Schmid, O. Quartz crystal microbalances (QCM) are suitable for real-time dosimetry in nanotoxicological studies using VITROCELL®Cloud cell exposure systems. Part. Fibre Toxicol. 2020, 17, 44. [Google Scholar] [CrossRef] [PubMed]
- Remzova, M.; Zouzelka, R.; Brzicova, T.; Vrbova, K.; Pinkas, D.; Rőssner, P.; Topinka, J.; Rathousky, J. Toxicity of TiO2, ZnO, and SiO2 Nanoparticles in Human Lung Cells: Safe-by-Design Development of Construction Materials. Nanomaterials 2019, 9, 968. [Google Scholar] [CrossRef] [PubMed] [Green Version]
- Gajewicz, A.; Schaeublin, N.; Rasulev, B.; Hussain, S.; Leszczynska, D.; Puzyn, T.; Leszczynski, J. Towards understanding mechanisms governing cytotoxicity of metal oxides nanoparticles: Hints from nano-QSAR studies. Nanotoxicology 2015, 9, 313–325. [Google Scholar] [CrossRef]
- DSMZ. Available online: https://www.dsmz.de/collection/catalogue/details/culture/ACC-107 (accessed on 11 February 2022).
- Available online: https://www.nanopartikel.info/files/methodik/VIGO/cell_culture_A549.pdf (accessed on 11 February 2022).
- Foster, K.A.; Oster, C.G.; Mayer, M.M.; Avery, M.L.; Audus, K.L. Characterization of the A549 cell line as a type II pulmonary epithelial cell model for drug metabolism. Exp. Cell Res. 1998, 243, 359–366. [Google Scholar] [CrossRef]
- Giard, D.J.; Aaronson, S.A.; Todaro, G.J.; Arnstein, P.; Kersey, J.H.; Dosik, H.; Parks, W.P. In vitro cultivation of human tumors: establishment of cell lines derived from a series of solid tumors. J. Natl. Cancer Inst. 1973, 51, 1417–1423. [Google Scholar] [CrossRef]
- Available online: https://www.ols-bio.de/wp-content/uploads/2020/02/OLS_-CASY_TTT-OperatorsGuide_2018-8.pdf (accessed on 11 February 2022).
- Jensen, K.A. The ENPRA Dispersion Protocol for NANoREG; National Research Centre for the Working Environment: Copenhagen, Denmark, 2014. [Google Scholar]
- Booth, A.; Jensen, K.A. SOP for Probe Sonicator Calibration of Delivered Acoustic Power and Deagglomeration Efficiency for Ecotoxicological Testing. 2015. Available online: http://creativecommons.org/licenses/by-nc-sa/4.0/ (accessed on 11 February 2022).


| Acceptance Criteria | Brief Description |
|---|---|
| Source cells | Microscopy observation of cell morphology and viability during cultivation: adherent cell growth and cuboidal cell morphology. |
| Biological test system | Healthy culture should contain at least 80% viable cells and exhibit a confluence of >70%. Microscopy check of cell morphology and confluence prior to cell cultivation, ENM treatment, and performance of the WST-1 assay. |
| Viability assay | Corrected absorption of controls representing viable cells between 0.5 and 2, standard deviation of 4 replicates < 0.3.Corrected absorption of cytotoxicity controls should be lower than the viability controls. |
| Source | Type III Sum of Squares | df | Mean Square | F | Sig. | |
|---|---|---|---|---|---|---|
| Intercept | Hypothesis | 964.142 | 1 | 964.142 | 12.790 | 0.067 |
| Error | 155.074 | 2.057 | 75.382 | |||
| Concentration | Hypothesis | 286.274 | 9 | 31.808 | 11.748 | 0.000 |
| Error | 45.014 | 16.625 | 2.708 | |||
| Replicate | Hypothesis | 3.932 | 2 | 1.966 | 2.508 | 0.181 |
| Error | 3.700 | 4.720 | 0.784 | |||
| Partner | Hypothesis | 148.599 | 2 | 74.299 | 8.988 | 0.017 |
| Error | 47.589 | 5.757 | 8.267 | |||
| Experimenter (partner) | Hypothesis | 17.565 | 3 | 5.855 | 5.744 | 0.023 |
| Error | 7.871 | 7.722 | 1019 | |||
| Concentration * partner | Hypothesis | 50.524 | 18 | 2.807 | 6.956 | 0.000 |
| Error | 7.449 | 18.459 | 0.404 | |||
| Concentration * experimenter (partner) | Hypothesis | 2.879 | 18 | 0.160 | 0.617 | 0.862 |
| Error | 9.331 | 36 | 0.259 | |||
| Experimenter * replicate (partner) | Hypothesis | 10.674 | 27 | 0.395 | 1.575 | 0.078 |
| Error | 13.555 | 54 | 0.251 | |||
| Concentration * partner * replicate | Hypothesis | 5.250 | 6 | 0.875 | 3.486 | 0.006 |
| Error | 13.555 | 54 | 0.251 | |||
| Concentration * experimenter * replicate (partner) | Hypothesis | 9.331 | 36 | 0.259 | 1.033 | 0.450 |
| Error | 13.555 | 54 | 0.251 |
Publisher’s Note: MDPI stays neutral with regard to jurisdictional claims in published maps and institutional affiliations. |
© 2022 by the authors. Licensee MDPI, Basel, Switzerland. This article is an open access article distributed under the terms and conditions of the Creative Commons Attribution (CC BY) license (https://creativecommons.org/licenses/by/4.0/).
Share and Cite
Elberskirch, L.; Sofranko, A.; Liebing, J.; Riefler, N.; Binder, K.; Bonatto Minella, C.; Razum, M.; Mädler, L.; Unfried, K.; Schins, R.P.F.; et al. How Structured Metadata Acquisition Contributes to the Reproducibility of Nanosafety Studies: Evaluation by a Round-Robin Test. Nanomaterials 2022, 12, 1053. https://doi.org/10.3390/nano12071053
Elberskirch L, Sofranko A, Liebing J, Riefler N, Binder K, Bonatto Minella C, Razum M, Mädler L, Unfried K, Schins RPF, et al. How Structured Metadata Acquisition Contributes to the Reproducibility of Nanosafety Studies: Evaluation by a Round-Robin Test. Nanomaterials. 2022; 12(7):1053. https://doi.org/10.3390/nano12071053
Chicago/Turabian StyleElberskirch, Linda, Adriana Sofranko, Julia Liebing, Norbert Riefler, Kunigunde Binder, Christian Bonatto Minella, Matthias Razum, Lutz Mädler, Klaus Unfried, Roel P. F. Schins, and et al. 2022. "How Structured Metadata Acquisition Contributes to the Reproducibility of Nanosafety Studies: Evaluation by a Round-Robin Test" Nanomaterials 12, no. 7: 1053. https://doi.org/10.3390/nano12071053