Article

Defective Black TiO2: Effects of Annealing Atmospheres and Urea Addition on the Properties and Photocatalytic Activities

1
Institute of Eco-Environmental and Plant Protection, Shanghai Academy of Agricultural Sciences, Shanghai 201403, China
2
Shanghai Engineering Research Center of Low-Carbon Agriculture, Shanghai 201403, China
*
Author to whom correspondence should be addressed.
Nanomaterials 2021, 11(10), 2648; https://doi.org/10.3390/nano11102648
Submission received: 14 September 2021 / Revised: 5 October 2021 / Accepted: 6 October 2021 / Published: 9 October 2021

Abstract

:
A series of black TiO2 with and without the addition of urea were successfully prepared using a simple one-step synthetic method by calcination under different atmospheres (vacuum, He, or N2). The physicochemical, optical, and light-induced charge transfer properties of the as-prepared samples were characterized by various techniques. It was found that a vacuum atmosphere was more beneficial for the formation of oxygen vacancies (OVs) than the inert gases (He and N2) and the addition of urea-inhibited OVs formation. The samples annealed in the vacuum condition exhibited better visible-light adsorption abilities, narrower bandgaps, higher photo-induced charge separation efficiency, and lower recombination rates. Hydroxyl radicals (·OH) were the dominant oxidative species in the samples annealed under a vacuum. Finally, the samples annealed under vacuum conditions displayed higher photocatalytic activity for methylene blue (MB) degradation than the samples annealed under He or N2. Based on the above, this study provides new insights into the effects of annealing atmospheres and urea addition on the properties of black TiO2.

1. Introduction

Titanium dioxide (TiO2) is the most widely investigated photocatalyst for use in solar-driven environmental purification. However, conventional white TiO2 has poor visible-light absorption and rapid electron-hole recombination, resulting in unsatisfactory photocatalytic activity in solar-driven reactions [1]. Therefore, many efforts have been expended to harvest visible photons and improve the photocatalytic activities of TiO2-based materials. Various strategies have been employed to improve the optical and electronic properties of white TiO2, including the replacement of Ti4+ ions by metal ions, and the replacement of O2− ions by non-metal ions in the TiO2 lattice, which has been able to extend the photoresponse of TiO2 to the visible-light region [2]. The chemical doping of TiO2 exhibited various colors because of the new band introduction by chemical dopants. However, the introduced dopants, acting as charge carrier recombination centers, affected the photocatalytic efficiency of doped TiO2 [3]. Consequently, appealing approaches based on dopant-free were proposed to overcome the above limitation. Chen et al. firstly reported that hydrogenation was used to produce black TiO2 to improve visible light absorption and photocatalytic activity without chemical doping [4]. In recent years, black TiO2 has triggered an explosion in interest for many environmental applications, due to its absorption of both visible and near-infrared solar light without the need for the addition of dopants to alter its properties.
The synthesis methods of black TiO2 include hydrogenation, chemical reduction, electrochemical reduction, laser ablation (in liquid), and oxidation approaches [5]. Most synthesis routes are based on the reduction of pristine TiO2. However, most reported reduction methods suffer from some inevitable drawbacks, including the requirements of high temperatures or pressures, toxic reagents, and complex operation processes with long time consumptions and high operational costs. Therefore, some studies have developed facile and low-cost strategies to synthesize black TiO2. Indeed, it is well known that heating TiO2 under vacuum conditions or a reducing atmosphere (i.e., H2, CO, and NH3) can lead to color changes [2,6]. The inert gas atmosphere has been considered as a reductant due to the formation of defective TiO2-x under an Ar or N2 atmosphere. The disordered layers form only if crystallization is performed in an oxygen-free environment [7]. Some studies have revealed that black TiO2 prepared by sintering P25 under a vacuum showed comparable performance with black TiO2 prepared under hydrogen [8]. Huang et al. investigated TiO2 nanorod arrays annealed under different atmospheres (O2, air, N2, and Ar), and found that samples annealed under Ar with the highest oxygen vacancies (OVs) concentration exhibited the highest photocurrent density [9]. Understanding the significant roles of calcination atmospheres on properties of produced black TiO2 would hold the key to the mechanism of the superior performances.
Although these synthesized black TiO2 have demonstrated improved performance, the explanations are largely diverse. It was widely accepted that TiO2 with changed colors exhibited different structural (lattice modification or disorder), chemical (formation of Ti3+, OVs, etc.), and physical properties (such as optical features), leading to different photocatalytic activities [10,11,12,13]. In contrast to the case of doping TiO2 that exhibited various colors because of the introduction of new band levels due to doped elements, extensive studies have revealed that the production of crystal and surface defects such as OVs or Ti interstitial is responsible for narrowing the bandgap of black TiO2 based on being dopant-free [11,14]. Meanwhile, others have reported that the key factor of bandgap narrowing was a unique core-shell structure with an oxygen-deficient disordered shell and a crystalline core [15]. It is commonly believed that the light-harvesting ability of a semiconductor is intimately associated with its bandgap and its subsequent photocatalytic performance. However, in many cases, although a narrower bandgap is beneficial for light absorption, the photoactivity of black TiO2 does not match its attractive absorption spectra [2,16]. To date, despite various efforts to study black TiO2 under various synthesization conditions, controversy persists regarding the mechanism of narrowed band gaps and the improved photoactivity of black TiO2.
Here, we synthesized black TiO2 using facile calcination under a vacuum and inert atmosphere (He and N2). Urea was added as a foreign dopant into the Ti precursor before the calcination process. The synthesized black TiO2 was characterized in detail to analyze the chemical and physical properties, and the electronic band structures of the materials were calculated. The production of reactive oxygen species (ROS) in the photocatalytic processes was determined to verify band structures and mid-gap states. MB decomposition was used as a model reaction to examine the photocatalytic activities of all forms of black TiO2. The two questions that we aimed to answer in this study were: (1) How do vacuums and inert atmospheres (He and N2) affect the properties of black TiO2? (2) Does the addition of urea benefit negatively impact the production and photoactivity of black TiO2?

2. Materials and Methods

2.1. Materials and Reagents

Tetrabutyl titanate (≥98%), urea (≥99.5%), hydrochloric acid (36.0–38.0%), and absolute ethanol (≥99.7%) were purchased from Sinopharm Chemical Reagent Co. Ltd. (Shanghai, China). Commercial TiO2 (P25) powder was purchased from Degussa Corporation Germany. Deionized (DI) water was used throughout the experiment.

2.2. Photocatalyst Synthesis

The synthesis process has been reported in our previous work [17]. Briefly, tetrabutyl titanate (14 mL) and urea (0.6 g) were mixed in ethanol (20 mL) using a magnetic stir bar (500 rpm) to form a light-yellow transparent solution A. Then, solution B, a mixture of ethanol (10 mL), DI water (5 mL), and hydrochloric acid (1 mL), was added dropwise into solution A, and a glass rod was used to stir the mixture until a white colloid formed due to a hydrolysis procedure. The white colloid was dried at 80 °C overnight. The resulting material was ground carefully and the obtained white powder was calcined under a vacuum, He, or N2 at 500 °C for 2 h at a heating rate of 4 °C min−1. For comparison, the samples without urea addition were also calcined under different atmospheres at the same conditions. The obtained materials with urea addition calcined under vacuum conditions, He, and N2 were denoted as U-T-V, U-T-He, and U-T-N2, respectively. The materials without urea addition calcined under vacuum conditions, He, and N2 were denoted as T-V, T-He, and T-N2, respectively.

2.3. Material Characterization

The surface morphologies of samples were characterized by field-emission scanning electron microscopy (SEM, JEOL-JSM-6700, Tokyo, Japan). High-resolution transmission electron microscopy (HR-TEM) was performed with JEOL-JEM-2100 microscopy (Tokyo, Japan). The crystalline phases of the as-prepared samples were analyzed by powder X-ray diffraction (XRD, Bruker D8 Advance, Germany), with Cu-Ka radiation source (λ = 0.15406 nm) in the range of 10–90° at 40 kV and 40 mA. Surface electronic states of the samples were measured by X-ray photoelectron spectroscopy (XPS) using an upgraded RBD PHI-5000C ESCA system (PerkinElmer) with Mg Kα radiation (h = 1253.6 eV). Raman spectra were obtained by a Raman Microscope (HORIBA LabRam HR Evolution) equipped with a 514 nm laser excitation source. UV-visible diffuse reflectance spectra (DRS) of the samples were acquired by a LAMBDA 950 spectrometer (PerkinElmer), with an integrating sphere and BaSO4 as a reference. Electron paramagnetic resonance (EPR) measurements of surface species of as-prepared powder samples were performed on a JEOL JES-FA200 spectrometer at room temperature, with a resonance frequency of 9.43 GHz and microwave power of 1.0 mW. EPR was also used to obtain signals of radical spin-trapped by spin-trap reagent 5,5-dimethyl-1-pyrroline N-oxide (DMPO). All EPR samples containing 10 mg photocatalyst in 5 mL DMPO solution (10 mM) were placed in a ~1 mm capillary, in which DMPO+water and DMPO+methanol systems were studied. The samples were irradiated by 300 W Xenon light (λ = 400–980 nm) for 1 min, and then the EPR spectra were obtained. The EPR instrumental settings were as follows: center field = 3365 Gauss, field sweep = 50 Gauss, sweep time = 1 min; microwave frequency, 9.4 GHz; microwave power, ~1.0 mW; modulation amplitude, 1.0 × 1000; time constant, 0.03 s; and receiver gain, 1 × 10⁵, 8192 points. Photoluminescence (PL) spectra were obtained with a fluorescence spectrophotometer (HORIBA MAX-4) using an excitation wavelength of 365 nm. The specific surface area and pore characteristics were determined by the N2 adsorption-desorption isotherm (ASAP2460, Micromeritics Instrument Corporation, USA) using the Brunauer–Emmett–Teller (BET) method and Barrett–Joyner–Halenda (BJH) method, respectively. Electrochemical impedance spectra (EIS) were measured by a three-electrode setup (CHI-760E, China). A Pt plate and Ag/AgCl were used as counter and reference electrodes, respectively, and 1 M KOH was used as the electrolyte. The working electrode was prepared by dropping 20 µL of catalyst suspension (10 mg of catalyst in 5 mL of glycerol) onto a 1.0 cm × 1.0 cm FTO glass. EIS was measured in the frequency range of 10–105 Hz, with an AC voltage amplitude of 0.5 V.

2.4. Photocatalytic Activity for Degradation of Organic Pollutants

The photocatalytic activities of the TiO2 samples were evaluated by the degradation of MB under simulated solar light irradiation. The experiments were conducted in a multiposition photochemical reactor (CEL-LAB500E4, Beijing China Education Au-light Co., Ltd., Beijing, China). A 500-W xenon lamp was placed into a condensation tube in the center of six 100 mL-quartz tubes. The light intensities were kept at 45.3 mW cm−2 under simulated solar light irradiation. The condensed water was recycled constantly to keep the experimental system cool. The photocatalyst (0.04 g) was added into a 100 mL MB solution (10 mg L−1) and stirred for 0.5 h in the dark to reach adsorption–desorption equilibrium between the photocatalyst and the MB. After turning on the light, 5 mL of suspension were taken out at different intervals of time between 30–60 min. After centrifugation, the MB concentration was monitored by measuring the absorbance of the solution at 664 nm using a UV-vis spectrophotometer (UV-1801, BFRL, Beijing, China).

3. Results and Discussion

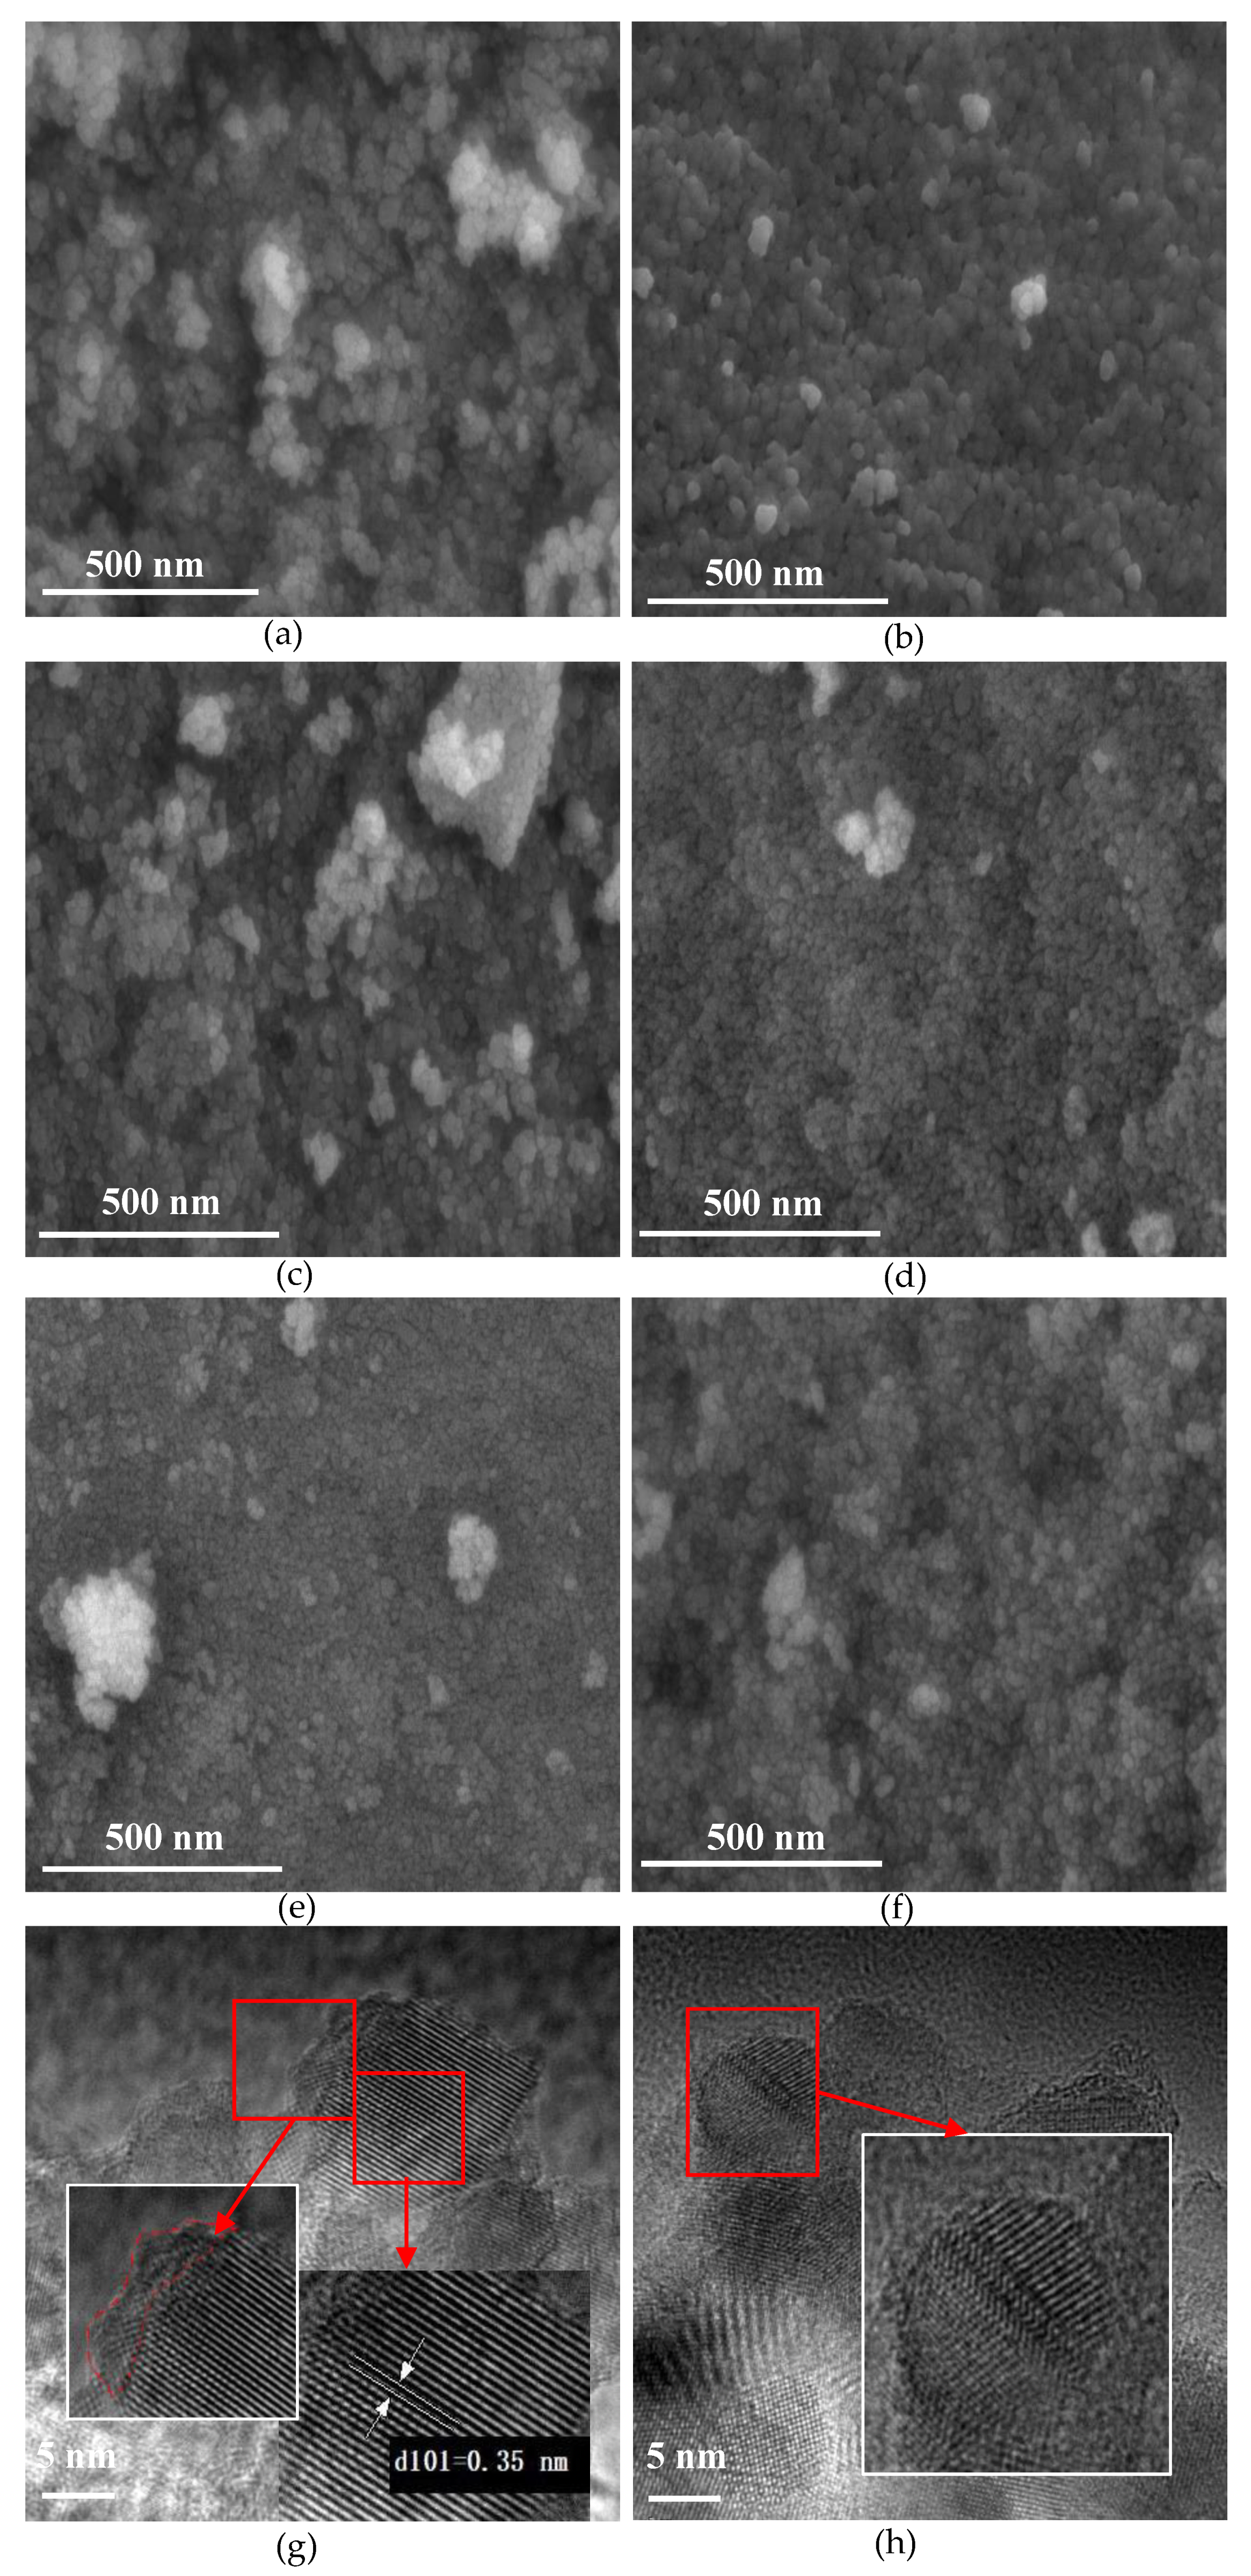
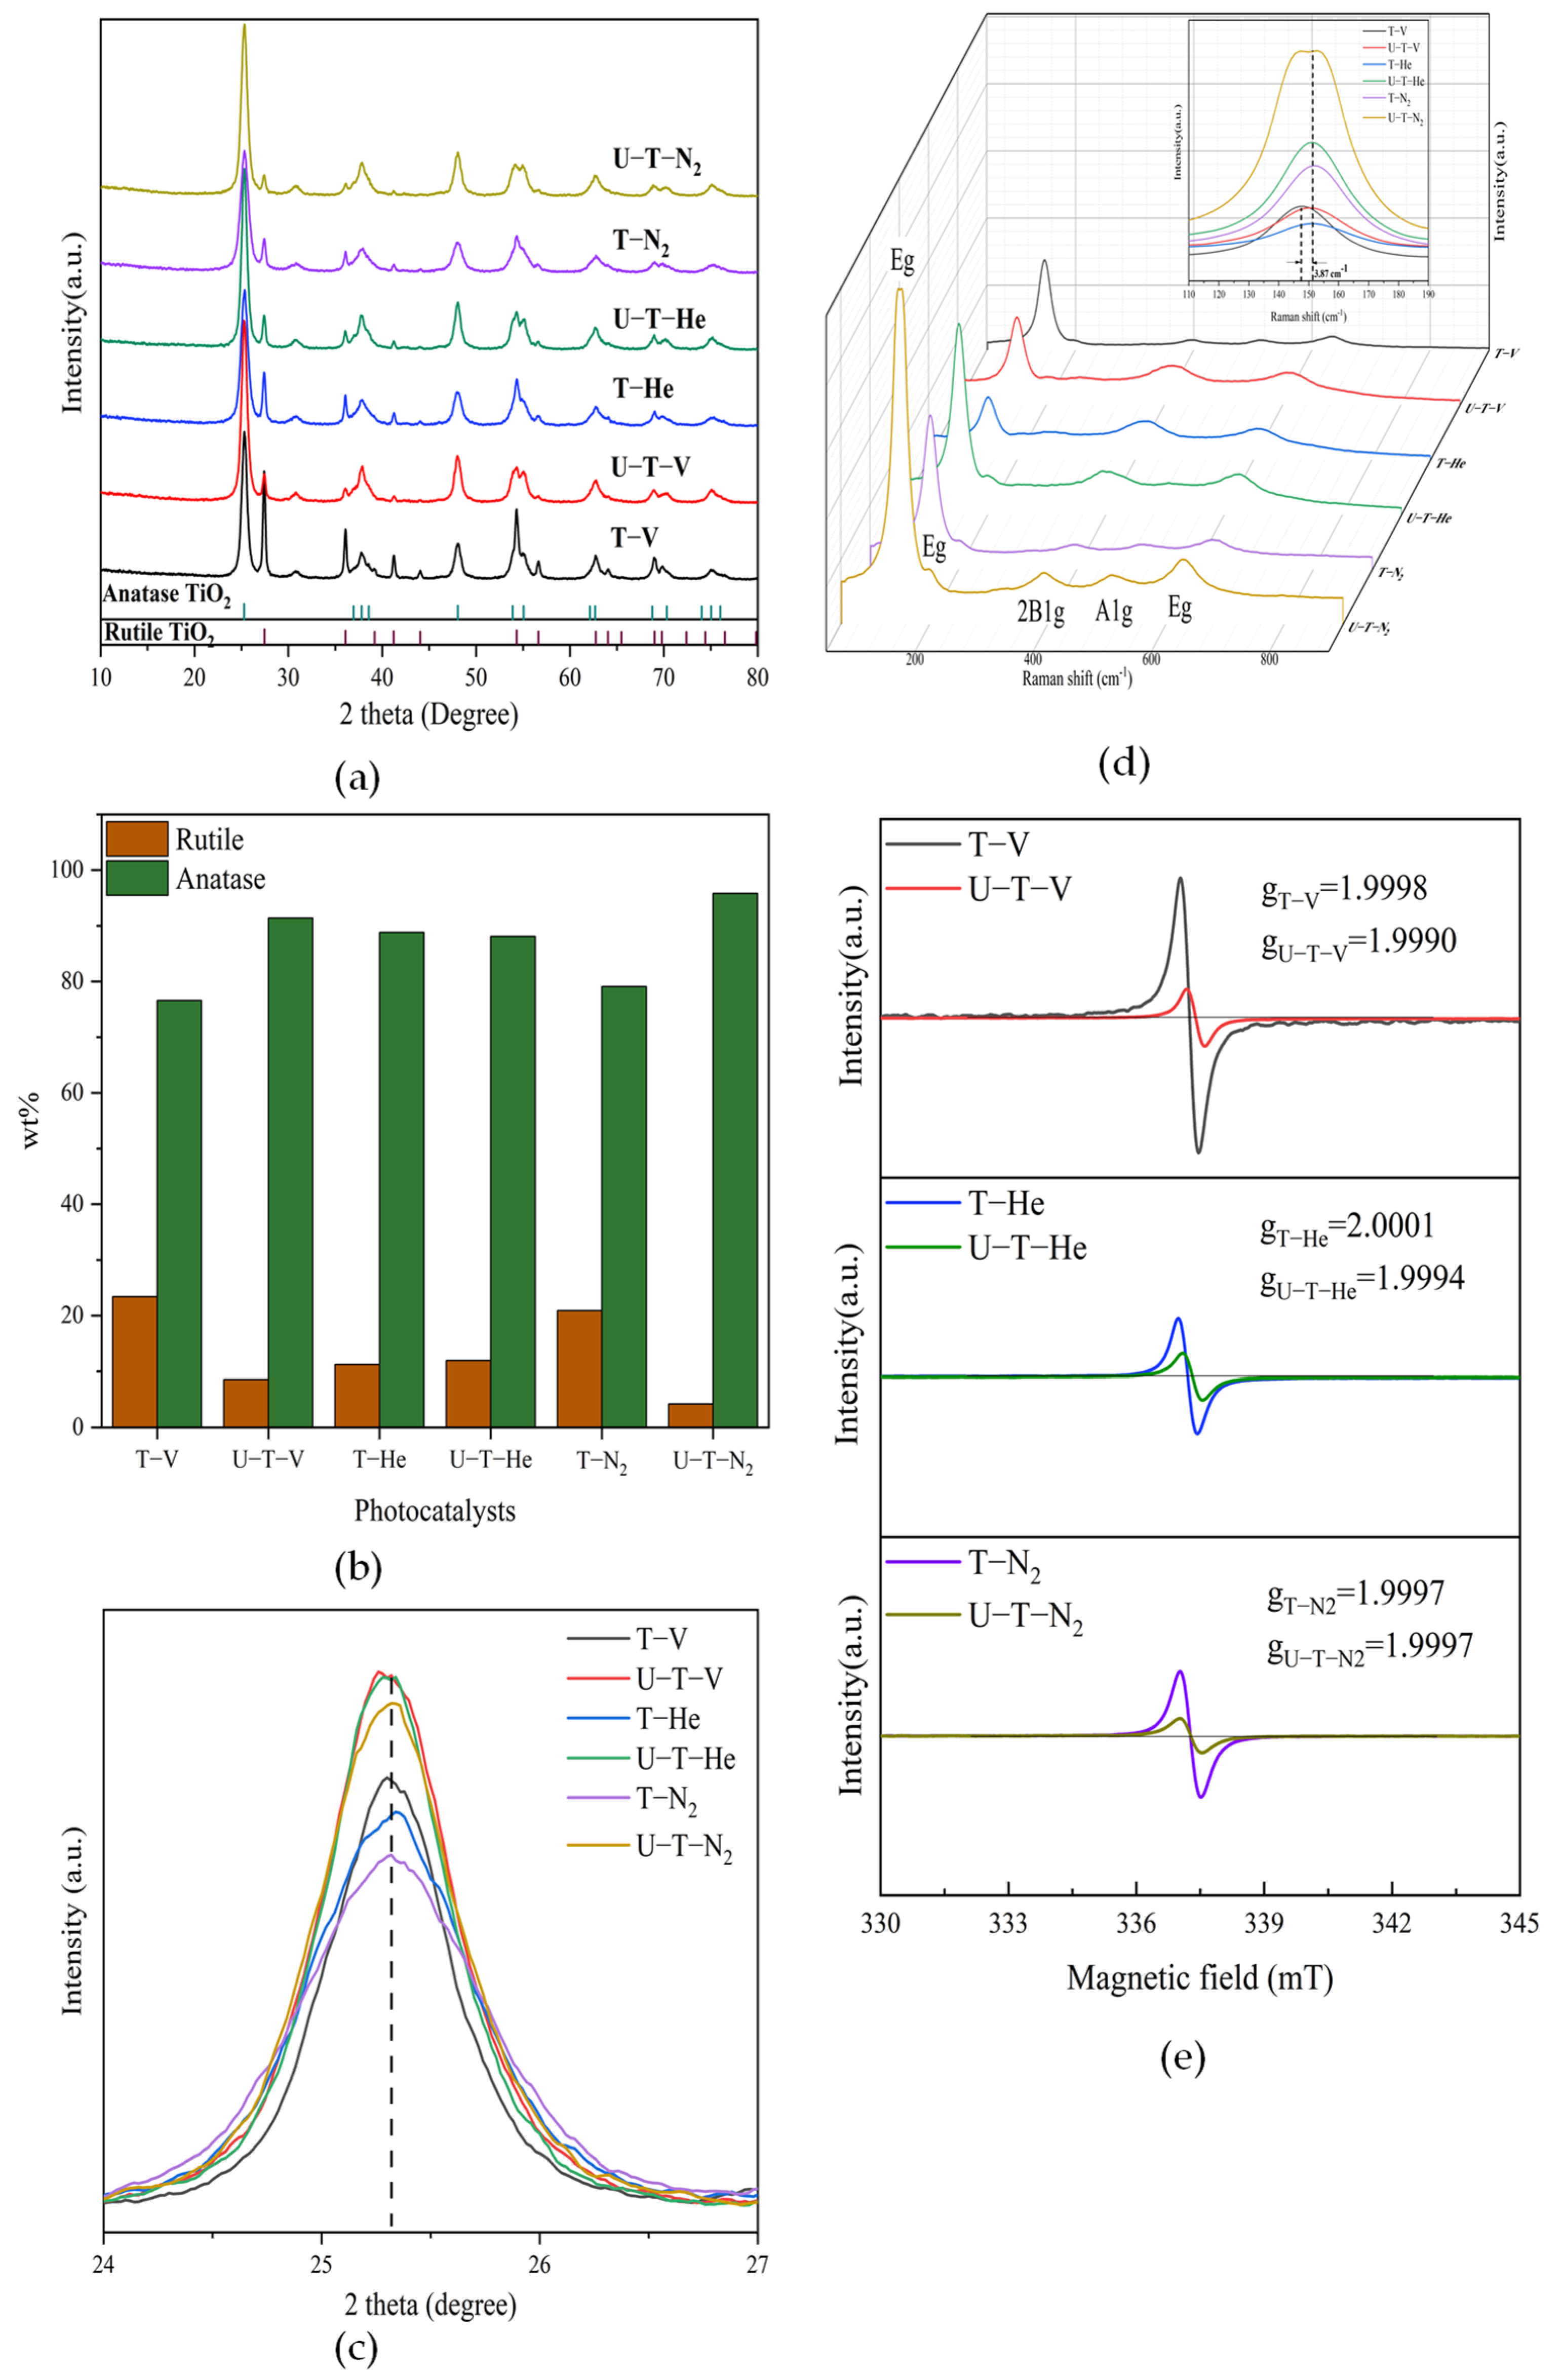
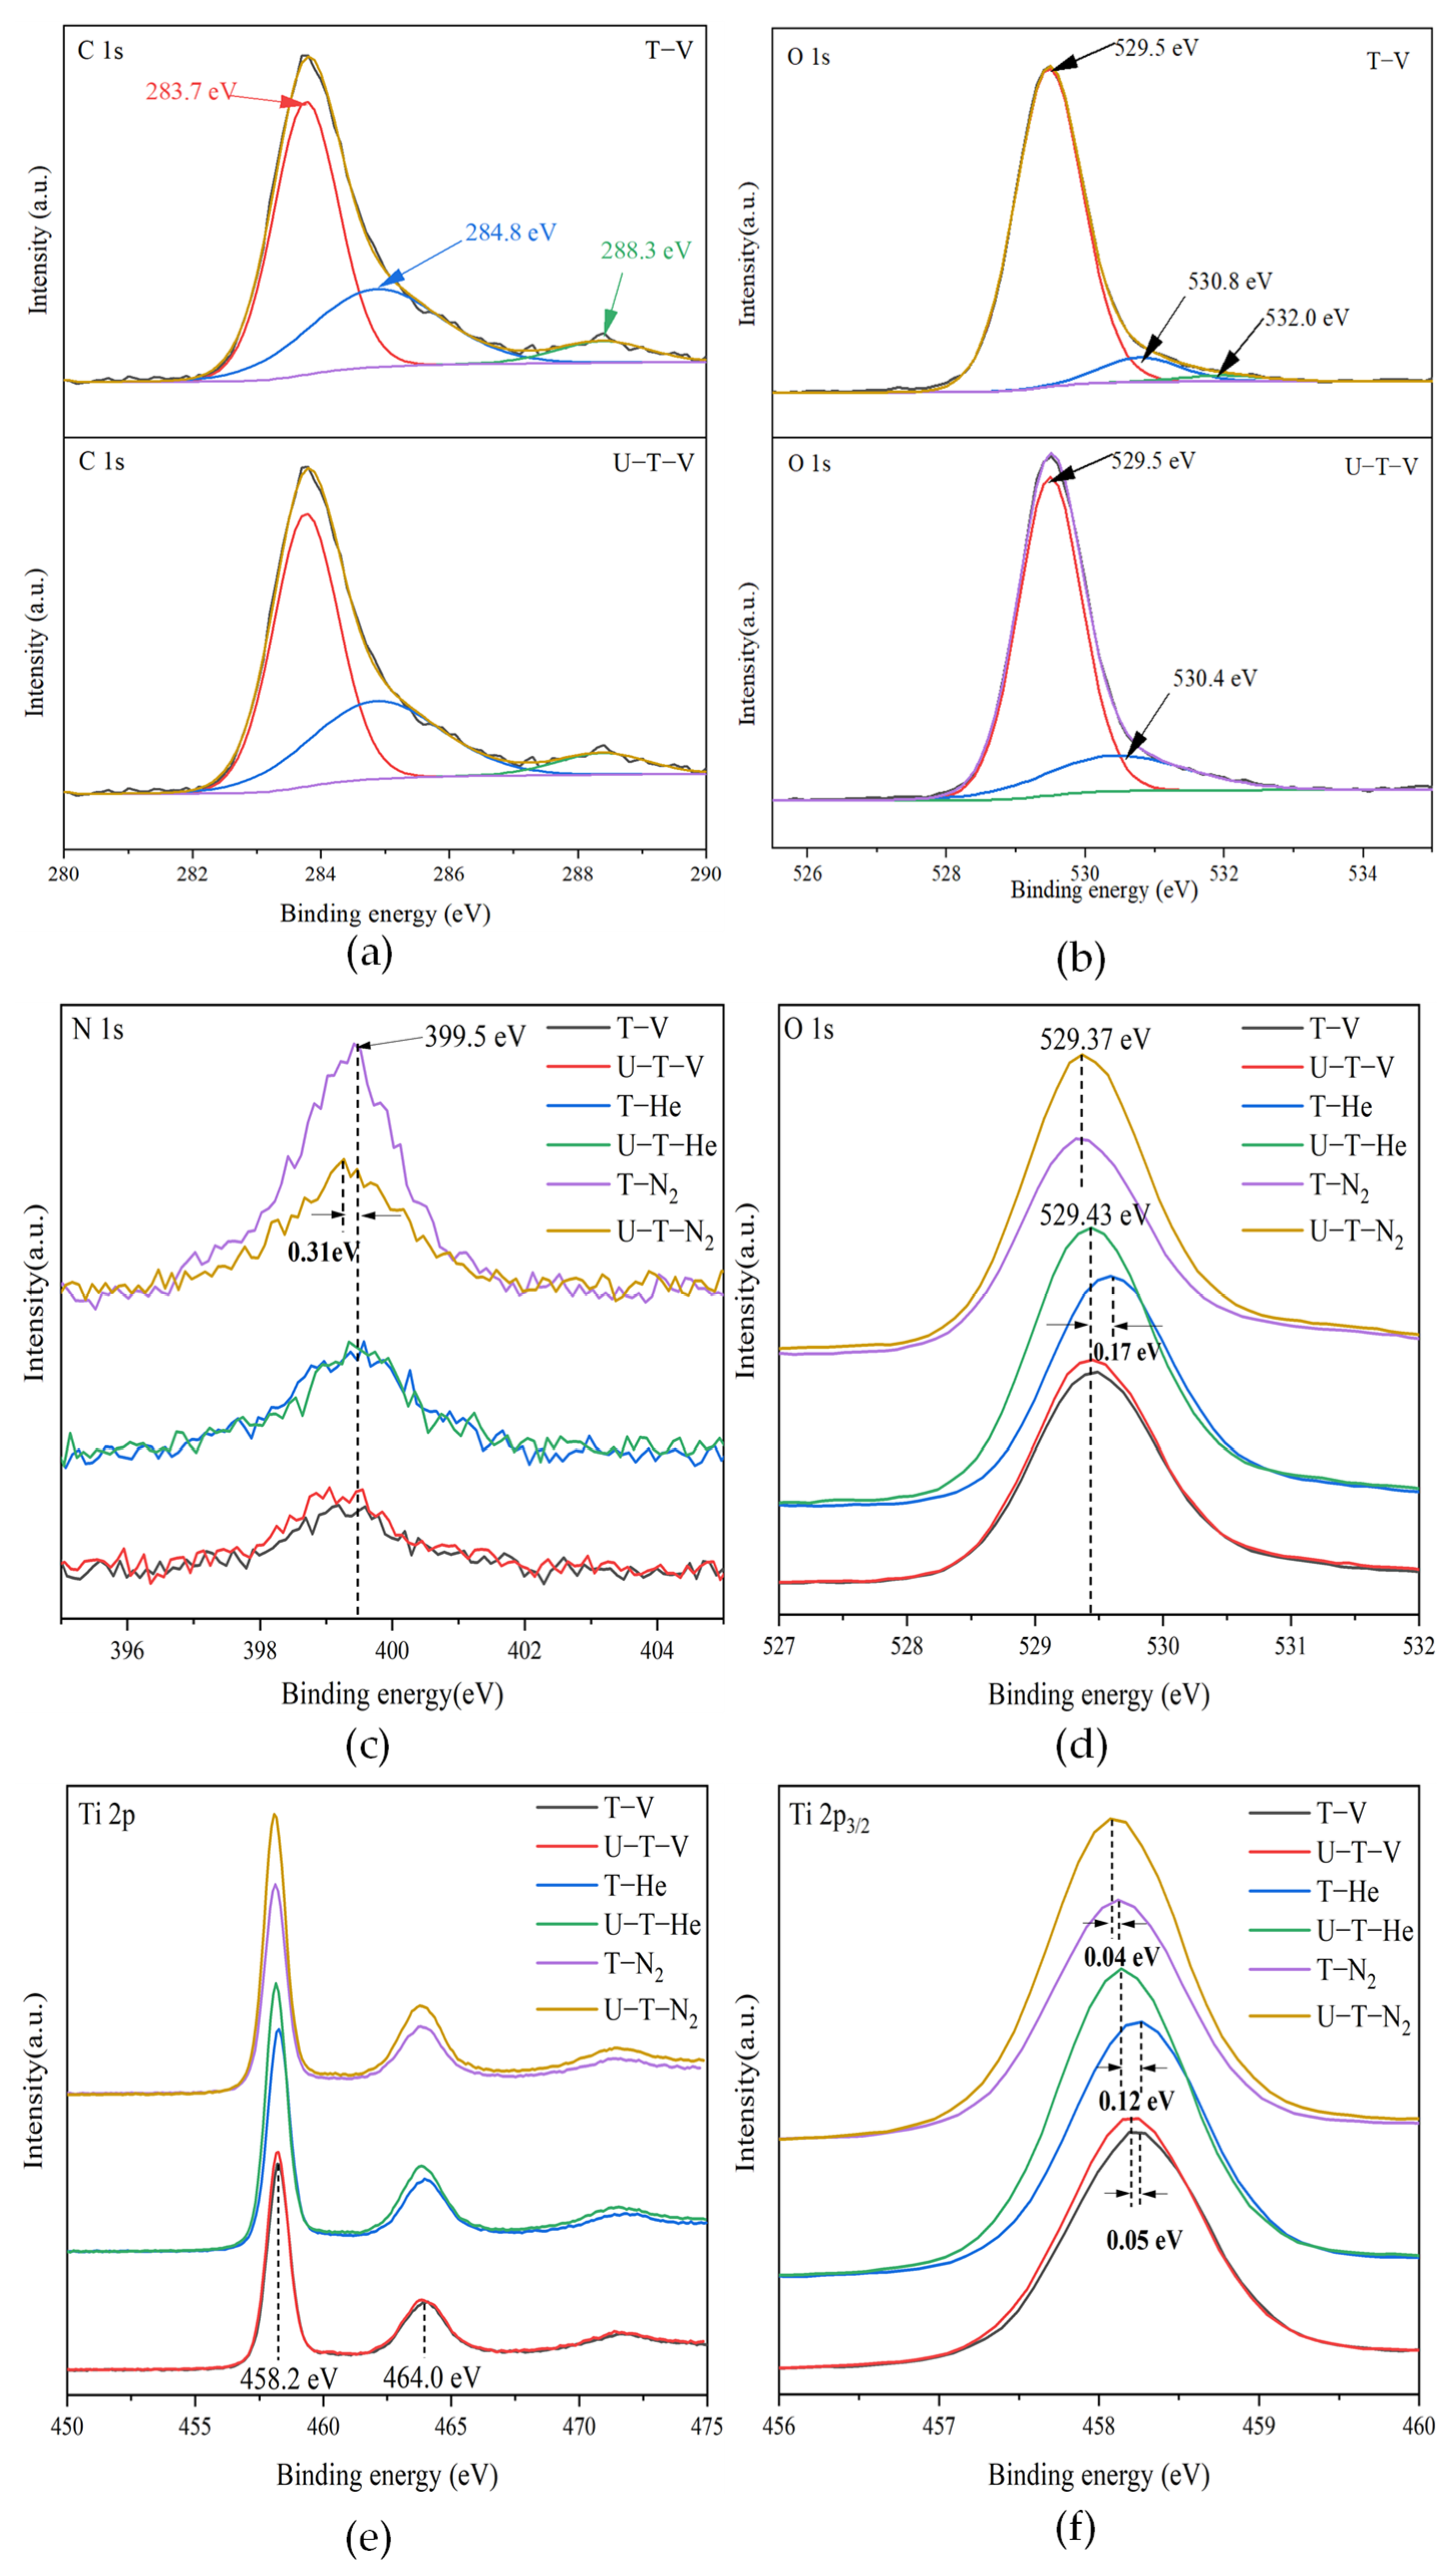
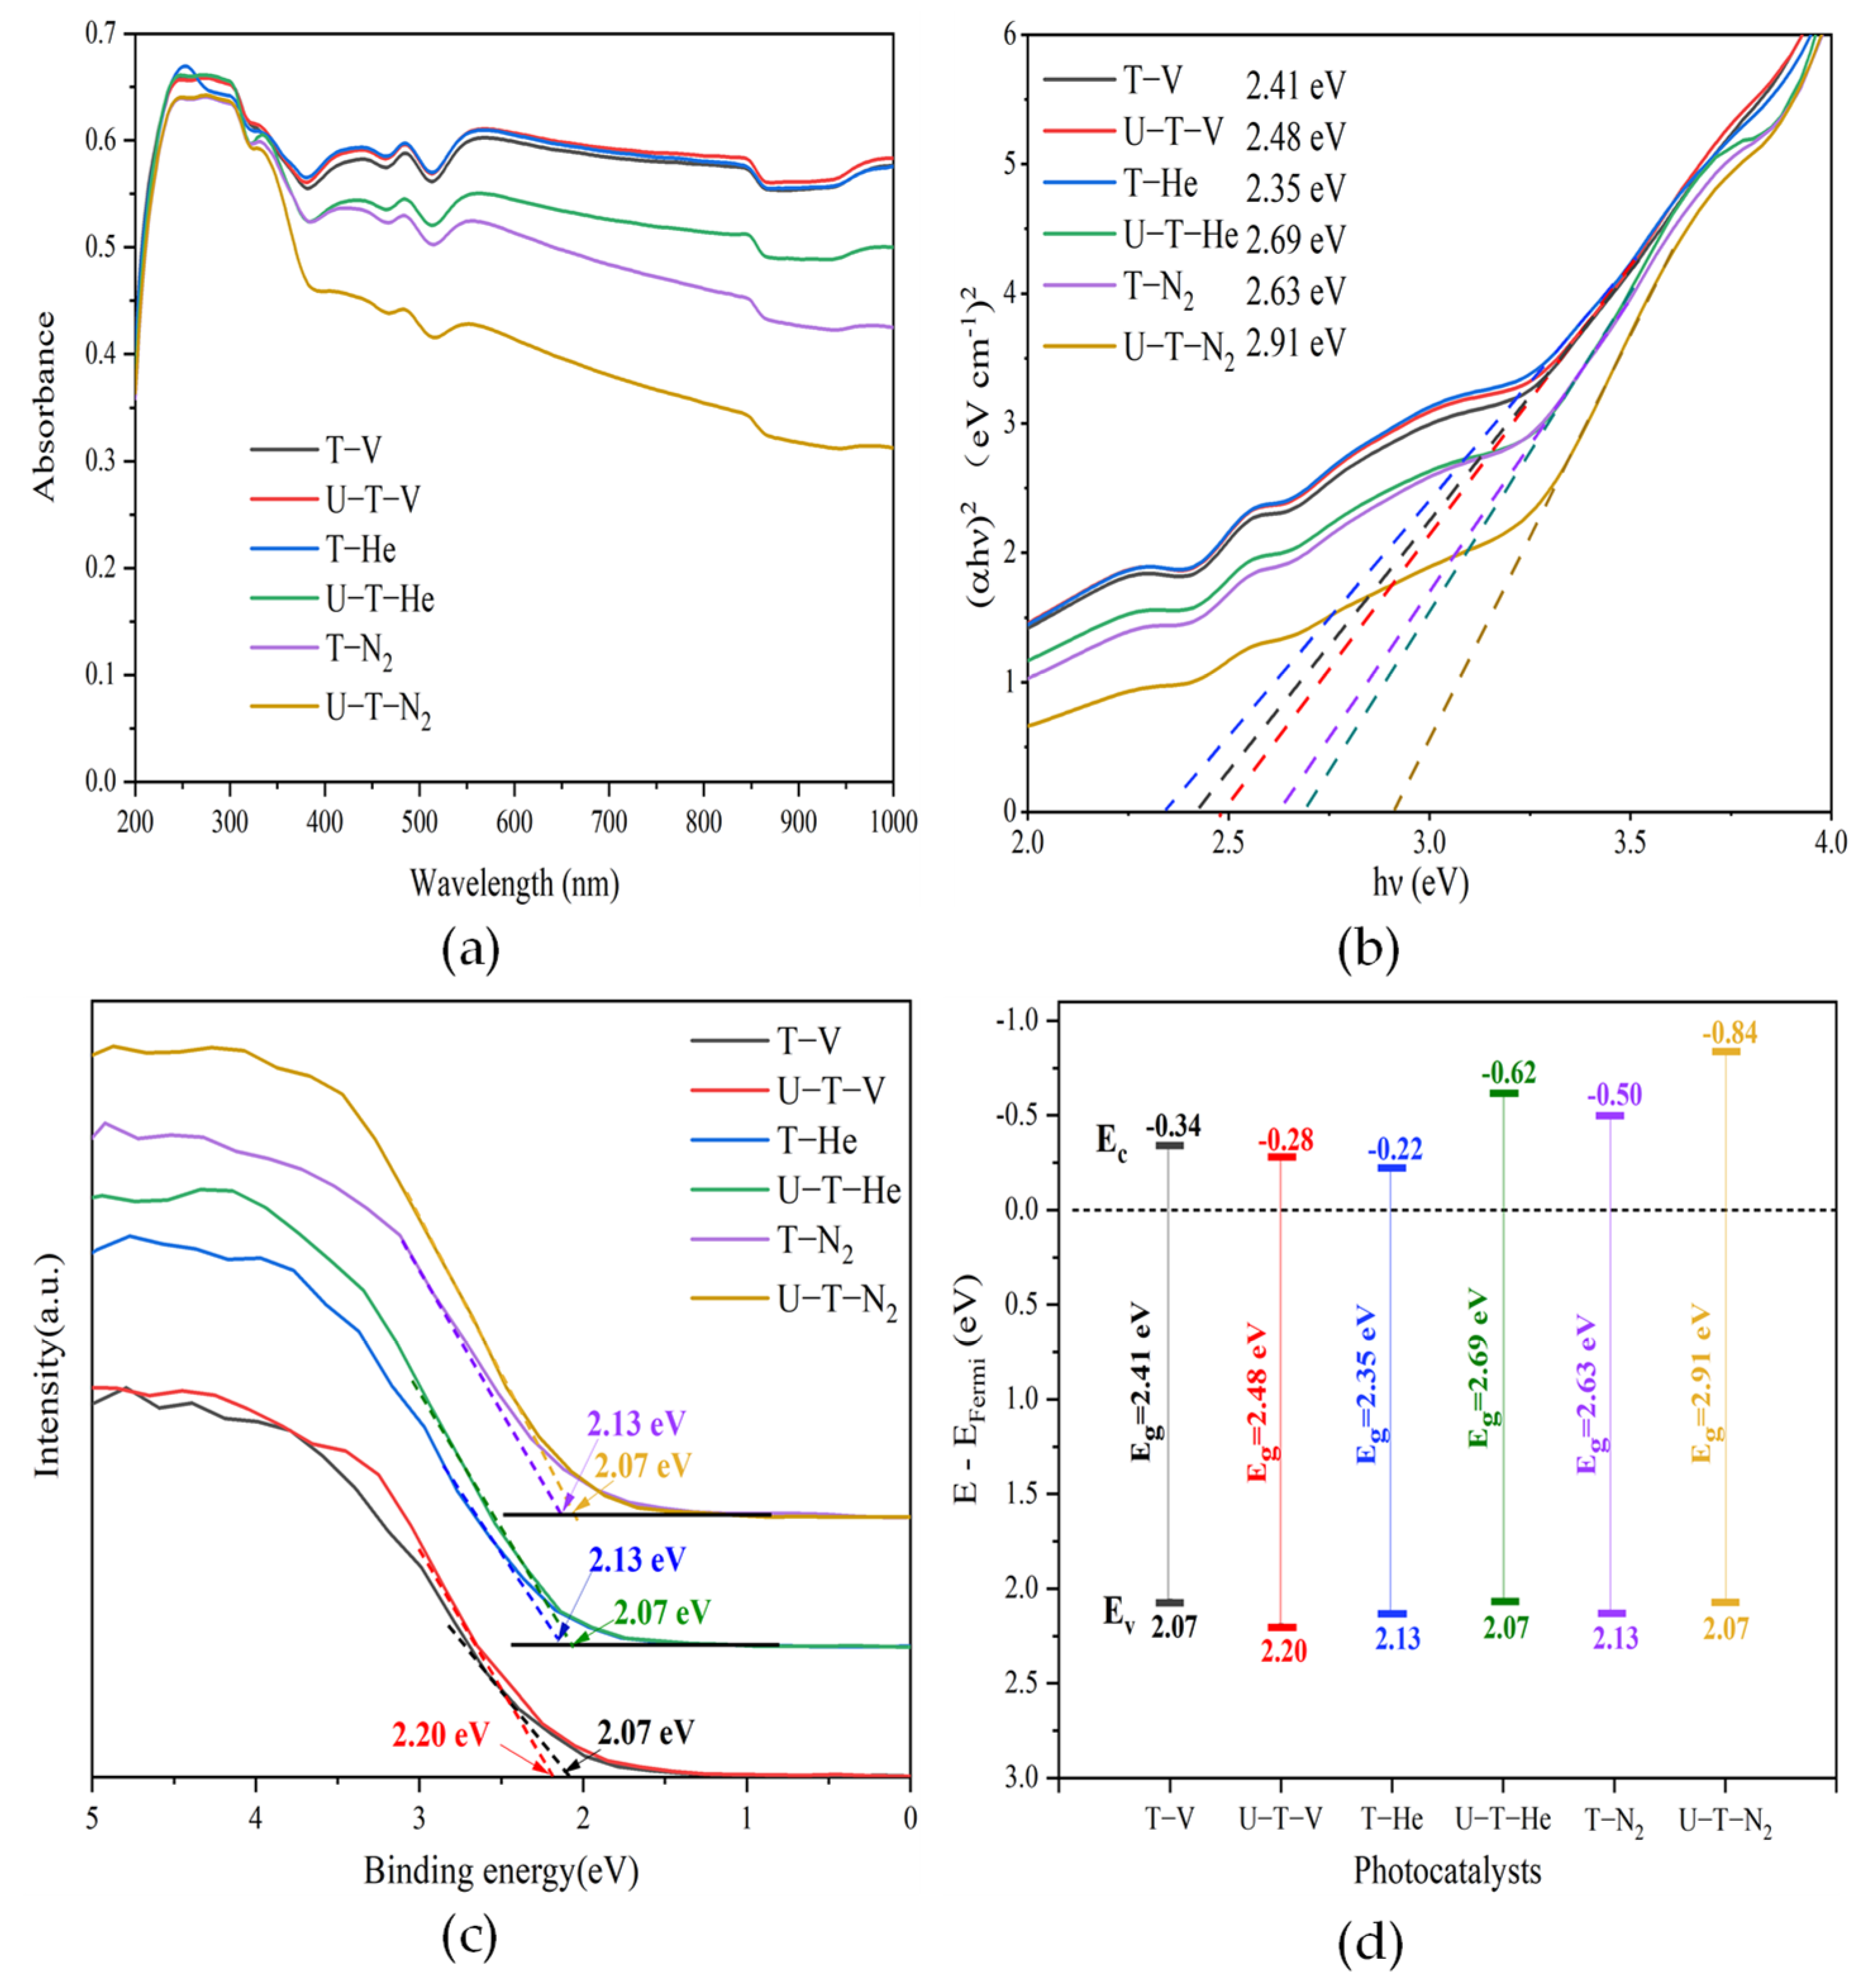
Morphological and Structural Characteristics of the Photocatalysts

The SEM images of as-prepared black TiO2 samples show an agglomeration of irregular primary nanoparticles, as shown in Figure 1a–f. For the samples annealed under a vacuum and He atmosphere, the nanoparticles without urea addition were fluffier than those with urea addition. However, the samples exhibited opposite characteristics when annealing under N2, and the sample without urea addition is flatter and more compact. The particle sizes in the SEM images were analyzed (Figure S1), and the relative data is shown in Table 1. The particle sizes of the as-prepared black TiO2 were 13–21 nm. The samples with urea addition exhibited larger particle sizes than those without urea addition for all atmospheres. The annealing atmosphere can also affect the particle size, and the N2 atmosphere leads to smaller particle sizes. U-T-V had the largest particle size and T-N2 had the smallest particle size. As shown in Figure S2, the lattice fringe of approximately 0.35 nm corresponding to the (101) plane of anatase TiO2 can be observed in all as-prepared black TiO2 samples, which indicates that anatase TiO2 is the majority of materials [18]. As shown in Figure 1g,f, the disordered surface and lattice deformation were owed to the unsaturated Ti atoms derived from the OVs [4,19]. In the TEM images of other TiO2 samples, disordered surface and lattice deformation are also observed, indicating defect formation in all as-prepared black TiO2 samples (Figures are not shown here). This proves that defects can be formed when annealed under a vacuum or inert atmosphere. The existence of defects like OVs can be confirmed by follow-up analyses.
As shown in Table 1 for the samples annealed under He or N2, a smaller material grain size provided a higher specific surface area and a smaller adsorption average pore diameter. However, for the samples annealed under vacuum, the sample with urea addition showed a higher specific surface area, which was possibly ascribed to the higher carbon content (3.5%) when compared with other samples (less than 3.0%) (the data from SEM-EDS in Table S1). The texture characteristics, such as the specific surface area and particle size, may affect the photocatalytic activity of the materials.
The XRD patterns of the as-prepared black TiO2 samples are presented in Figure 2a. The diffraction peaks of all samples were consistent with the standard pattern of anatase TiO2 (JCPDS No. 21-1272) and rutile TiO2 (JCPDS No. 21-1276), indicative of the presence of anatase and rutile TiO2 for all samples. The quantitative phase analysis was calculated from the integrated intensities of (101) peak for anatase phase and (110) peak for rutile phase using a reference intensity ratio (RIR) method [20]. As shown in Figure 2b, the weight percentage of the anatase phase was much higher than that of the rutile phase, which indicates anatase TiO2 was the majority of as-prepared samples. The U-T-N2 sample contains the least rutile TiO2 phase (4.2%), and the T-V sample contained the most rutile TiO2 phase (23.4%). Except for the samples annealed under He atmosphere, the urea addition inhibited the transfer from anatase to rutile phase for samples annealed under vacuum or N2 atmosphere. The same results had been observed in our previous study [17]. From Figure 2c, the intensities and the full width at half maxima of (101) peaks in the samples with urea addition were sharper than those in the samples without urea addition, which indicated that crystal sizes became larger [21]. The crystal sizes of as-prepared samples are determined by the Scherrer formula (as shown in Table 1). The crystal sizes of the samples with urea addition were larger than those without urea addition, which was identical to the results from the analysis of the (101) peak. From Figure 2c, the larger peak width of the samples without urea addition can also be derived from OVs and the resulting disorder-induced lattice strain, which indicated more OVs in the samples without urea addition than those with urea addition.
The phase of TiO2 can also be identified by Raman (as shown in Figure 2d,e). Six Raman-active peaks (3Eg+2B1g+A1g) of anatase TiO2 were detected, which is consistent with the results of XRD. Compared with the Raman spectra of pristine anatase TiO2 located at 143, 196, 326, 395, 512, 645 cm−1 [22], the Raman spectra of all as-prepared black TiO2 in this study occurred redshift, which could be ascribed to the lattice distortion and low crystallinity [23]. In other words, the formation of OVs in all samples was confirmed by Raman spectra. As shown in Figure 2e, T-He and T-N2 showed higher wavenumbers than U-T-He and U-T-N2, which was evidence of more OVs in the samples without urea addition than in the samples with urea addition and annealed under He and N2 [23]. The results are consistent with the EPR signals in Figure 2f. It was noted that the Raman shifts of the samples annealed under a vacuum did not support the amount of formed OVs. The Raman spectra of U-T-V occurred red shift compared with that of T-V. However, the sample T-V showed a higher EPR signal area. On the other hand, the intensities of Raman signals showed different trends for samples annealed under vacuum or inert atmospheres. For the samples with urea addition annealed under inert atmospheres, the Raman intensities are higher than those without urea addition, which confirms that there are more OVs without urea addition than with urea addition, due to the inverse relationship between the Raman intensity and the amount of OVs [24]. For the samples with and without urea addition annealed under the vacuum condition, the Raman intensity is similar. This is evidence of the different effects of vacuum and inert atmospheres on the properties of black TiO2. The reasons for the differences will be explained in the following analysis.
The OVs states in the as-prepared black TiO2 were investigated by EPR, which identify unpaired electrons in paramagnetic species. The g-factor extracted from the EPR spectra provides a qualitative analysis of defect species. The g-factors were calculated using the formula: g = 71.44ν/Β, where ν is the microwave frequency of X—band spectrometer (GHz) and B is the applied magnetic field (mT). All calculated g-factors are displayed in Figure 2d. As can be seen in Figure 2d, the obvious symmetrical signals at g≈2.000 were detected in all samples, which can be ascribed to the formation of defects in samples [25]. The g-factors of the samples with urea addition annealed in a vacuum and He atmosphere experienced a slight shift compared with that without urea addition. In general, the deviation of g-value from a standard value for free-electron (ge = 2.0023) and shape (symmetric or asymmetric) of the EPR signal provides direct evidence of intrinsic defective domains within the TiO2 lattice [26]. The g-values of <2.0023 with isotropic components (symmetric signal) in this study arise from OVs with one trapped electron [27]. On the other hand, the intensity of the signals reflects the relative concentration of the paramagnetic centers [28,29]. As shown in Figure 2d, the sample T-V exhibited the strongest signal. Concerning the three groups of samples annealed in different atmospheres, the sample without urea addition showed a higher EPR signal than that with urea addition. The results show that vacuum condition was more beneficial for OVs formation than the inert gases (He and N2) and that urea addition inhibited OVs formation.
On one hand, why was the vacuum condition more beneficial for OVs formation than the inert gas? It has been reported that OVs can be created by annealing the semiconductor oxides in an oxygen-deficient atmosphere, such as pure He, N2, or vacuum conditions [28]. The formation of OVs in the TiO2 samples under vacuum or oxygen-deficient atmosphere can be ascribed to the removal of the oxygen in the lattice (OL) of TiO2, which can be demonstrated by an equilibrium reaction (Equation (1)) [30]:
OL = 1/2O2(g) + OV + 2e
It can be deduced that the concentration of OVs increases with a decrease in O2 pressure. The oxygen-depleted condition under thermal annealing would facilitate the formation of OVs [31]. The vacuum condition is, therefore, better than inert gas for oxygen gas release due to its lower pressure, which causes the formation of the most OVs in the sample T-V.
On the other hand, why did the addition of urea inhibit the formation of OVs? Our previous study revealed that the addition of urea addition as an N precursor inhibited the incorporation of N and the production of OVs [17]. Nevertheless, it had been previously revealed that N doping facilitates the formation of OVs [32]. In other words, the urea addition inhibited the N doping directly and then decreased the production of OVs. Furthermore, some researchers have reported that it was more difficult for N atoms to enter the TiO2 lattice for the doped TiO2 samples prepared from a one-step reaction of crystalline TiO2 and N-containing precursor [2], just like in this study. Therefore, it needs to be made clear whether the N was incorporated into the lattice of black TiO2 successfully for the samples with urea addition, which can be concluded from the following XPS study.
XPS was performed to analyze the chemical states of as-prepared samples. The C–C peak at 284.8 eV was used as a charge correction reference. Taking the samples of T-V and U-T-V as examples, there were common peaks located at 284.8 eV for the C 1s spectra of the samples T-V and U-T-V, as shown in Figure 3a, which can be attributed to surface carbon with C–C bond due to carbon from the internal standard used during the XPS measurements. Some studies suggested that the peak at 288.3 eV was assigned to the C–N bond from the nitrogen precursor, like urea in this study [33]. It was noticed that the peak at 288.3 eV exists in the C 1s spectra of both T-V and U-T-V samples, while there was no nitrogen source added to the T-V sample. Therefore, it is possible that the C–N bond came from the N impurity in the measurement environments, rather than the added urea itself. The urea addition did not affect the production of C–N, which can be analyzed again by the XPS spectra of N 1s. No peak at ca. 281 eV associated with the Ti–C bond was detected, suggesting that oxygen was not substituted by carbon in the lattice of black TiO2 [34]. As shown in Figure 3c, the samples, except U-T-N2, display only one N 1s core level peak at around 399.5 eV, indicating that most samples contain uniform N species. In some studies, the main peak of N 1s, located at 399.5–399.7 eV, contributed to the substitutional N in N–Ti–O [35,36], where the N atoms replaced some lattice oxygen. Some other studies revealed that the peak at about 400 eV could be assigned to molecularly chemisorbed γ-N2 [37]. In this study, the samples without urea addition do not contain an N source during synthesis processes, thus the peak of N 1s at about 399.5 eV could be attributed to the chemisorbed N2 in the environment. The intensities of N 1s for the samples annealed in the N2 atmosphere are higher than that annealed in a vacuum and He atmosphere, which confirms the N2 absorbed on the surface of materials. There is a slight blue shift of 0.31 eV for the N 1s in the U-T-N2 sample, indicating the formation of other N-containing substances. In some studies, the peak of N 1s located at 399.2 eV can be ascribed to amines (NHx) [38], which is from the decomposition of urea under the N2 atmosphere. According to the XPS spectra of O 1s (as shown in Figure 3c), all the samples show lower-energy shifts than the O 1s located at 529.9 eV in the Ti–O linkages of TiO2. The conclusion of OVs formation can be obtained from the lower-energy shift of O 1s peaks compared with that of the pristine TiO2 [39]. For the samples annealed under vacuum, both O 1s spectra showed two peaks, as shown in Figure 3b. The major peak located at around 529.5 eV could be associated with the lattice oxygen in TiO2, which is the characteristic of the chemical bonding between metal and oxygen atoms. The other peak located at around 531.0 eV corresponded to the surface absorbed oxygen, which has a variety of origins, such as O, O2 and O−2 [40]. These adsorbed oxygen species in XPS spectra are derived from the formation of OVs in TiO2. Thus, the relative density of OVs can be quantitatively estimated by measuring the relative intensity ratio (RIR) of O 1s (lattice oxygen)/O 1s (adsorbed oxygen) [25,41]. The estimated RIRs of T-V and U-T-V are 3.43 and 3.54, respectively. The increase of RIR for U-T-V indicates fewer OVs than that in T-V, which is consistent with the EPR results.
Figure 3e shows the characteristic Ti 2p peaks of all samples. The Ti 2p peaks of T-V located at 464.0 eV and 458.2 eV, correspond to Ti 2p1/2 and Ti 2p3/2, respectively. Compared with the Ti 2p peaks (464. 6 and 458.8 eV for Ti 2p1/2 and Ti 2p 3/2) of pristine TiO2, the peaks of Ti 2p in all black TiO2 shifted to lower energy. A shift of Ti 2p to lower binding energy is owed to the OVs formation, which is consistent with previous studies [39,42]. Concerning enlarged Ti 2p3/2 peaks of all samples in Figure 3f, the samples with urea addition (U-T-V, U-T-He, and U-T-N2) show lower-energy shifts of 0.05, 0.12, and 0.04 eV, respectively, compared with the samples without urea addition (T-V, T-He, and T-N2), indicating an increase in electron density around Ti atoms after urea addition. In conclusion, the XPS results reveal the formation of OVs and no N or C incorporation in the lattice of black TiO2.
Figure 4a shows the UV-vis spectral absorbance of the samples. The TiO2 samples annealed under inert gas or vacuum conditions exhibited a broad light absorption in the range of 200–1000 nm. The samples of T-V, U-T-V, and T-He displayed much stronger light absorption than the other three samples. The strong light absorption of the samples can be attributed to the disordered surface layer due to the OVs formation [43], which was observed from the TEM images. The bandgaps can be evaluated from the plots of (αhν)2 versus , as shown in Figure 4b. The bandgap energies were estimated to be 2.41, 2.48, 2.35, 2.69, 2.63, and 2.91 eV for T-V, U-T-V, T-He, U-T-He, T-N2, and U-T-N2, respectively. The formation of OVs by the O2− replacement in the regular lattice of TiO2 induced a donor level below the conduction band (CB), which is normally at 0.75–1.18 below the CB of TiO2 [31], resulting in a narrower bandgap of the samples. Figure 4c exhibited the XPS spectra of VB of the samples, where the energies of VB (Ev) (the difference of the valence band edge below the Fermi energy) are 2.07, 2.20, 2.13, 2.07, 2.13, and 2.07 eV for T-V, U-T-V, T-He, U-T-He, T-N2, and U-T-N2, respectively. It should be noted that the urea addition did not influence the VB energy. The materials annealing under N2 exhibited a higher position of VB than those annealed under vacuum or He atmosphere. As is well known, OV does not influence the VB [42]. On the other hand, according to the XPS results of N 1s, there was no N doping in the samples. How did the shift of VB states happen? As is observed in the TEM images, the disordered layer and lattice deformation existed in all samples. On-lattice disorders in TiO2 nanocrystal induced midgap states which upshifted the VB edge of TiO2 nanocrystals, accompanied by a reduced bandgap [4]. For the samples annealed under He and N2, the introduced urea benefited the disordered layer and lattice deformation, and then upshifted the VB edge higher. However, for the samples annealed under the vacuum condition, the sample without urea addition exhibited a higher upshift. Based on the energies of the bandgap and the VB of as-prepared samples, the electronic band structures of the samples are summarized in Figure 4d.
It should be noticed that ROS production depends not only on the band structure, but also on the separation and recombination efficiency of photo-induced electrons and holes under light irradiation. Therefore, based on the above characteristics of light absorption, bandgap, and band construction of all the samples, the separation and recombination efficiencies of light-induced charges are observed from the results of the EIS Nyquist plots and PL emission spectra, as shown in Figure 5a,b.
Figure 5a shows EIS Nyquist plots for all of the samples. The relative sizes of circular arc radii correspond to the charge transfer resistance and separation efficiency of photo-induced electrons and holes [44]. The relative arc sizes are in the following order: U-T-V > T-V > T-He. The other three samples exhibited similar but smaller arc sizes. The sample U-T-V showed the smallest circular arc radius, indicating that it has the highest electron-hole pair separation and electron transfer efficiency to electron donor/acceptor. Figure 5b shows the PL emission spectra of all the samples in the range of 430–500 nm with an excitation wavelength of 365 nm, resulting from the recombination of free carriers. The excitonic PL resulted from surface OVs and defects of the samples. All the emission spectra shapes are similar, and three main emission peaks are located at 451, 469, and 482 nm, respectively. The peaks at 451 and 469 nm are attributed to band edge free excitons, and the peak at 482 nm is attributed to bound excitons [45]. The intensity of the peak at 469 nm reached the summit of the survey spectrum, demonstrating the formation of OVs in the lattice of the samples [46]. The samples annealing under the N2 atmosphere showed the highest emission intensity. T-V, U-T-V, and T-He exhibited similar but lower emission intensities, indicating a reduced recombination rate of photogenerated electrons and holes in the above three samples. The results agreed well with the results of the EIS test shown in Figure 5a. T-V, U-T-V, and T-He displayed faster interfacial charge transfers and lower charge recombination rates, which are the basic benefits of higher photocatalytic activities.
Except for the charge separation and transfer, the formation of ROS is also attributed to band structure. Based on the band structures of all samples shown in Figure 4d, the production of ·OH and ·O2 has been proposed in the above analysis. As shown in Figure 5 in the DMPO+water system, the EPR spectra measured after irradiation of the samples in water with DMPO exhibited a quartet with hyperfine coupling constants, AN = AH = 1.50 mT. The values are consistent with reported values for the DMPO-·OH spin adduct [47]. In the DMPO+methanol system, the EPR spectra measured after irradiation of the samples in methanol with DMPO were different from DMPO-·OH. Evaluated hyperfine coupling constants AN = 1.53 mT, AH = 2.16 mT suggest the generation of the superoxide radical adduct DMPO-·CH3 [48], which is a strong indicator of ·OH, since ·OH could react rapidly with DMPO to yield DMPO-·CH3 at the expense of DMPO-·OH [48]. Here the EPR results of DMPO-·OH DMPO-··CH3 confirmed the production of ·OH. According to the intensity of the DMPO-·OH and DMPO-·CH3 signals, the sample T-V, U-T-V, and T-He generated more ·OH than the other samples. The photocatalytic activities of as-prepared samples for oxide organic pollutants depend on the production of ROS.
The photocatalytic activity of the samples was determined by the degradation of MB under simulated solar light irradiation. Before conducting a photocatalytic activity investigation, it is essential to study the adsorption ability for MB onto the surface of the samples, due to its pivotal role in further photocatalytic degradation. All the samples exhibited different adsorption abilities for MB, with the following order: U-T-V > T-V > T-He > T-N2 > U-T-He > U-T-N2. The sample U-T-V displayed the best MB adsorption ability, with 69.36% of MB molecules adsorbed on the surface after 0.5 h of mixing in the dark, as shown in Figure S3a. After the simulated solar light irradiation, the MB concentrations in the solutions decreased rapidly, as shown in Figure 6a. The MB removal rates over the three samples T-V, U-T-V, and T-He were 98.38%, 99.40%, and 97.10%, respectively, after 4 h of irradiation under simulated solar light, which exhibited better MB degradation than pure P25, with a 91.34% removal rate. For the other three samples, i.e., U-T-He, T-N2, and U-T-N2, the MB removal rates were lower, at 79.25%, 77.34%, and 88.25%, respectively. The performance was further quantified with kinetic rate plots (as shown in Figure S3b) as a pseudo-first-order reaction. The calculated kinetic rate constants for the samples T-V, U-T-V, T-He, U-T-He, T-N2, U-T-N2, and P25 are 0.693 ± 0.023, 1.038 ± 0.047, 0,612 ± 0.036, 0.325 ± 0.009, 0.255 ± 0.008, 0.477 ± 0.016, and 0.656± 0.032 h−1, respectively, with an order of U-T-V > T-V > P25 > T-He > U-T-N2 > U-T-He > T-N2. The U-T-V sample exhibited the highest kinetic rate, which was 3.9 times higher than that of T-N2, which had the lowest kinetic rate.
The samples annealed under a vacuum atmosphere displayed the best photocatalytic activities for MB degradation compared with the samples annealed under He or N2 atmospheres, as a result of better MB adsorption capacities and visible light absorption abilities, production of more OVs, narrower bandgaps, a more positive VB position, more efficient charge separation, and transfer, and production of more ·OH. For the samples that annealed under the vacuum condition, the urea addition enhanced the MB adsorption capacity and degradation efficiency, which is potentially due to the larger surface area and higher efficiency of charge separation and transfer than that without urea addition.

4. Conclusions

A series of black TiO2 with or without urea addition were synthesized by calcination under different atmospheres (vacuum, He, or N2). The vacuum condition was more beneficial for the formation of OVs than the inert gases (He and N2) and urea addition inhibited OVs formation. There are no elements (N and C) incorporated into the lattice of black TiO2. It is the produced OVs and disordered layers that narrow the bandgap of black TiO2 via downshift of CB and upshift of VB. The samples annealed under the vacuum condition exhibited better visible-light adsorption abilities, narrower bandgaps, higher photo-induced charges separation efficiency, and lower recombination rates. The ·OH was the dominant oxidative species for the samples, and the samples annealed under the vacuum condition produced more ·OH than the other samples annealed under N2 atmosphere. Based on the differences between the as-prepared samples, the materials annealed under vacuum displayed higher photocatalytic activity for MB degradation compared with other materials. For the series of black TiO2, the material with urea addition annealed under vacuum exhibited the highest kinetic rate, which was 3.9 times higher than that of the material without urea addition under N2 owning the lowest kinetic rate. In general, the vacuum condition was better than inert atmospheres (He and N2) at synthesizing black TiO2, and urea addition enhanced photocatalytic activity, although it reduced the production of OVs.

Supplementary Materials

The following are available online at https://www.mdpi.com/article/10.3390/nano11102648/s1, Figure S1: Particle size distribution of (a) T-V, (b) U-T-V, (c) T-He, (d) U-T-He, (e) T-N2, and (f) U-T-N2., Figure S2: HR-TEM images showing lattice fringes of (a) T-V, (b) U-T-V, (c) T-He, (d) U-T-He, (e) T-N2, and (f) U-T-N2, Figure S3: (a) The adsorption capacity of as-prepared samples towards MB pollutant; (b) The fitting curves of ln(C0/Ct) versus Time (h). Table S1: Element contents (wt%) of the as-prepared black TiO2 samples by SEM-EDS.

Author Contributions

X.Z.: Investigation, Validation, Funding acquisition, Data curation, writing—original draft. M.C.: Methodology, Formal analysis. N.C.: Formal analysis, G.C.: Resources. G.Z.: Data Curation. Validation, Resources. L.Z.: Conceptualization, Project administration, Writing—review and editing. All authors have read and agreed to the published version of the manuscript.

Funding

This research was funded by SHANGHAI SAILING PROGRAM, grant number 21YF1440900, NATURAL SCIENCE FOUNDATION OF SHANGHAI, grant numbers 21ZR1456700; and NATIONAL NATURAL SCIENCE FOUNDATION OF CHINA, grant number 42007147.

Conflicts of Interest

The authors declare no conflict of interest. The funders had no role in the design of the study; in the collection, analyses, or interpretation of data; in the writing of the manuscript, or in the decision to publish the results.

References

  1. Ochiai, T.; Fujishima, A. Photoelectrochemical properties of TiO2 photocatalyst and its applications for environmental purification. J. Photoch. Photobio. C 2012, 13, 247–262. [Google Scholar] [CrossRef]
  2. Chen, X.B.; Liu, L.; Huang, F.Q. Black titanium dioxide (TiO2) nanomaterials. Chem. Soc. Rev. 2015, 44, 1861–1885. [Google Scholar] [CrossRef] [PubMed]
  3. Choi, W.Y.; Termin, A.; Hoffmann, M.R. The role of metal-ion dopants in quantum-sized TiO2 - correlation between photoreactivity and charge-carrier recombination dynamics. J. Phys. Chem. 1994, 98, 13669–13679. [Google Scholar] [CrossRef]
  4. Chen, X.; Liu, L.; Yu, P.Y.; Mao, S.S. Increasing solar absorption for photocatalysis with black hydrogenated titanium dioxide nanocrystals. Science 2011, 331, 746–750. [Google Scholar] [CrossRef] [PubMed]
  5. Liu, X.; Zhu, G.; Wang, X.; Yuan, X.; Lin, T.; Huang, F. Progress in black titania: A new material for advanced photocatalysis. Adv. Energy Mater. 2016, 6, 1600452. [Google Scholar] [CrossRef]
  6. Zu, D.; Wang, H.Y.; Lin, S.; Ou, G.; Wei, H.H.; Sun, S.Q.; Wu, H. Oxygen-deficient metal oxides: Synthesis routes and applications in energy and environment. Nano Res. 2019, 12, 2150–2163. [Google Scholar] [CrossRef]
  7. Tian, M.; Mahjouri-Samani, M.; Eres, G.; Sachan, R.; Yoon, M.; Chisholm, M.F.; Wang, K.; Puretzky, A.A.; Rouleau, C.M.; Geohegan, D.B.; et al. Structure and formation mechanism of black TiO2 nanoparticles. ACS Nano 2015, 9, 10482–10488. [Google Scholar] [CrossRef]
  8. Katal, R.; Salehi, M.; Farahani, M.; Masudy-Panah, S.; Hu, J. Preparation of a new type of black TiO2 under a vacuum atmosphere for sunlight photocatalysis. ACS Appl. Mater. Inter. 2018, 10, 35316–35326. [Google Scholar] [CrossRef]
  9. Huang, H.L.; Hou, X.L.; Xiao, J.R.; Zhao, L.; Huang, Q.Y.; Chen, H.; Li, Y.D. Effect of annealing atmosphere on the performance of TiO2 nanorod arrays in photoelectrochemical water splitting. Catal. Today 2019, 330, 189–194. [Google Scholar] [CrossRef]
  10. Andronic, L.; Enesca, A. Black TiO2 synthesis by chemical reduction methods for photocatalysis applications. Front. Chem. 2020, 8, 565489. [Google Scholar] [CrossRef]
  11. Hamdy, M.S.; Amrollahi, R.; Mul, G. Surface Ti3+-Containing (blue) Titania: A Unique Photocatalyst with High Activity and Selectivity in Visible Light-Stimulated Selective Oxidation. Acs Catal. 2012, 2, 2641–2647. [Google Scholar] [CrossRef]
  12. Yin, G.; Huang, X.; Chen, T.; Zhao, W.; Bi, Q.; Xu, J.; Han, Y.; Huang, F. Hydrogenated Blue Titania for Efficient Solar to Chemical Conversions: Preparation, Characterization, and Reaction Mechanism of CO2 Reduction. Acs Catalysis 2018, 8, 1009–1017. [Google Scholar] [CrossRef]
  13. Lettieri, S.; Gargiulo, V.; Alfe, M.; Amati, M.; Zeller, P.; Maraloiu, V.-A.; Borbone, F.; Pavone, M.; Munoz-Garcia, A.B.; Maddalena, P. Simple Ethanol Refluxing Method for Production of Blue-Colored Titanium Dioxide with Oxygen Vacancies and Visible Light-Driven Photocatalytic Properties. J. Phys. Chem. C 2020, 124, 3564–3576. [Google Scholar] [CrossRef]
  14. Zhang, K.; Park, J.H. Surface localization of defects in black TiO2: Enhancing photoactivity or reactivity. J. Phys. Chem. Lett. 2017, 8, 199–207. [Google Scholar] [CrossRef] [PubMed]
  15. Lü, X.; Chen, A.; Luo, Y.; Lu, P.; Dai, Y.; Enriquez, E.; Dowden, P.; Xu, H.; Kotula, P.G.; Azad, A.K.; et al. Conducting interface in oxide homojunction: Understanding of superior properties in black TiO2. Nano Lett. 2016, 16, 5751–5755. [Google Scholar] [CrossRef] [PubMed] [Green Version]
  16. Zhou, W.; Li, W.; Wang, J.-Q.; Qu, Y.; Yang, Y.; Xie, Y.; Zhang, K.; Wang, L.; Fu, H.; Zhao, D. Ordered mesoporous black TiO2 as highly efficient hydrogen evolution photocatalyst. J. Am. Chem. Soc. 2014, 136, 9280–9283. [Google Scholar] [CrossRef]
  17. Zhou, L.; Cai, M.; Zhang, X.; Cui, N.; Chen, G.; Zou, G.-Y. In-situ nitrogen-doped black TiO2 with enhanced visible-light-driven photocatalytic inactivation of Microcystis aeruginosa cells: Synthesization, performance and mechanism. Appl. Catal. B: Environ. 2020, 272, 119019. [Google Scholar] [CrossRef]
  18. Liu, X.; Xing, Z.; Zhang, Y.; Li, Z.; Wu, X.; Tan, S.; Yu, X.; Zhu, Q.; Zhou, W. Fabrication of 3D flower-like black N-TiO2-x@MoS2 for unprecedented-high visible-light-driven photocatalytic performance. Appl. Catal. B: Environ. 2017, 201, 119–127. [Google Scholar] [CrossRef]
  19. Wang, Y.; Yu, H.; Lu, Y.; Qu, J.; Zhu, S.; Huo, M. A nano-composite comprised of Ti3+-doped TiO2 nanotubes and Ag3PO4 quantum dots with enhanced photocatalytic activity under visible light. Mater. Lett. 2019, 240, 35–38. [Google Scholar] [CrossRef]
  20. Yazid, S.A.; Rosli, Z.M.; Juoi, J.M. Effect of titanium (IV) isopropoxide molarity on the crystallinity and photocatalytic activity of titanium dioxide thin film deposited via green sol–gel route. J. Mater. Res. Technol. 2019, 8, 1434–1439. [Google Scholar] [CrossRef]
  21. Nie, J.; Zhu, G.; Zhang, W.; Gao, J.; Zhong, P.; Xie, X.; Huang, Y.; Hojamberdiev, M. Oxygen vacancy defects-boosted deep oxidation of NO by β-Bi2O3/CeO2-δ p-n heterojunction photocatalyst in situ synthesized from Bi/Ce(CO3)(OH) precursor. Chem. Eng. J. 2021, 424, 130327. [Google Scholar] [CrossRef]
  22. Arsov, L.D.; Kormann, C.; Plieth, W. Electrochemical synthesis and insitu Raman-spectroscopy of thin-films of titanium-dioxide. J. Raman Spectrosc. 1991, 22, 573–575. [Google Scholar] [CrossRef]
  23. Ullattil, S.G.; Narendranath, S.B.; Pillai, S.C.; Periyat, P. Black TiO2 nanomaterials: A review of recent advances. Chem. Eng. J. 2018, 343, 708–736. [Google Scholar] [CrossRef]
  24. Fukushima, H.; Uchida, H.; Funakubo, H.; Katoda, T.; Nishida, K. Evaluation of oxygen vacancies in ZnO single crystals and powders by micro-Raman spectroscopy. J. Ceram. Soc. Jpn. 2017, 125, 445–448. [Google Scholar] [CrossRef] [Green Version]
  25. Chen, D.; Niu, F.; Qin, L.; Wang, S.; Zhang, N.; Huang, Y. Defective BiFeO3 with surface oxygen vacancies: Facile synthesis and mechanism insight into photocatalytic performance. Sol. Energy Mater. Sol. Cells 2017, 171, 24–32. [Google Scholar] [CrossRef]
  26. Misra, S.K.; Andronenko, S.I.; Tipikin, D.; Freed, J.H.; Somani, V.; Prakash, O. Study of paramagnetic defect centers in as-grown and annealed TiO2 anatase and rutile nanoparticles by a variable-temperature X-band and high-frequency (236GHz) EPR. J. Magn. Magn. Mater. 2016, 401, 495–505. [Google Scholar] [CrossRef] [Green Version]
  27. Ahmad, W.; Park, E.; Lee, H.; Kim, J.Y.; Kim, B.C.; Jurng, J.; Oh, Y. Defective domain control of TiO2 support in Pt/TiO2 for room temperature formaldehyde (HCHO) remediation. Appl. Surf. Sci. 2021, 538, 147504. [Google Scholar] [CrossRef]
  28. Wang, Z.; Yang, C.; Lin, T.; Yin, H.; Chen, P.; Wan, D.; Xu, F.; Huang, F.; Lin, J.; Xie, X.; et al. Visible-light photocatalytic, solar thermal and photoelectrochemical properties of aluminium-reduced black titania. Energ. Environ. Sci. 2013, 6, 3007–3014. [Google Scholar] [CrossRef]
  29. Zeng, L.; Song, W.; Li, M.; Zeng, D.; Xie, C. Catalytic oxidation of formaldehyde on surface of HTiO2/HCTiO2 without light illumination at room temperature. Appl. Catal. B: Environ. 2014, 147, 490–498. [Google Scholar] [CrossRef]
  30. Nowotny, M.K.; Sheppard, L.R.; Bak, T.; Nowotny, J. Defect chemistry of titanium dioxide. application of defect engineering in processing of TiO2-based photocatalysts. J. Phys. Chem. C 2008, 112, 5275–5300. [Google Scholar] [CrossRef]
  31. Pan, X.Y.; Yang, M.Q.; Fu, X.Z.; Zhang, N.; Xu, Y.J. Defective TiO2 with oxygen vacancies: Synthesis, properties and photocatalytic applications. Nanoscale 2013, 5, 3601–3614. [Google Scholar] [CrossRef]
  32. Batzill, M.; Morales, E.H.; Diebold, U. Influence of nitrogen doping on the defect formation and surface properties of TiO2 rutile and anatase. Phys. Rev. Lett. 2006, 96, 026103. [Google Scholar] [CrossRef]
  33. Muthukrishnan, A.; Nabae, Y.; Chang, C.W.; Okajimaa, T.; Ohsaka, T. A high-performance Fe and nitrogen doped catalyst derived from diazoniapentaphene salt and phenolic resin mixture for oxygen reduction reaction. Catal. Sci. Technol. 2015, 5, 1764–1774. [Google Scholar] [CrossRef]
  34. Yang, X.X.; Cao, C.D.; Erickson, L.; Hohn, K.; Maghirang, R.; Klabunde, K. Synthesis of visible-light-active TiO2-based photocatalysts by carbon and nitrogen doping. J. Catal. 2008, 260, 128–133. [Google Scholar] [CrossRef]
  35. Xing, M.Y.; Zhang, J.L.; Chen, F. New approaches to prepare nitrogen-doped TiO2 photocatalysts and study on their photocatalytic activities in visible light. Appl. Catal. B: Environ. 2009, 89, 563–569. [Google Scholar] [CrossRef]
  36. Yan, X.; Xing, Z.; Cao, Y.; Hu, M.; Li, Z.; Wu, X.; Zhu, Q.; Yang, S.; Zhou, W. In-situ C-N-S-tridoped single crystal black TiO2 nanosheets with exposed {001} facets as efficient visible-light-driven photocatalysts. Appl. Catal. B: Environ. 2017, 219, 572–579. [Google Scholar] [CrossRef]
  37. Saha, N.C.; Tompkins, H.G. Titanium nitride oxidation chemistry: An X-ray photoelectron spectroscopy study. J. Appl. Phys. 1992, 72, 3072–3079. [Google Scholar] [CrossRef]
  38. Hensel, J.; Wang, G.; Li, Y.; Zhang, J.Z. Synergistic effect of CdSe quantum dot sensitization and nitrogen doping of TiO2 nanostructures for photoelectrochemical solar hydrogen generation. Nano Lett. 2010, 10, 478. [Google Scholar] [CrossRef] [PubMed]
  39. Gu, Z.Y.; Cui, Z.T.; Wang, Z.J.; Chen, T.R.; Sun, P.; Wen, D.W. Reductant-free synthesis of oxygen vacancies-mediated TiO2 nanocrystals with enhanced photocatalytic NO removal performance: An experimental and DFT study. Appl. Surf. Sci. 2021, 544, 148923. [Google Scholar] [CrossRef]
  40. Yasutake, T.; Masahiro, Y.; Noboru, Y.; Tetsuro, S. Oxygen-sorptive properties and defect structure of perovskite-type oxides. Chem. Lett. 1984, 13, 893–896. [Google Scholar] [CrossRef]
  41. Qiao, L.; Bi, X. Direct observation of oxygen vacancy and its effect on the microstructure, electronic and transport properties of sputtered LaNiO3-δ films on Si substrates. Thin Solid Films 2010, 519, 943–946. [Google Scholar] [CrossRef]
  42. Xue, J.; Zhu, X.; Zhang, Y.; Wang, W.; Xie, W.; Zhou, J.; Bao, J.; Luo, Y.; Gao, X.; Wang, Y.; et al. Nature of conduction band tailing in hydrogenated titanium dioxide for photocatalytic hydrogen evolution. ChemCatChem 2016, 8, 2010–2014. [Google Scholar] [CrossRef]
  43. Wei, S.; Wu, R.; Xu, X.; Jian, J.; Wang, H.; Sun, Y. One-step synthetic approach for core-shelled black anatase titania with high visible light photocatalytic performance. Chem. Eng. J. 2016, 299, 120–125. [Google Scholar] [CrossRef]
  44. Leng, W.H.; Zhang, Z.; Zhang, J.Q.; Cao, C.N. Investigation of the kinetics of a TiO2 photoelectrocatalytic reaction involving charge transfer and recombination through surface states by electrochemical impedance spectroscopy. J. Phys. Chem. B 2005, 109, 15008–15023. [Google Scholar] [CrossRef] [PubMed]
  45. Yu, J.C.; Yu, J.; Ho, W.; Jiang, Z.; Zhang, L. Effects of F- doping on the photocatalytic activity and microstructures of nanocrystalline TiO2 powders. Chem. Mater. 2002, 14, 3808–3816. [Google Scholar] [CrossRef]
  46. Jiang, X.; Zhang, Y.; Jiang, J.; Rong, Y.; Wang, Y.; Wu, Y.; Pan, C. Characterization of oxygen vacancy associates within hydrogenated TiO2: A positron annihilation study. J. Phys. Chem. C 2012, 116, 22619–22624. [Google Scholar] [CrossRef]
  47. Hamilton, M.M.; Ejnik, J.W.; Carmichael, A.J. Uranium reactions with hydrogen peroxide studied by EPR spin trapping with DMPO. J. Chem. Soc. Perkin Trans. 2 1997, 2. [Google Scholar] [CrossRef]
  48. Ueno, I.; Hoshino, M.; Maitani, T.; Kanegasaki, S.; Ueno, Y. Luteoskyrin, an anthraquinoid hepatotoxin, and ascorbic-acid generate hydroxyl radical in-vitro in the presence of a trace amount of ferrous iron. Free Radic. Res. Commun. 1993, 19, S95–S100. [Google Scholar] [CrossRef]
Figure 1. SEM of (a) T-V, (b) U-T-V, (c) T-He, (d) U-T-He, (e) T-N2, and (f) U-T-N2, as well as (g,h) HR-TEM of T-V.
Nanomaterials 11 02648 g001
Figure 2. (a) XRD patterns of the as-prepared TiO2 samples; (b) The weight contents (wt%) of rutile and anatase TiO2 in different samples obtained from the integrated intensities of the anatase (101) and rutile (110) diffraction peaks by a reference intensity ratio (RIR) method [20]; (c) The most intense peak (101) of XRD patterns associated with different samples; (d) Raman spectra of different samples and the inset is the most intense peak (Eg (1)) of Raman spectra associated with different samples; (e) EPR spectra of different materials.
Nanomaterials 11 02648 g002
Figure 3. High-resolution XPS of (a) C 1s of T-V and U-T-V; (b) O 1s of T-V and U-T-V; (c) N 1s; (d) O 1s; (e) Ti 2p; (f) enlarged Ti 2p3/2 of the as-prepared samples.
Nanomaterials 11 02648 g003
Figure 4. (a) UV-vis spectral absorbance; (b) bandgap energies evaluated from the plots of (αhν)2 versus ; (c) XPS valence band (VB) spectra; (d) the calculated band energy.
Nanomaterials 11 02648 g004
Figure 5. (a) EIS Nyquist plots of the samples; (b) PL emission spectra of the samples; (c) EPR spectra of DMPO adducts obtained in DMPO+water and DMPO+methanol system over the samples after visible-light irradiation for 1 min.
Nanomaterials 11 02648 g005
Figure 6. (a) Photocatalytic degradation activity for MB by the as-prepared TiO2 samples under simulated solar light irradiation; (b) Constant k of the fitted Pseudo-first-order dynamic curves of photocatalytic degradation for MB.
Nanomaterials 11 02648 g006
Table 1. Characteristics of the as-prepared TiO2 samples.
SamplesParticle Size 1
(nm)
Crystal Size 2 (nm)BET Surface Area
(m2/g)
Adsorption Average Pore Diameter
(nm)
T-V15 ± 311.1557.0
U-T-V21 ± 311.2687.1
T-He13 ± 38.8716.2
U-T-He17 ± 211.2699.3
T-N213 ± 27.6875.8
U-T-N216 ± 210.1778.6
1 Measured from SEM; 2 Calculated from XRD with Scherrer Equation.
Publisher’s Note: MDPI stays neutral with regard to jurisdictional claims in published maps and institutional affiliations.

