
Comparative Study of the Structural Features and Electrochemical Properties of Nitrogen-Containing Multi-Walled Carbon Nanotubes after Ion-Beam Irradiation and Hydrochloric Acid Treatment

 ,
,  ,
,
Abstract
:1. Introduction


2. Materials and Methods
3. Results and Discussions
4. Conclusions
Supplementary Materials
Author Contributions
Funding
Data Availability Statement
Acknowledgments
Conflicts of Interest
References
- González, A.; Goikolea, E.; Barrena, J.A.; Mysyk, R. Review on supercapacitors: Technologies and materials. Renew. Sustain. Energy Rev. 2016, 58, 1189–1206. [Google Scholar] [CrossRef]
- Zhang, H.; Cao, G.; Yang, Y.; Gu, Z. Comparison Between Electrochemical Properties of Aligned Carbon Nanotube Array and Entangled Carbon Nanotube Electrodes. J. Electrochem. Soc. 2008, 155, 19–23. [Google Scholar] [CrossRef]
- Ujjain, S.K.; Bhatia, R.; Ahuja, P.; Attri, P. Highly Conductive Aromatic Functionalized Multi-Walled Carbon Nanotube for Inkjet Printable High Performance Supercapacitor Electrodes. PLoS ONE 2015, 10, e0131475. [Google Scholar]
- Xu, Y.; Ren, B.; Wang, S.; Dong, X.; Zhang, L.; Liu, Z. Carbon aerogels with oxygen-containing surface groups for use in supercapacitors. Solid State Ion. 2019, 339, 115005. [Google Scholar] [CrossRef]
- Popov, K.M.; Arkhipov, V.E.; Kurenya, A.G.; Fedorovskaya, E.O.; Kovalenko, K.A.; Okotrub, A.V.; Bulusheva, L.G. Supercapacitor performance of binder-free buckypapers from multiwall carbon nanotubes synthesized at different temperatures. Phys. Status Solidi Basic Res. 2016, 253, 2406–2412. [Google Scholar] [CrossRef]
- Li, L.X.; Li, F. The effect of carbonyl, carboxyl and hydroxyl groups on the capacitance of carbon nanotubes. Xinxing Tan Cailiao/New Carbon Mater. 2011, 26, 224–228. [Google Scholar] [CrossRef]
- Frackowiak, E.; Béguin, F. Carbon materials for the electrochemical storage of energy in capacitors. Carbon 2001, 39, 937–950. [Google Scholar] [CrossRef]
- Frackowiak, E.; Metenier, K.; Bertagna, V.; Beguin, F. Supercapacitor electrodes from multiwalled carbon nanotubes. Appl. Phys. Lett. 2000, 77, 2421–2423. [Google Scholar] [CrossRef]
- Cao, H.; Peng, X.; Zhao, M.; Liu, P.; Xu, B.; Guo, J. Oxygen functional groups improve the energy storage performances of graphene electrochemical supercapacitors. RSC Adv. 2018, 8, 2858–2865. [Google Scholar] [CrossRef] [Green Version]
- Avile, F.; Cauich-Rodríguez, J.V.; Moo-Tah, L.; May-Pat, A.; Vargas-Coronado, R. Evaluation of mild acid oxidation treatments for MWCNT functionalization. Carbon 2009, 7, 5–10. [Google Scholar]
- Datsyuk, V.; Kalyva, M.; Papagelis, K.; Parthenios, J.; Tasis, D.; Siokou, A.; Kallitsis, I.; Galiotis, C. Chemical oxidation of multiwalled carbon nanotubes. Carbon 2008, 46, 833–840. [Google Scholar] [CrossRef]
- Qui, N.V.; Scholz, P.; Krech, T.; Keller, T.F.; Pollok, K.; Ondruschka, B. Multiwalled carbon nanotubes oxidized by UV/H2O2 as catalyst for oxidative dehydrogenation of ethylbenzene. Catal. Commun. 2011, 12, 464–469. [Google Scholar] [CrossRef]
- Peng, K.; Liu, L.-Q.; Li, H.; Meyer, H.; Zhang, Z. Room temperature functionalization of carbon nanotubes using an ozone/water vapor mixture. Carbon 2010, 49, 70–76. [Google Scholar] [CrossRef]
- Aitchison, T.J.; Ginic-markovic, M.; Matisons, J.G.; Simon, G.P.; Fredericks, P.M. Purification, Cutting and Sidewall Functionalization of Multiwalled Carbon Nanotubes Using Potassium Permanganate Solutions. J. Phys. Chem. C 2007, 111, 2440–2446. [Google Scholar] [CrossRef]
- Sahoo, N.G.; Rana, S.; Cho, J.W.; Li, L.; Chan, S.H. Polymer nanocomposites based on functionalized carbon nanotubes. Prog. Polym. Sci. 2010, 35, 837–867. [Google Scholar] [CrossRef]
- Cañete-Rosales, P.; Ortega, V.; Álvarez-Lueje, A.; Bollo, S.; González, M.; Ansón, A.; Martínez, M.T. Influence of size and oxidative treatments of multi-walled carbon nanotubes on their electrocatalytic properties. Electrochim. Acta 2012, 62, 163–171. [Google Scholar] [CrossRef]
- Liang, S.; Li, G.; Tian, R. Multi-walled carbon nanotubes functionalized with a ultrahigh fraction of carboxyl and hydroxyl groups by ultrasound-assisted oxidation. J. Mater. Sci. 2016, 51, 3513–3524. [Google Scholar] [CrossRef]
- Chen, J.; Han, J. Effect of hydroxylated carbon nanotubes on the thermal and electrical properties of derived epoxy composite materials. Results Phys. 2020, 18, 103246. [Google Scholar] [CrossRef]
- Merenda, A.; Des Ligneris, E.; Sears, K.; Chaffraix, T.; Magniez, K.; Cornu, D.; Schütz, J.A.; Dumée, L.F. Assessing the temporal stability of surface functional groups introduced by plasma treatments on the outer shells of carbon nanotubes. Sci. Rep. 2016, 6, 31565. [Google Scholar] [CrossRef]
- Hu, C.; Su, J.; Wen, T. Modification of multi-walled carbon nanotubes for electric double-layer capacitors: Tube opening and surface functionalization. J. Phys. Chem. Solids 2007, 68, 2353–2362. [Google Scholar] [CrossRef]
- Gueon, D.; Moon, J.H. Nitrogen-Doped Carbon Nanotube Spherical Particles for Supercapacitor Applications: Emulsion-Assisted Compact Packing and Capacitance Enhancement. ACS Appl. Mater. Interfaces 2015, 7, 20083–20089. [Google Scholar] [CrossRef] [PubMed]
- Lobiak, E.V.; Bulusheva, L.G.; Fedorovskaya, E.O.; Shubin, Y.V.; Plyusnin, P.E.; Lonchambon, P.; Senkovskiy, B.V.; Ismagilov, Z.R.; Flahaut, E.; Okotrub, A.V. One-step chemical vapor deposition synthesis and supercapacitor performance of nitrogen-doped porous carbon—carbon nanotube hybrids. Beilstein J. Nanotechnol. 2017, 8, 2669–2679. [Google Scholar] [CrossRef] [Green Version]
- Sevilla, M.; Yu, L.; Zhao, L.; Ania, C.O.; Titiricic, M. Surface Modification of CNTs with N-Doped Carbon: An Effective Way of Enhancing Their Performance in Supercapacitors. ACS Sustain. Chem. Eng. 2014, 4, 1049–1055. [Google Scholar] [CrossRef] [Green Version]
- Bulusheva, L.G.; Okotrub, A.V.; Fedoseeva, Y.V.; Kurenya, A.G.; Asanov, I.P.; Vilkov, O.Y.; Koós, A.A.; Grobert, N. Controlling pyridinic, pyrrolic, graphitic, and molecular nitrogen in multi-wall carbon nanotubes using precursors with different N/C ratios in aerosol assisted chemical vapor deposition. Phys. Chem. Chem. Phys. 2015, 17, 23741–23747. [Google Scholar] [CrossRef] [PubMed] [Green Version]
- Zhang, Z.; Zhang, Y.; Mu, X.; Du, J.; Wang, H.; Huang, B.; Zhou, J.; Pan, X.; Xie, E. The carbonization temperature effect on the electrochemical performance of nitrogen-doped carbon monoliths. Electrochim. Acta 2017, 242, 100–106. [Google Scholar] [CrossRef]
- Liao, Y.; Huang, Y.; Shu, D.; Zhong, Y.; Hao, J.; He, C.; Zhong, J.; Song, X. Three-dimensional nitrogen-doped graphene hydrogels prepared via hydrothermal synthesis as high-performance supercapacitor materials. Electrochim. Acta 2016, 194, 136–142. [Google Scholar] [CrossRef]
- Guo, H.L.; Su, P.; Kang, X.; Ning, S.K. Synthesis and characterization of nitrogen-doped graphene hydrogels by hydrothermal route with urea as reducing-doping agents. J. Mater. Chem. A 2013, 1, 2248–2255. [Google Scholar] [CrossRef]
- Nasini, U.B.; Bairi, V.G.; Ramasahayam, S.K.; Bourdo, S.E.; Viswanathan, T.; Shaikh, A.U. Phosphorous and nitrogen dual heteroatom doped mesoporous carbon synthesized via microwave method for supercapacitor application. J. Power Sources 2014, 250, 257–265. [Google Scholar] [CrossRef]
- Wickramaratne, N.P.; Xu, J.; Wang, M.; Zhu, L.; Dai, L.; Jaroniec, M. Nitrogen enriched porous carbon spheres: Attractive materials for supercapacitor electrodes and CO2 adsorption. Chem. Mater. 2014, 26, 2820–2828. [Google Scholar] [CrossRef]
- Seman, R.N.A.R.; Munawar, R.F.; Razak, J.A.; Zulkapli, N.N.; Bistamam, M.S.A.; Talib, E.; Ishak, T.; Kudin, T.I.T.; Manaf, N.S.A.; Azam, M.A. Cyclic Voltammetry Analysis of Carbon Based Electrochemical Capacitor in Aqueous Electrolytes. Appl. Mech. Mater. 2015, 761, 452–456. [Google Scholar] [CrossRef]
- Stoller, M.D.; Ruoff, R.S. Best practice methods for determining an electrode material’s performance for ultracapacitors. Energy Environ. Sci. 2010, 3, 1294–1301. [Google Scholar] [CrossRef]
- Liu, H.; Song, H.; Chen, X.; Zhang, S.; Zhou, J.; Ma, Z. Effects of nitrogen- and oxygen-containing functional groups of activated carbon nanotubes on the electrochemical performance in supercapacitors. J. Power Sources 2015, 285, 303–309. [Google Scholar] [CrossRef]
- Fedorovskaya, E.O.; Bulusheva, L.G.; Kurenya, A.G.; Asanov, I.P.; Okotrub, A.V. Effect of Oxidative Treatment on the Electrochemical Properties of Aligned Multi-Walled Carbon Nanotubes. Russ. J. Electrochem. 2016, 52, 441–448. [Google Scholar] [CrossRef]
- Bulusheva, L.G.; Fedorovskaya, E.O.; Kurenya, A.G.; Okotrub, A.V. Supercapacitor performance of nitrogen-doped carbon nanotube arrays. Phys. Status Solidi Basic Res. 2013, 250, 2586–2591. [Google Scholar] [CrossRef]
- Fedoseenko, S.I.; Iossifov, I.E.; Gorovikov, S.A.; Schmidt, J.-S.; Follath, R.; Molodtsov, S.L.; Adamchuk, V.K.; Kaindl, G. Development and present status of the Russian–German soft X-ray beamline at BESSY II. Nucl. Instrum. Methods Phys. Res. Sect. A 2001, 470, 84–88. [Google Scholar] [CrossRef]
- Fairley, N.; Fernandez, V.; Richard-Plouet, M.; Guillot-Deudon, C.; Walton, J.; Smith, E.; Flahaut, D.; Greiner, M.; Biesinger, M.; Tougaard, S.; et al. Systematic and collaborative approach to problem solving using X-ray photoelectron spectroscopy. Appl. Surf. Sci. Adv. 2021, 5, 100112. [Google Scholar] [CrossRef]
- Susi, T.; Pichler, T.; Ayala, P. X-ray photoelectron spectroscopy of graphitic carbon nanomaterials doped with heteroatoms. Beilstein J. Nanotechnol. 2015, 6, 177–192. [Google Scholar] [CrossRef] [Green Version]
- Svirskiy, G.I.; Sergeeva, N.N.; Krasnikov, S.A.; Vinogradov, N.A.; Sergeeva, Y.N.; Cafolla, A.A.; Preobrajenski, A.B.; Vinogradov, A.S. Electronic structure of nickel porphyrin NiP: Study by X-ray photoelectron and absorption spectroscopy. Phys. Solid State 2017, 59, 368–377. [Google Scholar] [CrossRef]
- Hartmann, S.J.; Iurchenkova, A.A.; Kallio, T.; Fedorovskaya, E.O. Electrochemical Properties of Nitrogen and Oxygen Doped Reduced Graphene Oxide. Energies 2020, 13, 312. [Google Scholar] [CrossRef] [Green Version]
- Maldonado, S.; Morin, S.; Stevenson, K.J. Structure, composition, and chemical reactivity of carbon nanotubes by selective nitrogen doping. Carbon 2006, 44, 1429–1437. [Google Scholar] [CrossRef]
- Bobenko, N.G.; Bolotov, V.V.; Egorushkin, V.E.; Korusenko, P.M.; Melnikova, N.V.; Nesov, S.N.; Ponomarev, A.N.; Povoroznyuk, S.N. Experimental and theoretical study of electronic structure of disordered MWCNTs. Carbon 2019, 153, 40–51. [Google Scholar] [CrossRef]
- Krishnamoorthy, K.; Veerapandian, M.; Yun, K.; Kim, S.J. The chemical and structural analysis of graphene oxide with different degrees of oxidation. Carbon 2013, 53, 38–49. [Google Scholar] [CrossRef]
- Bulusheva, L.G.; Okotrub, A.V.; Kinloch, I.A.; Asanov, I.P.; Kurenya, A.G.; Kudashov, A.G.; Chen, X.; Song, H. Effect of nitrogen doping on Raman spectra of multi-walled carbon nanotubes. Phys. Status Solidi Basic Res. 2008, 245, 1971–1974. [Google Scholar] [CrossRef]
- Sharma, V.; Uy, D.; Gangopadhyay, A.; O’Neill, A.; Paxton, W.A.; Sammut, A.; Ford, M.A.; Aswath, P.B. Structure and chemistry of crankcase and exhaust soot extracted from diesel engines. Carbon 2016, 103, 327–338. [Google Scholar] [CrossRef]
- Edwards, E.R.; Antunes, E.F.; Botelho, E.C.; Baldan, M.R.; Corat, E.J. Evaluation of residual iron in carbon nanotubes purified by acid treatments. Appl. Surf. Sci. 2011, 258, 641–648. [Google Scholar] [CrossRef] [Green Version]
- Caņado, L.G.; Takai, K.; Enoki, T.; Endo, M.; Kim, Y.A.; Mizusaki, H.; Jorio, A.; Coelho, L.N.; Magalhães-Paniago, R.; Pimenta, M.A. General equation for the determination of the crystallite size la of nanographite by Raman spectroscopy. Appl. Phys. Lett. 2006, 88, 163106. [Google Scholar] [CrossRef]
- Brzhezinskaya, M.M.; Vinogradov, N.A.; Muradyan, V.E.; Shul’ga, Y.M.; Polyakova, N.V.; Vinogradov, A.S. Characterization of fluorinated multiwalled carbon nanotubes by x-ray absorption spectroscopy. Phys. Solid State 2008, 50, 587–594. [Google Scholar] [CrossRef]
- Gandhiraman, R.P.; Nordlund, D.; Javier, C.; Koehne, J.E.; Chen, B.; Meyyappan, M. X-ray absorption study of graphene oxide and transition metal oxide nanocomposites. J. Phys. Chem. C 2014, 118, 18706–18712. [Google Scholar] [CrossRef]
- Zhang, X.; Zhou, J.; Song, H.; Chen, X.; Fedoseeva, Y.V.; Okotrub, A.V.; Bulusheva, L.G. “butterfly Effect” in CuO/Graphene composite nanosheets: A small interfacial adjustment triggers big changes in electronic structure and Li-Ion storage performance. ACS Appl. Mater. Interfaces 2014, 6, 17236–17244. [Google Scholar] [CrossRef] [PubMed]
- Bulusheva, L.G.; Stolyarova, S.G.; Chuvilin, A.L.; Shubin, Y.V.; Asanov, I.P.; Sorokin, A.M.; Mel’Gunov, M.S.; Zhang, S.; Dong, Y.; Chen, X.; et al. Creation of nanosized holes in graphene planes for improvement of rate capability of lithium-ion batteries. Nanotechnology 2018, 29, 134001. [Google Scholar] [CrossRef]
- Chua, C.K.; Pumera, M. Renewal of sp2 bonds in graphene oxides via dehydrobromination. J. Mater. Chem. 2012, 22, 23227–23231. [Google Scholar] [CrossRef]
- Dolinskii, I.Y.; Katin, K.P.; Grishakov, K.S.; Prudkovskii, V.S.; Kargin, N.I.; Maslov, M.M. Influence of Mechanical Stretching on Adsorption Properties of Nitrogen-Doped Graphene. Phys. Solid State 2018, 60, 821–825. [Google Scholar] [CrossRef]
- Arrigo, R.; Hävecker, M.; Schlögl, R.; Su, D.S. Dynamic surface rearrangement and thermal stability of nitrogen functional groups on carbon nanotubes. Chem. Commun. 2008, 4891–4893. [Google Scholar] [CrossRef] [Green Version]
- Korusenko, P.M.; Bolotov, V.V.; Nesov, S.N.; Povoroznyuk, S.N.; Khailov, I.P. Changes of the electronic structure of the atoms of nitrogen in nitrogen-doped multiwalled carbon nanotubes under the influence of pulsed ion radiation. Nucl. Instrum. Methods Phys. Res. Sect. B Beam Interact. Mater. At. 2015, 358, 131–135. [Google Scholar] [CrossRef]
- Iurchenkova, A.A.; Lobiak, E.V.; Kobets, A.A.; Kolodin, A.N.; Stott, A.; Silva, S.R.P.; Fedorovskaya, E.O. A complex study of the dependence of the reduced graphite oxide electrochemical behavior on the annealing temperature and the type of electrolyte. Electrochim. Acta 2021, 370, 137832. [Google Scholar] [CrossRef]
- Sullivan, M.G.; Schnyder, B.; Bärtsch, M.; Alliata, D.; Barbero, C.; Imhof, R.; Kötz, R. Electrochemically Modified Glassy Carbon for Capacitor Electrodes Characterization of Thick Anodic Layers by Cyclic Voltammetry, Differential Electrochemical Mass Spectrometry, Spectroscopic Ellipsometry, X-Ray Photoelectron Spectroscopy, FTIR, and AFM. J. Electrochem. Soc. 2000, 147, 2636. [Google Scholar] [CrossRef]
- Ghosh, S.; Barg, S.; Jeong, S.M.; Ostrikov, K. Heteroatom-Doped and Oxygen-Functionalized Nanocarbons for High-Performance Supercapacitors. Adv. Energy Mater. 2020, 10, 2001239. [Google Scholar] [CrossRef]
- Lota, G.; Lota, K.; Frackowiak, E. Nanotubes based composites rich in nitrogen for supercapacitor application. Electrochem. Commun. 2007, 9, 1828–1832. [Google Scholar] [CrossRef]
- Iurchenkova, A.A.; Fedorovskaya, E.O.; Asanov, I.P.; Arkhipov, V.E.; Popov, K.M.; Baskakova, K.I.; Okotrub, A.V. MWCNT buckypaper/polypyrrole nanocomposites for supercapasitor application. Electrochim. Acta 2020, 335, 135700. [Google Scholar] [CrossRef]
- Leftheriotis, G.; Papaefthimiou, S.; Yianoulis, P. Dependence of the estimated diffusion coefficient of LixWO3 films on the scan rate of cyclic voltammetry experiments. Solid State Ion. 2007, 178, 259–263. [Google Scholar] [CrossRef]
- Li, R.; Liu, J. Mechanistic investigation of the charge storage process of pseudocapacitive Fe3O4 nanorod film. Electrochim. Acta 2014, 120, 52–56. [Google Scholar] [CrossRef]
- Sathiya, M.; Prakash, A.S.; Ramesha, K.; Tarascon, J.M.; Shukla, A.K. V2O5-anchored carbon nanotubes for enhanced electrochemical energy storage. J. Am. Chem. Soc. 2011, 133, 16291–16299. [Google Scholar] [CrossRef]
- Mirfakhrai, T.; Oh, J.; Kozlov, M.; Fang, S.; Zhang, M.; Baughman, R.H.; Madden, J.D.W. Carbon nanotube yarn actuators: An electrochemical impedance model. J. Electrochem. Soc. 2009, 156, 97–103. [Google Scholar] [CrossRef]
- Claye, A.; Fischer, J.E.; Métrot, A. Kinetics of alkali insertion in single wall carbon nanotubes: An electrochemical impedance spectroscopy study. Chem. Phys. Lett. 2000, 330, 61–67. [Google Scholar] [CrossRef]
- Huang, H.; Zhang, W.; Li, M.; Gan, Y.; Chen, J.; Kuang, Y. Carbon nanotubes as a secondary support of a catalyst layer in a gas diffusion electrode for metal air batteries. J. Colloid Interface Sci. 2005, 284, 593–599. [Google Scholar] [CrossRef] [PubMed]


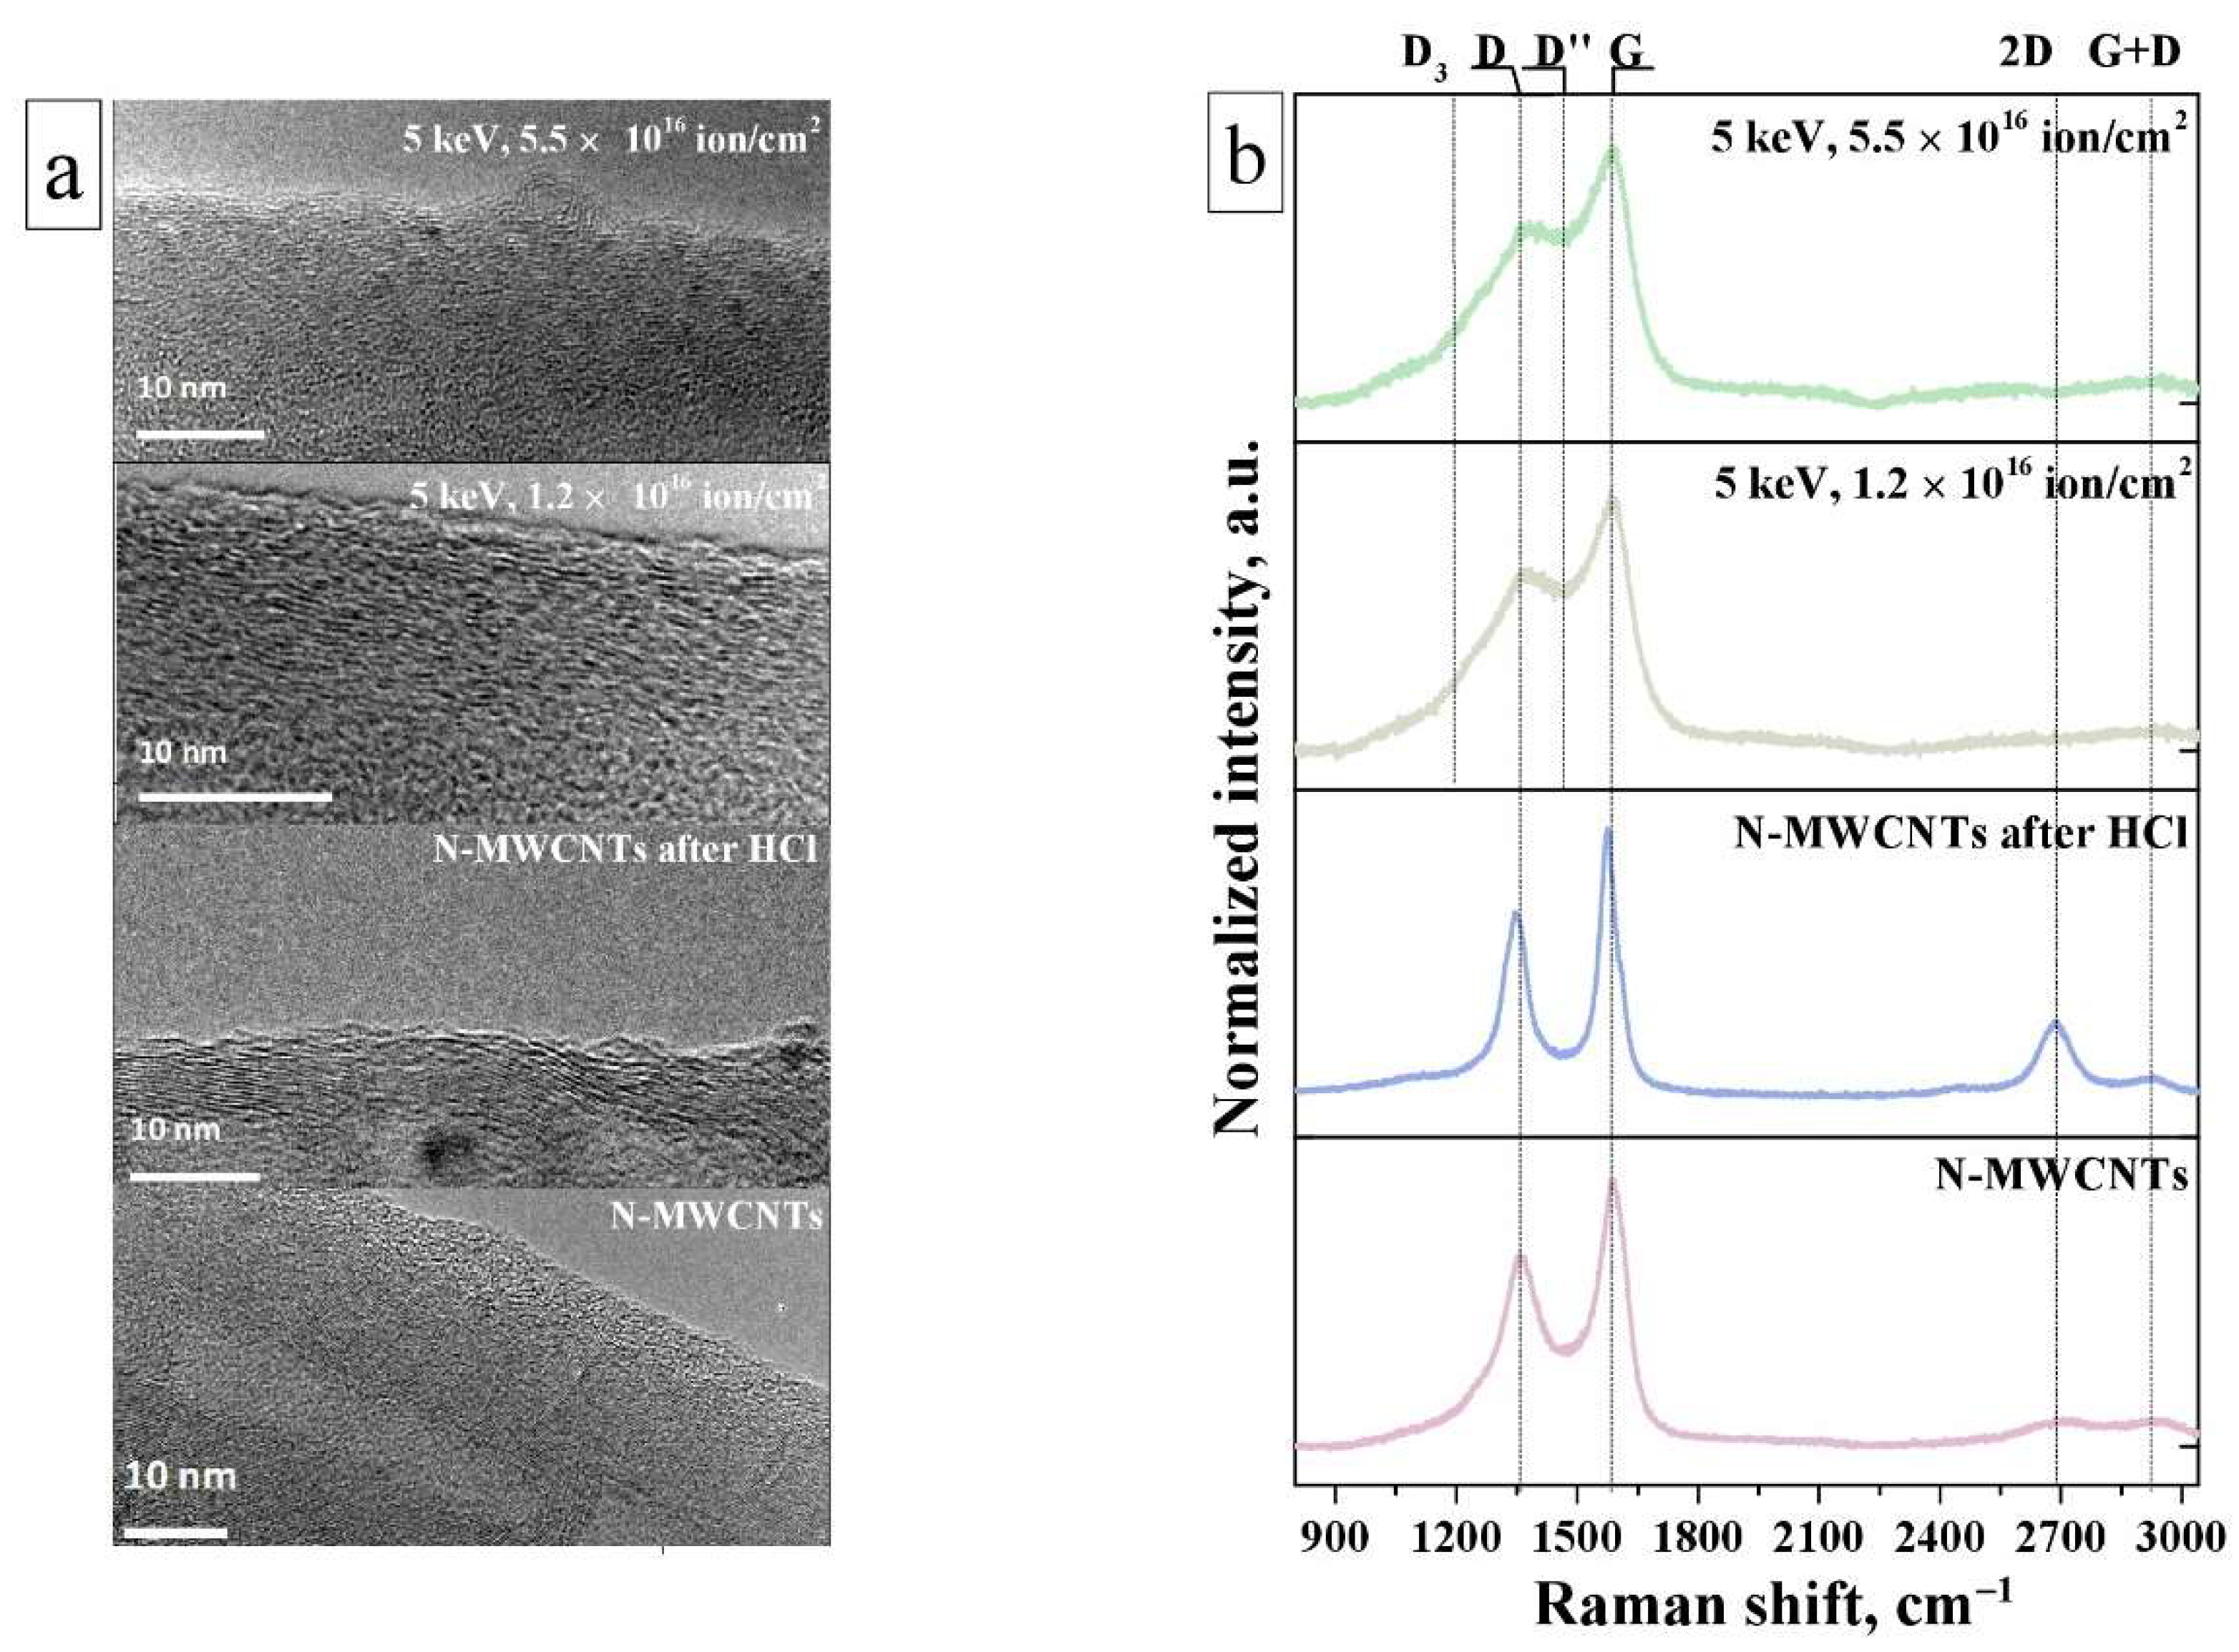
| Sample | G, cm−1 | D, cm−1 | Integral Intensities Ratio ID/IG | La 1, nm |
|---|---|---|---|---|
| N-MWCNTs | 1587 | 1359 | 1.3 | 12.73 |
| N-MWCNTs after HCl | 1577 | 1351 | 1.1 | 15.05 |
| N-MWCNTs after 1.2 × 10¹⁶ ion·cm−2 | 1591 | 1377 | 2.8 | 5.90 |
| N-MWCNTs after 5.5 × 10¹⁶ ion·cm−2 | 1591 | 1377 | 3.0 | 5.52 |
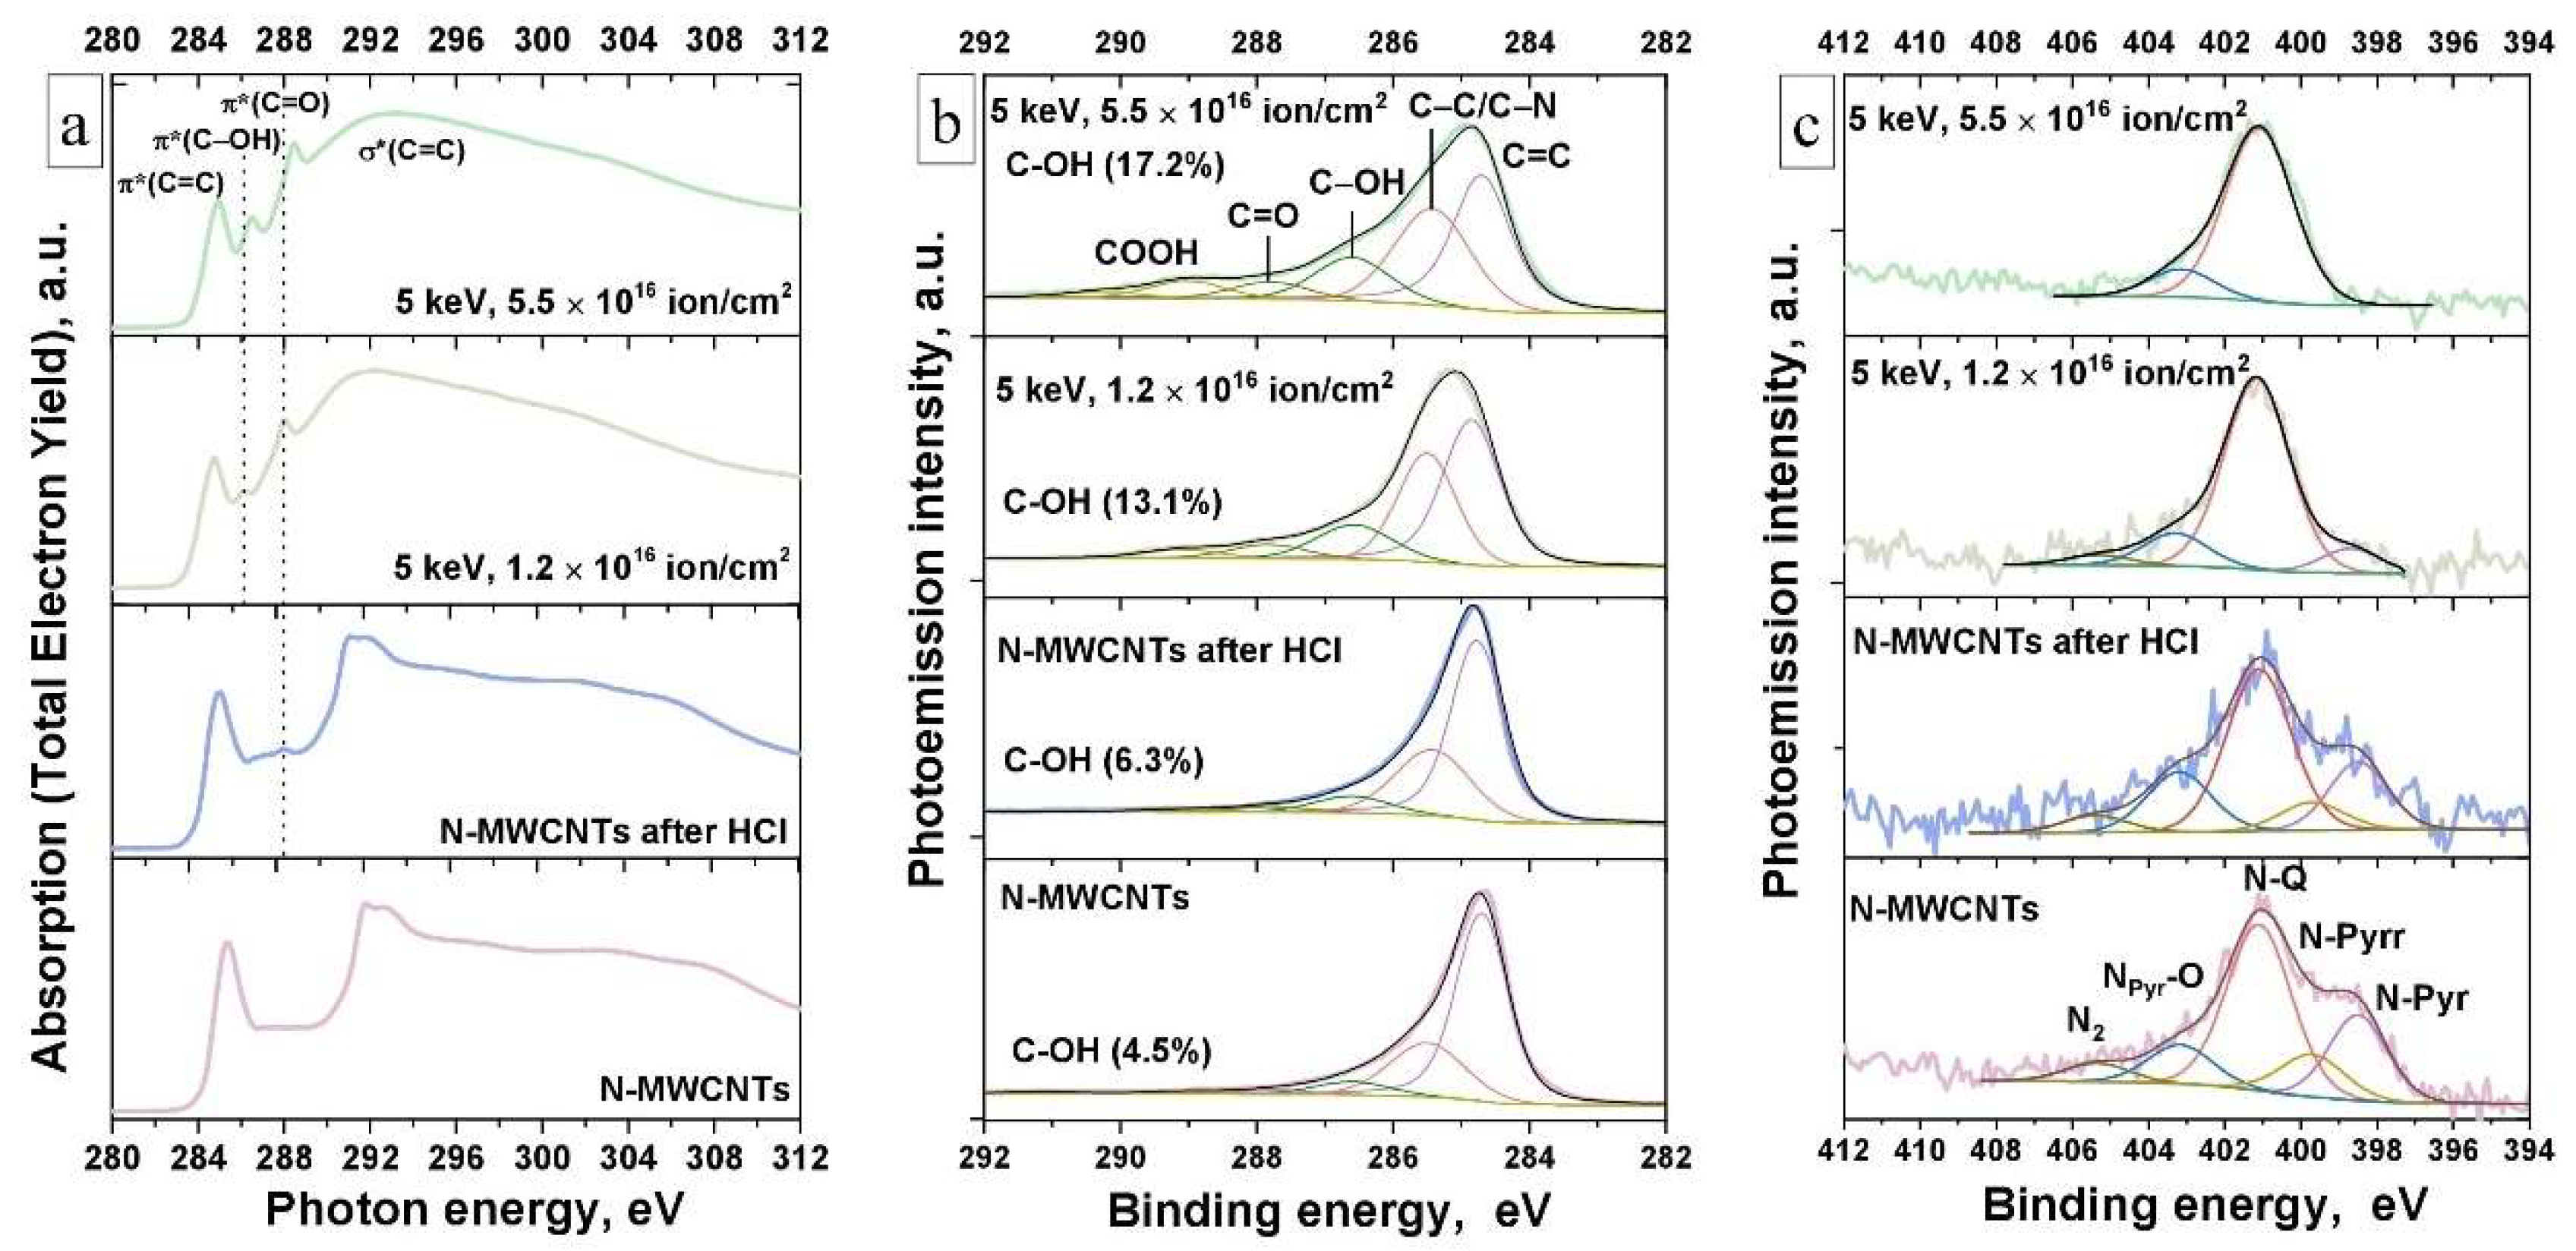
| Sample | [C] Total, at.% | Relative Areas of Components, % | ||||
|---|---|---|---|---|---|---|
| [C=C] | [C—C/C—N] | [C—OH] | [C=O] | [COOH] | ||
| N-MWCNTs | 94.35 | 69.5 | 23.1 | 4.5 | 1.9 | 1.0 |
| N-MWCNTs after HCl | 95.58 | 71.4 | 19.0 | 6.3 | 2.3 | 1.0 |
| N-MWCNTs after 1.2 × 10¹⁶ ion·cm−2 | 85.37 | 47.4 | 31.2 | 13.1 | 5.2 | 3.1 |
| N-MWCNTs after 5.5 × 10¹⁶ ion·cm−2 | 82.07 | 40.1 | 32.0 | 17.2 | 5.5 | 5.2 |
Publisher’s Note: MDPI stays neutral with regard to jurisdictional claims in published maps and institutional affiliations. |
© 2021 by the authors. Licensee MDPI, Basel, Switzerland. This article is an open access article distributed under the terms and conditions of the Creative Commons Attribution (CC BY) license (https://creativecommons.org/licenses/by/4.0/).
Share and Cite
Korusenko, P.M.; Nesov, S.N.; Iurchenkova, A.A.; Fedorovskaya, E.O.; Bolotov, V.V.; Povoroznyuk, S.N.; Smirnov, D.A.; Vinogradov, A.S. Comparative Study of the Structural Features and Electrochemical Properties of Nitrogen-Containing Multi-Walled Carbon Nanotubes after Ion-Beam Irradiation and Hydrochloric Acid Treatment. Nanomaterials 2021, 11, 2163. https://doi.org/10.3390/nano11092163
Korusenko PM, Nesov SN, Iurchenkova AA, Fedorovskaya EO, Bolotov VV, Povoroznyuk SN, Smirnov DA, Vinogradov AS. Comparative Study of the Structural Features and Electrochemical Properties of Nitrogen-Containing Multi-Walled Carbon Nanotubes after Ion-Beam Irradiation and Hydrochloric Acid Treatment. Nanomaterials. 2021; 11(9):2163. https://doi.org/10.3390/nano11092163
Chicago/Turabian StyleKorusenko, Petr M., Sergey N. Nesov, Anna A. Iurchenkova, Ekaterina O. Fedorovskaya, Valery V. Bolotov, Sergey N. Povoroznyuk, Dmitry A. Smirnov, and Alexander S. Vinogradov. 2021. "Comparative Study of the Structural Features and Electrochemical Properties of Nitrogen-Containing Multi-Walled Carbon Nanotubes after Ion-Beam Irradiation and Hydrochloric Acid Treatment" Nanomaterials 11, no. 9: 2163. https://doi.org/10.3390/nano11092163